
ABSTRACT - University of KwaZulu-Natal
98
Transcript of ABSTRACT - University of KwaZulu-Natal
i
ABSTRACT
The medicinal plant Sutherlandia frutescens (SF) is commonly consumed in South Africa,
and is traditionally applied to a range of ailments. Yet its popularity stems from the use of SF
as a cancer treatment. This plant contains a range of active compounds including L-
canavanine (L-CAV), D-pinitol and gamma (γ)-aminobutyric acid, all of which contribute to
the therapeutic properties of SF. It is also endorsed by the South African Ministry of Health
as a supplementary treatment for HIV/AIDS.
Maize is the staple crop of South Africa, and can be frequently contaminated by the
mycotoxin fumonisin B1 (FB1). The mycotoxin is linked to an extensive list of livestock
diseases. Although little is known about its role in human disease, FB1 has been
epidemiologically linked to oesophageal cancer in South Africa.
Both SF and FB1 have been shown to promote apoptosis, and the effect(s) of consuming both
in combination is currently unknown.
The principle aim of this study was to determine whether SF and FB1 had either synergistic or
antagonising effects in combination, by investigating immune cell toxicity Jurkat cells.
Apoptotic parameters such as caspase activation, mitochondrial depolarisation,
phosphatidylserine (PS) externalisation and ATP quantification were analysed. Levels of
caspase activation were highest in cells treated with SF only (caspase-3: 86.79 RLU, no
significance compared to other treatments; caspase-8: 40.1 RLU, significance compared to
other treatments [p<0.05]; caspase-9: 11.07 RLU, significance compared to FB1 and control
treatments [p<0.05]). ATP levels were significantly highest in SF-treated cells compared to
other treatments (8.17 RLU, [p<0.05]). Mitochondrial depolarisation was also highest in SF-
treated Jurkat cells at 18.5% depolarisation with no significance compared to other
ii
treatments, however PS externalisation were significantly lower in SF-treated cells compared
with other treatments (3.69% [p<0.05]).
Oxidative stress parameters were also investigated, including thiobutyric acid reactive species
(TBARS), Glutathione (GSH) and Reactive Nitrogen Species (RNS) assays. TBARS levels
were significantly higher in FB1 treated cells (OD 1.95, [p<0.05]) compared to SF and
control. Glutathione and RNS levels were also lowest in FB1-treated cells.
The data suggests that SF induces apoptosis, characteristic of its nature as an anti-cancer
treatment, and FB1 induces oxidative stress, which is characteristic of its carcinogenic
properties. Based on this preliminary study, it appears that FB1 and SF both synergises and
antagonises the other in combination, yet further investigation is needed into its effects in
vivo.

iii
DECLARATION
This study represents the original work by the author and has not been submitted in any form
to another university. The use of work by others has been duly acknowledged in the text.
The research described in this study was carried out in the Discipline of Medical
Biochemistry, Faculty of Health Sciences, University of KwaZulu-Natal, Durban, under the
supervision of Prof. A.A. Chuturgoon.
...........................................
K.A. Audain

iv
ACKNOWLEDGEMENTS
Prof. A.A. Chuturgoon
Thank you for giving me the opportunity to undergo this study. Your guidance, support and
encouragement throughout the past year and even before I came to South Africa will forever
be remembered.
Dr. D. Moodley
Thank you for your assistance with structuring this study and planning my experiments. Your
input has been invaluable in making this project what it has become.
Alisa Phulukdaree
Thank you for setting such high standards in the lab, which has helped me to achieve both my
project and personal goals.
My lab colleagues
Thanks for all the help with reagents, protocols and general guidance. I wish you all success
in future endeavours.
My mother
Without your unconditional love, support, advice and encouragement, this would not have
been possible. I owe all my achievements to you.
v
ABBREVIATIONS
oC Degrees Celsius
µg Microgram
µL Microlitre
µM Micrometre
∆Ψm Mitochondrial Membrane Potential
AIDS Acquired Immune Deficiency Syndrome
AIF Apoptosis Inducing Factor
ANOVA Analysis of Variance
Annexin-V-FITC Annexin-V-Fluorescein Isothiocyanate
Apaf-1 Apoptotic Protease-Inducing Factor-1
APS Ammonium Persulphate
Asp Aspartate
ATP Adenosine triphosphate
BCA Bicinchoninic Acid
BSA Bovine Serum Albumin
Ca2+ Calcium ion
CARD Caspase Recruitment Domain
Caspase Cysteine-dependent aspartate-specific protease
cFLIP FLICE Inhibitory Protein
cm Centimetre
CO2 Carbon Dioxide
Cu2+ Copper Ion
Cu(II)SO4 Copper Sulphate
Cys Cysteine
DD Death Domain
vi
DED Death Effector Domain
dH2O De-ionized water
DISC Death-Inducing Signalling Complex
DMSO Dimethyl Sulphoxide
DNA Deoxyribonucleic Acid
DNase Deoxyribonuclease
EDTA Ethylenediaminetetraacetic acid
ER Endoplasmic Reticulum
ERK1/2 Extracellular Signal Regulated Kinases 1 and 2
EtBr Ethidium Bromide
EtOH Ethanol
FADD Fas-associated Death Domain
FADH2 Flavin Adenine Dinucleotide
Fe3+ Iron (III)
FACS Fluorescence Activated Cell Sorting
FCS Foetal Calf Serum
FL Fluorescence
FSC Forward Light Scatter
GABA Gamma (у)-Aminobutyric Acid
GSH Glutathione
HCO-3 Hydrogen Carbonate
HIV Human Immunodeficiency Virus
h Hour
HRP Horse Radish Peroxidase
IAP Inhibitor of Apoptosis Protein
IM Inner Mitochondrial Membrane
iNOS Inducible Nitric Oxide Synthases
vii
JNK Jun N-terminal Kinase
K+ Potassium Ion
KCl Potassium Chloride
K2EDTA Dipotassium Ethylenediaminetetraacetic Acid
KH2PO4 Potassium Dihydrogen Phosphate
L-ARG L-Arginine
L-CAV L-Canavanine
LMPA Low Melting Point Agarose
M Molar
mA Milliampere
MAPK Mitogen Activated Protein Kinase
mg milligram
min minutes
ml millilitre
mm millimetre
mM millimolar
MTT Methylthiazol Tetrazolium
Na+ Sodium Ion
Na2EDTA Disodium Ethylenediaminetetraacetic Acid
NaCl Sodium Chloride
NADH Reduced Nicotinamide Adenine Dinucleotide
NADPH Reduced Nicotinamide Adenine Dinucleotide Phosphate
NaOH Sodium Hydroxide
NK Natural Killer
NO Nitric Oxide
OM Outer Mitochondrial Membrane
viii
PBS Phosphate Buffered Saline
PCD Programmed Cell Death
Phe Phenylalanine
PI Propidium Iodide
PKC Protein Kinase C
P/S Penicillin/Streptomycin
PS Phosphatidylserine
PT Permeability Transition
PTPC Permeability Transition Pore Complex
PVDF Polyvinylidene Fluoride
RBC Red Blood Cell
RNA Ribonucleic Acid
ROS Reactive Oxygen Species
rpm revolutions per minute
RPMI Roswell Park Memorial Institute
RT room temperature
SCGE Single Cell Gel Electrophoresis
SDS Sodium Dodecyl Sulphate
SDS-PAGE SDS – Polyacrylamide Gel Electrophoresis
SEM Standard Error of Mean
Smac/DIABLO Second mitochondria-derived activator of caspase/direct IAP-binding protein with low pI
SMase Sphingomyelinase
SSC Side Light Scatter
tBid truncated Bid
TCA Tricarboxylic Acid
TEMED Tetramethylenediamine
ix
TNF Tumour Necrosis Factor
TNFR1/2 Tumour Necrosis Factor Receptor 1 and 2
TRADD TNF-Receptor Death Domain
TRAIL Tumour Related Apoptosis inducing Ligand
tRNA Transfer Ribonucleic Acid
TBARS Thiobutyric acid reactive species
TBS Tris-Buffered Saline
TTBS Tween-Tris Buffered Saline
UV Ultraviolet
V Volts
VDAC voltage-Dependent Ion Channel
TABLES
CHAPTER 2
Table 2.1 Cell viability of Jurkat cells after 48h treatment with Fumonisin B1 ranging from 0-
500µM 26
CHAPTER 3
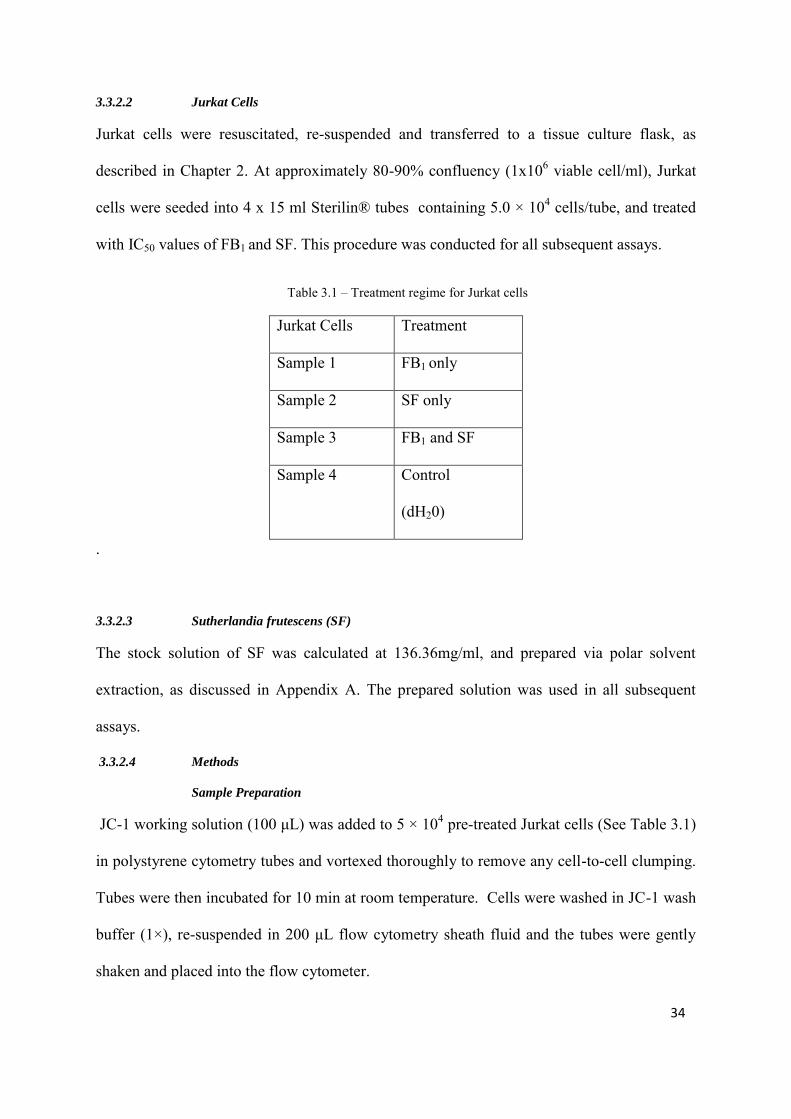
Table 3.1 Treatment regime for Jurkat cells 34
CHAPTER 4
Table 4.1 Caspase Assay Results 50
x
FIGURES
CHAPTER 1
Figure 1.1: (A) Structure of L-canavanine (L-CAV); (B) Structure of D-Pinitol 3
Figure 1.2: Structures of sphingosine, sphinganine, 5
FB1, hydrolyzed FB1 (HFB1), FB2, FB3, and
N-palmitoyl-hydrolyzed FB1 (N-Pal-HFB1) (Seefelder et al. 2003)
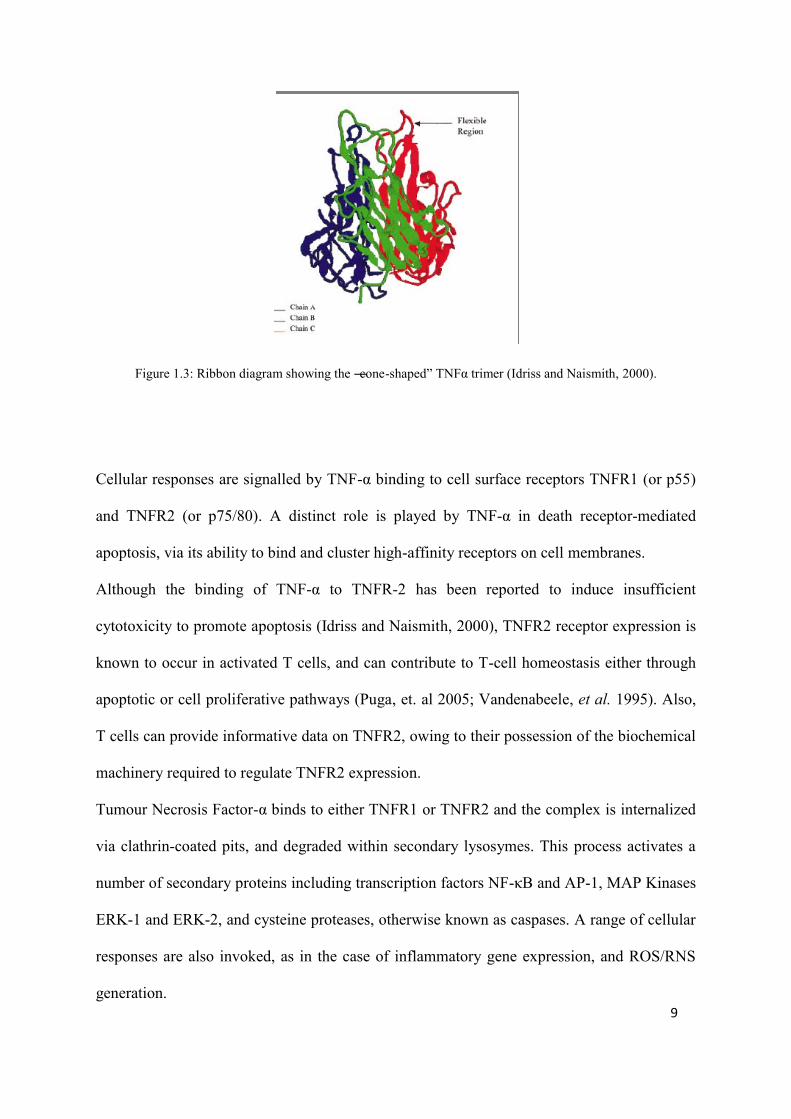
Figure 1.3: Ribbon diagram showing the “cone-shaped” Tumour Necrosis Factor α 9
trimer (Idriss and Naismith 2000)
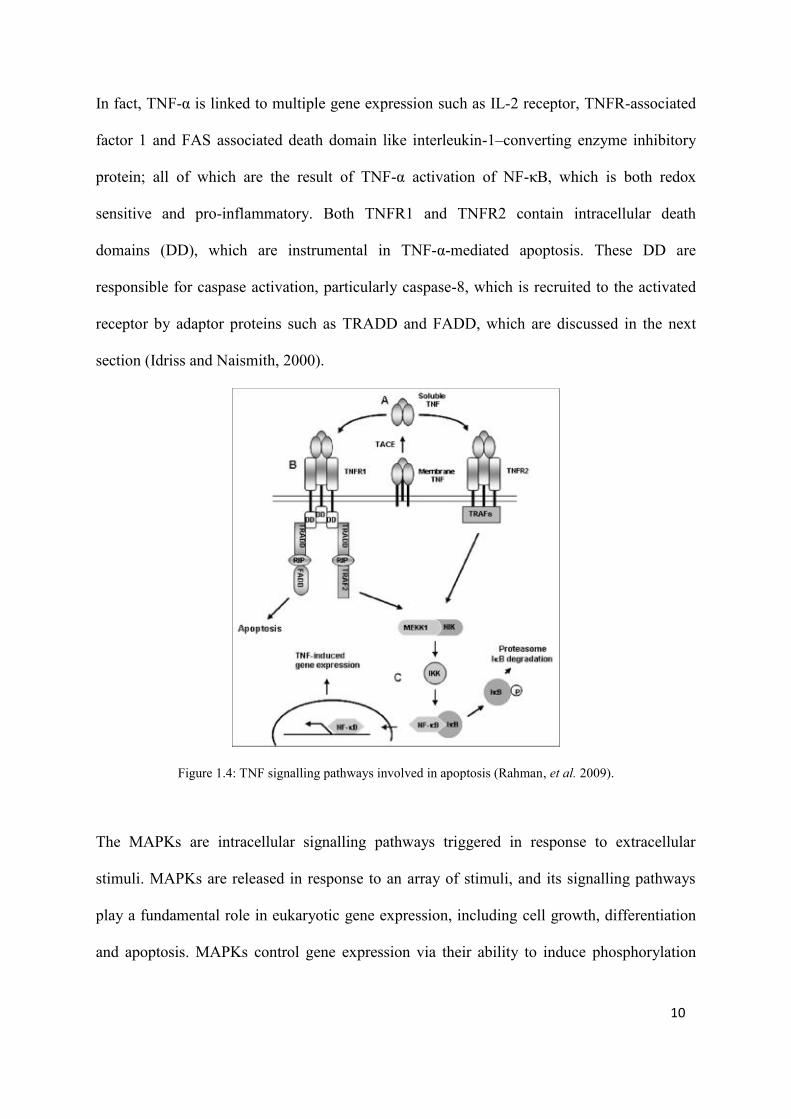
Figure 1.4: Tumour Necrosis Factor α signalling pathways involved in apoptosis 10
(Rahman et al. 2009)
Figure 1.5: Pathways to caspase activation and apoptosis 14
(Green et al. 1998).
Figure 1.6: A Schematic representation of apoptosis, showing the key pathways 15
(Elmore 2007)
Figure 1.7: Effects of Reactive Oxygen Species on cellular functions and the
induction of cell death (Ott et al. 2007) 20
xi
Figure 1.8: Formation, effects and inactivation of Reactive Oxygen Species in 21
mitochondria (Ott et al. 2007).
CHAPTER 2
Figure 2.1: Nonlinear regression graph of log [Fumonisin B1] vs. cell viability in Jurkat cells
(Prepared by the Author) 26
CHAPTER 3
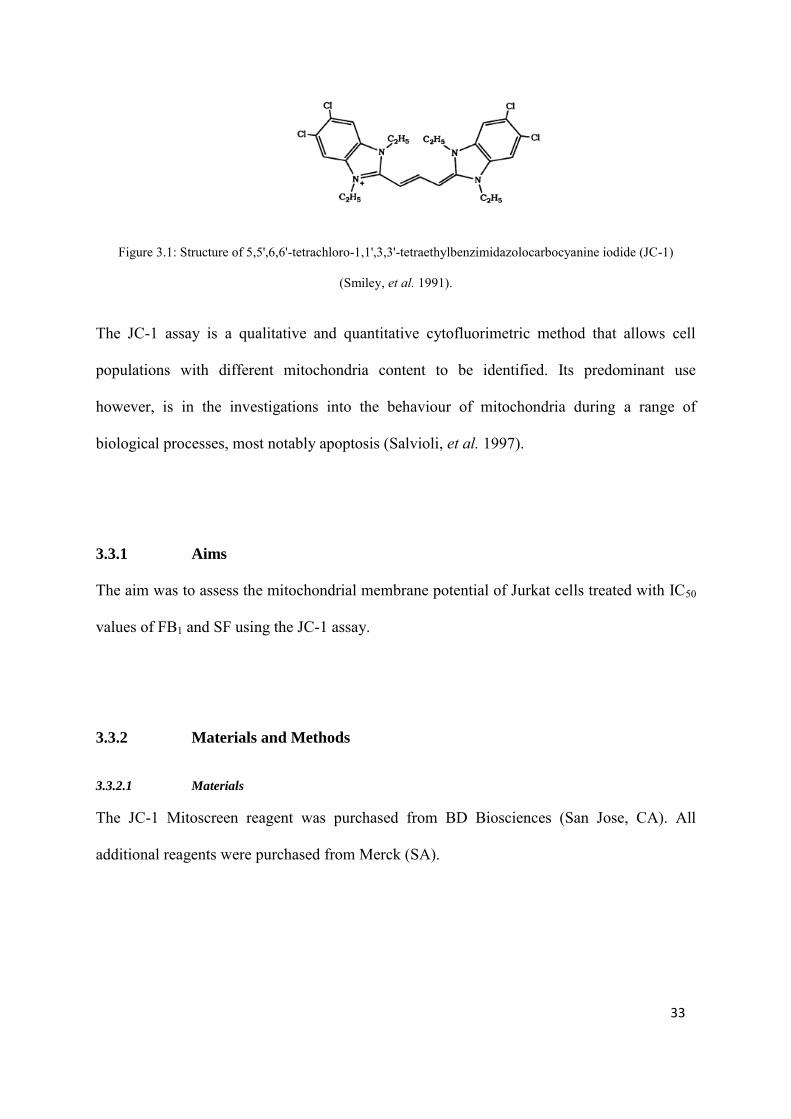
Figure 3.1: Structure of 5,5',6,6'-tetrachloro-1,1',3,3'-
tetraethylbenzimidazolocarbocyanine iodide (JC-1) 33
Figure 3.2: JC-1 Flow Cytometry scatter plot diagram 38
(Prepared by the author)
Figure 3.3 JC-1 Assay results for treatment samples 38
(Prepared by the author)
Figure 3.4: Annexin V Flow Cytometry Scatter Plot Diagram 43
(Prepared by the author)
Figure 3.5 Annexin V results for treatment samples 43
(Prepared by author)
xii
CHAPTER 4
Figure 4.1: Caspase-3 Assay results for treatment samples 48
(Prepared by the author)
Figure 4.2: Caspase-8 Assay results for treatment samples 49
(Prepared by the author)
Figure 4.3: Caspase-9 Assay results for treatment samples 50
(Prepared by the author)
Figure 4.4: Glutathione Assay results for treatment samples 54
(Prepared by the author)
Figure 4.5: Adenosine Tri Phosphate Assay results for treatment samples 57
(Prepared by the author)
CHAPTER 5
Figure 5.1: Reactive Nitrogen Species Assay results for treatment samples 60
(Prepared by the author)
Figure 5.2: Thiobutyric acid reactive species (TBARS) assay results for treatment
samples (Prepared by the author) 64
xiii
TABLE OF CONTENTS
Page
ABSTRACT i
DECLARATION iii
ACKNOWLEDGEMENTS iv
ABBREVIATIONS v
LIST OF TABLES ix
LIST OF FIGURES x
TABLE OF CONTENTS xiii
INTRODUCTION xvi
AIMS AND OBJECTIVES xix
CHAPTER 1: LITERATURE REVIEW
1.1 SUTHERLANDIA FRUTESCENS 1
1.2 FUMONISIN B1 4
1.3 TUMOUR NECROSIS FACTOR α 8
1.4 APOPTOSIS 12
1.5 OXIDATIVE STRESS 18
CHAPTER 2: METABOLIC ACTIVITY OF JURKAT CELLS AFTER FUMONISIN B1 TREATMENT
2.1 MTT ASSAY 22
2.2 Aims 23
2.3 Materials and Methods 23
2.3.1 Materials 23 2.3.2 Jurkat Cells 24 2.3.3 Fumonisin B1 24 2.3.4 Methods 24 2.4 Results and Discussion 26
xiv
CHAPTER 3: FLOW CYTOMETRIC ANALYSIS OF MITOCHONDRIAL MEMBRANE POTENTIAL AND APOPTOSIS OF FUMONISIN B1 AND SUTHERLANDIA FRUTESCENS-TREATED JURKAT CELLS
3.1 INTRODUCTION 29 3.2 FLOW CYTOMETRY 30 3.3 JC-1 ASSAY 32 3.3.1 Aims 33 3.3.2 Materials and Methods 33 3.3.2.1 Materials 33 3.3.2.2 Jurkat Cells 34 3.3.2.3 Sutherlandia 34 3.3.2.4 Methods 34 3.3.3 Results and Discussion 36 3.4 ANNEXIN V ASSAY 39
3.4.1 Aims 39 3.4.2 Materials and Methods 40 3.4.2.1 Materials 40 3.4.2.2 Methods 40 3.4.3 Results and Discussion 41
CHAPTER 4: LUMINOMETRIC ANALYSIS OF FUMONISIN B1- AND
SUTHERLANDIA FRUTESCENS TREATED JURKAT CELLS
4.1 CASPASE ASSAY 44 4.1.1 Aims 45 4.1.2 Materials and Methods 46 4.1.2.1 Materials 46 4.1.2.2 Methods 47 4.1.3 Results and Discussion
4.2 GLUTATHIONE LUMINOMETRY ASSAY 51 4.2.1 Aims 52 4.2.2 Materials and Methods 52 4.2.2.1 Materials 52 4.2.2.2 Methods 52 4.2.3 Results and Discussion 53
4.3 ATP QUANTIFICATION 54 4.3.1 Aims 55 4.3.2 Materials and Methods 55 4.3.2.1 Materials 55 4.3.2.2 Methods 56 4.3.3 Results and Discussion 56
xv
CHAPTER 5: SPECTROPHOTOMETRIC ANALYSIS OF REACTIVE NITROGEN AND OXYGEN SPECIES IN FUMONISIN B1 AND SUTHERLANDIA FRUTESCENS
TREATED JURKAT CELLS
5.1 NITRIC OXIDE ASSAY 58
5.1.1 Aims 58 5.1.2 Materials and Methods 59 5.1.2.1 Materials 59 5.1.2.2 Methods 59 5.1.3 Results and Discussion 59
5.2 TBARS ASSAY 61
5.2.1 Aims 61 5.2.2 Materials and Methods 61 5.2.2.1 Materials 61 5.2.2.2 Methods 62 5.2.3 Results and Discussion 62
CONCLUSION 65 REFERENCES 66 APPENDIX 77
xvi
INTRODUCTION
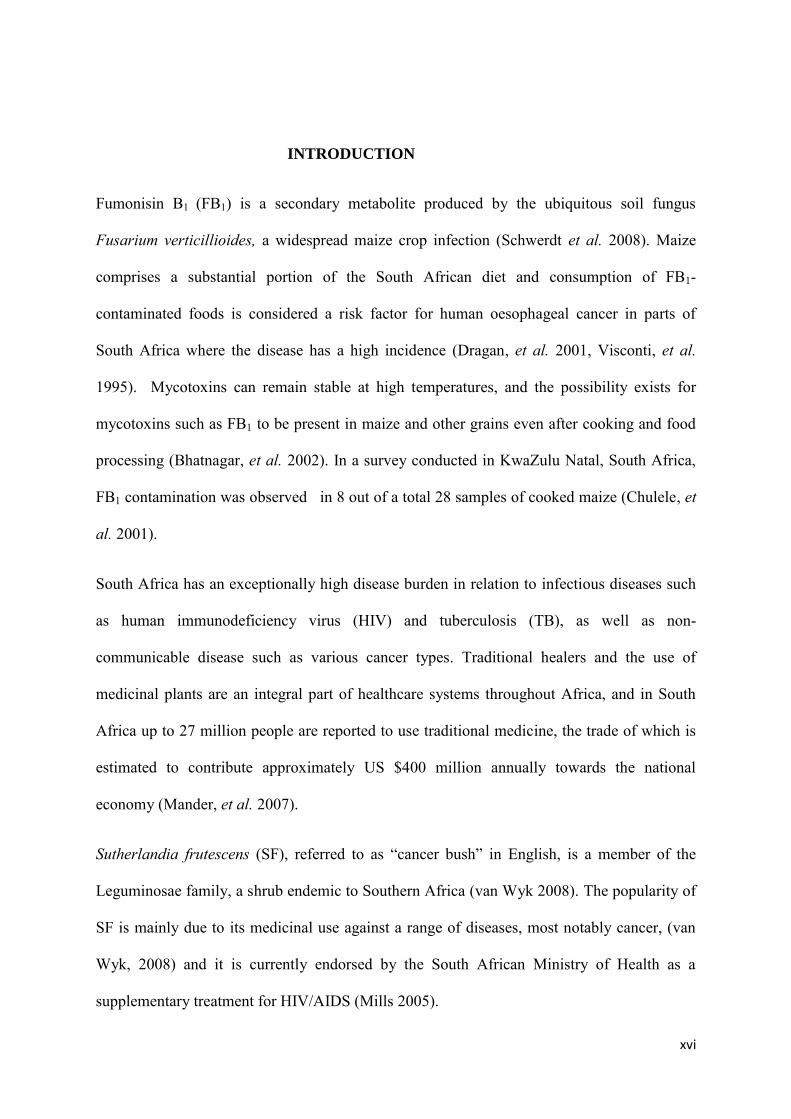
Fumonisin B1 (FB1) is a secondary metabolite produced by the ubiquitous soil fungus
Fusarium verticillioides, a widespread maize crop infection (Schwerdt et al. 2008). Maize
comprises a substantial portion of the South African diet and consumption of FB1-
contaminated foods is considered a risk factor for human oesophageal cancer in parts of
South Africa where the disease has a high incidence (Dragan, et al. 2001, Visconti, et al.
1995). Mycotoxins can remain stable at high temperatures, and the possibility exists for
mycotoxins such as FB1 to be present in maize and other grains even after cooking and food
processing (Bhatnagar, et al. 2002). In a survey conducted in KwaZulu Natal, South Africa,
FB1 contamination was observed in 8 out of a total 28 samples of cooked maize (Chulele, et
al. 2001).
South Africa has an exceptionally high disease burden in relation to infectious diseases such
as human immunodeficiency virus (HIV) and tuberculosis (TB), as well as non-
communicable disease such as various cancer types. Traditional healers and the use of
medicinal plants are an integral part of healthcare systems throughout Africa, and in South
Africa up to 27 million people are reported to use traditional medicine, the trade of which is
estimated to contribute approximately US $400 million annually towards the national
economy (Mander, et al. 2007).
Sutherlandia frutescens (SF), referred to as “cancer bush” in English, is a member of the
Leguminosae family, a shrub endemic to Southern Africa (van Wyk 2008). The popularity of
SF is mainly due to its medicinal use against a range of diseases, most notably cancer, (van
Wyk, 2008) and it is currently endorsed by the South African Ministry of Health as a
supplementary treatment for HIV/AIDS (Mills 2005).
xvii
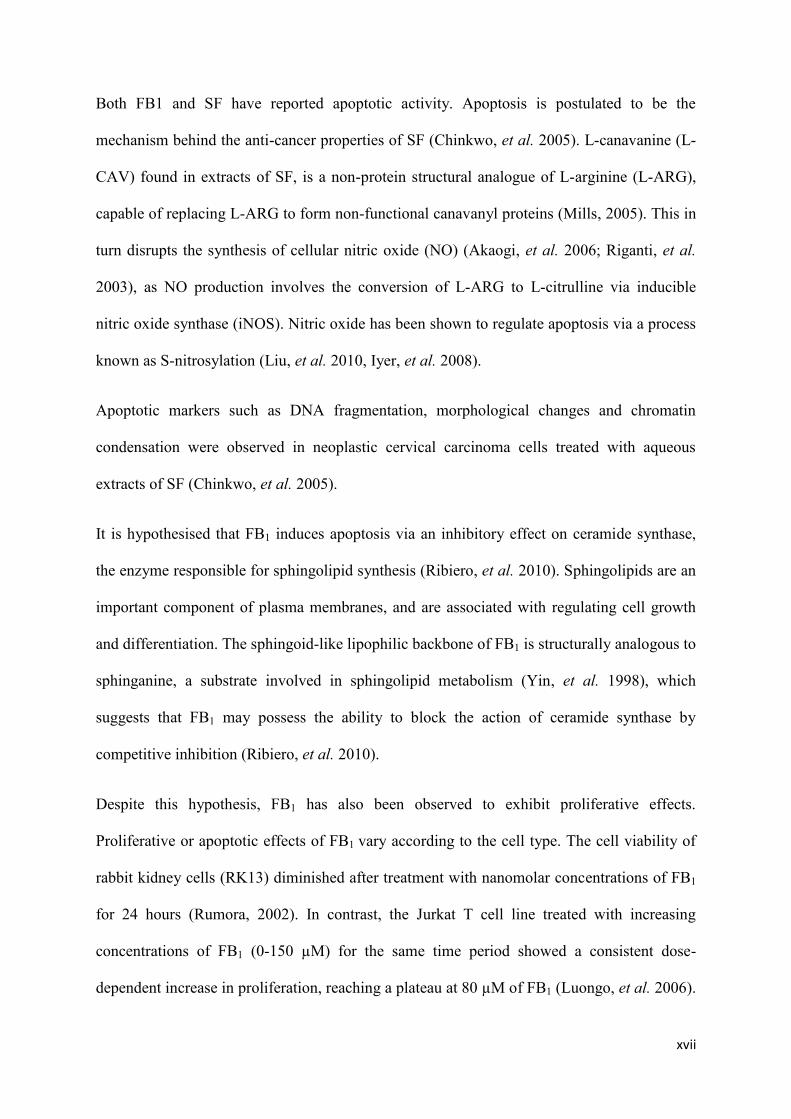
Both FB1 and SF have reported apoptotic activity. Apoptosis is postulated to be the
mechanism behind the anti-cancer properties of SF (Chinkwo, et al. 2005). L-canavanine (L-
CAV) found in extracts of SF, is a non-protein structural analogue of L-arginine (L-ARG),
capable of replacing L-ARG to form non-functional canavanyl proteins (Mills, 2005). This in
turn disrupts the synthesis of cellular nitric oxide (NO) (Akaogi, et al. 2006; Riganti, et al.
2003), as NO production involves the conversion of L-ARG to L-citrulline via inducible
nitric oxide synthase (iNOS). Nitric oxide has been shown to regulate apoptosis via a process
known as S-nitrosylation (Liu, et al. 2010, Iyer, et al. 2008).
Apoptotic markers such as DNA fragmentation, morphological changes and chromatin
condensation were observed in neoplastic cervical carcinoma cells treated with aqueous
extracts of SF (Chinkwo, et al. 2005).
It is hypothesised that FB1 induces apoptosis via an inhibitory effect on ceramide synthase,
the enzyme responsible for sphingolipid synthesis (Ribiero, et al. 2010). Sphingolipids are an
important component of plasma membranes, and are associated with regulating cell growth
and differentiation. The sphingoid-like lipophilic backbone of FB1 is structurally analogous to
sphinganine, a substrate involved in sphingolipid metabolism (Yin, et al. 1998), which
suggests that FB1 may possess the ability to block the action of ceramide synthase by
competitive inhibition (Ribiero, et al. 2010).
Despite this hypothesis, FB1 has also been observed to exhibit proliferative effects.
Proliferative or apoptotic effects of FB1 vary according to the cell type. The cell viability of
rabbit kidney cells (RK13) diminished after treatment with nanomolar concentrations of FB1
for 24 hours (Rumora, 2002). In contrast, the Jurkat T cell line treated with increasing
concentrations of FB1 (0-150 µM) for the same time period showed a consistent dose-
dependent increase in proliferation, reaching a plateau at 80 µM of FB1 (Luongo, et al. 2006).
xviii
Despite a proliferative action in T cells, FB1 has also demonstrated immune suppressing
effects in human immunocytes extracted from carcinoma patients, Dose-dependent
reductions in cell viability was observed when leukocytes from breast and oesophageal
cancer patients were exposed to FB1 (Odhav, et al. 2008).
Previous studies linked FB1 to oxidative stress (Abel and Gelderblom, 1998; Rumora, et al.
2007). Cellular membranes are postulated to be the main target for the cytotoxic effect of
FB1, and evidence for its role in lipid peroxidation has been presented, including dose-
dependent increases in reactive species generation in various cell lines treated with FB1 (Abel
and Gelderbloom, 1998; Stockmann-Juvala, et al. 2004). Still, the mechanism behind its
action remains largely unknown.
In contrast, SF has been linked to antioxidant activity, owing to its phenolic and flavonoid
constituents. Fernandes, et al. (2004) demonstrated that SF may possess superoxide and
hydrogen peroxide (H2O2) scavenging properties in neutrophils, which were observed at
concentrations as low as 10μg/mL.
The links between FB1 exposure, immune suppression, apoptosis and/or oxidative stress is
not yet fully understood. Due to the high consumption of maize and maize products in South
Africa, and the popularity of SF as a traditional medicine, it is possible that both SF and FB1
are frequently ingested in combination. This study aims to investigate the effects of exposure
to both SF and FB1 on immune cells, by measuring apoptotic and oxidative stress parameters
in the human acute T cell leukaemia Jurkat cell line (a model of T lymphocytes) pre-treated
with the IC50 concentration of FB1 and SF.
xix
AIM AND OBJECTIVES
The aim of this study was to expose the human acute T cell leukaemia Jurkat cell line to
Sutherlandia Frutescens (SF) and Fumonisin B1 (FB1), to determine any possible synergism
or antagonism.
Apoptotic and oxidative stress parameters were measured in Jurkat cells pre-treated with the
IC50 concentration of FB1 and SF.
These parameters included assessment of mitochondrial membrane potential (MMP),
phosphatidylserine (PS), metabolic activity, glutathione antioxidant response, and lipid
peroxidation in FB1 and SF-treated Jurkat cells.
1
CHAPTER 1: LITERATURE REVIEW
1.1 SUTHERLANDIA FRUTESCENS
The use of medicinal plants is an integral part of healthcare systems in Africa. In South
Africa, up to 27 million people are reported to use traditional medicine, the trade of which is
estimated to generate R2.9 billion (approx US $400 million) annually towards the national
economy (Mander, et al. 2007). Sutherlandia frutescens is one of the best known therapeutic
plants in Southern Africa, and has long been incorporated in the medicinal framework across
the region.
Sutherlandia frutescens, a perennial shrub that grows up to 2 ½ metres in length, is an
indigenous member of the Leguminosae family. It is identified by its oval, oblong shaped
leaves and light, but bright red tubular flowers. A number of subspecies exist and are located
along the coastal areas of Southern Africa (van Wyk and Albrecht, 2008).
Traditionally, SF was applied broadly to a range of ailments, most notably diabetes, fevers,
stomach ailments, and general stress. Its popularity however, stems from its use as a cancer
treatment, hence being given the name ―cancer-bush‖ (unwele in isiZulu; kankerbos in
Afrikaans).
Scientific and commercial interest in SF has increased considerably over the past decade,
mainly due to its association with not only cancer, but also HIV/AIDS. In South Africa, SF is
officially endorsed by the Ministry of Health as a supplementary treatment for HIV/AIDS
(Mills et al. 2005). The company Phyto Nova (Pty) Ltd is the main large-scale cultivator of
SF, and manufactures a 300 milligram (mg) tablet containing stem and leaf extracts of the
plant.
2
The leaves of SF contain the non-protein amino acid L-canavanine (L-CAV), a structural
analogue of L-arginine (L-ARG). As a result of its structural similarity, L-CAV is capable of
inhibiting the action of L-ARG-utilising enzymes such as inducible nitric oxide synthase
(iNOS or type II) and arginase. iNOS synthesises a sustained amount of nitric oxide (NO)
over prolonged periods and produces the highest quantity of NO compared to other members
of the NOS family. Nitric oxide is an inert, free radical gas critically involved in apoptosis via
mitogen-activated protein kinases (MAPK) activation. The up-regulation of NO is controlled
by the release of tumour necrosis factor- α (TNF-α) and other signalling molecules that
increase NO synthesis (Kim, et al. 2001).
The inhibition of iNOS can lead to the disruption of NO synthesis, as cellular NO production
involves the conversion of L-ARG to L-citrulline via iNOS (Akaogi, et al. 2006, Riganti, et
al. 2003).
Nitric oxide has been implicated in tumour cell growth promotion by inducing cell
proliferation, suggesting a regulatory role for NO in apoptosis. Hence, NO may possess
concentration-dependent pleiotropic functions (Iyer, et al. 2008).
The role of nitric oxide in apoptotic regulation occurs via S-nitrosylation, which is defined as
―the reversible coupling of a nitroso moiety to a reactive cysteine thiol, (which) leads to the
formation of S-nitrosothiol‖ (Iyer, et al. 2008). S-nitrosylation of pro-apoptotic proteins
results in both the induction and the inhibition of apoptosis. For example, the S-nitrosylation
of caspase-3, caspase-8 and caspase-9 inhibits their enzymatic activity, causing an anti-
apoptotic effect. In contrast, S-nitrosylation can degrade the anti-apoptotic FLICE Inhibitory
Protein (FLIP) protein, which in turn promotes apoptosis (Iyer, et al. 2008).
Additional anti-cancer properties attributed to L-CAV is owed to its primary metabolite L-
canaline. L-canaline is catalysed by the enzyme arginase, and was found to be cytotoxic
3
towards peripheral blood mononuclear cells (PBMCs) (Bence, et al. 2002). L-CAV can also
bind to arginyl tRNA synthetase during protein synthesis, to form non-functional canavanyl
proteins, which has both anti-cancer and antiviral properties (Mills, et al. 2005; Akaogi, et al.
2006).
(A) (B)
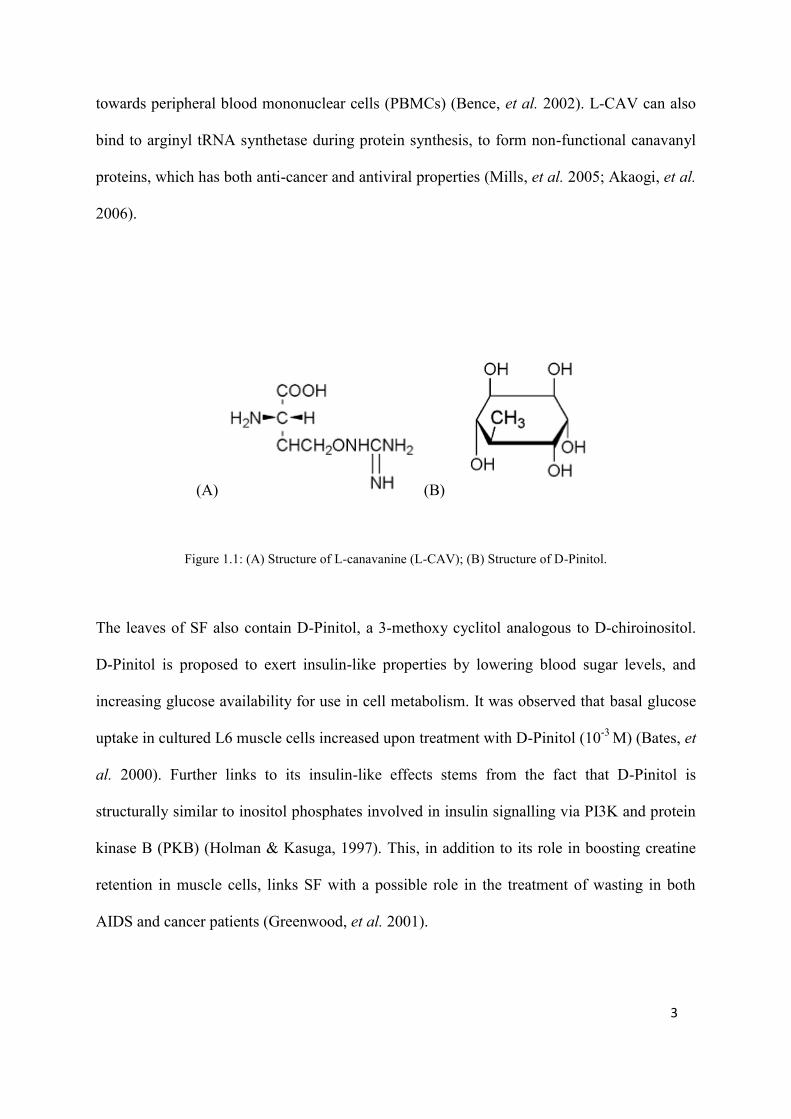
Figure 1.1: (A) Structure of L-canavanine (L-CAV); (B) Structure of D-Pinitol.
The leaves of SF also contain D-Pinitol, a 3-methoxy cyclitol analogous to D-chiroinositol.
D-Pinitol is proposed to exert insulin-like properties by lowering blood sugar levels, and
increasing glucose availability for use in cell metabolism. It was observed that basal glucose
uptake in cultured L6 muscle cells increased upon treatment with D-Pinitol (10-3 M) (Bates, et
al. 2000). Further links to its insulin-like effects stems from the fact that D-Pinitol is
structurally similar to inositol phosphates involved in insulin signalling via PI3K and protein
kinase B (PKB) (Holman & Kasuga, 1997). This, in addition to its role in boosting creatine
retention in muscle cells, links SF with a possible role in the treatment of wasting in both
AIDS and cancer patients (Greenwood, et al. 2001).
4
Sutherlandia contains a range of other phyto-active compounds such as phenols, flavonoids
and Triterpenoid saponins, which has linked it with antioxidant activities. Fernandes et al.
(2004) showed SF possesses potent superoxide and hydrogen peroxide scavenging properties
in neutrophils at relatively low concentrations. The ROS scavenging properties of SF may
account for its effects and use as an anti-inflammatory agent, however the mechanism behind
its antioxidant activity as yet remains unknown (Fernandes, et al. 2004).
The endorsement and commercial availability of SF is not yet in accordance with the amount
of scientific data currently existing on the plant, compared to other medicinal plants. Few
studies have been conducted on SF usage, particularly with respect to contraindications with
drug therapy and food contaminants.
1.2 FUMONISIN B1
The mycotoxin FB1 is a secondary metabolite produced by the ubiquitous soil fungus
Fusarium verticillioides (formerly known as Fusarium Monoliforme) and has been isolated
from a number of agricultural crops and cereals, particularly maize. Fumonisin B1 is
associated with an extensive list of diseases in livestock, including leukoencephalomalacia in
horses, pulmonary oedema in pigs, and hepatic cancer in rats (Schwerdt, et al. 2009). As a
result, research into its containment is considered to be of economic importance. The role of
FB1 in human disease however, leaves room for much needed investigation.
Isolated strains of the Fusarium verticillioides fungus from European grown maize have been
reported to produce up to 4mg/g of FB1 and FB2 (Visconti, et al. 1995). Investigations into
the prevalence of fumonisin contamination of corn-based foods in Southern California found
the mycotoxin present in all 38 samples examined, at a median concentration of 231ng/g
5
(Dvorak, et al. 2008). Mycotoxins can remain stable despite temperature changes, and the
possibility exists for mycotoxins such as FB1 to remain present in maize and other grains
subsequent to cooking and food processing (Bhatnagar, et al. 2003). A survey conducted in
KwaZulu Natal, South Africa showed the presence of FB1 in 29% out of a total of 28 cooked
maize samples (Chulele, et al. 2001). Fumonisin B1 has been epidemiologically linked to
oesophageal cancer (Dragan, et al. 2001, Visconti, et al. 1995), yet the mechanism behind its
proposed carcinogenicity has not yet been fully elucidated.
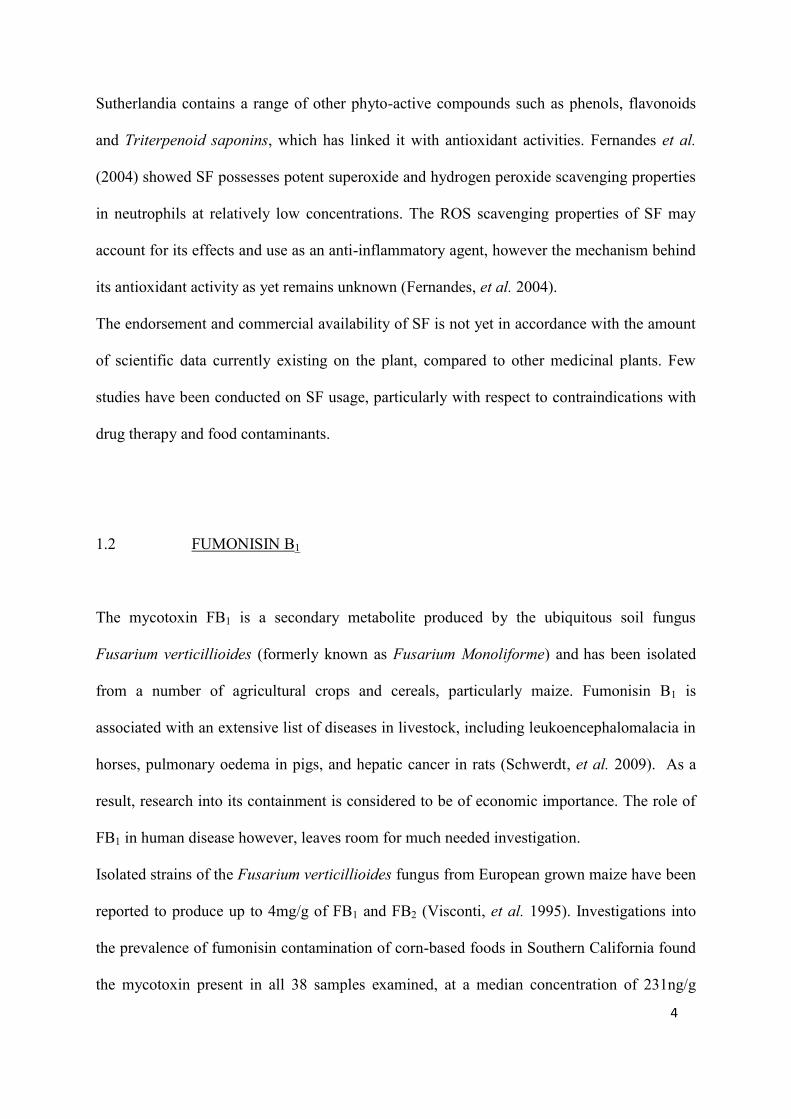
Over 15 fumonisin isomers exist, and FB1 appears to be most abundantly present. Fumonisin
B1 contains 10 stereocenters, which allows for the possibility for 1024 different
stereochemical structures. Fumonisin B1 belongs to the aminopolycarboxylic acid family, and
bears a strong structural similarity to sphinganine, owing to its hydroxygroups, aminogroup
and a 20-carbon lipophilic backbone (Yin, et al. 1998).
Figure 1.2: Structures of sphingosine, sphinganine, FB1, hydrolyzed FB1 (HFB1), FB2, FB3, and palmitoyl-
hydrolyzed FB1 (N-Pal-HFB1) (Seefelder, 2003).
6
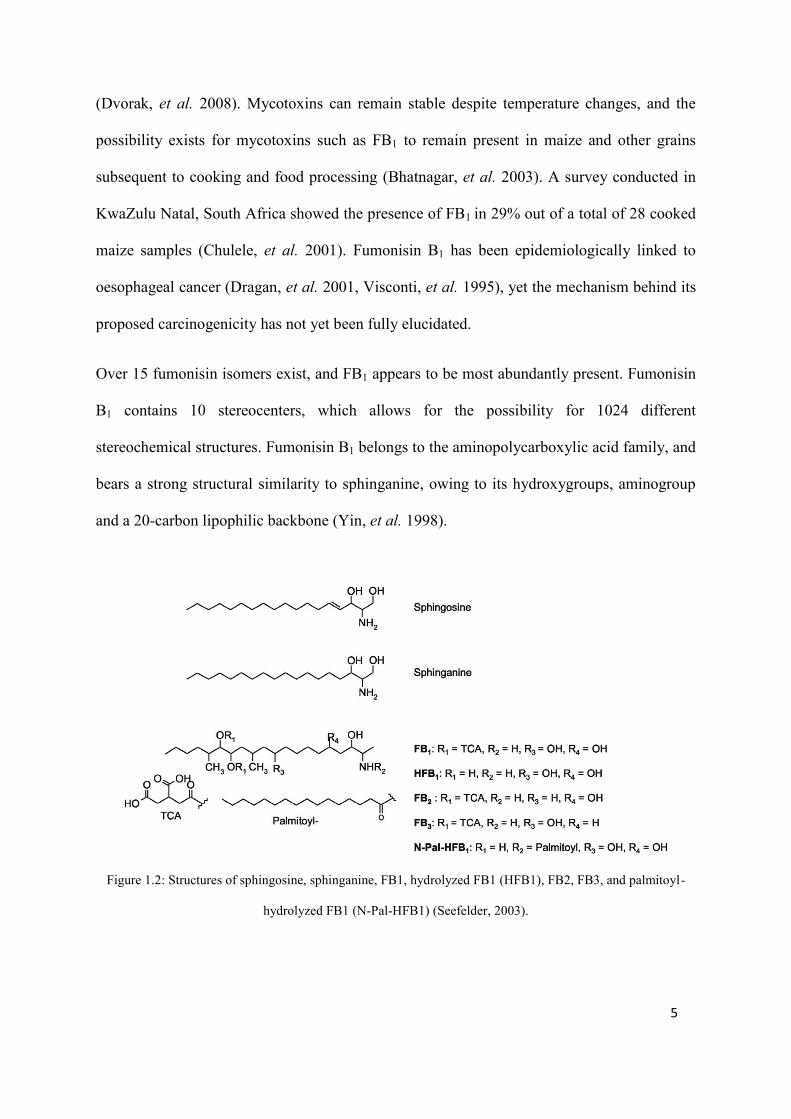
Sphinganine is a sphingoid base substrate that is converted to a sphingolipid product via the
action of ceramide synthase, the enzyme responsible for sphingolipid metabolism. The
structural similarity of FB1 enables FB1 to prevent the binding of sphinganine to ceramide
synthase via competitive inhibition, thus inhibiting ceramide synthesis (Ribiero, et al. 2010).
Sphingolipids are a significant component of plasma membranes, and are important
signalling molecules associated with regulating signal transduction pathways such as cell
proliferation, cytokine induction and apoptosis (Luongo, et al. 2006). The carcinogenicity of
FB1 has thus been attributed to cell signalling disruption owing to the ability of FB1 to inhibit
sphingolipid synthesis.
The sphingolipid ceramide is produced via cytokine activation and sphingomyelin (SM)
hydrolysis, catalysed by sphingomyelinase (SMase). Sphingoyelin is also a member of the
sphingolipid species, and is abundantly present in cell membranes, carrying important
structural and functional properties (Liu, et al. 1997). The enzyme SMase is linked to TNFα-
induced apoptosis, which will be discussed later. Ceramide is considered to be an important
apoptotic regulator, and has been associated with the induction of nitro-oxidative stress,
through its stimulation of reactive species O2. and NO. Therefore the inhibition of this
ceramide synthesis by FB1 should contribute to limiting the presence of reactive species, and
as an extension to reduce oxidative damage (Cuzzocrea, et al. 2008). However, FB1 has been
linked to the induction of oxidative stress (Rumora, et al. 2007), and evidence has been
presented to support a role for FB1 in lipid peroxidation (Abel and Gelderblom, 1998;
Stockmann-Juvala, et al. 2004). Lipid peroxidation is defined as the induction of cyclic lipid
degradation of polyunsaturated fatty acids. Lipid Peroxidation alters the lipid structure of cell
membranes, thus impacting on the fluidity of the membrane, leading to loss of function and
the destabilisation of membrane-bound receptors and enzymes (Winrow, et al. 1993). Early
7
stages of lipid peroxidation can be measured by electron spin resonance (ESR) oximetry,
which measures the concentration of aqueous molecular oxygen in liposomes as well as
oxygen uptake. Fumonisin B1 may contribute to lipid peroxidation by increasing molecular
oxygen transport close to the surface of cell membranes, which may potentially accelerate
oxidative reactions and ROS generation in the hydrophobic region of the membrane (Yin, et.
al 1998).
When the effect of FB1 on lipid peroxidation in egg yolk phosphatidylcholine (EYPC)
bilayers was demonstrated, Yin et al. (1998) observed that FB1 disrupted membrane ordering
and increased oxygen transport as well as membrane permeability. It was suggested that
membrane damage via lipid peroxidation and other free radical processes could also lead to
oxidative damage of DNA (Yin, et. al. 1998). Stockmann-Juvala et al. (2004) showed a dose-
and time-dependent increase in lipid peroxidation and ROS generation in U-118MG
glioblastoma cells treated with FB1 (Stockmann-Juvala, et al 2004).
Fumonisin B1 has been previously described as non-genotoxic; owing to the fact that studies
were not able to find DNA damage both in vivo and in vitro DNA repair assays in primary rat
hepatocytes (Gelderblom, et al. 1992). Yet, when Rumora et al. (2002) measured the ability
of FB1 treated rabbit kidney cells (RK13) to induce micronuclei as a marker for
genotoxicity, a significant increase in micronucleus was observed, albeit time and dose-
dependent (Rumora, et al. 2002). In a separate analysis, the mechanism behind the genotoxic
effect of FB1 was attributed to its ability to induce oxidative stress (Abel, et al. 1998).
The proliferative and/or apoptotic effects of FB1 appear to vary among different cell types.
The cell viability of RK13 cells diminished after treatment with nanomolar concentrations of
FB1 for 24h (Rumora, 2002), yet in contrast, the Jurkat T cell line treated with increasing
8
concentrations of FB1 (0-150 µM) for the same time period showed a consistent dose-
dependent proliferation increase at low doses, finally reaching a plateau at 80 µM FB1
(Luongo, et al. 2006). In spite of the cell proliferative activity in the Jurkat T cell line, FB1
has also contributed to T-cell suppression in human patients. A dose-dependent reduction of
human leukocytes was reported in oesophageal and breast cancer patients exposed to FB1
(Odhav, et al. 2008).
1.3 TUMOUR NECROSIS FACTOR- α
Cytokines are proteins that act as chemical messengers between cells. They are produced by
white blood cells and are capable of either stimulating or inhibiting the growth and activity of
various immune cells, thus effectively playing a role in immune and inflammation regulation
(Odhav, et al. 2008).
The cytokine TNF-α plays an instrumental role in growth modulation and differentiation in a
range of cell types. It is involved in inflammatory responses, and is also linked to immune
function regulation, owing to its pleiotropic properties.
Additionally, evidence has linked TNF-α to a range of therapeutic activities, including
infection and tumour resistance development, embryonic development and sleep regulation
(Idriss and Naismith, 2000).
9
Figure 1.3: Ribbon diagram showing the ―cone-shaped‖ TNFα trimer (Idriss and Naismith, 2000).
Cellular responses are signalled by TNF-α binding to cell surface receptors TNFR1 (or p55)
and TNFR2 (or p75/80). A distinct role is played by TNF-α in death receptor-mediated
apoptosis, via its ability to bind and cluster high-affinity receptors on cell membranes.
Although the binding of TNF-α to TNFR-2 has been reported to induce insufficient
cytotoxicity to promote apoptosis (Idriss and Naismith, 2000), TNFR2 receptor expression is
known to occur in activated T cells, and can contribute to T-cell homeostasis either through
apoptotic or cell proliferative pathways (Puga, et. al 2005; Vandenabeele, et al. 1995). Also,
T cells can provide informative data on TNFR2, owing to their possession of the biochemical
machinery required to regulate TNFR2 expression.
Tumour Necrosis Factor-α binds to either TNFR1 or TNFR2 and the complex is internalized
via clathrin-coated pits, and degraded within secondary lysosymes. This process activates a
number of secondary proteins including transcription factors NF-κB and AP-1, MAP Kinases
ERK-1 and ERK-2, and cysteine proteases, otherwise known as caspases. A range of cellular
responses are also invoked, as in the case of inflammatory gene expression, and ROS/RNS
generation.
10
In fact, TNF-α is linked to multiple gene expression such as IL-2 receptor, TNFR-associated
factor 1 and FAS associated death domain like interleukin-1–converting enzyme inhibitory
protein; all of which are the result of TNF-α activation of NF-κB, which is both redox
sensitive and pro-inflammatory. Both TNFR1 and TNFR2 contain intracellular death
domains (DD), which are instrumental in TNF-α-mediated apoptosis. These DD are
responsible for caspase activation, particularly caspase-8, which is recruited to the activated
receptor by adaptor proteins such as TRADD and FADD, which are discussed in the next
section (Idriss and Naismith, 2000).
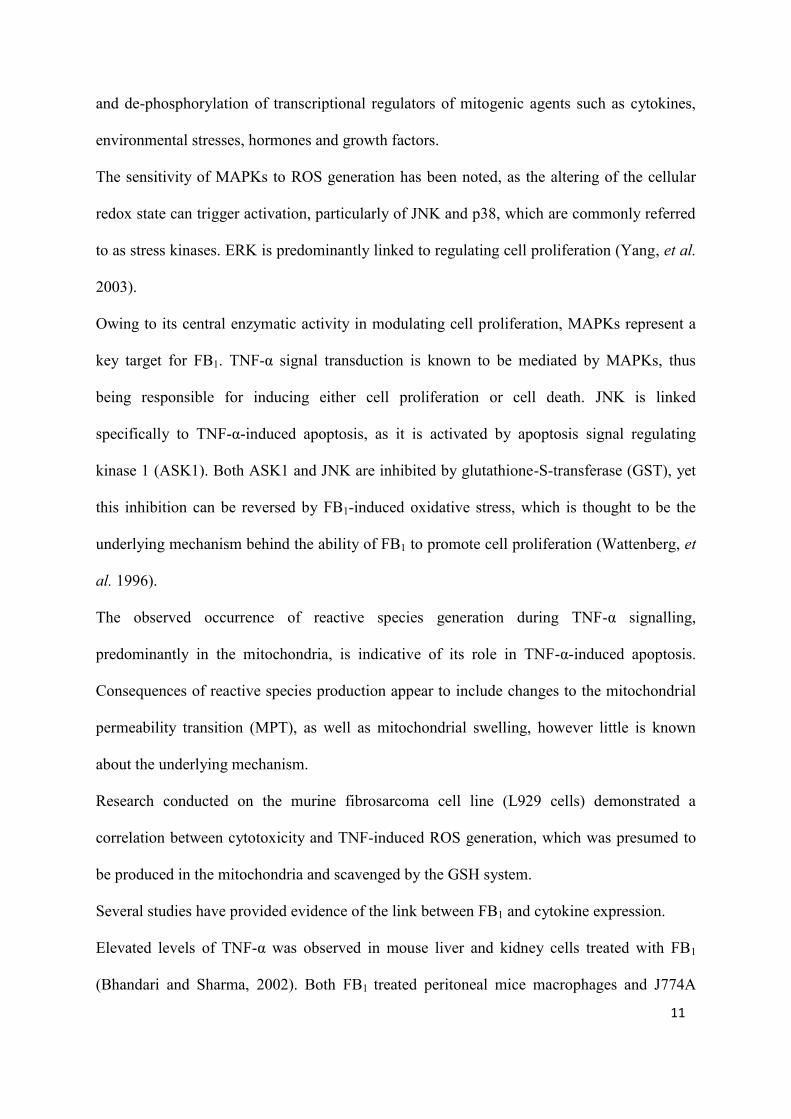
Figure 1.4: TNF signalling pathways involved in apoptosis (Rahman, et al. 2009).
The MAPKs are intracellular signalling pathways triggered in response to extracellular
stimuli. MAPKs are released in response to an array of stimuli, and its signalling pathways
play a fundamental role in eukaryotic gene expression, including cell growth, differentiation
and apoptosis. MAPKs control gene expression via their ability to induce phosphorylation
11
and de-phosphorylation of transcriptional regulators of mitogenic agents such as cytokines,
environmental stresses, hormones and growth factors.
The sensitivity of MAPKs to ROS generation has been noted, as the altering of the cellular
redox state can trigger activation, particularly of JNK and p38, which are commonly referred
to as stress kinases. ERK is predominantly linked to regulating cell proliferation (Yang, et al.
2003).
Owing to its central enzymatic activity in modulating cell proliferation, MAPKs represent a
key target for FB1. TNF-α signal transduction is known to be mediated by MAPKs, thus
being responsible for inducing either cell proliferation or cell death. JNK is linked
specifically to TNF-α-induced apoptosis, as it is activated by apoptosis signal regulating
kinase 1 (ASK1). Both ASK1 and JNK are inhibited by glutathione-S-transferase (GST), yet
this inhibition can be reversed by FB1-induced oxidative stress, which is thought to be the
underlying mechanism behind the ability of FB1 to promote cell proliferation (Wattenberg, et
al. 1996).
The observed occurrence of reactive species generation during TNF-α signalling,
predominantly in the mitochondria, is indicative of its role in TNF-α-induced apoptosis.
Consequences of reactive species production appear to include changes to the mitochondrial
permeability transition (MPT), as well as mitochondrial swelling, however little is known
about the underlying mechanism.
Research conducted on the murine fibrosarcoma cell line (L929 cells) demonstrated a
correlation between cytotoxicity and TNF-induced ROS generation, which was presumed to
be produced in the mitochondria and scavenged by the GSH system.
Several studies have provided evidence of the link between FB1 and cytokine expression.
Elevated levels of TNF-α was observed in mouse liver and kidney cells treated with FB1
(Bhandari and Sharma, 2002). Both FB1 treated peritoneal mice macrophages and J774A
12
mouse macrophage cell line showed increases in TNF-α expression (Dugyala, et al. 1998). In
contrast, swine alveolar macrophages demonstrated a reduction in TNF-α expression upon
FB1 treatment (Liu, et al. 2002), thus indicating a cell and tissue type-dependent response of
FB1 on cytokine expression.
Nitric oxide is a highly reactive molecule involved in regulatory processes in a range of
biological events (Choi, et al. 2002), and its low-level regulation is necessary for the
maintenance of cell homeostasis. Its role in regulating apoptosis and cell proliferation
incorporates MAPK activation, as NO induces the gradual elevation of Ca2+ ions activating
ERKs, which in turn stimulates cell division and hence proliferation. In a similar fashion,
NO-induced activation of stress kinases p38 and JNK promote apoptosis. This occurs via the
mitochondrial pathway, when cytochrome c is released from the mitochondria into the
cytosol, leading towards caspase-3 activation, the executioner caspase (Choi, et al. 2002).
Thus inhibiting iNOS by blocking MAPK signalling molecules can considerably impact on
the cellular homeostasis modulated by both iNOS and NO.
1.4 APOPTOSIS
Apoptosis is now known to be a specific form of cell death, of which there are several others.
Apoptosis is a normal occurrence during the growth and degeneration of living organisms,
and contributes maintaining cellular homeostasis. It also acts as a mode of defence during
pathogenic invasion of a host organism, or upon cell damage (Rastogi, et al. 2009).
Apoptosis is triggered by a range of stimuli, and regulated via signal transduction as a result
of cell signalling molecules such as TNF-α and MAPKs.
13
The morphological pathway of apoptosis clearly distinguishes it from other types of cell
death. This pathway includes cell shrinkage, chromatin condensation or pyknosis, and the
disintegration of the cell cytoskeleton, which causes bulges in the plasma membrane
otherwise known as blebbing. This is followed by nuclear DNA fragmentation or
karyorrhexis, and the formation of apoptotic bodies. These apoptotic bodies express cell
surface markers such as phosphatidylserine, which allows phagocytic recognition whilst
minimising the damage to surrounding tissue. Recombinant protein Annexin V binds to
phosphatidylserine residues on apoptotic bodies, and is currently applied as an apoptotic
detector (Elmore, 2007).
The induction of apoptosis occurs via the activation of a particular group of cysteine
proteases, referred to as ―caspases‖, which is incorporated into a cascade of pathway
activations initiated by apoptotic stimuli, leading to the ―programmed‖ death of the cell.
Caspases are initially synthesized as inactive precursors, which undergo a proteolytic
processing process prior to activation. A total of fourteen caspases have thus far been
identified in mammals, and of this only a subset has been identified as directly functional in
apoptotic regulation (Slee, 2000).
Inducing apoptosis is generally dependent on the nature of the stimuli and the pathway it
initiates. This determines which caspases are expressed. Caspases initially present themselves
in cells as an inactive proenzyme called a procaspase, which upon activation, initiates a
cascade of procaspase activation. The ensued proteolytic cascade then amplifies the pathway
associated with the activated procaspases, and heads toward ultimate apoptosis (Elmore,
2007).
Caspases are categorised in two general subsets. Upstream or apical caspases are aggregated
upon receipt of apoptotic stimuli, and initiate a caspase cascade. Within this subset are
caspase-2, -8, -9, -10, all having long N-terminal regions (prodomains) with motifs (caspase
14
recruitment domains (CARDs), and death effector domains (DEDs). Downstream, or
executioner, caspases (caspase-3, -6, -7), are directly involved in cell destruction. These
caspases have either prodomains or none at all (Slee 2000).
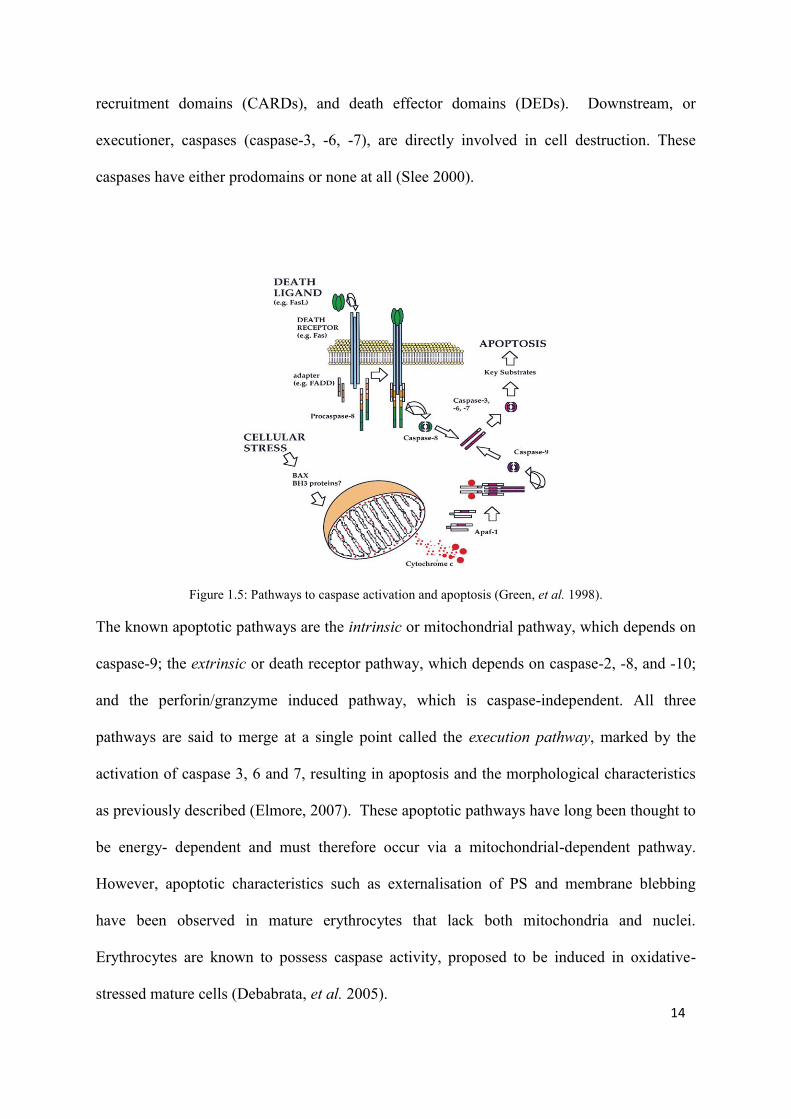
Figure 1.5: Pathways to caspase activation and apoptosis (Green, et al. 1998).
The known apoptotic pathways are the intrinsic or mitochondrial pathway, which depends on
caspase-9; the extrinsic or death receptor pathway, which depends on caspase-2, -8, and -10;
and the perforin/granzyme induced pathway, which is caspase-independent. All three
pathways are said to merge at a single point called the execution pathway, marked by the
activation of caspase 3, 6 and 7, resulting in apoptosis and the morphological characteristics
as previously described (Elmore, 2007). These apoptotic pathways have long been thought to
be energy- dependent and must therefore occur via a mitochondrial-dependent pathway.
However, apoptotic characteristics such as externalisation of PS and membrane blebbing
have been observed in mature erythrocytes that lack both mitochondria and nuclei.
Erythrocytes are known to possess caspase activity, proposed to be induced in oxidative-
stressed mature cells (Debabrata, et al. 2005).
15
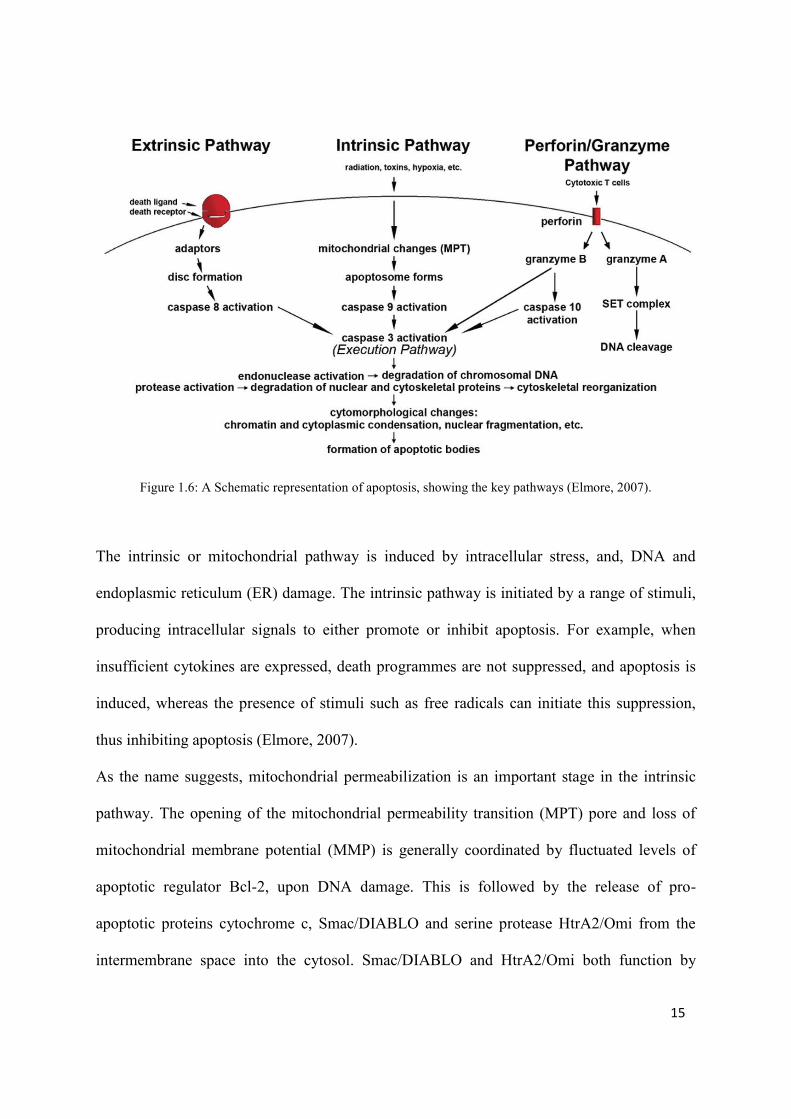
Figure 1.6: A Schematic representation of apoptosis, showing the key pathways (Elmore, 2007).
The intrinsic or mitochondrial pathway is induced by intracellular stress, and, DNA and
endoplasmic reticulum (ER) damage. The intrinsic pathway is initiated by a range of stimuli,
producing intracellular signals to either promote or inhibit apoptosis. For example, when
insufficient cytokines are expressed, death programmes are not suppressed, and apoptosis is
induced, whereas the presence of stimuli such as free radicals can initiate this suppression,
thus inhibiting apoptosis (Elmore, 2007).
As the name suggests, mitochondrial permeabilization is an important stage in the intrinsic
pathway. The opening of the mitochondrial permeability transition (MPT) pore and loss of
mitochondrial membrane potential (MMP) is generally coordinated by fluctuated levels of
apoptotic regulator Bcl-2, upon DNA damage. This is followed by the release of pro-
apoptotic proteins cytochrome c, Smac/DIABLO and serine protease HtrA2/Omi from the
intermembrane space into the cytosol. Smac/DIABLO and HtrA2/Omi both function by
16
blocking the activity of the inhibitors of apoptosis proteins (IAP) (Schimmer, 2004). A
complex called an apoptosome subsequently forms when cytochrome c binds to apoptotic
protease activating factor (Apaf-1) and procaspase-9 (Hill, et al. 2004). This stimulates
caspase-9 activation. Additional proteins including Apoptosis Inducing Factor (AIF) and
Endonuclease G (Endo G) are also released from the mitochondria but stimulate DNA
fragmentation and pyknosis via a caspase-independent pathway (Rastogi, et al. 2009).
The Extrinsic pathway triggers apoptosis via interaction between receptors belonging to the
TNF receptor gene superfamily and the appropriate ligand (Locksley, et al. 2001). Members
of this family commonly possess an 80 amino acid long ―death domain‖ located on the cell
surface, which is responsible for transmitting death signals to the intracellular signalling
pathways. The TNF-α/TNFR1 or TNFR2 ligand-receptor bond in activated T cells is an
example of this extrinsic pathway. Once the bond is formed, cytoplasmic adaptor proteins are
recruited and attach to the receptor. In the case of the TNF ligand - TNF receptor bond, the
adapter protein (TNF-Receptor Death Domain) TRADD is recruited. The death effector
domain then undergoes dimerization as TRADD binds to procapase-8, forming the death
inducing signal complex (DISC). The DISC can also be formed via the binding of the Fas
ligand to the Fas receptor, which recruits the adaptor protein (Fas-associated Death Domain
(FADD) in a similar fashion (Honglin, et al. 1998). This results in the auto-catalytic
activation of procaspase-8 to form caspase-8, which in turn triggers apoptosis. At this point
the intrinsic pathway can become involved, provided caspase-8 activation causes indirect
activation of downstream caspases, BH3 interacting domain death agonist (Bid) cleavage.
Fas-signalling is meant to occur via two pathways, both of which has been proposed to lead
to mitochondrial damage. The Bcl2 family of proteins contains Bcl2 homology domains
BH1,
17
BH2, BH3, and BH4, which are said to contribute to the anti-apoptotic characteristics of the
Bcl2 family, particularly in the prevention of apoptosis-induced mitochondrial damage. These
proteins may be able to disrupt the action of only the type II Fas-signalling pathway, but not
type I (Honglin, et al. 1998).
The perforin/granzyme pathway involves the release of perforin/granzyme-A or B by
cytotoxic T lymphocytes and NK cells (Martinvalet, et al. 2005). The resulting cytotoxicity
occurs as the transmembrane pore-forming molecule perforin is secreted, followed by the
release of cytoplasmic granules through the pore and into the target cell (Trapani and Smyth,
2002).
Granzyme B activates procaspase-10 owing to its ability to cleave proteins at aspartate
residues. This cleaving ability also allows granzyme B to cleave Bid protein and induce the
release of cytochrome c, which utilizes the mitochondrial pathway for the amplification of the
death signal. In addition, granzyme B is involved in the direct activation of caspase-3, thus
allowing the execution phase to occur without the involvement of signalling pathways (Barry
and Bleackley, 2002).
The action of granzyme A occurs via its stimulation of DNA nicking, an important feature in
apoptosis induction against tumour cells. This is achieved by the tumour suppressor gene
product DNAse NM23-H1. The nucleosome assembly protein SET is cleaved from the SET
complex and inhibits the NM23-H1 gene. The SET protein forms part of a complex that
repairs DNA and chromatin structure, therefore as granzyme A cleaves this complex, DNA
damage may appear, which may also contribute to apoptosis (Fan, et al. 2003).
18
1.5 OXIDATIVE STRESS
Oxidative stress has long been defined as an imbalance between oxidants and antioxidants,
where an influx of free radicals is presented, without the necessary antioxidant response to
act as scavengers. This definition predominantly but not exclusively refers to oxygen-derived
free radicals or ROS, which are primarily generated at the mitochondrial respiratory chain as
by-products of energy production and metabolism. Reactive species are involved in the
regulation of a range of cellular functions including the activation of receptor and nuclear
transcription factors, signal transduction and gene expression. For example, hydrogen
peroxide (H2O2) activates NF-kB and Nrf2, along with other universal transcription factors
(Packer, et al. 2007).
Reactive species are not however, limited to oxygen-derived radicals, as exemplified by free
radicals NO and nitrogen monoxide (NO+). The combination of NO with other free radical
superoxides forms the potent non-radical oxidant peroxynitrite, which is widely known to
induce tissue damage. Nitrogen monoxide participates in a range of physiological
occurrences such as vasodilation and neuronal signalling and inflammation. It is synthesised
by the enzyme nitric oxide synthase (NOS) and is present in various cell types (Packer, et al.
2007).
Due to the role of reactive species in signalling and control events via the altering of redox
pathways, a new definition of oxidative stress was proposed as “a disruption of redox
signalling and control that recognizes the occurrence of compartmentalized cellular redox
circuits” (Jones, et al. 2006).
As mentioned earlier, the mitochondrial respiratory chain is cited as the main source for the
synthesis of ROS, yet it is also the main target for their oxidative effects. As mitochondrial
DNA (mtDNA) rests in close proximity to the respiratory chain, it is particularly vulnerable
19
to oxidative damage. An apoptotic pathway is triggered as a result of electron transport
interruption, mitochondrial membrane depolarisation, and the inhibition of ATP synthesis
(Ott, et al. 2007).
The iron-sulphur protein aconitase is found in the mitochondria, and is elemental in the Krebs
cycle, being the enzyme involved in citrate to isocitrate conversion. Reactive species such as
O.2− directly oxidises and inactivates aconitases, resulting in iron release. Thus, the inevitable
disruption of the Krebs cycle as a result of mitochondrial aconitase inhibition, impacts on
energy production and cell viability (Farris, et al. 2005).
Glutathione (GSH) plays an important role in the mitochondrial antioxidant defence system.
The mitochondria contains its own stock of GSH that controls the level of ROS within the
cell via the action of GSH-linked enzymes Glutathione peroxidase 1 and 4 (Gpx1 and 4),
which catalyses the reduction of radicals such as H2O2 (Schreck, et al. 1991). Although Gpx1
is the predominant isoform, Gpx4 was shown to be more efficient at reducing hydroperoxide
groups on membrane phospholipids and lipoproteins, owing to its smaller size and larger
hydrophobic surface, making it the main enzymatic mechanism against cellular membrane
oxidative damage (Ott, et al. 2007).
Another important defence mechanism is the mitochondrial thioredoxin (Trx) system.
Although Trx systems are present in the cytoplasm and nucleus, mitochondrial Trx operates
independently, containing its own exclusive gene products Thioredoxin 2 (Trx2) and
thioredoxin reductase 2 (TrxR2). Trx2 and TrxR2 function by potently reducing protein
disulfides, the by-products of protein oxidation, as well as mixed disulfides between proteins
and GSH (de/glutathionylation) (Ott, et al. 2007). This reduction mechanism is thought to
assist with the protection of cysteine residues from modification by S-nitrosylation (Packer,
et al. 2007).
20
Data has been presented that links TNF-α signalling with the oxidation of mitochondrial
Trx2. Trx2 appears to play a distinct role in the regulation of TNF-α–induced ROS
generation in the mitochondria, which in turn regulates processes such as apoptosis and cell
proliferation via NF-κB activation.
As previously mentioned, the enzyme SMase has been implicated in TNFα-induced
apoptosis. SMase is activated by TNF-α, which in turn hydrolyses SM, resulting in the
production of ceramide, a known apoptotic regulator and inducer of oxidative stress
(Cuzzocrea, et al. 2008). Liu et al. (1997) demonstrated in MCF7 human carcinoma cells that
treatment with GSH inhibits the hydrolysis of SM by blocking the induction of neutral,
magnesium dependent SMase (N-SMase) by TNF-α. However, when the same cell line was
treated with TNF-α, a sharp decline in GSH levels was observed, and as a result, N-SMase
was activated leading to SM hydrolysis and ceramide formation. This suggests that the effects
of GSH are reversible and concentration dependent (Liu, et al. 1998).
Overproduction of ROS results in the depletion of GSH, which in turn affects an array of
functions such as protein biosynthesis, immune function, and detoxification capacity
(Ngondi, et al. 2006).
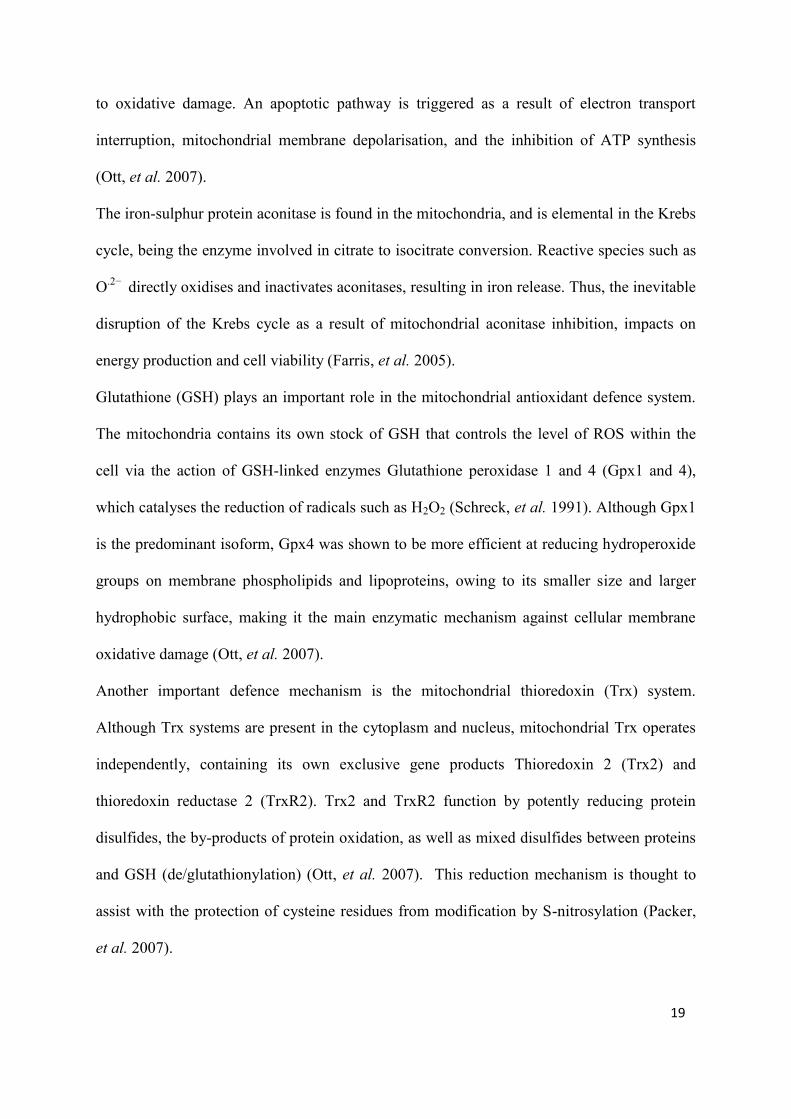
Figure 1.7: Effects of ROS on cellular functions and the induction of cell death - ROS induce DNA damage,
oxidation of proteins, impair mitochondrial respiration, and dose-dependently either stimulate or inhibit cellular
proliferation (Ott, et al. 2007).
21
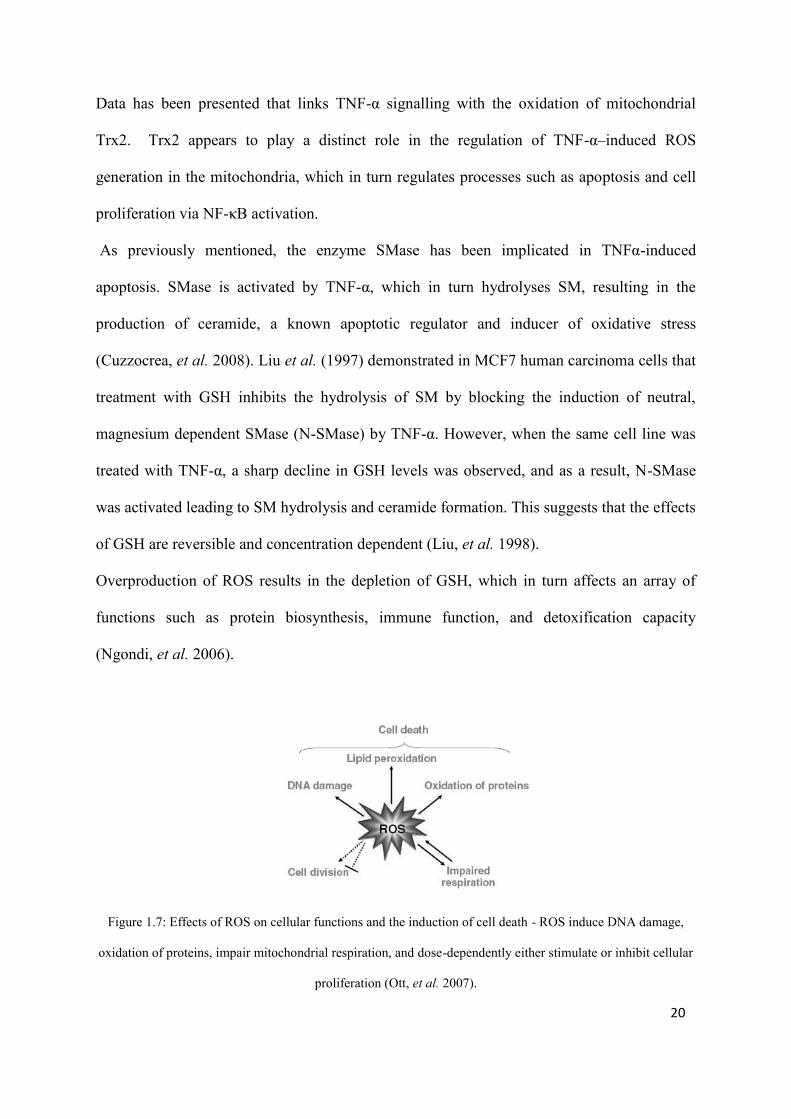
Figure 1.8: Formation, effects and inactivation of ROS in mitochondria (Ott, et al. 2007).
Lipid peroxidation predominantly acts on cellular membrane lipids. This results in membrane
permeability, loss of membrane function, and the destabilising of membrane-bound receptors
and enzymes (Abel, et al. 1998). By-products of lipid peroxidation are proposed to contribute
to major health risks such as atherosclerosis, as oxidized lipids have been identified in human
patients classified as high-risk for such lifestyle-related diseases. These by-products also
induce redox-related cell signalling, which integrate with other signalling pathways to control
cellular responses to extracellular stimuli.
In addition, lipid peroxidation impacts on mitochondrial functions such as maintenance of
mitochondrial membrane potential (ψ), respiration and oxidative phosphorylation,
mitochondrial Ca2+ buffering capacity and inner membrane barrier properties (Halliwell, et
al. 1993).
22
CHAPTER 2
METABOLIC ACTIVITY OF JURKAT CELLS AFTER TREATMENT BY MTT
ASSAY
2.1 MTT ASSAY
Abnormal cell metabolism, including energy and redox potential, are distinct characteristics
of carcinogenicity. In order to maintain cell viability, a homeostatic relationship must exist
among the growth requirements of the cell, the rate of production and energy use, and redox
metabolites, without having to alter the levels of metabolic intermediates associated with
other cell processes.
The methylthiazol tetrazolium (MTT) assay involves the reductive cleavage of the
heterocyclic organic yellow salt 3-[4,5-dimethylthiazol-2-yl]-2,5-diphenyltetrazolium
bromide, to the purple formazan product. The MTT assay is widely used for investigating cell
proliferation and cytotoxicity. It is colorimetric, and formation of the purple formazan is
indicative of cell viability, as only metabolically active cells are capable of converting MTT
salt to formazan (Bernhard, et al. 2003).
Despite being used extensively in cell proliferation and cytotoxicity assays, the mechanism
behind its bio-reductive properties remained elusive. It was initially proposed that MTT
reduction was due to the succinate-dehydrogenase system via the mitochondrial respiratory
chain. However, the ability of flavin oxidases and other non-mitochondrial dehydrogenases to
23
reduce MTT led to belief that an alternative mechanism was also involved. Berridge, et al.
(1996) provided evidence of the involvement of reduced nicotimamide NADH and NADPH.
Both NADH and NADPH are high-energy electron donors and their presence within the cell
contributes to cellular homeostasis owing to their involvement in biosynthetic pathways. The
primary association of NADPH is with cellular detoxification and the maintenance of the
antioxidant defence system. An intermediate role in ATP synthesis and transcription repair in
the nucleus is played by NADH. The oxidised NAD+ is converted to NADP+ via the action of
NAD kinases. A functional role in cell signalling is played by NADP+, as its conversion to
secondary messengers during calcium signalling impacts on cellular processes (Agledal, et al.
2010).
2.2 Aims
The aim was to determine the cell viability of Jurkat cells treated with FB1 and to calculate
the concentration of FB1 required to induce a 50% inhibition (IC50) of live Jurkat cells.
2.3 Materials and Methods
2.3.1 Materials
Methylthiazol tetrazolium salt was purchased from Calbiochem (SA); dimethyl sulphoxide
(DMSO) and PBS tablets were obtained from Merck (SA); 96 well microtitre plates were
purchased from the Scientific Group (SA). All other chemicals were purchased from Merck
(SA).
24
2.3.2 Jurkat cells
Jurkat cells are peripheral blood mononuclear cells that have been transformed to a
continuous cell line via infection with Epstein - Barr virus (EBV). Jurkat cells originally
derive from an acute T-cell leukaemia (ATCC TIB-152), and possess a pseudodiploid
karyotype, due to spontaneously occurring chromosome and genetic abnormalities within the
cell population (Neff and Reddy, 2008).
A cryovial of Jurkat cells was resuscitated by incubating at 37oC for a few minutes. The cells
were then suspended in 15 ml of pre-warmed culture medium (RPMI; 10% FCS; P/S), and
centrifuged for 10 minutes and 400rpm at RT (eppendorf 5804 R). The supernatant was then
discarded and the remaining pellet of cells re-suspended in 5 ml RPMI, and transferred to a
tissue culture flask containing the appropriate amount of media. At approximately 80-90%
confluency (1x10⁶ viable cell/ml), Jurkat cells were seeded into a 96-well microtitre plate
(2.0 × 10⁴ cells/well), treated in triplicate with serial dilutions of FB1 (0-500µM) made from a
1mg/ml stock (1384µM) at 37 ºC for 12h, 24 h and 48h.
2.3.3 Fumonisin B1
A 1 in 10 dilution of 10mg/ml stock of FB1 was prepared, having a final concentration of
(1384µM). This was then serially diluted with deionised water, within the range of 0 -
500µM, and used in the subsequent assay. The derived IC50 value for FB1 was used in all
subsequent assays.
2.3.4 Methods
After the respective incubation period, MTT salt (5 mg/mL in PBS at pH 7.4) was added to
the Jurkat cells and further incubated for 4 h at 37 ºC. These steps were performed in a safety
25
cabinet equipped with a vertical laminar flow hood, to ensure the protection of cell
suspension from any foreign particles that may affect the experiment. The microtitre plate
was then centrifuged (240C; 400g; 10 min) and the supernatants aspirated. Dimethyl
sulphoxide (DMSO) (100 μL/well) was added to the wells and left to incubate for 1h. As a
polar aprotic solvent, DMSO is unable to donate hydrogen, and is capable of dissolving both
polar and non polar compounds. Hence DMSO solubilises the insoluble formazan formed.
The optical density was measured at 570/690 nm, using a spectrophotometric plate reader
(Bio-Tek μQuant).
Calculations
The assay was performed in triplicate and the mean cell viability was calculated by
comparing the absorbance of each treatment to that of the control:
Cell Viability (%) = (Mean absorbance of treatment cells/Mean absorbance of control cells) x
100
Statistical Analysis
Based on MTT cell viability results, a FB1 dose-response curve was plotted for each time
period using GraphPad Prism v5.0 software (GraphPad Software Inc., La Jolla, USA), to
determine the IC50 of FB1 in Jurkat cells. The IC50 value obtained was used for Jurkat cell
treatments in subsequent assays.
26
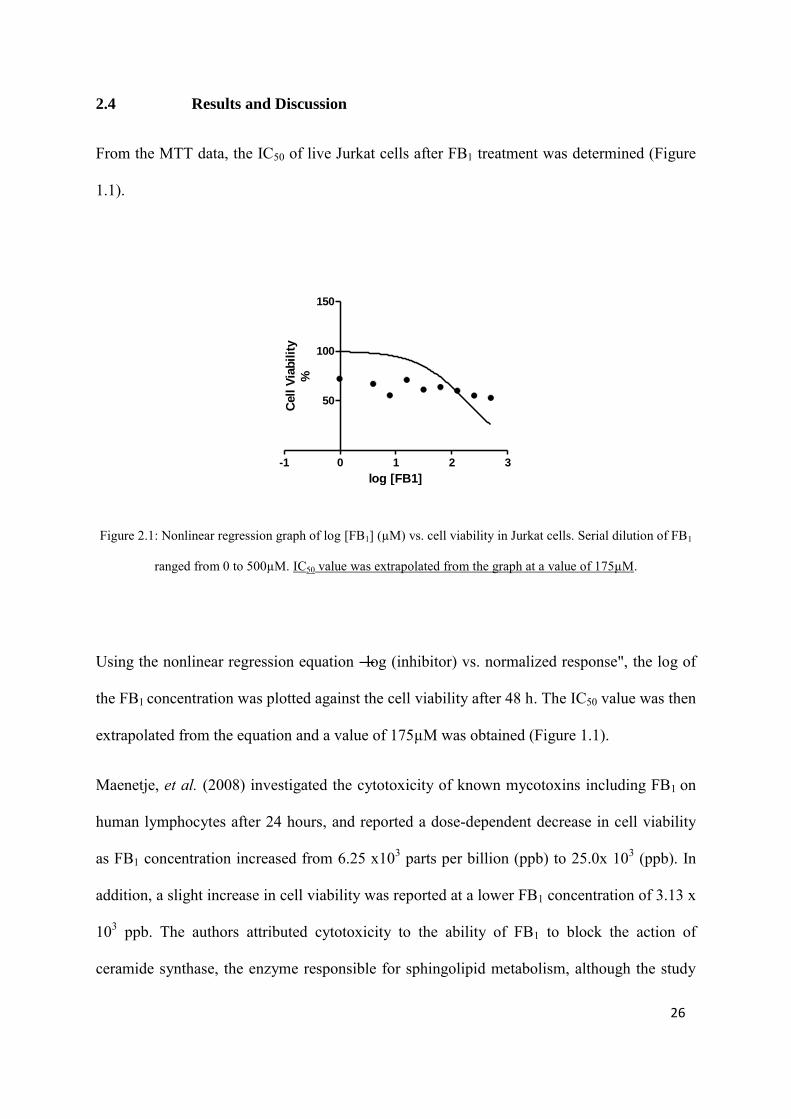
2.4 Results and Discussion
From the MTT data, the IC50 of live Jurkat cells after FB1 treatment was determined (Figure
1.1).
-1 0 1 2 3
50
100
150
log [FB1]
Cell
Via
bil
ity
%
Figure 2.1: Nonlinear regression graph of log [FB1] (µM) vs. cell viability in Jurkat cells. Serial dilution of FB1
ranged from 0 to 500µM. IC50 value was extrapolated from the graph at a value of 175µM.
Using the nonlinear regression equation ―log (inhibitor) vs. normalized response", the log of
the FB1 concentration was plotted against the cell viability after 48 h. The IC50 value was then
extrapolated from the equation and a value of 175µM was obtained (Figure 1.1).
Maenetje, et al. (2008) investigated the cytotoxicity of known mycotoxins including FB1 on
human lymphocytes after 24 hours, and reported a dose-dependent decrease in cell viability
as FB1 concentration increased from 6.25 x10³ parts per billion (ppb) to 25.0x 10³ (ppb). In
addition, a slight increase in cell viability was reported at a lower FB1 concentration of 3.13 x
103 ppb. The authors attributed cytotoxicity to the ability of FB1 to block the action of
ceramide synthase, the enzyme responsible for sphingolipid metabolism, although the study
27
provided no data to conclude this. Owing to it lipophilic backbone, FB1 bears strong
structural similarity to the ceramide synthase-binding substrate sphinganine. The sphingoid
base substrate converts to a sphingolipid product via the enzymatic action. As a result, FB1
may be capable of inhibiting sphingolipid synthesis (Yin, et al. 1998). Sphingolipids are an
important component of plasma membranes, and are associated with regulating signal
transduction pathways such as cell proliferation and apoptosis (Luongo, et al. 2006).
Therefore, the ability of FB1 to block the synthesis of this regulatory molecule may result in
uncontrolled cell proliferation, causing formation of the formazan product. This mechanism
has been proposed for the carcinogenic properties of FB1. An additional mechanism for cell
cytotoxicity is the ability of FB1 to promote oxidative stress. The iron-sulphur protein
aconitase is found in the mitochondria, and is elemental in the Krebs cycle, being the enzyme
involved in citrate-to-isocitrate conversion. Reactive species directly oxidise and inactivate
aconitases, resulting in iron release. Thus, the inevitable disruption of the Krebs cycle as a
result of mitochondrial aconitase inhibition, impacts on energy production and cell viability
(Farris, et al. 2005).
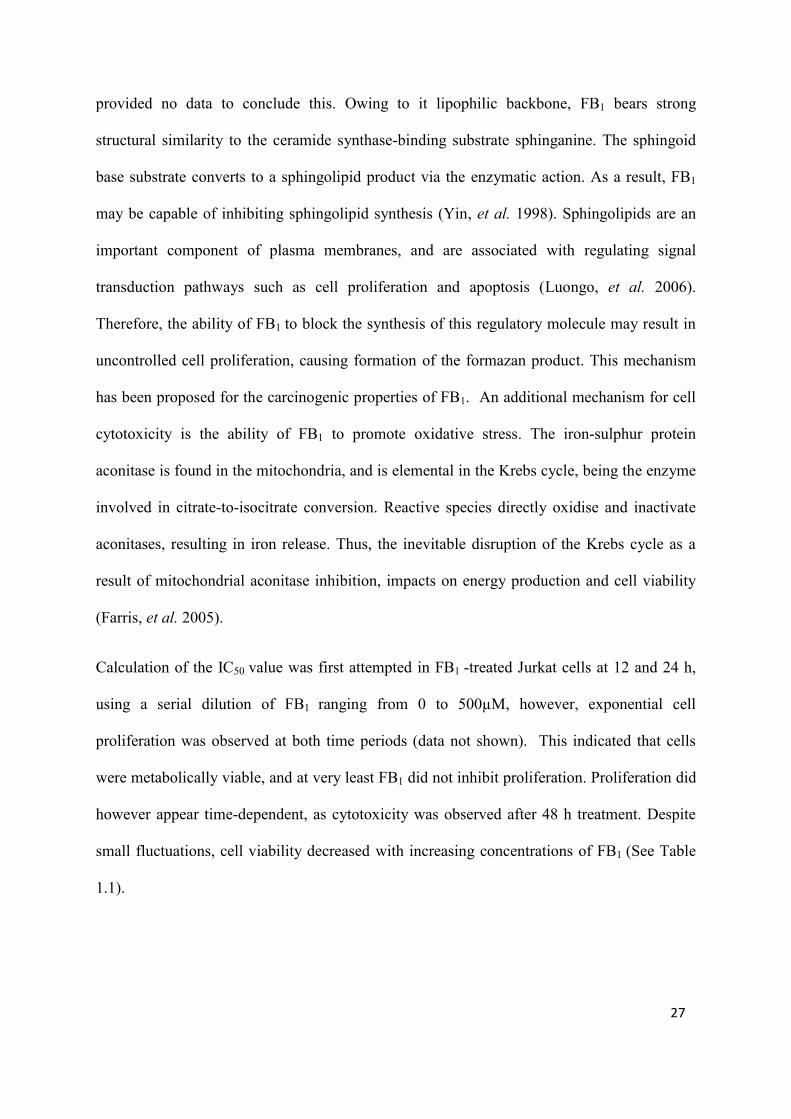
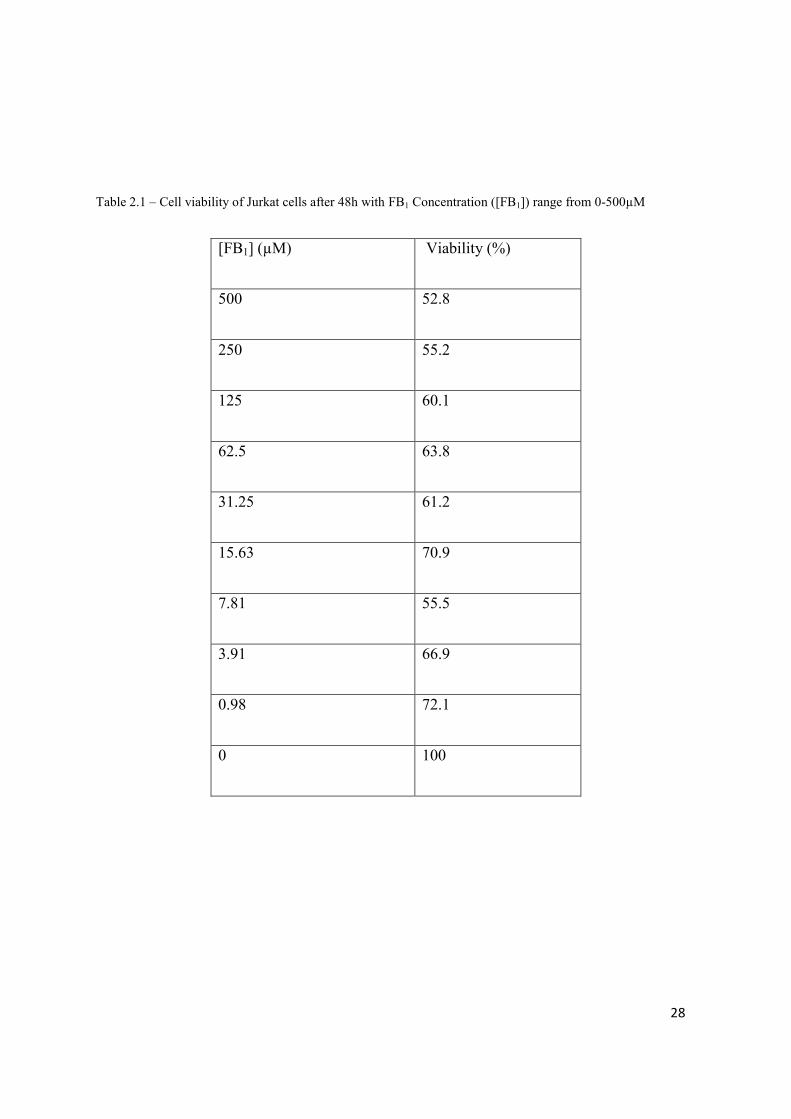
Calculation of the IC50 value was first attempted in FB1 -treated Jurkat cells at 12 and 24 h,
using a serial dilution of FB1 ranging from 0 to 500µM, however, exponential cell
proliferation was observed at both time periods (data not shown). This indicated that cells
were metabolically viable, and at very least FB1 did not inhibit proliferation. Proliferation did
however appear time-dependent, as cytotoxicity was observed after 48 h treatment. Despite
small fluctuations, cell viability decreased with increasing concentrations of FB1 (See Table
1.1).
28
Table 2.1 – Cell viability of Jurkat cells after 48h with FB1 Concentration ([FB1]) range from 0-500µM
[FB1] (µM) Viability (%)
500 52.8
250 55.2
125 60.1
62.5 63.8
31.25 61.2
15.63 70.9
7.81 55.5
3.91 66.9
0.98 72.1
0 100
29
CHAPTER 3
FLOW CYTOMETRIC ANALYSIS OF MITOCHONDRIAL MEMBRANE
POTENTIAL AND APOPTOSIS OF FUMONISIN B1 AND SUTHERLANDIA
FRUTESCENS-TREATED JURKAT CELLS
3.1 Introduction
Apoptosis is a normal occurrence during the growth and degeneration of living organisms,
and contributes to maintaining cellular homeostasis. It also acts as a mode of defence during
pathogenic invasion of host organisms, or upon cell damage. Apoptosis is triggered by a
range of stimuli, and regulated via signal transduction as a result of cell signalling molecules
such as TNF-α (Rastogi, et al. 2009).
The key role of mitochondria in a cell is ATP generation via oxidative phosphorylation and
oxygen consumption. The mitochondrion possesses a large, impermeable inner membrane
containing enzymes responsible for oxidative phosphorylation. In addition to ATP
generation, mitochondria also take part in the execution of apoptosis. Apoptotic cells undergo
both extrinsic (receptor-mediated) and intrinsic (mitochondrial-mediated) signalling
pathways, and both have been shown to recruit the mitochondrial death machinery, which
amplifies the apoptotic response (Farris, et al. 2005).
The loss of mitochondrial membrane potential (MMP) and opening of the mitochondrial
permeability transition (MPT) pore is associated with the intrinsic pathway towards
apoptosis. This involves the release of apoptotic protein cytochrome c, which inevitably
results in caspase-9 activation and mitochondrial depolarisation (Rastogi, et al. 2009) (See
Literature Review). Hence mitochondria have generally been assessed for the determination
of cell viability.
30
3.2 Flow Cytometry
Flow cytometry provides a mechanism by which cell populations can be distinguished via
measurable markers; whether size, fluorescent stain, or granular content (the number of
granules/other organelles contained within the cell). It involves the utilisation of laser light
scattering and fluorescent emission to collect information from the sample being analysed.
Flow cytometry finds predominant use in molecular biology laboratories for data extraction
in clinical diagnostic procedures, such as immunophenotyping for diagnosis of acute and
chronic leukaemias, immune-deficiencies (HIV) and lymphomas.
3.2.1 Continuous Flow
The cell samples are loaded into the central channel of the fluidics system, which is enclosed
by an outer sheath containing continuously flowing fluid. As this fluid moves, the sample
becomes constricted as the diameter of the central channel reduces. The sample then passes
through the nozzle of the cytometer one particle at a time. This is referred to as hydrodynamic
focusing, which limits the occurrence of nozzle blockage, as blockage prevents the analysis
of individual particles. The high thermal capacity of the water safeguards the cells from
damage by the laser beam (Ormerod, 2000).
3.2.2 Light
Subsequent to hydrodynamic focusing, the sample is exposed to beams of laser light. This is
the stage where sample information is obtained. Generally, light in the flow cytometer is
sourced from an argon ion laser, although arc lamps provide a cheaper but less effective
option. The laser produces an oval-shaped light beam of a single wavelength at 488nm, aimed
31
directly at the buffer stream. The sample passes through the laser beam one particle at a time.
Each particle to connect with the laser beam scatters light in all directions, and this scattered
light is collected and measured by detector systems (Ormerod, 2000).
3.2.3 Fluorescence
If the samples are labelled with fluorochromes (fluorescent dyes used in biological system
detection), upon exposure to the laser beams these fluorochromes become excited and the
electrical impulse generated is analysed by computer software. Two commonly used
fluorochrome labels are fluorescein isothiocyanate (FITC) and R-phycoerythrin (RPE), which
are easily distinguished from each other as they are excited at different wavelengths (approx
488nm and 575nm respectively) (Ormerod, 2000).
3.2.4 Detection
The Forward Scatter Channel (FSC) collects light scattered through a small angle (approx 200
from the laser beam axis), in the forward direction. This enables particles to be sorted
according to their size, which in the case of cells, helps to differentiate between living and
dead cells, as live cells produce a larger degree of low-angle light scatter compared to dead
cells (Ormerod 2000). The Side Scatter Channel (SSC) measures the light scattered at an
approximately 900 angle from the laser beam axis. In cell samples, cells with a larger granular
content scatter more light than other cells; thus the SSC sorts the sample according to this
marker. The data collected is analysed and the information is often displayed as a histogram
with the various parameters plotted against each other. For example, cell size can be plotted
against cell fluorescence. A dot plot or contour plot allows multiple parameters to be
displayed at the same time. In order to begin conducting analyses on the flow cytometer, the
outer sheath must be filled and the waste tank emptied. The vacuum trap must also be cleared
32
of any water. After switching on the machine, the required protocol is selected according to
the type of analysis being conducted (Ormerod, 2000).
3.3 JC-1 Assay
The cationic, lipophilic dye 5,5’,6,6’-tetrachloro-1,1’,3,3’ tetraethylbenzimidazolyl-
carbocyanine iodide or JC-1 is applied to measure the extent of mitochondrial membrane
depolarisation. Cells with low levels of depolarisation possess a negatively charged
membrane potential, which allows the positively charged JC-1 to enter and accumulate within
the mitochondrial matrix. J-aggregates form when high concentrations of JC-1 dye is
reached, resulting in considerable shifts in absorption and fluorescence maxima of the dye
and the mitochondrial becoming fluorescent red (Smiley, et al. 1991).
JC-1 exists in a liquid crystal form and possesses a unique feature in its ability to rapidly
form at desirable sites, and its display of ―resonance fluorescence‖. The large dye molecules
allow them to diffuse slowly enough for their application as reporter molecules for localized
biochemical events (Legrand, et al. 2001; Smiley, et al. 1991).
In depolarised cells however, the mitochondrial membrane potential does not remain intact,
hence the JC-1 dye is unable to accumulate within the mitochondria. JC-1 thus remains in the
cytoplasm and the cell appears fluorescent green. JC-1 has an absorption and fluorescence
maximum of 585 nm for J-aggregates. It is relatively non-toxic and soluble, and is detected
via flow cytometry.
33
Figure 3.1: Structure of 5,5',6,6'-tetrachloro-1,1',3,3'-tetraethylbenzimidazolocarbocyanine iodide (JC-1)
(Smiley, et al. 1991).
The JC-1 assay is a qualitative and quantitative cytofluorimetric method that allows cell
populations with different mitochondria content to be identified. Its predominant use
however, is in the investigations into the behaviour of mitochondria during a range of
biological processes, most notably apoptosis (Salvioli, et al. 1997).
3.3.1 Aims
The aim was to assess the mitochondrial membrane potential of Jurkat cells treated with IC50
values of FB1 and SF using the JC-1 assay.
3.3.2 Materials and Methods
3.3.2.1 Materials
The JC-1 Mitoscreen reagent was purchased from BD Biosciences (San Jose, CA). All
additional reagents were purchased from Merck (SA).
34
3.3.2.2 Jurkat Cells
Jurkat cells were resuscitated, re-suspended and transferred to a tissue culture flask, as
described in Chapter 2. At approximately 80-90% confluency (1x10⁶ viable cell/ml), Jurkat
cells were seeded into 4 x 15 ml Sterilin® tubes containing 5.0 × 10⁴ cells/tube, and treated
with IC50 values of FB1 and SF. This procedure was conducted for all subsequent assays.
Table 3.1 – Treatment regime for Jurkat cells
Jurkat Cells Treatment
Sample 1 FB1 only
Sample 2 SF only
Sample 3 FB1 and SF
Sample 4
Control
(dH20)
.
3.3.2.3 Sutherlandia frutescens (SF)
The stock solution of SF was calculated at 136.36mg/ml, and prepared via polar solvent
extraction, as discussed in Appendix A. The prepared solution was used in all subsequent
assays.
3.3.2.4 Methods
Sample Preparation
JC-1 working solution (100 μL) was added to 5 × 10⁴ pre-treated Jurkat cells (See Table 3.1)
in polystyrene cytometry tubes and vortexed thoroughly to remove any cell-to-cell clumping.
Tubes were then incubated for 10 min at room temperature. Cells were washed in JC-1 wash
buffer (1×), re-suspended in 200 μL flow cytometry sheath fluid and the tubes were gently
shaken and placed into the flow cytometer.
35
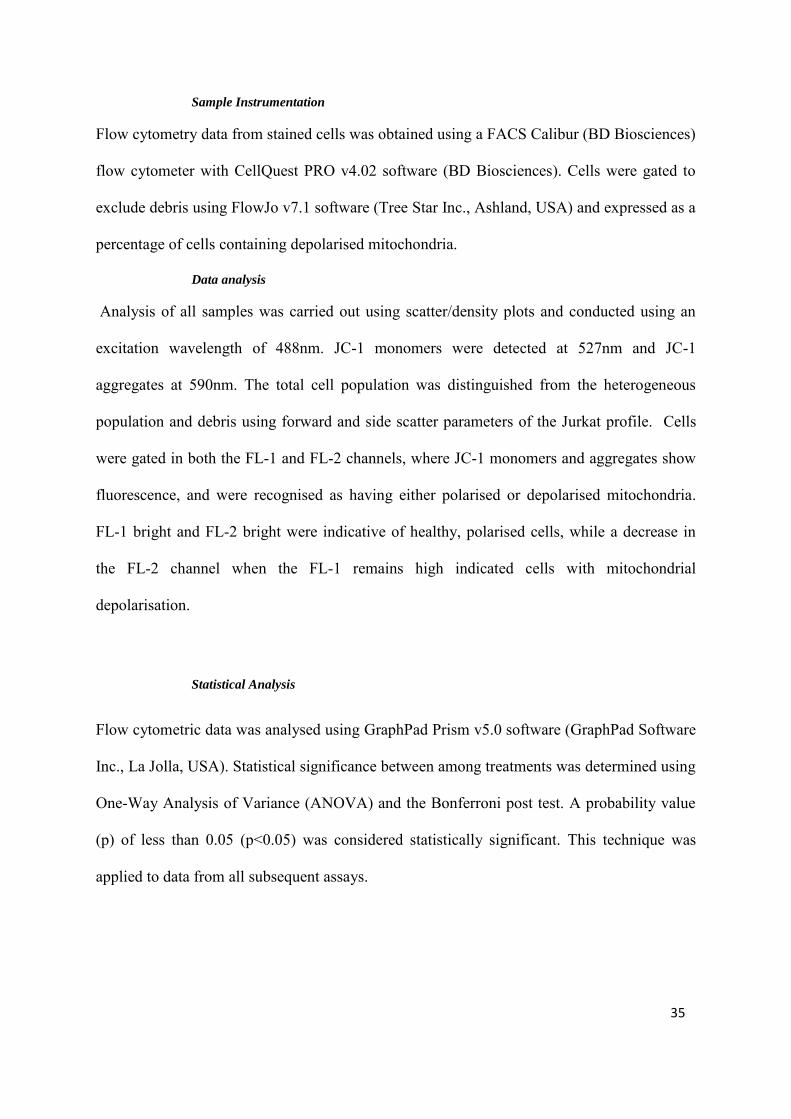
Sample Instrumentation
Flow cytometry data from stained cells was obtained using a FACS Calibur (BD Biosciences)
flow cytometer with CellQuest PRO v4.02 software (BD Biosciences). Cells were gated to
exclude debris using FlowJo v7.1 software (Tree Star Inc., Ashland, USA) and expressed as a
percentage of cells containing depolarised mitochondria.
Data analysis
Analysis of all samples was carried out using scatter/density plots and conducted using an
excitation wavelength of 488nm. JC-1 monomers were detected at 527nm and JC-1
aggregates at 590nm. The total cell population was distinguished from the heterogeneous
population and debris using forward and side scatter parameters of the Jurkat profile. Cells
were gated in both the FL-1 and FL-2 channels, where JC-1 monomers and aggregates show
fluorescence, and were recognised as having either polarised or depolarised mitochondria.
FL-1 bright and FL-2 bright were indicative of healthy, polarised cells, while a decrease in
the FL-2 channel when the FL-1 remains high indicated cells with mitochondrial
depolarisation.
Statistical Analysis
Flow cytometric data was analysed using GraphPad Prism v5.0 software (GraphPad Software
Inc., La Jolla, USA). Statistical significance between among treatments was determined using
One-Way Analysis of Variance (ANOVA) and the Bonferroni post test. A probability value
(p) of less than 0.05 (p<0.05) was considered statistically significant. This technique was
applied to data from all subsequent assays.
36
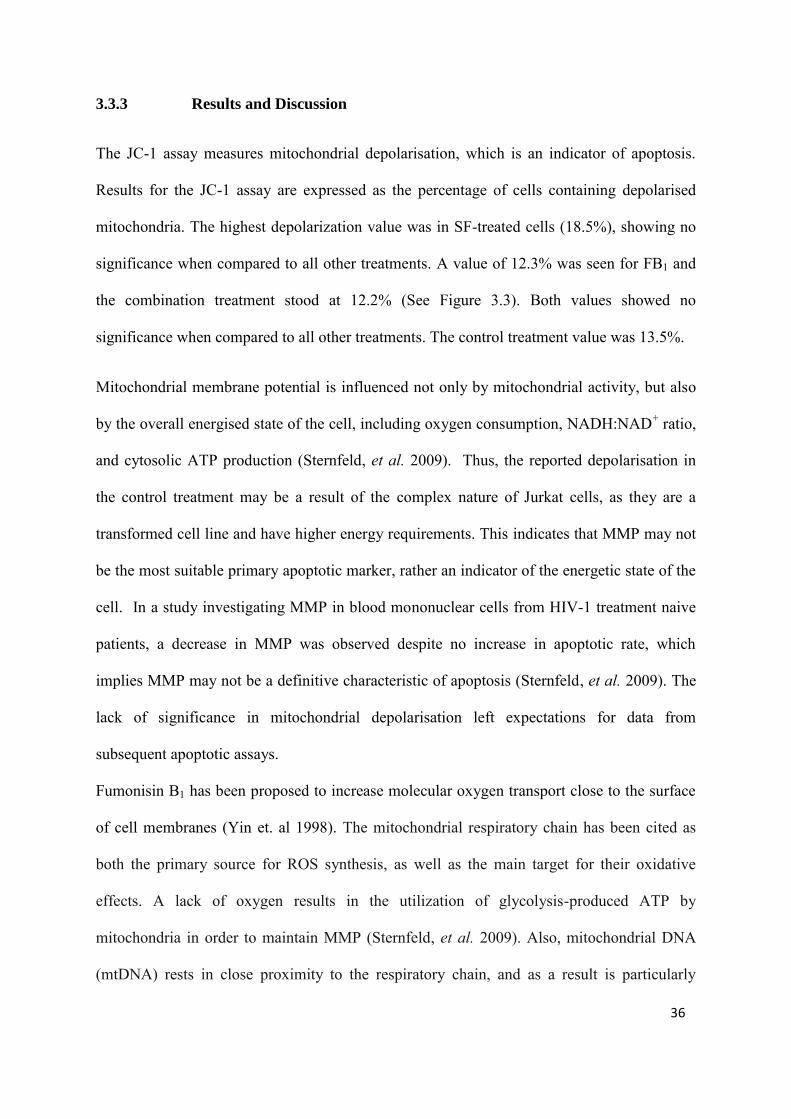
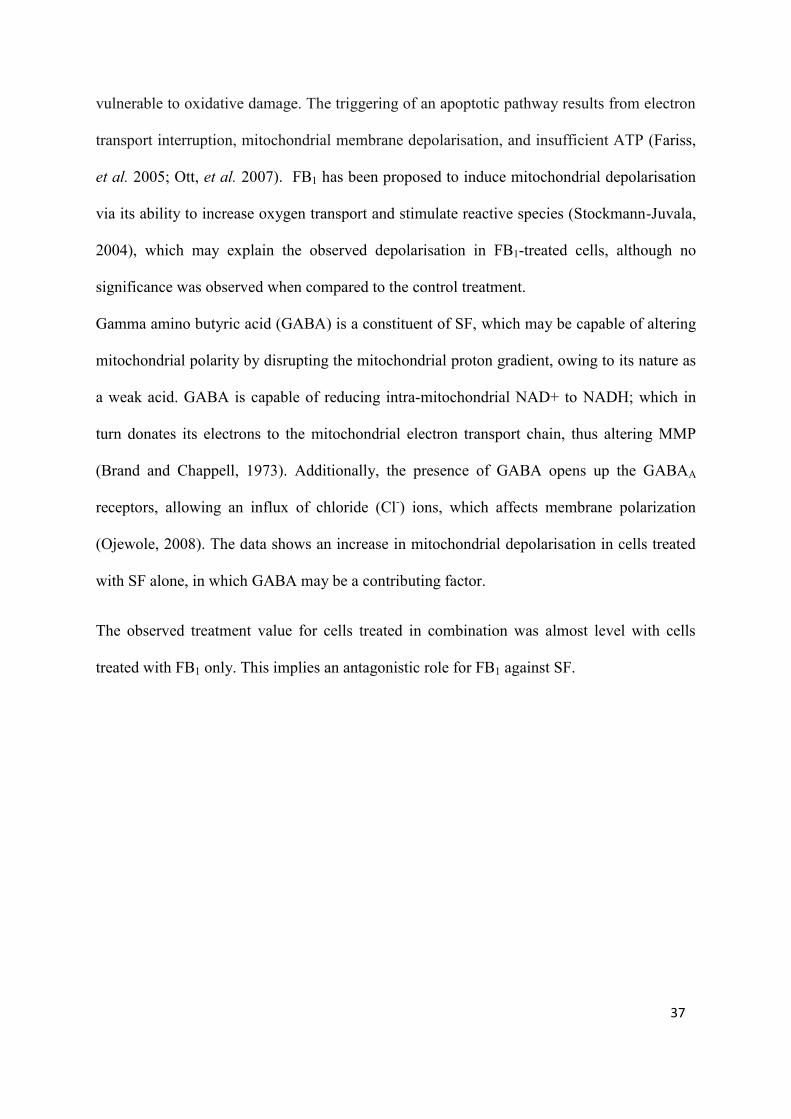
3.3.3 Results and Discussion
The JC-1 assay measures mitochondrial depolarisation, which is an indicator of apoptosis.
Results for the JC-1 assay are expressed as the percentage of cells containing depolarised
mitochondria. The highest depolarization value was in SF-treated cells (18.5%), showing no
significance when compared to all other treatments. A value of 12.3% was seen for FB1 and
the combination treatment stood at 12.2% (See Figure 3.3). Both values showed no
significance when compared to all other treatments. The control treatment value was 13.5%.
Mitochondrial membrane potential is influenced not only by mitochondrial activity, but also
by the overall energised state of the cell, including oxygen consumption, NADH:NAD+ ratio,
and cytosolic ATP production (Sternfeld, et al. 2009). Thus, the reported depolarisation in
the control treatment may be a result of the complex nature of Jurkat cells, as they are a
transformed cell line and have higher energy requirements. This indicates that MMP may not
be the most suitable primary apoptotic marker, rather an indicator of the energetic state of the
cell. In a study investigating MMP in blood mononuclear cells from HIV-1 treatment naive
patients, a decrease in MMP was observed despite no increase in apoptotic rate, which
implies MMP may not be a definitive characteristic of apoptosis (Sternfeld, et al. 2009). The
lack of significance in mitochondrial depolarisation left expectations for data from
subsequent apoptotic assays.
Fumonisin B1 has been proposed to increase molecular oxygen transport close to the surface
of cell membranes (Yin et. al 1998). The mitochondrial respiratory chain has been cited as
both the primary source for ROS synthesis, as well as the main target for their oxidative
effects. A lack of oxygen results in the utilization of glycolysis-produced ATP by
mitochondria in order to maintain MMP (Sternfeld, et al. 2009). Also, mitochondrial DNA
(mtDNA) rests in close proximity to the respiratory chain, and as a result is particularly
37
vulnerable to oxidative damage. The triggering of an apoptotic pathway results from electron
transport interruption, mitochondrial membrane depolarisation, and insufficient ATP (Fariss,
et al. 2005; Ott, et al. 2007). FB1 has been proposed to induce mitochondrial depolarisation
via its ability to increase oxygen transport and stimulate reactive species (Stockmann-Juvala,
2004), which may explain the observed depolarisation in FB1-treated cells, although no
significance was observed when compared to the control treatment.
Gamma amino butyric acid (GABA) is a constituent of SF, which may be capable of altering
mitochondrial polarity by disrupting the mitochondrial proton gradient, owing to its nature as
a weak acid. GABA is capable of reducing intra-mitochondrial NAD+ to NADH; which in
turn donates its electrons to the mitochondrial electron transport chain, thus altering MMP
(Brand and Chappell, 1973). Additionally, the presence of GABA opens up the GABAA
receptors, allowing an influx of chloride (Cl-) ions, which affects membrane polarization
(Ojewole, 2008). The data shows an increase in mitochondrial depolarisation in cells treated
with SF alone, in which GABA may be a contributing factor.
The observed treatment value for cells treated in combination was almost level with cells
treated with FB1 only. This implies an antagonistic role for FB1 against SF.
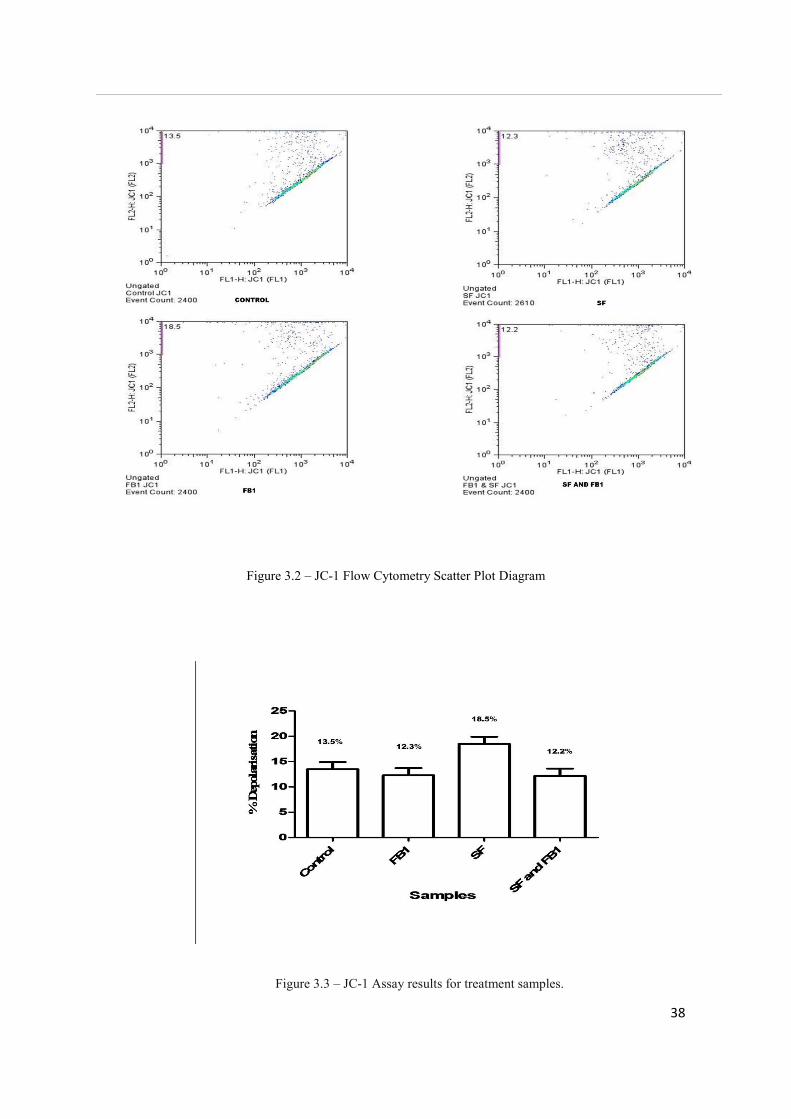
38
Figure 3.2 – JC-1 Flow Cytometry Scatter Plot Diagram
Figure 3.3 – JC-1 Assay results for treatment samples.
39
3.4 Annexin V Assay
The lipid phosphatidylserine (PS) has an important function in apoptosis. It is found on the
surface of apoptotic cells as an ―eat me‖ signal for phagocyte/macrophage recognition. The
positioning of PS on cell surfaces is dependent on caspase activation, hence its use as an
indicator of caspase-dependent apoptosis (Crimmi and Esposti, 2010). Although receptors
that bind to ligands other than PS and enable recognition exist, many of these ligands remain
unknown (Fadok, et al. 2003). Phosphatidylserine does appear to be most significant, as it has
been reported that apoptotic cells that did not express PS were not recognised by both mouse
macrophages and HT-1080 cells (Fadok, et al. 2000).
The 35-kDa Ca2+ -binding recombinant protein Annexin V was developed as an apoptotic
detector as it binds to PS residues on cells undergoing apoptosis. Biotinylated-annexin is used
to label cells in all stages of apoptosis, allowing for detection by flow cytometry. A
significant disadvantage of Annexin V is the fact that it can also attach to necrotic cells as
well as apoptotic, thus limiting its specificity. This is overcome in flow cytometry detection
by incorporating DNA binding dyes capable of distinguishing between necrosis and apoptosis
(Huerta, et al. 2007).
3.4.1 Aims
The aim was to assess phosphatidylserine (PS) binding in Jurkat cells treated with IC50 values
of FB1 and SF using the Annexin V assay.
40
3.4.2 Material and Methods
3.4.2.1 Materials
Annexin-V-FLUOS staining kit was purchased from Roche Diagnostics (Penzberg,
Germany). All other reagents were purchased from Merck (SA).
Annexin V-FLUOS labelling solution was prepared by diluting 20µl of the Annexin-V-
FLUOS labelling reagent and 1ml of the propidium iodide (PI) incubation buffer.
3.4.2.2 Methods
Sample Preparation
An aliquot of 5 x 10⁴ cells were transferred to eppendorf tubes and pelleted by centrifugation.
Cells were then re-suspended in the Annexin-V-FLUOS labelling solution, incubated in the
dark for 15 min and transferred to appropriately labelled polystyrene flow cytometric tubes.
Sample Instrumentation and Analysis
Annexin-V-FLUOS data were analysed using a FACS Calibur flow cytometer. Prior to
analysis, 500µL of an incubation buffer was added to each sample and the tubes were lightly
shaken and placed in the flow cytometer. Analysis of all samples was conducted using an
excitation wavelength of 488nm. Subsequently, FL1 (Annexin-V-FITC-PS) and FL3
(propidium iodide-DNA) signals were detected via 515nm and 600nm bandpass filters
respectively.
Data Analysis
Data was acquired with CellQuest PRO v4.0.2 software (BD Biosciences) and analyses using
FlowJO v7.1 Software (Tree Star, Inc.) Analysis was carried out using scatter/density plots.
41
The total cell population was distinguished from the heterogeneous population and debris
using forward and side scatter parameters of the Jurkat profile. Cells were gated in the
respective fluorescent probes. The Jurkat population was gated at the 102 mark on the FL1
and FL3 channels creating cluster gates, thereby differentiating apoptotic and necrotic cells.
Apoptotic cells were Annexin-V-FITC positive (x-axis) but PI negative (y-axis) (bottom right
quadrant) and necrotic cells were positive for both Annexin-V-FITC and PI (top right
quadrant)
Statistical Analysis
Statistical significance was determined using One-Way Analysis of Variance (ANOVA) and
the Bonferroni post test on GraphPad Prism v5.0 software (GraphPad Software Inc., La Jolla,
USA) A probability value (p) of less than 0.05 [p<0.05] was considered statistically
significant.
3.4 Results and Discussion
Results for the Annexin V assay are expressed in percentage of PS externalisation (%). The
combination treatment had the highest value of 29.1 %, showing no significance against the
control value, but significant when compared to SF-treated cells [p<0.05]. A value of 24.3 %
was seen for FB1, which was significant when compared to SF [p<0.05], but not against the
other treatments. The lowest value was observed for SF at 3.69 %, which was significant
when compared to FB1, combination treatment, and the control [p<0.05]. The control
treatment value was 23.9 % (See Figure 3.5).
42
Although the Jurkat T cell line expresses similar markers as those found in normal T
lymphocytes, proliferation occurs at a much faster rate, which may explain the results
observed in the control cells.
The low value of Annexin binding in SF-treated cells was unexpected, and upon initial
observation appears to represent an inhibition of apoptosis. The primary location for PS
synthesis appears to be in mitochondria-associated membranes of the endoplasmic reticulum.
There is no evidence to suggest that significant changes in mitochondrial PS levels occur
during apoptosis, except in cases where oxidative stress is involved. Oxidation of PS by
reactive species generated from the mitochondrial respiratory chain has been strongly linked
to its externalization and role in the phagocytosis of apoptotic cells (Serenkan, et al. 2004). A
likely mechanism behind this involves the electrostatic interaction of positively charged
cytochrome c from the mitochondria with negatively charged PS, which catalyses PS
oxidation (Serenkan, et al. 2004). Therefore, the low levels of Annexin V binding observed
could be a result of the absence of PS oxidation in SF-treated cells. Reports have indicated
that SF may possess antioxidant activity (Fernandes, et al. 2004), which may have inhibited
PS oxidation and hence prevented its externalization. However it has also been demonstrated
that although antioxidant activity may inhibit PS oxidation (Jiang, et al. 2003); it may not
necessarily block phagocytosis or even prevent PS externalization. A study involving the
treatment of Jurkat cells with potent antioxidant Vitamin E, showed no changes in PS
externalization, phagocytosis or other apoptotic biomarkers, despite having no detectable
levels of PS oxidation (Serenkan, et al. 2004). Although results for SF-treated cells did not
correlate with JC-1 data, which indicates that some level of mitochondrial depolarisation
occurred within SF-treated cells, as it was concluded that MMP is not a primary apoptotic
marker, it may not be reflective of the true apoptotic state of the cell.
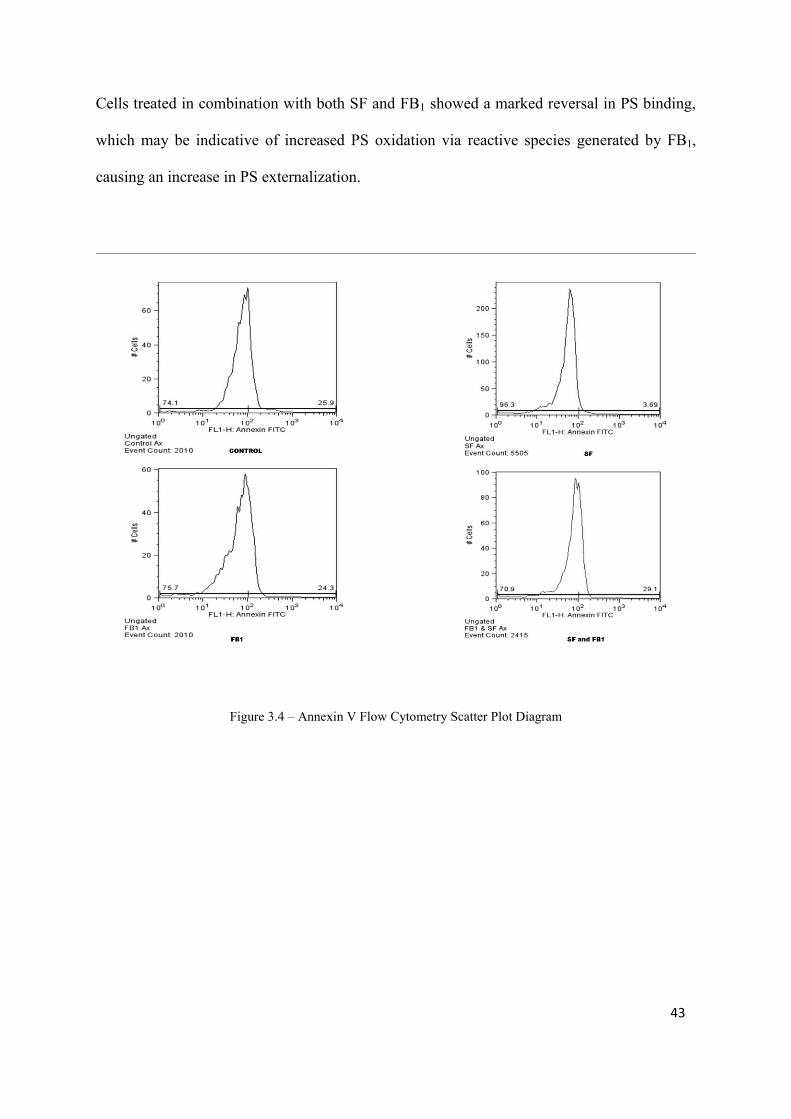
43
Cells treated in combination with both SF and FB1 showed a marked reversal in PS binding,
which may be indicative of increased PS oxidation via reactive species generated by FB1,
causing an increase in PS externalization.
Figure 3.4 – Annexin V Flow Cytometry Scatter Plot Diagram
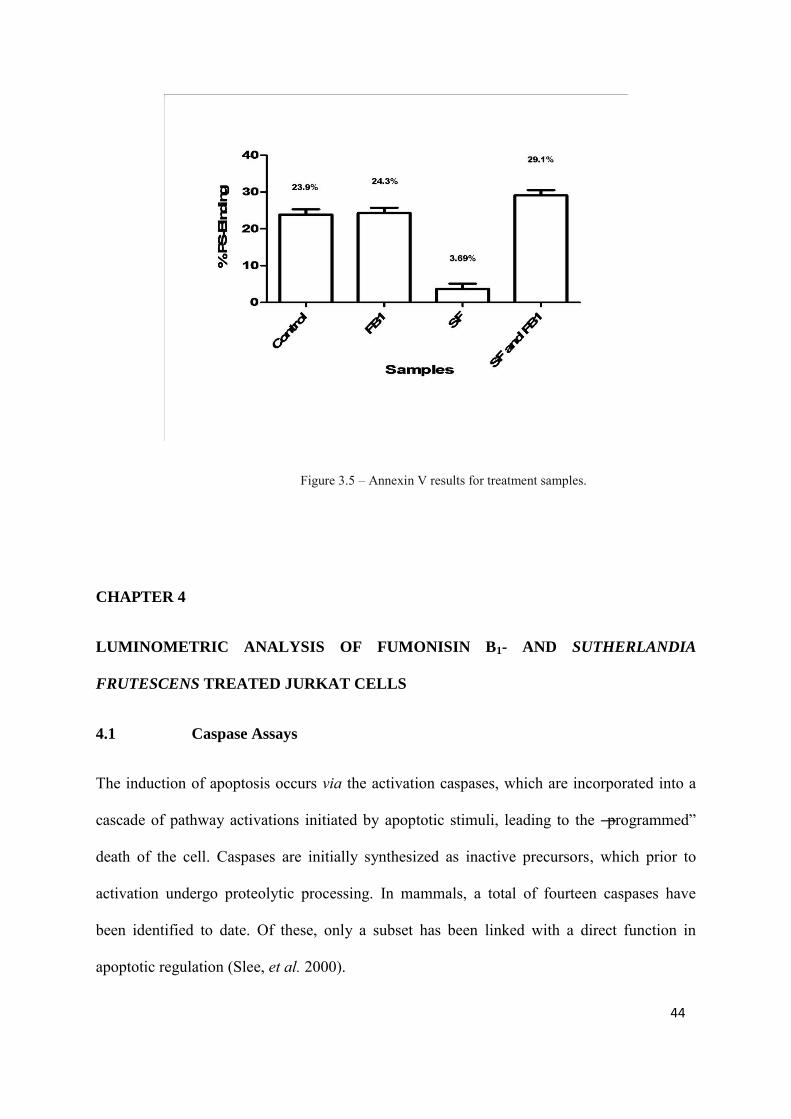
44
Figure 3.5 – Annexin V results for treatment samples.
CHAPTER 4
LUMINOMETRIC ANALYSIS OF FUMONISIN B1- AND SUTHERLANDIA
FRUTESCENS TREATED JURKAT CELLS
4.1 Caspase Assays
The induction of apoptosis occurs via the activation caspases, which are incorporated into a
cascade of pathway activations initiated by apoptotic stimuli, leading to the ―programmed‖
death of the cell. Caspases are initially synthesized as inactive precursors, which prior to
activation undergo proteolytic processing. In mammals, a total of fourteen caspases have
been identified to date. Of these, only a subset has been linked with a direct function in
apoptotic regulation (Slee, et al. 2000).
45
All three pathways involved in apoptosis (intrinsic, extrinsic and perforin/granzyme) are
considered to merge at a single point called the execution pathway, which is defined by the
activation of caspase 3, 6 and 7, resulting in the characteristic morphological changes seen in
apoptosis (Elmore, 2007).
Apoptotic induction is generally dependent on the nature of the stimuli and the pathway it
initiates. This will determine which caspases are expressed. Caspases initially present
themselves in cells as an inactive proenzyme called a procaspase, which upon activation goes
on to initiate a cascade of procaspase activation. This proteolytic cascade amplifies the
pathway associated with the activated procaspases, ultimately leading to cell death.
Caspases belong to two general subsets. The upstream or apical caspases become aggregated
upon receipt of apoptotic stimuli, and initiate a caspase cascade. Within this subset is
caspase-2, -8, -9, -10, which have long N-terminal regions (prodomains) containing specific
motifs – the caspase recruitment domains (CARDs), and death effector domains (DEDs).
Downstream, or executioner, caspases (caspase-3, -6, -7), are directly involved in cell
destruction. These caspases may or may not possess prodomains (Slee, et al. 2000).
Caspase-Glo® Assays operate via a bioluminescent system, where a complex containing a
luminogenic substrate and the enzyme luciferase is added to the cell sample. The substrate is
then cleaved by the respective caspases, resulting in the generation of a luminescent signal,
which is directly proportional to the level of caspase activity present in the cell (Karvinen,
2002).
4.1.1 Aims
The aim was to investigate caspase-3/7, -8 and -9 activities in FB1 and SF-treated Jurkat cells
using a luminometer.
46
4.1.2 Materials and Methods
4.1.2.1 Materials
Caspase activity was measured by the Caspase-Glo® assay.
[This involves the peptide-conjugated luminescent substrate Z-DEVD-aminoluciferin, which
was combined to a stable recombinant firefly luciferase, Ultra-Glo™ Luciferase (Promega
Corporation).] 10 μL of either Caspase-Glo® 3/7, 8 or 9 reagent (Promega) was added and
allowed to react.
4.1.3.2 Method
Prior to analysis, Caspase-Glo® Reagents were prepared (see Appendix D) .The reagent was
allowed to equilibrate to RT and thoroughly mixed. 2.0x 10⁴ Jurkat cells re-suspended in
PBS, pre-treated with SF and FB1, and aliquotted into a white luminometer plate. 100μL of
Caspase-Glo® 3/7, 8 or 9 Reagent was added to each well. The plate was gently mixed using
a plate shaker at 300–500rpm for 30 seconds, and incubated at room temperature in the dark
for 30 minutes. Following incubation, the luminescent signal produced by mono-oxygenation
of amino-luciferin was measured with a microplate luminometer (Turner Biosystems,
Sunnyvale, USA), and results expressed as Relative Light Units (RLU).
Statistical Analysis
Statistical significance was determined using One-Way Analysis of Variance (ANOVA) and
the Bonferroni post test on GraphPad Prism v5.0 software (GraphPad Software Inc., La Jolla,
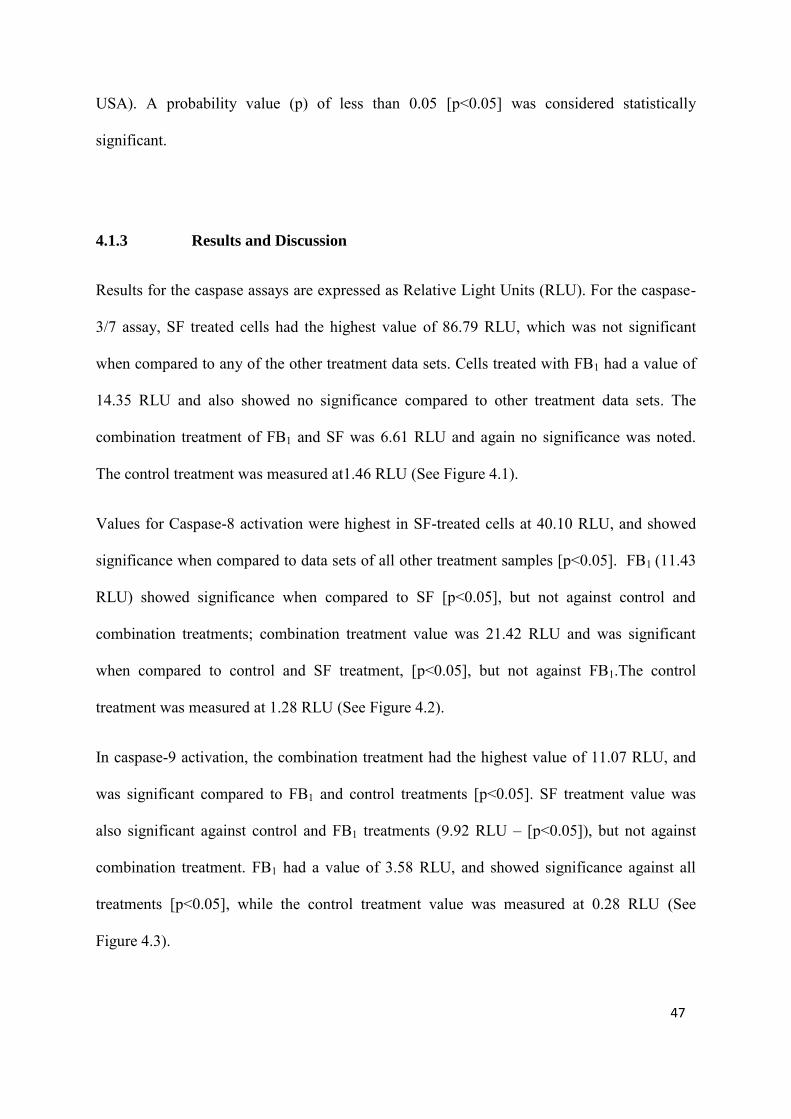
47
USA). A probability value (p) of less than 0.05 [p<0.05] was considered statistically
significant.
4.1.3 Results and Discussion
Results for the caspase assays are expressed as Relative Light Units (RLU). For the caspase-
3/7 assay, SF treated cells had the highest value of 86.79 RLU, which was not significant
when compared to any of the other treatment data sets. Cells treated with FB1 had a value of
14.35 RLU and also showed no significance compared to other treatment data sets. The
combination treatment of FB1 and SF was 6.61 RLU and again no significance was noted.
The control treatment was measured at1.46 RLU (See Figure 4.1).
Values for Caspase-8 activation were highest in SF-treated cells at 40.10 RLU, and showed
significance when compared to data sets of all other treatment samples [p<0.05]. FB1 (11.43
RLU) showed significance when compared to SF [p<0.05], but not against control and
combination treatments; combination treatment value was 21.42 RLU and was significant
when compared to control and SF treatment, [p<0.05], but not against FB1.The control
treatment was measured at 1.28 RLU (See Figure 4.2).
In caspase-9 activation, the combination treatment had the highest value of 11.07 RLU, and
was significant compared to FB1 and control treatments [p<0.05]. SF treatment value was
also significant against control and FB1 treatments (9.92 RLU – [p<0.05]), but not against
combination treatment. FB1 had a value of 3.58 RLU, and showed significance against all
treatments [p<0.05], while the control treatment value was measured at 0.28 RLU (See
Figure 4.3).
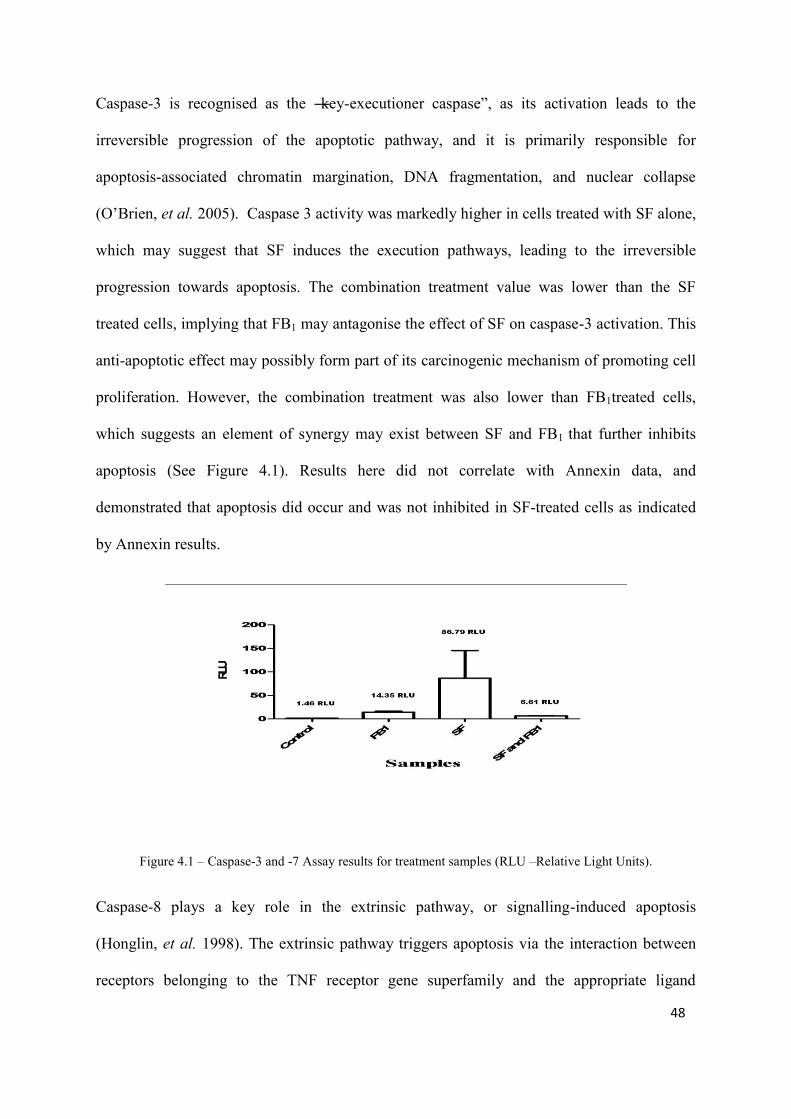
48
Caspase-3 is recognised as the ―key-executioner caspase‖, as its activation leads to the
irreversible progression of the apoptotic pathway, and it is primarily responsible for
apoptosis-associated chromatin margination, DNA fragmentation, and nuclear collapse
(O’Brien, et al. 2005). Caspase 3 activity was markedly higher in cells treated with SF alone,
which may suggest that SF induces the execution pathways, leading to the irreversible
progression towards apoptosis. The combination treatment value was lower than the SF
treated cells, implying that FB1 may antagonise the effect of SF on caspase-3 activation. This
anti-apoptotic effect may possibly form part of its carcinogenic mechanism of promoting cell
proliferation. However, the combination treatment was also lower than FB1treated cells,
which suggests an element of synergy may exist between SF and FB1 that further inhibits
apoptosis (See Figure 4.1). Results here did not correlate with Annexin data, and
demonstrated that apoptosis did occur and was not inhibited in SF-treated cells as indicated
by Annexin results.
Figure 4.1 – Caspase-3 and -7 Assay results for treatment samples (RLU –Relative Light Units).
Caspase-8 plays a key role in the extrinsic pathway, or signalling-induced apoptosis
(Honglin, et al. 1998). The extrinsic pathway triggers apoptosis via the interaction between
receptors belonging to the TNF receptor gene superfamily and the appropriate ligand
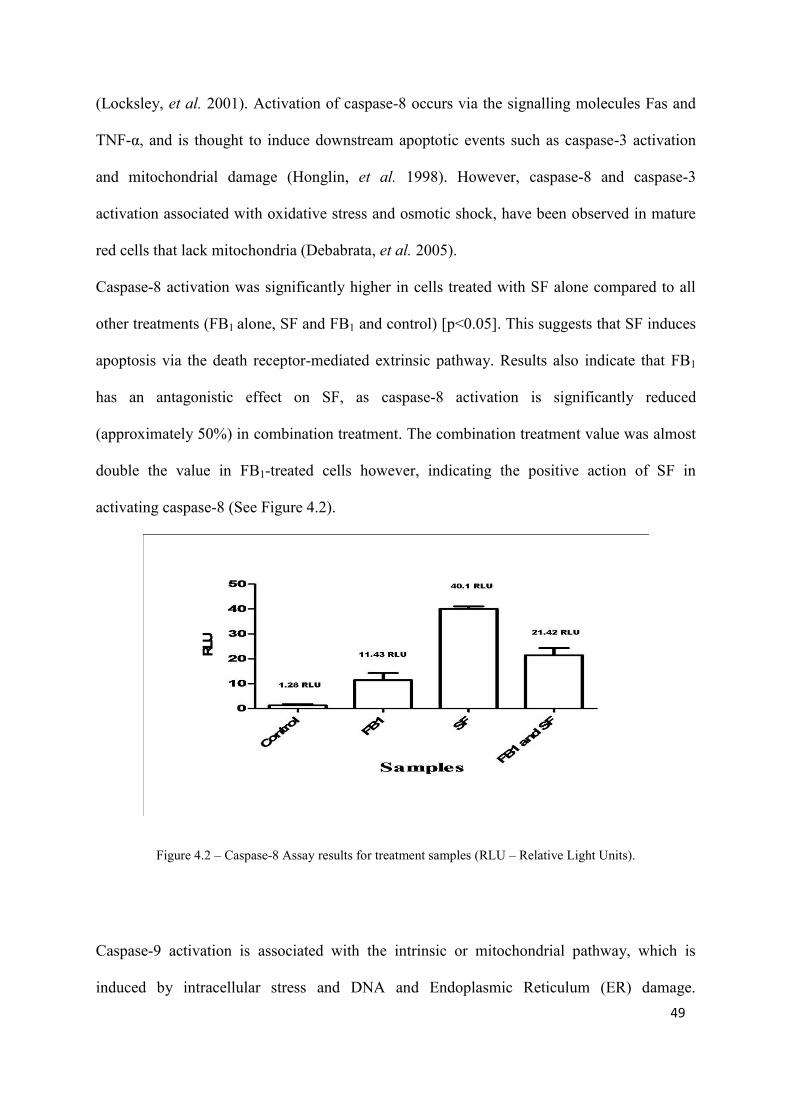
49
(Locksley, et al. 2001). Activation of caspase-8 occurs via the signalling molecules Fas and
TNF-α, and is thought to induce downstream apoptotic events such as caspase-3 activation
and mitochondrial damage (Honglin, et al. 1998). However, caspase-8 and caspase-3
activation associated with oxidative stress and osmotic shock, have been observed in mature
red cells that lack mitochondria (Debabrata, et al. 2005).
Caspase-8 activation was significantly higher in cells treated with SF alone compared to all
other treatments (FB1 alone, SF and FB1 and control) [p<0.05]. This suggests that SF induces
apoptosis via the death receptor-mediated extrinsic pathway. Results also indicate that FB1
has an antagonistic effect on SF, as caspase-8 activation is significantly reduced
(approximately 50%) in combination treatment. The combination treatment value was almost
double the value in FB1-treated cells however, indicating the positive action of SF in
activating caspase-8 (See Figure 4.2).
Figure 4.2 – Caspase-8 Assay results for treatment samples (RLU – Relative Light Units).
Caspase-9 activation is associated with the intrinsic or mitochondrial pathway, which is
induced by intracellular stress and DNA and Endoplasmic Reticulum (ER) damage.
50
Cytochrome c associates with monomeric Apaf-1 upon its release from the mitochondria and
entry into the cytosol and the subsequent conformational change promotes the
oligomerization of Apaf-1, the recruitment of caspase-9, and the formation of the apoptosome
complex. It is within this complex that caspase-9 has been observed to undergo rapid
proteolytic maturation (Hill, et al. 2004).
Although caspase-9 was detected, its activation was not as prevalent when compared to
caspase-3/7 and -8. Activation was higher in combination-treated cells compared to cells
treated with SF alone, indicating that an FB1-induced apoptotic pathway may be attributed to
caspase-9 activation, as it was the only caspase to be synergistically activated by combination
treatment. These results also suggest that the mitochondrial pathway may not be the primary
mechanism involved in SF-induced apoptosis (See Figure 4.3).
Figure 4.3 – Caspase-9 Assay results for treatment samples (RLU – Relative Light Units).
Table 4.1 – Caspase Assay Results
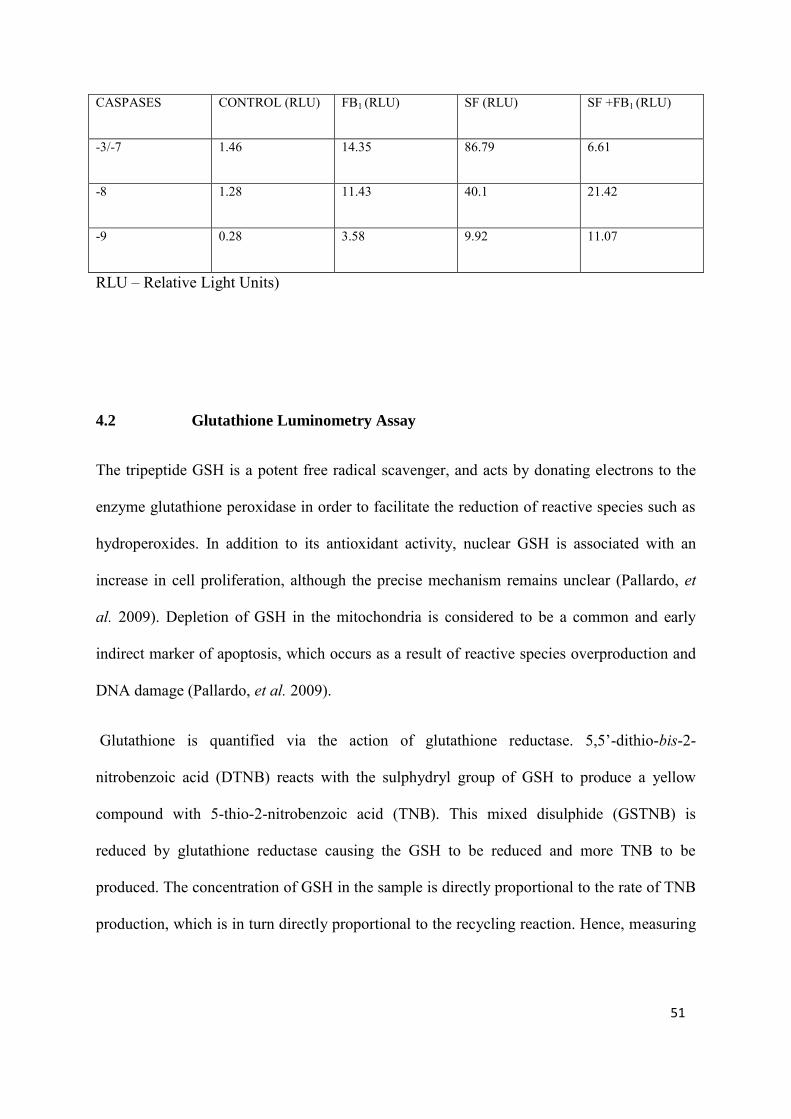
51
CASPASES CONTROL (RLU) FB1 (RLU) SF (RLU) SF +FB1 (RLU)
-3/-7 1.46 14.35 86.79 6.61
-8 1.28 11.43 40.1 21.42
-9 0.28 3.58 9.92 11.07
RLU – Relative Light Units)
4.2 Glutathione Luminometry Assay
The tripeptide GSH is a potent free radical scavenger, and acts by donating electrons to the
enzyme glutathione peroxidase in order to facilitate the reduction of reactive species such as
hydroperoxides. In addition to its antioxidant activity, nuclear GSH is associated with an
increase in cell proliferation, although the precise mechanism remains unclear (Pallardo, et
al. 2009). Depletion of GSH in the mitochondria is considered to be a common and early
indirect marker of apoptosis, which occurs as a result of reactive species overproduction and
DNA damage (Pallardo, et al. 2009).
Glutathione is quantified via the action of glutathione reductase. 5,5’-dithio-bis-2-
nitrobenzoic acid (DTNB) reacts with the sulphydryl group of GSH to produce a yellow
compound with 5-thio-2-nitrobenzoic acid (TNB). This mixed disulphide (GSTNB) is
reduced by glutathione reductase causing the GSH to be reduced and more TNB to be
produced. The concentration of GSH in the sample is directly proportional to the rate of TNB
production, which is in turn directly proportional to the recycling reaction. Hence, measuring
52
the absorbance of TNB gives an accurate estimation of the GSH concentration present in the
sample.
4.2.1 Aims
The aim was to measure the GSH antioxidant response in Jurkat cells treated with FB1 and
SF.
4.2.2 Materials and Methods
4.2.2.1 Materials
The GSH-Glo TM Glutathione Assay was purchased from Promega, (Madison, USA). All
other reagents were purchased from Merck (SA).
4.2.2.2 Method
Standards of GSH (0 μM – 5 μM) were prepared from a 5 mM stock solution, and added to
the wells (50 μL) of the microtitre plate. 2x GSH-Glo TM Reagent was prepared according to
the manufacturer’s instructions, added to each well, (50 μL/well), and incubated at RT for
30min. Reconstituted Luciferin Detection Reagent (100 μL) was added to each well and
incubated for 15min. The luminescence was measured on a Modulus TM microplate
luminometer (Turner Biosystems, Sunnyvale, USA). A standard curve was derived using the
GSH standards and the GSH concentration in each sample was extrapolated from the
equation.
Statistical Analysis
Statistical significance was determined using One-Way Analysis of Variance (ANOVA) and
the Bonferroni post test on GraphPad Prism v5.0 software (GraphPad Software Inc., La Jolla,
53
USA). A probability value (p) of less than 0.05 [p<0.05] was considered statistically
significant.
4.2.3 Results and Discussion
Concentration values for GSH were determined by linear extrapolation from the standard
curve and expressed in µM. Concentrations of GSH were lowest in FB1-treated cells
(0.3µM), and showed significance when compared to the control sample [p<0.05], but not
against other treatments. SF-treated cells had a value of 0.48 µM, which was also significant
when compared to the control treatment [p<0.05], and was slightly higher in value than FB1,
with no statistical significance. The combination treatment had a value of 0.94 µM, and was
significant against the control value, [p<0.05], but not against the other treatments. The
control treatment had a value of 2.79 µM (See Figure 4.4).
Glutathione plays an important role in the mitochondrial antioxidant defence system. The
mitochondria contains its own stock of GSH that controls the level of reactive species within
the cell via the action of GSH-linked enzymes Glutathione peroxidase 1 and 4 (Gpx1 and 4),
which catalyses the reduction of radicals such as hydrogen peroxide (H2O2) (Schreck, et al.
1991). Overproduction of reactive species results in the GSH depletion, which in turn can
affect an array of functions such as protein biosynthesis, immune function, and detoxification
capacity (Ngondi, et al. 2006). Glucose transported into the cell undergoes phosphorylation
to become glucose-6-phosphate (G6P), which is then oxidised in the pentose phosphate
pathway (PPP) to produce NADPH. This is catalysed by the enzyme G6P dehydrogenase
(G6PD). Not only is NADPH a key co-factor in fatty acid, nucleotide and amino acid
biosynthesis; it also has an important role in cellular antioxidant activity, as it is responsible
for the maintenance of GSH in a reduced state, which allows for the prevention of oxidative
damage (Buchakjian and Kornbluth, 2010). Thus, the disruption of G6P oxidation by reactive
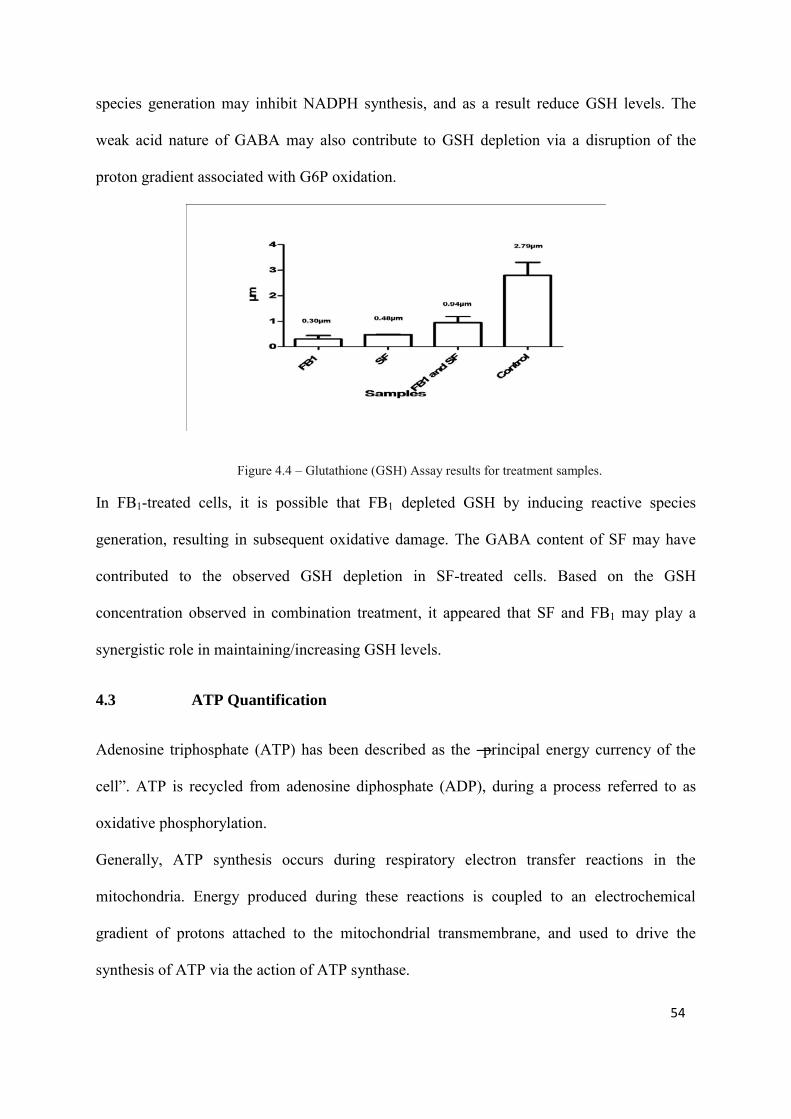
54
species generation may inhibit NADPH synthesis, and as a result reduce GSH levels. The
weak acid nature of GABA may also contribute to GSH depletion via a disruption of the
proton gradient associated with G6P oxidation.
Figure 4.4 – Glutathione (GSH) Assay results for treatment samples.
In FB1-treated cells, it is possible that FB1 depleted GSH by inducing reactive species
generation, resulting in subsequent oxidative damage. The GABA content of SF may have
contributed to the observed GSH depletion in SF-treated cells. Based on the GSH
concentration observed in combination treatment, it appeared that SF and FB1 may play a
synergistic role in maintaining/increasing GSH levels.
4.3 ATP Quantification
Adenosine triphosphate (ATP) has been described as the ―principal energy currency of the
cell‖. ATP is recycled from adenosine diphosphate (ADP), during a process referred to as
oxidative phosphorylation.
Generally, ATP synthesis occurs during respiratory electron transfer reactions in the
mitochondria. Energy produced during these reactions is coupled to an electrochemical
gradient of protons attached to the mitochondrial transmembrane, and used to drive the
synthesis of ATP via the action of ATP synthase.
55
The ATP assay utilizes bioluminescence to quantify the presence of ATP in metabolically
active cells, and hence provides useful information on cell viability or cytotoxicity.
The concentration of ATP is relatively uniform in each cell type, and is used as a marker for
cell viability owing to the fact that its concentration rapidly declines in metabolically active
cells undergoing apoptotic cell death. As a result, proliferation or cytotoxicity is expressed as
a concentration-dependent increase or reduction in the bioluminescent measurement of ATP
in cells subsequent to xenobiotic exposure. The principle of the bioluminescent ATP assay
involves the use of luciferase enzyme, which catalyzes light formation from the reaction
between ATP and the substrate luciferin. The light intensity emitted is directly proportional to
the concentration of ATP present in the cell sample (Crouch, et al 1993).
4.3.1 Aims
The aim was to investigate the metabolic activity of FB1- and SF-treated Jurkat cells by
measuring ATP concentration.
4.3.2 Materials and Methods
4.3.2.1 Materials
The CellTitre-Glo® Assay was purchased from Promega (Madison, USA).
4.3.3.2 Method
The CellTitre-Glo® reagent was prepared (See Appendix D). Approximately 1.0 x 10⁴
cells/well in 50µl of PBS were aliquotted to an opaque polystyrene flat-bottomed 96 well
plate. A blank sample was set up as a negative control, containing only PBS. This was done
to correct background luminescence.
50µL CellTitre-Glo® Reagent was added to each well and the plate was agitated briefly in
order to mix the cell suspension with the assay reagent. The plate was then incubated at RT
56
for 1 h. Following incubation, the plate was agitated again and placed in a GloMax Multi
Detection System. The luminescence from each sample was measured using the CellTitre-
Glo TM assay software.
4.3.3 Results and Discussion
Results for the ATP assay was expressed in Relative Light Units (RLU).
The highest value of 8.17 RLU was observed in SF-treated cells, which was significant when
compared to control, FB1 and combination treatments [p<0.05]. Combination treatment was
4.17 RLU and showed no significance against FB1 alone, but significance when compared to
all other treatments [p<0.05]. FB1 had a value of 2.28 RLU, and showed significance only
against SF-treated cells. The control treatment was measured at 0.22 RLU (See Figure 4.5).
It has been reported that apoptosis is an energy-dependent process; hence it is heavily reliant
on both the presence of ATP and functioning mitochondria. Active nuclear transport is
needed for the transfer of large molecules across the nuclear membrane during Fas-mediated
apoptosis, as death signals are transmitted from the cytoplasm to the nucleus. Additionally, in
Jurkat cells the utilisation of ATP is necessary for nuclear cell fragmentation and chromatin
condensation (Bradbury, et al. 2000).
D-pinitol is an active constituent of SF, and has anti-hyperglycaemic properties. It has been
proposed that D-pinitol exerts this action by interacting with the cellular signalling pathway
linking insulin to glucose transport (Bates, 2000), enabling it to improve glucose metabolism
and increase cellular energy as a result of an increase in oxidative phosphorylation
(Sivkumar, 2009). This action may have contributed to the high ATP found in SF-treated
cells. Sethi, et al. (2008) demonstrated that pinitol was capable of inhibiting NF-κB
activation, an action that was not cell-type specific. This inhibition led to the down-regulation
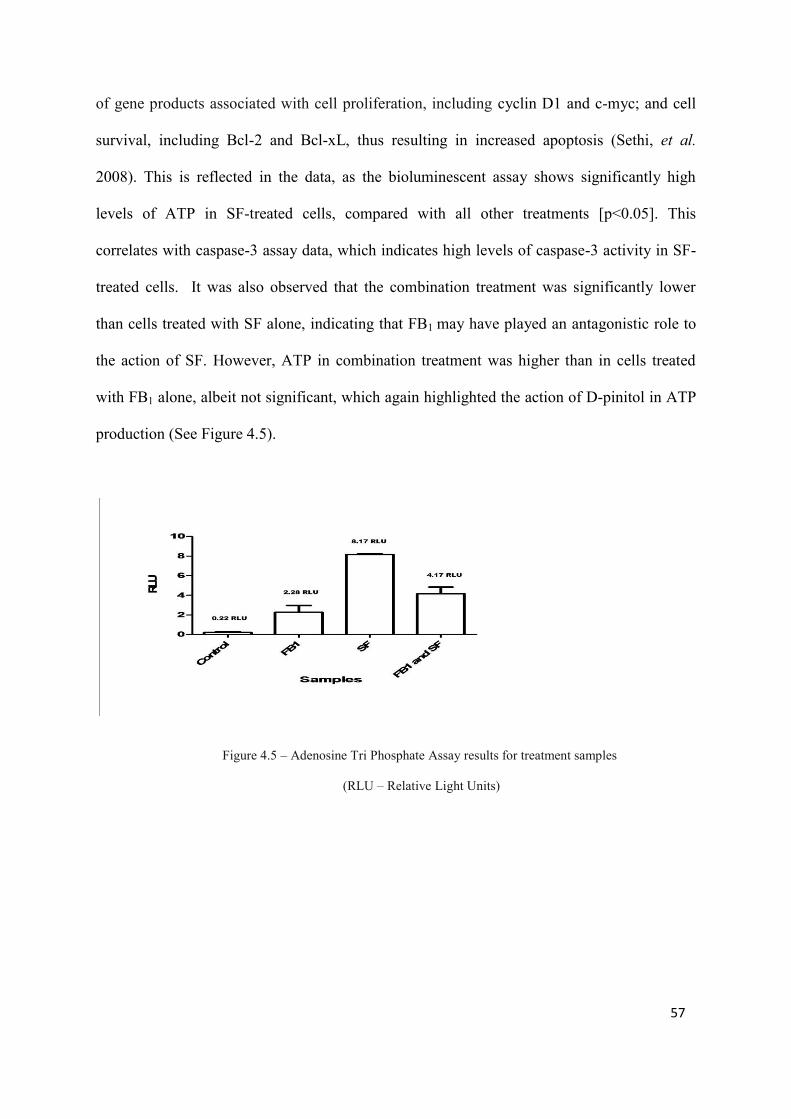
57
of gene products associated with cell proliferation, including cyclin D1 and c-myc; and cell
survival, including Bcl-2 and Bcl-xL, thus resulting in increased apoptosis (Sethi, et al.
2008). This is reflected in the data, as the bioluminescent assay shows significantly high
levels of ATP in SF-treated cells, compared with all other treatments [p<0.05]. This
correlates with caspase-3 assay data, which indicates high levels of caspase-3 activity in SF-
treated cells. It was also observed that the combination treatment was significantly lower
than cells treated with SF alone, indicating that FB1 may have played an antagonistic role to
the action of SF. However, ATP in combination treatment was higher than in cells treated
with FB1 alone, albeit not significant, which again highlighted the action of D-pinitol in ATP
production (See Figure 4.5).
Figure 4.5 – Adenosine Tri Phosphate Assay results for treatment samples
(RLU – Relative Light Units)
58
CHAPTER 5
SPECTROPHOTOMETRIC ANALYSIS OF REACTIVE NITROGEN AND
OXYGEN SPECIES IN FUMONISIN B1 AND SUTHERLANDIA FRUTESCENS
TREATED JURKAT CELLS
5.1 Nitric Oxide Assay
Nitric Oxide (NO) is most commonly known as a reactive nitrogen species that combines
with superoxides to form powerful oxidants that cause cellular damage. However, it can also
scavenge superoxides by forming non-reactive species, thus possessing both cytotoxic and
cytoprotective activity, depending on the concentration levels of NO (Riganti, et al 2003).
The conversion of L-ARG to L-citrulline is dependent on NO, which has also been shown to
regulate apoptosis via S-nitrosylation (Liu, et al. 2010; Iyer, et al. 2008).
Recent evidence indicates that NO activates a complex network of responses leading to
apoptosis via mitochondrial, death receptor, p38/MAPK, and glyceraldehyde-3-phosphate
dehydrogenase (GAPDH)-Siah1 cascades. The transient and volatile nature of NO makes it
unsuitable for most convenient detection methods; however, two stable breakdown products,
nitrate (NO3) and nitrite (NO2) can be easily detected by photometric means.
5.1.1 Aims
The aim was to investigate NO levels in Jurkat cells pre-treated with FB1 and SF, by
measuring NO3 and NO2 products using spectrophotometry.
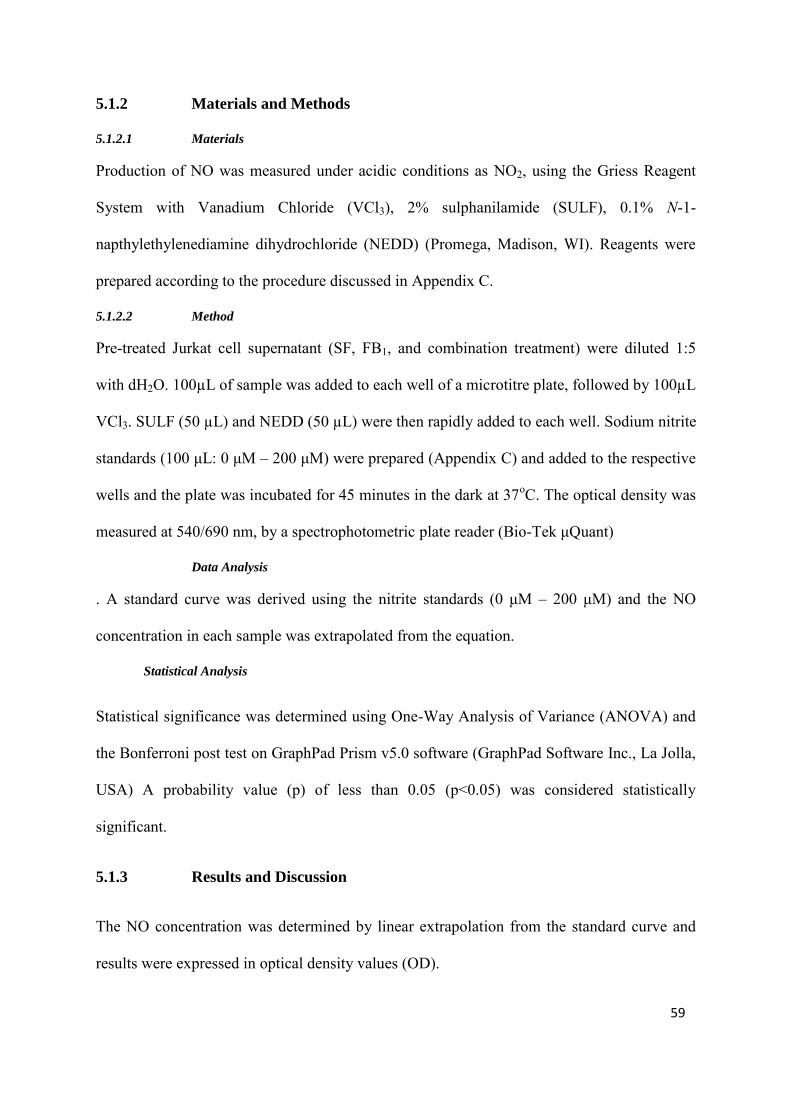
59
5.1.2 Materials and Methods
5.1.2.1 Materials
Production of NO was measured under acidic conditions as NO2, using the Griess Reagent
System with Vanadium Chloride (VCl3), 2% sulphanilamide (SULF), 0.1% N-1-
napthylethylenediamine dihydrochloride (NEDD) (Promega, Madison, WI). Reagents were
prepared according to the procedure discussed in Appendix C.
5.1.2.2 Method
Pre-treated Jurkat cell supernatant (SF, FB1, and combination treatment) were diluted 1:5
with dH2O. 100µL of sample was added to each well of a microtitre plate, followed by 100µL
VCl3. SULF (50 µL) and NEDD (50 µL) were then rapidly added to each well. Sodium nitrite
standards (100 μL: 0 μM – 200 μM) were prepared (Appendix C) and added to the respective
wells and the plate was incubated for 45 minutes in the dark at 37oC. The optical density was
measured at 540/690 nm, by a spectrophotometric plate reader (Bio-Tek μQuant)
Data Analysis
. A standard curve was derived using the nitrite standards (0 μM – 200 μM) and the NO
concentration in each sample was extrapolated from the equation.
Statistical Analysis
Statistical significance was determined using One-Way Analysis of Variance (ANOVA) and
the Bonferroni post test on GraphPad Prism v5.0 software (GraphPad Software Inc., La Jolla,
USA) A probability value (p) of less than 0.05 (p<0.05) was considered statistically
significant.
5.1.3 Results and Discussion
The NO concentration was determined by linear extrapolation from the standard curve and
results were expressed in optical density values (OD).
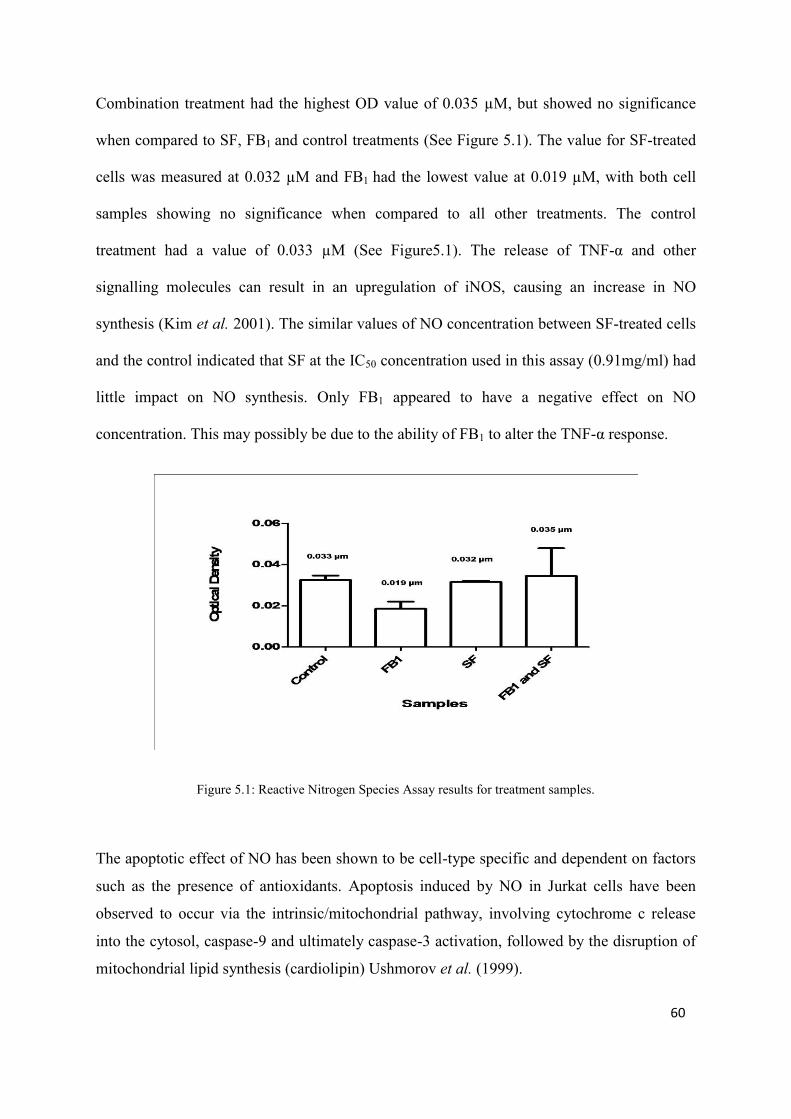
60
Combination treatment had the highest OD value of 0.035 µM, but showed no significance
when compared to SF, FB1 and control treatments (See Figure 5.1). The value for SF-treated
cells was measured at 0.032 µM and FB1 had the lowest value at 0.019 µM, with both cell
samples showing no significance when compared to all other treatments. The control
treatment had a value of 0.033 µM (See Figure5.1). The release of TNF-α and other
signalling molecules can result in an upregulation of iNOS, causing an increase in NO
synthesis (Kim et al. 2001). The similar values of NO concentration between SF-treated cells
and the control indicated that SF at the IC50 concentration used in this assay (0.91mg/ml) had
little impact on NO synthesis. Only FB1 appeared to have a negative effect on NO
concentration. This may possibly be due to the ability of FB1 to alter the TNF-α response.
Figure 5.1: Reactive Nitrogen Species Assay results for treatment samples.
The apoptotic effect of NO has been shown to be cell-type specific and dependent on factors
such as the presence of antioxidants. Apoptosis induced by NO in Jurkat cells have been
observed to occur via the intrinsic/mitochondrial pathway, involving cytochrome c release
into the cytosol, caspase-9 and ultimately caspase-3 activation, followed by the disruption of
mitochondrial lipid synthesis (cardiolipin) Ushmorov et al. (1999).
61
Based on caspase-9 assay data, the mitochondrial pathway did not appear to be the key
apoptotic pathway in SF-treated cells; therefore NO may not have played a significant role in
SF- induced apoptosis, but may have still contributed to the observed caspase-9 activation.
5.2 Thiobarbituric Acid Reactive Substances (TBARS)
Malondialdehyde (MDA), a by-product of lipid peroxidation, is a highly reactive aldehyde
capable of covalently bonding to protein, DNA and phospholipids, resulting in their
inactivation (Houglum, et al. 1990). Several other reactive aldehydes and lipid peroxides are
produced during lipid peroxidation, and the thiobarbituric acid-reactive substance TBARS
assay is utilized to quantify these reactive substances within the tested sample. The basic
principle of the assay involves the binding of reactive aldehydes and other substances to
thiobarbituric acid to form a 1:2 adduct, which can be measured by spectrophotometry
(Meagher, et al. 2000).
5.2.1 Aims
The aim was to investigate the levels of lipid peroxidation in FB1 and SF-treated Jurkat cells.
5.2.2 Materials and Methods
5.2.2.1 Materials
Oxidative damage occurring in Jurkat cells was assessed using the TBARS assay.
5.2.2.2 Methods
Jurkat cells were centrifuged (240C; 400g; 10 min) and 500 μL of the supernatant was
dispensed into glass tubes. A positive control of 1% MDA was prepared, as well as a blank
negative control. To each glass tube, 200 μL of 7% H2PO3 was added, followed by 400 μL of
62
thiobarbituric acid (1%, w/v)/ 0.1 mM butylated hydroxytoluene solution. To the negative
control, 400 μL of 3 mM HCl was added. The solution was adjusted to pH 1.5 and placed in a
water bath at 1000 C for 15 min. The samples were allowed to cool to RT, and 1500 μL of
butanol was added to each tube. 500 μL of each sample was transferred to eppendorf tubes
and centrifuged (240C 400 g, 6 min). Following centrifugation, 200 μL of the butanol phase
from each sample (including controls) was aliquotted into a microtitre plate. The optical
density was measured at 532/600 nm, by a spectrophotometric plate reader (Bio-Tek
μQuant).
Statistical Analysis
Statistical significance was determined using One-Way Analysis of Variance (ANOVA) and
the Bonferroni post test on GraphPad Prism v5.0 software (GraphPad Software Inc., La Jolla,
USA) A probability value (p) of less than 0.05 [p<0.05] was considered statistically
significant.
5.2.3 Results and Discussion
The TBARS concentration was expressed in optical density values (OD).
Levels of TBARS in FB1 treated cells had an OD value of 1.95, which was significantly
higher compared to control and SF treated cells [p<0.05]. Combination treatment had a
significantly higher value when compared to treatment with FB1 alone (2.58, [p<0.05]).
There was no significant difference between SF and control treatments (0.252 vs. 0.277) (See
Figure 5.2)
Lipid peroxidation is essentially the cyclic oxidation, or removal of hydrogen atoms from
lipids by a free radical. Reactive species generally contain one or more unpaired electrons
and is therefore sufficiently reactant to extract hydrogen atoms from fatty acid side chains.
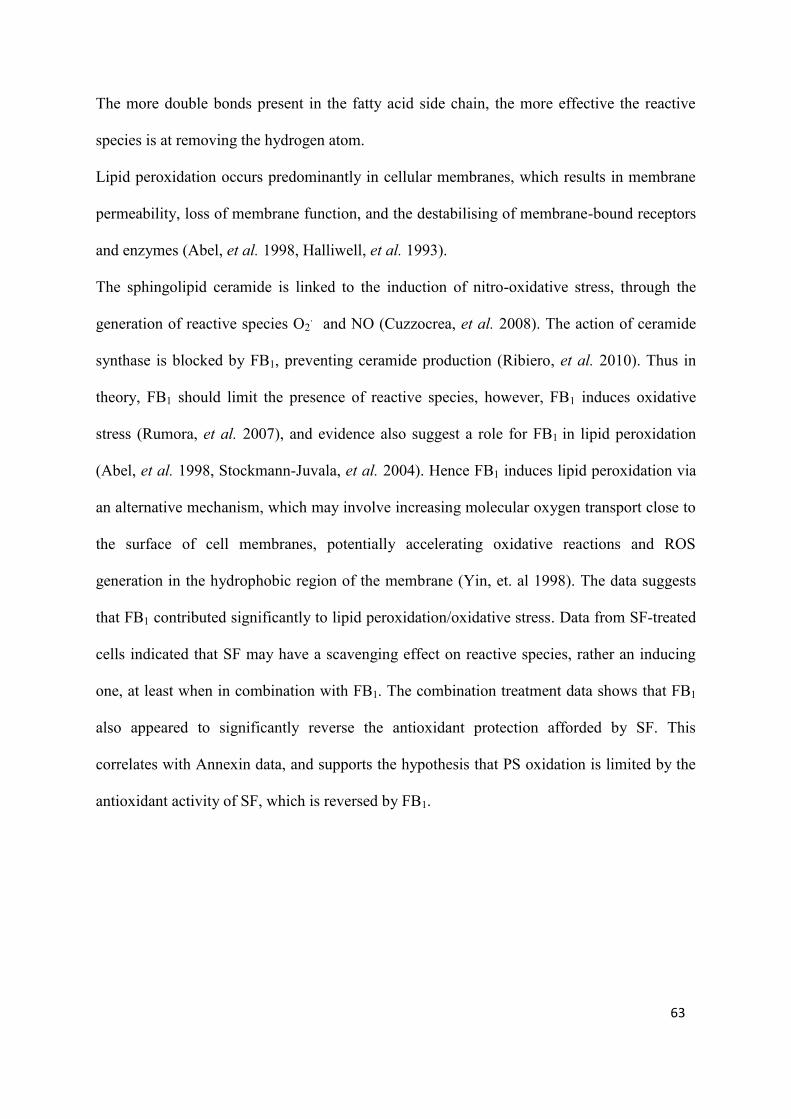
63
The more double bonds present in the fatty acid side chain, the more effective the reactive
species is at removing the hydrogen atom.
Lipid peroxidation occurs predominantly in cellular membranes, which results in membrane
permeability, loss of membrane function, and the destabilising of membrane-bound receptors
and enzymes (Abel, et al. 1998, Halliwell, et al. 1993).
The sphingolipid ceramide is linked to the induction of nitro-oxidative stress, through the
generation of reactive species O2. and NO (Cuzzocrea, et al. 2008). The action of ceramide
synthase is blocked by FB1, preventing ceramide production (Ribiero, et al. 2010). Thus in
theory, FB1 should limit the presence of reactive species, however, FB1 induces oxidative
stress (Rumora, et al. 2007), and evidence also suggest a role for FB1 in lipid peroxidation
(Abel, et al. 1998, Stockmann-Juvala, et al. 2004). Hence FB1 induces lipid peroxidation via
an alternative mechanism, which may involve increasing molecular oxygen transport close to
the surface of cell membranes, potentially accelerating oxidative reactions and ROS
generation in the hydrophobic region of the membrane (Yin, et. al 1998). The data suggests
that FB1 contributed significantly to lipid peroxidation/oxidative stress. Data from SF-treated
cells indicated that SF may have a scavenging effect on reactive species, rather an inducing
one, at least when in combination with FB1. The combination treatment data shows that FB1
also appeared to significantly reverse the antioxidant protection afforded by SF. This
correlates with Annexin data, and supports the hypothesis that PS oxidation is limited by the
antioxidant activity of SF, which is reversed by FB1.
64
Figure 5.2: Thiobutyric acid reactive species (TBARS) assay results for treatment samples.
65
CONCLUSION
Proliferation in Jurkat cells was induced by FB1, which supports existing evidence for its
carcinogenic properties. Proliferation was time-dependent however, and cells became
cytotoxic after 48 h. Cell proliferation may have been stimulated due to the ability of FB1 to
alter sphingolipid metabolism. Further investigation such as sphingoid base quantification via
HPLC analysis would provide more insight into this proposed mechanism. Cytotoxicity may
be a result of FB1-induced reactive species generation.
Mitochondrial depolarization in Jurkat cells is induced by FB1, owing to its generation of
reactive species that react with thiobarbituric acid, although this did not appear to be a main
indicator of apoptosis. An antagonistic relationship existed between FB1 and SF in caspase-
3/7, and -8 activities, but a synergistic one in caspase-9, indicating FB1-induced apoptosis
may occur via the mitochondrial pathway. Apoptosis in Jurkat cells was induced by SF
maybe via the death-receptor mediated extrinsic pathway, as characterized by caspase-8
activity, which correlates with its status as an anti-cancer agent. The depletion of GSH by
FB1 may be enhanced by SF due to the action of weak acid GABA, although further studies
using higher concentrations of SF would need to be conducted in order to confirm this. The
action of D-pinitol may contribute to increasing ATP in SF-treated Jurkat cells, which may
also contribute to apoptotic activity, as apoptosis is an ATP-dependent process. Based on data
from this study, both SF and FB1 appear to antagonize each other in some cases, for example
in apoptotic activity as measured by caspase data; and act synergistically in others as
exemplified by GSH depletion. This can be problematic if both are ingested together, hence
this area of research warrants further investigation into the effects of SF and FB1 on human T-
lymphocytes, as well as other cell lines and in vivo studies.
66
REFERENCES
1. Abel, S., Gelderblom WC. (1998). Oxidative damage and fumonisin B1 -induced
toxicity in primary rat hepatocytes and rat liver in vivo. Toxicology 131, 121-131.
2. Agledal, L., Niere, M., Ziegler, M. (2010). The phosphate makes a difference: cellular
functions of NADP. Redox Report, 15(1); 2-10.
3. Akaogi, J., Barker, T., Kuroda, Y., Nacionales, D., Yamasaki, Y., Stevens, B.,
Reeves, W., and Satoh, M. (2006). Role of non-protein amino acid l-canavanine in
autoimmunity. Autoimmunity Reviews 5(6), 429-435.
4. Astoul, E., Edmunds, C., Cantrell, D.A., Ward, S.G., (2001) PI 3-K and T-cell
activation: limitations of T-leukemic cell lines as signaling models. Trends in
Immunology. 22, 490–496.
5. Barry, M, Bleackley, RC (2002). Cytotoxic T lymphocytes: all roads lead to death.
Nature Reviews Immunology;2:401–9
6. Bates, S.H, Jones, R.B. Bailey, C.J (2000) Insulin-like effect of Pinitol, British
Journal of Pharmacology, 130, 1944-1948
7. Behrens, A, S. M. Wagner, E.F (1999). Amino-terminal phosphorylation of c-Jun
regulates stress induced apoptosis and cell proliferation. Nature Genetics 21, 326-329.
8. Bence, AK, Worthen, DR, Adams VR, Crooks PA, (2002) The antiproliferative and
immunotoxic effects of L-canavanine and L-canaline, Anticancer Drugs.13(3):313-20.
9. Bensaad, K., Tsuruta, A., Selak, M., Vidal, M., Nakano, K., Bartrons, R., Gottlieb, E.,
and Vousden, K. (2006). TIGAR, a p53-Inducible Regulator of Glycolysis and
Apoptosis. Cell 126(1), 107-120.
10. Bernhard, D.S.W., Crazzolara, R. Tinhofer, I. Kofler, R. Csordas, A (2003). Enhanced
MTT-reducing activity under growth inhibition by resveratrol in CEM-C7H2
lymphocytic leukemia cells. Cancer Letters 195, 193-199.
11. Berridge, M.V, T. A. S., McCoy K.D, Wang R (1996). The biochemical and cellular
basis of cell proliferation assays that use tetrazolium salts. Biochemica 4, 14-19.
12. Bhandari, N, R. P., Sharma (2002). Modulation of selected cell signaling genes in
mouse liver by fumonisin B1. Chemico-Biological Interactions 139, 317-331.
13. Bhatnagar, D., Cleveland, TE. Dowd, PF., Desjardins, AE., Cotty, PJ, (2003) United
States Department of Agriculture-Agricultural Research Service research on pre-
harvest prevention of mycotoxins and mycotoxigenic fungi in US crops. Pest
Management Science, 59 (6-7), 629-42
67
14. Bradbury, D.A, Simmons T.D, Slater, K.J, Crouch, S.P.M (2000) Measurement of the
ADP:ATP ratio in human leukaemic cell lines can be used as an indicator of cell
viability, necrosis and apoptosis. Journal of Immunological Methods 240, 79–92
15. Brand, MD. Chappell, JB (1973). Permeability of mitochondria from rat liver and rat
brain to GABA. Journal of Neurochemistry. 22:47–51
16. Buchakjian, M. R., and Kornbluth, S. (2010). The engine driving the ship: metabolic
steering of cell proliferation and death. Nature Reviews Molecular Cell Biology
11(10), 715-727.
17. Carretta, M., Alarcon, P., Jara, E., Solis, L., Hancke, J., Concha, I., Hidalgo, M., and
Burgos, R. (2009). Andrographolide reduces IL-2 production in T-cells by interfering
with NFAT and MAPK activation. European Journal of Pharmacology 602(2-3), 413-
421.
18. Chelule, P.K, G. N., Dutton, M.F. Chuturgoon, AA (2001). Exposure of rural and
urban populations in KwaZulu Natal, South Africa to fumonisin B1 in maize.
Environmental Health Perspectives 109, 253-256.
19. Chinkwo, K. (2005). Sutherlandia frutescens extracts can induce apoptosis in cultured
carcinoma cells. Journal of Ethnopharmacology 98(1-2), 163-170.
20. Choi B, Pae HO, Jang, SI, Kim, YM, Chung, HT (2002). Nitric Oxide as a Pro-
apoptotic as well as Anti-apoptotic Modulator. Journal of Biochemistry and
Molecular Biology 35 (1), 116-126
21. Crimi, M., and Esposti, M. D. (2010). Apoptosis-induced changes in mitochondrial
lipids. Biochimica et Biophysica Acta (BBA) - Molecular Cell Research.
22. Crimi, M.E.M.D. (2010). Apoptosis: induced changes in mitochondrial lipids.
Biochimica et Biophysica Acta xxx, xxx-xxx.
23. Crouch, S, Kozlowski, R. Slater. K. (1993) The use of ATP bioluminescence as a
measure of cell proliferation and cytotoxicity. Journal of Immunological Methods
160:8188
24. Cuzzocrea, S., Di Paola, R., Genovese, T., Mazzon, E., Esposito, E., Crisafulli, C.,
Bramanti, P., and Salvemini, D. (2008). Anti-Inflammatory and Anti-Apoptotic
Effects of Fumonisin B1, an Inhibitor of Ceramide Synthase, in a Rodent Model of
Splanchnic Ischemia and Reperfusion Injury. Journal of Pharmacology and
Experimental Therapeutics 327(1), 45-57.
25. Dawnlinsley, M., Ekinci, F., Ortiz, D., Rogers, E., and Shea, T. (2005). Monitoring
68
thiobarbituric acid-reactive substances (TBARs) as an assay for oxidative damage in
neuronal cultures and central nervous system. Journal of Neuroscience Methods
141(2), 219-222.
26. Debabrata, Mandal. A. M., Pradeep, Das Manikuntala, Kundu, Joyoti, Basu (2005).
Fas-, caspase 8-, and caspase 3-dependent signalling regulates the activity of the
aminophospholipid translocase and phosphatidylserine externalization in human
erythrocytes. Journal of Biological Chemistry 280, 34960-34967.
27. Dragan, Y, B. W., Cohen, S. Goldsworthy, T Hard, G. Howard, P Riley, R. Voss, K.
(2001). Implications of Apoptosis for Toxicity, Carcinogenicity, and Risk
Assessment- Fumonisin B1 as an Example. Society of Toxicology. 61, 6-17.
28. Dugyala, R.R, R. P. Sharma, Tsunoda, M. Riley, R.T (1998). Tumour Necrosis
Factor-α as a Contributor in Fumonisin B1 Toxicity. Journal of Pharmacology and
Experimental Therapeutics 285, 317-324.
29. Dvorak, NJ. Riley, RT Harris, M. McGregor, JA (2008) Fumonisin mycotoxin
contamination of corn-based foods consumed by potentially pregnant women in
southern California. Journal of Reproductive Medicine 53 (9):672-6.
30. Ehrlich, V.D.F. Uhl, M. Steinkellner, H. Zsivkovit, Knasmueller S. (2002). Fumonisin
B1 is genotoxic in human derived hepatoma (HepG2) cells. Mutagenesis 17, 257-260.
31. Elmore, S (2007). Apoptosis: A Review of Programmed Cell Death. Toxicology
Pathology; 35 (4), 495-516
32. Elnekeety, A. Elkholy, W. Abbas, N. Ebaid, A. Amra, H. Abdelwahhab, M. (2007).
Efficacy of royal jelly against the oxidative stress of fumonisin in rats. Toxicon 50(2),
256-269.
33. Fadok, VA. Cathelineau, A. Daleke, DL. Henson, PM. Bratton, D. (2000). Loss of
Phospholipid Asymmetry and Surface Exposure of Phosphatidylserine is required for
Phagocytosis of Apoptotic Cells by Macrophages and Fibroblasts. Journal of
Biological Chemistry; 276, 1071-1077
34. Fadok, V.A.H.P. (2003). Apoptosis: giving phosphatidylserine recognition an assist –
with a twist. Current Biology 13, 655-657.
35. Fan, Z. Beresford, PJ. Oh, D.Y. Zhang, D. Lieberman, J (2003). Tumour suppressor
NM23-H1 is a granzyme Activated DNase during CTL- mediated apoptosis, and the
nucleosome assembly protein SET is its inhibitor. Cell; 112:659–72.
36. Fariss, M.W, Patel, M Van Houten, B. Orrenius, S. (2005). Role of Mitochondria in
69
Toxic Oxidative Stress. Molecular Interventions 5(94-111).
37. Fernandes, A. Cromarty, A. Albrecht, C. and Jansenvanrensburg, C. (2004). The
antioxidant potential of Sutherlandia Frutescens. Journal of Ethnopharmacology
95(1), 1-5.
38. Gelderblom, W.C.A Jaskiewicz K, M. W. F. O., Thiel, P.G. Horak, R.M. Vleggaar, R.
Kriek, N.P.J. (1988). Fumonisins--novel mycotoxins with cancer-promoting activity
produced by Fusarium moniliforme. Applied and Environmental Microbiology 54(7),
1806-1811.
39. Gelderblom, W.C.A, S. E. Marasas, W.F.O. Farber, E (1992). The cancer-initiating
potential of the fumonisin B mycotoxins. Carcinogenesis 13(3), 433-437.
40. Gopee, N. (2003). Fumonisin B1-induced apoptosis is associated with delayed
inhibition of protein kinase C, nuclear factor-κB and tumour necrosis factor α in LLC-
PK1 cells. Chemico-Biological Interactions 146(2), 131-145.
41. Green, D. (1998). Apoptotic Pathways - The Roads to Ruin. Cell 94, 695-698.
42. Greenwood, M. Kreider, R.B. Rasmussen, C. Almada, A.L. Earnest, C.P. (2001). D-
pinitol augments whole body creatine retention in man. Journal of Exercise
Physiology 4, 41–47.
43. Halliwell, B.C.S. (1993). Lipid peroxidation- its mechanism, measurement, and
significance. American Journal of Clinical Nutrition 57, 715-725.
44. Harnett, S. Oosthuizen, V. and Vandeventer, M. (2005). Anti-HIV activities of
organic and aqueous extracts of and. Journal of Ethnopharmacology 96(1-2), 113-119.
45. Hassan, A. M. Mohamed, S. R. El-Nekeety, A. A. Hassan, N. S. Abdel-Wahhab, M.
A. (2010). Aquilegia vulgaris L. extract counteracts oxidative stress and cytotoxicity
of fumonisin in rats. Toxicon 56(1), 8-18.
46. Hill, M.M. Duriez, P.J. Creagh, E.M. Martin, S.J (2004). Analysis of the composition,
assembly kinetics and activity of native Apaf-1 apoptosomes. EMBO Journal 23,
2134-2145.
47. Holman, G.D. Kasuga, M. (1997). From receptor to transporter: insulin signalling to
glucose transport. Diabetologia, 40, 991 -1003
48. Honglin, Li. Chi-jie Xu, Junying Yuan (1998). Cleavage of BID by Caspase 8
Mediates the Mitochondrial Damage in the Fas Pathway of Apoptosis. Cell 94, 491-
501.
49. Houglum, K. Filip, M. Witztum, J.L. Chojkier, M. (1990) Malondialdehyde and 4-
70
Hydroxynonenal Protein Adducts in Plasma and Liver of Rats with Iron Overload.
Journal of Clinical Investigation 86; 1991-1998
50. Huerta, S. Goulet, E. Huertayepez, S. and Livingston, E. (2007). Screening and
Detection of Apoptosis. Journal of Surgical Research 139(1), 143-156.
51. Idriss, H.T. and Naismith, J.H. (2000). TNFα and the TNF receptor superfamily:
structure-function relationship(s). Microscopy Research and Technique. 50, 184–195
52. Iyer, A.K.V. Azad, N. Wang, L. and Rojanasakul, Y. (2008). Role of S-nitrosylation
in apoptosis resistance and carcinogenesis. Nitric Oxide 19(2), 146-151.
53. J.W, A. (2001). Structure, Synthesis, and Biosynthesis of Fumonisin B1 and Related
Compounds. Environmental Health Perspectives 109, 245-249.
54. Jiang, J. Serinkan, BF. Tyurina, YY. Borisenko, GG. Mi, Z. Robbins, PD. Schroit, AJ.
Kagan, V.E. (2003). Peroxidation and Externalization of Phosphatidylserine
Associated with Release of cytochrome c from Mitochondria. Free Radical Biology
and Medicine 35; 7, 814-825
55. Johnson, V. (2003). Increased susceptibility of renal epithelial cells to TNFα-induced
apoptosis following treatment with fumonisin B1. Chemico-Biological Interactions
145(3), 297-309.
56. Jones, D.P (2006). Redefining oxidative stress. Antioxidant Redox Signaling
8:1865_1879.
57. Jones, C. C.-Z. J., Zhang, Y. Henderson, G. Dickman M (2001). Analysis of
fumonisin B1-induced apoptosis. Environmental Health Perspectives 109, 315-320.
58. Karvinen, J. (2002) Homogeneous time-resolved fluorescence quenching assay
(LANCE) for caspase-3. Journal of Biomolecular. Screening. 7, 223–31.
59. Katerere, D.R. Eloff, J.N. (2005). Antibacterial and antioxidant activity of
Sutherlandia frutescens (Fabaceae), a reputed Anti-HIV/AIDS phytomedicine.
Phytotherapy Research 19(9), 779-781.
60. Kiang, J. G. Krishnan, S. Lu, X. Li, Y. (2007). Inhibition of Inducible Nitric-Oxide
Synthase Protects Human T Cells from Hypoxia-Induced Apoptosis. Molecular
Pharmacology 73(3), 738-747.
61. Kim, P. Petrosko, P. Billiar, T. (2001). The regulatory role of nitric oxide in
apoptosis. International Immunopharmacology ,1:1421–1441.
62. Kirkham, P.A. Lam, E. Parkhouse, R.M.E. (2000). Ligation of the WC1 Receptor
Induces T call growth arrest through FB1-sensitive increases in Cellular Ceramide.
71
Journal of Immunology 165, 3564-3570.
63. Kischkel, F.C. Behrmann, I. Germer, M. Pawlita, M. Krammer, P.H, Peter, M.E.
(1995). Cytotoxicity-dependent APO-1 (Fas-CD95)-associated proteins form a death-
inducing signalling complex (DISC) with the receptor. EMBO Journal 14, 5579-5588.
64. Korb, V.C. Chuturgoon, A.A. (2010). Apoptosis-promoting effects of Sutherlandia
frutescens extracts on Normal Human Lymphocytes in Vitro. South African Journal
of Science 106, 64-69.
65. Legrand, O. Perrot, JY. Simonin, G. Baudard, M., Marie, JP. (2001) JC-1: a very
sensitive fluorescent probe to test Pgp activity in adult acute myeloid leukemia. Blood
97, 502-508
66. Levy, B. (2004). Comparative effects of vasopressin, norepinephrine, and L-
canavanine, a selective inhibitor of inducible nitric oxide synthase, in endotoxic
shock. AJP: Heart and Circulatory Physiology 287(1), H209-H215.
67. Li, C. Hanigan, C.L. Hofseth, L.J. Trudel, L.J. Harris, C.C. Wogan, G.N. (2004).
Apoptotic signalling pathways induced by nitric oxide in human lymphoblastoid cells
expressing wild-type or mutant p53. Cancer Research 64, 3022-3029.
68. Liu, B. (2002). The Effects of Mycotoxins, Fumonisin B1 and Aflatoxin B1, on
Primary Swine Alveolar Macrophages. Toxicology and Applied Pharmacology
180(3), 197-204.
69. Liu, M. H. J. Huang, L. Huang, X. Heibeck, HT. Zhao, R. Pasa-Tolic, L. Smith, R.
Kai Fu, Y. Zhang, Z. Hinrichs, S. Ding, S. (2010). Site-Specific Proteomics Approach
for Study Protein S-Nitrosylation. Analytical Chemistry.
70. Liu, Y.P. Kimura, H. Schubert, D. (1997). Mechanism of Cellular 3- (4,5-
Dimethylthiazol-2-yl) -2,5-Diphenyltetrazolium Bromide (MTT) Reduction. Journal
of Neurochemistry 69 581 —593.
71. Locksley, R.M. Lenardo, M.J. (2001). The TNF and TNF Receptor Superfamilies-
Integrating Mammalian Biology. Cell 104, 487-501.
72. Luongo, D. Severino, L. Bergamo, P. De Luna, R. Lucisano, A. Rossi, M. (2006)
Interactive effects of Fumonisin B1 and α zearalenol on proliferation and cytokine
expression in Jurkat T cells, Toxicology in Vitro 20, 1403-1410
73. Maenetje, P. W. de Villiers, N. Dutton, M. F. (2008). The Use of Isolated Human
Lymphocytes in Mycotoxin Cytotoxicity Testing. International Journal of Molecular
Sciences 9(8), 1515-1526.
72
74. Mander, M. Ntuli, L. Diederichs, N. Mavundla, K. (2007) Economics of the
Traditional Medicine Trade in South Africa – Chapter 13. South African Health
Review, Health Systems Trust.
75. Martinvalet, D. Zhu, P. Lieberman, J. (2005). Granzyme A Induces Caspase-
Independent Mitochondrial Damage, a Required First Step for Apoptosis. Immunity
22(3), 355-370.
76. Massimo, Crimi. (2010). Apoptosis-induced changes in mitochondrial lipids.
Biochimica et Biophysica Acta.
77. Meagher, EA, Fitzgerald, GA. (2000) Indices of Lipid Peroxidation in vivo: strengths
and limitations. Free Radical Biological Medicine; 28:1745–50.
78. Mills, E., Cooper, C. Seely, D. (2005). African herbal medicines in the treatment of
HIV: Hypoxis and Sutherlandia. An overview of evidence and pharmacology.
Nutrition Journal 4(1), 19.
79. Neff, N. Reddy, T. Cell Growth Protocol for Jurkat Cell Line; Hudson Alpha/Caltech
ENDCODE group; August 27th 2008
80. Ngondi, J. L. Oben, J. Etame, L. H. Forkah, D. M. and Mbanya, D. (2006). The effect
of different combination therapies on oxidative stress markers in HIV infected
patients in Cameroon. AIDS Research Therapy 3(1), 19.
81. O’Brien, M.A. et al. (2005) Homogeneous, bioluminescent protease assays: caspase-3 as a model. J. Biomolecular. Screening. 10, 137–48.
82. O, C. (2002). Sphingosine in apoptosis signaling. Biochimica et Biophysica Acta
1585, 153– 162.
83. Odhav, B. Adam, J.K. Bhola, K.D. (2008) Modulating effects of fumonisin B1 and
ochratoxin A on leukocytes and messenger cytokines of the human immune system,
International Immunopharmacology, 8, 799-809
84. Ojewole, J. A. O. (2008). Anticonvulsant property of Sutherlandia frutescens R. BR.
(variety Incana E. MEY.) [Fabaceae] shoot aqueous extract. Brain Research Bulletin
75(1), 126-132.
85. Ormerod, M.G (2000). Flow Cytometry: A Practical. 3rd ed. Oxford: Oxford
University Press 1-27, 240,243
86. Ott, M. Gogvadze, V. Orrenius, S. Zhivotovsky, B. (2007). Mitochondria, oxidative
stress and cell death. Apoptosis 12(5), 913-922.
87. Ott, M. Gogvadze, V. Orrenius, S. Zhivotovsky, B. (2007). Mitochondria, oxidative
73
stress and cell death. Apoptosis 12(5), 913-922.
88. Packer, L. Cadenas, E. (2007). Oxidants and antioxidants revisited. New concepts of
oxidative stress. Free Radical Research 41(9), 951-952.
89. Paila, Y. D. Ganguly, S. Chattopadhyay, A. (2010). Metabolic Depletion of
Sphingolipids Impairs Ligand Binding and Signaling of Human Serotonin1A
Receptors. Biochemistry 49(11), 2389-2397.
90. Pallardo, F.V. Markovic, J. Garcia, JL. Vina, J. (2009). Role of Nuclear Glutathione
as a key regulator of Cell Proliferation. Molecular Aspects of Medicine. 30; 77-85
91. Peng, L. Wang, B. Ren, P. (2005). Reduction of MTT by flavonoids in the absence of
cells. Colloids and Surfaces B: Biointerfaces 45(2), 108-111.
92. Peng, L. Wang, B. and Ren, P. (2005). Reduction of MTT by flavonoids in the
absence of cells. Colloids and Surfaces B: Biointerfaces 45(2), 108-111.
93. Peter, Kim. Patricia, Petrosko. Timothy, Billiar. (2001). The regulatory role of nitric
oxide in apoptosis. International Immunopharmacology 1, 1421–1441.
94. Proskuryakov, S. (2003). Necrosis: a specific form of programmed cell death?
Experimental Cell Research 283(1), 1-16.
95. Puga, I. (2005). A Polymorphism in the 3' Untranslated Region of the Gene for
Tumour Necrosis Factor Receptor 2 Modulates Reporter Gene Expression.
Endocrinology 146(5), 2210-2220.
96. Rahman, M. Pumphrey, JG. Lipkowitz, S. (2009) The TRAIL to Targeted Therapy of
Breast Cancer. Advanced Cancer Research 103; 43-73
97. Rastogi, R.P. Sinha, R.P. (2009). Apoptosis - Molecular Mechanisms and
Pathogenicity. EXCLI Journal 8, 155-181.
98. Ribeiro, D. H. B. Ferreira, F. L. da Silva, V. N. Aquino, S. Corrêa, B. (2010). Effects
of Aflatoxin B1 and Fumonisin B1 on the Viability and Induction of Apoptosis in Rat
Primary Hepatocytes. International Journal of Molecular Sciences 11(4), 1944-1955.
99. Riganti, C. Aldieri E, Bergandi, L. Miraglia, E. Costamagna, C. Bosia, A. Ghigo, D.
(2003). Nitroarginine methyl ester and canavanine lower intracellular reduced
glutathione. Free Radical Biology and Medicine 35(10), 1210-1216.
100. Rumora, L. Domijan, A. Grubisic, T. and Peraica, M. (2007). Mycotoxin
fumonisin B1 alters cellular redox balance and signalling pathways in rat liver and
kidney. Toxicology 242(1-3), 31-38.
74
101. Rumora, L. Kovacic, S. Rozgaj, R. Cepelak, I. Pepeljnjak, S. Grubisic, T.Z.
(2002) Cytotoxic and genotoxic effects of fumonisin B1 on rabbit kidney RK13 cell
line. Archives of Toxicology. 76, 55–61.
102. Salvioli, S. Ardizzoni, A. Franceschi, C. Cossarizza, A. (1997) JC-1, but not
DiOC6(3) or rhodamine 123, is a reliable fluorescent probe to assess ∆Ψ changes in
intact cells: implications for studies on mitochondrial functionality during apoptosis.
Federation of European Biochemical Sciences 411, 77-82
103. Schimmer, A.D. (2004). Inhibitor of apoptosis proteins: translating basic
knowledge into clinical practice. Cancer Research; 64: 7183–7190.
104. Schreck, R. Baeuerle, P.A (1991). Reactive oxygen intermediates as
apparently widely used messengers in the activation of the NF-kappa B transcription
factor and HIV-1. EMBO Journal 10, 2247-2258.
105. Schroeder, J.J. Xias, J. Liotta, D.C. Merrill, A.H. (1994). Disruption of
Sphingolipid Metabolism and Stimulation of DNA synthesis by FB1. The Journal of
Biological Chemistry 269, 3475-3481.
106. Schwerdt, G. Königs, M. Holzinger, H. Humpf, H. U. and Gekle, M. (2009).
Effects of the mycotoxin fumonisin B1on cell death in human kidney cells and human
lung fibroblasts in primary culture. Journal of Applied Toxicology 29(2), 174-182.
107. Scorrano, L. (2003). BAX and BAK Regulation of Endoplasmic Reticulum
Ca2+: A Control Point for Apoptosis. Science 300(5616), 135-139.
108. Seefelder, W. (2003). Induction of apoptosis in cultured human proximal
tubule cells by fumonisins and fumonisin metabolites. Toxicology and Applied
Pharmacology 192(2), 146-153.
109. Sennepin, A. D. Charpentier, S. Normand, T. Sarré, C. Legrand, A. Mollet, L.
M. (2009). Multiple reprobing of Western blots after inactivation of peroxidase
activity by its substrate, hydrogen peroxide. Analytical Biochemistry 393(1), 129-131.
110. Serinkan, BF. Tyurina, YY. Babu, H. Djukic, M. Quinn, PJ. Schroit, A.
Kagan, V (2004). Vitamin E Inhibits Anti-Fas-Induced Phosphatidylserine Oxidation
but Does Not Affect Its Externalization during Apoptosis in Jurkat T Cells and their
Phagocytosis by J774A.1 Macrophages. Antioxidants and Redox Signalling. 6; 2,
227-236
111. Sethi, G. Seok, Ahn K. Sung, B. (2008). Pinitol targets nuclear factor-κB
activation pathway leading to inhibition of gene products associated with
75
proliferation, apoptosis, invasion and angiogenesis. Molecular Cancer Therapeutics
7:1604-1614
112. Sharma, N. He, Q. and Sharma, R. (2004). Sphingosine kinase activity confers
resistance to apoptosis by fumonisin B in human embryonic kidney (HEK-293) cells.
Chemico-Biological Interactions 151(1), 33-42.
113. Sharma, N. Suzuki, H. He, Q. and Sharma, R.P. (2006). Tumour necrosis
factor α-mediated activation of c-Jun NH2-terminal kinase as a mechanism for
fumonisin B1 induced apoptosis in murine primary hepatocytes. Journal of
Biochemical and Molecular Toxicology 19(6), 359-367.
114. Sivakumar, S. and Subramanian, S.P. (2009). Pancreatic tissue protective
nature of D-Pinitol studied in streptozotocin-mediated oxidative stress in experimental
diabetic rats. European Journal of Pharmacology 622(1-3), 65-70.
115. Slee, E. A. (2000). Executioner Caspase-3, -6, and -7 Perform Distinct, Non-
redundant Roles during the Demolition Phase of Apoptosis. Journal of Biological
Chemistry 276(10), 7320-7326.
116. Smiley, S.T. Mottola-Hartshorn, C. Lin, M. Chen, A. Smith, T.W. Steele,
G.D. Chen, L.B. (1991). Intracellular heterogeneity in mitochondrial membrane
potentials. Cell Biology 88, 3671-3675.
117. Solomon, JC. Wei, LX. Fujita, T. Shi, Y.F. (2003). A novel role for
sphingolipid intermediates in activation-induced cell death in T cells. Cell Death and
Differentiation 10 193-202.
118. Sternfeld, T. Tischleder, A. Schuster, M. Bogner, J.R. (2009). Mitochondrial
membrane potential and apoptosis of blood mononuclear cells in HIV-1 infected
patients. HIV Medicine; 10: 512-519
119. Stockmann-Juvala, H. (2004). Fumonisin B1-induced toxicity and oxidative
damage in U-118MG glioblastoma cells. Toxicology 202(3), 173-183.
120. Stockmann-Juvala, H. Alenius, H. Savolainen, K. (2008). Effects of fumonisin
B1 on the expression of cytokines and chemokines in human dendritic cells. Food and
Chemical Toxicology 46(5), 1444-1451.
121. Theumer, M. G. Cánepa, M. C. López, A. G. Mary, V.S. Dambolena, J.S.
Rubinstein, H.R. (2010). Subchronic mycotoxicoses in Wistar rats: Assessment of the
in vivo and in vitro genotoxicity induced by fumonisins and aflatoxin B1, and
oxidative stress biomarkers status. Toxicology 268(1-2), 104-110.
76
122. Tice, R.R. Anderson, D. Burlinson, B. Hartmann, A. Kobayashi, H. Miyamae,
Y. Rojas, E. Ryu, J.C. Sasaki, Y.F. (2000). Single cell gel or comet assay- guidelines
for in vitro and in vivo genetic toxicology testing. Environmental and Molecular
Mutagenesis 35, 206-221
123. Trapani, JA. Smyth, M.J. (2002). Functional significance of the
perforin/granzyme cell death pathway. Nature Reviews Immunology; 2:735–47.
124. Ushmorov, A.F.R. Lehmann, V. Dröge, W. Schirrmacher, V. Umansky, V
(1999). Nitric Oxide-Induced Apoptosis in Human Leukemic Lines Requires
Mitochondrial Lipid Degradation and Cytochrome C Release. Blood 93 2342-2352.
125. Vandenabeele, P.D.W. Beyaert, R. Fiers, W (1995). Two tumour necrosis
factor receptors - structure and function. Trends in Cell Biology 5, 392-399.
126. Vanwyk, B. Albrecht, C. (2008). A review of the taxonomy, ethnobotany,
chemistry and pharmacology of Sutherlandia frutescens (Fabaceae). Journal of
Ethnopharmacology 119(3), 620-629.
127. Visconti, A. Boenke, A. Doko, MB. Solfrizzo, M. Pascale, M. (1995)
Occurrence of fumonisins in Europe and the BCR--measurements and testing
projects, Natural Toxins. 1995;3 (4):269-74
128. Ware, C.F. Vanarsdale, T.L. Andrews, J.L. Grayson, M.H. Jerzy, R. Smith,
C.A. Goodwin, R.G. (1991). TNF Receptor Expression in T-Lymphocytes Journal of
Immunology 147, 4229-4238.
129. Wattenberg, F. Badria, F.A. (1996). Activation of Mitogen-Activated Protein
Kinase by the Carcinogenic Mycotoxin Fumonisin B1. Biochemical and Biophysical
Research Communications 227, 622-627.
130. Winrow, V.R. Winyard, P.G. Morris, C.J. Blake, D.R. (1993) Free radicals in
inflammation: second messengers and mediators of tissue destruction. British Medical
Bulletin 49, 506–522.
131. Yang, S. (2003). Transcriptional regulation by the MAP kinase signaling
cascades. Gene 320, 3-21.
132. Yin, J.J. Eppley, R. Page, S.W. Sphon, J.A. (1998). Effects of fumonisin B1
on lipid peroxidation in membranes. Biochimica et Biophysica Acta 134-142.
77
APPENDIX
Appendix A
Preparation of Sutherlandia frutescens (SF) stock solution
Ten 300mg (total mass 3000mg) SF tablets were crushed with a pestle and mortar and
subjected to polar solvent extraction of active ingredients in 22ml of 70% Ethanol for 4 h at
RT. Subsequent to extraction, the particular matter was centrifuged for 10 min at 400g at RT.
The stock solution of SF was calculated as: 3000mg/22mL = 136.36mg/mL
The IC50 value for SF was obtained from literature (Tai, et al. 2004) as a 1/150 dilution of the
stock solution, which was a value of 0.91mg/mL.
This IC50 concentration of SF was used for all further treatments of Jurkat cells.
Appendix B
Caspase-Glo® 3/7, 8 and 9 reagent preparations Caspase-Glo® 3/7 Buffer and lyophilized Caspase-Glo® 3/7 substrate were equilibrated to
RT before use.
Contents of the Caspase-Glo® 3/7 Buffer bottle was emptied into the bottle containing
Caspase-Glo® 3/7 Substrate and mixed until the substrate was thoroughly dissolved to form
the Caspase-Glo® 3/7 Reagent.
The freshly-prepared, reconstituted Caspase-Glo® 3/7 Reagent was stored at 4°C until ready
for use. (N.B – It is not recommended to store freshly-prepared Caspase-Glo® 3/7 Reagent
for longer than three days).
The same procedure was applied to Caspase-Glo® 8 and Caspase-Glo® 9 reagent.
78
CellTitre-Glo® Reagent Preparation The lyophilised CellTitre-Glo® Substrate and CellTitre-Glo® Buffer were equilibrated to
RT. The enzyme substrate mixture was reconstituted by adding the CellTitre-Glo® Buffer to
a vial of CellTitre-Glo® Substrate and gently vortexed.
Appendix C
Nitrites and Nitrates (Reactive Nitrogen Species) Assay reagent preparations
i. VCl3 – 100mg of VCl3 was dissolved in 12.5mL of 1M HCl and filter-sterilised.
Reagent was kept in foil and in the dark at 4oC.
ii. N-1-napthylethylenediamine dihydrochloride (NEDD) (0.1%) – 10mg NEDD was
dissolved in 10mL dH2O
iii. Sulphanilamide (SULF) (2%) – 200mg SULF was dissolved in 10mL of 5% HCl
(3mL 1M HCl, + 15mL dH2O) and stirred on a hot plate. Reagent was kept in foil and
in the dark at 4oC.
iv. Standards – 6.06mg Sodium Nitrite was dissolved in 30mL dH2O and 200µM stock
was made up to 10 standards ranging from 0 - 200µM.


![Abstract - Abdullah Gül University · 2019-10-24 · Abstract π-Conjugated small molecules based on a [1]benzothieno[3,2-b]benzothiophene (BTBT) unit are of great research interest](https://static.fdocument.org/doc/165x107/5f5b124daa14db0c6651c214/abstract-abdullah-gl-2019-10-24-abstract-conjugated-small-molecules-based.jpg)