A novel method for controlled synthesis of nanosize ... · A novel method for controlled synthesis...
18
1 A novel method for controlled synthesis of nanosize hematite (α-Fe 2 O 3 ) thin film on liquid- vapor interface Pawan Kumar 1 , Raj Kumar Singh 2 , Nitin Rawat 3 , Partha Bir Barman, 1 Subhash Chander Katyal 4 , Hwanchol Jang 3 , Heung-No Lee 3* , and Rajesh Kumar 1,3* 1 Jaypee University of Information Technology, Waknaghat, Solan (H.P) -173234, India 2 CSIR-Indian Institute of Petroleum, Dehradun - 248005, India 3 Gwangju Institute of Science and Technology, Gwangju - 500712, Republic of Korea 4 Jaypee Institute of Information Technology, Sector 128, Noida (U.P) - 201304, India * Corresponding author address: E-Mail: [email protected], [email protected], [email protected] Tel.: +91 -1792 -239386 Fax: +91 -1792-245362 Abstract Hematite (α-Fe 2 O 3 ) films having high quality surface morphology have been formed at the liquid-vapor interface using a novel approach. The surface morphology/size of the nanoparticles constituting the film is tuned in a controlled manner. It is observed that the concentration of polyvinyl alcohol (PVA) in the precursor Fe 3+ /Fe 2+ solution, the concentration of ammonia (NH 3 ) vapor, and the annealing temperature are factors influencing the surface morphology/size of nanoparticles. The diameter of the α-Fe 2 O 3 nanoparticles inside the film is controlled to be 2 nm to 15 nm by varying the synthesis conditions, and accordingly, the films have roughness in the 1.34–6.8 nm range. The prepared α-Fe 2 O 3 films are crystalline in nature and exhibit superparamagnetic behavior at room temperature. Keywords: α-Fe 2 O 3 nanoparticles, NH 3 vapor, concentration of PVA, annealing temperature.
Transcript of A novel method for controlled synthesis of nanosize ... · A novel method for controlled synthesis...
1
A novel method for controlled synthesis of nanosize hematite (α-Fe2O3) thin film on liquid-vapor interface
Pawan Kumar1, Raj Kumar Singh2, Nitin Rawat3, Partha Bir Barman,1 Subhash Chander Katyal4, Hwanchol Jang3, Heung-No Lee3*, and Rajesh Kumar1,3*
1Jaypee University of Information Technology, Waknaghat, Solan (H.P) -173234, India 2CSIR-Indian Institute of Petroleum, Dehradun - 248005, India 3Gwangju Institute of Science and Technology, Gwangju - 500712, Republic of Korea 4Jaypee Institute of Information Technology, Sector 128, Noida (U.P) - 201304, India
*Corresponding author address:
E-Mail: [email protected], [email protected], [email protected] Tel.: +91 -1792 -239386 Fax: +91 -1792-245362
Abstract
Hematite (α-Fe2O3) films having high quality surface morphology have been formed at the liquid-vapor interface using a novel approach. The surface morphology/size of the nanoparticles constituting the film is tuned in a controlled manner. It is observed that the concentration of polyvinyl alcohol (PVA) in the precursor Fe3+/Fe2+ solution, the concentration of ammonia (NH3) vapor, and the annealing temperature are factors influencing the surface morphology/size of nanoparticles. The diameter of the α-Fe2O3 nanoparticles inside the film is controlled to be 2 nm to 15 nm by varying the synthesis conditions, and accordingly, the films have roughness in the 1.34–6.8 nm range. The prepared α-Fe2O3 films are crystalline in nature and exhibit superparamagnetic behavior at room temperature.
Keywords: α-Fe2O3 nanoparticles, NH3 vapor, concentration of PVA, annealing temperature.

2
Introduction
Iron oxides attract interest as materials because of their catalytic, magnetic, and semiconducting properties
(Aronniemi et al. 2004; Chandra et al. 2010). The material α-Fe2O3, iron oxide in particular has been suggested for
application as a catalyst (Liu et al. 2007), a magnetic material (Wu et al. 2006), a photo catalyst (Chirita et al. 2009),
an anode in Li-ion batteries (Ryu et al. 2010), in photo electrochemical solar cells (Shinde et al. 2011; Ahmmad et al.
2010), a water splitter (Shen et al. 2012), in non-linear optics (Zhou et al. 2000), and for gas sensors (Gou et al.
2008; Zhang et al. 2011).
For any technological application, the size of the α-Fe2O3 nanoparticles composing a film is an important
factor. The small size of α-Fe2O3 nanoparticles provide a large surface area for adsorption/desorption of the
chemical species in contact with it, thus allowing for good performance of the application device using the film.
Most of the properties such as superparamagnetism (Lindgren et al. 2002; Ramachandran et al. 2007), light
absorption (Mulmudi et al. 2011), Li-ion adsorption (Turkovoć et al. 2011; Jin et al. 2012), optical limiting (Singh et
al. 2008), and gas sensing (Aronniemi et al. 2008) depend upon the size of α-Fe2O3 nanoparticles. The size of α-
Fe2O3 nanoparticles depends upon the synthesis methods (Dong et al. 2012) as well. So far, many methods of
synthesizing α-Fe2O3 films such as chemical vapor deposition (CVD) (Mathur et al. 2006; Ge at al. 2009;
Chatzitheodorou et al. 1986), reactive ion beam sputtering (Birkholz et al. 1992), laser assisted CVD (Sivako et al.
2005), and ultrasonic spray pyrolysis (Cesar et al. 2006; Fu et al. 2003; Jia et al. 2005; Mahapatra et al. 2009; Park et
al. 2009; Miller et al. 2004; Zang et al. 2010; Kay et al.2006; Glasscock et al. 2007; Kim et al. 2011) have been
reported. Also a well known vapor-liquid-solid (VLS) method (Liu et al. 2007; Hwang et al. 2009) has also been
used to synthesize α-Fe2O3 (Kumar et al. 2009). Nevertheless, most of them are not cost effective and lack the
flexibility of formation and transformation of the film on a desired substrate.
Methods employing polymers have also been reported (Morishita et al. 2005; Omi et al. 2001; Liu et al.
2007). These methods combine different polymers, utilizing their emulsion forming tendency and
adsorption/encapsulation property of metal oxide nanoparticles into their dispersed polymeric micro and
nanospheres. In most of the methods, a polymer such as PVA is frequently used in the synthesis of magnetic
nanocomposites as it is a unique, synthetic, nontoxic, biocompatible, water-soluble, and easily available polymer.
Also it has a large number of -OH groups for interaction, which is a strong reason for its utilization.
Here, we present a novel approach for the formation of α-Fe2O3 film using PVA polymer in the precursor
solution. Initially, a PVA composite film was formed on the liquid-vapor interface, which after transferring over a
glass substrate and annealing in a furnace, was converted to an α-Fe2O3 film. In this work, tuning the size of
nanoparticles/surface morphology as well as flexibility of transferring the film that is formed at the liquid-vapor
interface to a desired substrate has been achieved. By changing the synthesis parameters, such as concentration of
NH3 vapor, film annealing temperature, and concentration of PVA, films of different morphologies have been
formed. The method presented here is a comparatively low temperature method for the formation of α-Fe2O3 film.
3
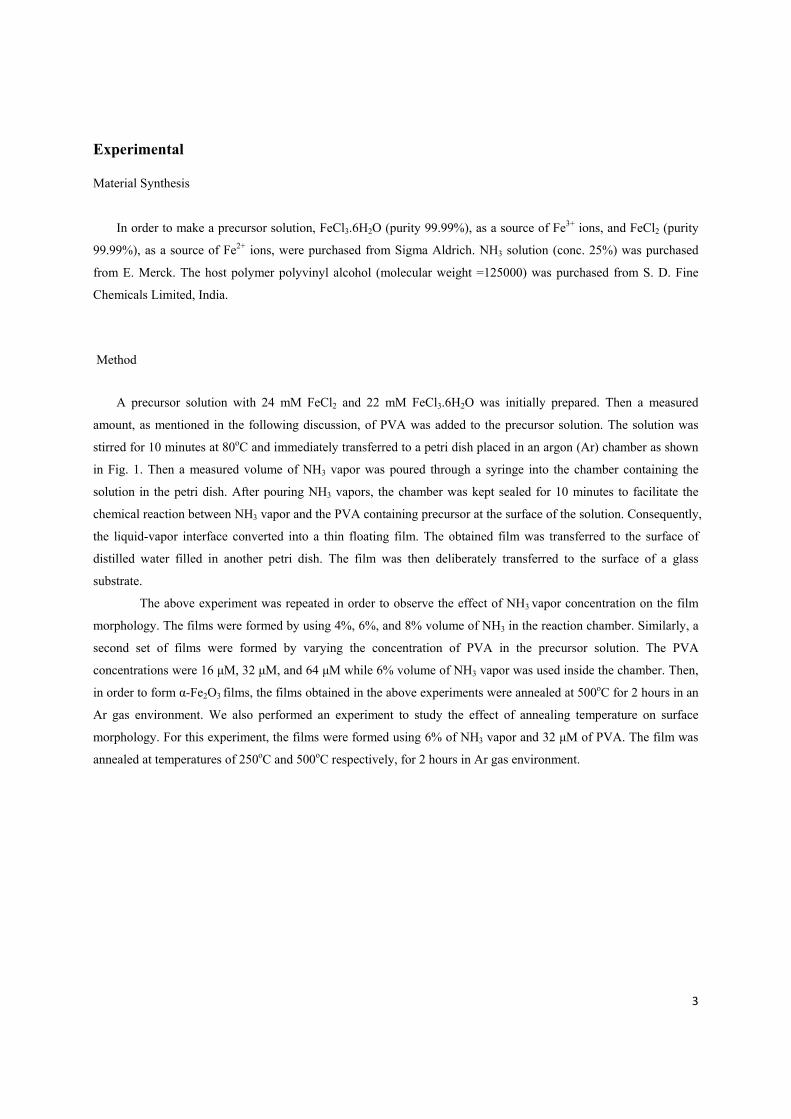
Experimental
Material Synthesis
In order to make a precursor solution, FeCl3.6H2O (purity 99.99%), as a source of Fe3+ ions, and FeCl2 (purity
99.99%), as a source of Fe2+ ions, were purchased from Sigma Aldrich. NH3 solution (conc. 25%) was purchased
from E. Merck. The host polymer polyvinyl alcohol (molecular weight =125000) was purchased from S. D. Fine
Chemicals Limited, India.
Method
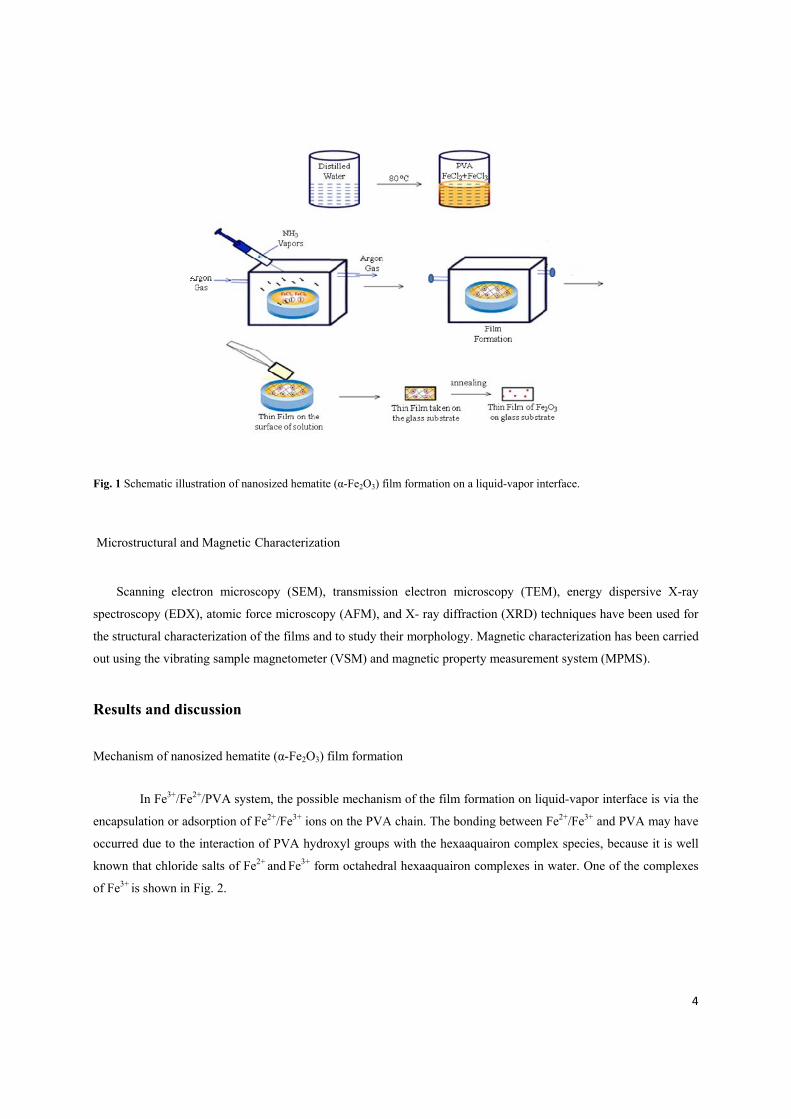
A precursor solution with 24 mM FeCl2 and 22 mM FeCl3.6H2O was initially prepared. Then a measured
amount, as mentioned in the following discussion, of PVA was added to the precursor solution. The solution was
stirred for 10 minutes at 80oC and immediately transferred to a petri dish placed in an argon (Ar) chamber as shown
in Fig. 1. Then a measured volume of NH3 vapor was poured through a syringe into the chamber containing the
solution in the petri dish. After pouring NH3 vapors, the chamber was kept sealed for 10 minutes to facilitate the
chemical reaction between NH3 vapor and the PVA containing precursor at the surface of the solution. Consequently,
the liquid-vapor interface converted into a thin floating film. The obtained film was transferred to the surface of
distilled water filled in another petri dish. The film was then deliberately transferred to the surface of a glass
substrate.
The above experiment was repeated in order to observe the effect of NH3 vapor concentration on the film
morphology. The films were formed by using 4%, 6%, and 8% volume of NH3 in the reaction chamber. Similarly, a
second set of films were formed by varying the concentration of PVA in the precursor solution. The PVA
concentrations were 16 μM, 32 μM, and 64 μM while 6% volume of NH3 vapor was used inside the chamber. Then,
in order to form α-Fe2O3 films, the films obtained in the above experiments were annealed at 500oC for 2 hours in an
Ar gas environment. We also performed an experiment to study the effect of annealing temperature on surface
morphology. For this experiment, the films were formed using 6% of NH3 vapor and 32 μM of PVA. The film was
annealed at temperatures of 250oC and 500oC respectively, for 2 hours in Ar gas environment.
4
Fig. 1 Schematic illustration of nanosized hematite (α-Fe2O3) film formation on a liquid-vapor interface.
Microstructural and Magnetic Characterization
Scanning electron microscopy (SEM), transmission electron microscopy (TEM), energy dispersive X-ray
spectroscopy (EDX), atomic force microscopy (AFM), and X- ray diffraction (XRD) techniques have been used for
the structural characterization of the films and to study their morphology. Magnetic characterization has been carried
out using the vibrating sample magnetometer (VSM) and magnetic property measurement system (MPMS).
Results and discussion
Mechanism of nanosized hematite (α-Fe2O3) film formation
In Fe3+/Fe2+/PVA system, the possible mechanism of the film formation on liquid-vapor interface is via the
encapsulation or adsorption of Fe2+/Fe3+ ions on the PVA chain. The bonding between Fe2+/Fe3+ and PVA may have
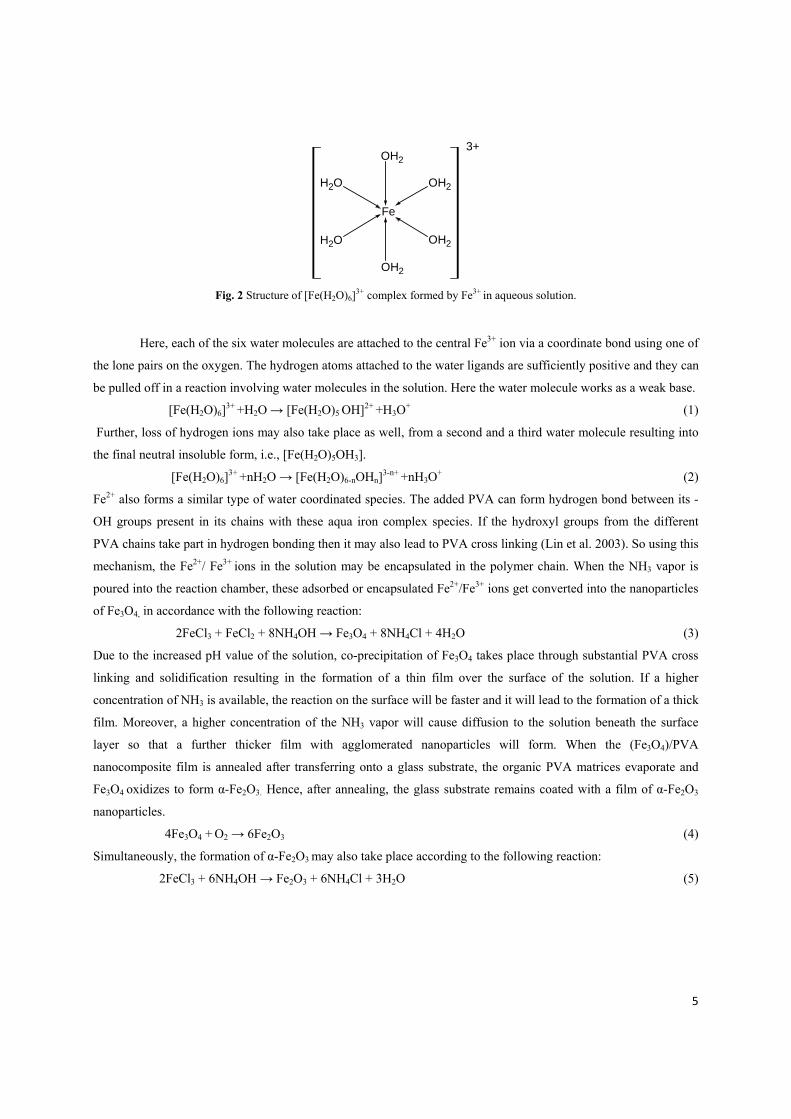
occurred due to the interaction of PVA hydroxyl groups with the hexaaquairon complex species, because it is well
known that chloride salts of Fe2+ and Fe3+ form octahedral hexaaquairon complexes in water. One of the complexes
of Fe3+ is shown in Fig. 2.
5
OH2
OH2
OH2OH2
OH2 OH2
Fe
3+
Fig. 2 Structure of [Fe(H2O)6]
3+ complex formed by Fe3+ in aqueous solution.
Here, each of the six water molecules are attached to the central Fe3+ ion via a coordinate bond using one of
the lone pairs on the oxygen. The hydrogen atoms attached to the water ligands are sufficiently positive and they can
be pulled off in a reaction involving water molecules in the solution. Here the water molecule works as a weak base.
[Fe(H2O)6]3+ +H2O → [Fe(H2O)5 OH]2+ +H3O
+ (1)
Further, loss of hydrogen ions may also take place as well, from a second and a third water molecule resulting into
the final neutral insoluble form, i.e., [Fe(H2O)5OH3].
[Fe(H2O)6]3+ +nH2O → [Fe(H2O)6-nOHn]
3-n+ +nH3O+ (2)
Fe2+ also forms a similar type of water coordinated species. The added PVA can form hydrogen bond between its -
OH groups present in its chains with these aqua iron complex species. If the hydroxyl groups from the different
PVA chains take part in hydrogen bonding then it may also lead to PVA cross linking (Lin et al. 2003). So using this
mechanism, the Fe2+/ Fe3+ ions in the solution may be encapsulated in the polymer chain. When the NH3 vapor is
poured into the reaction chamber, these adsorbed or encapsulated Fe2+/Fe3+ ions get converted into the nanoparticles
of Fe3O4, in accordance with the following reaction:
2FeCl3 + FeCl2 + 8NH4OH → Fe3O4 + 8NH4Cl + 4H2O (3)
Due to the increased pH value of the solution, co-precipitation of Fe3O4 takes place through substantial PVA cross
linking and solidification resulting in the formation of a thin film over the surface of the solution. If a higher
concentration of NH3 is available, the reaction on the surface will be faster and it will lead to the formation of a thick
film. Moreover, a higher concentration of the NH3 vapor will cause diffusion to the solution beneath the surface
layer so that a further thicker film with agglomerated nanoparticles will form. When the (Fe3O4)/PVA
nanocomposite film is annealed after transferring onto a glass substrate, the organic PVA matrices evaporate and
Fe3O4 oxidizes to form α-Fe2O3. Hence, after annealing, the glass substrate remains coated with a film of α-Fe2O3
nanoparticles.
4Fe3O4 + O2 → 6Fe2O3 (4)
Simultaneously, the formation of α-Fe2O3 may also take place according to the following reaction:
2FeCl3 + 6NH4OH → Fe2O3 + 6NH4Cl + 3H2O (5)
6
Effect of NH3 concentration
The precursor solution was exposed successively to three concentrations viz. 4%, 6%, and 8% of NH3
vapors. Then the obtained films after their transfer to the glass substrate were annealed for 2 hours at 500oC in a
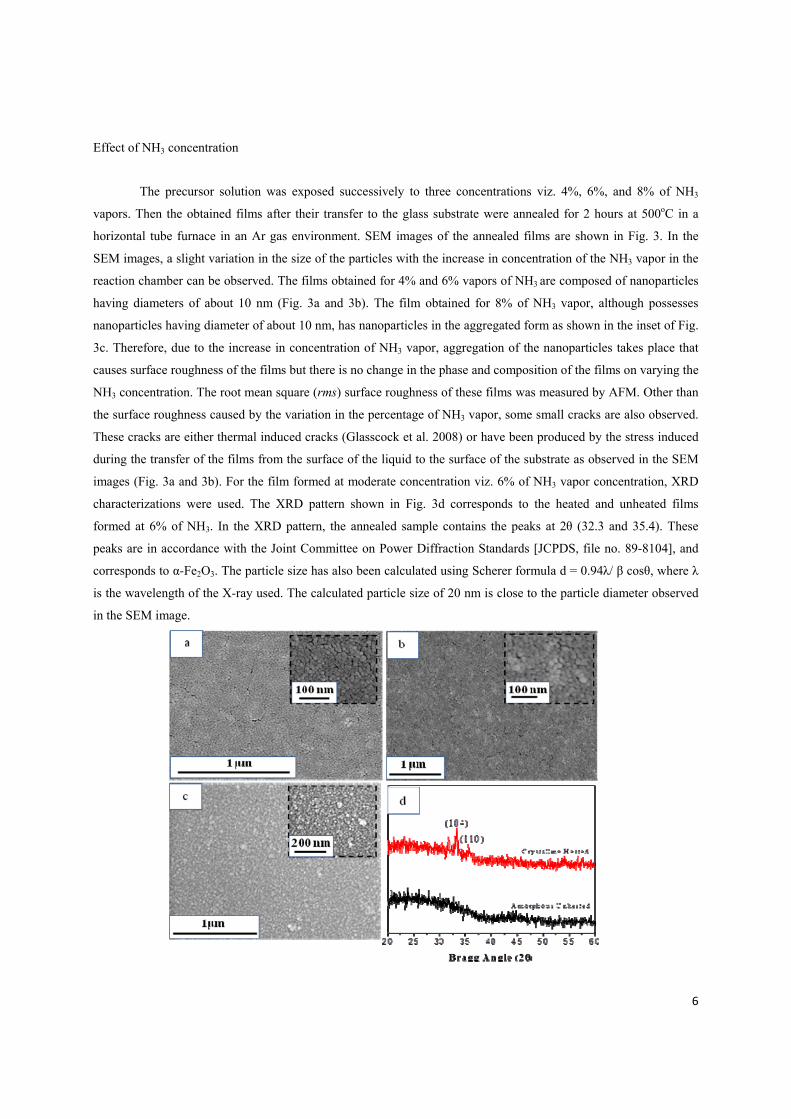
horizontal tube furnace in an Ar gas environment. SEM images of the annealed films are shown in Fig. 3. In the
SEM images, a slight variation in the size of the particles with the increase in concentration of the NH3 vapor in the
reaction chamber can be observed. The films obtained for 4% and 6% vapors of NH3 are composed of nanoparticles
having diameters of about 10 nm (Fig. 3a and 3b). The film obtained for 8% of NH3 vapor, although possesses
nanoparticles having diameter of about 10 nm, has nanoparticles in the aggregated form as shown in the inset of Fig.
3c. Therefore, due to the increase in concentration of NH3 vapor, aggregation of the nanoparticles takes place that
causes surface roughness of the films but there is no change in the phase and composition of the films on varying the
NH3 concentration. The root mean square (rms) surface roughness of these films was measured by AFM. Other than
the surface roughness caused by the variation in the percentage of NH3 vapor, some small cracks are also observed.
These cracks are either thermal induced cracks (Glasscock et al. 2008) or have been produced by the stress induced
during the transfer of the films from the surface of the liquid to the surface of the substrate as observed in the SEM
images (Fig. 3a and 3b). For the film formed at moderate concentration viz. 6% of NH3 vapor concentration, XRD
characterizations were used. The XRD pattern shown in Fig. 3d corresponds to the heated and unheated films
formed at 6% of NH3. In the XRD pattern, the annealed sample contains the peaks at 2θ (32.3 and 35.4). These
peaks are in accordance with the Joint Committee on Power Diffraction Standards [JCPDS, file no. 89-8104], and
corresponds to α-Fe2O3. The particle size has also been calculated using Scherer formula d = 0.94λ/ β cosθ, where λ
is the wavelength of the X-ray used. The calculated particle size of 20 nm is close to the particle diameter observed
in the SEM image.
7
Fig. 3 shows the SEM and XRD pattern of the films. The SEM image for (a) 4% NH3 vapor, (b) 6% NH3 vapor, and (c) 8% NH3 vapor. The XRD pattern of the unheated film and annealed film at 500oC for 2 hours using 32 μM concentration of PVA and 6% NH3 vapor is shown in (d).
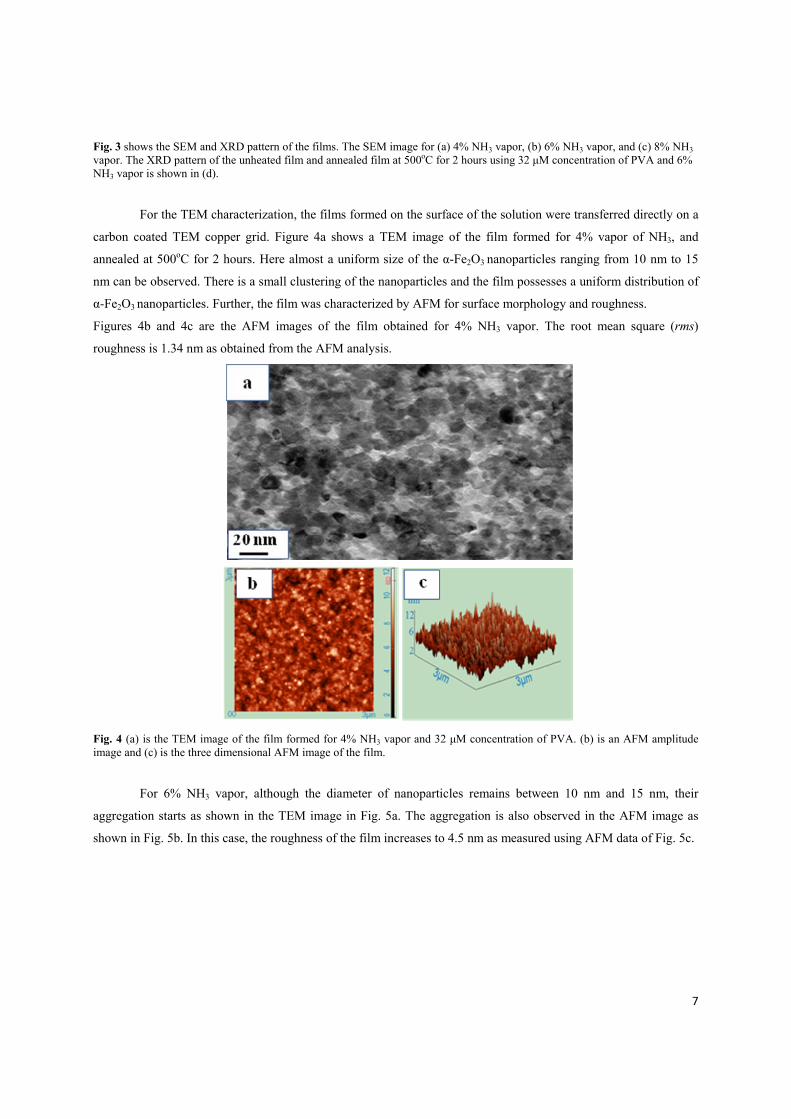
For the TEM characterization, the films formed on the surface of the solution were transferred directly on a
carbon coated TEM copper grid. Figure 4a shows a TEM image of the film formed for 4% vapor of NH3, and
annealed at 500oC for 2 hours. Here almost a uniform size of the α-Fe2O3 nanoparticles ranging from 10 nm to 15
nm can be observed. There is a small clustering of the nanoparticles and the film possesses a uniform distribution of
α-Fe2O3 nanoparticles. Further, the film was characterized by AFM for surface morphology and roughness.
Figures 4b and 4c are the AFM images of the film obtained for 4% NH3 vapor. The root mean square (rms)
roughness is 1.34 nm as obtained from the AFM analysis.
Fig. 4 (a) is the TEM image of the film formed for 4% NH3 vapor and 32 μM concentration of PVA. (b) is an AFM amplitude image and (c) is the three dimensional AFM image of the film.
For 6% NH3 vapor, although the diameter of nanoparticles remains between 10 nm and 15 nm, their
aggregation starts as shown in the TEM image in Fig. 5a. The aggregation is also observed in the AFM image as
shown in Fig. 5b. In this case, the roughness of the film increases to 4.5 nm as measured using AFM data of Fig. 5c.
8
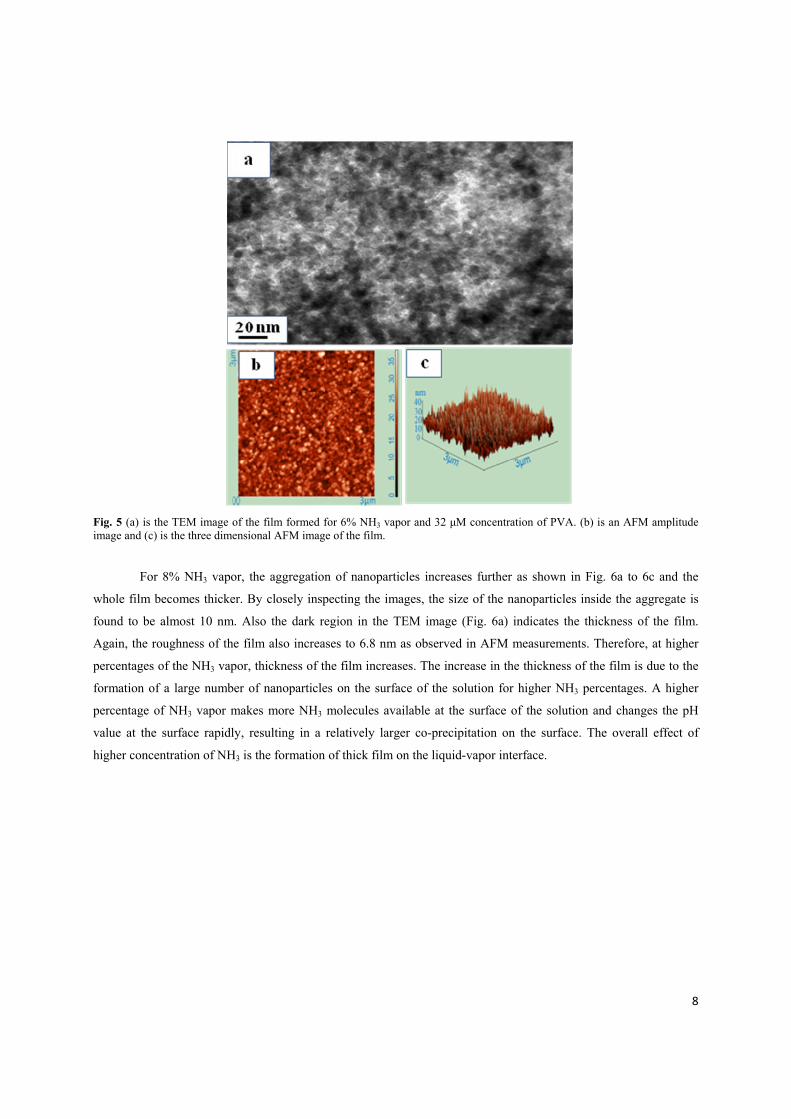
Fig. 5 (a) is the TEM image of the film formed for 6% NH3 vapor and 32 μM concentration of PVA. (b) is an AFM amplitude image and (c) is the three dimensional AFM image of the film.
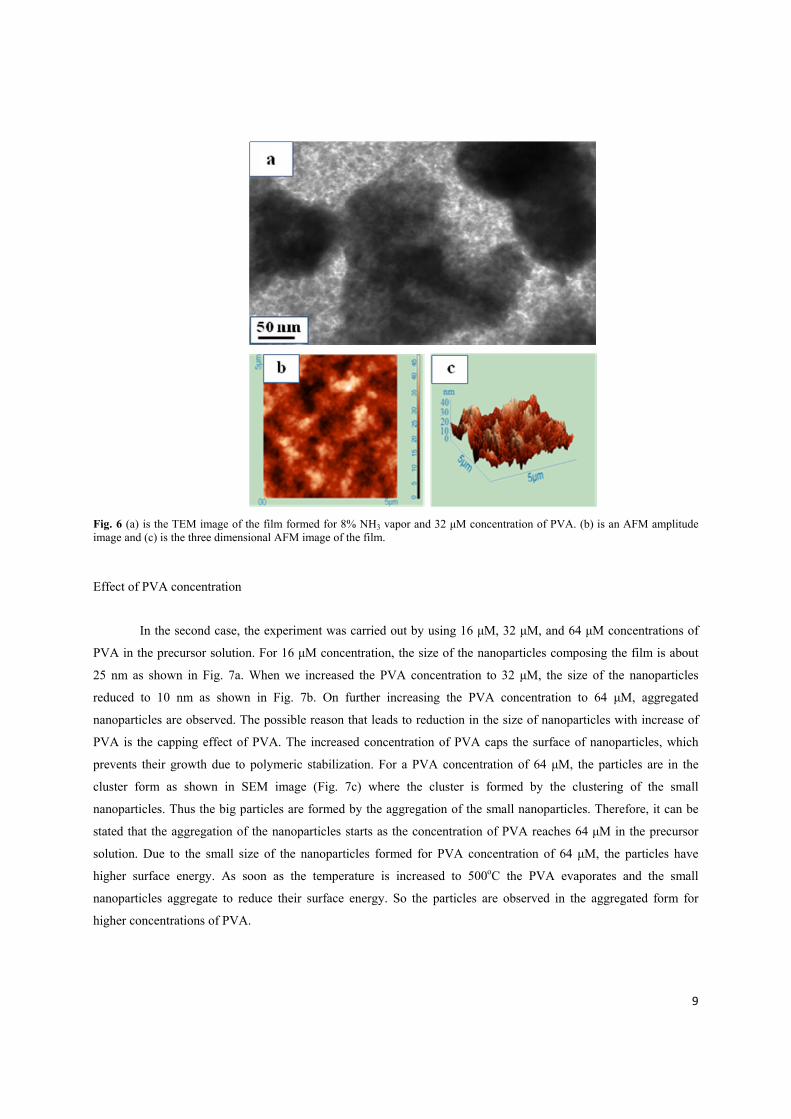
For 8% NH3 vapor, the aggregation of nanoparticles increases further as shown in Fig. 6a to 6c and the
whole film becomes thicker. By closely inspecting the images, the size of the nanoparticles inside the aggregate is
found to be almost 10 nm. Also the dark region in the TEM image (Fig. 6a) indicates the thickness of the film.
Again, the roughness of the film also increases to 6.8 nm as observed in AFM measurements. Therefore, at higher
percentages of the NH3 vapor, thickness of the film increases. The increase in the thickness of the film is due to the
formation of a large number of nanoparticles on the surface of the solution for higher NH3 percentages. A higher
percentage of NH3 vapor makes more NH3 molecules available at the surface of the solution and changes the pH
value at the surface rapidly, resulting in a relatively larger co-precipitation on the surface. The overall effect of
higher concentration of NH3 is the formation of thick film on the liquid-vapor interface.
9
Fig. 6 (a) is the TEM image of the film formed for 8% NH3 vapor and 32 μM concentration of PVA. (b) is an AFM amplitude image and (c) is the three dimensional AFM image of the film.
Effect of PVA concentration
In the second case, the experiment was carried out by using 16 μM, 32 μM, and 64 μM concentrations of
PVA in the precursor solution. For 16 μM concentration, the size of the nanoparticles composing the film is about
25 nm as shown in Fig. 7a. When we increased the PVA concentration to 32 μM, the size of the nanoparticles
reduced to 10 nm as shown in Fig. 7b. On further increasing the PVA concentration to 64 μM, aggregated
nanoparticles are observed. The possible reason that leads to reduction in the size of nanoparticles with increase of
PVA is the capping effect of PVA. The increased concentration of PVA caps the surface of nanoparticles, which
prevents their growth due to polymeric stabilization. For a PVA concentration of 64 μM, the particles are in the
cluster form as shown in SEM image (Fig. 7c) where the cluster is formed by the clustering of the small
nanoparticles. Thus the big particles are formed by the aggregation of the small nanoparticles. Therefore, it can be
stated that the aggregation of the nanoparticles starts as the concentration of PVA reaches 64 μM in the precursor
solution. Due to the small size of the nanoparticles formed for PVA concentration of 64 μM, the particles have
higher surface energy. As soon as the temperature is increased to 500oC the PVA evaporates and the small
nanoparticles aggregate to reduce their surface energy. So the particles are observed in the aggregated form for
higher concentrations of PVA.
10
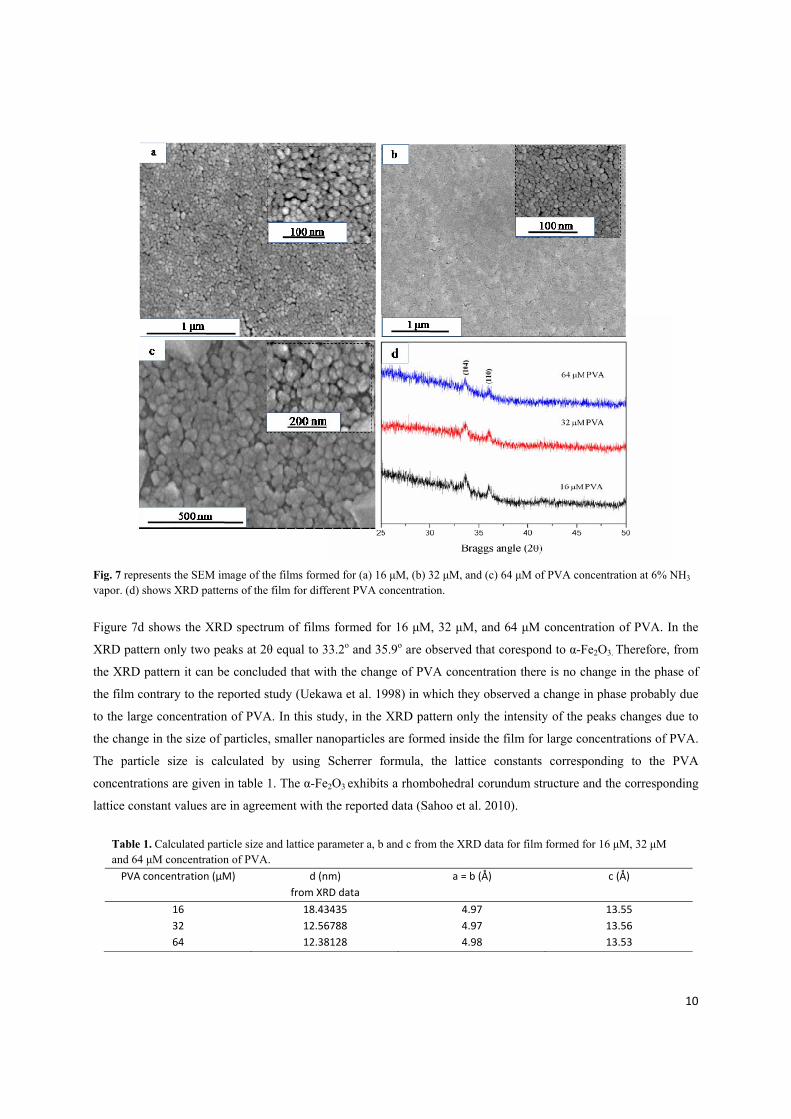
Fig. 7 represents the SEM image of the films formed for (a) 16 μM, (b) 32 μM, and (c) 64 μM of PVA concentration at 6% NH3 vapor. (d) shows XRD patterns of the film for different PVA concentration.
Figure 7d shows the XRD spectrum of films formed for 16 μM, 32 μM, and 64 μM concentration of PVA. In the
XRD pattern only two peaks at 2θ equal to 33.2o and 35.9o are observed that corespond to α-Fe2O3. Therefore, from
the XRD pattern it can be concluded that with the change of PVA concentration there is no change in the phase of
the film contrary to the reported study (Uekawa et al. 1998) in which they observed a change in phase probably due
to the large concentration of PVA. In this study, in the XRD pattern only the intensity of the peaks changes due to
the change in the size of particles, smaller nanoparticles are formed inside the film for large concentrations of PVA.
The particle size is calculated by using Scherrer formula, the lattice constants corresponding to the PVA
concentrations are given in table 1. The α-Fe2O3 exhibits a rhombohedral corundum structure and the corresponding
lattice constant values are in agreement with the reported data (Sahoo et al. 2010).
Table 1. Calculated particle size and lattice parameter a, b and c from the XRD data for film formed for 16 μM, 32 μM and 64 μM concentration of PVA.
PVA concentration (μM) d (nm)
from XRD data
a = b (Å) c (Å)
16 18.43435 4.97 13.55
32 12.56788 4.97 13.56
64 12.38128 4.98 13.53
11
Effect of annealing temperature
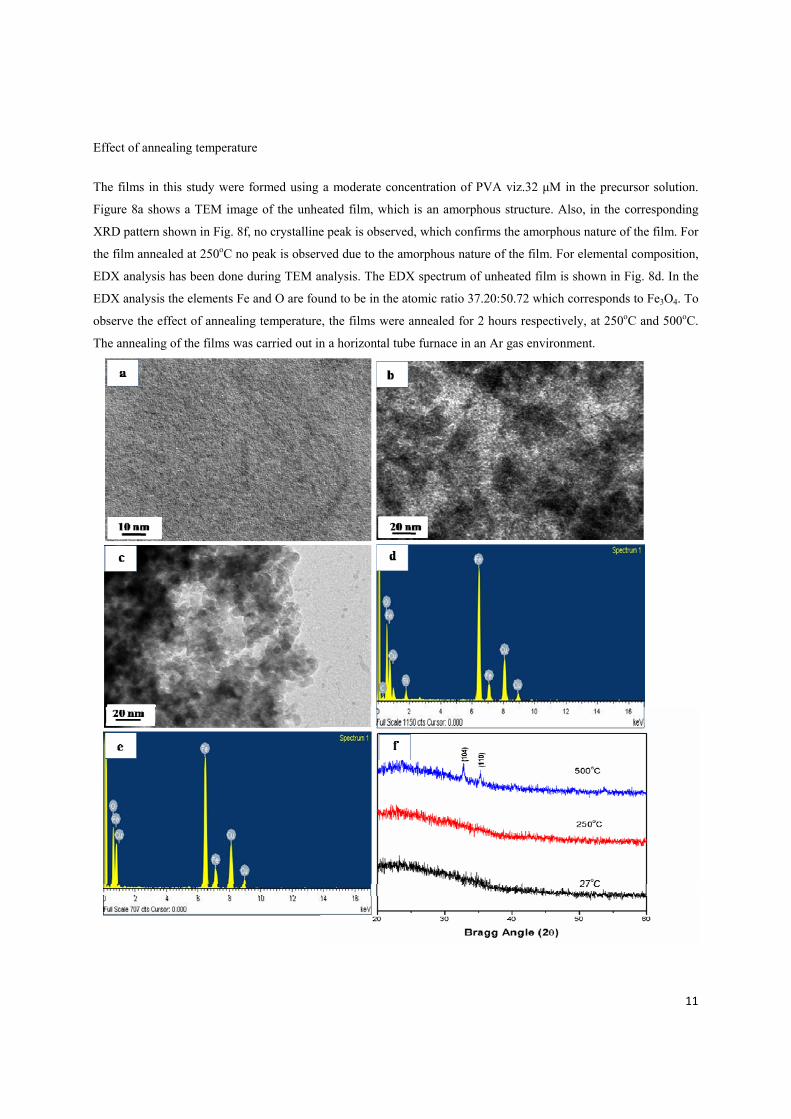
The films in this study were formed using a moderate concentration of PVA viz.32 μM in the precursor solution.
Figure 8a shows a TEM image of the unheated film, which is an amorphous structure. Also, in the corresponding
XRD pattern shown in Fig. 8f, no crystalline peak is observed, which confirms the amorphous nature of the film. For
the film annealed at 250oC no peak is observed due to the amorphous nature of the film. For elemental composition,
EDX analysis has been done during TEM analysis. The EDX spectrum of unheated film is shown in Fig. 8d. In the
EDX analysis the elements Fe and O are found to be in the atomic ratio 37.20:50.72 which corresponds to Fe3O4. To
observe the effect of annealing temperature, the films were annealed for 2 hours respectively, at 250oC and 500oC.
The annealing of the films was carried out in a horizontal tube furnace in an Ar gas environment.
12
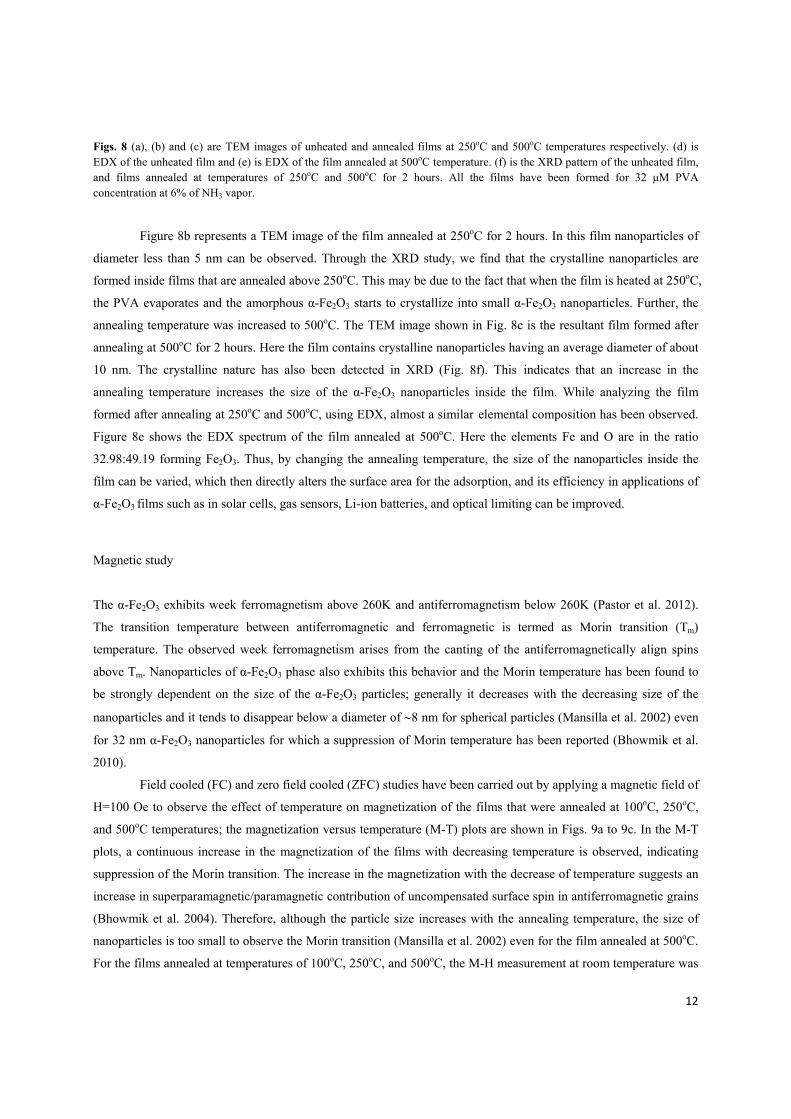
Figs. 8 (a), (b) and (c) are TEM images of unheated and annealed films at 250oC and 500oC temperatures respectively. (d) is EDX of the unheated film and (e) is EDX of the film annealed at 500oC temperature. (f) is the XRD pattern of the unheated film, and films annealed at temperatures of 250oC and 500oC for 2 hours. All the films have been formed for 32 μM PVA concentration at 6% of NH3 vapor.
Figure 8b represents a TEM image of the film annealed at 250oC for 2 hours. In this film nanoparticles of
diameter less than 5 nm can be observed. Through the XRD study, we find that the crystalline nanoparticles are
formed inside films that are annealed above 250oC. This may be due to the fact that when the film is heated at 250oC,
the PVA evaporates and the amorphous α-Fe2O3 starts to crystallize into small α-Fe2O3 nanoparticles. Further, the
annealing temperature was increased to 500oC. The TEM image shown in Fig. 8c is the resultant film formed after
annealing at 500oC for 2 hours. Here the film contains crystalline nanoparticles having an average diameter of about
10 nm. The crystalline nature has also been detected in XRD (Fig. 8f). This indicates that an increase in the
annealing temperature increases the size of the α-Fe2O3 nanoparticles inside the film. While analyzing the film
formed after annealing at 250oC and 500oC, using EDX, almost a similar elemental composition has been observed.
Figure 8e shows the EDX spectrum of the film annealed at 500oC. Here the elements Fe and O are in the ratio
32.98:49.19 forming Fe2O3. Thus, by changing the annealing temperature, the size of the nanoparticles inside the
film can be varied, which then directly alters the surface area for the adsorption, and its efficiency in applications of
α-Fe2O3 films such as in solar cells, gas sensors, Li-ion batteries, and optical limiting can be improved.
Magnetic study
The α-Fe2O3 exhibits week ferromagnetism above 260K and antiferromagnetism below 260K (Pastor et al. 2012).
The transition temperature between antiferromagnetic and ferromagnetic is termed as Morin transition (Tm)
temperature. The observed week ferromagnetism arises from the canting of the antiferromagnetically align spins
above Tm. Nanoparticles of α-Fe2O3 phase also exhibits this behavior and the Morin temperature has been found to
be strongly dependent on the size of the α-Fe2O3 particles; generally it decreases with the decreasing size of the
nanoparticles and it tends to disappear below a diameter of 8 nm for spherical particles (Mansilla et al. 2002) even
for 32 nm α-Fe2O3 nanoparticles for which a suppression of Morin temperature has been reported (Bhowmik et al.
2010).
Field cooled (FC) and zero field cooled (ZFC) studies have been carried out by applying a magnetic field of
H=100 Oe to observe the effect of temperature on magnetization of the films that were annealed at 100oC, 250oC,
and 500oC temperatures; the magnetization versus temperature (M-T) plots are shown in Figs. 9a to 9c. In the M-T
plots, a continuous increase in the magnetization of the films with decreasing temperature is observed, indicating
suppression of the Morin transition. The increase in the magnetization with the decrease of temperature suggests an
increase in superparamagnetic/paramagnetic contribution of uncompensated surface spin in antiferromagnetic grains
(Bhowmik et al. 2004). Therefore, although the particle size increases with the annealing temperature, the size of
nanoparticles is too small to observe the Morin transition (Mansilla et al. 2002) even for the film annealed at 500oC.
For the films annealed at temperatures of 100oC, 250oC, and 500oC, the M-H measurement at room temperature was
13
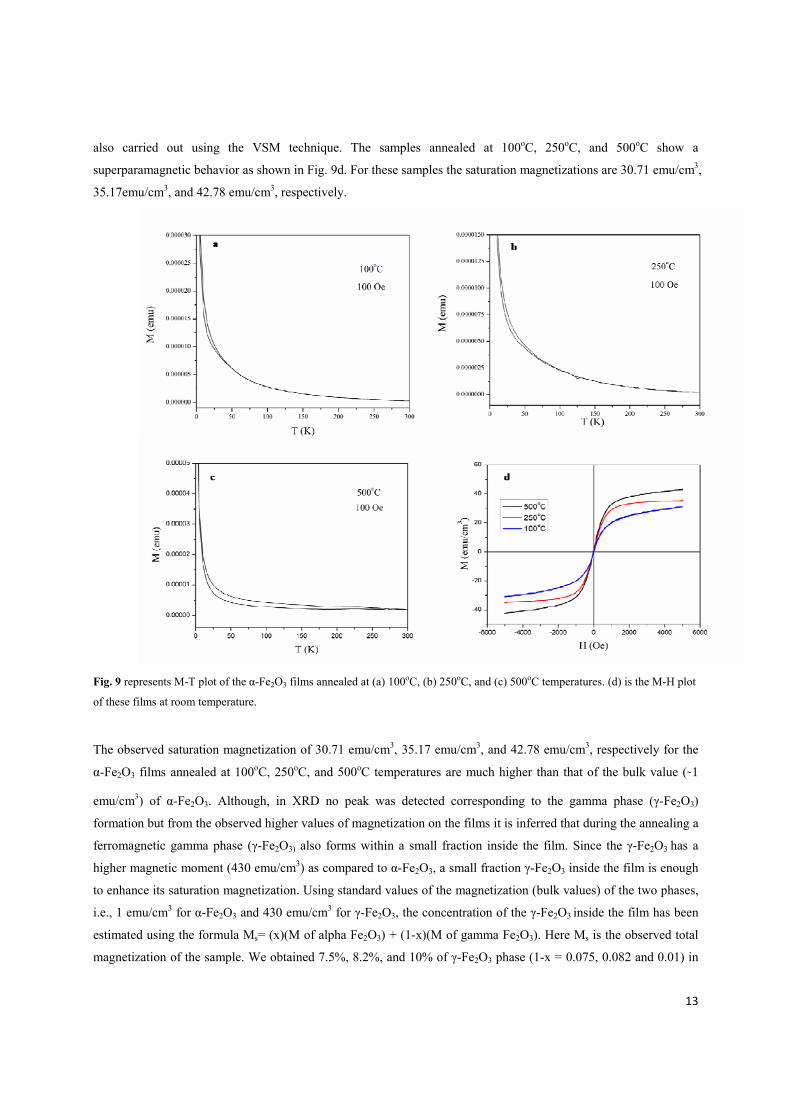
also carried out using the VSM technique. The samples annealed at 100oC, 250oC, and 500oC show a
superparamagnetic behavior as shown in Fig. 9d. For these samples the saturation magnetizations are 30.71 emu/cm3,
35.17emu/cm3, and 42.78 emu/cm3, respectively.
Fig. 9 represents M-T plot of the α-Fe2O3 films annealed at (a) 100oC, (b) 250oC, and (c) 500oC temperatures. (d) is the M-H plot
of these films at room temperature.
The observed saturation magnetization of 30.71 emu/cm3, 35.17 emu/cm3, and 42.78 emu/cm3, respectively for the
α-Fe2O3 films annealed at 100oC, 250oC, and 500oC temperatures are much higher than that of the bulk value (1
emu/cm3) of α-Fe2O3. Although, in XRD no peak was detected corresponding to the gamma phase (γ-Fe2O3)
formation but from the observed higher values of magnetization on the films it is inferred that during the annealing a
ferromagnetic gamma phase (γ-Fe2O3) also forms within a small fraction inside the film. Since the γ-Fe2O3 has a
higher magnetic moment (430 emu/cm3) as compared to α-Fe2O3, a small fraction γ-Fe2O3 inside the film is enough
to enhance its saturation magnetization. Using standard values of the magnetization (bulk values) of the two phases,
i.e., 1 emu/cm3 for α-Fe2O3 and 430 emu/cm3 for γ-Fe2O3, the concentration of the γ-Fe2O3 inside the film has been
estimated using the formula Ms= (x)(M of alpha Fe2O3) + (1-x)(M of gamma Fe2O3). Here Ms is the observed total
magnetization of the sample. We obtained 7.5%, 8.2%, and 10% of γ-Fe2O3 phase (1-x = 0.075, 0.082 and 0.01) in
14
the film annealed at temperatures of 100oC, 250oC, and 500oC, respectively alongside the remaining alpha phase
nanoparticles. It may be noted here the percentage of γ-Fe2O3 phase has been calculated by using the bulk values of
magnetization, however in antiferromagnetic nanoparticles the saturation magnetization could be higher than their
bulk values due to the canting and uncompensated surface spins. Therefore, while considering the canting and
uncompensated surface spins the percentage of γ-Fe2O3 phase would reduce correspondingly.
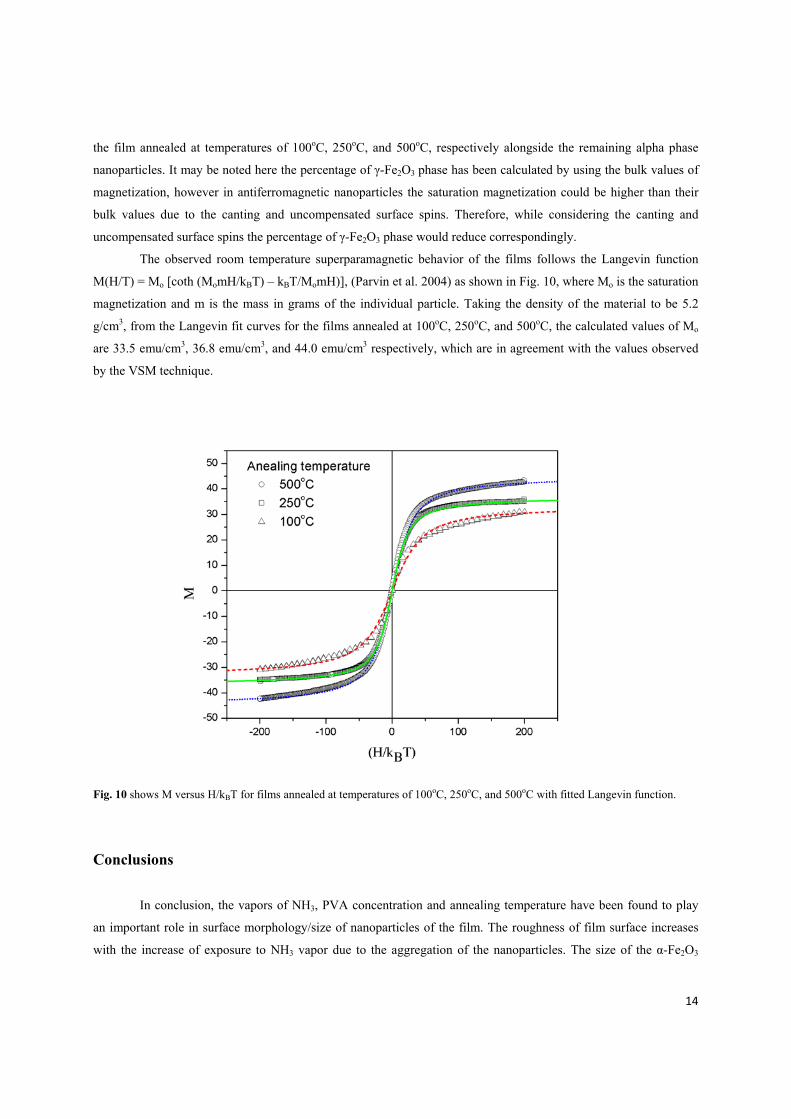
The observed room temperature superparamagnetic behavior of the films follows the Langevin function
M(H/T) = Mo [coth (MomH/kBT) – kBT/MomH)], (Parvin et al. 2004) as shown in Fig. 10, where Mo is the saturation
magnetization and m is the mass in grams of the individual particle. Taking the density of the material to be 5.2
g/cm3, from the Langevin fit curves for the films annealed at 100oC, 250oC, and 500oC, the calculated values of Mo
are 33.5 emu/cm3, 36.8 emu/cm3, and 44.0 emu/cm3 respectively, which are in agreement with the values observed
by the VSM technique.
Fig. 10 shows M versus H/kBT for films annealed at temperatures of 100oC, 250oC, and 500oC with fitted Langevin function.
Conclusions
In conclusion, the vapors of NH3, PVA concentration and annealing temperature have been found to play
an important role in surface morphology/size of nanoparticles of the film. The roughness of film surface increases
with the increase of exposure to NH3 vapor due to the aggregation of the nanoparticles. The size of the α-Fe2O3
15
nanoparticles inside the films can also be controlled by varying the annealing temperature and concentration of PVA
inside the solution; this has many valuable applications such as in solar cells, Li-ion batteries, and gas sensors. The
method presented here is a novel approach to control the thickness of the α-Fe2O3 film. The film formed on the
solution surface can be transferred to any desired substrate. The films are superparamagnetic in nature.
Acknowledgements
This work was partly supported by the National Research Foundation of Korea (NRF) grant funded by the Korean
government (MEST) (No. 2012-0005656) and by the Research Grant for Nanotechnology Lab, Jaypee University of
Information Technology, Waknaghat, Solan (India).
References
Ahmmad B, Kusumoto Y, Abdulla-Al-Mamun M, Mihata A, Yang H (2009) Effect of single wall nanotubes as
counter electrode on laser deposited Fe2O3 and TiO2 films solar cells. J Sci Res 1:430-437
Aronniemi M, Lahtinen J, Hautojärvi P (2004) Characterization of iron oxide thin films. Surf Interface Anal
36:1004-1006
Aronniemi M, Saino J, Lathtinen J (2008) Characterization and gas sensing behavior of an iron oxide thin film
prepared by atomic layer deposition. Thin Solid Films 516:6110-6115
Bhowmik RN, Nagarajan R, Raganathan R (2004) Magnetic enhancement in antiferromagnetic nanoparticle
CoRh2O4. Phys Rev B 69:054430-5
Bhowmik RN, Saravanan A (2010) Surface magnetism, Morin transition and magnetic dynamics in
antiferromagnetic α-Fe2O3 (hematite) nanograins. J Appl Phys 107:053916-10
Birkholz M, Lichtenberger D, Hfpfner C, Fiechter S (1992) Sputtering of thin pyrite films. Sol Energy Mater Sol
Cells 27:243-251
Cesar I, Kay A, Martinez JAG, Gratzel M (2006) Translucent thin film Fe2O3 photo anodes for efficient water
splitting by sun light: Nanostructure-directed effect of Si doping. J Am Chem Soc 128:4582-4583
Chandra V, Park J, Chun Y, Lee JW, Hwang IC, Kim KS (2010) Water-dispersible magnetite-reduced graphene
oxide composites for arsenic removal. ACS nano 4:3979-3986
Chatzitheodorou G, Fiechter S, Kfnenkamp R, Kunst M, Jaegermann W, Tributschthin H (1986) Photo active FeS2
(pyrite) films. Mater Res Bull 21:1481-1487
Chirita M, Grozescu I (2009) Fe2O3-nanoparticle, physical properties and their photochemical and
photoelectrochemical application. Chem Bull “POLITEHNICA”Univ (Timisoura) 54:1-8
Dong Q, Yin S, Guo CS, Li HH, Kumada N, Takei T, Yonesaki Y, Kinomura N, Sato T (2012) Preparation of α-
Fe2O3 particles with controlled shape and size via a facile hydrothermal route. JPCS 339:012004
Fu YY, Wang RM, Xu J, Chen J, YanY, Narlikar AV, Zhang H (2003) Synthesis of large arrays of aligned α-Fe2O3
nanowires. Chem Phys Lett 379:373-379
16
Ge S, Shi XY, Sun K, Li CP, Uber C, Baker JR, Banaszak Holl Jr MM, Orr BG (2009) Facil hydrothermal synthesis
of iron oxide nanoparticles with tunable magnetic properties. J phys chem C 113:13593-13599
Glasscock JA, Barnes PRF, Plumb IC, Savvides N (2007) Enhancement of photoelectrochemical hydrogen
production from hematite thin films by the introduction of Ti and Si. J Phys Chem C 111:16477-16488
Glasscock JA, Barnes IC, Plumb IC, Bendavid A, Martin PJ (2008) Structural, optical and electrical properties of
undoped polycrystalline hematite thin films produced using filtered arc deposition. Thin solid Films 516:1716-
1724
Gou X, Wang G, Park J, Liu H, Yang J (2008) Monodisperse hematite porous nanospheres: synthesis,
characterization, and application for gas sensors. Nanotechnology 19:125606
Hwang IC, Kumar R, Kim ND, Chun Y, Lee JW, Kumar P, Mana RS, Choi C, Lee JR, Kim KS (2009) Controlling
metal nanotoppings on the tip of silicide nanostructure. Nanotechnology 20:245605
Jia CJ, Sun LD, Yan ZG, You LP, Luo F, Han XD, Pang YC, Zhang Z, Yan CH (2005) Single crystalline iron oxide
nanotubes. Angew Chem Int Ed 44:4328-4333
Jin YH, Deok S, Shim HW, Park KS, Kim DW (2012) Synthesis of core/shell spinel ferrite/carban nanoparticles
with enhanced cycling stability for Lithium ion battery anodes. Nanotechnology 23:125402
Kay A, Cesar I, Gratzel M (2006) New Benchmark for water photooxidation by nanostructured α-Fe2O3 films. J Am
Chem Soc 128:15714-15721
Kim JY, Jun H, Hong SJ, Kim HG, Lee JS (2011) Charge transfer in iron oxide photoanode modified with carbon
nanotubes for photoelectrochemical water oxidation: An electrochemical impedance study. Int J Hydrogen
Energ 36:9462-9468
Kumar R, Gautam S, Hwang IC, Lee JR, Chae KH, Thakur N (2009) Preparation and characterization of α-Fe2O3
polyhedral nanocrystals via annealing technique. Matter Lett 63:1047-1050
Lin H, Watanabe Y, Kimura M, Hanabusa K, Shirai H (2003) Preparation of magnetic poly(vinyl alcohol) (PVA)
materials by In situ synthesis of magnetite in a PVA matrix. J Appl Polym Sci 87:1239-1247
Lindgren T, Wang H, Beermann N, Vayssieres L, Hagfeldt A, Lindquist SE (2002) Aqueous photoelectrochemistry
of hematite nanorod arrays. Sol Energy Mater Sol Cells 71:231-243
Liu Y, Sun D (2007) Effect of CeO2 doping on catalytic activity of Fe2O3/ -Al2O3 catalyst for catalytic wet peroxide
of azo dyes. J Hazard mater 143:448-454
Liu Z, Sha J, Yang Q, Su Z, Zhang H, Yang D (2007) Flower-like silicon nanostructures. Physica E 38:27-30
Liu ZL, Liu CC, Yao KL, Liu PD, Ning Q (2007) Preparation and characterization of micron-sized magnetic
microspheres by one-step suspension polymerization. J Appl Polym Sci 105:1331-1335
Mahapatra SK, John SE, Banerjee S, Mishra M (2009) Water photooxidation by smooth and ultrathin α-Fe2O3
nanotubes arrays. Chem Matters 21:3048-3055
Mansilla M V, Zysler R, Fiorani D, Suber L (2002) Annealing effect on magnetic properties of acicular hematite
nanoparticles. Physica B 320:206-209
Mathur S, Sivakov V, Shen H, Barth S, Cavelius C, Nilsson A, Kuhn P (2006) Nanostructured film of iron, tin and
titanium oxide by chemical vapor deposition. Thin Solid films 502:88-93
17
Miller EL, Paluselli D, Marsen B, Rocheleau RE (2004) Low temperature reactivity sputtered iron oxide for thin
film devices. Thin Solid Films 466:307-313
Mulmudi HK, Mathews N, Dou XC, Xi LF, Pramana SS, Lam YM, Mhuisalkar SG (2011) Controlled growth of
hematite (α-Fe2O3) nanorod array on flourin doped tin oxide: synthesis and photoelectrochemical properties.
Electrochem Commun 13:951-954
Morishita N, Malagami H, Morishita R, Takeda S, Mishima F, Terazono B, Nishijima S, Kaneda Y, Tanaka N
(2005) Magnetic nanoparticles with surface modification enhanced gene delivery of HVJ-E vector. Biochem
Biophys Res Commun 334:1121-1126
Omi S, Kanetaka A, Shimamori Y, Supsakulchai A, Nagai M, Ma GH (2001) Magnetite (Fe3O4) microcapsules
prepared using a glass membrane and solvent removal. J Microencapsul 18:749-765
Park CD, Walker J, Tannenbaum R, Stiegman AE, Frydrych J, Machala L (2009) Sol-gel derived iron oxide thin
films on silicon: surface properties and interfacial chemistry. ACS Appl Mater Interfaces 1:1843-1846
Parvin K, Ma J, Ly J, Sun XC, Nikles DE, Sun K, Wang LM (2004) Synthesis and magnetic properties of
monodisperse Fe3O4 nanoparticles. J Appl Phys 95:7121-7123
Pastor JM, Pérez-Landazalol JI, Gómez-Polo C, Recarte V, Larumbe S, Santamarta R, Silva MF, Pineda EAG,
Hechenleitner AAW, Lima MK (2012) Entropy change linked to the magnetic field induced Morin transition in
hematite nanoparticles. Appl Phys Lett 100:063102
Ramachandran B, Ramachandra Rao MS, (2007) Optical and magnetic properties of monodispersed α–Fe2O3
nanoparticle aggregates. AIP Conf Proc 1003:91-93
Ryu HS, Kim JS, Guo Z, Liu H, Kim KW, Ahn JH, Ahn HJ (2010) Electrochemical properties of Fe2O3 thin film
fabricated by electrostatic spray deposition for lithium-ion batteries. Phys Scr T139:014066
Sahoo SK, Agarwal K, Singh AK, Polke BG, Raha KC (2010) Characterization of γ- and α-Fe2O3 nanopowder
synthesized by emulsion precipitation-calcination rout and rheological behavior of α-Fe2O3. IJEST 8:118-126
Shen S, Kronawitter CX, Jiang J, Mao SS, Guo L (2012) Surface tuning for promoted charge transfer in hematite
nanorod arrays as water-splitting photoanodes. Nano Res 5:327-336
Shinde SS, Bansode RA, Bhosale CH, Rajpure KY (2011) Physical properties of hematite α-Fe2O3 thin films:
application to photo electrochemical solar cells. J semicond 32:013001-8
Singh CP, Bindra KS, Bhalera GM, Oak SM (2008) Investigation of optical limiting in iron oxide nanoparticles. Opt
Express 16:8440- 8450
Sivako V, Petersen C, Daniel C, Shen H, Mucklich F, Mathur S (2005) Laser induced local and periodic phase
transformations in iron oxide thin films obtained by chemical vapour deposition. Appl Surf Sci 247:513-517
Turkovoć A, Ivanda M, Bitenc M, Orel ZC (2011) Influence of Lithium on nanosized film of Fe2O3. J Nanomater
967307:1-8
Uekawa N, Kaneko N (1998) Nonstoichiometric properties of nanoporous iron oxide films. J Phys Chem B
102:8719-8724.
18
Wu C, Yin P, Zhu X, Yang CO, Xie Y (2006) Synthesis of hematite (α-Fe2O3) nanorods; Diameter size and shape
effect on their application in magnetism, Lithium ion battery and gas sensors. J Phys Chem B 110:17806-
17812
Zang Z, Hossain MF, Miyazaki T, Takahashi T (2010) Gas phase photocatalytic activity of ultrathin Pt layer coated
on α-Fe2O3 films under visible light illumination. Environ Sci Technol 44:4741-4746
Zhang J, Liu X, Wang L, Yang T, Guo X, Wu S, Wang S, Zhang S (2011) Synthesis and gas sensing properties of α-
Fe2O3 @ ZnO core-shell nanospindles. Nanotechnology 22:185501
Zhou HS, Mito A, Kundu D, Honma I (2000) Nonlinear optical susceptibility of Fe2O3 thin film synthesized by a
modified sol-gel method. J Sol-Gel Sci Technol 19:539-541