A critical analysis of the α, β and γ phases in poly ...
8
A critical analysis of the a, b and g phases in poly(vinylidene fluoride) using FTIR† Xiaomei Cai, a Tingping Lei, * bc Daoheng Sun d and Liwei Lin de Poly(vinylidene fluoride) (PVDF) has been widely utilized in scientific research and the manufacturing industry for its unique piezoelectric properties. In the past few decades, the vibrational spectra of PVDF polymorphic polymers via FTIR (Fourier transform infrared spectroscopy) have been extensively investigated and documented. However, reports on the analysis of a, b and g phases often have conflicting views based on measured data. In this work, we analyze the FTIR vibrational bands of PVDF materials fabricated by different processes with detailed XRD (X-ray diffraction) characterization to identify the structural a, b and g phases. By examining the results in this work and extensively reviewing published research reports in the literature, a universal phase identification procedure using only the FTIR results is proposed and validated. Specifically, this procedure can differentiate the three phases by checking the bands around 763 and/or 614, 1275, and 1234 cm 1 for the a, b and g phases, respectively. The rule for assignment of the 840* and 510* cm 1 bands is provided for the first time and an integrated quantification methodology for individual b and g phase in mixed systems is also demonstrated. Introduction Since the discovery of piezoelectricity in poly(vinylidene uo- ride) (PVDF), 1 strong interest has been focused on the pro- cessing of the semi-crystalline polymer 2–6 and at least ve distinct polymorphs, a (TGTG 0 , form II), b (TTTT, form I), g (T 3 GT 3 G 0 , form III), d and 3 have been constructed depending on the molecular chain conformation during the fabrication processes. Processing parameters, such as mechanical, thermal, electrical and chemical treatments all affect the nal PVDF properties, including but not limited to electroactivity, dielec- tric and mechanical properties, antifouling behavior, and evoking cellular behavior. 7–12 Although FTIR has been widely used in characterizing PVDF, 13–23 reports in the existing litera- ture (sometimes by the same authors) have many conicting characterization results based on FTIR results (Table 1), espe- cially in the electroactive b and g phases. Two main reasons have resulted in this divergence. First, many authors directly assigned the FTIR bands at around 840 and 510 cm 1 to the b and/or g phases without providing sufficient evidence. 12,16–18,24–33 Second, several bands exclusive to the b and g phases in the wavenumber range of 400–1500 cm 1 (or smaller range) have seldom been taken into consideration previously. Furthermore, the relative amounts of the electroactive b and g phases have been quantied in the works of Gregorio et al. 24 and Lopes et al., 34 for samples containing only two-phase of a and b; or a and g without considering the cases for three phases (a, b, and g), or the b and g two-phase systems. Although a recent report has proposed the quantication of b and g phases system, 35 the procedure is rather complex. In the present contribution, the procedure for the identication of a, b and g phases using the FTIR vibrational spectrum is proposed and demonstrated with an integrated quantication methodology for individual b and g phase for PVDF materials made of various a, b and g phase compositions. Both FTIR and XRD data have been utilized to validate and identify the phases of various PVDF polymeric systems, because the nonelectroactive a phase and the electroactive b phase can be clearly identied by FTIR and XRD, respectively. 4,5,20 Procedure for phase identification By sorting out more than 100 prior publications, the FTIR absorption peaks for the three main a, b and g polymorphs of PVDF can be classied into three major categories: (1) common peaks that appear in all three phases; (2) exclusive peaks that only appear in one of the three phases; and (3) dual peaks that could come from two different phases. In general, spectrum peaks around 881, 1071, 1176 and 1401 cm 1 with high a School of Science, Jimei University, Xiamen 361021, China b Fujian Key Laboratory of Special Energy Manufacturing, Huaqiao University, Xiamen 361021, China. E-mail: [email protected] c College of Mechanical Engineering and Automation, Huaqiao University, Xiamen 361021, China d School of Aerospace Engineering, Xiamen University, Xiamen 361005, China e Department of Mechanical Engineering, University of California, Berkeley, California 94720, USA † Electronic supplementary information (ESI) available. See DOI: 10.1039/c7ra01267e Cite this: RSC Adv. , 2017, 7, 15382 Received 30th January 2017 Accepted 28th February 2017 DOI: 10.1039/c7ra01267e rsc.li/rsc-advances 15382 | RSC Adv., 2017, 7, 15382–15389 This journal is © The Royal Society of Chemistry 2017 RSC Advances PAPER Open Access Article. Published on 07 March 2017. Downloaded on 10/26/2021 3:01:21 PM. This article is licensed under a Creative Commons Attribution 3.0 Unported Licence. View Article Online View Journal | View Issue
Transcript of A critical analysis of the α, β and γ phases in poly ...
RSC Advances
PAPER
Ope
n A
cces
s A
rtic
le. P
ublis
hed
on 0
7 M
arch
201
7. D
ownl
oade
d on
10/
26/2
021
3:01
:21
PM.
Thi
s ar
ticle
is li
cens
ed u
nder
a C
reat
ive
Com
mon
s A
ttrib
utio
n 3.
0 U
npor
ted
Lic
ence
.
View Article OnlineView Journal | View Issue
A critical analysis
aSchool of Science, Jimei University, XiamenbFujian Key Laboratory of Special Energy Ma
361021, China. E-mail: [email protected] of Mechanical Engineering and A
361021, ChinadSchool of Aerospace Engineering, Xiamen UeDepartment of Mechanical Engineering, Un
94720, USA
† Electronic supplementary informa10.1039/c7ra01267e
Cite this: RSC Adv., 2017, 7, 15382
Received 30th January 2017Accepted 28th February 2017
DOI: 10.1039/c7ra01267e
rsc.li/rsc-advances
15382 | RSC Adv., 2017, 7, 15382–1538
of the a, b and g phases inpoly(vinylidene fluoride) using FTIR†
Xiaomei Cai,a Tingping Lei,*bc Daoheng Sund and Liwei Linde
Poly(vinylidene fluoride) (PVDF) has been widely utilized in scientific research and the manufacturing
industry for its unique piezoelectric properties. In the past few decades, the vibrational spectra of PVDF
polymorphic polymers via FTIR (Fourier transform infrared spectroscopy) have been extensively
investigated and documented. However, reports on the analysis of a, b and g phases often have
conflicting views based on measured data. In this work, we analyze the FTIR vibrational bands of PVDF
materials fabricated by different processes with detailed XRD (X-ray diffraction) characterization to
identify the structural a, b and g phases. By examining the results in this work and extensively reviewing
published research reports in the literature, a universal phase identification procedure using only the FTIR
results is proposed and validated. Specifically, this procedure can differentiate the three phases by
checking the bands around 763 and/or 614, 1275, and 1234 cm�1 for the a, b and g phases, respectively.
The rule for assignment of the 840* and 510* cm�1 bands is provided for the first time and an integrated
quantification methodology for individual b and g phase in mixed systems is also demonstrated.
Introduction
Since the discovery of piezoelectricity in poly(vinylidene uo-ride) (PVDF),1 strong interest has been focused on the pro-cessing of the semi-crystalline polymer2–6 and at least vedistinct polymorphs, a (TGTG0, form II), b (TTTT, form I), g(T3GT3G0, form III), d and 3 have been constructed depending onthe molecular chain conformation during the fabricationprocesses. Processing parameters, such asmechanical, thermal,electrical and chemical treatments all affect the nal PVDFproperties, including but not limited to electroactivity, dielec-tric and mechanical properties, antifouling behavior, andevoking cellular behavior.7–12 Although FTIR has been widelyused in characterizing PVDF,13–23 reports in the existing litera-ture (sometimes by the same authors) have many conictingcharacterization results based on FTIR results (Table 1), espe-cially in the electroactive b and g phases. Two main reasonshave resulted in this divergence. First, many authors directlyassigned the FTIR bands at around 840 and 510 cm�1 to theb and/or g phases without providing sufficient
361021, China
nufacturing, Huaqiao University, Xiamen
utomation, Huaqiao University, Xiamen
niversity, Xiamen 361005, China
iversity of California, Berkeley, California
tion (ESI) available. See DOI:
9
evidence.12,16–18,24–33 Second, several bands exclusive to the b andg phases in the wavenumber range of 400–1500 cm�1 (orsmaller range) have seldom been taken into considerationpreviously.
Furthermore, the relative amounts of the electroactive b andg phases have been quantied in the works of Gregorio et al.24
and Lopes et al.,34 for samples containing only two-phase ofa and b; or a and g without considering the cases for threephases (a, b, and g), or the b and g two-phase systems. Althougha recent report has proposed the quantication of b and g
phases system,35 the procedure is rather complex. In the presentcontribution, the procedure for the identication of a, b and g
phases using the FTIR vibrational spectrum is proposed anddemonstrated with an integrated quantication methodologyfor individual b and g phase for PVDFmaterials made of variousa, b and g phase compositions. Both FTIR and XRD data havebeen utilized to validate and identify the phases of various PVDFpolymeric systems, because the nonelectroactive a phase andthe electroactive b phase can be clearly identied by FTIR andXRD, respectively.4,5,20
Procedure for phase identification
By sorting out more than 100 prior publications, the FTIRabsorption peaks for the three main a, b and g polymorphs ofPVDF can be classied into three major categories: (1) commonpeaks that appear in all three phases; (2) exclusive peaks thatonly appear in one of the three phases; and (3) dual peaks thatcould come from two different phases. In general, spectrumpeaks around 881, 1071, 1176 and 1401 cm�1 with high
This journal is © The Royal Society of Chemistry 2017
Table 1 Divergence in the assignment of some typical bandsa
Wave number(cm�1)
Crystallinephase Reference
431 b 23, 36–38g 4, 18, 22, 24, 29, 39–41b + g 28
482 b 42–45g 14–15, 17, 20, 22, 23 and 46a 47–49
510 b 12, 14, 16, 17, 19, 28, 40, 50–52g 24, 53–56b + g 35, 39, 41, 42, 57–60a 47 and 48
840 b 12, 16, 17, 24, 26, 27, 51,52, 61–67
g 15, 68–72b + g 4, 9, 15, 18, 28, 35, 39, 57,
58, 60, 73–76881 b 77
g 48, 51 and 72b + g 60 and 78a + b 62a + b + g 73a 79
1071 b 14, 79–84b + g 60a + b + g 21, 22, 46, 65, 73, 74 and 85a 47, 48, 86–88
1176 b 34, 52, 62 and 86g 42b + g 14 and 60
1234 b 36, 37, 89–94g 9, 15, 19, 21, 22, 57, 65, 73,
76, 95–99b + g 18, 42 and 58
1275 b 14–15, 19, 22, 23, 42, 73, 76,94, 96–98 and 100
g 71 and 721401 b 77, 84, 86–88
g 48b + g 60a 79, 101 and 102
a Note: the assignment of some other bands such as 833 and 1431 cm�1
is also in dispute.
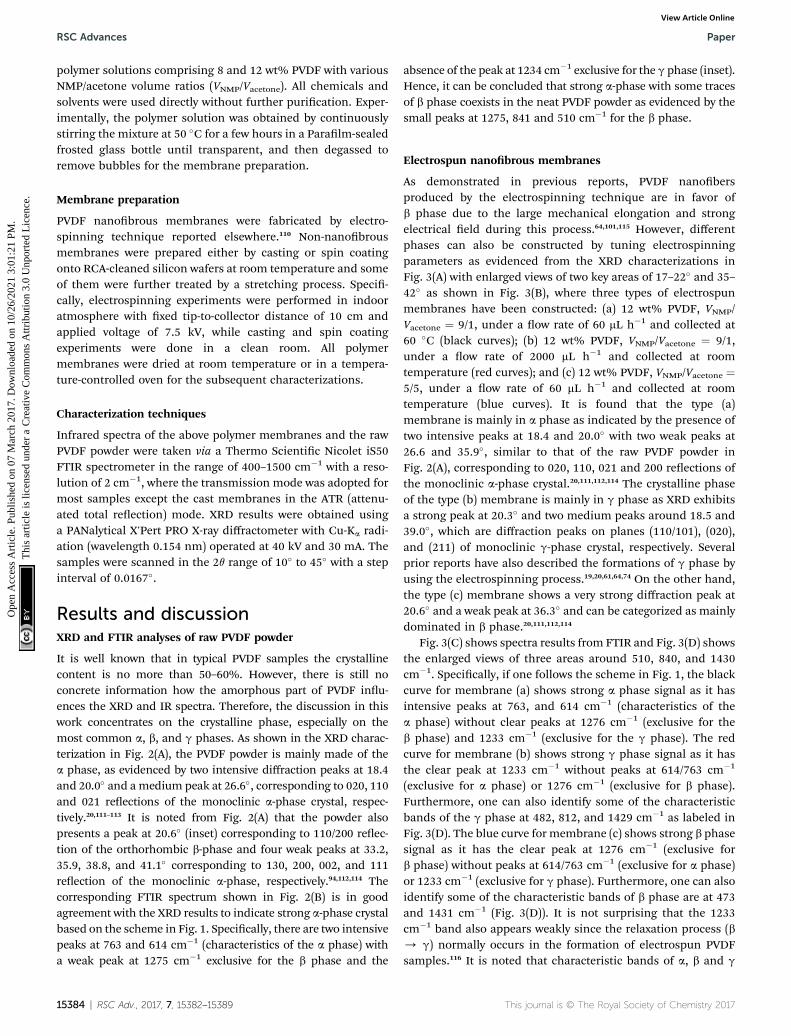
Fig. 1 Flow diagram for the identification of a, b and g phases; 840*and 510* represents bands in the range of 837–841 and 508–512cm�1, respectively; 776# and 833# reflects possible variations based onspecific processes.
Paper RSC Advances
Ope
n A
cces
s A
rtic
le. P
ublis
hed
on 0
7 M
arch
201
7. D
ownl
oade
d on
10/
26/2
021
3:01
:21
PM.
Thi
s ar
ticle
is li
cens
ed u
nder
a C
reat
ive
Com
mon
s A
ttrib
utio
n 3.
0 U
npor
ted
Lic
ence
.View Article Online
intensity were previously used to characterize the crystal phasesin some papers (see Table 1). However, peaks in the range of876–885, 1067–1075, 1171–1182 and 1398–1404 cm�1 havesimilar characteristics in samples of a-, b- and g-phases or othermixed systems.19,21,22,46,65,66,73,74,100,103 In other words, these arecommon peaks that appear in all three phases. The exclusivepeaks can be used to identify the corresponding crystallinephases, whereas the dual peaks may be the results of experi-mental uncertainty for small wavenumber shis (typicallywithin 2 cm�1), or truely different phases depending on exper-imental conditions. Specically, the exclusive peaks for thea phase (characteristic bands of the a phase) are around at 410,489, 532, 614, 763, 795, 854, 975, 1149, 1209, 1383 and 1423cm�1; the exclusive peaks for the b phase are around at 445, 473and 1275 cm�1; and the exclusive peaks for the g phase arearound at 431, 482, 811 and 1234 cm�1. In contrast, the peaks in
This journal is © The Royal Society of Chemistry 2017
the range of 837–841 and 508–512 cm�1, although may appearin many different samples, the absorbance for the b- and g-phase is much stronger than that of the a-phase. These twopeaks (below using 840* and 510* cm�1 for simplicity) cantherefore be used to characterize the electroactive b and/or g
phases (detailed in assignment of the 840* and 510* cm�1
bands). Although the b and g phases show very close peaks inthe range of 1428–1432 cm�1, various results support that thepeaks at 1431 and 1429 cm�1 can be used as the characteristicbands of the b and g phases, respectively.20,80,85,104,105 The 600cm�1 band that was previously assigned to the b-phase by someauthors,17,38,101,106 should not be used to characterize PVDF asthis band is commonly showed up in many samples, includinga-phase ones, due to the other intensive peak around at 613cm�1.11,12,16,18,20,29,31,46,51,107,108 It is noted that the 776 and 833cm�1 bands exclusively shown in high temperature crystalliza-tion g-phase,18,68,109 are rather seldom observed in other g-phasedomination samples.14,19,40,42,55,69,70,85
Since the amounts of the three phases can be in anypercentage, establishing a universal but simplied procedure totrace these phases is therefore of great signicance. It is foundthat the bands around at 763 and/or 614, 1275, and 1234 cm�1
can be consistently used to differentiate and identify the a,b and g phases, respectively. Therefore, the procedure for theidentication of a, b and g phases can be summarized asillustrated in Fig. 1.
ExperimentalPolymer solutions
PVDF (D692, from Shanghai Sensure Chemical Co. Ltd, witha molecular weight of 625 000) powders were dissolved in N-methyl-2-pyrrolidinone (NMP) and acetone to prepare the
RSC Adv., 2017, 7, 15382–15389 | 15383
RSC Advances Paper
Ope
n A
cces
s A
rtic
le. P
ublis
hed
on 0
7 M
arch
201
7. D
ownl
oade
d on
10/
26/2
021
3:01
:21
PM.
Thi
s ar
ticle
is li
cens
ed u
nder
a C
reat
ive
Com
mon
s A
ttrib
utio
n 3.
0 U
npor
ted
Lic
ence
.View Article Online
polymer solutions comprising 8 and 12 wt% PVDF with variousNMP/acetone volume ratios (VNMP/Vacetone). All chemicals andsolvents were used directly without further purication. Exper-imentally, the polymer solution was obtained by continuouslystirring the mixture at 50 �C for a few hours in a Paralm-sealedfrosted glass bottle until transparent, and then degassed toremove bubbles for the membrane preparation.
Membrane preparation
PVDF nanobrous membranes were fabricated by electro-spinning technique reported elsewhere.110 Non-nanobrousmembranes were prepared either by casting or spin coatingonto RCA-cleaned silicon wafers at room temperature and someof them were further treated by a stretching process. Speci-cally, electrospinning experiments were performed in indooratmosphere with xed tip-to-collector distance of 10 cm andapplied voltage of 7.5 kV, while casting and spin coatingexperiments were done in a clean room. All polymermembranes were dried at room temperature or in a tempera-ture-controlled oven for the subsequent characterizations.
Characterization techniques
Infrared spectra of the above polymer membranes and the rawPVDF powder were taken via a Thermo Scientic Nicolet iS50FTIR spectrometer in the range of 400–1500 cm�1 with a reso-lution of 2 cm�1, where the transmission mode was adopted formost samples except the cast membranes in the ATR (attenu-ated total reection) mode. XRD results were obtained usinga PANalytical X'Pert PRO X-ray diffractometer with Cu-Ka radi-ation (wavelength 0.154 nm) operated at 40 kV and 30 mA. Thesamples were scanned in the 2q range of 10� to 45� with a stepinterval of 0.0167�.
Results and discussionXRD and FTIR analyses of raw PVDF powder
It is well known that in typical PVDF samples the crystallinecontent is no more than 50–60%. However, there is still noconcrete information how the amorphous part of PVDF inu-ences the XRD and IR spectra. Therefore, the discussion in thiswork concentrates on the crystalline phase, especially on themost common a, b, and g phases. As shown in the XRD charac-terization in Fig. 2(A), the PVDF powder is mainly made of thea phase, as evidenced by two intensive diffraction peaks at 18.4and 20.0� and a medium peak at 26.6�, corresponding to 020, 110and 021 reections of the monoclinic a-phase crystal, respec-tively.20,111–113 It is noted from Fig. 2(A) that the powder alsopresents a peak at 20.6� (inset) corresponding to 110/200 reec-tion of the orthorhombic b-phase and four weak peaks at 33.2,35.9, 38.8, and 41.1� corresponding to 130, 200, 002, and 111reection of the monoclinic a-phase, respectively.94,112,114 Thecorresponding FTIR spectrum shown in Fig. 2(B) is in goodagreement with the XRD results to indicate strong a-phase crystalbased on the scheme in Fig. 1. Specically, there are two intensivepeaks at 763 and 614 cm�1 (characteristics of the a phase) witha weak peak at 1275 cm�1 exclusive for the b phase and the
15384 | RSC Adv., 2017, 7, 15382–15389
absence of the peak at 1234 cm�1 exclusive for the g phase (inset).Hence, it can be concluded that strong a-phase with some tracesof b phase coexists in the neat PVDF powder as evidenced by thesmall peaks at 1275, 841 and 510 cm�1 for the b phase.
Electrospun nanobrous membranes
As demonstrated in previous reports, PVDF nanobersproduced by the electrospinning technique are in favor ofb phase due to the large mechanical elongation and strongelectrical eld during this process.64,101,115 However, differentphases can also be constructed by tuning electrospinningparameters as evidenced from the XRD characterizations inFig. 3(A) with enlarged views of two key areas of 17–22� and 35–42� as shown in Fig. 3(B), where three types of electrospunmembranes have been constructed: (a) 12 wt% PVDF, VNMP/Vacetone ¼ 9/1, under a ow rate of 60 mL h�1 and collected at60 �C (black curves); (b) 12 wt% PVDF, VNMP/Vacetone ¼ 9/1,under a ow rate of 2000 mL h�1 and collected at roomtemperature (red curves); and (c) 12 wt% PVDF, VNMP/Vacetone ¼5/5, under a ow rate of 60 mL h�1 and collected at roomtemperature (blue curves). It is found that the type (a)membrane is mainly in a phase as indicated by the presence oftwo intensive peaks at 18.4 and 20.0� with two weak peaks at26.6 and 35.9�, similar to that of the raw PVDF powder inFig. 2(A), corresponding to 020, 110, 021 and 200 reections ofthe monoclinic a-phase crystal.20,111,112,114 The crystalline phaseof the type (b) membrane is mainly in g phase as XRD exhibitsa strong peak at 20.3� and two medium peaks around 18.5 and39.0�, which are diffraction peaks on planes (110/101), (020),and (211) of monoclinic g-phase crystal, respectively. Severalprior reports have also described the formations of g phase byusing the electrospinning process.19,20,61,64,74 On the other hand,the type (c) membrane shows a very strong diffraction peak at20.6� and a weak peak at 36.3� and can be categorized as mainlydominated in b phase.20,111,112,114
Fig. 3(C) shows spectra results from FTIR and Fig. 3(D) showsthe enlarged views of three areas around 510, 840, and 1430cm�1. Specically, if one follows the scheme in Fig. 1, the blackcurve for membrane (a) shows strong a phase signal as it hasintensive peaks at 763, and 614 cm�1 (characteristics of thea phase) without clear peaks at 1276 cm�1 (exclusive for theb phase) and 1233 cm�1 (exclusive for the g phase). The redcurve for membrane (b) shows strong g phase signal as it hasthe clear peak at 1233 cm�1 without peaks at 614/763 cm�1
(exclusive for a phase) or 1276 cm�1 (exclusive for b phase).Furthermore, one can also identify some of the characteristicbands of the g phase at 482, 812, and 1429 cm�1 as labeled inFig. 3(D). The blue curve for membrane (c) shows strong b phasesignal as it has the clear peak at 1276 cm�1 (exclusive forb phase) without peaks at 614/763 cm�1 (exclusive for a phase)or 1233 cm�1 (exclusive for g phase). Furthermore, one can alsoidentify some of the characteristic bands of b phase are at 473and 1431 cm�1 (Fig. 3(D)). It is not surprising that the 1233cm�1 band also appears weakly since the relaxation process (b/ g) normally occurs in the formation of electrospun PVDFsamples.116 It is noted that characteristic bands of a, b and g
This journal is © The Royal Society of Chemistry 2017
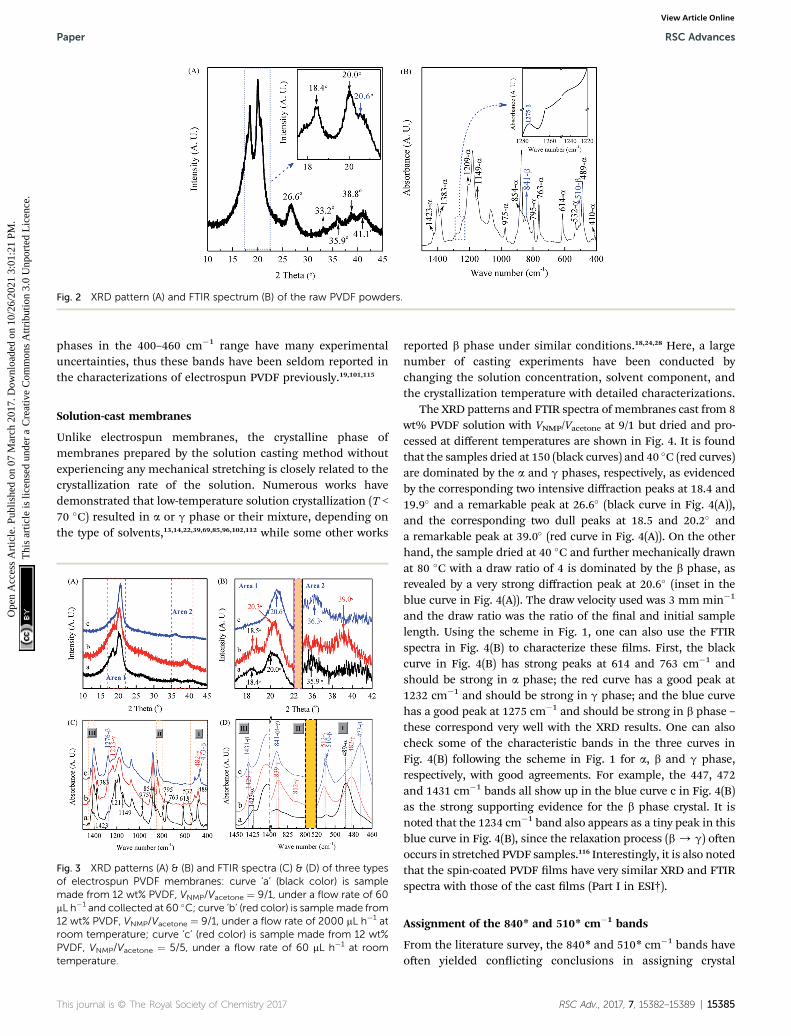
Fig. 2 XRD pattern (A) and FTIR spectrum (B) of the raw PVDF powders.
Paper RSC Advances
Ope
n A
cces
s A
rtic
le. P
ublis
hed
on 0
7 M
arch
201
7. D
ownl
oade
d on
10/
26/2
021
3:01
:21
PM.
Thi
s ar
ticle
is li
cens
ed u
nder
a C
reat
ive
Com
mon
s A
ttrib
utio
n 3.
0 U
npor
ted
Lic
ence
.View Article Online
phases in the 400–460 cm�1 range have many experimentaluncertainties, thus these bands have been seldom reported inthe characterizations of electrospun PVDF previously.19,101,115
Solution-cast membranes
Unlike electrospun membranes, the crystalline phase ofmembranes prepared by the solution casting method withoutexperiencing any mechanical stretching is closely related to thecrystallization rate of the solution. Numerous works havedemonstrated that low-temperature solution crystallization (T <70 �C) resulted in a or g phase or their mixture, depending onthe type of solvents,13,14,22,39,69,85,96,102,112 while some other works
Fig. 3 XRD patterns (A) & (B) and FTIR spectra (C) & (D) of three typesof electrospun PVDF membranes: curve ‘a’ (black color) is samplemade from 12 wt% PVDF, VNMP/Vacetone ¼ 9/1, under a flow rate of 60mL h�1 and collected at 60 �C; curve ‘b’ (red color) is samplemade from12 wt% PVDF, VNMP/Vacetone ¼ 9/1, under a flow rate of 2000 mL h�1 atroom temperature; curve ‘c’ (red color) is sample made from 12 wt%PVDF, VNMP/Vacetone ¼ 5/5, under a flow rate of 60 mL h�1 at roomtemperature.
This journal is © The Royal Society of Chemistry 2017
reported b phase under similar conditions.18,24,28 Here, a largenumber of casting experiments have been conducted bychanging the solution concentration, solvent component, andthe crystallization temperature with detailed characterizations.
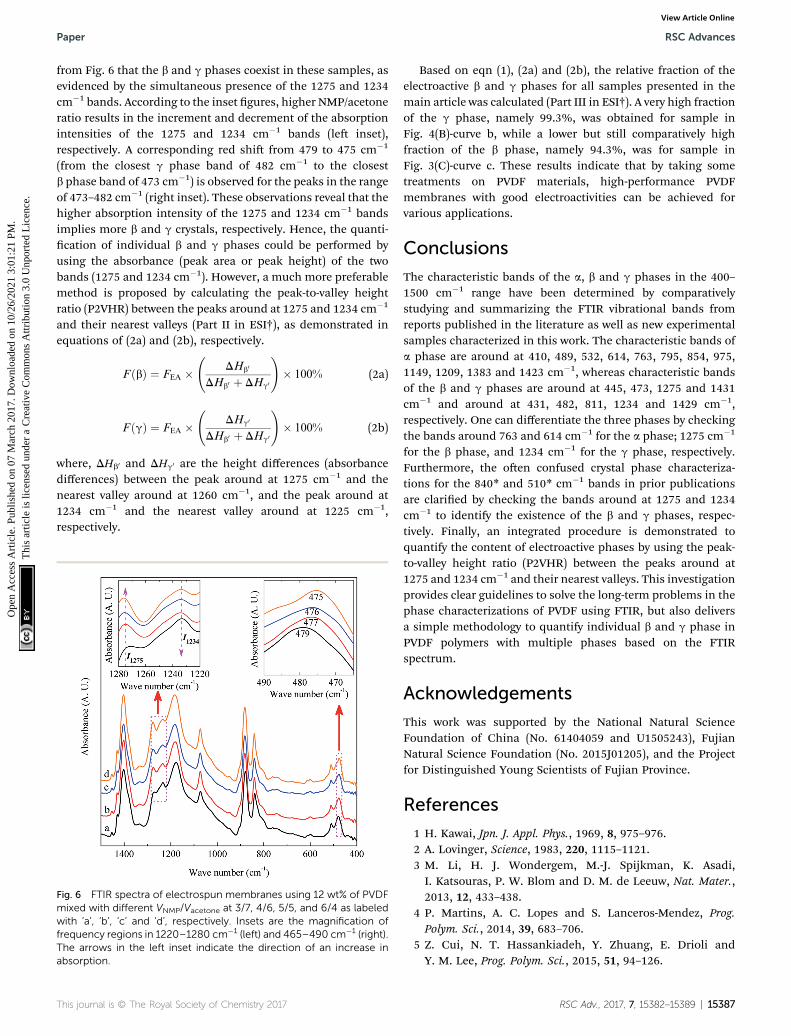
The XRD patterns and FTIR spectra of membranes cast from 8wt% PVDF solution with VNMP/Vacetone at 9/1 but dried and pro-cessed at different temperatures are shown in Fig. 4. It is foundthat the samples dried at 150 (black curves) and 40 �C (red curves)are dominated by the a and g phases, respectively, as evidencedby the corresponding two intensive diffraction peaks at 18.4 and19.9� and a remarkable peak at 26.6� (black curve in Fig. 4(A)),and the corresponding two dull peaks at 18.5 and 20.2� anda remarkable peak at 39.0� (red curve in Fig. 4(A)). On the otherhand, the sample dried at 40 �C and further mechanically drawnat 80 �C with a draw ratio of 4 is dominated by the b phase, asrevealed by a very strong diffraction peak at 20.6� (inset in theblue curve in Fig. 4(A)). The draw velocity used was 3 mm min�1
and the draw ratio was the ratio of the nal and initial samplelength. Using the scheme in Fig. 1, one can also use the FTIRspectra in Fig. 4(B) to characterize these lms. First, the blackcurve in Fig. 4(B) has strong peaks at 614 and 763 cm�1 andshould be strong in a phase; the red curve has a good peak at1232 cm�1 and should be strong in g phase; and the blue curvehas a good peak at 1275 cm�1 and should be strong in b phase –these correspond very well with the XRD results. One can alsocheck some of the characteristic bands in the three curves inFig. 4(B) following the scheme in Fig. 1 for a, b and g phase,respectively, with good agreements. For example, the 447, 472and 1431 cm�1 bands all show up in the blue curve c in Fig. 4(B)as the strong supporting evidence for the b phase crystal. It isnoted that the 1234 cm�1 band also appears as a tiny peak in thisblue curve in Fig. 4(B), since the relaxation process (b/ g) oenoccurs in stretched PVDF samples.116 Interestingly, it is also notedthat the spin-coated PVDF lms have very similar XRD and FTIRspectra with those of the cast lms (Part I in ESI†).
Assignment of the 840* and 510* cm�1 bands
From the literature survey, the 840* and 510* cm�1 bands haveoen yielded conicting conclusions in assigning crystal
RSC Adv., 2017, 7, 15382–15389 | 15385
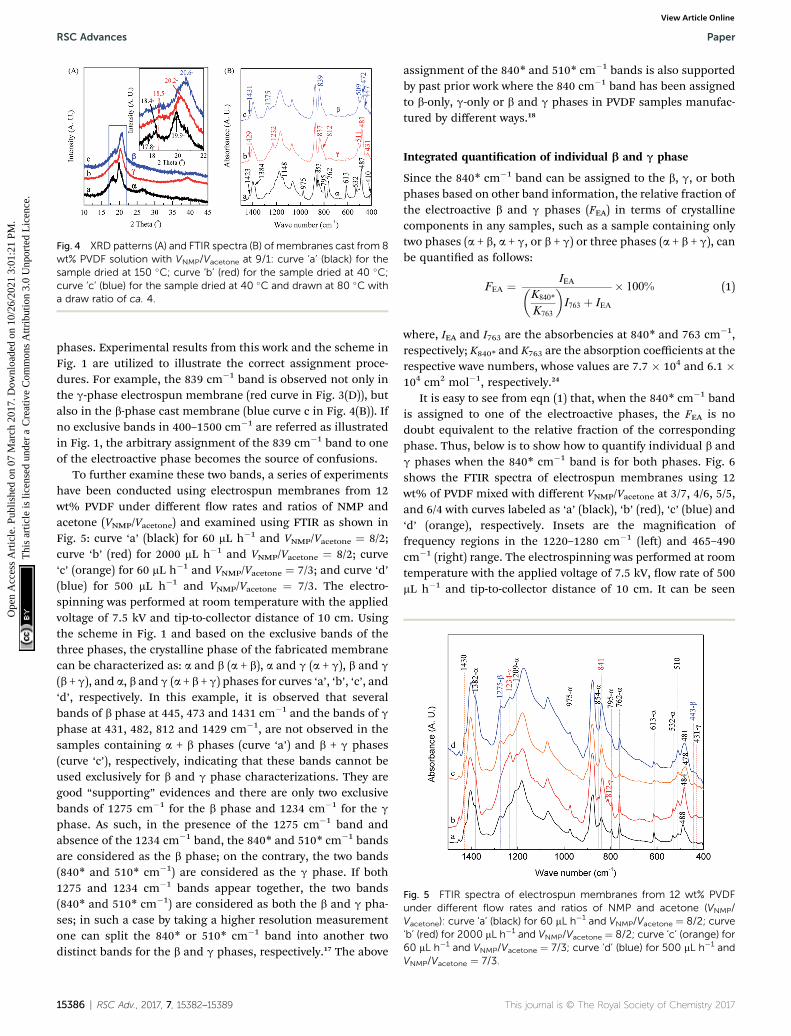
Fig. 4 XRD patterns (A) and FTIR spectra (B) of membranes cast from 8wt% PVDF solution with VNMP/Vacetone at 9/1: curve ‘a’ (black) for thesample dried at 150 �C; curve ‘b’ (red) for the sample dried at 40 �C;curve ‘c’ (blue) for the sample dried at 40 �C and drawn at 80 �C witha draw ratio of ca. 4.
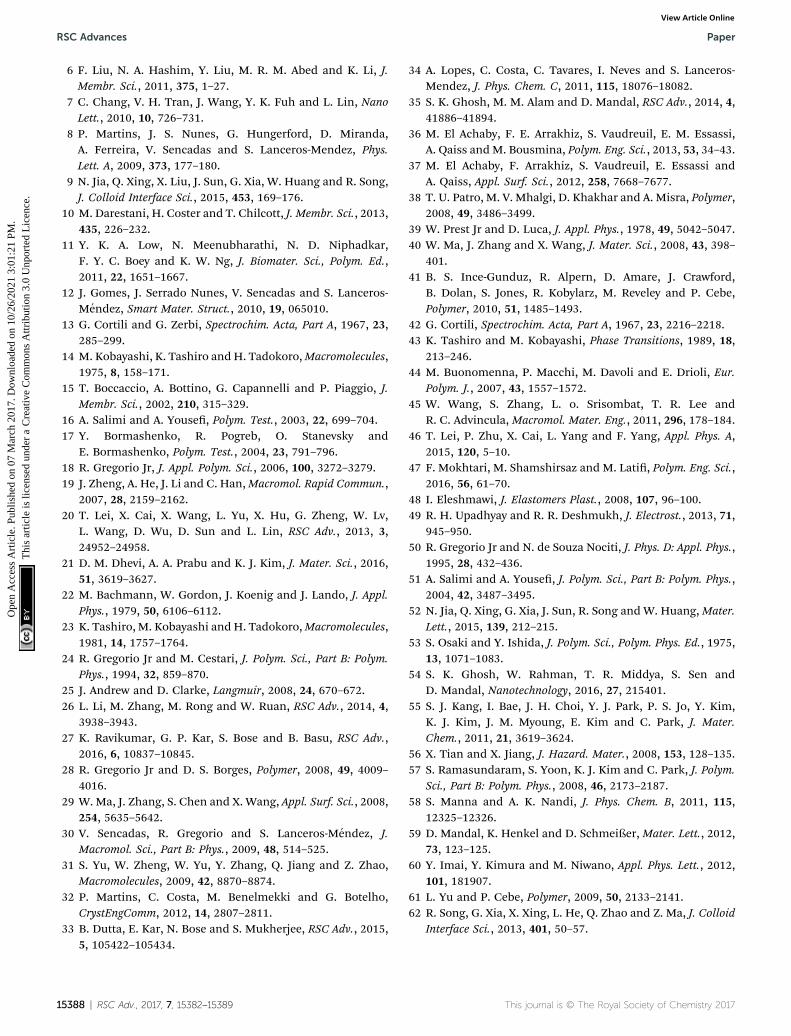
Fig. 5 FTIR spectra of electrospun membranes from 12 wt% PVDFunder different flow rates and ratios of NMP and acetone (VNMP/Vacetone): curve ‘a’ (black) for 60 mL h�1 and VNMP/Vacetone ¼ 8/2; curve‘b’ (red) for 2000 mL h�1 and VNMP/Vacetone ¼ 8/2; curve ‘c’ (orange) for60 mL h�1 and VNMP/Vacetone ¼ 7/3; curve ‘d’ (blue) for 500 mL h�1 and
RSC Advances Paper
Ope
n A
cces
s A
rtic
le. P
ublis
hed
on 0
7 M
arch
201
7. D
ownl
oade
d on
10/
26/2
021
3:01
:21
PM.
Thi
s ar
ticle
is li
cens
ed u
nder
a C
reat
ive
Com
mon
s A
ttrib
utio
n 3.
0 U
npor
ted
Lic
ence
.View Article Online
phases. Experimental results from this work and the scheme inFig. 1 are utilized to illustrate the correct assignment proce-dures. For example, the 839 cm�1 band is observed not only inthe g-phase electrospun membrane (red curve in Fig. 3(D)), butalso in the b-phase cast membrane (blue curve c in Fig. 4(B)). Ifno exclusive bands in 400–1500 cm�1 are referred as illustratedin Fig. 1, the arbitrary assignment of the 839 cm�1 band to oneof the electroactive phase becomes the source of confusions.
To further examine these two bands, a series of experimentshave been conducted using electrospun membranes from 12wt% PVDF under different ow rates and ratios of NMP andacetone (VNMP/Vacetone) and examined using FTIR as shown inFig. 5: curve ‘a’ (black) for 60 mL h�1 and VNMP/Vacetone ¼ 8/2;curve ‘b’ (red) for 2000 mL h�1 and VNMP/Vacetone ¼ 8/2; curve‘c’ (orange) for 60 mL h�1 and VNMP/Vacetone ¼ 7/3; and curve ‘d’(blue) for 500 mL h�1 and VNMP/Vacetone ¼ 7/3. The electro-spinning was performed at room temperature with the appliedvoltage of 7.5 kV and tip-to-collector distance of 10 cm. Usingthe scheme in Fig. 1 and based on the exclusive bands of thethree phases, the crystalline phase of the fabricated membranecan be characterized as: a and b (a + b), a and g (a + g), b and g
(b + g), and a, b and g (a + b + g) phases for curves ‘a’, ‘b’, ‘c’, and‘d’, respectively. In this example, it is observed that severalbands of b phase at 445, 473 and 1431 cm�1 and the bands of gphase at 431, 482, 812 and 1429 cm�1, are not observed in thesamples containing a + b phases (curve ‘a’) and b + g phases(curve ‘c’), respectively, indicating that these bands cannot beused exclusively for b and g phase characterizations. They aregood “supporting” evidences and there are only two exclusivebands of 1275 cm�1 for the b phase and 1234 cm�1 for the g
phase. As such, in the presence of the 1275 cm�1 band andabsence of the 1234 cm�1 band, the 840* and 510* cm�1 bandsare considered as the b phase; on the contrary, the two bands(840* and 510* cm�1) are considered as the g phase. If both1275 and 1234 cm�1 bands appear together, the two bands(840* and 510* cm�1) are considered as both the b and g pha-ses; in such a case by taking a higher resolution measurementone can split the 840* or 510* cm�1 band into another twodistinct bands for the b and g phases, respectively.17 The above
15386 | RSC Adv., 2017, 7, 15382–15389
assignment of the 840* and 510* cm�1 bands is also supportedby past prior work where the 840 cm�1 band has been assignedto b-only, g-only or b and g phases in PVDF samples manufac-tured by different ways.18
Integrated quantication of individual b and g phase
Since the 840* cm�1 band can be assigned to the b, g, or bothphases based on other band information, the relative fraction ofthe electroactive b and g phases (FEA) in terms of crystallinecomponents in any samples, such as a sample containing onlytwo phases (a + b, a + g, or b + g) or three phases (a + b + g), canbe quantied as follows:
FEA ¼ IEA�K840*
K763
�I763 þ IEA
� 100% (1)
where, IEA and I763 are the absorbencies at 840* and 763 cm�1,respectively; K840* and K763 are the absorption coefficients at therespective wave numbers, whose values are 7.7 � 104 and 6.1 �104 cm2 mol�1, respectively.24
It is easy to see from eqn (1) that, when the 840* cm�1 bandis assigned to one of the electroactive phases, the FEA is nodoubt equivalent to the relative fraction of the correspondingphase. Thus, below is to show how to quantify individual b andg phases when the 840* cm�1 band is for both phases. Fig. 6shows the FTIR spectra of electrospun membranes using 12wt% of PVDF mixed with different VNMP/Vacetone at 3/7, 4/6, 5/5,and 6/4 with curves labeled as ‘a’ (black), ‘b’ (red), ‘c’ (blue) and‘d’ (orange), respectively. Insets are the magnication offrequency regions in the 1220–1280 cm�1 (le) and 465–490cm�1 (right) range. The electrospinning was performed at roomtemperature with the applied voltage of 7.5 kV, ow rate of 500mL h�1 and tip-to-collector distance of 10 cm. It can be seen
VNMP/Vacetone ¼ 7/3.
This journal is © The Royal Society of Chemistry 2017
Paper RSC Advances
Ope
n A
cces
s A
rtic
le. P
ublis
hed
on 0
7 M
arch
201
7. D
ownl
oade
d on
10/
26/2
021
3:01
:21
PM.
Thi
s ar
ticle
is li
cens
ed u
nder
a C
reat
ive
Com
mon
s A
ttrib
utio
n 3.
0 U
npor
ted
Lic
ence
.View Article Online
from Fig. 6 that the b and g phases coexist in these samples, asevidenced by the simultaneous presence of the 1275 and 1234cm�1 bands. According to the inset gures, higher NMP/acetoneratio results in the increment and decrement of the absorptionintensities of the 1275 and 1234 cm�1 bands (le inset),respectively. A corresponding red shi from 479 to 475 cm�1
(from the closest g phase band of 482 cm�1 to the closestb phase band of 473 cm�1) is observed for the peaks in the rangeof 473–482 cm�1 (right inset). These observations reveal that thehigher absorption intensity of the 1275 and 1234 cm�1 bandsimplies more b and g crystals, respectively. Hence, the quanti-cation of individual b and g phases could be performed byusing the absorbance (peak area or peak height) of the twobands (1275 and 1234 cm�1). However, a much more preferablemethod is proposed by calculating the peak-to-valley heightratio (P2VHR) between the peaks around at 1275 and 1234 cm�1
and their nearest valleys (Part II in ESI†), as demonstrated inequations of (2a) and (2b), respectively.
FðbÞ ¼ FEA �
DHb0
DHb0 þ DHg0
!� 100% (2a)
FðgÞ ¼ FEA �
DHg0
DHb0 þ DHg0
!� 100% (2b)
where, DHb0 and DHg0 are the height differences (absorbancedifferences) between the peak around at 1275 cm�1 and thenearest valley around at 1260 cm�1, and the peak around at1234 cm�1 and the nearest valley around at 1225 cm�1,respectively.
Fig. 6 FTIR spectra of electrospun membranes using 12 wt% of PVDFmixed with different VNMP/Vacetone at 3/7, 4/6, 5/5, and 6/4 as labeledwith ‘a’, ‘b’, ‘c’ and ‘d’, respectively. Insets are the magnification offrequency regions in 1220–1280 cm�1 (left) and 465–490 cm�1 (right).The arrows in the left inset indicate the direction of an increase inabsorption.
This journal is © The Royal Society of Chemistry 2017
Based on eqn (1), (2a) and (2b), the relative fraction of theelectroactive b and g phases for all samples presented in themain article was calculated (Part III in ESI†). A very high fractionof the g phase, namely 99.3%, was obtained for sample inFig. 4(B)-curve b, while a lower but still comparatively highfraction of the b phase, namely 94.3%, was for sample inFig. 3(C)-curve c. These results indicate that by taking sometreatments on PVDF materials, high-performance PVDFmembranes with good electroactivities can be achieved forvarious applications.
Conclusions
The characteristic bands of the a, b and g phases in the 400–1500 cm�1 range have been determined by comparativelystudying and summarizing the FTIR vibrational bands fromreports published in the literature as well as new experimentalsamples characterized in this work. The characteristic bands ofa phase are around at 410, 489, 532, 614, 763, 795, 854, 975,1149, 1209, 1383 and 1423 cm�1, whereas characteristic bandsof the b and g phases are around at 445, 473, 1275 and 1431cm�1 and around at 431, 482, 811, 1234 and 1429 cm�1,respectively. One can differentiate the three phases by checkingthe bands around 763 and 614 cm�1 for the a phase; 1275 cm�1
for the b phase, and 1234 cm�1 for the g phase, respectively.Furthermore, the oen confused crystal phase characteriza-tions for the 840* and 510* cm�1 bands in prior publicationsare claried by checking the bands around at 1275 and 1234cm�1 to identify the existence of the b and g phases, respec-tively. Finally, an integrated procedure is demonstrated toquantify the content of electroactive phases by using the peak-to-valley height ratio (P2VHR) between the peaks around at1275 and 1234 cm�1 and their nearest valleys. This investigationprovides clear guidelines to solve the long-term problems in thephase characterizations of PVDF using FTIR, but also deliversa simple methodology to quantify individual b and g phase inPVDF polymers with multiple phases based on the FTIRspectrum.
Acknowledgements
This work was supported by the National Natural ScienceFoundation of China (No. 61404059 and U1505243), FujianNatural Science Foundation (No. 2015J01205), and the Projectfor Distinguished Young Scientists of Fujian Province.
References
1 H. Kawai, Jpn. J. Appl. Phys., 1969, 8, 975–976.2 A. Lovinger, Science, 1983, 220, 1115–1121.3 M. Li, H. J. Wondergem, M.-J. Spijkman, K. Asadi,I. Katsouras, P. W. Blom and D. M. de Leeuw, Nat. Mater.,2013, 12, 433–438.
4 P. Martins, A. C. Lopes and S. Lanceros-Mendez, Prog.Polym. Sci., 2014, 39, 683–706.
5 Z. Cui, N. T. Hassankiadeh, Y. Zhuang, E. Drioli andY. M. Lee, Prog. Polym. Sci., 2015, 51, 94–126.
RSC Adv., 2017, 7, 15382–15389 | 15387
RSC Advances Paper
Ope
n A
cces
s A
rtic
le. P
ublis
hed
on 0
7 M
arch
201
7. D
ownl
oade
d on
10/
26/2
021
3:01
:21
PM.
Thi
s ar
ticle
is li
cens
ed u
nder
a C
reat
ive
Com
mon
s A
ttrib
utio
n 3.
0 U
npor
ted
Lic
ence
.View Article Online
6 F. Liu, N. A. Hashim, Y. Liu, M. R. M. Abed and K. Li, J.Membr. Sci., 2011, 375, 1–27.
7 C. Chang, V. H. Tran, J. Wang, Y. K. Fuh and L. Lin, NanoLett., 2010, 10, 726–731.
8 P. Martins, J. S. Nunes, G. Hungerford, D. Miranda,A. Ferreira, V. Sencadas and S. Lanceros-Mendez, Phys.Lett. A, 2009, 373, 177–180.
9 N. Jia, Q. Xing, X. Liu, J. Sun, G. Xia, W. Huang and R. Song,J. Colloid Interface Sci., 2015, 453, 169–176.
10 M. Darestani, H. Coster and T. Chilcott, J. Membr. Sci., 2013,435, 226–232.
11 Y. K. A. Low, N. Meenubharathi, N. D. Niphadkar,F. Y. C. Boey and K. W. Ng, J. Biomater. Sci., Polym. Ed.,2011, 22, 1651–1667.
12 J. Gomes, J. Serrado Nunes, V. Sencadas and S. Lanceros-Mendez, Smart Mater. Struct., 2010, 19, 065010.
13 G. Cortili and G. Zerbi, Spectrochim. Acta, Part A, 1967, 23,285–299.
14 M. Kobayashi, K. Tashiro and H. Tadokoro,Macromolecules,1975, 8, 158–171.
15 T. Boccaccio, A. Bottino, G. Capannelli and P. Piaggio, J.Membr. Sci., 2002, 210, 315–329.
16 A. Salimi and A. Youse, Polym. Test., 2003, 22, 699–704.17 Y. Bormashenko, R. Pogreb, O. Stanevsky and
E. Bormashenko, Polym. Test., 2004, 23, 791–796.18 R. Gregorio Jr, J. Appl. Polym. Sci., 2006, 100, 3272–3279.19 J. Zheng, A. He, J. Li and C. Han,Macromol. Rapid Commun.,
2007, 28, 2159–2162.20 T. Lei, X. Cai, X. Wang, L. Yu, X. Hu, G. Zheng, W. Lv,
L. Wang, D. Wu, D. Sun and L. Lin, RSC Adv., 2013, 3,24952–24958.
21 D. M. Dhevi, A. A. Prabu and K. J. Kim, J. Mater. Sci., 2016,51, 3619–3627.
22 M. Bachmann, W. Gordon, J. Koenig and J. Lando, J. Appl.Phys., 1979, 50, 6106–6112.
23 K. Tashiro, M. Kobayashi and H. Tadokoro,Macromolecules,1981, 14, 1757–1764.
24 R. Gregorio Jr and M. Cestari, J. Polym. Sci., Part B: Polym.Phys., 1994, 32, 859–870.
25 J. Andrew and D. Clarke, Langmuir, 2008, 24, 670–672.26 L. Li, M. Zhang, M. Rong and W. Ruan, RSC Adv., 2014, 4,
3938–3943.27 K. Ravikumar, G. P. Kar, S. Bose and B. Basu, RSC Adv.,
2016, 6, 10837–10845.28 R. Gregorio Jr and D. S. Borges, Polymer, 2008, 49, 4009–
4016.29 W. Ma, J. Zhang, S. Chen and X. Wang, Appl. Surf. Sci., 2008,
254, 5635–5642.30 V. Sencadas, R. Gregorio and S. Lanceros-Mendez, J.
Macromol. Sci., Part B: Phys., 2009, 48, 514–525.31 S. Yu, W. Zheng, W. Yu, Y. Zhang, Q. Jiang and Z. Zhao,
Macromolecules, 2009, 42, 8870–8874.32 P. Martins, C. Costa, M. Benelmekki and G. Botelho,
CrystEngComm, 2012, 14, 2807–2811.33 B. Dutta, E. Kar, N. Bose and S. Mukherjee, RSC Adv., 2015,
5, 105422–105434.
15388 | RSC Adv., 2017, 7, 15382–15389
34 A. Lopes, C. Costa, C. Tavares, I. Neves and S. Lanceros-Mendez, J. Phys. Chem. C, 2011, 115, 18076–18082.
35 S. K. Ghosh, M. M. Alam and D. Mandal, RSC Adv., 2014, 4,41886–41894.
36 M. El Achaby, F. E. Arrakhiz, S. Vaudreuil, E. M. Essassi,A. Qaiss andM. Bousmina, Polym. Eng. Sci., 2013, 53, 34–43.
37 M. El Achaby, F. Arrakhiz, S. Vaudreuil, E. Essassi andA. Qaiss, Appl. Surf. Sci., 2012, 258, 7668–7677.
38 T. U. Patro, M. V. Mhalgi, D. Khakhar and A. Misra, Polymer,2008, 49, 3486–3499.
39 W. Prest Jr and D. Luca, J. Appl. Phys., 1978, 49, 5042–5047.40 W. Ma, J. Zhang and X. Wang, J. Mater. Sci., 2008, 43, 398–
401.41 B. S. Ince-Gunduz, R. Alpern, D. Amare, J. Crawford,
B. Dolan, S. Jones, R. Kobylarz, M. Reveley and P. Cebe,Polymer, 2010, 51, 1485–1493.
42 G. Cortili, Spectrochim. Acta, Part A, 1967, 23, 2216–2218.43 K. Tashiro and M. Kobayashi, Phase Transitions, 1989, 18,
213–246.44 M. Buonomenna, P. Macchi, M. Davoli and E. Drioli, Eur.
Polym. J., 2007, 43, 1557–1572.45 W. Wang, S. Zhang, L. o. Srisombat, T. R. Lee and
R. C. Advincula, Macromol. Mater. Eng., 2011, 296, 178–184.46 T. Lei, P. Zhu, X. Cai, L. Yang and F. Yang, Appl. Phys. A,
2015, 120, 5–10.47 F. Mokhtari, M. Shamshirsaz and M. Lati, Polym. Eng. Sci.,
2016, 56, 61–70.48 I. Eleshmawi, J. Elastomers Plast., 2008, 107, 96–100.49 R. H. Upadhyay and R. R. Deshmukh, J. Electrost., 2013, 71,
945–950.50 R. Gregorio Jr and N. de Souza Nociti, J. Phys. D: Appl. Phys.,
1995, 28, 432–436.51 A. Salimi and A. Youse, J. Polym. Sci., Part B: Polym. Phys.,
2004, 42, 3487–3495.52 N. Jia, Q. Xing, G. Xia, J. Sun, R. Song and W. Huang,Mater.
Lett., 2015, 139, 212–215.53 S. Osaki and Y. Ishida, J. Polym. Sci., Polym. Phys. Ed., 1975,
13, 1071–1083.54 S. K. Ghosh, W. Rahman, T. R. Middya, S. Sen and
D. Mandal, Nanotechnology, 2016, 27, 215401.55 S. J. Kang, I. Bae, J. H. Choi, Y. J. Park, P. S. Jo, Y. Kim,
K. J. Kim, J. M. Myoung, E. Kim and C. Park, J. Mater.Chem., 2011, 21, 3619–3624.
56 X. Tian and X. Jiang, J. Hazard. Mater., 2008, 153, 128–135.57 S. Ramasundaram, S. Yoon, K. J. Kim and C. Park, J. Polym.
Sci., Part B: Polym. Phys., 2008, 46, 2173–2187.58 S. Manna and A. K. Nandi, J. Phys. Chem. B, 2011, 115,
12325–12326.59 D. Mandal, K. Henkel and D. Schmeißer, Mater. Lett., 2012,
73, 123–125.60 Y. Imai, Y. Kimura and M. Niwano, Appl. Phys. Lett., 2012,
101, 181907.61 L. Yu and P. Cebe, Polymer, 2009, 50, 2133–2141.62 R. Song, G. Xia, X. Xing, L. He, Q. Zhao and Z. Ma, J. Colloid
Interface Sci., 2013, 401, 50–57.
This journal is © The Royal Society of Chemistry 2017
Paper RSC Advances
Ope
n A
cces
s A
rtic
le. P
ublis
hed
on 0
7 M
arch
201
7. D
ownl
oade
d on
10/
26/2
021
3:01
:21
PM.
Thi
s ar
ticle
is li
cens
ed u
nder
a C
reat
ive
Com
mon
s A
ttrib
utio
n 3.
0 U
npor
ted
Lic
ence
.View Article Online
63 D. Shah, P. Maiti, E. Gunn, D. F. Schmidt, D. D. Jiang,C. A. Batt and E. P. Giannelis, Adv. Mater., 2004, 16, 1173–1177.
64 G. Zhong, L. Zhang, R. Su, K. Wang, H. Fong and L. Zhu,Polymer, 2011, 52, 2228–2237.
65 M. M. Abolhasani, F. Zarejousheghani, Z. Cheng andM. Naebe, RSC Adv., 2015, 5, 22471–22479.
66 Y. Sui, W.-T. Chen, J.-J. Ma, R.-H. Hu and D.-S. Liu, RSCAdv., 2016, 6, 7364–7369.
67 S. Roy, P. Thakur, N. A. Hoque, B. Bagchi and S. Das, RSCAdv., 2016, 6, 21881–21894.
68 R. Gregorio and R. Capitao, J. Mater. Sci., 2000, 35, 299–306.69 Y. J. Park, Y. S. Kang and C. Park, Eur. Polym. J., 2005, 41,
1002–1012.70 J. H. Park, N. Kurra, M. AlMadhoun, I. N. Odeh and
H. N. Alshareef, J. Mater. Chem. C, 2015, 3, 2366–2370.71 S. Choi, J. Kim, Y. Ahn, S. Jo and E. Cairns, Chem. Mater.,
2007, 19, 104–115.72 M. Kanik, O. Aktas, H. S. Sen, E. Durgun and M. Bayindir,
ACS Nano, 2014, 8, 9311–9323.73 S. Yoon, A. Prabu, K. Kim and C. Park, Macromol. Rapid
Commun., 2008, 29, 1316–1321.74 Y. L. Liu, Y. Li, J. T. Xu and Z. Q. Fan, ACS Appl. Mater.
Interfaces, 2010, 2, 1759–1768.75 H. Pan, B. Na, R. Lv, C. Li, J. Zhu and Z. Yu, J. Polym. Sci.,
Part B: Polym. Phys., 2012, 50, 1433–1437.76 C.-L. Liang, Q. Xie, R.-Y. Bao, W. Yang, B.-H. Xie and
M.-B. Yang, J. Mater. Sci., 2014, 49, 4171–4179.77 Y. Peng and P. Wu, Polymer, 2004, 45, 5295–5299.78 C.-L. Liang, Z.-H. Mai, Q. Xie, R.-Y. Bao, W. Yang, B.-H. Xie
and M.-B. Yang, J. Phys. Chem. B, 2014, 118, 9104–9111.79 S. Janakiraman, A. Surendran, S. Ghosh, S. Anandhan and
A. Venimadhav, Solid State Ionics, 2016, 292, 130–135.80 Y. Xin, X. Qi, H. Tian, C. Guo, X. Li, J. Lin and C. Wang,
Mater. Lett., 2016, 164, 136–139.81 H. Zhang, P. Zhang, Z. Li, M. Sun, Y. Wu and H. Wu,
Electrochem. Commun., 2007, 9, 1700–1703.82 D. Dhakras, V. Borkar, S. Ogale and J. Jog, Nanoscale, 2012,
4, 752–756.83 H. Yu, T. Huang, M. Lu, M. Mao, Q. Zhang and H. Wang,
Nanotechnology, 2013, 24, 405401.84 P. Zhang, X. Zhao, X. Zhang, Y. Lai, X. Wang, J. Li, G. Wei
and Z. Su, ACS Appl. Mater. Interfaces, 2014, 6, 7563–7571.85 M. Benz, W. Euler and O. Gregory, Macromolecules, 2002,
35, 2682–2688.86 W. Zhou, X. Jiang, P. Wang and H. Wang, Fibers Polym.,
2013, 14, 100–104.87 N. A. Hashim, Y. Liu and K. Li, Chem. Eng. Sci., 2011, 66,
1565–1575.88 N. A. Hashim, Y. Liu and K. Li, Ind. Eng. Chem. Res., 2011,
50, 3035–3040.89 I. B. Rietveld, K. Kobayashi, T. Honjo, K. Ishida, H. Yamada
and K. Matsushige, J. Mater. Chem., 2010, 20, 8272–8278.
This journal is © The Royal Society of Chemistry 2017
90 B. Luo, X. Wang, Y. Wang and L. Li, J. Mater. Chem. A, 2014,2, 510–519.
91 M. Zhang, A. Q. Zhang, B. K. Zhu, C. H. Du and Y. Y. Xu, J.Membr. Sci., 2008, 319, 169–175.
92 I. B. Rietveld, K. Kobayashi, H. Yamada and K. Matsushige,So Matter, 2009, 5, 593–598.
93 R. A. Amoresi, A. A. Felix, E. R. Botero, N. L. Domingues,E. A. Falcao, M. A. Zaghete and A. W. Rinaldi, Ceram. Int.,2015, 41, 14733–14739.
94 D. Okada, H. Kaneko, K. Kato, S. Furumi, M. Takeguchi andY. Yamamoto, Macromolecules, 2015, 48, 2570–2575.
95 M. Sharma, G. Madras and S. Bose, Phys. Chem. Chem. Phys.,2014, 16, 14792–14799.
96 M. Benz andW. B. Euler, J. Appl. Polym. Sci., 2003, 89, 1093–1100.
97 X. He and K. Yao, Appl. Phys. Lett., 2006, 89, 112909.98 J. Andrew and D. Clarke, Langmuir, 2008, 24, 8435–8438.99 Y. Li, J.-Z. Xu, L. Zhu, G.-J. Zhong and Z.-M. Li, J. Phys. Chem.
B, 2012, 116, 14951–14960.100 W. Yee, M. Kotaki, Y. Liu and X. Lu, Polymer, 2007, 48, 512–
521.101 A. Baji, Y. W. Mai, Q. Li and Y. Liu, Nanoscale, 2011, 3,
3068–3071.102 S. Satapathy, S. Pawar, P. Gupta and K. B. R. Varma, Bull.
Mater. Sci., 2011, 34, 727–733.103 T. Lei, L. Yu, W. Lingyun, F. Yang and D. Sun, J. Macromol.
Sci., Part B: Phys., 2015, 54, 91–101.104 S. K. Karan, D. Mandal and B. B. Khatua, Nanoscale, 2015, 7,
10655–10666.105 L. T. Beringer, X. Xu, W. Shih, W.-H. Shih, R. Habas and
C. L. Schauer, Sens. Actuators, A, 2015, 222, 293–300.106 P. Thakur, A. Kool, B. Bagchi, N. A. Hoque, S. Das and
P. Nandy, Phys. Chem. Chem. Phys., 2015, 17, 13082–13091.107 B. Mohammadi, A. A. Youse and S. M. Bellah, Polym. Test.,
2007, 26, 42–50.108 Y. K. A. Low, L. Y. Tan, L. P. Tan, F. Y. C. Boey and K. W. Ng,
J. Appl. Polym. Sci., 2013, 128, 2902–2910.109 Y. Li, S. Tang, M.-W. Pan, L. Zhu, G.-J. Zhong and Z.-M. Li,
Macromolecules, 2015, 48, 8565–8573.110 T. Lei, Z. Zhan, W. Zuo, W. Cheng, B. Xu, Y. Su and D. Sun,
Int. J. Nanomanuf., 2012, 8, 294–305.111 D. Esterly and B. Love, J. Polym. Sci., Part B: Polym. Phys.,
2004, 42, 91–97.112 R. Hasegawa, Y. Takahashi, Y. Chatani and H. Tadokoro,
Polym. J., 1972, 3, 600–610.113 X. Cai, X. Huang, Z. Zheng, J. Xu, X. Tang and T. Lei, J.
Macromol. Sci., Part B: Phys., 2017, 57, 75–82.114 G. Davis, J. McKinney, M. Broadhurst and S. Roth, J. Appl.
Phys., 1978, 49, 4998–5002.115 T. Lei, L. Yu, G. Zheng, L. Wang, D. Wu and D. Sun, J. Mater.
Sci., 2015, 50, 4342–4347.116 J. Miao, R. S. Bhatta, D. H. Reneker, M. Tsige and
P. L. Taylor, Polymer, 2015, 56, 482–489.
RSC Adv., 2017, 7, 15382–15389 | 15389