CHAPTER 7 BLENDS OF POLY ( εεεε-CAPROLACTONE) AND ...
44
Chapter 7 Blends of PCL and Intermediate Molar Mass PS 160 CHAPTER 7 BLENDS OF POLY (ε-CAPROLACTONE) AND INTERMEDIATE MOLAR MASS POLYSTYRENE AS LANGMUIR FILMS AT THE AIR/WATER INTERFACE Most of this chapter is reproduced with permission from: Li, B.; Esker, A. R. “Blends of Poly(ε-caprolactone) and Intermediate Molar Mass Polystyrene as Langmuir Films at the Air/Water Interface,” Langmuir 2007, 23, 574. Copyright 2007, American Chemical Society. 7.1. Abstract Poly(ε-caprolactone)/polystyrene (PCL/PS) blends, where non-amphiphilic PS is glassy in the bulk state at the experimental temperature of 22.5 °C, are immiscible as Langmuir films at the air/water (A/W) interface. Surface pressure-area per monomer (Π- A) isotherm analyses indicate that the surface concentration of amphiphilic PCL is the only factor influencing the surface pressure below the collapse transition. For PS-rich blends, Brewster angle microscopy (BAM) studies at the A/W interface and atomic force microscopy (AFM) studies on Langmuir-Schaefer films reveal that PS nanoparticle aggregates formed at very low surface pressures can form networks upon further compression. The morphologies seen in PS-rich blends (networklike rings) are consistent with a recent study of a non-amphiphilic polyhedral oligomeric silsesquioxane (POSS), octaisobutyl-POSS, blended with amphiphilic poly(dimethylsiloxane) (PDMS),
Transcript of CHAPTER 7 BLENDS OF POLY ( εεεε-CAPROLACTONE) AND ...
Chapter 7 Blends of PCL and Intermediate Molar Mass PS
160
CHAPTER 7
BLENDS OF POLY (εεεε-CAPROLACTONE) AND INTERMEDIATE
MOLAR MASS POLYSTYRENE AS LANGMUIR FILMS AT THE
AIR/WATER INTERFACE
Most of this chapter is reproduced with permission from: Li, B.; Esker, A. R. “Blends of
Poly(ε-caprolactone) and Intermediate Molar Mass Polystyrene as Langmuir Films at the
Air/Water Interface,” Langmuir 2007, 23, 574. Copyright 2007, American Chemical
Society.
7.1. Abstract
Poly(ε-caprolactone)/polystyrene (PCL/PS) blends, where non-amphiphilic PS is
glassy in the bulk state at the experimental temperature of 22.5 °C, are immiscible as
Langmuir films at the air/water (A/W) interface. Surface pressure-area per monomer (Π-
A) isotherm analyses indicate that the surface concentration of amphiphilic PCL is the
only factor influencing the surface pressure below the collapse transition. For PS-rich
blends, Brewster angle microscopy (BAM) studies at the A/W interface and atomic force
microscopy (AFM) studies on Langmuir-Schaefer films reveal that PS nanoparticle
aggregates formed at very low surface pressures can form networks upon further
compression. The morphologies seen in PS-rich blends (networklike rings) are consistent
with a recent study of a non-amphiphilic polyhedral oligomeric silsesquioxane (POSS),
octaisobutyl-POSS, blended with amphiphilic poly(dimethylsiloxane) (PDMS),
Chapter 7 Blends of PCL and Intermediate Molar Mass PS
161
suggesting that the non-amphiphilic PS aggregates at the A/W interface produce domains
with dipole densities that differ from pure PCL. In all composition regimes, the
amphiphilic PCL phase tends to spread and form a continuous surface layer at the A/W
interface, while simultaneously improving the dispersion of non-amphiphilic PS domains.
During film expansion, BAM images show a gradual change in the surface morphology
from highly continuous networklike structures (PS-rich blends) to broken ringlike
structures (intermediate composition) to small discontinuous aggregates (PCL-rich
blends). This study provides valuable information on the morphological evolution of
semicrystalline PCL-based polymer blends confined in a “two-dimensional” geometry at
the A/W interface and fundamental insight into the influence of microstructure (domain
size, phase-separated structures, crystalline morphology, etc.) on the interfacial properties
of the blends as Langmuir films.
7.2. Introduction
Polyester-based polymer blends have attracted considerable attention for improving
the properties of composite materials because of their potential applications as coatings
and drug delivery systems.177-184 High performance polyester-based polymer blends
exhibit interesting morphologies compared to homopolymers because of the
micro/nanostructures generated during phase separation.185-188 In particular, the
morphological features of binary immiscible polymer blends can be controlled through
the blend's composition and processing conditions.185-193 At extreme volume fractions,
dispersed-droplets of the minor phase within a matrix of the major phase is the normal
morphology. When the volume fraction of the dispersed phase is increased,
interconnected co-continuous biphasic microstructures form for a certain range of
compositions.189, 191 For example, an interconnected porous template of poly(L-lactic
Chapter 7 Blends of PCL and Intermediate Molar Mass PS
162
acid) (PLLA) can be made by the selective extraction of the poly(ε-caprolactone) (PCL)
component in a co-continuous mixture of PLLA/PCL produced via melt-processing.185
Recent investigations of PLLA/polystyrene (PLLA/PS) blends have also shown that a
biphasic continuous morphology is observed in the composition range of ~ 40 to 80
volume% PS.191 Sarazin et al. also examined the influence of temperature on the co-
continuous morphologies in immiscible PCL/PS blends prepared by melt mixing.189
Their results indicate that the composition ranges for co-continuous microstructures are
50-65 volume% PS at 230 °C and 30 to 70 volume% PS at 155 °C. The mixing
temperature has little effect on the microstructure at lower volume fractions, while
temperature-induced coalescence becomes a dominant factor in the evolution of the
biphasic morphology when the volume fraction of PS is increased above 30 volume%.189
Furthermore, studies on spincoated thin films reveal that specific polymer-substrate
interactions can significantly affect the morphologies and physical properties of blend
materials.8-23, 194-198 Recently, Qi et al. reported the morphological evolution of PCL/PS
spincoated films prepared from tetrahydrofuran (THF).194 The morphological features of
the blend film are governed by the composition ratio at the early stages of annealing,
however; with further annealing the PCL-rich phase always becomes the continuous
phase even if it is the minor component. This observation is attributed to the fact that the
PS tends to segregate and form a dewetted layer on top of PCL because of its lower
surface energy, while PCL tends to wet the glass substrate.
Previous studies on weakly compatible bulk blends of PCL and oligomeric PS
demonstrate an upper critical solution temperature (UCST) type phase diagram with a
critical composition at a PCL composition of ~ 20 volume%.85-89 For this system, the
binodal line could not be precisely defined at temperatures below the melting curve of
Chapter 7 Blends of PCL and Intermediate Molar Mass PS
163
PCL because the phase separation process is coupled with the crystallization of
semicrystalline PCL. As a result, new types of spherulitic PCL crystals were observed.
These features arose from the competition between nonequilibrium crystallization and
phase separation.
Although many interesting studies on PCL-based blends in bulk or spincoated films
have been reported because of their tailored biocompatibility and biodegradability,75, 76
little is known about the morphologies that develop within a “two dimensional” (2D)
confined dynamic field. In particular, the shear stresses and conformational constraints
placed on blends in Langmuir films during compression could potentially be used to
regulate the surface morphologies of semicrystalline PCL, leading to dramatically
different microstructures at the A/W interface. Furthermore, the morphological features
such as size, size distribution, and the microstructures of the semicrystalline and
amorphous phases are all important for controlling the physical properties of blend films.
Considering the presence of hydrophilic/hydrophobic interfaces in many biological
systems,163 fundamental studies of PCL-based polymer blends performed at the A/W
interface can provide valuable information about the interfacial phase behavior of blends
to further guide their biomedical applications. Only a few published results show that
pure PCL forms uniform Langmuir monolayers at low surface concentrations.24, 26, 75, 163
Upon compression past the “collapse” transition of PCL monolayers, the nucleation and
growth of crystals occurs, making the system particularly suitable for studying surface
pressure induced crystallization and testing models for crystallization kinetics in thin
films.24, 26 However, to the best of our knowledge, the PCL/PS blends in this chapter and
PCL/PtBA blends is Chapters 5 and 6 were the first to examine the interfacial behavior
Chapter 7 Blends of PCL and Intermediate Molar Mass PS
164
and morphological evolution of semicrystalline PCL-based polymer blends at the A/W
interface.
In this chapter, the compatibility of amorphous intermediate molar mass PS and
semicrystalline PCL mixed Langmuir films at various blend ratios are quantitatively
investigated through surface pressure-area per monomer (Π-A) isotherm studies by the
Wilhelmy plate technique. Hydrophobic PS with very low surface energy does not form
stable monomer-thick films at the air/water (A/W) interface.199-202 Intermediate molar
mass PS samples used in this study refer to PS samples of weight average molar mass
from Mw = 1.56 to at least 217 kg·mol-1 with bulk glass transition temperatures (Tg)
above the experimental temperature of T = 22.5 °C. Evolving biphasic morphologies for
a series of mixed PCL/PS films are simultaneously observed by Brewster angle
microscopy (BAM) during hysteresis experiments. Langmuir-Schaefer (LS) films for
key morphologies are characterized by atomic force microscopy (AFM). At the end of
this chapter, in situ BAM studies of PCL/liquid PS (Mw = 0.74 kg·mol-1) oligomer blends
as Langmuir films are also provided to compare to the morphological features of
PCL/glassy PS blends.
7.3. Results and Discussion
7.3.1. Compression ΠΠΠΠ-A Isotherm Studies of PCL and PS Langmuir Films
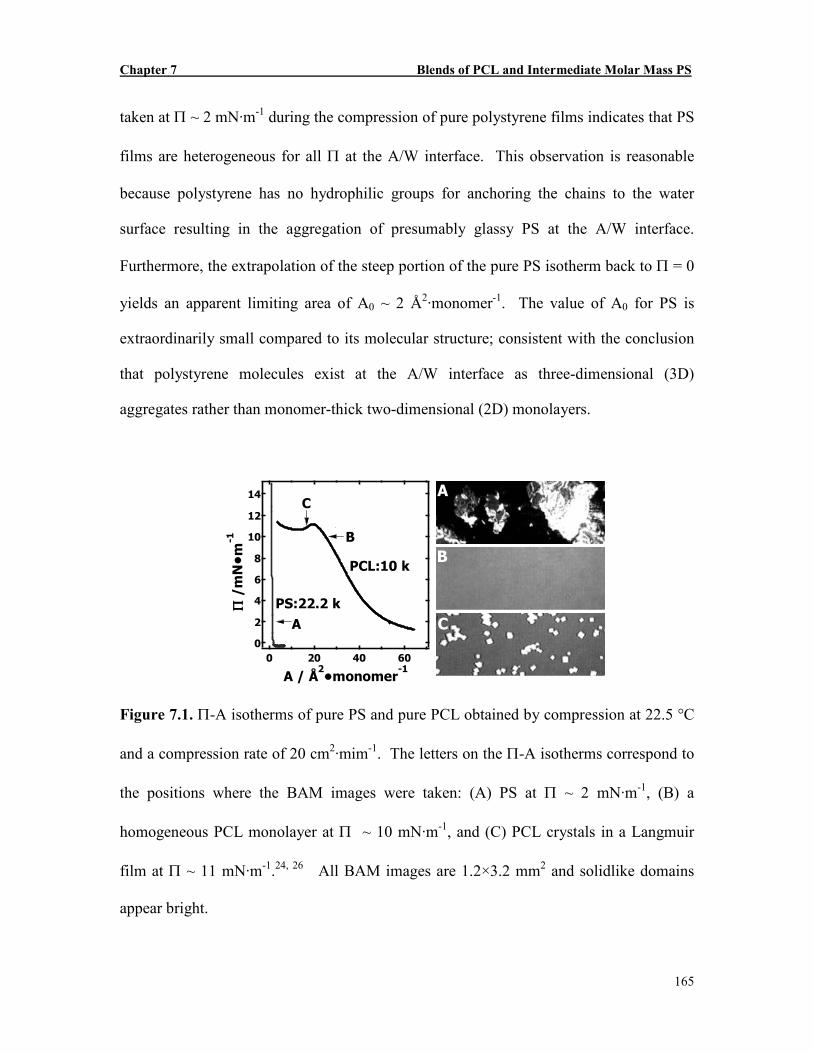
Isotherms in Figure 7.1 show plots of surface pressure, Π, as a function of area per
monomer, A, for PS (Mw = 22.2 kg·mol-1) and PCL (Mw = 10 kg·mol-1). The isotherms
were obtained by compression at T = 22.5 °C and a compression rate of 20 cm2·min-1.
The shape of the isotherm for pure PS is consistent with previous reports.24, 26 After
spreading the PS solution on the water surface, PS molecules immediately aggregate and
form irregular islands upon further compression. The BAM micrograph in Figure 7.1A
Chapter 7 Blends of PCL and Intermediate Molar Mass PS
165
taken at Π ~ 2 mN·m-1 during the compression of pure polystyrene films indicates that PS
films are heterogeneous for all Π at the A/W interface. This observation is reasonable
because polystyrene has no hydrophilic groups for anchoring the chains to the water
surface resulting in the aggregation of presumably glassy PS at the A/W interface.
Furthermore, the extrapolation of the steep portion of the pure PS isotherm back to Π = 0
yields an apparent limiting area of A0 ~ 2 Å2·monomer-1. The value of A0 for PS is
extraordinarily small compared to its molecular structure; consistent with the conclusion
that polystyrene molecules exist at the A/W interface as three-dimensional (3D)
aggregates rather than monomer-thick two-dimensional (2D) monolayers.
C
B
A14
12
10
8
6
4
2
0
Π
Π
Π
Π /mN•m
-1
6040200
A / Å2•monomer
-1
A
B
C
PS:22.2 k
PCL:10 k
Figure 7.1. Π-A isotherms of pure PS and pure PCL obtained by compression at 22.5 °C
and a compression rate of 20 cm2·mim-1. The letters on the Π-A isotherms correspond to
the positions where the BAM images were taken: (A) PS at Π ~ 2 mN·m-1, (B) a
homogeneous PCL monolayer at Π ~ 10 mN·m-1, and (C) PCL crystals in a Langmuir
film at Π ~ 11 mN·m-1.24, 26 All BAM images are 1.2×3.2 mm2 and solidlike domains
appear bright.
Chapter 7 Blends of PCL and Intermediate Molar Mass PS
166
The isotherm for PCL in Figure 7.1 is in good agreement with those reported in the
literature.24, 26, 163 At the A/W interface, PCL forms a homogeneous liquidlike monolayer
with A0 ~ 52 Å2·monomer-1. BAM studies for the pure PCL sample show the monolayer
is homogeneous for Π < ~10 mN·m-1. On the basis of the static elasticity,
( )TS AA ∂Π∂−== −1κε as discussed in Chapter 4 and its scaling behavior,166, 171, 173 the
A/W interface is a good solvent for PCL and PCL forms a liquid-expanded monolayer.
The amphiphilic nature of PCL molecules arises from carbonyl groups capable of
adsorbing onto the water subphase interspersed with segments composed of five
hydrophobic methylene groups that prevent dissolution of the molecules.24, 26 Previous
studies have shown that nucleation sites form in a supersaturated liquid-expanded phase
at a surface pressure slightly lower than the onset of the collapse transition (ΠC ~ 11
mN·m-1 for PCL with MW = 10 kg·mol-1).24 Following nucleation, the cusp and plateau in
the compression isotherm of a pure PCL monolayer correspond to the transport of PCL
chains from the monolayer to the faces of crystallizing lamellae. Figure 7.1C is a BAM
image taken at Π ~ 11 mN·m-1 during compression past the collapse point, where the
bright domains are the growing PCL crystals. Upon further compression in the plateau
region, the crystals grow larger.24
7.3.2. Compression ΠΠΠΠ-<A> Isotherm Studies of PCL/PS Blends as Langmuir Films
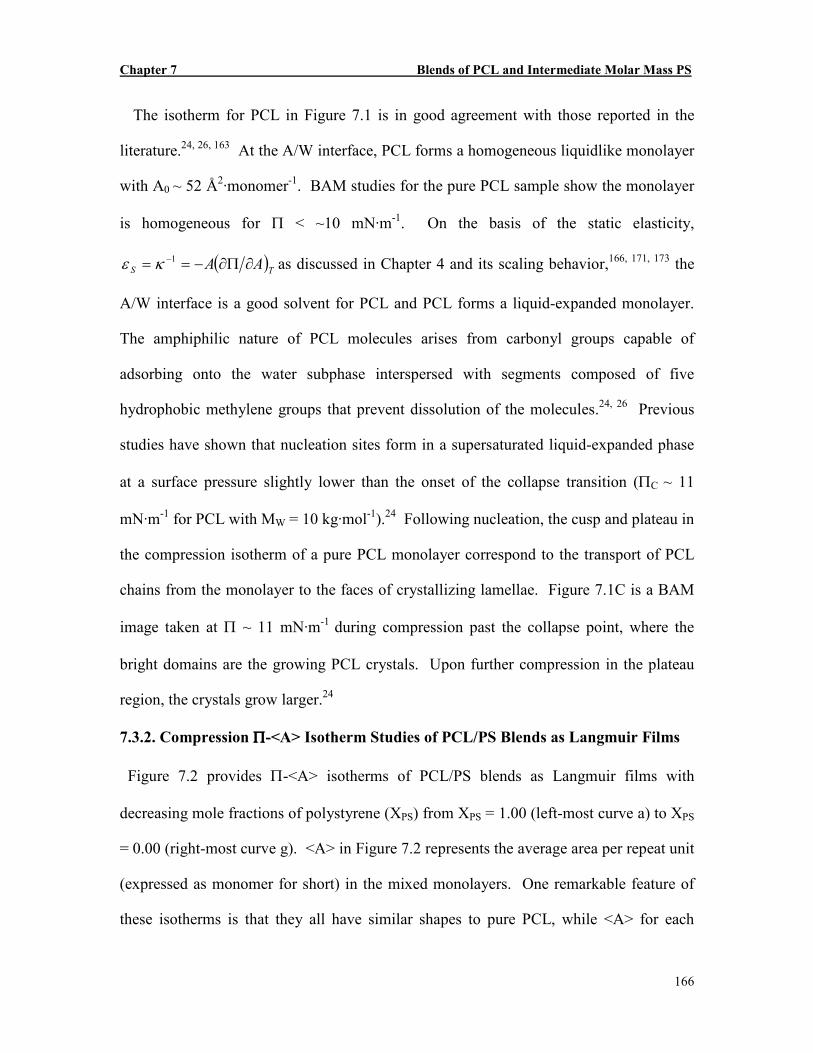
Figure 7.2 provides Π-<A> isotherms of PCL/PS blends as Langmuir films with
decreasing mole fractions of polystyrene (XPS) from XPS = 1.00 (left-most curve a) to XPS
= 0.00 (right-most curve g). <A> in Figure 7.2 represents the average area per repeat unit
(expressed as monomer for short) in the mixed monolayers. One remarkable feature of
these isotherms is that they all have similar shapes to pure PCL, while <A> for each
Chapter 7 Blends of PCL and Intermediate Molar Mass PS
167
isotherm shows a gradual shift to smaller values for comparable Π as the composition
shifts from pure PCL to pure PS. The qualitative behavior of these isotherms in the
monolayer regime is very different from a recent study with another blend system,
amphiphilic poly(dimethylsiloxane) (PDMS) with a non-amphiphilic polyhedral
oligomeric silsesquioxane (POSS), octaisobutyl-POSS.48(g) At first glance, the
octaisobutyl-POSS/PDMS system should be very similar to the PCL/PS system where the
bulk Tg for PS is above room temperature for several reasons: (1) PS, like octaisobutyl-
POSS, is non-amphiphilic and forms large aggregates at all A values; and (2) PCL, like
PDMS is amphiphilic at the A/W interface. The big difference between the PCL/PS and
octaisobutyl-POSS/PDMS system is the analogous plot to Figure 7.2 in the octaisobutyl-
POSS/PDMS system.48(g) Adding octaisobutyl-POSS to PDMS has no effect on the Π-
<A> isotherm.48(g) PDMS disperses octaisobutyl-POSS in the film, i.e. octaisobutyl-
POSS behaves as a 2D filler. Given the fact that Π-<A> isotherms for PCL/PS blends
shift to smaller <A> with increasing wt% PS and knowing that smaller <A> are not
physically realistic for a monomer-thick film, a different approach from the traditional
analysis in terms of area additivity used in Chapter 5 for PCL/PtBA blends is required.
Chapter 7 Blends of PCL and Intermediate Molar Mass PS
168
14
12
10
8
6
4
2
0
Π
Π
Π
Π /mN•m
-1
6040200
<A> / Å2•monomer
-1
a
bc d
ef
g
(A)
12
11
10
ΠΠ ΠΠc /m
N•m
-1
1.00.80.60.40.20.0XPS
(B)
Figure 7.2. (A) Π-<A> compression isotherms for various PCL/PS blends obtained at
22.5 °C and a compression rate of 20 cm2·min-1. Letters on this figure correspond to the
isotherms of PCL/PS blends with XPS = (a) 1.00 (pure PS), (b) 0.81, (c) 0.69, (d) 0.65,
(e) 0.34, (f) 0.13, and (g) 0.00 (pure PCL). (B) A ΠC-XPS graph is provided to clarify the
weak composition dependence of the collapse transition for PCL. The error bars of ± 0.2
mN·m-1 indicate the uncertainty of the surface pressure measurements by the Wilhelmy
plate technique with the plate and surface pressure sensor used in this study.
Chapter 7 Blends of PCL and Intermediate Molar Mass PS
169
14
12
10
8
6
4
2
0
Π
Π
Π
Π /mN•m
-1
100806040200
APCL / Å2•monomer
-1
XPS ~ 0.81
XPS ~ 0.69
XPS ~ 0.65
XPS ~ 0.34
XPS ~ 0.13
PS
PCL
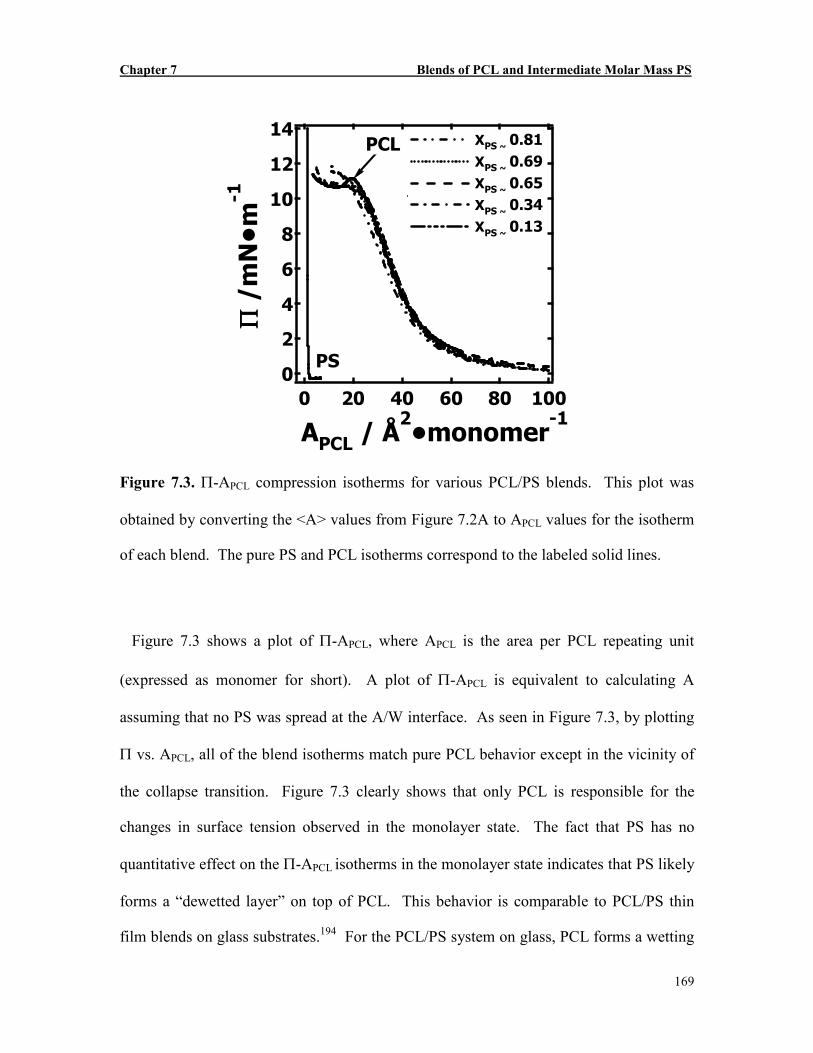
Figure 7.3. Π-APCL compression isotherms for various PCL/PS blends. This plot was
obtained by converting the <A> values from Figure 7.2A to APCL values for the isotherm
of each blend. The pure PS and PCL isotherms correspond to the labeled solid lines.
Figure 7.3 shows a plot of Π-APCL, where APCL is the area per PCL repeating unit
(expressed as monomer for short). A plot of Π-APCL is equivalent to calculating A
assuming that no PS was spread at the A/W interface. As seen in Figure 7.3, by plotting
Π vs. APCL, all of the blend isotherms match pure PCL behavior except in the vicinity of
the collapse transition. Figure 7.3 clearly shows that only PCL is responsible for the
changes in surface tension observed in the monolayer state. The fact that PS has no
quantitative effect on the Π-APCL isotherms in the monolayer state indicates that PS likely
forms a “dewetted layer” on top of PCL. This behavior is comparable to PCL/PS thin
film blends on glass substrates.194 For the PCL/PS system on glass, PCL forms a wetting
Chapter 7 Blends of PCL and Intermediate Molar Mass PS
170
layer on the glass substrate, while a dewet layer of PS forms on top of PCL because of its
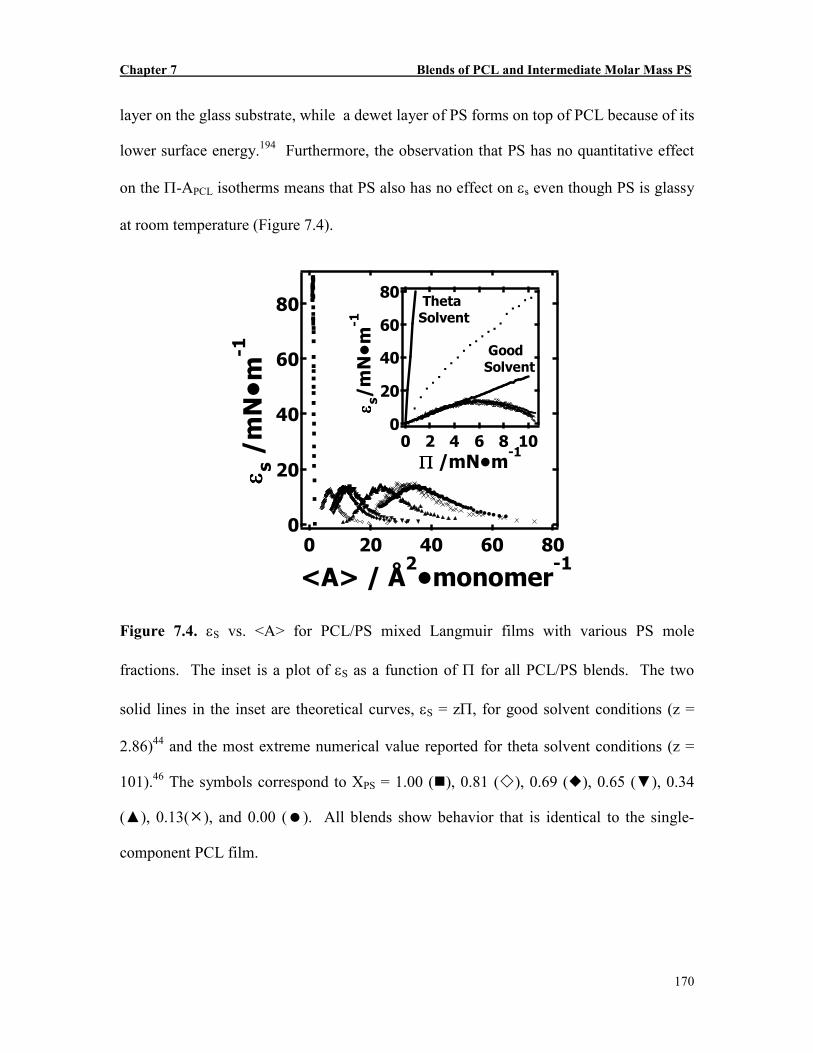
lower surface energy.194 Furthermore, the observation that PS has no quantitative effect
on the Π-APCL isotherms means that PS also has no effect on εs even though PS is glassy
at room temperature (Figure 7.4).
80
60
40
20
0
εε εεs /m
N•m
-1
806040200
<A> / Å2•monomer
-1
80
60
40
20
0
εε εεs/mN•m
-1
1086420Π Π Π Π /mN•m
-1
ThetaSolvent
GoodSolvent
Figure 7.4. εS vs. <A> for PCL/PS mixed Langmuir films with various PS mole
fractions. The inset is a plot of εS as a function of Π for all PCL/PS blends. The two
solid lines in the inset are theoretical curves, εS = zΠ, for good solvent conditions (z =
2.86)44 and the most extreme numerical value reported for theta solvent conditions (z =
101).46 The symbols correspond to XPS = 1.00 (�), 0.81 (�), 0.69 (�), 0.65 (▼), 0.34
(▲), 0.13(�), and 0.00 (�). All blends show behavior that is identical to the single-
component PCL film.
Chapter 7 Blends of PCL and Intermediate Molar Mass PS
171
Even though PS has no effect on the monolayer state, PCL/PS blends do show small
variations in the vicinity of the film's collapse transition as seen in Figures 7.2 and 7.3.
At Π > ~10 mN·m-1, all isotherms of the mixed films show qualitatively similar collapse
behavior followed by a short plateau regime like pure PCL. Previous studies have shown
that ΠC ~11 mN·m-1 is a characteristic feature of a pure PCL (Mw = 10 kg·mol-1)
monolayer at T = 22.5 °C and corresponds to the nucleation and growth of PCL crystals
in Langmuir films.24, 26 Figure 7.2B shows a plot of the onset pressure for ΠC as a
function of XPS at a compression rate of 20 cm2·min-1. A weak composition-dependence
of ΠC for PCL/PS blend films is observed. At XPS < ~ 0.34, the dispersed PS aggregates
could provide more sites for heterogeneous nucleation of PCL in the blend films,
resulting in a slightly smaller ΠC. With further increases in XPS from 0.34 to 0.81, the
onset of the collapse transition increases to ΠC ~12 mN·m-1. However, the metastable
regime, 9 < Π < 12 mN·m-1, still falls in the crystallization window for pure PCL
Langmuir films.24, 26 This fact indicates that the collapse transition for PCL in the blend
films is not dramatically changed by adding PS, even though the nucleation rate and
mechanism (homogeneous vs. heterogeneous) may differ from that of pure PCL. The
above discussion has focused on how PS affects the thermodynamic properties of PCL at
the A/W interface. To further understand the phase behavior of PCL/PS blends, the
morphologies of mixed Langmuir films also need to be considered.
Chapter 7 Blends of PCL and Intermediate Molar Mass PS
172
7.3.3. Morphological Studies of PCL/PS Blends as Langmuir Films During
Compression
In the previous section, Π-APCL isotherm studies indicated that the addition of non-
amphiphilic PS to PCL had no dramatic effects on the isotherms. In this section, BAM is
used to examine the in situ morphologies of this blend system.
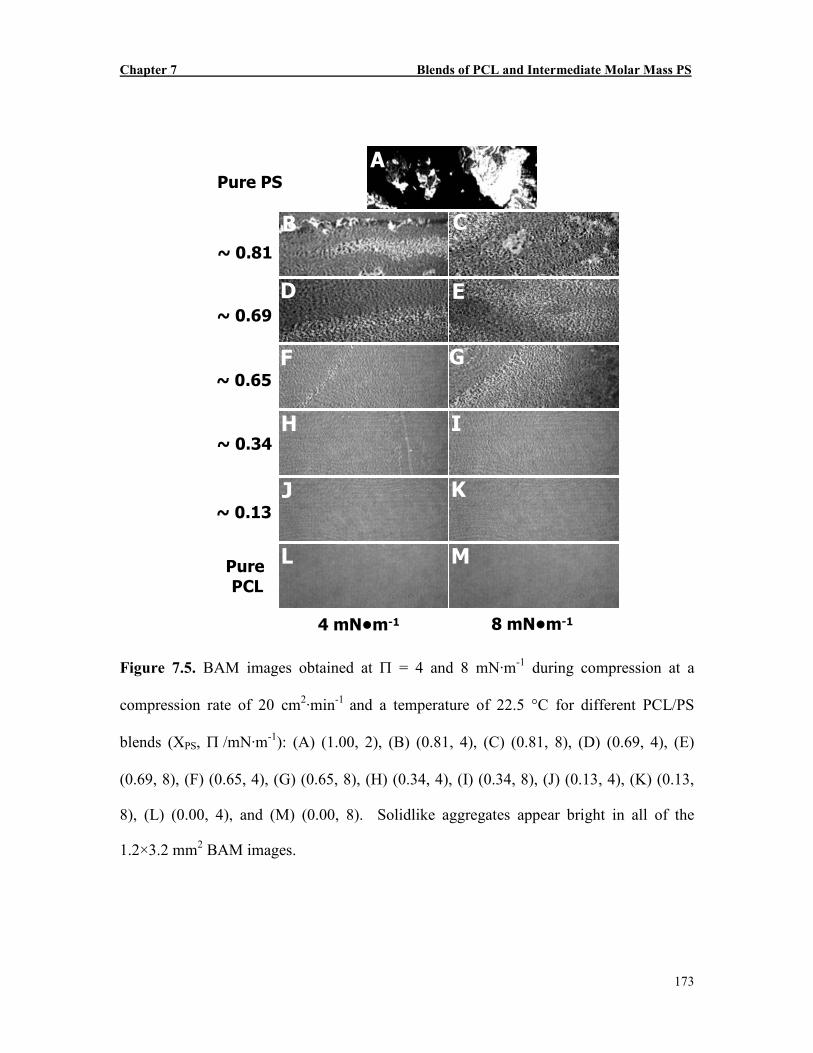
Figure 7.5 shows representative BAM images for various PCL/PS blend compositions
obtained at constant Π values of 4 and 8 mN·m-1 during compression at 20 cm2·min-1.
Figure 7.5A shows the large solidlike aggregates of pure PS formed at the A/W interface.
In contrast, BAM images of PCL, the film-forming component in this blend system, show
uniform liquidlike films at both 4 and 8 mN·m-1 (Figure 7.5L and M). The addition of a
small amount of PCL to PS (XPS ~ 0.81) dramatically changes the surface morphologies
relative to pure PS as seen in Figure 7.5B and C. The morphologies in these images
appear to contain smaller aggregates with more regular sizes. At Π ~ 4 mN·m-1 for the
XPS ~ 0.81 blend (Figure 7.5B), the homogeneously distributed PS aggregates are
observed to coexist with some larger PS domains. Compressing this blend film to Π ~ 8
mN·m-1 leads to a higher density of the aggregates (Figure 7.5C). By systematically
decreasing the PS content from XPS ~ 0.81 to ~ 0.34, BAM images show similar
morphological features, however; the uniformity of the aggregates increases and their
density decreases as shown in Figure 7.5D through I. When the content of PS decreases
to XPS ~ 0.13 or lower, the surface morphologies become more homogeneous as seen in
Figure 7.5J and K.
Chapter 7 Blends of PCL and Intermediate Molar Mass PS
173
4 mN•m-1 8 mN•m-1
B C
APure PS
~ 0.81
Pure PCL
~ 0.65
~ 0.34
~ 0.13
~ 0.69D E
F G
H I
J K
L M
Figure 7.5. BAM images obtained at Π = 4 and 8 mN·m-1 during compression at a
compression rate of 20 cm2·min-1 and a temperature of 22.5 °C for different PCL/PS
blends (XPS, Π /mN·m-1): (A) (1.00, 2), (B) (0.81, 4), (C) (0.81, 8), (D) (0.69, 4), (E)
(0.69, 8), (F) (0.65, 4), (G) (0.65, 8), (H) (0.34, 4), (I) (0.34, 8), (J) (0.13, 4), (K) (0.13,
8), (L) (0.00, 4), and (M) (0.00, 8). Solidlike aggregates appear bright in all of the
1.2×3.2 mm2 BAM images.
Chapter 7 Blends of PCL and Intermediate Molar Mass PS
174
On the basis of the BAM images in Figure 7.5, the immiscible PCL/PS blends that
form at the A/W interface before compression, are comprised of strongly hydrophobic PS
domains where the PS is most likely in a solidlike state. In order to better understand the
morphology of the PS aggregates formed upon compression, AFM was used to image
LS-films transferred on silicon substrates for two representative PCL/PS blends (XPS ~
0.69 and XPS ~ 0.13). The silicon substrates were first covered with a thin layer of
spincoated PS to enhance the adhesion of transferred PS aggregates to the solid substrate.
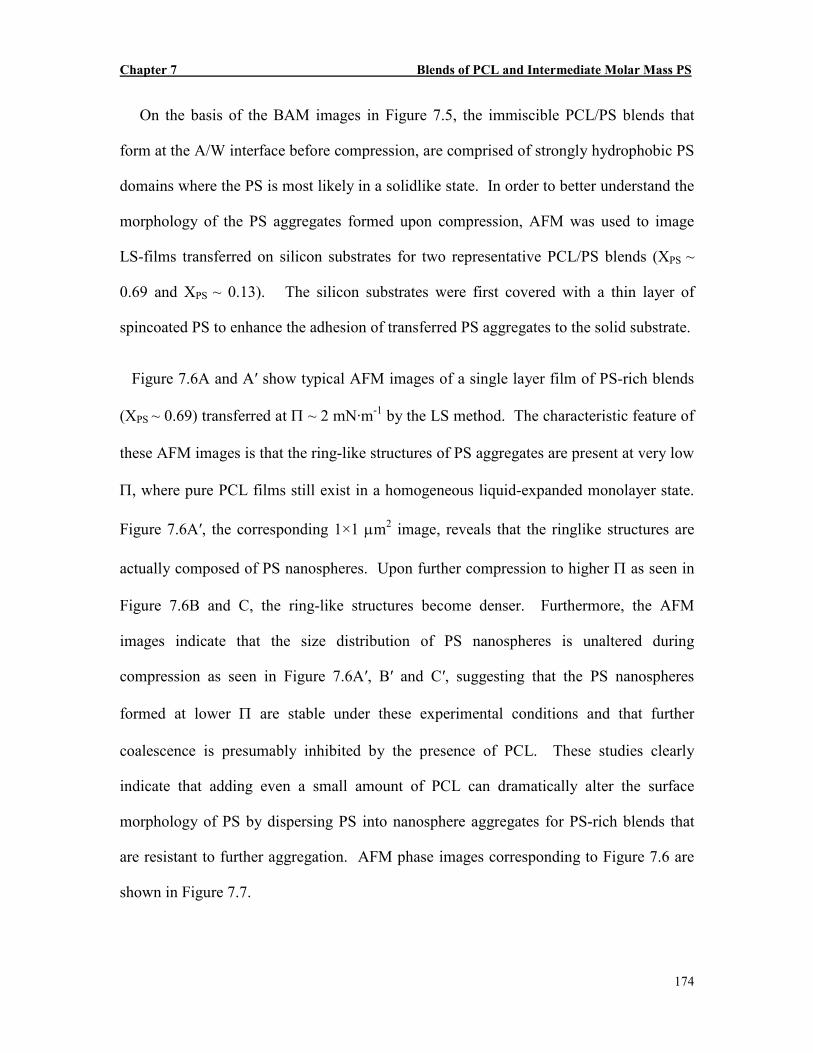
Figure 7.6A and A′ show typical AFM images of a single layer film of PS-rich blends
(XPS ~ 0.69) transferred at Π ~ 2 mN·m-1 by the LS method. The characteristic feature of
these AFM images is that the ring-like structures of PS aggregates are present at very low
Π, where pure PCL films still exist in a homogeneous liquid-expanded monolayer state.
Figure 7.6A′, the corresponding 1×1 µm2 image, reveals that the ringlike structures are
actually composed of PS nanospheres. Upon further compression to higher Π as seen in
Figure 7.6B and C, the ring-like structures become denser. Furthermore, the AFM
images indicate that the size distribution of PS nanospheres is unaltered during
compression as seen in Figure 7.6A′, B′ and C′, suggesting that the PS nanospheres
formed at lower Π are stable under these experimental conditions and that further
coalescence is presumably inhibited by the presence of PCL. These studies clearly
indicate that adding even a small amount of PCL can dramatically alter the surface
morphology of PS by dispersing PS into nanosphere aggregates for PS-rich blends that
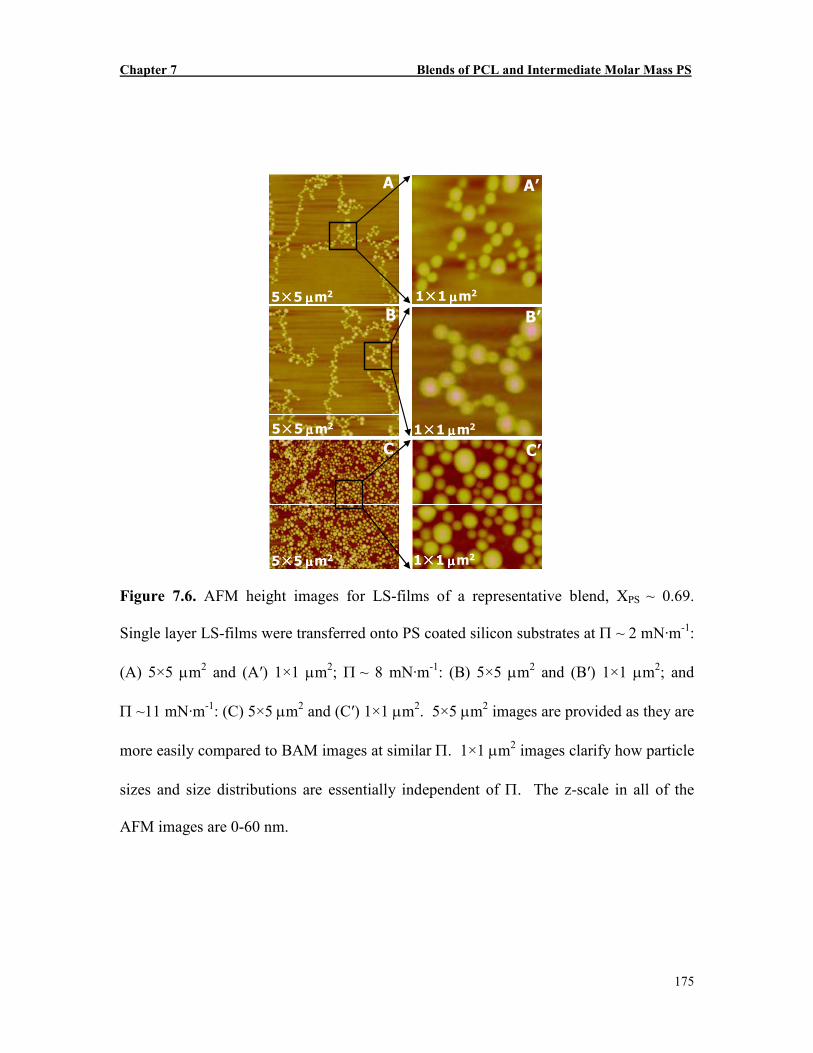
are resistant to further aggregation. AFM phase images corresponding to Figure 7.6 are
shown in Figure 7.7.
Chapter 7 Blends of PCL and Intermediate Molar Mass PS
175
A
E
5××××5 µµµµm2 1××××1 µµµµm2
1××××1 µµµµm2
5××××5 µµµµm2
5××××5 µµµµm2
1××××1 µµµµm2
A’
B B’
C C’
Figure 7.6. AFM height images for LS-films of a representative blend, XPS ~ 0.69.
Single layer LS-films were transferred onto PS coated silicon substrates at Π ~ 2 mN·m-1:
(A) 5×5 µm2 and (A′) 1×1 µm2; Π ~ 8 mN·m-1: (B) 5×5 µm2 and (B′) 1×1 µm2; and
Π ~11 mN·m-1: (C) 5×5 µm2 and (C′) 1×1 µm2. 5×5 µm2 images are provided as they are
more easily compared to BAM images at similar Π. 1×1 µm2 images clarify how particle
sizes and size distributions are essentially independent of Π. The z-scale in all of the
AFM images are 0-60 nm.
Chapter 7 Blends of PCL and Intermediate Molar Mass PS
176
A A’
B B’
C C’
Figure 7.7. AFM height (left) and phase (right) images of LS-films for a representative
PCL/PS blend, XPS ~ 0.69. Single layer LS-films were transferred onto PS coated silicon
substrates at Π ~ 2 mN·m-1 (A, A′), Π ~8 mN·m-1 (B, B′), and Π ~11 mN·m-1 (C, C′).
5×5 µm2 images are provided as they are more easily compared to BAM images at
similar Π. The z-scales in the height images are 0-60 nm and the z-scales in phase
images are 0-60 deg.
Chapter 7 Blends of PCL and Intermediate Molar Mass PS
177
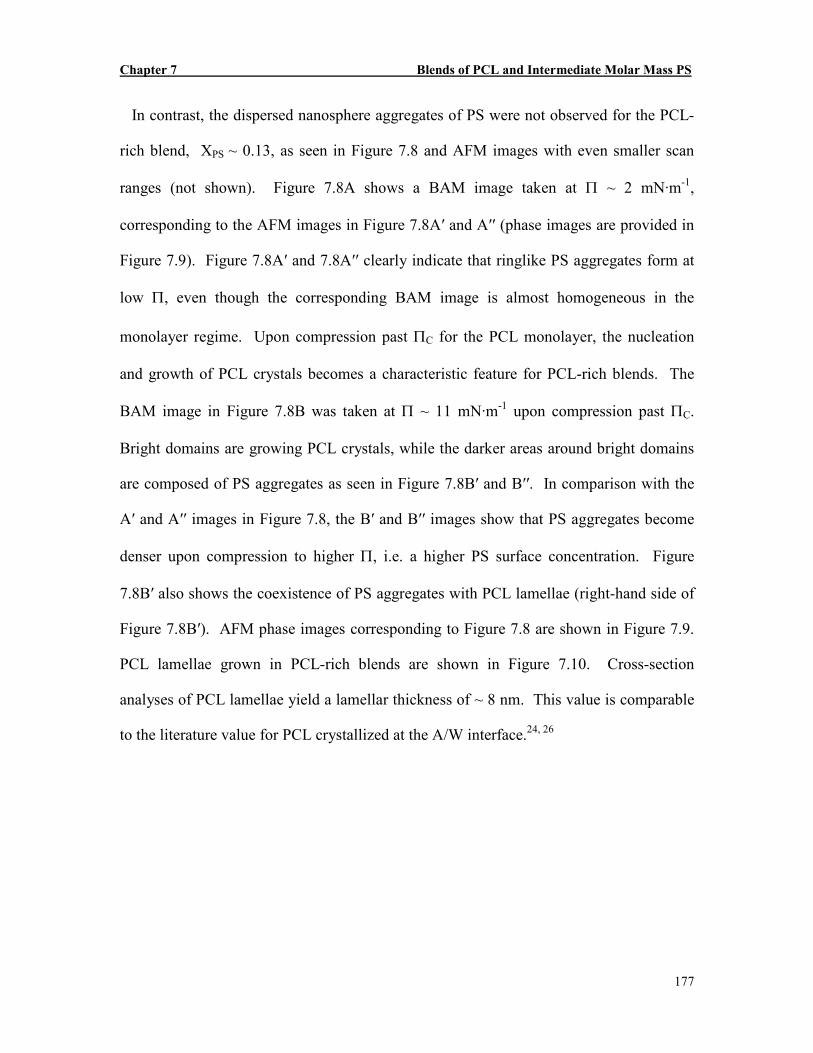
In contrast, the dispersed nanosphere aggregates of PS were not observed for the PCL-
rich blend, XPS ~ 0.13, as seen in Figure 7.8 and AFM images with even smaller scan
ranges (not shown). Figure 7.8A shows a BAM image taken at Π ~ 2 mN·m-1,
corresponding to the AFM images in Figure 7.8A′ and A′′ (phase images are provided in
Figure 7.9). Figure 7.8A′ and 7.8A′′ clearly indicate that ringlike PS aggregates form at
low Π, even though the corresponding BAM image is almost homogeneous in the
monolayer regime. Upon compression past ΠC for the PCL monolayer, the nucleation
and growth of PCL crystals becomes a characteristic feature for PCL-rich blends. The
BAM image in Figure 7.8B was taken at Π ~ 11 mN·m-1 upon compression past ΠC.
Bright domains are growing PCL crystals, while the darker areas around bright domains
are composed of PS aggregates as seen in Figure 7.8B′ and B′′. In comparison with the
A′ and A′′ images in Figure 7.8, the B′ and B′′ images show that PS aggregates become
denser upon compression to higher Π, i.e. a higher PS surface concentration. Figure
7.8B′ also shows the coexistence of PS aggregates with PCL lamellae (right-hand side of
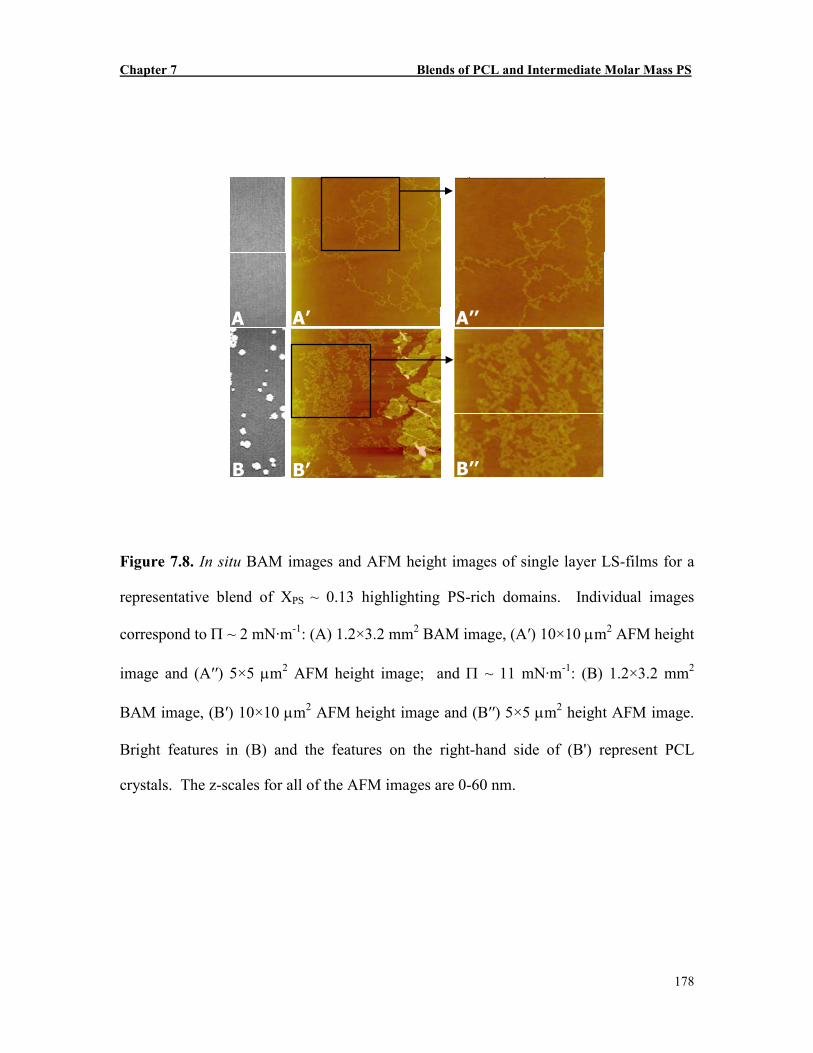
Figure 7.8B′). AFM phase images corresponding to Figure 7.8 are shown in Figure 7.9.
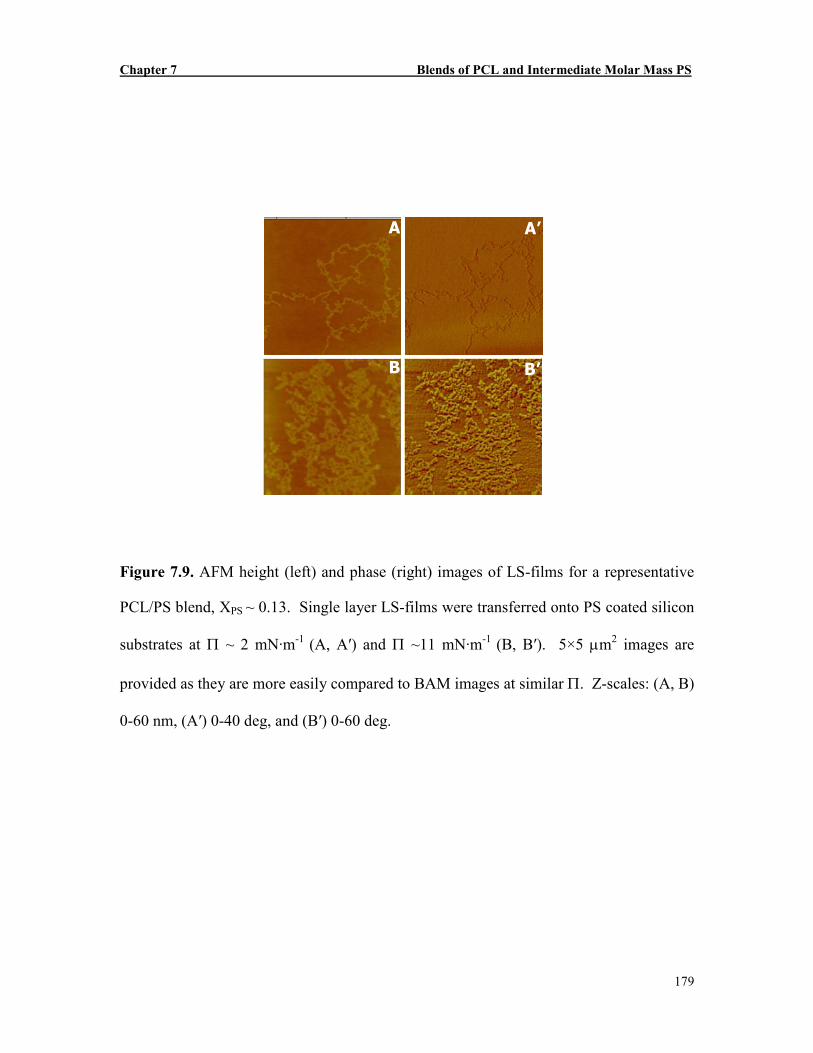
PCL lamellae grown in PCL-rich blends are shown in Figure 7.10. Cross-section
analyses of PCL lamellae yield a lamellar thickness of ~ 8 nm. This value is comparable
to the literature value for PCL crystallized at the A/W interface.24, 26
Chapter 7 Blends of PCL and Intermediate Molar Mass PS
178
B’’B
A A’ A’’
B’
Figure 7.8. In situ BAM images and AFM height images of single layer LS-films for a
representative blend of XPS ~ 0.13 highlighting PS-rich domains. Individual images
correspond to Π ~ 2 mN·m-1: (A) 1.2×3.2 mm2 BAM image, (A′) 10×10 µm2 AFM height
image and (A′′) 5×5 µm2 AFM height image; and Π ~ 11 mN·m-1: (B) 1.2×3.2 mm2
BAM image, (B′) 10×10 µm2 AFM height image and (B′′) 5×5 µm2 height AFM image.
Bright features in (B) and the features on the right-hand side of (B') represent PCL
crystals. The z-scales for all of the AFM images are 0-60 nm.
Chapter 7 Blends of PCL and Intermediate Molar Mass PS
179
B B’
A A’
Figure 7.9. AFM height (left) and phase (right) images of LS-films for a representative
PCL/PS blend, XPS ~ 0.13. Single layer LS-films were transferred onto PS coated silicon
substrates at Π ~ 2 mN·m-1 (A, A′) and Π ~11 mN·m-1 (B, B′). 5×5 µm2 images are
provided as they are more easily compared to BAM images at similar Π. Z-scales: (A, B)
0-60 nm, (A′) 0-40 deg, and (B′) 0-60 deg.
Chapter 7 Blends of PCL and Intermediate Molar Mass PS
180
25 nm
-25
0
10 µµµµm
A
B C
10××××10 µµµµm2 10××××10 µµµµm2
Vertical Distance ~ 8.322 nm
Figure 7.10. AFM images and a cross-section analysis of a PCL crystal for a LS-film
prepared from a XPS ~ 0.13 PCL/PS blend. Single layer LS-films were transferred onto
PS coated silicon substrates at Π ~ 11 mN·m-1 (above ΠC). (A) Cross-section analysis
yielding a lamellar thickness of ~ 8 nm. (B) 10×10 µm2 height image (Z-scale: 0-60 nm)
and (C) 10×10 µm2 phase image (Z-scale: 0-40 deg).
Chapter 7 Blends of PCL and Intermediate Molar Mass PS
181
A
B
C
D
E
F
G
H
14
12
10
8
6
4
2
0
Π
Π
Π
Π /mN•m
-1
2520151050
<A> / Å2•monomer
-1
AB
C
D
E
FG H
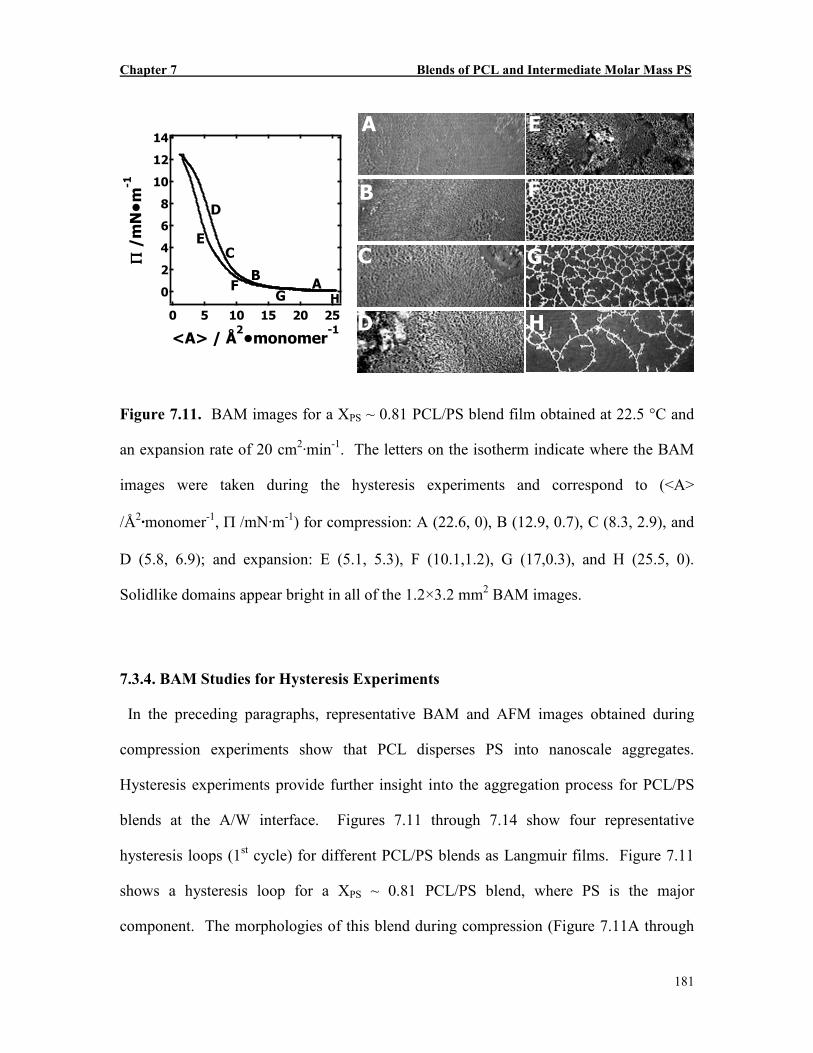
Figure 7.11. BAM images for a XPS ~ 0.81 PCL/PS blend film obtained at 22.5 °C and
an expansion rate of 20 cm2·min-1. The letters on the isotherm indicate where the BAM
images were taken during the hysteresis experiments and correspond to (<A>
/Å2·monomer-1, Π /mN·m-1) for compression: A (22.6, 0), B (12.9, 0.7), C (8.3, 2.9), and
D (5.8, 6.9); and expansion: E (5.1, 5.3), F (10.1,1.2), G (17,0.3), and H (25.5, 0).
Solidlike domains appear bright in all of the 1.2×3.2 mm2 BAM images.
7.3.4. BAM Studies for Hysteresis Experiments
In the preceding paragraphs, representative BAM and AFM images obtained during
compression experiments show that PCL disperses PS into nanoscale aggregates.
Hysteresis experiments provide further insight into the aggregation process for PCL/PS
blends at the A/W interface. Figures 7.11 through 7.14 show four representative
hysteresis loops (1st cycle) for different PCL/PS blends as Langmuir films. Figure 7.11
shows a hysteresis loop for a XPS ~ 0.81 PCL/PS blend, where PS is the major
component. The morphologies of this blend during compression (Figure 7.11A through
Chapter 7 Blends of PCL and Intermediate Molar Mass PS
182
D) are clearly different from pure PS (Figure 7.1A). Upon expansion of the compressed
films, the surface density of the PS aggregates decreases with increasing <A>.
Meanwhile, the aggregates self-assemble into networklike structures as seen in Figure
7.11F through H. The “mesh sizes” of the networks increase with increasing <A> during
expansion. Furthermore, the networklike structures remain even at Π ~ 0 mN·m-1 (Figure
7.11H).
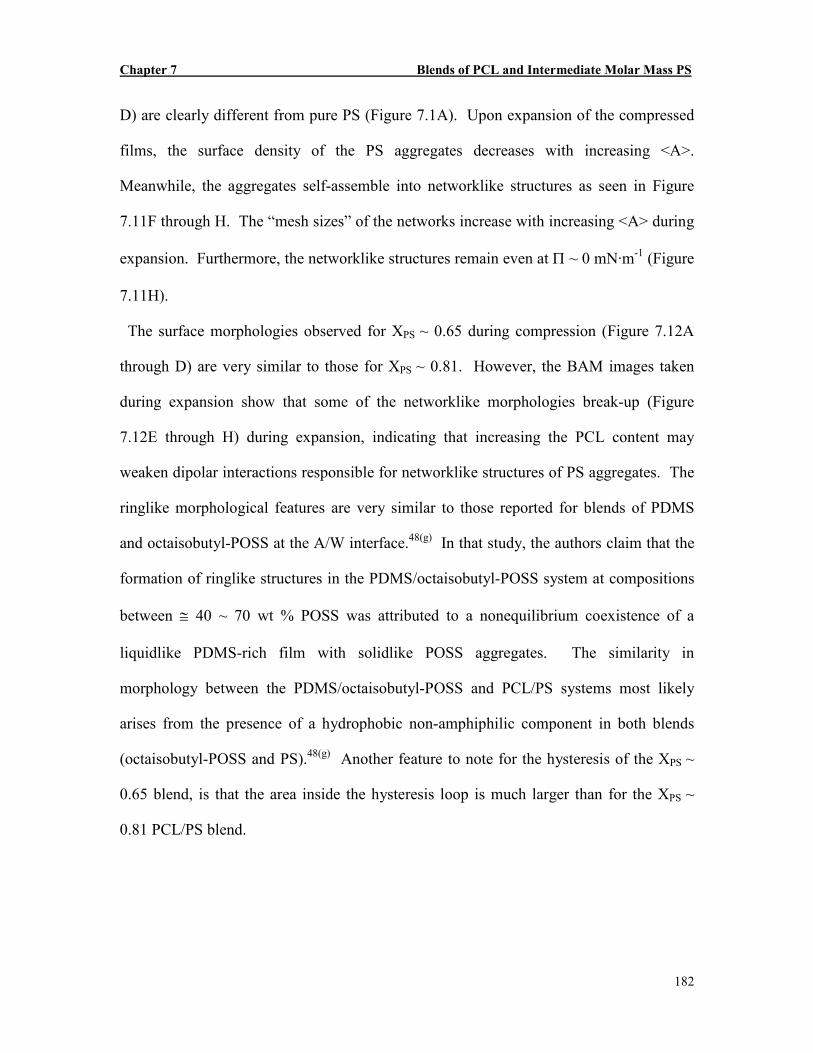
The surface morphologies observed for XPS ~ 0.65 during compression (Figure 7.12A
through D) are very similar to those for XPS ~ 0.81. However, the BAM images taken
during expansion show that some of the networklike morphologies break-up (Figure
7.12E through H) during expansion, indicating that increasing the PCL content may
weaken dipolar interactions responsible for networklike structures of PS aggregates. The
ringlike morphological features are very similar to those reported for blends of PDMS
and octaisobutyl-POSS at the A/W interface.48(g) In that study, the authors claim that the
formation of ringlike structures in the PDMS/octaisobutyl-POSS system at compositions
between ≅ 40 ~ 70 wt % POSS was attributed to a nonequilibrium coexistence of a
liquidlike PDMS-rich film with solidlike POSS aggregates. The similarity in
morphology between the PDMS/octaisobutyl-POSS and PCL/PS systems most likely
arises from the presence of a hydrophobic non-amphiphilic component in both blends
(octaisobutyl-POSS and PS).48(g) Another feature to note for the hysteresis of the XPS ~
0.65 blend, is that the area inside the hysteresis loop is much larger than for the XPS ~
0.81 PCL/PS blend.
Chapter 7 Blends of PCL and Intermediate Molar Mass PS
183
B
C
D
E
F
G
H
A
14
12
10
8
6
4
2
0
Π
Π
Π
Π /mN•m
-1
403020100
<A> / Å2•monomer
-1
AB
C
D
E
F
G H
Figure 7.12. BAM images for a XPS ~ 0.65 PCL/PS blend film obtained at 22.5 °C and
an expansion rate of 20 cm2·min-1. The letters on the isotherm indicate where the BAM
images were taken during the hysteresis experiments and correspond to (<A>
/Å2·monomer-1, Π /mN·m-1) for compression: A (23.7, 1.0), B (17.6, 2.5), C (10.6, 8.3)
and D (7.0, 10.8); and expansion: E (7.5, 5.0), F (15.8, 2.6), G (28.7, 0.6), and H (35.5,
0.3). Solidlike domains appear bright in all of the 1.2×3.2 mm2 BAM images.
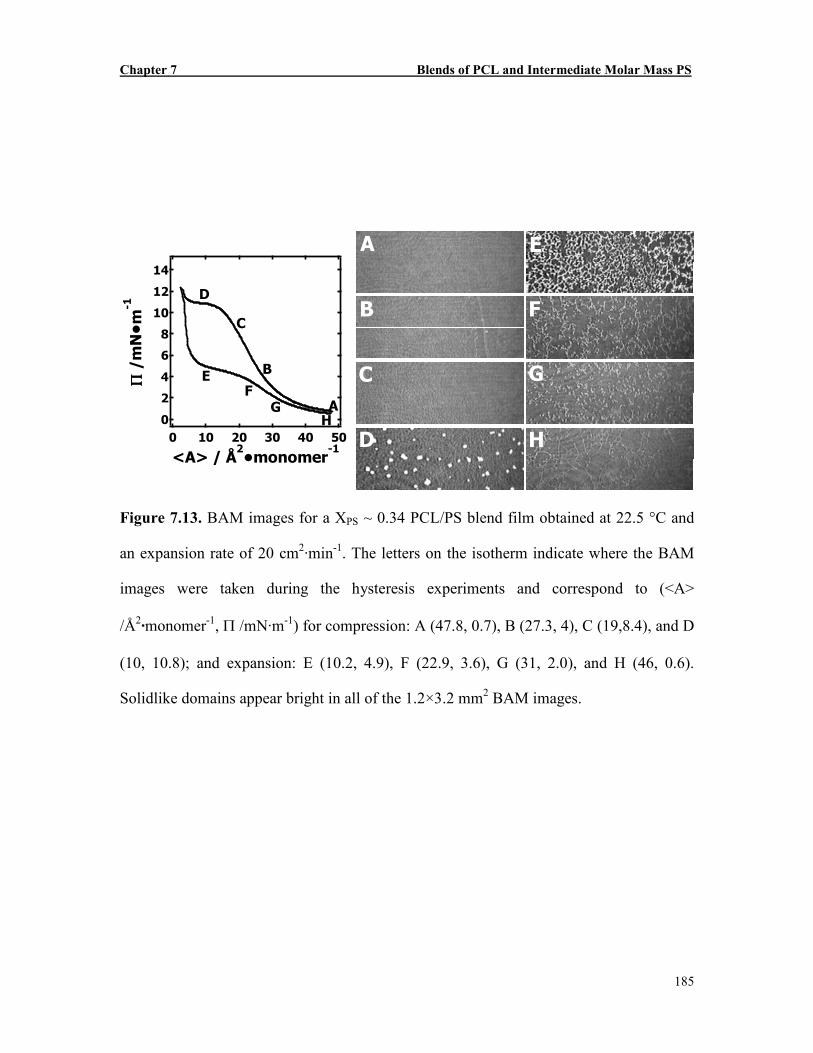
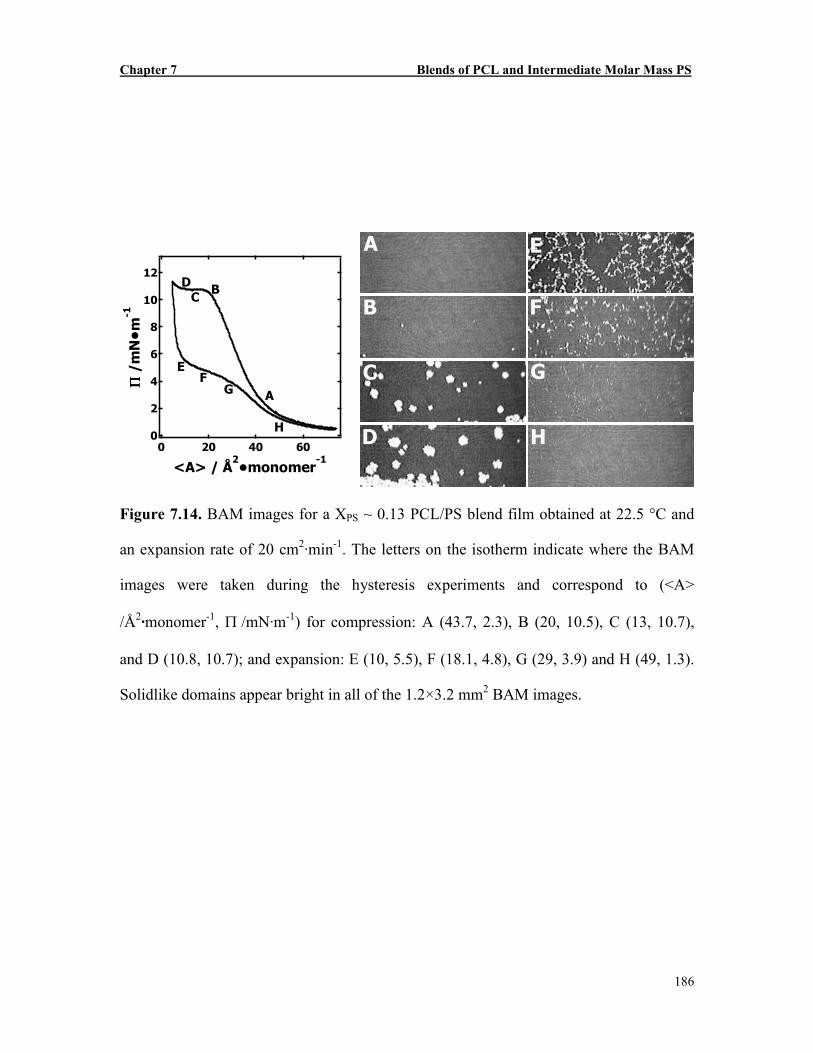
Figure 7.13 (XPS ~ 0.34) and Figure 7.14 (XPS ~ 0.13) provide representative
morphologies for blends where PCL is the major phase. The nucleation and growth of
PCL crystals in the “homogeneously heterogeneous monolayer” were clearly observed
upon compression above ΠC as shown in Figure 7.13D for XPS ~ 0.34 and Figure 7.14D
for XPS ~ 0.13 (bright objects). It is clear from Figures 7.11 through 7.14 that the stability
of the network structures decreases with increasing PCL content in the blend. As seen in
Figure 7.14E, XPS ~ 0.13, the networklike structures break apart immediately upon
expansion. In comparison to the blends with higher PS contents, only discontinuous
smaller aggregates with weak BAM contrast are observed when the barriers start to open
Chapter 7 Blends of PCL and Intermediate Molar Mass PS
184
during the expansion process. It is also worth noting that the area inside the hysteresis
loop systematically increases with increasing PCL content from the smallest area for the
XPS ~ 0.81 (Figure 7.11) to the largest area for the XPS ~ 0.13 blend (Figure 7.14). The
increasing area and changing shape of the hysteresis loops with increasing PCL content is
attributed to the crystallization of PCL in blends where PCL is the major component. For
PCL-rich blends, once PCL crystallizes, it is necessary for PCL to “melt” before it can re-
spread. The plateau in the expansion isotherms has been identified as the “melting”
transition for PCL crystals that form during compression.24, 26 For PS rich blends, the
near absence of a plateau in the compression isotherms means that PS inhibits the
nucleation and growth of PCL crystals, even though other aspects of the Π-<A> isotherm
are completely controlled by PCL for all of the blends.
Chapter 7 Blends of PCL and Intermediate Molar Mass PS
185
B
C
A
D
E
F
G
H
14
12
10
8
6
4
2
0
Π
Π
Π
Π /mN•m
-1
50403020100
<A> / Å2•monomer
-1
A
B
C
D
EF
GH
Figure 7.13. BAM images for a XPS ~ 0.34 PCL/PS blend film obtained at 22.5 °C and
an expansion rate of 20 cm2·min-1. The letters on the isotherm indicate where the BAM
images were taken during the hysteresis experiments and correspond to (<A>
/Å2·monomer-1, Π /mN·m-1) for compression: A (47.8, 0.7), B (27.3, 4), C (19,8.4), and D
(10, 10.8); and expansion: E (10.2, 4.9), F (22.9, 3.6), G (31, 2.0), and H (46, 0.6).
Solidlike domains appear bright in all of the 1.2×3.2 mm2 BAM images.
Chapter 7 Blends of PCL and Intermediate Molar Mass PS
186
A
B
C
D
E
F
G
H
12
10
8
6
4
2
0
Π
Π
Π
Π /mN•m
-1
6040200
<A> / Å2•monomer
-1
A
BC
D
EF
G
H
Figure 7.14. BAM images for a XPS ~ 0.13 PCL/PS blend film obtained at 22.5 °C and
an expansion rate of 20 cm2·min-1. The letters on the isotherm indicate where the BAM
images were taken during the hysteresis experiments and correspond to (<A>
/Å2·monomer-1, Π /mN·m-1) for compression: A (43.7, 2.3), B (20, 10.5), C (13, 10.7),
and D (10.8, 10.7); and expansion: E (10, 5.5), F (18.1, 4.8), G (29, 3.9) and H (49, 1.3).
Solidlike domains appear bright in all of the 1.2×3.2 mm2 BAM images.
Chapter 7 Blends of PCL and Intermediate Molar Mass PS
187
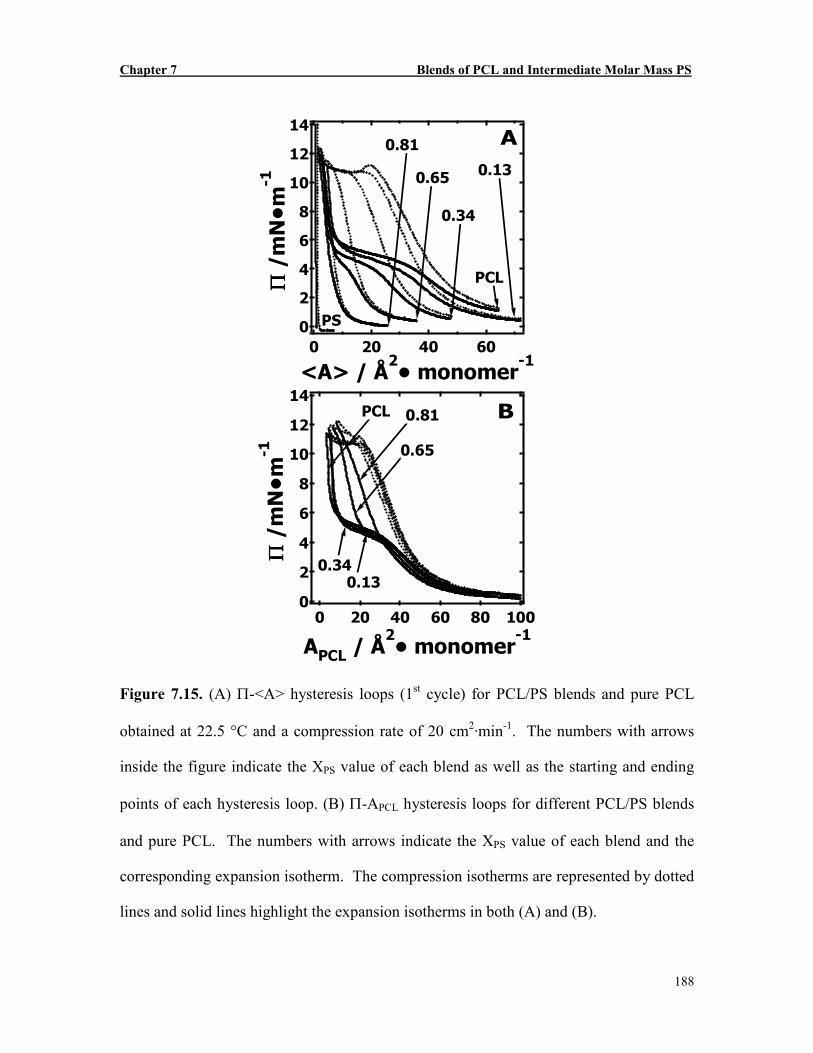
Additional features of these hysteresis loops are further illustrated in Figure 7.15, where
the compression isotherms are represented by dotted lines and solid lines highlight the
expansion isotherms. In Figure 7.15A, the arrow inside the figure indicates the starting
and ending points of each individual hysteresis loop as well as the composition (XPS).
All blend films were compressed to sufficiently small <A> values to ensure that all films
have gone through the collapse transition within the limitation of the compression ratio
for the Langmuir trough. The expansion isotherm for pure PCL is analogous to a
"melting" process. The surface pressure corresponding to the plateau in the expansion
isotherm is characteristic of the “melting pressure” of PCL crystals. As seen in Figure
7.15A, there is a definite change in the expansion isotherm with a change in blend
composition. On the basis of the observation that the surface activity of the blends is
controlled by the PCL component Π-APCL plots were constructed. Figure 7.15B clearly
shows that the expansion isotherms for blends of XPS ~ 0.13 and ~ 0.34 are consistent
with pure PCL where the plateau corresponds to the melting of PCL crystals formed
during compression. In contrast, the hysteresis loops for binary blends where PS is the
major component have smaller areas without clearly observable plateaus. As expected,
the surface tension and surface area of the blend films during expansion are only
controlled by the surface-active PCL component, even though there are dramatic
morphological changes when non-amphiphilic PS is blended with PCL.
Chapter 7 Blends of PCL and Intermediate Molar Mass PS
188
A
B
14
12
10
8
6
4
2
0
Π
Π
Π
Π /mN•m
-1
6040200
<A> / Å2• monomer
-1
PS
0.81
0.65
0.34
0.13
PCL
14
12
10
8
6
4
2
0
Π
Π
Π
Π /mN•m
-1
100806040200
APCL / Å2• monomer
-1
0.81
0.65
PCL
0.130.34
Figure 7.15. (A) Π-<A> hysteresis loops (1st cycle) for PCL/PS blends and pure PCL
obtained at 22.5 °C and a compression rate of 20 cm2·min-1. The numbers with arrows
inside the figure indicate the XPS value of each blend as well as the starting and ending
points of each hysteresis loop. (B) Π-APCL hysteresis loops for different PCL/PS blends
and pure PCL. The numbers with arrows indicate the XPS value of each blend and the
corresponding expansion isotherm. The compression isotherms are represented by dotted
lines and solid lines highlight the expansion isotherms in both (A) and (B).
Chapter 7 Blends of PCL and Intermediate Molar Mass PS
189
14
12
10
8
6
4
2
0
Π
Π
Π
Π /mN•m
-1
403020100
<A> / Å2•monomer
-1
XPS ~ 0.65
1st cycle 2nd cycle 3rd cycle
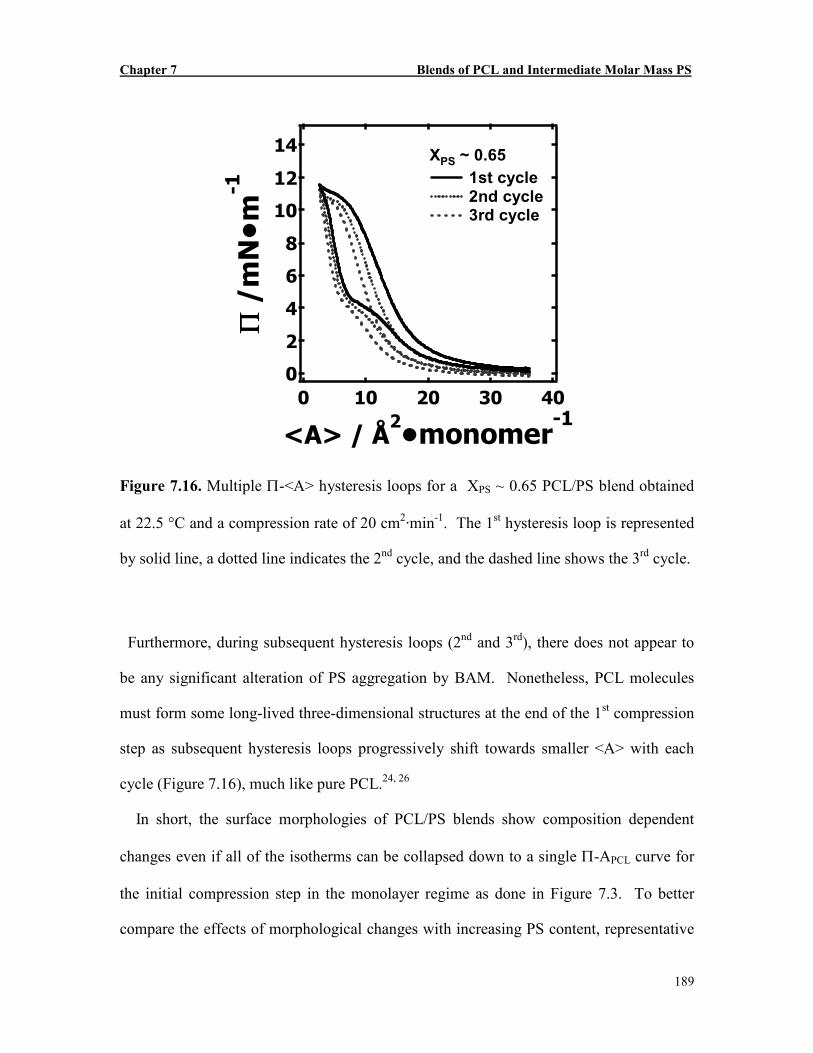
Figure 7.16. Multiple Π-<A> hysteresis loops for a XPS ~ 0.65 PCL/PS blend obtained
at 22.5 °C and a compression rate of 20 cm2·min-1. The 1st hysteresis loop is represented
by solid line, a dotted line indicates the 2nd cycle, and the dashed line shows the 3rd cycle.
Furthermore, during subsequent hysteresis loops (2nd and 3rd), there does not appear to
be any significant alteration of PS aggregation by BAM. Nonetheless, PCL molecules
must form some long-lived three-dimensional structures at the end of the 1st compression
step as subsequent hysteresis loops progressively shift towards smaller <A> with each
cycle (Figure 7.16), much like pure PCL.24, 26
In short, the surface morphologies of PCL/PS blends show composition dependent
changes even if all of the isotherms can be collapsed down to a single Π-APCL curve for
the initial compression step in the monolayer regime as done in Figure 7.3. To better
compare the effects of morphological changes with increasing PS content, representative
Chapter 7 Blends of PCL and Intermediate Molar Mass PS
190
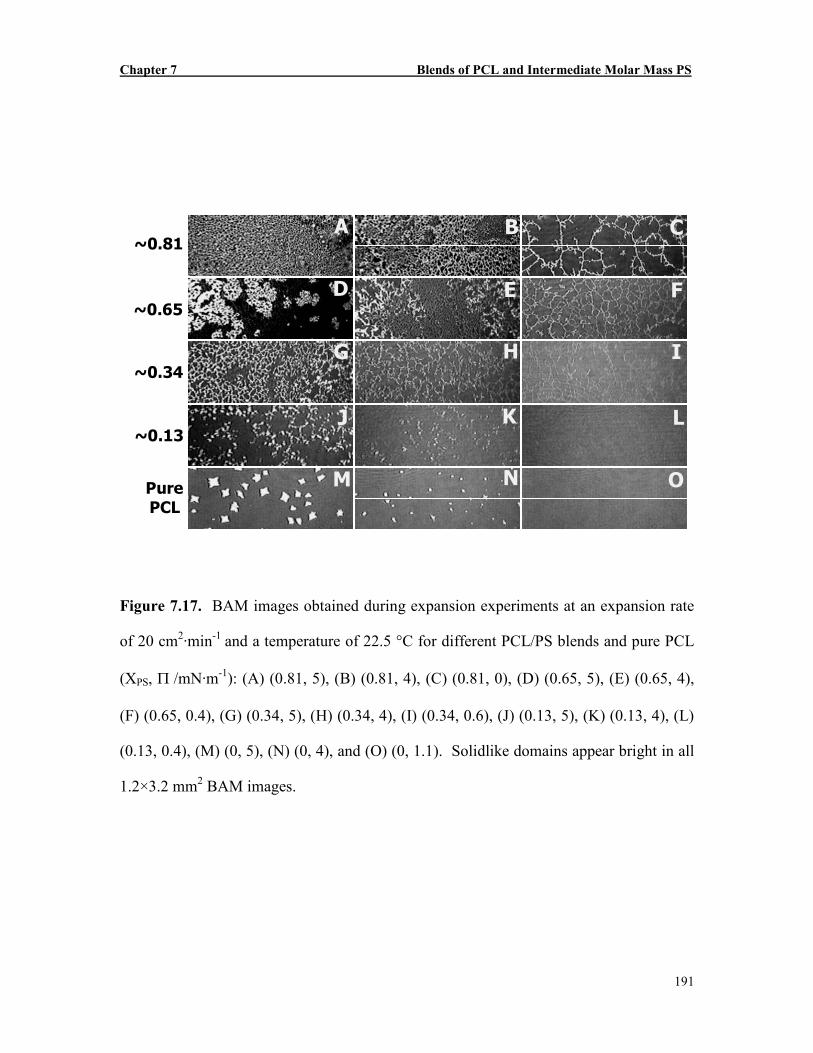
BAM images obtained during expansion at constant Π values for all blend films are
shown in Figure 7.17. For pure PS (not shown here), the surface pressure immediately
drops to zero upon expansion. The large aggregates (Figure 7.5A) do not re-spread
during expansion, indicating irreversible aggregation behavior that is consistent with the
absence of hydrophilic groups for PS. In contrast to PS, the surface pressure in
expansion isotherms of PCL decreases slowly and shows larger hysteresis.24, 26 The
BAM images of pure PCL show that the PCL crystals grown during compression become
smaller and smaller with decreasing surface concentration during expansion and finally
disappear at lower Π. This behavior indicates that the compressed single-component
PCL films are able to melt and re-spread upon expansion as seen in Figure 7.17M
through O. In Figure 7.17, the BAM images of the PCL/PS blends clearly show that
there is a gradual change in surface morphology from highly continuous networklike
structures (PS-major component) to broken ringlike structures (intermediate composition)
to small discontinuous aggregates (PCL-major component).
Chapter 7 Blends of PCL and Intermediate Molar Mass PS
191
~0.34
Pure PCL
~0.81
~0.65
~0.13
A B C
D E F
G H I
J K L
M N O
Figure 7.17. BAM images obtained during expansion experiments at an expansion rate
of 20 cm2·min-1 and a temperature of 22.5 °C for different PCL/PS blends and pure PCL
(XPS, Π /mN·m-1): (A) (0.81, 5), (B) (0.81, 4), (C) (0.81, 0), (D) (0.65, 5), (E) (0.65, 4),
(F) (0.65, 0.4), (G) (0.34, 5), (H) (0.34, 4), (I) (0.34, 0.6), (J) (0.13, 5), (K) (0.13, 4), (L)
(0.13, 0.4), (M) (0, 5), (N) (0, 4), and (O) (0, 1.1). Solidlike domains appear bright in all
1.2×3.2 mm2 BAM images.
Chapter 7 Blends of PCL and Intermediate Molar Mass PS
192
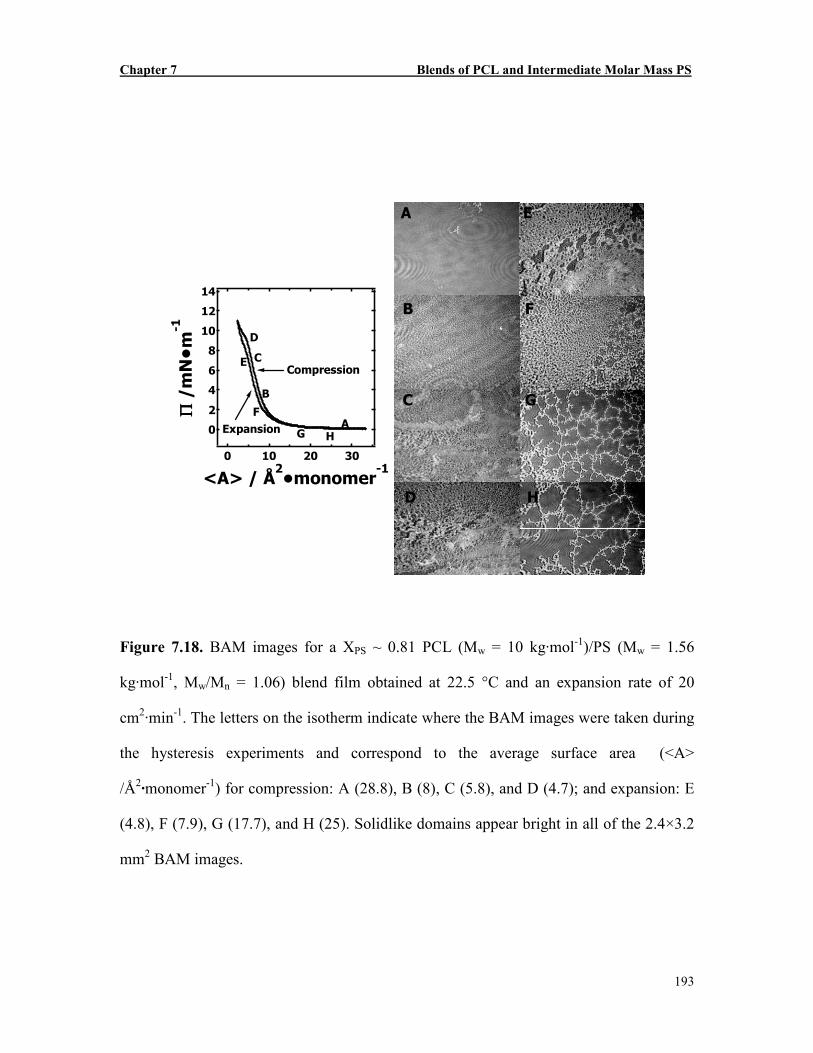
Furthermore, similar morphological features were also observed for PS (Mw ~ 1.56
kg·mol-1, Mw ~ 64.4 kg·mol-1, and Mw ~ 217 kg·mol-1) blends with PCL as seen in Figure
7.18 through 7.23. This similarity leads to a more general conclusion that PS of
intermediate molar mass from Mw ~ 1.56 to at least 217 kg·mol-1 (glassy in the bulk state
at 22.5 °C) will exhibit surface behavior at the A/W interface that is similar to the results
presented here for PCL/PS blends (PS Mw = 22.2 kg·mol-1). The similarity in
networklike morphology seen here for PCL/PS binary polymer blends also strongly
supports the interpretation provided for the PDMS/octaisobutyl-POSS system.48(g) This
observation also reinforces the conclusion drawn on the basis of isotherm studies that
both PS and PCL show independent surface behavior, even though the weak hydrophobic
cohesive forces at PCL/PS domain boundaries help disperse the PS aggregates and inhibit
further coalescence.
Chapter 7 Blends of PCL and Intermediate Molar Mass PS
193
A
B
C
D
E
F
G
H
14
12
10
8
6
4
2
0
Π
Π
Π
Π /mN•m
-1
3020100
<A> / Å2•monomer
-1
A
B
C
D
E
F
G H
Compression
Expansion
Figure 7.18. BAM images for a XPS ~ 0.81 PCL (Mw = 10 kg·mol-1)/PS (Mw = 1.56
kg·mol-1, Mw/Mn = 1.06) blend film obtained at 22.5 °C and an expansion rate of 20
cm2·min-1. The letters on the isotherm indicate where the BAM images were taken during
the hysteresis experiments and correspond to the average surface area (<A>
/Å2·monomer-1) for compression: A (28.8), B (8), C (5.8), and D (4.7); and expansion: E
(4.8), F (7.9), G (17.7), and H (25). Solidlike domains appear bright in all of the 2.4×3.2
mm2 BAM images.
Chapter 7 Blends of PCL and Intermediate Molar Mass PS
194
A
B
C
D
E
F
G
H
14
12
10
8
6
4
2
0
Π
Π
Π
Π /mN•m
-1
806040200
<A> / Å2•monomer
-1
ABCD
E
FG
H
Compression
Expansion
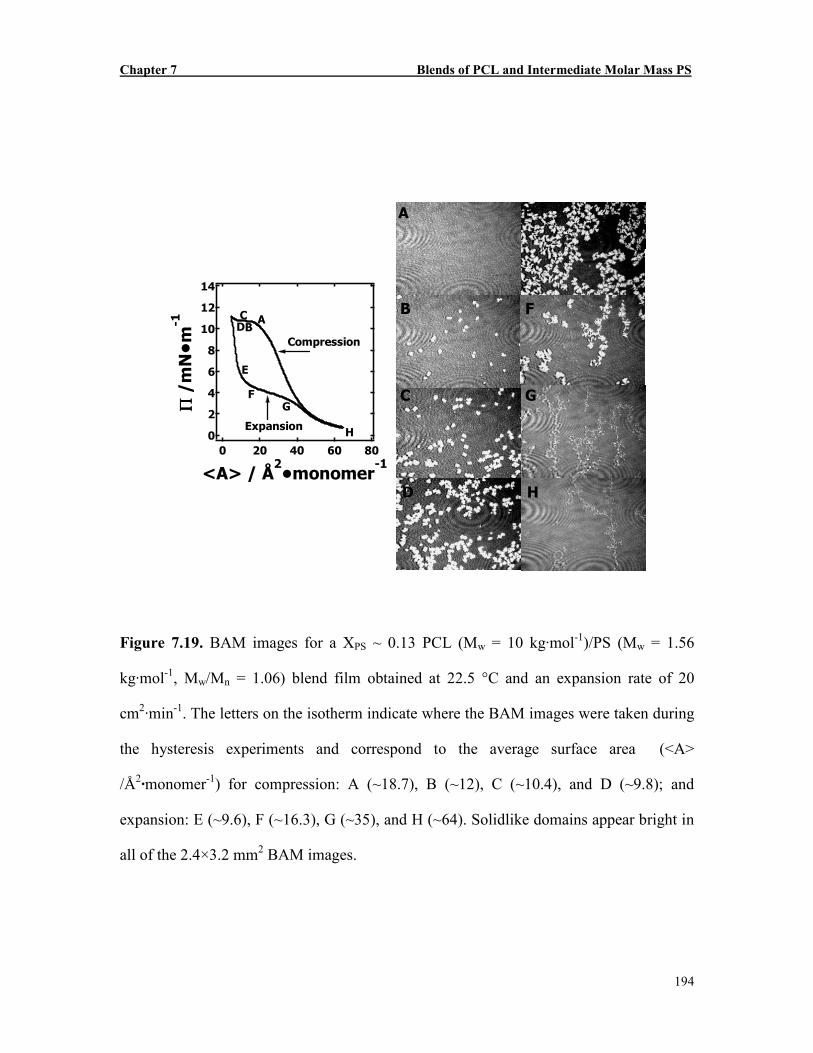
Figure 7.19. BAM images for a XPS ~ 0.13 PCL (Mw = 10 kg·mol-1)/PS (Mw = 1.56
kg·mol-1, Mw/Mn = 1.06) blend film obtained at 22.5 °C and an expansion rate of 20
cm2·min-1. The letters on the isotherm indicate where the BAM images were taken during
the hysteresis experiments and correspond to the average surface area (<A>
/Å2·monomer-1) for compression: A (~18.7), B (~12), C (~10.4), and D (~9.8); and
expansion: E (~9.6), F (~16.3), G (~35), and H (~64). Solidlike domains appear bright in
all of the 2.4×3.2 mm2 BAM images.
Chapter 7 Blends of PCL and Intermediate Molar Mass PS
195
14
12
10
8
6
4
2
0
Π
Π
Π
Π /mN•m
-1
3020100
<A> / Å2•monomer
-1
Compression
Expansion AB
C
D
E
F G H
A
B
C
D
E
F
G
H
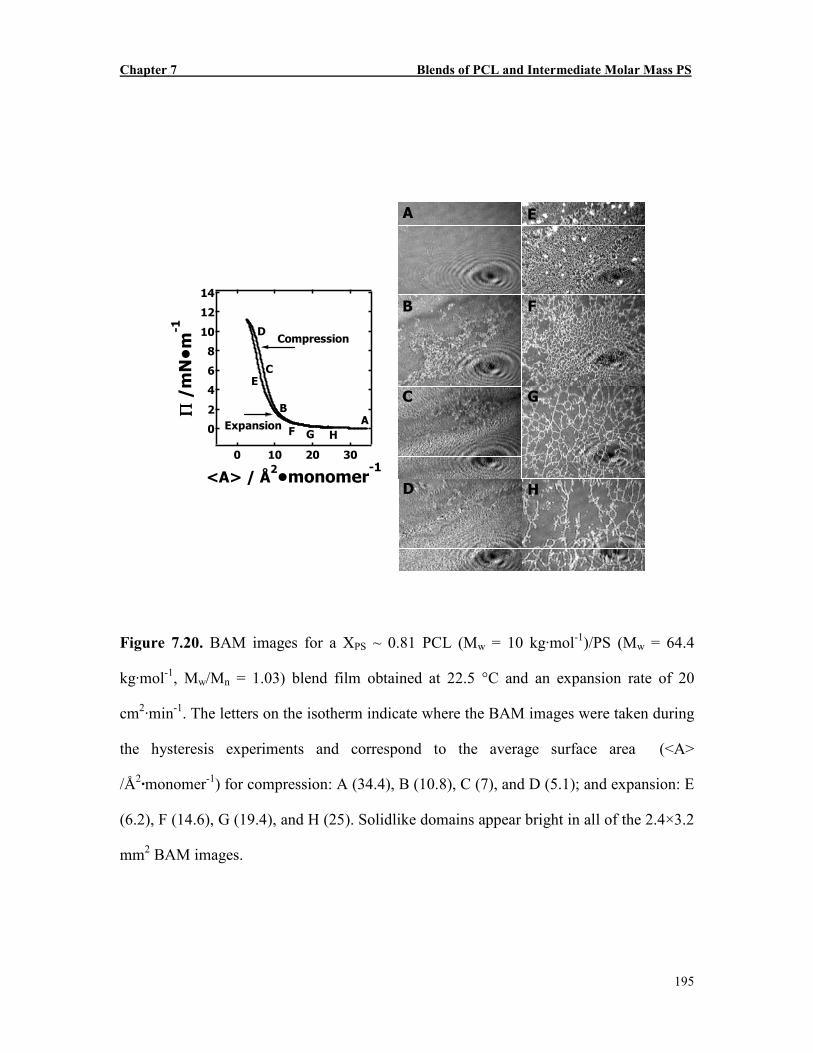
Figure 7.20. BAM images for a XPS ~ 0.81 PCL (Mw = 10 kg·mol-1)/PS (Mw = 64.4
kg·mol-1, Mw/Mn = 1.03) blend film obtained at 22.5 °C and an expansion rate of 20
cm2·min-1. The letters on the isotherm indicate where the BAM images were taken during
the hysteresis experiments and correspond to the average surface area (<A>
/Å2·monomer-1) for compression: A (34.4), B (10.8), C (7), and D (5.1); and expansion: E
(6.2), F (14.6), G (19.4), and H (25). Solidlike domains appear bright in all of the 2.4×3.2
mm2 BAM images.
Chapter 7 Blends of PCL and Intermediate Molar Mass PS
196
14
12
10
8
6
4
2
0
Π
Π
Π
Π /mN•m
-1
6040200
<A> / Å2•monomer
-1
Compression
Expansion
AB
CD
E
FG
H
A
B
C
D
E
F
G
H
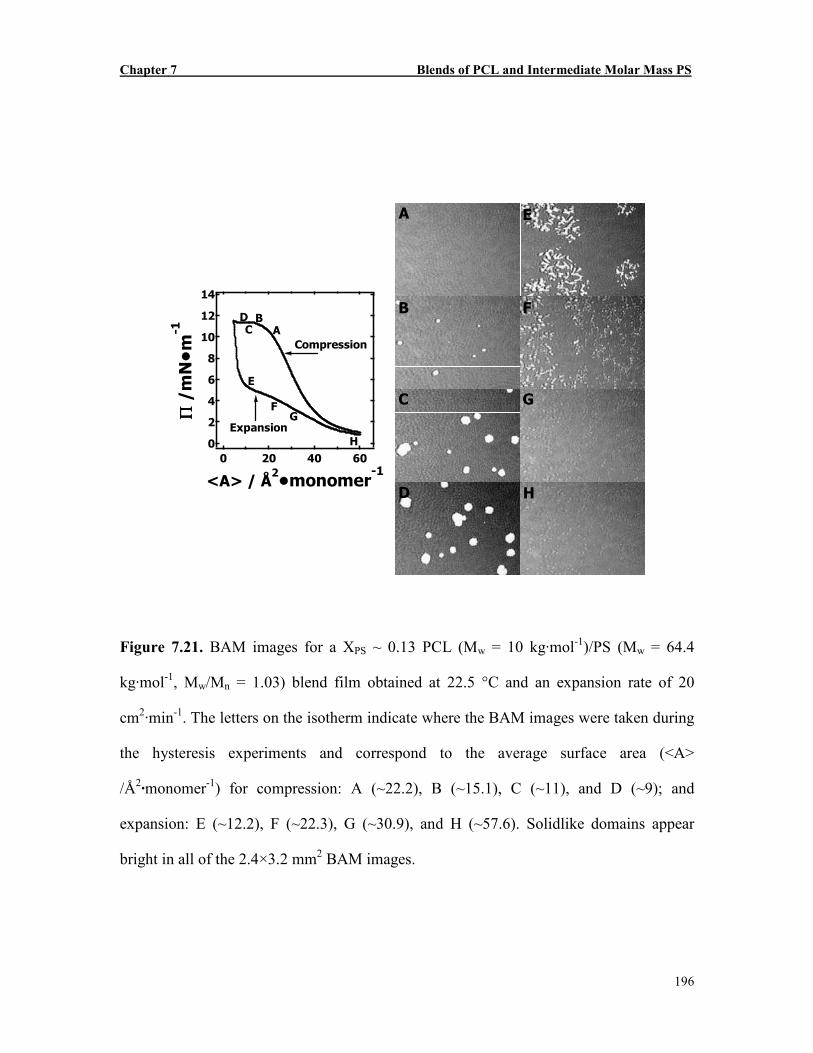
Figure 7.21. BAM images for a XPS ~ 0.13 PCL (Mw = 10 kg·mol-1)/PS (Mw = 64.4
kg·mol-1, Mw/Mn = 1.03) blend film obtained at 22.5 °C and an expansion rate of 20
cm2·min-1. The letters on the isotherm indicate where the BAM images were taken during
the hysteresis experiments and correspond to the average surface area (<A>
/Å2·monomer-1) for compression: A (~22.2), B (~15.1), C (~11), and D (~9); and
expansion: E (~12.2), F (~22.3), G (~30.9), and H (~57.6). Solidlike domains appear
bright in all of the 2.4×3.2 mm2 BAM images.
Chapter 7 Blends of PCL and Intermediate Molar Mass PS
197
14
12
10
8
6
4
2
0
Π
Π
Π
Π /mN•m
-1
3020100
<A> / Å2•monomer
-1
Compression
Expansion
A
B
C
D
E
FG H
A
B
C
D
E
F
G
H
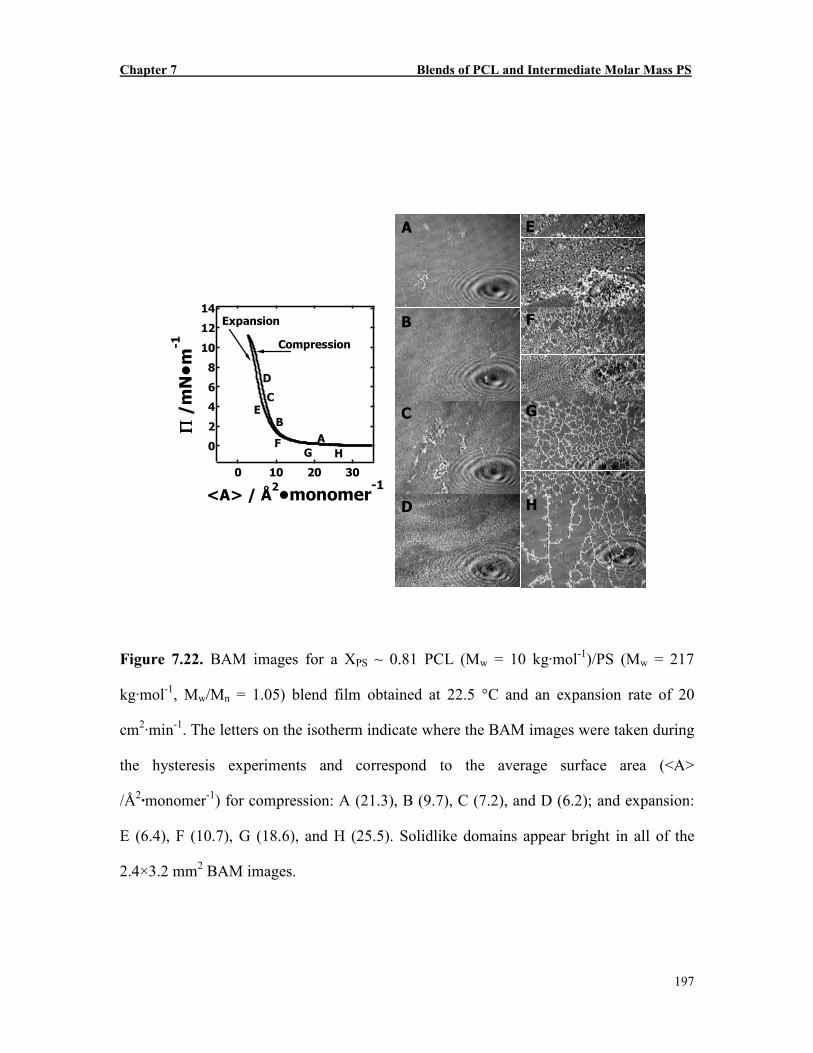
Figure 7.22. BAM images for a XPS ~ 0.81 PCL (Mw = 10 kg·mol-1)/PS (Mw = 217
kg·mol-1, Mw/Mn = 1.05) blend film obtained at 22.5 °C and an expansion rate of 20
cm2·min-1. The letters on the isotherm indicate where the BAM images were taken during
the hysteresis experiments and correspond to the average surface area (<A>
/Å2·monomer-1) for compression: A (21.3), B (9.7), C (7.2), and D (6.2); and expansion:
E (6.4), F (10.7), G (18.6), and H (25.5). Solidlike domains appear bright in all of the
2.4×3.2 mm2 BAM images.
Chapter 7 Blends of PCL and Intermediate Molar Mass PS
198
14
12
10
8
6
4
2
0
Π
Π
Π
Π /mN•m
-1
806040200
<A> / Å2•monomer
-1
Compression
Expansion
ABCD
EF
GH
A
B
C
D
E
F
G
H
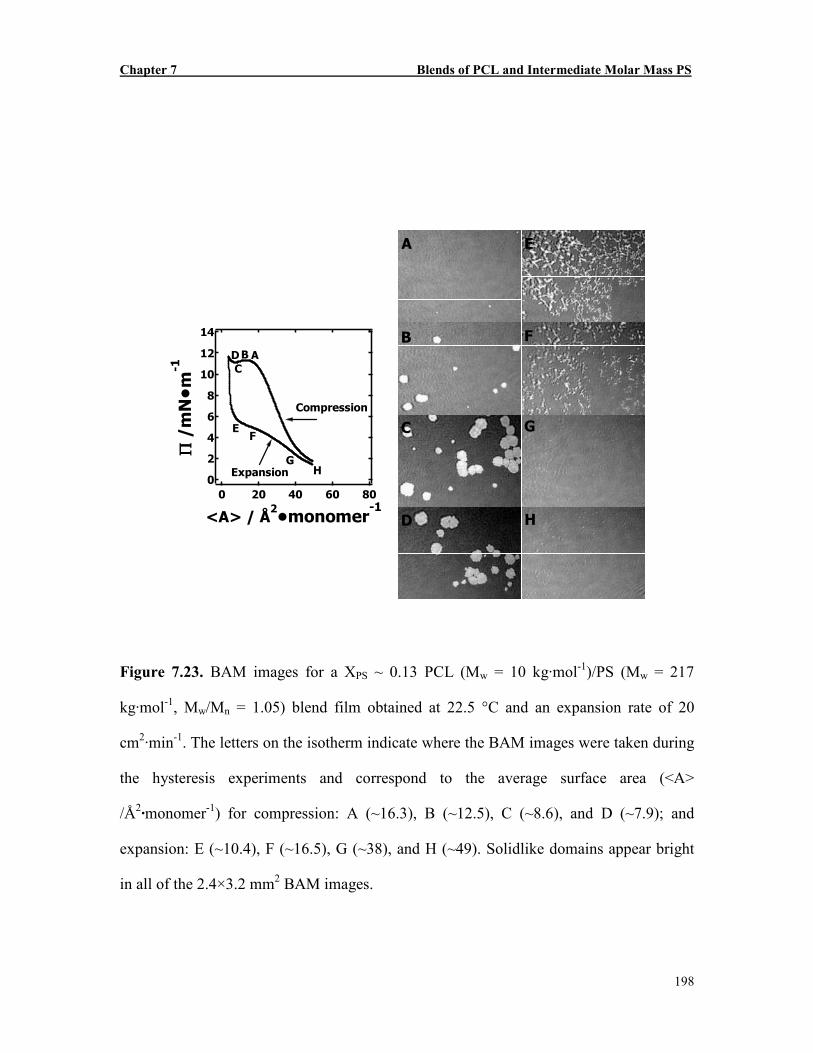
Figure 7.23. BAM images for a XPS ~ 0.13 PCL (Mw = 10 kg·mol-1)/PS (Mw = 217
kg·mol-1, Mw/Mn = 1.05) blend film obtained at 22.5 °C and an expansion rate of 20
cm2·min-1. The letters on the isotherm indicate where the BAM images were taken during
the hysteresis experiments and correspond to the average surface area (<A>
/Å2·monomer-1) for compression: A (~16.3), B (~12.5), C (~8.6), and D (~7.9); and
expansion: E (~10.4), F (~16.5), G (~38), and H (~49). Solidlike domains appear bright
in all of the 2.4×3.2 mm2 BAM images.
Chapter 7 Blends of PCL and Intermediate Molar Mass PS
199
In picking the title for this chapter, care was taken to restrict the lower bound for
defining “intermediate” molar mass to ensure that PS was in the glassy state at T = 22.5
°C. The reason for this is that PCL blends with a PS oligomer (Mw = 0.74 kg·mol-1) that
is in the liquid state at T = 22.5 °C exhibit dramatically different phase behavior. BAM
images obtained from two representative blends as Langmuir films are provided in
Figures 7.24 and 7.25 to highlight some of these differences. In contrast to the
PCL/glassy PS blends, the PCL/liquid PS oligomer blends may exhibit interesting
features consistent with phase separation by “nucleation and growth” and “spinodal”
decomposition mechanisms.
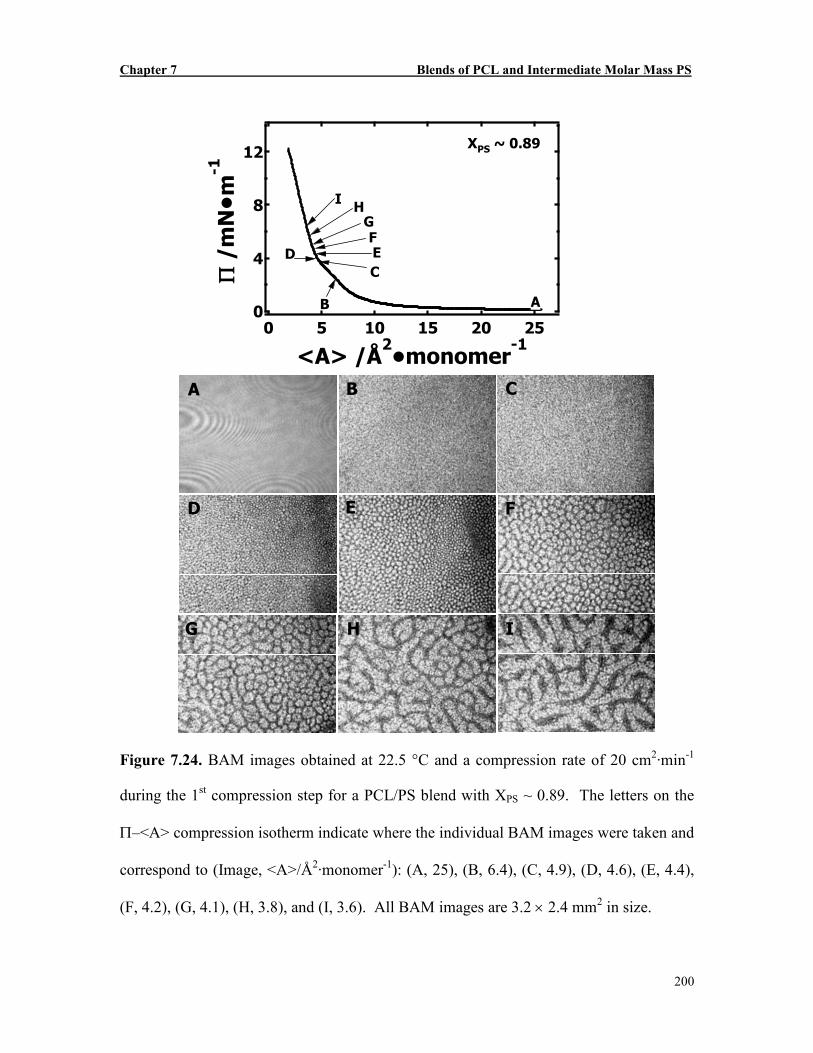
For strongly PS-rich blends, where PCL crystallization was inhibited, BAM images
captured during dynamic compression reveal a homogeneous surface morphology at very
low Π (Figure 7.24A). Further compression of the PS-rich blend film causes the films to
turn “cloudy” at intermediate Π values as seen in Figure 7.24B and C, heterogeneously
homogeneous surface morphologies with fine structures are observed. If the film is
compressed a bit more, the features coarsen and small droplets, presumably
corresponding to phase separation by a nucleation and growth mechanism, are observed
as seen in Figure 7.24D, E, and F. At even higher Π, the droplet morphology gives way
to elongated, curved domains that are surprisingly similar to what one may expect for
phase separation by spinodal decomposition (Figure 7.24G through I).
Chapter 7 Blends of PCL and Intermediate Molar Mass PS
200
A B C
D E F
G H I
12
8
4
0
Π
Π
Π
Π /mN•m
-1
2520151050
<A> /Å2•monomer
-1
XPS ~ 0.89
AB
CD E
FG
HI
Figure 7.24. BAM images obtained at 22.5 °C and a compression rate of 20 cm2·min-1
during the 1st compression step for a PCL/PS blend with XPS ~ 0.89. The letters on the
Π–<A> compression isotherm indicate where the individual BAM images were taken and
correspond to (Image, <A>/Å2·monomer-1): (A, 25), (B, 6.4), (C, 4.9), (D, 4.6), (E, 4.4),
(F, 4.2), (G, 4.1), (H, 3.8), and (I, 3.6). All BAM images are 3.2 × 2.4 mm2 in size.
Chapter 7 Blends of PCL and Intermediate Molar Mass PS
201
A
E F
B C
D
G H
12
8
4
0
Π
Π
Π
Π /mN•m
-1
6040200
<A> /Å2•monomer
-1
XPS ~ 0.22
A
BCD
EF
G
H
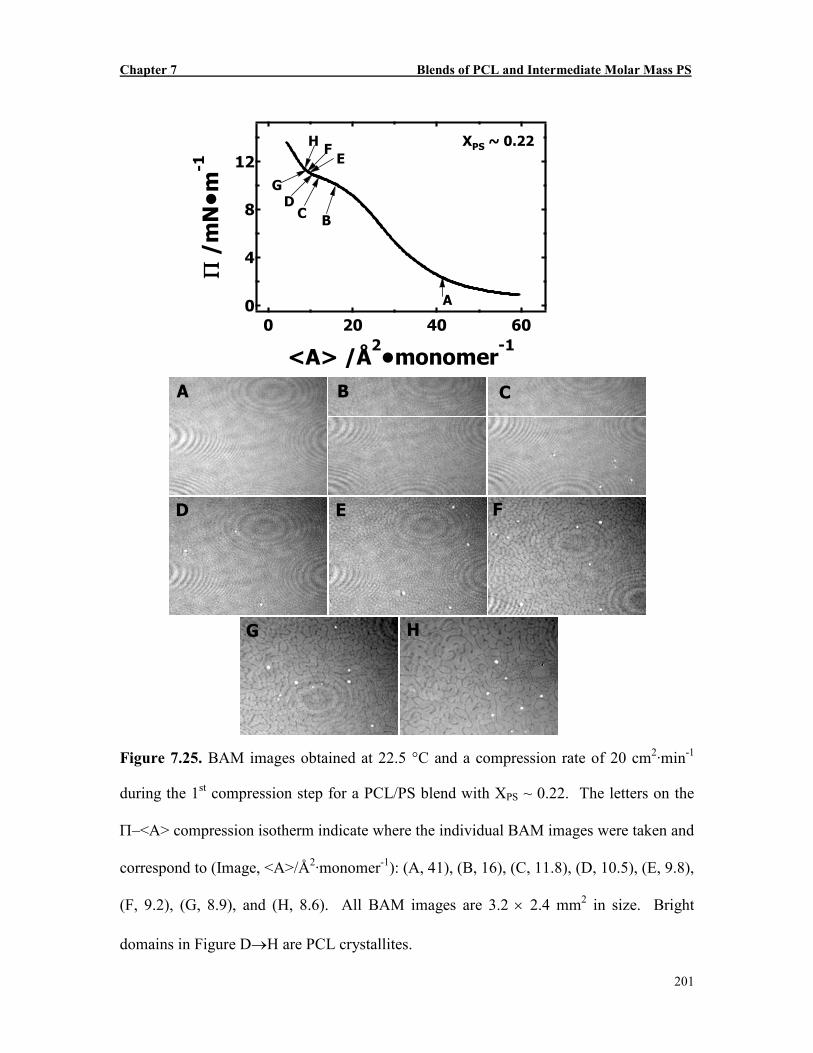
Figure 7.25. BAM images obtained at 22.5 °C and a compression rate of 20 cm2·min-1
during the 1st compression step for a PCL/PS blend with XPS ~ 0.22. The letters on the
Π–<A> compression isotherm indicate where the individual BAM images were taken and
correspond to (Image, <A>/Å2·monomer-1): (A, 41), (B, 16), (C, 11.8), (D, 10.5), (E, 9.8),
(F, 9.2), (G, 8.9), and (H, 8.6). All BAM images are 3.2 × 2.4 mm2 in size. Bright
domains in Figure D→H are PCL crystallites.
Chapter 7 Blends of PCL and Intermediate Molar Mass PS
202
While Figure 7.24 provided morphological data for a PS-rich blend of PCL/liquid PS
oligomer, Figure 7.25 provides representative data for a PCL-rich blend (XPS ~ 0.22) of
the same blend system. In the XPS ~ 0.22 blend, the films do not turn cloudy until Π is
much larger (Figure 7.25A through D). Unlike the PS-rich blend, droplets formed in the
PCL-rich blend may have much lower optical contrast (Figure 7.25E and F). At even
higher Π, it is clear that domains are no longer droplets (Figure 7.25G and H). One other
interesting feature of Figure 7.25 is the very bright spots that signify the nucleation and
growth of some PCL crystals.
At this stage, Figures 7.24 and 7.25 are only provided as proof that liquid PS
oligomers have very different properties in blends with PCL than higher molar mass PS.
While it is tempting to claim that the PCL/liquid PS oligomer system exhibits Π-induced
liquid-liquid phase separation, a complete understanding of the observed behavior is still
lacking. As such further speculation is saved for Chapter 9, where some suggestions for
future work are made.
7.4. Conclusions
This study demonstrates surface morphologies of immiscible intermediate molar mass
(glassy) PS blends with PCL as Langmuir films at the A/W interface. Π-<A> isotherm
studies indicate that the surface activity of the blend films is only controlled by the
amphiphilic PCL component. The addition of glassy PS to PCL has no effect on the Π-A
isotherm of PCL in the monolayer state if one ignores the PS component. Instead,
solidlike nanoscale PS aggregates tend to exist on top of a liquidlike PCL film. The
better dispersed PS aggregates for all the blends apparently arise from more favorable PS
wetting of the PCL layer than the water surface. BAM studies show that PCL-rich blends
exhibit nucleation and growth of PCL crystals upon collapse of the monolayer, whereas
Chapter 7 Blends of PCL and Intermediate Molar Mass PS
203
PS inhibits PCL crystallization when PS is the major component. In PS-rich blends, the
composition-dependent morphological features show PS aggregates can self-assemble
over longer length scales. The networklike morphologies observed for PS-rich blends
show similarity to morphological features observed in blends of amphiphilic PDMS and
non-amphiphilic octaisobutyl-POSS,48(g) and blends of amphiphilic trisilanolisobutyl-
POSS with amphiphilic PDMS, where non-amphiphilic trisilanolisobutyl-POSS may
form non-amphiphilic hydrophobic dimers upon collapse.48(c) Hence, it appears that
networklike morphologies of hydrophobic nanoscale aggregates are a common feature
when non-amphiphilic materials (POSS and PS) are blended with amphiphilic materials
that form liquidlike monolayers (PDMS and PCL) at the A/W interface.
![EFFECT OF AROMATIC OIL ON PHASE DYNAMICS OF S … 2016 paper... · immiscible IR (polyisoprene) / NR (natural rubber) blends [4] are used due to the improved wet-skid resistance.](https://static.fdocument.org/doc/165x107/5aaa30d17f8b9a72188de79b/effect-of-aromatic-oil-on-phase-dynamics-of-s-2016-paperimmiscible-ir-polyisoprene.jpg)