
A Comparison of -Test and Mutual Information as Distinguisher … · 2019-10-24 · A Comparison of...
15
A Comparison of χ 2 -Test and Mutual Information as Distinguisher for Side-Channel Analysis Bastian Richter, David Knichel, and Amir Moradi Ruhr University Bochum, Horst G¨ortz Institute Bochum, Germany [email protected] Abstract. Masking is known as the most widely studied countermea- sure against side-channel analysis attacks. Since a masked implementa- tion is based on a certain number of shares (referred to as the order of masking), it still exhibits leakages at higher orders. In order to exploit such leakages, higher-order statistical moments individually at each order need to be estimated reflecting the higher-order attacks. Instead, Mutual Information Analysis (MIA) known for more than 10 years avoids such a moment-based analysis by considering the entire distribution for the key recovery. Recently the χ 2 -test has been proposed for leakage detection and as a distinguisher where also the whole distribution of the leakages is analyzed. In this work, we compare these two schemes to examine their dependency. Indeed, one of the goals of this research is to conclude whether one can outperform the other. In addition to a theoretical comparison, we present two case studies and their corresponding practical evaluations. Both case studies are masked hardware implementations; one is an FPGA-based re- alization of a threshold implementation of PRESENT, and the other is an AES implementation as a coprocessor on a commercial smart card. Keywords: chi squared test · mutual information analysis · side-channel attacks 1 Introduction When developing real-world cryptographic applications, implementation attacks pose a serious threat. The past has shown that cryptographic applications like locking systems [5,17], one-time-password tokens [16], RFID cards [15], and mesh networks [4] not incorporating strong countermeasures are susceptible to Side- Channel Analysis (SCA) attacks. Thus, it is very important to harden these during development and to thoroughly test by performing possible attacks. Within the area of countermeasures against SCA attacks, masking is widely considered as the most important one since it can give certain guarantees, e.g. threshold implementations [14] concerning glitches in the implementation. By splitting the computation into shares, direct leakage of the state can be prevented
Transcript of A Comparison of -Test and Mutual Information as Distinguisher … · 2019-10-24 · A Comparison of...
A Comparison ofχ2-Test and Mutual Information
as Distinguisher for Side-Channel Analysis
Bastian Richter, David Knichel, and Amir Moradi
Ruhr University Bochum, Horst Gortz InstituteBochum, Germany
Abstract. Masking is known as the most widely studied countermea-sure against side-channel analysis attacks. Since a masked implementa-tion is based on a certain number of shares (referred to as the order ofmasking), it still exhibits leakages at higher orders. In order to exploitsuch leakages, higher-order statistical moments individually at each orderneed to be estimated reflecting the higher-order attacks. Instead, MutualInformation Analysis (MIA) known for more than 10 years avoids such amoment-based analysis by considering the entire distribution for the keyrecovery. Recently the χ2-test has been proposed for leakage detectionand as a distinguisher where also the whole distribution of the leakagesis analyzed.In this work, we compare these two schemes to examine their dependency.Indeed, one of the goals of this research is to conclude whether one canoutperform the other. In addition to a theoretical comparison, we presenttwo case studies and their corresponding practical evaluations. Both casestudies are masked hardware implementations; one is an FPGA-based re-alization of a threshold implementation of PRESENT, and the other isan AES implementation as a coprocessor on a commercial smart card.
Keywords: chi squared test · mutual information analysis · side-channelattacks
1 Introduction
When developing real-world cryptographic applications, implementation attackspose a serious threat. The past has shown that cryptographic applications likelocking systems [5,17], one-time-password tokens [16], RFID cards [15], and meshnetworks [4] not incorporating strong countermeasures are susceptible to Side-Channel Analysis (SCA) attacks. Thus, it is very important to harden theseduring development and to thoroughly test by performing possible attacks.
Within the area of countermeasures against SCA attacks, masking is widelyconsidered as the most important one since it can give certain guarantees, e.g.threshold implementations [14] concerning glitches in the implementation. Bysplitting the computation into shares, direct leakage of the state can be prevented
2 B. Richter, D. Knichel and A. Moradi
and not only reduced or covered by noise like with hiding countermeasures. Inthe univariate case these masking schemes are developed to prevent leakageup to a certain statistical order, i.e. a first-order masking prevents extractinginformation via the first statistical moment but might still be attackable via thesecond centered statistical moment. However, higher-order statistics are moresusceptible to noise, so the required number of traces to sufficiently approximatethe statistics are increasing exponentially with the order [19].
Further, when implementing masking schemes, the designers always haveto test whether some physical side-effects of the platform are influencing theeffectiveness of the countermeasure. Here, especially coupling [10,3] is a mainproblem for hardware implementations which can lead to unpredicted leakagesin lower orders due to undesired interaction between the shares.
An initial test is usually performed by using a leakage detection method oftenbased on the t-test [8]. In 2018 the χ2-test [12] was proposed as an addition tothe t-test. While the t-test highlights leakage in each order individually, the χ2-test considers the whole distribution and can thus detect leakage spread overmultiple orders. Leakage detected with the χ2-test but not in the t-tests canindicate that the noise in the measurements is not sufficient to cover the leakagein the higher orders.
However, leakage detected in these tests does not necessarily indicate ex-ploitable leakage. To further examine if detected leakage can be exploited, attackshave to be executed. The original Correlation Power Analysis (CPA) [2] attackcorrelates the measurements with a hypothetical power model based on a guessedkey and thus targets the first order. Fortunately, the attack can be extended tohigher orders by preprocessing the measurements [19] (c.f. Section 2.5). But still,this only attacks individual orders like the t-test. To attack the whole distribu-tion different attack methods are needed. The first one was Mutual InformationAnalysis (MIA) presented by Gierlichs et al. in 2008 [7] which computes the mu-tual information between the measurements and an assumed model to reveal thekey. As this is based on histograms or a kernel distribution, it also considers thewhole distribution. In addition to leakage detection Moradi et al. also proposeda distinguisher based on the χ2-test, which tests whether the groups defined bya model are independent and thus can also reveal the keys. In combination withmodern measurement methods like on-die EM measurements [6,9] which canmonitor the leakage of the cryptographic core independently of the surroundingcircuitry, a low noise measurement might defeat a masking implementation whentargeting with the combined leakage of all orders.
1.1 Contribution
As both methods follow similar approaches and can actually be calculated onthe same precomputed histograms, the question arises whether one of the meth-ods shows an advantage over the other. To evaluate this, we first try to find atheoretical dependency between the two tests and show why these schemes arenot directly related in the way the attacks are currently formulated. Further,we present two case studies which successfully exploit leakage in higher orders.
A Comparison of χ2-Test and MI as Distinguisher for SCA 3
The first one is a threshold implementation of PRESENT implemented on anFPGA and the second an SCA-protected AES hardware implementation on asmart card.
2 Background
2.1 χ2-Test and Distinguisher
Utilizing the χ2-test to detect leakage independent of statistical moments wasinitially proposed by Moradi et al. in 2018 [12]. Further, they showed that it canalso be used as a distinguisher similar to MIA.
χ2-Test of Independence Pearson’s χ2-test of independence checks whethertwo random variables are independent. For two random variables X and Y , ittests whether
H0 : Pr[X = x|Y = y] = Pr[X = x]
which means that they are independent. Let P ∈ Rr×c be the matrix with pijstanding for the joint probabilities Pr[X = xi ∧ Y = yj ] that X takes its i-thcategory and Y takes its j-th. If H0 holds, the multiplication rule states thatPr[X = xi ∧ Y = yj ] = Pr[X = xi] · Pr[Y = yj ]. So in a random experimentwith N repetitions, the expected frequency that X = xi and Y = yj shouldbe N · Pr[X = xi] · Pr[Y = yj ]. Since Pr[X = xi] and Pr[Y = yj ] are notknown, they have to be estimated from the contingency table F = (fi,j) ∈ Rr×cwhere fi,j is the number of times that xi occurred together with yj . To estimatePr[X = xi] we sum up all frequencies in the corresponding row and divide itby the total number of experiments N . To estimate Pr[Y = yj ] we sum up allfrequencies in the corresponding column and divide it by N . This results in theexpected frequency being calculated as
ei,j =
( c−1∑k=0
fi,k
N
)( r−1∑k=0
fk,j
N
)·N =
( c−1∑k=0
fi,k
)( r−1∑k=0
fk,j
)N
. (1)
Now the Z value is a metric of how much the actual frequencies fi,j differ from theexpected ones ei,j . It is computed in the same fashion as shown in Equation (2):
Z =
r−1∑i=0
c−1∑j=0
(fi,j − ei,j)2
ei,j. (2)
With the degree of freedom as v = (r − 1) · (c− 1). The p-value
p =
∫ ∞Z
f(Z, v) dx, f(Z, v) =
Zv2−1e−
Z2
2v2 Γ( v
2 )Z > 0
0 Z ≤ 0, (3)
4 B. Richter, D. Knichel and A. Moradi
with the gamma function Γ can be used as a metric in order to test H0. Itexpresses the probability whether the null hypothesis is accepted. We use thistest for specific leakage assessment and as a distinguisher in a Differential PowerAnalysis (DPA). More precisely, we test whether the distribution depends of thevalue of a hypothetical power model. In this case, X corresponds to the valuemeasured by the ADC of the oscilloscope and Y corresponds to the value of thepower model. It can also be used in addition to the non-specific t-test [12], whereY is simply 0 or 1, depending of whether a random plaintext or a fixed plaintextis used.
Distinguisher Very similar to the way the Pearson correlation coefficient isused as a distinguisher in a DPA/CPA, we may use the result of the χ2-test.In DPA/CPA, it is assumed that for the correct key guess, the values of thepower model correlates well with the actual power consumption. In χ2-test theassumption is that for the correct key guess, the traces depend on the values ofthe power model, whereas the power consumption is independent of the modelfor wrong key guesses. For every key guess this can be checked with the χ2-testof independence. Similar to the t-test, we can state with a certain confidencethat the assumption H0 is wrong, which in our case means that the values ofthe power consumption depends on the values of the model.
2.2 Mutual information Analysis
Mutual Information Analysis (MIA) for SCA was initially proposed by Gierlichset al. in 2008 [7] as a more generic information-theoretic distinguisher.
Mutual Information The Mutual Information (MI) I is a measure for theinformation shared between two random variables X and Y .
As the entropy H(X) is a measure of the information contained in X we cansubstract the conditional entropy H(X|Y ) as this is exactly the portion of theentropy which is not covered by Y to get the mutual information I(X;Y ).
I(X;Y ) = H(X)−H(X|Y )
= H(X) + H(Y )−H(X,Y ) = I(Y ;X)(4)
Suppose that X and Y are random variables of the discrete spaces X and Y, wecan also formulate the mutual information I(X;Y ) as
I(X;Y ) = −∑x∈X
∑y∈Y
Pr[X = x, Y = y]·
log2
(Pr[X = x, Y = y]
Pr[X = x]Pr[Y = y]
),
(5)
knowing the joint probability Pr[X = x, Y = y] and the marginal probabilitiesPr[X = x] and Pr[Y = y] which can be calculated from the contingency tables.
A Comparison of χ2-Test and MI as Distinguisher for SCA 5
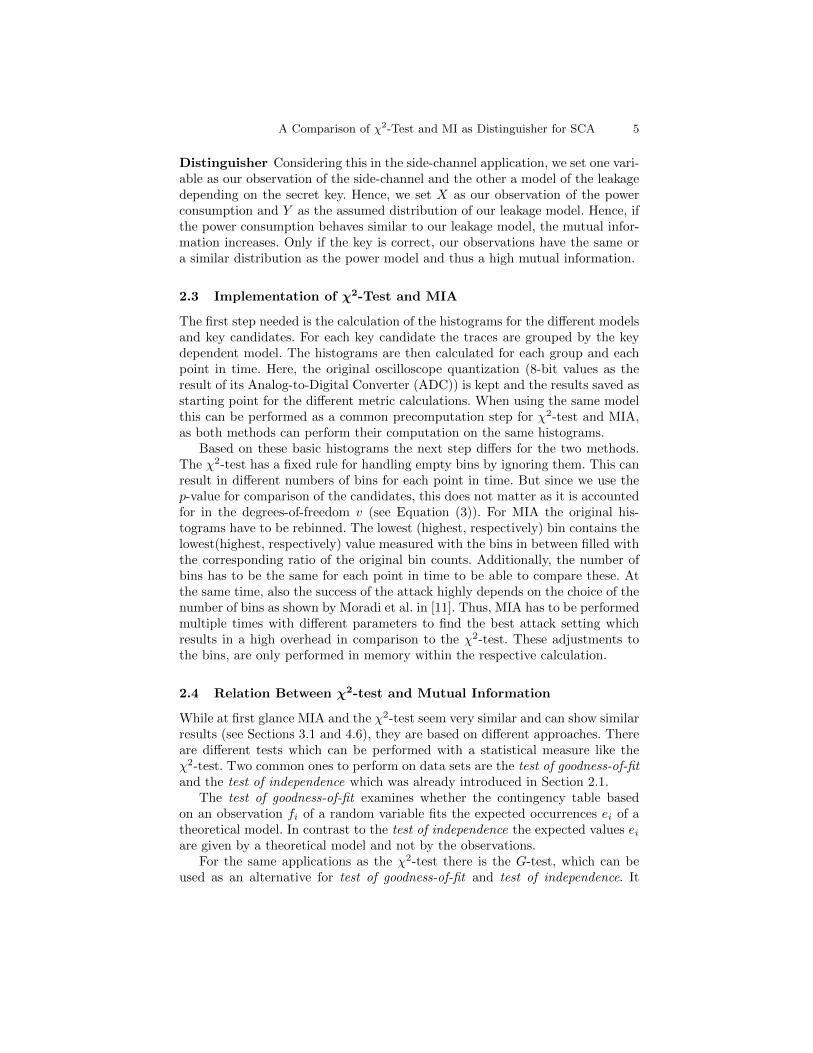
Distinguisher Considering this in the side-channel application, we set one vari-able as our observation of the side-channel and the other a model of the leakagedepending on the secret key. Hence, we set X as our observation of the powerconsumption and Y as the assumed distribution of our leakage model. Hence, ifthe power consumption behaves similar to our leakage model, the mutual infor-mation increases. Only if the key is correct, our observations have the same ora similar distribution as the power model and thus a high mutual information.
2.3 Implementation of χ2-Test and MIA
The first step needed is the calculation of the histograms for the different modelsand key candidates. For each key candidate the traces are grouped by the keydependent model. The histograms are then calculated for each group and eachpoint in time. Here, the original oscilloscope quantization (8-bit values as theresult of its Analog-to-Digital Converter (ADC)) is kept and the results saved asstarting point for the different metric calculations. When using the same modelthis can be performed as a common precomputation step for χ2-test and MIA,as both methods can perform their computation on the same histograms.
Based on these basic histograms the next step differs for the two methods.The χ2-test has a fixed rule for handling empty bins by ignoring them. This canresult in different numbers of bins for each point in time. But since we use thep-value for comparison of the candidates, this does not matter as it is accountedfor in the degrees-of-freedom v (see Equation (3)). For MIA the original his-tograms have to be rebinned. The lowest (highest, respectively) bin contains thelowest(highest, respectively) value measured with the bins in between filled withthe corresponding ratio of the original bin counts. Additionally, the number ofbins has to be the same for each point in time to be able to compare these. Atthe same time, also the success of the attack highly depends on the choice of thenumber of bins as shown by Moradi et al. in [11]. Thus, MIA has to be performedmultiple times with different parameters to find the best attack setting whichresults in a high overhead in comparison to the χ2-test. These adjustments tothe bins, are only performed in memory within the respective calculation.
2.4 Relation Between χ2-test and Mutual Information
While at first glance MIA and the χ2-test seem very similar and can show similarresults (see Sections 3.1 and 4.6), they are based on different approaches. Thereare different tests which can be performed with a statistical measure like theχ2-test. Two common ones to perform on data sets are the test of goodness-of-fitand the test of independence which was already introduced in Section 2.1.
The test of goodness-of-fit examines whether the contingency table basedon an observation fi of a random variable fits the expected occurrences ei of atheoretical model. In contrast to the test of independence the expected values eiare given by a theoretical model and not by the observations.
For the same applications as the χ2-test there is the G-test, which can beused as an alternative for test of goodness-of-fit and test of independence. It
6 B. Richter, D. Knichel and A. Moradi
is also based on histograms/contingency tables and also approximates the χ2
distribution.
G = 2∑∀i
fi · ln(fiei
)(6)
As shown in [13] Equation (6) can also be expressed in terms of probabilitiespi = 1
N
∑i fi,j and pi,j = 1
N fi,j with N the total number of observations.
G = 2N∑∀i,∀j
pi,j · (ln(pi,j)− ln(pi)− ln(pj)) (7)
By considering the definition of entropy H(x) = −∑x∈X p(x) · ln p(x) and joint
entropy H(x, y) = −∑x∈X ,y∈Y p(x, y) · ln p(x, y) based on the natural logarithm
and distributing the sum to the sub-terms we can further express G throughentropies and following from these mutual information.
G = 2N (H(x) + H(y)−H(x, y)) = 2N · I(x; y) (8)
Please note that the entropy and mutual information in computer science areusually calculated with log2 which introduces an additional factor of 1
ln 2 ≈ 1.443in Equation (8).
Based on this, there should only be a constant factor between mutual in-formation and the G value. As G-test and χ2-test both approximate the χ2-distribution, these should lead to the same results for reasonable sample sizes.So, there seems to be a connection between χ2 and mutual information. How-ever, the two tests are currently used in different approaches. For the χ2-test aspresented in [12] we split up the observations into sets based on a model andthen perform a test of independence, i.e. whether the distributions of the sets areindependent. In contrast, for MIA we calculate the mutual information betweenour model and the observations which is more like a test of goodness-of-fit, i.e.whether the observed distribution is similar to the theoretical model. Accord-ingly, the relation via the G-test does not apply. Since we cannot give a directtheoretical connection we further evaluate their behavior by two case studies.
2.5 Higher-Order CPA
CPA as introduced by Bier et al. [2] uses the Pearson correlation coefficient be-tween measurements and hypothetical leakage to extract the secret key. The hy-pothetical leakage is calculated for each challenge using a key dependent model.
In order to attack masked implementations, it is possible to perform a univari-ate (i.e., every point in time is considered individually) CPA at higher orders bypreprocessing the measurements. To this end, the point-wise mean is subtractedfrom the measurements t and the results are taken to the power of the order das t′ = (t − t)d. It is shown by Schneider et al. [20] in 2016 how to efficientlyperform these computations.
A Comparison of χ2-Test and MI as Distinguisher for SCA 7
3 Case Study 1: PRESENT Threshold Implementation
Our first case study is a threshold implementation of the PRESENT cipher aspresented in [18]. For better comparison we evaluate the same implementationused by Moradi et al. in [12]. To achieve first-order security the state of thecipher is split into three Boolean shares (x1, x2, x3) where x = x1 ⊕ x2 ⊕ x3.It is saved in three 16-by-4 bit shift registers and from there shifted 4 bits perclock cycle. After key addition, the state is shifted into the S-box which is splitup into two functions G and F separated by a register. The S-box lookups arethen run as a pipelined serial computation which takes 17 clock cycles with thePLayer run in parallel in one clock cycle after the S-boxes.
The design is implemented on a Xilinx Spartan-6 FPGA on a SAKURA-Gboard [1]. To collect the measurements, we used the integrated amplifier of theSAKURA-G board and sampled the power consumption at a sampling rate of1 GS/s. The core was running at a frequency of 160 MHz and the initial sharingperformed in the control FPGA to prevent leakage from the inputs, i.e. the targetFPGA receives masked plaintext and issues masked ciphertext.
Performing a random-vs-fixed (non-specific) t-test on the traces revealed min-imal leakage (t = 8.2) in the second and significant leakage (t = 39.55) in thethird order using 50,000,000 traces. Since we attack the first round of the en-cryption and the major leakage is right at the beginning of the measurement,we only consider the first 500 ns for the attack.
3.1 Results
As we are analyzing a nibble-serial implementation, we chose the Hamming dis-tance of two consecutive S-box lookups as our power model HD(S(pi⊕ki), S(pi+1⊕ki+1)). It results in 8-bit key candidates, as it is based on the distance betweentwo consecutive nibbles. To decrease the complexity of the attack, we can as-sume that we perform the 8 bit attack only for the first distance, continuingfrom there we always already know one of the two key nibbles and can workwith 4 bit candidates. To find the optimal number of bins for the MIA, we firsttested which settings lead to the best result for the nibble and then performedthe attack with this optimal number of bins.
We performed a key recovery on one of the key nibbles with χ2-test and MIAusing 50,000,000 traces. Figure 1 (a) and (c) show the χ2-p-value and the mutualinformation after all traces were processed. Both attacks are successful and thecorrect key can be clearly distinguished. As both methods use the same modelthey highlight the correct key at the same point in time but the period duringwhich the correct key stands out is longer for MIA. However, correct key andwrong candidates are more clearly separated in the χ2-test. This is also confirmedby Figures 1 (d) and (b) which plot the maximum MI (p-value, respectively) overthe number of traces in the calculation. The χ2-test needs 30,000,000 traces forthe key to stand out while MIA needs 36,000,000 traces for the correct key tobe more likely than the ghost peak.
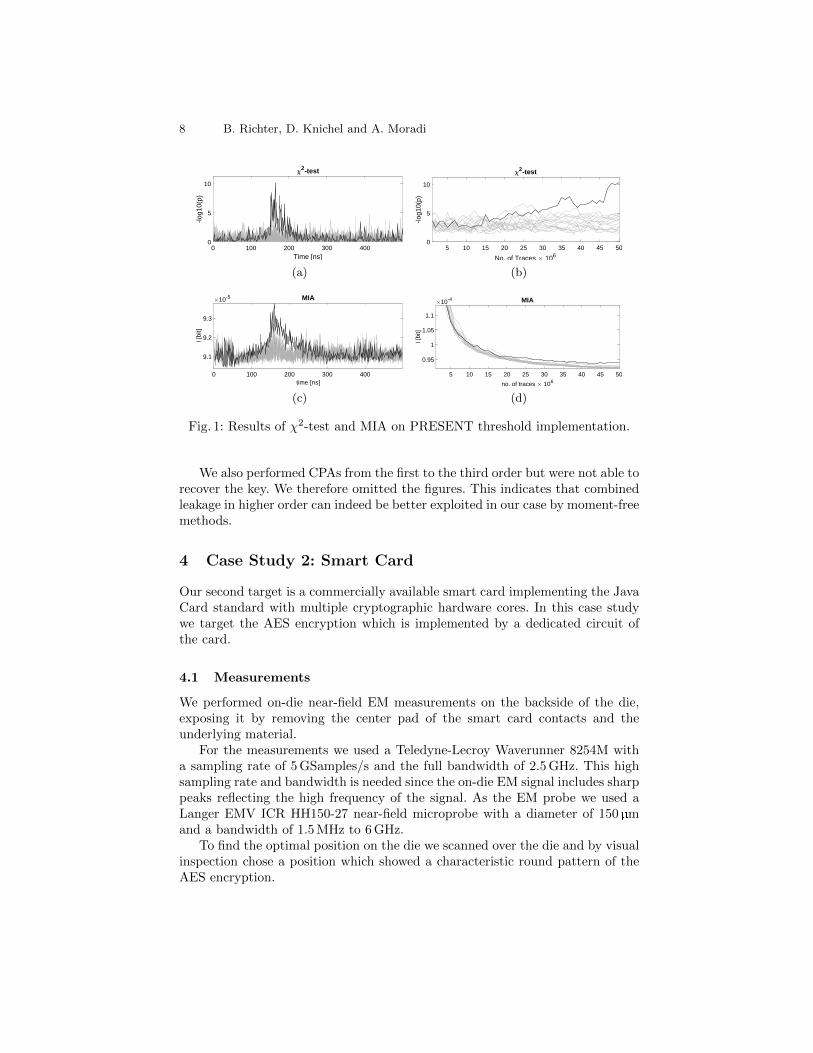
8 B. Richter, D. Knichel and A. Moradi
0 100 200 300 400Time [ns]
0
5
10
-log1
0(p)
2-test
(a)
5 10 15 20 25 30 35 40 45 50
No. of Traces 106
0
5
10
-log1
0(p)
2-test
(b)
0 100 200 300 400time [ns]
9.1
9.2
9.3
I [bi
t]
10-5 MIA
(c)
5 10 15 20 25 30 35 40 45 50
no. of traces 106
0.95
1
1.05
1.1
I [bi
t]
10-4 MIA
(d)
Fig. 1: Results of χ2-test and MIA on PRESENT threshold implementation.
We also performed CPAs from the first to the third order but were not able torecover the key. We therefore omitted the figures. This indicates that combinedleakage in higher order can indeed be better exploited in our case by moment-freemethods.
4 Case Study 2: Smart Card
Our second target is a commercially available smart card implementing the JavaCard standard with multiple cryptographic hardware cores. In this case studywe target the AES encryption which is implemented by a dedicated circuit ofthe card.
4.1 Measurements
We performed on-die near-field EM measurements on the backside of the die,exposing it by removing the center pad of the smart card contacts and theunderlying material.
For the measurements we used a Teledyne-Lecroy Waverunner 8254M witha sampling rate of 5 GSamples/s and the full bandwidth of 2.5 GHz. This highsampling rate and bandwidth is needed since the on-die EM signal includes sharppeaks reflecting the high frequency of the signal. As the EM probe we used aLanger EMV ICR HH150-27 near-field microprobe with a diameter of 150 µmand a bandwidth of 1.5 MHz to 6 GHz.
To find the optimal position on the die we scanned over the die and by visualinspection chose a position which showed a characteristic round pattern of theAES encryption.
A Comparison of χ2-Test and MI as Distinguisher for SCA 9
0 2 4 6 8 10 12Time [ s]
-50
0
50
Vol
tage
[AD
C u
nits
]
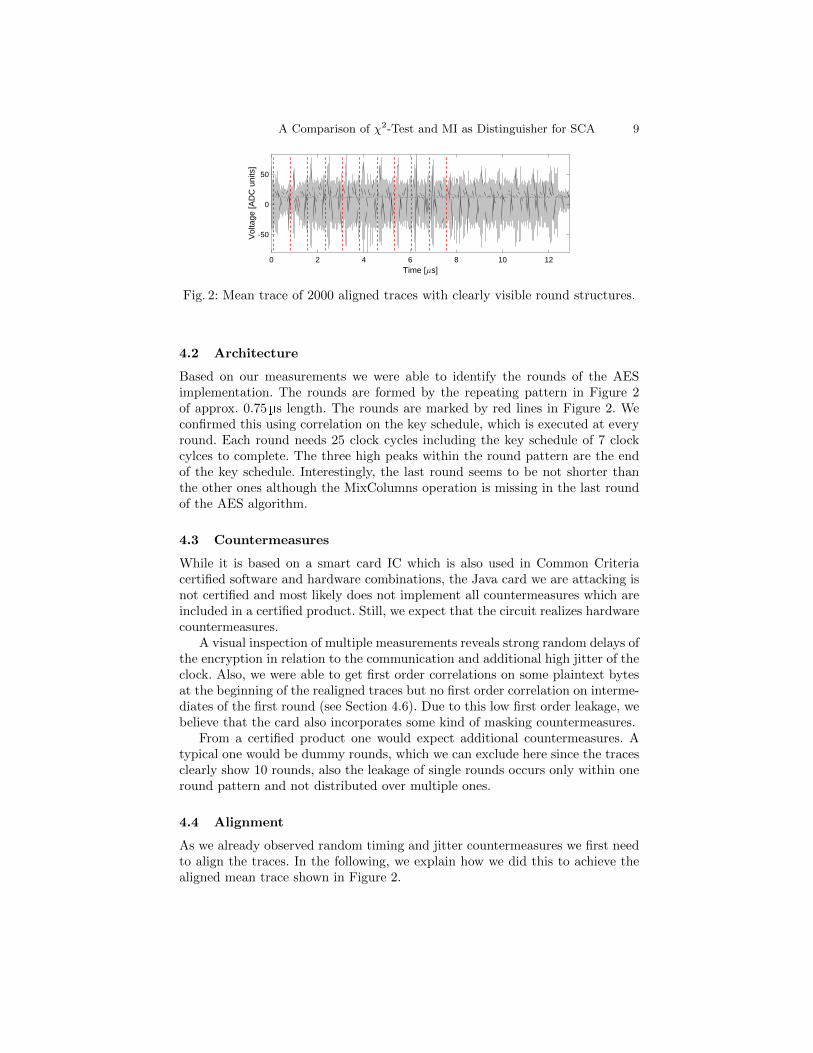
Fig. 2: Mean trace of 2000 aligned traces with clearly visible round structures.
4.2 Architecture
Based on our measurements we were able to identify the rounds of the AESimplementation. The rounds are formed by the repeating pattern in Figure 2of approx. 0.75 µs length. The rounds are marked by red lines in Figure 2. Weconfirmed this using correlation on the key schedule, which is executed at everyround. Each round needs 25 clock cycles including the key schedule of 7 clockcylces to complete. The three high peaks within the round pattern are the endof the key schedule. Interestingly, the last round seems to be not shorter thanthe other ones although the MixColumns operation is missing in the last roundof the AES algorithm.
4.3 Countermeasures
While it is based on a smart card IC which is also used in Common Criteriacertified software and hardware combinations, the Java card we are attacking isnot certified and most likely does not implement all countermeasures which areincluded in a certified product. Still, we expect that the circuit realizes hardwarecountermeasures.
A visual inspection of multiple measurements reveals strong random delays ofthe encryption in relation to the communication and additional high jitter of theclock. Also, we were able to get first order correlations on some plaintext bytesat the beginning of the realigned traces but no first order correlation on interme-diates of the first round (see Section 4.6). Due to this low first order leakage, webelieve that the card also incorporates some kind of masking countermeasures.
From a certified product one would expect additional countermeasures. Atypical one would be dummy rounds, which we can exclude here since the tracesclearly show 10 rounds, also the leakage of single rounds occurs only within oneround pattern and not distributed over multiple ones.
4.4 Alignment
As we already observed random timing and jitter countermeasures we first needto align the traces. In the following, we explain how we did this to achieve thealigned mean trace shown in Figure 2.

10 B. Richter, D. Knichel and A. Moradi
0 0.1 0.2 0.3 0.4 0.5 0.6 0.7 0.8 0.9 1Time [ s]
-50
0
50
Vol
tage
[AD
C u
nits
]
(a) Start: Only trigger
11.6 11.7 11.8 11.9 12 12.1 12.2 12.3 12.4 12.5 12.6Time [ s]
-50
0
50
Vol
tage
[AD
C u
nits
]
(b) End: Only trigger
0 0.1 0.2 0.3 0.4 0.5 0.6 0.7 0.8 0.9 1Time [ s]
-50
0
50
Vol
tage
[AD
C u
nits
]
(c) Start: After coarse alignment
11.6 11.7 11.8 11.9 12 12.1 12.2 12.3 12.4 12.5 12.6Time [ s]
-50
0
50
Vol
tage
[AD
C u
nits
]
(d) End: After coarse alignment
0 0.1 0.2 0.3 0.4 0.5 0.6 0.7 0.8 0.9 1Time [ s]
-50
0
50
Vol
tage
[AD
C u
nits
]
(e) Start: After peak alignment
11.6 11.7 11.8 11.9 12 12.1 12.2 12.3 12.4 12.5 12.6Time [ s]
-50
0
50V
olta
ge [A
DC
uni
ts]
(f) End: After peak alignment
Fig. 3: Beginning and end of ten traces each after the three different stages ofalignment.
Trigger on high peak To compensate for the long random delays, we used anadvanced trigger setting making use of both IO communication signals of thecard and the EM signal itself. This approach is possible since we are perform-ing a localized EM measurement which exhibits the highest amplitudes whenthe encryption is running. Using such a trigger results in traces with only smalltemporal variation of the beginning of the encryption block as shown in Fig-ure 3 (a) and 3 (b).
Coarse Alignment of AES Block We selected a reference pattern at thebeginning of the first trace. To recover the offset of the other traces, we thencorrelated the pattern over a window at the beginning. Shifting the traces bythe found offset results in Figure 3 (c) and (d). The beginning is now aligned butdue to the clock jitter, the difference between the traces increases to the end.
Fine Alignment Against Clock Jitter To overcome the clock jitter, wefollowed a windowing approach. For each clock cycle in each trace we searchedfor the minimum and selected a window around it. By only keeping the part ofthe trace belonging to the windows of the 150 clock cycles, we created traces
A Comparison of χ2-Test and MI as Distinguisher for SCA 11
whose clock cycles are aligned. As shown in Figure 3 (e) and (f) all peaks arenow aligned at the beginning as well as at the end.
4.5 Key Recovery
After performing the alignment, we were able to conduct an attack on a subsetof the key bytes. To this end, we used a Hamming distance (HD) model betweenoutputs of the S-box operation HD(S(pi⊕ki), S(pj⊕kj)). We found certain pairs(i, j) = {(1, 2), (5, 6), (9, 10), (13, 14), (6, 7), (14, 15)} which lead to successful keyrecovery. As the model targets the distance between two bytes the size of the keycandiates is 16 bits for the first four pairs and 8 bits for the last two ones sinceone of the bytes is already known from a previous pair. Interestingly, the firstfour pairs resemble the byte-wise distance between the second and third row ofthe AES state matrix.
0.425 0.43 0.435 0.44Time [ s]
0
5
10
-log 10
(p)
(6,7)(14,15)
(a)
0.76 0.762 0.764 0.766 0.768Time [ s]
0
10
20
-log 10
(p)
(1,2)(5,6)(9,10)(13,14)
(b)
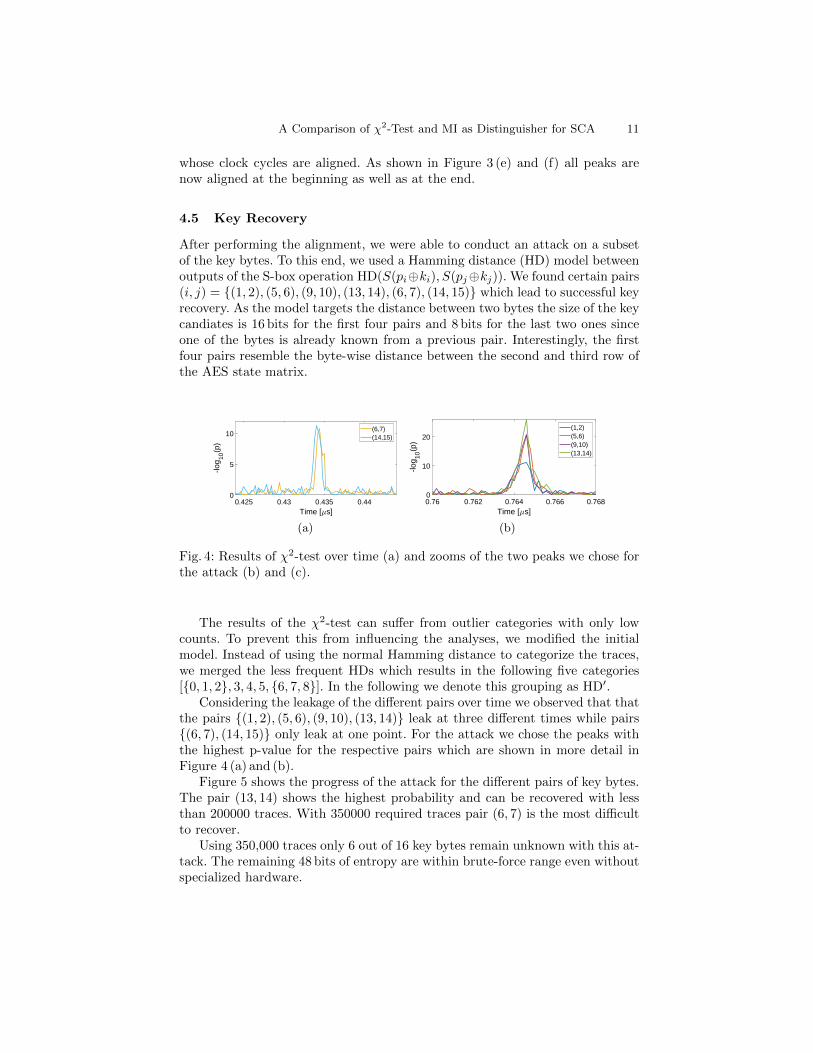
Fig. 4: Results of χ2-test over time (a) and zooms of the two peaks we chose forthe attack (b) and (c).
The results of the χ2-test can suffer from outlier categories with only lowcounts. To prevent this from influencing the analyses, we modified the initialmodel. Instead of using the normal Hamming distance to categorize the traces,we merged the less frequent HDs which results in the following five categories[{0, 1, 2}, 3, 4, 5, {6, 7, 8}]. In the following we denote this grouping as HD′.
Considering the leakage of the different pairs over time we observed that thatthe pairs {(1, 2), (5, 6), (9, 10), (13, 14)} leak at three different times while pairs{(6, 7), (14, 15)} only leak at one point. For the attack we chose the peaks withthe highest p-value for the respective pairs which are shown in more detail inFigure 4 (a) and (b).
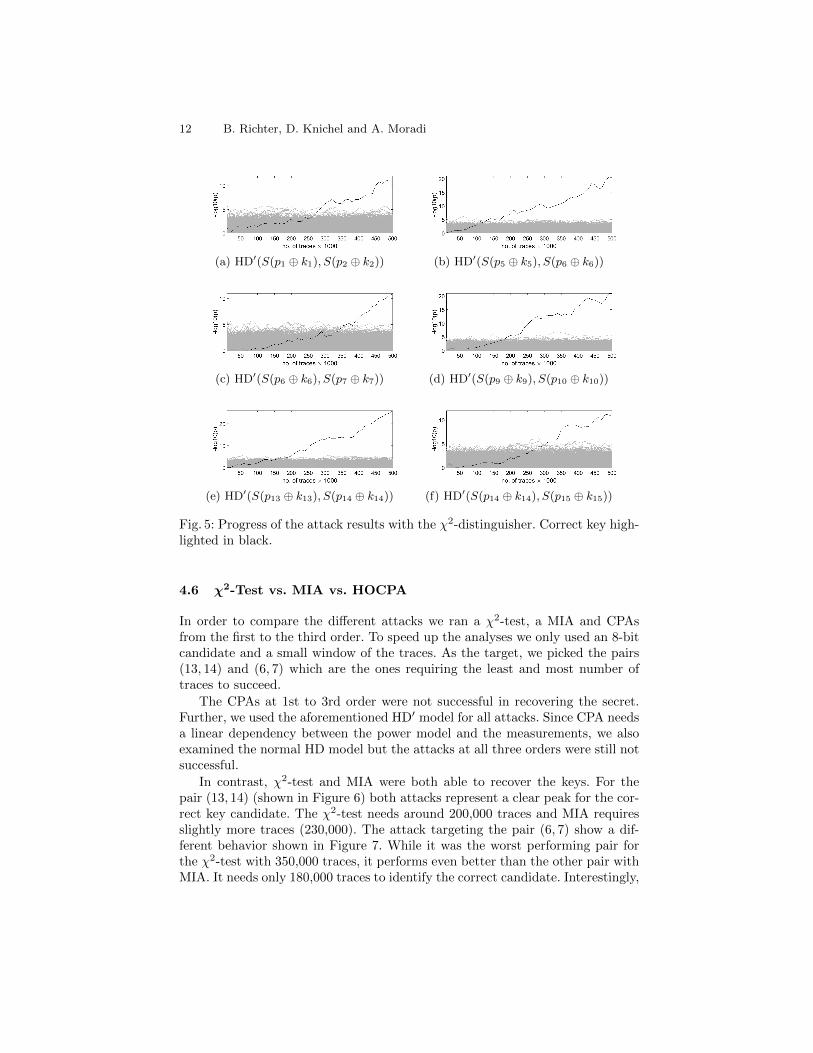
Figure 5 shows the progress of the attack for the different pairs of key bytes.The pair (13, 14) shows the highest probability and can be recovered with lessthan 200000 traces. With 350000 required traces pair (6, 7) is the most difficultto recover.
Using 350,000 traces only 6 out of 16 key bytes remain unknown with this at-tack. The remaining 48 bits of entropy are within brute-force range even withoutspecialized hardware.
12 B. Richter, D. Knichel and A. Moradi
(a) HD′(S(p1 ⊕ k1), S(p2 ⊕ k2)) (b) HD′(S(p5 ⊕ k5), S(p6 ⊕ k6))
(c) HD′(S(p6 ⊕ k6), S(p7 ⊕ k7)) (d) HD′(S(p9 ⊕ k9), S(p10 ⊕ k10))
(e) HD′(S(p13 ⊕ k13), S(p14 ⊕ k14)) (f) HD′(S(p14 ⊕ k14), S(p15 ⊕ k15))
Fig. 5: Progress of the attack results with the χ2-distinguisher. Correct key high-lighted in black.
4.6 χ2-Test vs. MIA vs. HOCPA
In order to compare the different attacks we ran a χ2-test, a MIA and CPAsfrom the first to the third order. To speed up the analyses we only used an 8-bitcandidate and a small window of the traces. As the target, we picked the pairs(13, 14) and (6, 7) which are the ones requiring the least and most number oftraces to succeed.
The CPAs at 1st to 3rd order were not successful in recovering the secret.Further, we used the aforementioned HD′ model for all attacks. Since CPA needsa linear dependency between the power model and the measurements, we alsoexamined the normal HD model but the attacks at all three orders were still notsuccessful.
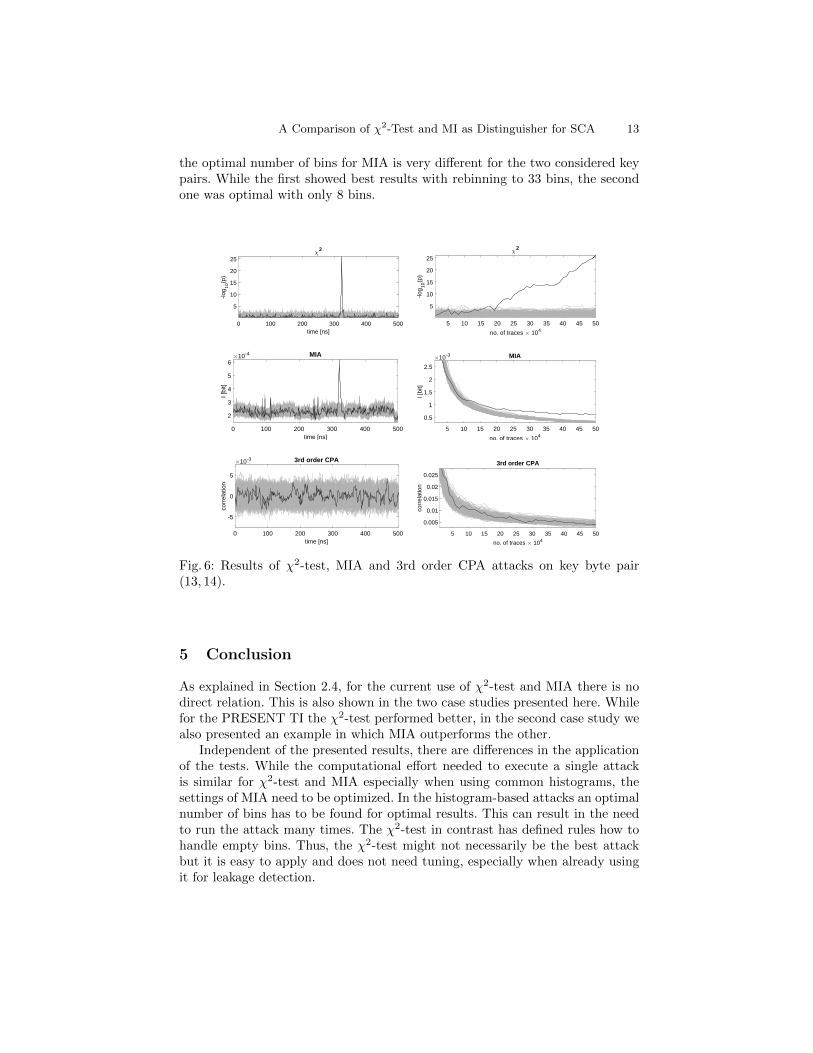
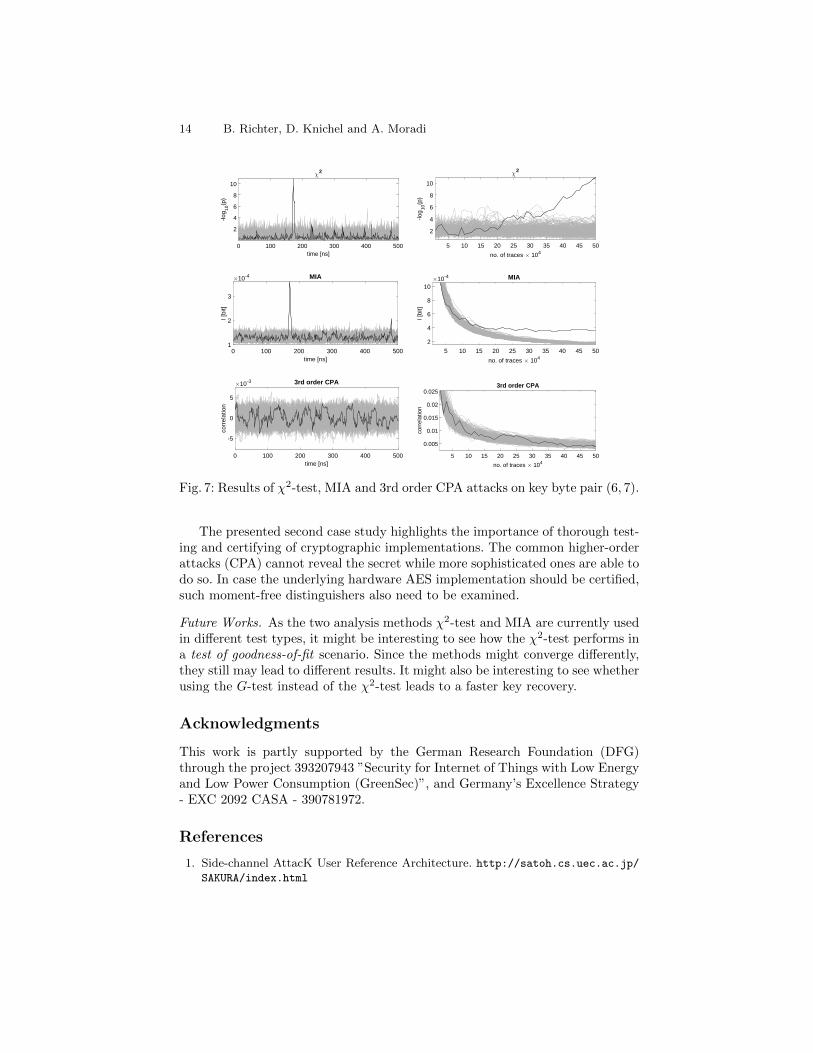
In contrast, χ2-test and MIA were both able to recover the keys. For thepair (13, 14) (shown in Figure 6) both attacks represent a clear peak for the cor-rect key candidate. The χ2-test needs around 200,000 traces and MIA requiresslightly more traces (230,000). The attack targeting the pair (6, 7) show a dif-ferent behavior shown in Figure 7. While it was the worst performing pair forthe χ2-test with 350,000 traces, it performs even better than the other pair withMIA. It needs only 180,000 traces to identify the correct candidate. Interestingly,
A Comparison of χ2-Test and MI as Distinguisher for SCA 13
the optimal number of bins for MIA is very different for the two considered keypairs. While the first showed best results with rebinning to 33 bins, the secondone was optimal with only 8 bins.
0 100 200 300 400 500time [ns]
5
10
15
20
25
-log
10(p
)
χ2
5 10 15 20 25 30 35 40 45 50
no. of traces × 104
5
10
15
20
25
-log
10(p
)
χ2
0 100 200 300 400 500time [ns]
2
3
4
5
6
I [bi
t]
×10-4 MIA
5 10 15 20 25 30 35 40 45 50
no. of traces × 104
0.5
1
1.5
2
2.5
I [bi
t]
×10-3 MIA
0 100 200 300 400 500time [ns]
-5
0
5
corr
elat
ion
×10-3 3rd order CPA
5 10 15 20 25 30 35 40 45 50
no. of traces × 104
0.005
0.01
0.015
0.02
0.025
corr
elat
ion
3rd order CPA
Fig. 6: Results of χ2-test, MIA and 3rd order CPA attacks on key byte pair(13, 14).
5 Conclusion
As explained in Section 2.4, for the current use of χ2-test and MIA there is nodirect relation. This is also shown in the two case studies presented here. Whilefor the PRESENT TI the χ2-test performed better, in the second case study wealso presented an example in which MIA outperforms the other.
Independent of the presented results, there are differences in the applicationof the tests. While the computational effort needed to execute a single attackis similar for χ2-test and MIA especially when using common histograms, thesettings of MIA need to be optimized. In the histogram-based attacks an optimalnumber of bins has to be found for optimal results. This can result in the needto run the attack many times. The χ2-test in contrast has defined rules how tohandle empty bins. Thus, the χ2-test might not necessarily be the best attackbut it is easy to apply and does not need tuning, especially when already usingit for leakage detection.
14 B. Richter, D. Knichel and A. Moradi
0 100 200 300 400 500time [ns]
2
4
6
8
10
-log
10(p
)
χ2
5 10 15 20 25 30 35 40 45 50
no. of traces × 104
2
4
6
8
10
-log
10(p
)
χ2
0 100 200 300 400 500time [ns]
1
2
3
I [bi
t]
×10-4 MIA
5 10 15 20 25 30 35 40 45 50
no. of traces × 104
2
4
6
8
10
I [bi
t]
×10-4 MIA
0 100 200 300 400 500time [ns]
-5
0
5
corr
elat
ion
×10-3 3rd order CPA
5 10 15 20 25 30 35 40 45 50
no. of traces × 104
0.005
0.01
0.015
0.02
0.025
corr
elat
ion
3rd order CPA
Fig. 7: Results of χ2-test, MIA and 3rd order CPA attacks on key byte pair (6, 7).
The presented second case study highlights the importance of thorough test-ing and certifying of cryptographic implementations. The common higher-orderattacks (CPA) cannot reveal the secret while more sophisticated ones are able todo so. In case the underlying hardware AES implementation should be certified,such moment-free distinguishers also need to be examined.
Future Works. As the two analysis methods χ2-test and MIA are currently usedin different test types, it might be interesting to see how the χ2-test performs ina test of goodness-of-fit scenario. Since the methods might converge differently,they still may lead to different results. It might also be interesting to see whetherusing the G-test instead of the χ2-test leads to a faster key recovery.
Acknowledgments
This work is partly supported by the German Research Foundation (DFG)through the project 393207943 ”Security for Internet of Things with Low Energyand Low Power Consumption (GreenSec)”, and Germany’s Excellence Strategy- EXC 2092 CASA - 390781972.
References
1. Side-channel AttacK User Reference Architecture. http://satoh.cs.uec.ac.jp/SAKURA/index.html
A Comparison of χ2-Test and MI as Distinguisher for SCA 15
2. Brier, E., Clavier, C., Olivier, F.: Correlation power analysis with a leakage model.In: CHES. Lecture Notes in Computer Science, vol. 3156, pp. 16–29. Springer(2004)
3. Cnudde, T.D., Ender, M., Moradi, A.: Hardware masking, revisited. IACR Trans.Cryptogr. Hardw. Embed. Syst. 2018(2), 123–148 (2018)
4. Dinu, D., Kizhvatov, I.: EM analysis in the iot context: Lessons learned from anattack on thread. IACR Trans. Cryptogr. Hardw. Embed. Syst. 2018(1), 73–97(2018)
5. Eisenbarth, T., Kasper, T., Moradi, A., Paar, C., Salmasizadeh, M., Shalmani,M.T.M.: On the power of power analysis in the real world: A complete break ofthe keeloqcode hopping scheme. In: CRYPTO. Lecture Notes in Computer Science,vol. 5157, pp. 203–220. Springer (2008)
6. Gandolfi, K., Mourtel, C., Olivier, F.: Electromagnetic analysis: Concrete results.In: CHES. Lecture Notes in Computer Science, vol. 2162, pp. 251–261. Springer(2001)
7. Gierlichs, B., Batina, L., Tuyls, P., Preneel, B.: Mutual information analysis. In:CHES. Lecture Notes in Computer Science, vol. 5154, pp. 426–442. Springer (2008)
8. Goodwill, G., Jun, B., Jaffe, J., Rohatgi, P.: A testing methodology for side channelresistance validation. In: NIST non-invasive attack testing workshop (2011)
9. Heyszl, J., Mangard, S., Heinz, B., Stumpf, F., Sigl, G.: Localized electromag-netic analysis of cryptographic implementations. In: CT-RSA. Lecture Notes inComputer Science, vol. 7178, pp. 231–244. Springer (2012)
10. Moradi, A., Mischke, O.: On the simplicity of converting leakages from multivariateto univariate - (case study of a glitch-resistant masking scheme). In: CHES. LectureNotes in Computer Science, vol. 8086, pp. 1–20. Springer (2013)
11. Moradi, A., Mousavi, N., Paar, C., Salmasizadeh, M.: Information security ap-plications. chap. A Comparative Study of Mutual Information Analysis Under aGaussian Assumption, pp. 193–205. Springer-Verlag, Berlin, Heidelberg (2009)
12. Moradi, A., Richter, B., Schneider, T., Standaert, F.: Leakage detection with thex2-test. IACR Trans. Cryptogr. Hardw. Embed. Syst. 2018(1), 209–237 (2018)
13. Morris, A.: An information theoretic measure of sequence recognition performance.Tech. rep., IDIAP (2002)
14. Nikova, S., Rijmen, V., Schlaffer, M.: Secure hardware implementation of nonlinearfunctions in the presence of glitches. J. Cryptology 24(2), 292–321 (2011)
15. Oswald, D., Paar, C.: Breaking mifare desfire MF3ICD40: power analysis and tem-plates in the real world. In: CHES. Lecture Notes in Computer Science, vol. 6917,pp. 207–222. Springer (2011)
16. Oswald, D., Richter, B., Paar, C.: Side-channel attacks on the yubikey 2 one-timepassword generator. In: RAID. Lecture Notes in Computer Science, vol. 8145, pp.204–222. Springer (2013)
17. Oswald, D., Strobel, D., Schellenberg, F., Kasper, T., Paar, C.: When reverse-engineering meets side-channel analysis - digital lockpicking in practice. In: SelectedAreas in Cryptography. Lecture Notes in Computer Science, vol. 8282, pp. 571–588.Springer (2013)
18. Poschmann, A., Moradi, A., Khoo, K., Lim, C., Wang, H., Ling, S.: Side-channelresistant crypto for less than 2, 300 GE. J. Cryptology 24(2), 322–345 (2011)
19. Prouff, E., Rivain, M., Bevan, R.: Statistical analysis of second order differentialpower analysis. IEEE Trans. Computers 58(6), 799–811 (2009)
20. Schneider, T., Moradi, A., Guneysu, T.: Robust and one-pass parallel computationof correlation-based attacks at arbitrary order. In: COSADE. Lecture Notes inComputer Science, vol. 9689, pp. 199–217. Springer (2016)