4. Materials and Methods - Information and Library...
24
4. Materials and Methods
Transcript of 4. Materials and Methods - Information and Library...
4. Materials and Methods
4.I. Experimental Animals
Swiss mice (either sex, 20-30 g) and Wistar rats (either sex, 200–230 g) procured from
disease free small animal house, CCS-Haryana Agricultural University, Hisar and Punjab
Agriculture University, Ludhiana were employed in the present study. They were housed in
institute animal house with free access to water and standard laboratory pellet chow diet. The
animals with cages were kept in the departmental animal house and were exposed to normal
cycles of light and dark. The experimental protocol was duly approved by the Institutional
Animal Ethics Committee (IAEC) and the care of the animals was carried out as stated in the
guidelines of the Committee for the Purpose of Control and supervision of Experiments on
Animals (CPCSEA), Ministry of Environment and Forest, Government of India (Reg. No.-
107/1999/CPCSEA).
4.II. Drugs and Chemicals
Vincristine sulfate (Chandra Bhagat Pharma Pvt. Ltd. Mumbai), pregabalin (gift
sample obtained from Ranbaxy Research Laboratories, Gurgaon), Ehrlich reagent (SRL,
Mumbai), NBT (Nitro Blue Tetrazolium) (Sigma Aldrich, USA), hexadecyl trimethyl
ammonium bromide (HETAB), O-dianisidine hydrochloride (S.D. Fine, Mumbai India),
Folin-Ciocalteu's phenol reagent (Merck Limited, Mumbai), 5, 5′-dithio, bis (2-nitrobenzoic
acid) (DTNB), bovine serum albumin (BSA), (Sisco Research Laboratories Pvt. Ltd.
Mumbai), were procured for the present study. All the reagents used in the present study were
of analytical grade. Pregabalin and Acorus calamus extracts were suspended in 0.5 % w/v
carboxy methyl cellulose solution and vincristine was diluted with normal saline.
4.III. Plant Materials
The fresh rhizome parts of Acorus calamus (AC) were collected at Kodaikanal of
Tamilnadu, India and authenticated by Dr. D. Stephen, Assistant Professor, Department of
Botany, American College, Madurai district, Tamilnadu. Plant sample has been kept in
voucher specimen (PUP-218/2009-2010) at Punjabi University, Patiala for future reference.
After authentication, fresh rhizomes of AC were collected, cleaned thoroughly with distilled
water and dried under shade.
4.IV. Preparation of Extracts
4.IV.A. Preparation of Hydro-Alcoholic Extract of Acorus calamus (HAE-AC)
The shade dried rhizomes of Acorus calamus were pulverized in a mechanical grinder
to obtain coarse powder (sieve no.10/40). The coarsely powdered plant material was subjected
to extraction with mixture of ethanol:water (1:1, 50%) at room temperature as described by
Shukla et al. (2002) as well as Parab and Mengi (2002). After completion of extraction, the
solvent was completely removed by vacuum drying at low temperature (<50ºC). The yield of
hydroalcoholic extract was found to be 26.4% (w/w).
4.IV.A.1. Phytochemical Analysis
Phytochemical analysis was carried out in hydroalcoholic extract of Acorus calamus
for identification of flavonoids, saponins, tannins, steroids, alkaloids, and phenolic
compounds as described by Evans (2009), and Harborne (1998). Briefly, Mg-HCl and Zn-HCl
were used for flavonoids, foam test was used for saponins, ferric chloride and gelatin were
used for tannins, acetic anhydride and sulphuric acid were used for steroids, Wagner’s and
Heger’s reagents were used for alkaloid, and ferric chloride was used for phenolic compounds
(data not shown). The experiments were carried out three times for each phytochemical
constituent. Further, the hydroalcoholic extracts was also evaluated for absence of β-asarone
by measuring the extinction at 253 and 303 nm using HPLC method. β-asarone a phyto-
constituent of Acorus calamus has been reported to be responsible for psychedelic
(hallucinogen), sedative and carcinogenic actions (Zanoli et al., 1988; Chen et al., 2009).
Hence AC free from β-asarone was selected for the present study.
4.IV.B. Preparation of Saponin Rich Extract of Acorus calamus From HAE-AC (SRE-AC)
Saponins rich extract was prepared from hydroalcoholic extract of Acorus calamus as
described in the method of Harborne (1988) with some modification. Briefly, the aqueous
extract of Acorus calamus (100 g) was refluxed with n-butanol for 2 h and n-butanol soluble
constituents were separated by filtration. The n-butanol layer was sequentially washed with
distilled water, alkali (2% KOH) and distilled water again. The n-butanol layer was
evaporated and dried under vacuum to obtain a clear powder of crude saponins.
4.IV.B.1. Determination of Total Saponins
The total saponins content of SRE-SD was determined by the vanillin-sulfuric acid
method as described by Hiai et al. (1976). This extract was mixed with vanillin (8%, w/v) and
sulfuric acid (72%, w/v). The mixture was incubated at 60°C for 10 min, cooled in an ice
water bath for another 15 min followed by absorbance measurement at 538 nm. Ursolic acid
was used as a reference standard and the content of total saponins was expressed as ursolic
acid equivalents (UA mg/mg extract).
4.V. Toxicity Study
4.V.A. Acute Oral Toxicity Test in Mice
Acute toxicity tests were performed in both male and female mice in order to evaluate
the toxic effect of hydro-alcoholic extract of Acorus calamus (2500, 5000, 7500, and 10000
mg/kg, p.o.) in different gender groups. All deviations in general behavior i.e., convulsions,
disorientation, hypoactivity, hyperventilation, pilo-erection and mortality rate in mice were
monitored continuously for 24 hours after dosing completed. The median lethal dose (LD50)
was calculated according to the method of Litchfield and Wilcoxon, (1949), and Miller and
Tainter, (1944). The experimental procedure for toxicity studies was followed according to
the Organization for Economic Co-operation and development (OECD) guideline no. 401 and
425 (Combes et al., 2006; Lipnick et al., 1995; Schlede et al., 1995).
4.V.B. Sub-Acute Oral Toxicity Test in Rat
Sub-acute toxicity tests were performed in rats of both sexes, in order to evaluate the
toxic effect of the HAE-AC in different gender groups. Based on median lethal dose (LD50)
values (5070.59 mg/kg) obtained from acute toxicity studies, the selection of doses for sub-
acute toxicity study was carried out. The dose selected for sub-acute toxicity studies ranges
from 200 mg/kg, p.o. to 1000 mg/kg, p.o. The dosing was done daily and the rats were
observed for 28 days for signs of sub-acute toxicity i.e. mortality, and the body weight
changes. On the 28th day, the animals were anaesthetized with chloroform and sacrificed.
Whole blood samples were collected by cardiac puncture and transferred into
ethylenediaminetetraacetic acid (EDTA), sodium fluoride and gel containing tubes for
hematological and biochemical analysis. Tissue sample i.e, liver, heart, and kidney were
collected from the rats. Further, tissue samples were weighed, observed for color changes of
the vital organs and then subjected to histopathological examinations.
4.VI. Induction of Neuropathic Pain in Rats
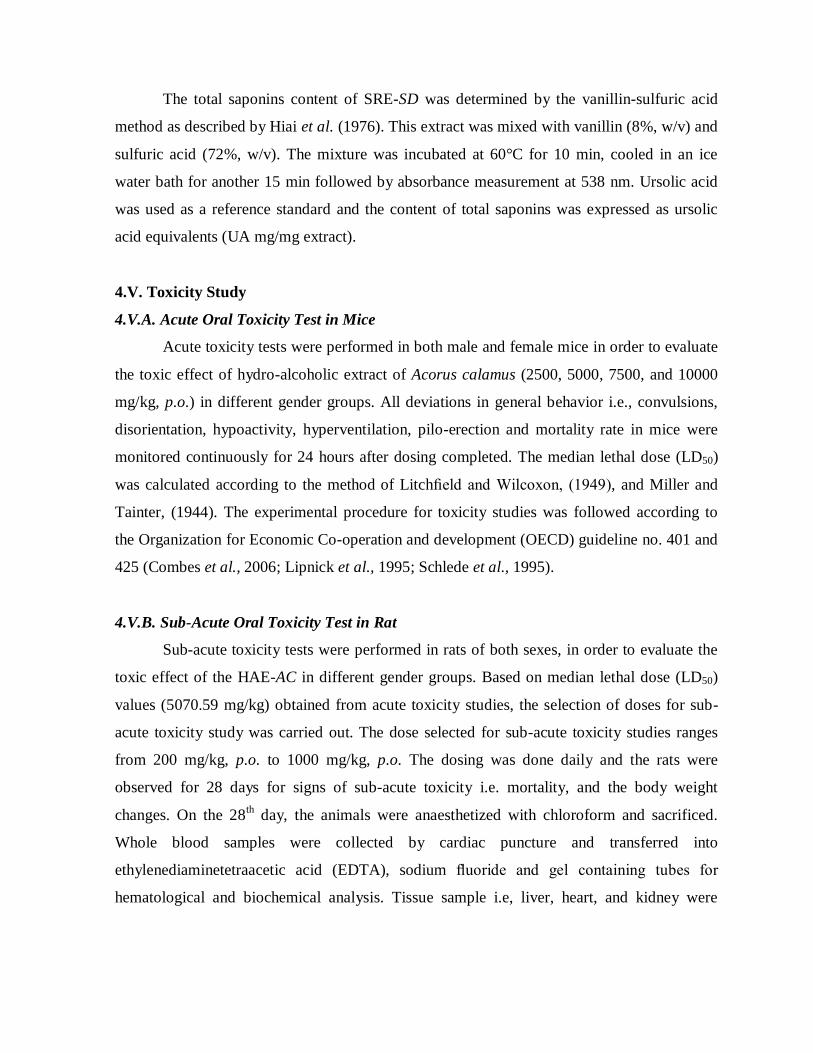
4.VI.A. Painful Peripheral Neuropathy by Tibial and Sural Nerve Transection
Peripheral neuropathic pain was induced by tibial and sural nerve transection as
described by the method of lee et al., (2000). Briefly, the rat was anesthetized with thiopental
sodium (35 mg/kg i.p.). The skin layer of the lateral surface on the left thigh was incised and a
cut was made directly through the biceps femoris muscle to expose the sciatic nerve and its
three terminal branches (the sural, common peroneal and tibial nerves) were identified.
Thereafter, the tibial and sural nerves were ligated, with silk suture and transection was made
at 2 mm from the ligation at distal side. The common peroneal nerve was left intact and no
contact was made with it. The muscle and the skin layers were closed immediately. Sham
control group was performed by exposing the sciatic nerve and its branches without inducing
any lesion.
Fig. 4. Induction of painful peripheral neuropathy by tibial and sural nerve transection (TST).
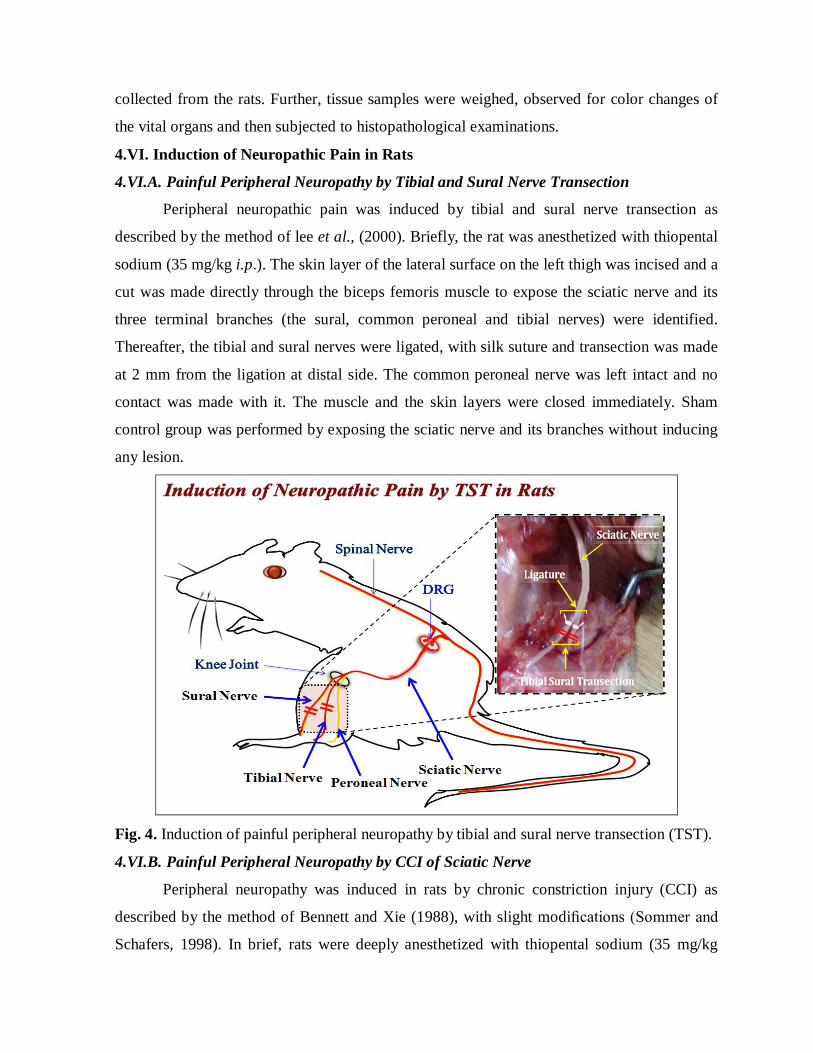
4.VI.B. Painful Peripheral Neuropathy by CCI of Sciatic Nerve
Peripheral neuropathy was induced in rats by chronic constriction injury (CCI) as
described by the method of Bennett and Xie (1988), with slight modifications (Sommer and
Schafers, 1998). In brief, rats were deeply anesthetized with thiopental sodium (35 mg/kg
i.p.). The hair of the rat’s lower back and thigh were shaved, and the skin was sterilized with
0.5% chlorhexidine. The skin of the lateral surface of the left thigh was incised and a cut was
made directly through the biceps femoris muscle to expose the sciatic nerve and four ligatures
(silk 4-0), were placed around the nerve proximal part of the trifurcation with a distance of
one millimeter between each ligature. The ligatures were loosely tied until a short flick of the
ipsilateral hind limb was observed. After performing nerve ligation, muscular and skin layer
was immediately sutured with thread, and topical antibiotic was applied.
Fig. 5. Induction of painful peripheral neuropathy by chronic constriction injury (CCI) of sciatic nerve. 4.VI.C. Peripheral Neuropathy by Vincristine
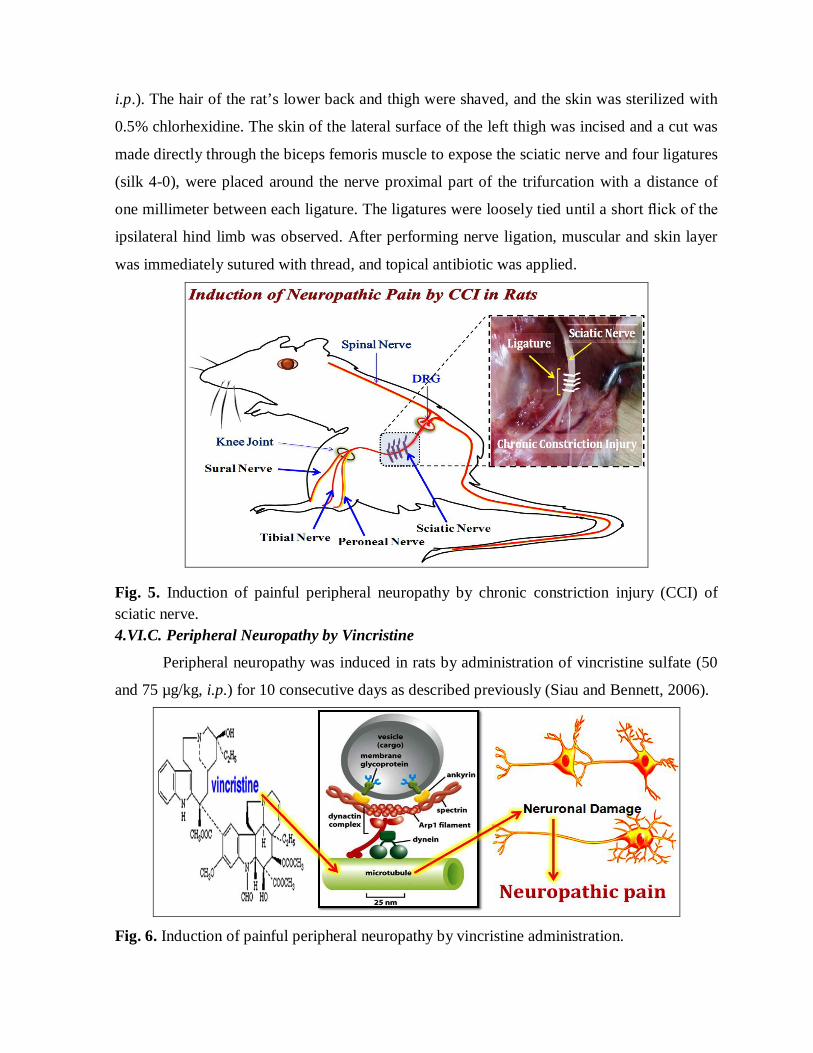
Peripheral neuropathy was induced in rats by administration of vincristine sulfate (50
and 75 µg/kg, i.p.) for 10 consecutive days as described previously (Siau and Bennett, 2006).
Fig. 6. Induction of painful peripheral neuropathy by vincristine administration.
4.VII. Behavioral Assessment for Painful Neuropathic Parameters
All the behavioral tests were carried out on the different time intervals as per study
protocol, i.e., 0, 1, 3, 6, 9, 12, 15, 18 and 21st day. Spontaneous motor activity, motor co-
ordination test, body and organ weight changes were performed in the acute and sub-acute
oral toxicity study protocol to find behavioral, motor function, whole body and vital organ
mass changes.
4.VII.A. Motor Co-ordination Test (Rota-Rod Test)
Motor co-ordination (grip muscle strength) was evaluated by rota-rod device as
described by Jones and Roberts (1968) with slight modification of Muthuraman et al. (2008).
Rats were placed for one minute on the rotating rod (25 rpm). The time taken for the falling
from the roller, during one minute period was recorded.
4.VII.B. Spontaneous Locomotor (Exploratory) Activity Test (Photo-Actometer Test)
Photo-actometer test was employed to assess the effect of drug treatment on
spontaneous motor (exploratory) activity. Each animal was observed for a period of 5 min in a
square closed field arena (30 x 30 x 30 cm) equipped with 6 photocells in the outer wall.
Interruptions of photocell beams (locomotor / exploratory action) were recorded by means of
a 6 digits counter (Goddard et al., 2008).
4.VII.C. Cold-Allodynia Test (Acetone Drop Test)
Cold-allodynia of the hind paw was assessed using acetone drop method as described
by Choi et al. (1994), with slight modification (de la Calle et al., 2002) for assessing the
reactivity to non-noxious cold chemical stimuli. The rats were placed on the top of a wire
mesh grid, which allowed access to the hind paws. Acetone 0.1 ml (100 µl) was sprayed on
the plantar surface of hind paw of rat. Cold sensitive reaction with respect to either paw
licking, shaking or rubbing the hind paw was observed and recorded as paw lifting duration
for 20 s test period.
4.VII.D. Heat (Radiant) Hyperalgesia Test (Plantar Test)
Radiant heat hyperalgesia of the left hind paw was assessed using the radiant heat
lamp source as described by the method of Hargreaves et al. (1988), for assessing the
reactivity to noxious radiant heat stimuli. The intensity of the radiant heat stimulus was
maintained at 25 ± 0.1º C. Response of left hind paw withdrawal threshold was noted. Cut-off
time of 20 s was maintained.
4.VII.E. Heat (Conduction) Hyperalgesia (Hot Plate Test)
Thermal nociceptive threshold, as an index of thermal-hyperalgesia, was assessed
using Eddy’s hot plate as described by the method of Eddy et al. (1950). Eddy’s hot plate was
pre-heated and maintained at temperature of 52.5±0.5°C. Rats were placed on the hot plate
and nociceptive threshold, with respect to jumping or hind paw of licking was recorded in
seconds. The cut-off time of 15 seconds was maintained.
4.VII.F. Tactile Mechanical Allodynia Test (Von Frey Hair Test)
Mechanical allodynia (non-noxious mechanical stimuli) was assessed as described by
the method of Chaplan et al. (1994). Briefly, calibrated nylon filaments [Von Frey Hair, total
20 filaments numbered 1.65, 2.36, 2.44, 2.83, 3.22, 3.61, 3.84, 4.08, 4.17, 4.31, 4.58, 4.74,
4.83, 5.07, 5.18, 5.48, 5.88, 6.10, 6.45, and 6.65], in terms of different bending forces [0.008,
0.02, 0.04, 0.07, 0.16, 0.4, 0.6, 1, 1.4, 2, 4, 6, 8, 10, 15, 26, 60, 100, 180, 300 g], were applied
to the mid plantar surface of left hind paw. The filaments were applied ten times, starting with
the softest and continuing in ascending order of stiffness. A brisk withdrawal of the left hind
limb was considered a positive response. The criterion for the threshold value, in grams, was
equal to the filament evoking a withdrawal threshold of the left hind paw 5 times out of 10
trials i.e., 50% response.
4.VII.G. Tactile Mechanical Hyperalgesia Test (Pinprick Test)
Mechanical (tactile) hyperalgesia was assessed using pinprick test as described by the
method of Erichsen and Blackburn-Munro (2002). The surface of the injured hind paw was
touched with the point of the bent 18 gauge needle (at 90º angle) at intensity sufficient to
produce a reflex withdrawal response in normal non-operated animals, but at an intensity
which was insufficient to penetrate the skin in all other group. The duration of the paw
withdrawal was recorded in seconds. A cut-off time of 20 s was maintained.
4.VII.H. Static Mechanical Hyperalgesia Test (Randall Selitto Test)
Mechanical (static) nociceptive threshold as an index of mechano-hyperalgesia were
assessed by pressure stimulation method as described method of Randall and Selitto, (1957).
Briefly, nociceptive threshold, expressed in grams, as measured by applying increasing
pressure to the left hind paw. Withdrawal of left hind paw or vocalization response was noted
to assess the static mechanical nociceptive threshold. The cut-off pressure of 450 g was
maintained.
4.VII.I. Neuronal Functional Index Test
The SFI was subsequently measured from the images, using the formula derived by
Bain et al. (1989). Briefly, animals were subjected to walking-track analysis and measurement
of the sciatic functional index (SFI) using a method similar to that described by de Medinaceli
et al. (1982). The trials were done in an 8.2 x 42 cm corridor darkened at one end and covered
with a sheet of white paper. The rat hind paws were dipped in black India- ink and then each
animal was allowed to walk freely in above mentioned corridor. In most cases, a single walk
by each animal was enough to obtain adequate prints on paper. From the analysis of the
footprints of the feet, the following lengths were obtained: (I) Distance from the heel to the
third toe, the print length (PL); (II) Distance from the first to the fifth toe, the toe spread (TS);
and (III) Distance from the second to the fourth toe, the intermediary toe spread (ITS). All
three measurements were taken from the experimental (E) and normal (N) sides. The factors
were calculated as follows: (I) Print length factor (PLF) = (EPL - NPL)/NPL; (II) Toe spread
factor (TSF) = (ETS - NTS)/NTS; (III) Intermediary toe spread factor (ITF) = (EIT -
NIT)/NIT. These factors were then incorporated into the following formula: for sciatic
functional index (SFI) = -38.3 × PLF + 109.5 × TSF + 13.3 × ITF - 8.8; for tibial functional
Index (TFI) = -37.2 × PLF + 104.4 × TSF + 45.6 × ITF – 8.8 and for peroneal functional
index (PFI) = 174.9 × PLF + 80.3 × TSF - 13.4. A sciatic tibial and peroneal functional index
of 0 is normal. A functional index of -100 indicates total impairment, such as would result
from an injured and uninjured tibial, peroneal and sciatic nerve function.
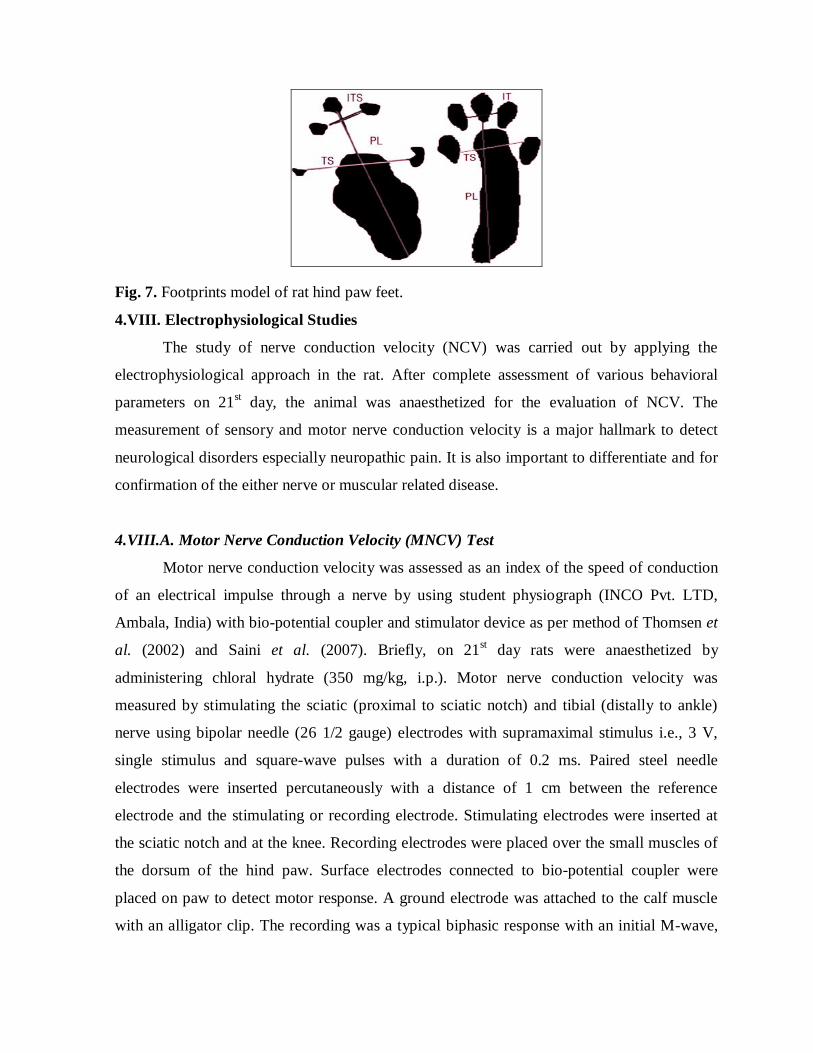
Fig. 7. Footprints model of rat hind paw feet.
4.VIII. Electrophysiological Studies
The study of nerve conduction velocity (NCV) was carried out by applying the
electrophysiological approach in the rat. After complete assessment of various behavioral
parameters on 21st day, the animal was anaesthetized for the evaluation of NCV. The
measurement of sensory and motor nerve conduction velocity is a major hallmark to detect
neurological disorders especially neuropathic pain. It is also important to differentiate and for
confirmation of the either nerve or muscular related disease.
4.VIII.A. Motor Nerve Conduction Velocity (MNCV) Test
Motor nerve conduction velocity was assessed as an index of the speed of conduction
of an electrical impulse through a nerve by using student physiograph (INCO Pvt. LTD,
Ambala, India) with bio-potential coupler and stimulator device as per method of Thomsen et
al. (2002) and Saini et al. (2007). Briefly, on 21st day rats were anaesthetized by
administering chloral hydrate (350 mg/kg, i.p.). Motor nerve conduction velocity was
measured by stimulating the sciatic (proximal to sciatic notch) and tibial (distally to ankle)
nerve using bipolar needle (26 1/2 gauge) electrodes with supramaximal stimulus i.e., 3 V,
single stimulus and square-wave pulses with a duration of 0.2 ms. Paired steel needle
electrodes were inserted percutaneously with a distance of 1 cm between the reference
electrode and the stimulating or recording electrode. Stimulating electrodes were inserted at
the sciatic notch and at the knee. Recording electrodes were placed over the small muscles of
the dorsum of the hind paw. Surface electrodes connected to bio-potential coupler were
placed on paw to detect motor response. A ground electrode was attached to the calf muscle
with an alligator clip. The recording was a typical biphasic response with an initial M-wave,
which is a direct motor response due to stimulation of motor fibers. Motor nerve responses
were amplified and recorded by student physiograph. During the study, body temperature of
rat was maintained at 37°C using homeo-thermic blanket system (Ascent Healthcare,
Mumbai, India). Motor nerve conduction velocity recordings were measured twice at a time
and results were averaged. Latency was measured from the point of stimulation to the onset of
the response. The latency was measured in milliseconds and distance between the two
stimulating electrodes measured in millimeters using steel rule. Motor nerve conduction
velocity was calculated by using the following formula: Motor nerve conduction velocity =
(Distance between the nerve stimulation point) / (Latency period difference).
4.VIII.B. Sensory Nerve Conduction Velocity (SNCV) Test
The determination of sensory nerve conduction velocity (SNCV) was recorded
orthodromically by using student physiograph with bio-potential coupler and stimulator
device as per method of Oh (2003) and Kurokawa et al. (2004) with slight modification of
Saini et al. (2007) and Renn et al. (2011). The recording electrodes were placed
subcutaneously at the ankle behind the medial malleolus, and the reference electrode placed
1cm proximal to the active electrode. The thin stimulating ring (0.5 mm diameter) electrodes
were placed in the middle (3rd) digital nerve of hind limb and stimulated with a square-wave
pulse of 0.05 ms in duration, at the rate of 1HZ and 10 pulses per train intensity current,
which resulted in a maximal amplitude response. The amplitudes were measured from peak to
peak. The distance between recording and stimulating electrodes approximately 25 mm and
10 mm between indifferent and active recording needles were maintained. During the study,
body temperature of rat also maintained at 37°C using homeo-thermic blanket system (Ascent
Healthcare, Mumbai, India). Approximately 10 responses were averaged to obtain the
position of the negative peak. Latencies were measured from the point of stimulation to the
onset of the response. The maximal sensory nerve action potential was calculated by using the
following formula: sensory nerve conduction velocity also known as H-reflex = Onset of
latency / Peak of the initial negative deflection (Distance between stimulating and recording
electrodes).
4.IX. Biochemical Estimations
After behavioral; nerve functional and electrophysiological assessments, animals were
sacrificed on 21st day with chemical euthanasia (50 mg/kg thiopentone sodium, i.p.). Skin and
muscle layers were removed from the thigh region of hind limbs in the rat. The portions of the
sciatic nerve and the tissue beneath the sciatic nerve were isolated immediately as described
earlier (Muthuraman et al., 2008; 2008a). The sciatic nerve portion, proximal to the point of
transection up to its point of emergence from the spinal cord, and distal to the point of
transection up to its ending, was excised. The tissue 1 cm diameter, exactly beneath the point
of the sciatic nerve transection and ligation were taken. The uniformity among the different
nerve and the tissue samples was maintained by taking the constant weight of the respective
samples. Superoxide anion measurement was carried out immediately in sciatic nerve as
described method of Wang et al. (1998). The rest of the samples were kept in the humidity
chamber (maintained at 85% relative humidity and 37ºC temperature) to remove and maintain
the moisture content of the collected samples. The sciatic nerve homogenate (10%, w/v) was
prepared with 0.1 M Tris–HCl buffer (pH 7.4), and deionised water for total protein and total
calcium estimation respectively. The tubes with homogenate were kept in ice water for 30
minutes and centrifuged at 4°C (2500 rpm for 10 min). Further, surrounding muscular tissue
was homogenated with phosphate buffer (pH 7.4) and employed for myeloperoxidase (MPO)
estimation. In addition, blood sample and histopathological assessments were carried out in
sub-acute oral toxicity study protocol to find any hematological; organ dysfunction and
microscopical changes respectively.
4.IX.A. Blood Analyses
For sub-acute oral toxicity study, hematological and biochemical analyses were
performed at a commercial laboratory. Complete blood cell count i.e. red blood cell count
(RBC), white blood cell count (WBC), platelet count, lymphocytes, heamoglobin, hematocrit
(packed cell volume, PCV) mean corpuscular volume (MCV), mean corpuscular hemoglobin
(MCH), mean corpuscular hemoglobin concentration (MCHC) were determined on a fully
automated analyzer. Blood chemistry tests were performed on an auto analyzer (Beckman
Coulter CX7, Fullerton, CA, USA) using a kinetic rate method for the enzymes i.e. alanine
transaminase (ALT), aspartate transaminase (AST) modified rate Jaffe method for creatinine;
the timed endpoint method for urea, high-density lipoprotein (HDL), low-density lipoprotein
(LDL), and glucose oxidase peroxidase method for glucose (Slot, 1965; Kirschner and
Woods, 2001).
4.IX.B. Estimation of Tissue Total Protein Content
Sciatic nerve protein content was determined by Lowry’s method
(Lowry et al., 1951) using bovine serum albumin (BSA) as a standard. 0.3 ml of supernatant
of tissue homogenate was diluted to 1 ml. The 100 l of diluted supernatant was made up to 1
ml using distilled water. To this, 5 ml of Lowry’s reagent was added. The contents were
mixed thoroughly and the mixture was allowed to stand for 15 min at room temperature. Then
0.5 ml of Folin-Ciocalteu reagent was added and the contents were vortexed vigorously and
incubated at room temperature for 30 min. The protein content was determined
spectrophotometrically at 750 nm and expressed as mg per ml of 10% sciatic nerve
homogenate.
Preparation of Reagents
Preparation of Lowry’s Reagent
Lowry’s reagent was freshly prepared by mixing 1% w/v copper sulphate solution, 2%
w/v sodium-potassium tartrate and 2% w/v sodium carbonate in 0.1 M sodium
hydroxide, in the ratio of 1:1:98.
Preparation of 0.1 M Sodium Hydroxide Solution
0.1 M sodium hydroxide was prepared by dissolving 4 g of sodium hydroxide in
distilled water and volume was made up to 1 liter with distilled water.
Preparation of 1% Copper Sulphate Solution
1% CuSO4 was prepared by dissolving 1 g of copper sulphate in 0.1 M sodium
hydroxide and volume was made up to 100 ml with sodium hydroxide.
Preparation of 2% Sodium Potassium Tartrate Solution
2 g of sodium potassium tartrate was dissolved in 0.1 M sodium hydroxide and final
volume was made up to 100 ml with the same.
Preparation of 2% Sodium Carbonate Solution
2 g of sodium carbonate was dissolved in 0.1 M sodium hydroxide and volume was
made up to 100 ml with 0.1 M sodium hydroxide.
4.IX.C. Estimation of Superoxide Anion Generation
The superoxide anion generation was estimated in terms of measuring reduced
nitroblue tetrazolium (NBT) (Wang et al., 1998). Weighed amount of tissue (10 mg) was
taken in 5 ml phosphate buffered saline containing 100 µM of NBT and incubated at 37 0C for
1.5 h. The NBT reduction was stopped by adding 5 mL of 0.5 M HCl. Then, the tissue was
taken out and was minced and homogenized in a mixture of 0.1 M sodium hydroxide and
0.1% sodium dodecyl sulphate in water containing 40 mg/L diethylene triamine penta acetic
acid. The mixture was centrifuged at 20,000 g for 20 min and the resultant pellet was
suspended in 1.5 mL of pyridine and kept at 80 0C for 1.5 h to extract formazan, an adduct
formed after reaction of NBT with superoxide anions. The mixture was again centrifuged at
10,000 g for 10 min and absorbance of formazan was determined spectrophotometerically at
540 nm. The amount of reduced NBT was calculated using the formula
A × V
Amount of reduced NBT =
T × Wt × ε × l
where A is absorbance, V is volume of pyridine (1.5 mL), T is time for which the tissue was
incubated with NBT (1.5 h), Wt is blotted wet weight of tissue (25 mg), is extinction
coefficient (0.72 L/mmol/mm) and l is length of light path (1 cm). Results were expressed as
reduced NBT picomole per min per mg of wet tissue.
Preparation of Reagents
Preparation of Phosphate Buffered Saline
2.5 g of sodium dihydrogen phosphate, 2.523 g of disodium hydrogen phosphate and
8.2 g of sodium chloride were dissolved separately in sufficient quantity of distilled
water. The three solutions were mixed and final volume was made to 1 L with distilled
water.
Preparation of 100 µM of Nitroblue Tetrazolium
8.17 mg of nitroblue tetrazolium was dissolved in 100 mL phosphate buffered saline
to make 100 µM solution.
Preparation of 0.5 M Hydrochloric Acid
4.34 mL of 11.5 M HCl was diluted to 100 mL with distilled water.
Preparation of 0.1 M Sodium Hydroxide Solution
400 mg of sodium hydroxide was dissolved in 100 mL of distilled water.
Preparation of 0.1% Sodium Dodecyl Sulphate Solution
100 mg of sodium dodecyl sulphate was dissolved in 100 mL distilled water.
4.IX.D. Estimation of Total Calcium
Total calcium levels were estimated in sciatic nerve as described by Severnghaus and
Ferrebee (1950). Briefly, 2 mg of sciatic nerve was homogenated with 1ml of deionised triple
distilled water under ice cold conditions and homogenate was mixed with 1 ml of
trichloroacetic acid (4 %). The tubes were centrifuged at 2500 rpm, for 10 minutes. The clear
supernatant was used for the estimation of total calcium ion by atomic emission spectroscopy.
A standard calibration curve was prepared by using 0-1000 parts per million (ppm) of calcium
chloride. The total calcium value was expressed as parts per million per mg of protein.
Preparation of Reagents
Preparation of 10% Trichloroacetic Acid
4 g of trichloroacetic acid was dissolved in 100 ml of distilled water.
Preparation of 1000 ppm Calcium Chloride Solution
0.3676 g of calcium chloride was dissolved in 100 ml of deionised triple distilled
water.
4.IX.E. Estimation of Myeloperoxidase Activity
The myeloperoxidase activity was measured by a method of Grisham et al. (1994) and
Patriarca et al. (1977). The inflammatory reactions are characterized by the recruitment of
inflammatory cells from the blood capillaries to the connective tissue, adjacent to the point of
injury. Therefore, the tissue surrounding the nerve lesion was excised as a measure of degree
of inflammation. The tissue samples were homogenized in 10 volumes of ice-cold potassium
phosphate buffer (pH 7.4), using a tissue homogenizer. The homogenate was centrifuged at
5000 × g for 10 min at 4ºC. The supernatant was discarded and 10 mL of ice-cold 50 mM
potassium phosphate buffer (pH 6.0), containing 0.5% hexadecyl trimethyl ammonium
bromide (HETAB) and l0 mM EDTA was then added to the pellet. It was then subjected to
one cycle of freezing and thawing and a brief period (l5 s) of sonication. After sonication, the
solution was centrifuged at 19,000 × g for 15 min. 100 µl of supernatant was combined with
2.9 ml of phaosphate buffer [It contains 0.167 mg/ml of O-dianisidine hydrochloride and
0.0005% hydrogen peroxide (H2O2)]. The myeloperoxidase activity was measured
spectrophotometrically at 460 nm. One unit of the myeloperoxidase activity is defined as that
which would produce a change in absorbance of 1.0 unit/min at pH 7.0 and 25ºC, calculated
from the initial rate of reaction with peroxide (1µM) as the substrate. The results were
expressed as myeloperoxidase activity units per milligram of protein at one minute. The
amount of MPO activity was calculated using the formula
X MPO activity (U/g) =
Weight of the piece of tissue taken Where
10 x change in absorbance per minute X =
Volume of supernatant taken in the final reaction (mL) Preparation of Reagents
Preparation of 0.2 M Potassium Phosphate Buffer (pH 7.4)
Potassium dihydrogen orthophosphate (27.22 g) was dissolved in 930 mL of distilled
water. pH was then adjusted with 30 % w/v potassium hydroxide solution and
sufficient distilled water was added to make volume upto one liter.
Preparation of Potassium Phosphate Buffer (pH 6.0), Containing 0.5 % Hexadecyl Trimethyl
Ammonium Bromide (HETAB) and 10 mM EDTA
Disodium hydrogen phosphate (60.5 g) and potassium dihydrogen phosphate (46 g)
were dissolved in one litre of distilled water to make potassium phosphate buffer (with
pH 6.0). 5 g of hexadecyl trimethyl ammonium bromide (HETAB) and 3.72 g of
EDTA were dissolved in one litre of potassium phosphate buffer (pH 6.0) to make
final solution.
Preparation of Phosphate Buffer Containing 0.167 mg/mL O-dianisidine Hydrochloride and
0.0005 % H2O2
O-dianisidine hydrochloride (16.7 mg) was dissolved in 100 mL of potassium
phosphate buffer (pH 6.0) solution to this 1 µL of H2O2 was added to make desired
solution.
4.IX.F. Estimation of Tumor Necrosis Factor-Alpha (TNF-α) Level
Sciatic nerve samples were utilized for determination of TNF-α level. TNF-α levels
(sensitivity: 25 pg/ml) were determined by using rat TNF-alpha ELISA kit (RayBio, Inc.,
USA) method and procedure was followed as per manufacturer instructions (see below).
Available Reagent in Rat TNF-Alpha ELISA Kit
TNF-alpha microplate (Item A): 96 wells (12 strips X 8 wells) coated with anti-Rat
TNF-alpha. Wash buffer concentrate (20x) (Item B): 25 ml of 20x concentrated solution.
Standards (Item C): 2 vials, recombinant Rat TNF-alpha. Assay diluent A (Item D): 30 ml of
animal serum with 0.09% sodium azide as preservative. For standard/sample (serum/plasma)
diluents. Assay diluent B (Item E): 15 ml of 5x concentrated buffer. For standard/sample (cell
culture medium/urine) diluent. Detection antibody TNF-alpha (Item F): 2 vial of biotinylated
anti-Rat TNF-alpha (each vial is enough to assay half microplate). HRP-streptavidin
concentrate (Item G): 8 µl of 10,000x concentrated HRP-conjugated streptavidin. TMB one
step substrate reagent (item H): 12 ml of 3,3’,5,5’-tetramethylbenzidine (TMB) in buffered
solution. Stop solution (Item I): 8 ml of 2 M sulfuric acid.
Preparation of Reagent for Estimation of TNF-Alpha Level
1. All reagents and samples were bought to room temperature (18-25º C) before use for
further preparation of solution as required.
2. Assay diluent B (Item E) was used for dilution of tissue supernatants.
3. Assay diluents B was diluted 5-fold with distilled water.
4. Preparation of standard: Item C vial was spin and then added 400 µl of 1x assay
diluent B into Item C vial to prepare a 100 ng/ml standard TNF-alpha solution.
Powder was dissolved thoroughly by a gentle mixing.
5. 100 µl TNF-alpha standard solutions was added from the vial of Item C, into a tube
with 400 µl 1x assay diluent B to prepare a 20,000 pg/ml stock standard solution.
Pipette 400 µl 1x assay diluent B into each tube. This stock solution was used for the
further dilution series (shown below). Each tube was mixed thoroughly before the next
transfer. 1x assay diluent B was serves as the zero standard (0 pg/ml).
Fig. 8. Illustration for TNF-alpha standard solutions preparation.
6. Preparation of Wash Concentrate (20x): If (Item B) was appear to visible crystals, vial
was warmed to room temperature and mixed gently until dissolve the crystal. 20 ml of
wash buffer concentrate was diluted with distilled water to get 400 ml of 1x wash
buffer.
7. Preparation of Detection Antibody: Vial (Item F) was spinned for preparation of
detection antibody before use for further dilution. 100 µl of 1x assay diluent B was
added into the vial to prepare a detection antibody concentrate. This preparation was
mixed gently by pipette up and down of the solution 3-5 times and the concentrate was
stored at 4º C for 5 further days utilization. The detection antibody concentrate was
diluted 80-fold with 1x assay diluent B and used in step 4 of part VI assay procedure.
8. Preparation of HRP-Streptavidin Concentrate: Vial (Item G) was spinned and pipette
up and down to make uniform mixing. HRP-Streptavidin concentrate was diluted
10,000-fold with 1x assay diluent B.
[For example: Vial (Item G) was spinned and pipetted up and down to make uniform mixing
and added 2 µl of HRP-Streptavidin concentrate into a tube with 198.0 µl 1x assay diluent B
to prepare a 100 fold diluted HRP-Streptavidin solution (Note: This diluted solution was not
stored for next day use). Further, 120 µl of prepared 100-fold diluted solution was pipetted out
and added into a tube with 12 ml 1x assay diluent B to prepare a final 10,000 fold diluted
HRP-Streptavidin solution].
Assay Procedure for Estimation of TNF-Alpha Level in Tissue Sample
1. All standards and samples were bought to room temperature (19-25º C) for further
estimation. All standards and samples were estimated two times for accuracy.
2. 100 µl of each standard dilution (see reagent preparation step 2) and samples were
added into appropriate wells. All wells were covered and incubated for 2.5 hours at
room temperature with gentle shaking.
3. The micro plate solution was discarded and washed 4 times with 1x wash solution
(Item B). Washing was carried out by filling each well with wash buffer (300 µl) using
a micropipette. Complete removal of liquid at each step was carefully performed.
4. 100 µl of 1x prepared biotinylated antibody (Reagent preparation step 6) was added
into each well. Incubation was maintained for 1 hour at room temperature with gentle
shaking.
5. For discarding of micro plate well solution was repeated as in step 3.
6. 100 µl of prepared Streptavidin solution (see reagent preparation step 7) was added
into each well. Incubation was maintained for 45 minutes at room temperature with
gentle shaking.
7. For discarding of micro plate well solution was repeated as in step 3.
8. 100 µl of TMB one-step substrate reagent (Item H) was added into each well.
Incubation was maintained for 30 minute at room temperature in the dark with gentle
shaking.
9. 50 µl of stop solution (Item I) was added to each well. Absorbance reading was
recorded immediately at 450 nm after addition of stop solution.
Calculation procedure for test results
Recombinant anti-Rat TNF-alpha was used to generate the standard curve (range 0-
20,000 pg/ml) with rat TNF-alpha ELISA diagnostic kit. Mean absorbance for each set of
duplicate standards, controls and samples was calculated by subtracting the average zero
standard optical density. Standard plot curve was estimated by using sigma plot software
inbuilt in ELISA reader, with standard concentration of the X-axis and absorbance on the Y-
axis. Best-fit straight line was drawn through the standard points. The results were expressed
as pictograms of TNF-α per mg of total protein in the supernatant.
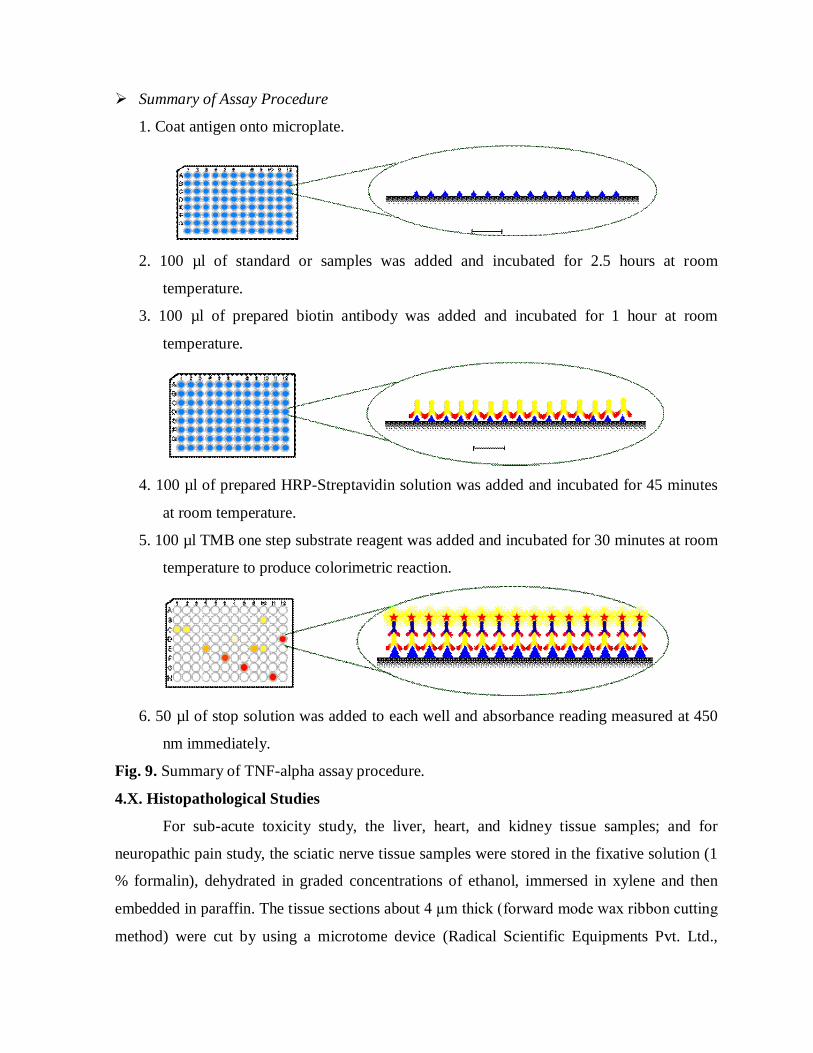
Summary of Assay Procedure
1. Coat antigen onto microplate.
2. 100 µl of standard or samples was added and incubated for 2.5 hours at room
temperature.
3. 100 µl of prepared biotin antibody was added and incubated for 1 hour at room
temperature.
4. 100 µl of prepared HRP-Streptavidin solution was added and incubated for 45 minutes
at room temperature.
5. 100 µl TMB one step substrate reagent was added and incubated for 30 minutes at room
temperature to produce colorimetric reaction.
6. 50 µl of stop solution was added to each well and absorbance reading measured at 450
nm immediately.
Fig. 9. Summary of TNF-alpha assay procedure.
4.X. Histopathological Studies
For sub-acute toxicity study, the liver, heart, and kidney tissue samples; and for
neuropathic pain study, the sciatic nerve tissue samples were stored in the fixative solution (1
% formalin), dehydrated in graded concentrations of ethanol, immersed in xylene and then
embedded in paraffin. The tissue sections about 4 µm thick (forward mode wax ribbon cutting
method) were cut by using a microtome device (Radical Scientific Equipments Pvt. Ltd.,
Ambala, India) and placed on slide using commercial Baker’s mounting fluid. Paraffin wax
was removed by warming the slide gently, until the wax melted and then was washed with
xylene. The slide was followed by washings with absolute alcohol and water to hydrate the
sections and stained with haematoxylin-eosin (H & E) method.
Haematoxylin-Eosin (H & E) Method
The haematoxylin-eosin staining of nervous tissue was carried out as described by
Sudoh et al. (2004). The hydrated sections were stained with haematoxylin for 15 min. The
stained sections were washed with water and treated with 1% acid alcohol mixture for 15-20
s. The acid alcohol mixture was washed off with water and sections were counterstained with
1% aqueous solution of eosin for 2 min. After washing with water to remove excess of eosin,
sections were dehydrated using absolute alcohol and then mounted using Canada balsam as
mounting agent. Microscopic slides were analyzed qualitatively under light microscope (450
X) for neuronal pathological changes assessment.
Preparation of Reagents
Preparation of Haematoxylin Solution
2 g of haematoxylin was dissolved in a mixture of absolute alcohol, distilled water and
glycerin 100 mL each, followed by addition of 10 mL glacial acetic acid and in excess
addition of sodium potassium sulphate.
Preparation of 1% Eosin Solution
1 g of eosin was weighed and dissolved in 100 mL of distilled water.
Preparation of Acid Alcohol Mixture
The acid alcohol mixture was made by adding 1 mL of concentrated hydrochloric acid
(HCl) in 99 mL of 70% alcohol.
4.XI. Experimental Protocol
Twenty seven groups, each comprising of six Wistar rats (n=6), were employed in the
present study.
Group I (Normal Control Group): Rats were not subjected to any surgical procedure or drug
administration and all animals were kept for 21 days. Behavioral tests were performed before
(i.e. day 0) and after surgery on the different time intervals, i.e., 1, 3, 6, 9, 12, 15, 18 and 21st
day. On 21st day sciatic functional index and nerve conduction velocity were measured as per
method of Bain et al. (1989) and Kurokawa et al. (2004) respectively. Thereafter, all the
animals were sacrificed and subjected to biochemical analysis for estimation of total protein,
tumor necrosis factor-alpha (TNF-α), superoxide anion generation and total calcium in sciatic
nerve tissue and myeloperoxidase (MPO) activity in the surrounding muscular tissue sample.
Further, histopathological study was also performed on 21st day as described by Sudoh et al.
(2004).
Group II (Sham Control Group): Rats were subjected to surgical procedure to expose left
hind paw sciatic, tibial and sural nerve without any nerve ligation and transection
respectively. Behavioral tests, biochemical and histopathological parameters were assessed as
described in group I.
Group III (TST Control Group): Rats were subjected to surgical procedure to expose and
transect tibial and sural nerve as described earlier. Behavioral tests, biochemical and
histopathological parameters were assessed as described in group I.
Group IV (CCI Control Group): Rats were subjected to surgical procedure to expose and
ligate left hind paw sciatic nerve as described earlier. Behavioral tests, biochemical and
histopathological parameters were assessed as described in group I.
Group V and VI (Vincristine Control Groups): Vincristine (50 and 75 µg/kg; i.p.), was
administered to normal rats for 10 consecutive days. Behavioral tests, biochemical and
histopathological parameters were assessed as described in group I.
Group VII (Vehicle in TST Group): After subjecting the rats to TST, normal saline (0.9 %
w/v; i.p.) was administered for 14 consecutive days, starting from the day of surgery.
Behavioral tests, biochemical and histopathological parameters were assessed as described in
group I.
Group VIII (Vehicle in CCI Group): After subjecting the rats to CCI, normal saline (0.9 %
w/v; i.p.) was administered for 14 consecutive days, starting from the day of surgery.
Behavioral tests, biochemical and histopathological parameters were assessed as described in
group I.
Group IX (Vehicle in Vincristine Treated Group): Rats were administered normal saline (0.9
% w/v, i.p.) one hour before vincristine injection, for 10 consecutive days. Behavioral tests,
biochemical and histopathological parameters were assessed as described in group I.
Group X (HAE-AC per se): Rats were administered hydro-alcoholic extract of Acorus
calamus (HAE-AC, 200 mg/kg; p.o.) for 14 consecutive days, starting from the day 1st.
Behavioral tests, biochemical and histopathological parameters were assessed as described in
group I.
Group XI (SRE-AC per se): Rats were administered saponin rich extract of Acorus calamus
(SRE-AC, 40 mg/kg; p.o.) for 14 consecutive days, starting from the day 1st. Behavioral tests,
biochemical and histopathological parameters were assessed as described in group I.
Group XII (Pregabalin per se): Rats were administered pregabalin (10 mg/kg; p.o.) for 14
consecutive days, starting from the day 1st. Behavioral tests, biochemical and
histopathological parameters were assessed as described in group I.
Group XIII and XIV (HAE-AC in TST): Hydro-alcoholic extract of Acorus calamus (100
and 200 mg/kg; p.o.) was administered for 14 consecutive days in rats subjected to tibial and
sural nerve transection, starting from the day 1st. Behavioral tests, biochemical and
histopathological parameters were assessed as described in group I.
Group XV and XVI (HAE-AC in CCI): Hydro-alcoholic extract of Acorus calamus (100 and
200 mg/kg; p.o.) was administered for 14 consecutive days in rats subjected to CCI of sciatic
nerve, starting from the day 1st. Behavioral tests, biochemical and histopathological
parameters were assessed as described in group I.
Group XVII and XVIII (HAE-AC in Vincristine Treated Group): Hydro-alcoholic extract of
Acorus calamus (100 and 200 mg/kg; p.o.) was administered (one hour before) for 14
consecutive days in rats subjected to vincristine injection, starting from the day 1st. Behavioral
tests, biochemical and histopathological parameters were assessed as described in group I.
Group XIX and XX (SRE-AC in TST): Saponin rich extract of Acorus calamus (20 and 40
mg/kg; p.o.) was administered for 14 consecutive days in rats subjected to tibial and sural
nerve transection, starting from the day 1st. Behavioral tests, biochemical and
histopathological parameters were assessed as described in group I.
Group XXI and XXII (SRE-AC in CCI): Saponin rich extract of Acorus calamus (20 and 40
mg/kg; p.o.) was administered for 14 consecutive days in rats subjected to CCI of sciatic
nerve, starting from the day 1st. Behavioral tests, biochemical and histopathological
parameters were assessed as described in group I.
Group XXIII and XXIV (SRE-AC in Vincristine Treated Group): Saponin rich extract of
Acorus calamus (20 and 40 mg/kg; p.o.) was administered (one hour before) for 14
consecutive days in rats subjected to vincristine injection, starting from the day 1st. Behavioral
tests, biochemical and histopathological parameters were assessed as described in group I.
Group XXV (Pregabalin in TST): Pregabalin (10 mg/kg; p.o.) was administered for 14
consecutive days in rats subjected to tibial and sural nerve transection, starting from the day
1st. Behavioral tests, biochemical and histopathological parameters were assessed as described
in group I.
Group XXVI (Pregabalin in CCI): Pregabalin (10 mg/kg; p.o.) was administered for 14
consecutive days in rats subjected to CCI of sciatic nerve, starting from the day 1st. Behavioral
tests, biochemical and histopathological parameters were assessed as described in group I.
Group XXVII (Pregabalin in Vincristine Treated Group): Pregabalin (10 mg/kg; p.o.) was
administered (one hour before) for 14 consecutive days in rats subjected to vincristine
injection, starting from the day 1st. Behavioral tests, biochemical and histopathological
parameters were assessed as described in group I.
In addition to above acute and sub-acute oral toxicity potential of HAE-AC was
evaluated in mice (six groups, n=10) and in rats (six groups, n=10) respectively. Our
previous studies have documented that 0.5 % w/v carboxy methyl cellulose did not show any
significant changes in the neuropathic pain behaviour and biochemical marker alterations
(Muthuraman et al., 2008a, 2008b). Therefore, in the present research protocol 0.5 % w/v of
carboxy methyl cellulose vehicle treatment group is not added. 4.XII. Statistical Analysis
All the results were expressed as mean ± standard deviation. The Student’s t-test was
used for statistical comparison of data between groups in toxicological study. The LD50 was
calculated according to method of Litchfield and Wilcoxon (1949), and Miller and Tainter,
(1944). The data of behavioral results was statistically analyzed by two-way analysis of
variance (ANOVA) followed by Bonferonni’s post test and the data of biochemical results
was statistically analyzed by one-way ANOVA followed by Tukey’s multiple range tests by
using Sigmastat Version-2.0 software. The P-value < 0.05 was considered to be statistically
significant.