
24 Polarization observable measurements for γp → K+Λ and γp → K+Σ for energies up to 1.5 GeV...
15
DOI 10.1140/epja/i2006-10167-8 Regular Article – Hadron Physics Eur. Phys. J. A 31, 79–93 (2007) T HE EUROPEAN P HYSICAL JOURNAL A Polarization observable measurements for γ p → K + Λ and γ p → K + Σ 0 for energies up to 1.5 GeV A. Lleres 1, a , O. Bartalini 2,9 , V. Bellini 12,5 , J.P. Bocquet 1 , P. Calvat 1 , M. Capogni 2,9, b , L. Casano 9 , M. Castoldi 7 , A. D’Angelo 2,9 , J.-P. Didelez 14 , R. Di Salvo 9 , A. Fantini 2,9 , C. Gaulard 4, c , G. Gervino 3,10 , F. Ghio 8,11 , B. Girolami 8,11 , A. Giusa 12,6 , M. Guidal 14 , E. Hourany 14 , V. Kouznetsov 13 , R. Kunne 14 , A. Lapik 13 , P. Levi Sandri 4 , D. Moricciani 9 , A.N. Mushkarenkov 13 , V. Nedorezov 13 , L. Nicoletti 2,9,1 , C. Perrin 1 , C. Randieri 12,5 , D. Rebreyend 1 , F. Renard 1 , N. Rudnev 13 , T. Russew 1 , G. Russo 12,6 , C. Schaerf 2,9 , M.-L. Sperduto 12,6 , M.-C. Sutera 6 , and A. Turinge 13 1 IN2P3, Laboratoire de Physique Subatomique et de Cosmologie, 38026 Grenoble, France 2 Dipartimento di Fisica, Universit` a di Roma “Tor Vergata”, via della Ricerca Scientifica 1, I-00133 Roma, Italy 3 Dipartimento di Fisica Sperimentale, Universit` a di Torino, via P. Giuria, I-00125 Torino, Italy 4 INFN - Laboratori Nazionali di Frascati, via E. Fermi 40, I-00044 Frascati, Italy 5 INFN - Laboratori Nazionali del Sud, via Santa Sofia 44, I-95123 Catania, Italy 6 INFN - Sezione di Catania, via Santa Sofia 64, I-95123 Catania, Italy 7 INFN - Sezione di Genova, via Dodecanneso 33, I-16146 Genova, Italy 8 INFN - Sezione di Roma, piazzale Aldo Moro 2, I-00185 Roma, Italy 9 INFN - Sezione di Roma Tor Vergata, via della Ricerca Scientifica 1, I-00133 Roma, Italy 10 INFN - Sezione di Torino, I-10125 Torino, Italy 11 Istituto Superiore di Sanit` a, viale Regina Elena 299, I-00161 Roma, Italy 12 Dipartimento di Fisica ed Astronomia, Universit` a di Catania, via Santa Sofia 64, I-95123 Catania, Italy 13 Institute for Nuclear Research, 117312 Moscow, Russia 14 IN2P3, Institut de Physique Nucl´ eaire, 91406 Orsay, France Received: 7 July 2006 / Revised: 14 December 2006 Published online: 24 January 2007 – c Societ` a Italiana di Fisica / Springer-Verlag 2007 Communicated by N. Bianchi Abstract. Beam asymmetries and hyperon recoil polarizations for the reactions γp → K + Λ and γp → K + Σ 0 have been measured from the threshold production to 1500 MeV with the GRAAL facility located at the ESRF in Grenoble. These results complement the database for the beam asymmetry, covering for the first time the production threshold region. Recent theoretical analyses are presented for which the beam asymmetry data bring interesting new information and allow to better determine some resonance parameters. Most importantly, these results strengthen the need of a new D13 state around 1900 MeV. PACS. 13.60.Le Meson production – 13.88.+e Polarization in interactions and scattering – 25.20.Lj Pho- toproduction reactions 1 Introduction Until recently, data on kaon photoproduction reactions in the resonance region, because of an intrinsic experimental difficulty, were scarce and had low precision. As a con- sequence, resonance couplings to either KΛ or KΣ were poorly known [1]. With the recent release of high-quality data by SAPHIR [2], CLAS [3,4] and LEPS [5,6], a new breakthrough has been achieved in the common endeavour a e-mail: [email protected] b Present affiliation: ENEA - C.R. Casaccia, via Anguillarese 301, I-00060 Roma, Italy. c Present affiliation: IN2P3, Centre de Spectrom´ etrie Nucl´ eaire et de Spectrom´ etrie de Masse, 91405 Orsay, France. to complete the meson photoproduction database. Several theoretical analyses [7–14] of these new data have been performed. All suggest that new resonances should be in- corporated in the nucleon spectrum. They also underline the importance of polarization observable measurements in order to resolve ambiguities in the multipole extraction and make their conclusions stronger. In the present work, we report on measurements of the beam asymmetry Σ and hyperon recoil polarization P for the reactions γp → K + Λ and γp → K + Σ 0 , over large energy (from threshold to 1500 MeV) and angular (θ cm = 30–140 ◦ ) ranges. For the first time, the region below 1500 MeV is extensively covered with high-precision Σ data.
-
Upload
cristian-randieri-phd -
Category
Science
-
view
108 -
download
1
Transcript of 24 Polarization observable measurements for γp → K+Λ and γp → K+Σ for energies up to 1.5 GeV...
DOI 10.1140/epja/i2006-10167-8
Regular Article – Hadron Physics
Eur. Phys. J. A 31, 79–93 (2007) THE EUROPEAN
PHYSICAL JOURNAL A
Polarization observable measurements for γp → K+Λ andγp → K+Σ0 for energies up to 1.5 GeV
A. Lleres1,a, O. Bartalini2,9, V. Bellini12,5, J.P. Bocquet1, P. Calvat1, M. Capogni2,9,b, L. Casano9, M. Castoldi7,A. D’Angelo2,9, J.-P. Didelez14, R. Di Salvo9, A. Fantini2,9, C. Gaulard4,c, G. Gervino3,10, F. Ghio8,11, B. Girolami8,11,A. Giusa12,6, M. Guidal14, E. Hourany14, V. Kouznetsov13, R. Kunne14, A. Lapik13, P. Levi Sandri4, D. Moricciani9,A.N. Mushkarenkov13, V. Nedorezov13, L. Nicoletti2,9,1, C. Perrin1, C. Randieri12,5, D. Rebreyend1, F. Renard1,N. Rudnev13, T. Russew1, G. Russo12,6, C. Schaerf2,9, M.-L. Sperduto12,6, M.-C. Sutera6, and A. Turinge13
1 IN2P3, Laboratoire de Physique Subatomique et de Cosmologie, 38026 Grenoble, France2 Dipartimento di Fisica, Universita di Roma “Tor Vergata”, via della Ricerca Scientifica 1, I-00133 Roma, Italy3 Dipartimento di Fisica Sperimentale, Universita di Torino, via P. Giuria, I-00125 Torino, Italy4 INFN - Laboratori Nazionali di Frascati, via E. Fermi 40, I-00044 Frascati, Italy5 INFN - Laboratori Nazionali del Sud, via Santa Sofia 44, I-95123 Catania, Italy6 INFN - Sezione di Catania, via Santa Sofia 64, I-95123 Catania, Italy7 INFN - Sezione di Genova, via Dodecanneso 33, I-16146 Genova, Italy8 INFN - Sezione di Roma, piazzale Aldo Moro 2, I-00185 Roma, Italy9 INFN - Sezione di Roma Tor Vergata, via della Ricerca Scientifica 1, I-00133 Roma, Italy
10 INFN - Sezione di Torino, I-10125 Torino, Italy11 Istituto Superiore di Sanita, viale Regina Elena 299, I-00161 Roma, Italy12 Dipartimento di Fisica ed Astronomia, Universita di Catania, via Santa Sofia 64, I-95123 Catania, Italy13 Institute for Nuclear Research, 117312 Moscow, Russia14 IN2P3, Institut de Physique Nucleaire, 91406 Orsay, France
Received: 7 July 2006 / Revised: 14 December 2006Published online: 24 January 2007 – c© Societa Italiana di Fisica / Springer-Verlag 2007Communicated by N. Bianchi
Abstract. Beam asymmetries and hyperon recoil polarizations for the reactions γp → K+Λ and γp →K+Σ0 have been measured from the threshold production to 1500MeV with the GRAAL facility locatedat the ESRF in Grenoble. These results complement the database for the beam asymmetry, covering forthe first time the production threshold region. Recent theoretical analyses are presented for which thebeam asymmetry data bring interesting new information and allow to better determine some resonanceparameters. Most importantly, these results strengthen the need of a new D13 state around 1900MeV.
PACS. 13.60.Le Meson production – 13.88.+e Polarization in interactions and scattering – 25.20.Lj Pho-toproduction reactions
1 Introduction
Until recently, data on kaon photoproduction reactions inthe resonance region, because of an intrinsic experimentaldifficulty, were scarce and had low precision. As a con-sequence, resonance couplings to either KΛ or KΣ werepoorly known [1]. With the recent release of high-qualitydata by SAPHIR [2], CLAS [3,4] and LEPS [5,6], a newbreakthrough has been achieved in the common endeavour
a e-mail: [email protected] Present affiliation: ENEA - C.R. Casaccia, via Anguillarese
301, I-00060 Roma, Italy.c Present affiliation: IN2P3, Centre de Spectrometrie
Nucleaire et de Spectrometrie de Masse, 91405 Orsay, France.
to complete the meson photoproduction database. Severaltheoretical analyses [7–14] of these new data have beenperformed. All suggest that new resonances should be in-corporated in the nucleon spectrum. They also underlinethe importance of polarization observable measurementsin order to resolve ambiguities in the multipole extractionand make their conclusions stronger.
In the present work, we report on measurements ofthe beam asymmetry Σ and hyperon recoil polarizationP for the reactions γp → K+Λ and γp → K+Σ0, overlarge energy (from threshold to 1500MeV) and angular(θcm = 30–140◦) ranges. For the first time, the regionbelow 1500MeV is extensively covered with high-precisionΣ data.
80 The European Physical Journal A
2 The experimental set-up
2.1 General description
The experiment has been carried-out with the GRAALfacility (see [15] for a detailed description), installed atthe European Synchrotron Radiation Facility (ESRF) inGrenoble (France). The tagged and polarized γ-ray beamis produced by Compton scattering of laser photons offthe 6.03GeV electrons circulating in the storage ring.In the present experiment, we have used a set of UV
lines at 333, 351 and 364 nm produced by an Ar laser,giving 1.40, 1.47 and 1.53GeV maximum energies, respec-tively. Some data were also taken with the green line at514 nm (maximum energy of 1.1GeV).The photon energy is provided by an internal tagging
system. The position of the scattered electron is measuredby a silicon microstrip detector (128 strips with a pitch of300µm and 1000µm thick). The energy resolution of thetagging system is 16MeV (FWHM). A set of plastic scin-tillators used for time measurements is placed behind themicrostrip detector. Thanks to specially developed elec-tronics which synchronize the detector signal with the RFof the machine, the resulting time resolution is ≈ 100 ps.The coincidence between detector signal and RF is usedas a start for all Time-of-Flight (ToF) measurements andis part of the trigger of the experiment.The γ-ray beam polarization is calculated using the ex-
pression derived by Arutyunian et al. [16] from the Klein-Nishina formula. The UV beam polarization is close to1 at the maximum energy and decreases smoothly withenergy to around 60% at the KΛ threshold (0.911GeV).Based on detailed studies [15], it was found that the onlysignificant source of error for the γ-ray polarization Pγcomes from the laser beam polarization:
δPγPγ
=δPLPL
= 0.02 . (1)
The γ-ray beam flux (typically 106Hz) is measured bya thin monitor made of three plastic scintillators, yieldingan efficiency of around 3%.The target cell consists of an aluminum hollow cylinder
of 4 cm in diameter closed by thin mylar windows (100µm)at both ends. Two different target lengths (6 and 12 cm)have been used for the present experiment. The target wasfilled by liquid hydrogen at 18K (ρ ≈ 7 10−2 g/cm3).The 4π LAγRANGE detector of the GRAAL set-up
allows to detect both neutral and charged particles (fig. 1).The apparatus is composed of two main parts: a centralone (25◦ ≤ θ ≤ 155◦) and a forward one (θ ≤ 25◦). In thefollowing, all resolutions are given as the Full-Width HalfMaximum (FWHM).The charged-particles tracks are measured by a set of
MultiWire Proportional Chambers (MWPCs). This track-ing detector is described in detail in the following section.Charged-particle identification in the central region is
obtained by dE/dx technique thanks to a plastic scin-tillator barrel (32 bars, 5mm thick, 43 cm long) with an
1
2 3
4
56
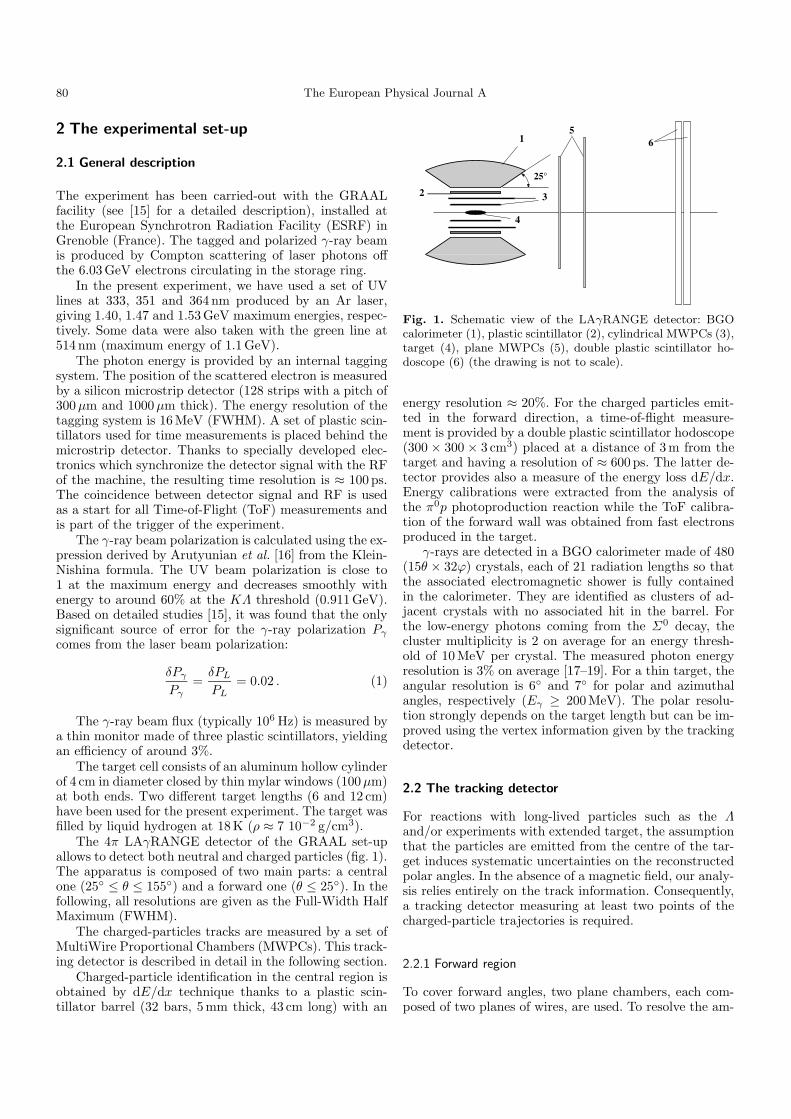
25°
Fig. 1. Schematic view of the LAγRANGE detector: BGOcalorimeter (1), plastic scintillator (2), cylindrical MWPCs (3),target (4), plane MWPCs (5), double plastic scintillator ho-doscope (6) (the drawing is not to scale).
energy resolution ≈ 20%. For the charged particles emit-ted in the forward direction, a time-of-flight measure-ment is provided by a double plastic scintillator hodoscope(300 × 300 × 3 cm3) placed at a distance of 3m from thetarget and having a resolution of ≈ 600 ps. The latter de-tector provides also a measure of the energy loss dE/dx.Energy calibrations were extracted from the analysis ofthe π0p photoproduction reaction while the ToF calibra-tion of the forward wall was obtained from fast electronsproduced in the target.
γ-rays are detected in a BGO calorimeter made of 480(15θ × 32ϕ) crystals, each of 21 radiation lengths so thatthe associated electromagnetic shower is fully containedin the calorimeter. They are identified as clusters of ad-jacent crystals with no associated hit in the barrel. Forthe low-energy photons coming from the Σ0 decay, thecluster multiplicity is 2 on average for an energy thresh-old of 10MeV per crystal. The measured photon energyresolution is 3% on average [17–19]. For a thin target, theangular resolution is 6◦ and 7◦ for polar and azimuthalangles, respectively (Eγ ≥ 200MeV). The polar resolu-tion strongly depends on the target length but can be im-proved using the vertex information given by the trackingdetector.
2.2 The tracking detector
For reactions with long-lived particles such as the Λand/or experiments with extended target, the assumptionthat the particles are emitted from the centre of the tar-get induces systematic uncertainties on the reconstructedpolar angles. In the absence of a magnetic field, our analy-sis relies entirely on the track information. Consequently,a tracking detector measuring at least two points of thecharged-particle trajectories is required.
2.2.1 Forward region
To cover forward angles, two plane chambers, each com-posed of two planes of wires, are used. To resolve the am-
A. Lleres et al.: Polarization observable measurements for γp→ K+Λ . . . 81
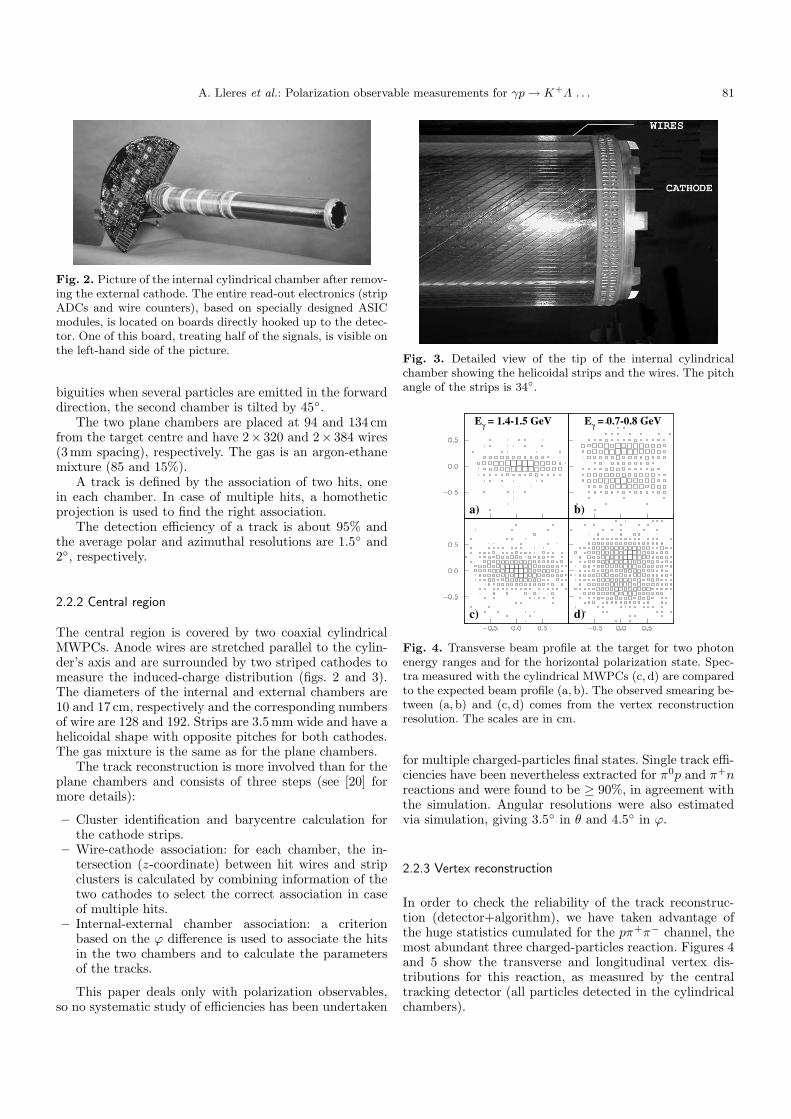
Fig. 2. Picture of the internal cylindrical chamber after remov-ing the external cathode. The entire read-out electronics (stripADCs and wire counters), based on specially designed ASICmodules, is located on boards directly hooked up to the detec-tor. One of this board, treating half of the signals, is visible onthe left-hand side of the picture.
biguities when several particles are emitted in the forwarddirection, the second chamber is tilted by 45◦.The two plane chambers are placed at 94 and 134 cm
from the target centre and have 2× 320 and 2× 384 wires(3mm spacing), respectively. The gas is an argon-ethanemixture (85 and 15%).A track is defined by the association of two hits, one
in each chamber. In case of multiple hits, a homotheticprojection is used to find the right association.The detection efficiency of a track is about 95% and
the average polar and azimuthal resolutions are 1.5◦ and2◦, respectively.
2.2.2 Central region
The central region is covered by two coaxial cylindricalMWPCs. Anode wires are stretched parallel to the cylin-der’s axis and are surrounded by two striped cathodes tomeasure the induced-charge distribution (figs. 2 and 3).The diameters of the internal and external chambers are10 and 17 cm, respectively and the corresponding numbersof wire are 128 and 192. Strips are 3.5mm wide and have ahelicoidal shape with opposite pitches for both cathodes.The gas mixture is the same as for the plane chambers.The track reconstruction is more involved than for the
plane chambers and consists of three steps (see [20] formore details):
– Cluster identification and barycentre calculation forthe cathode strips.
– Wire-cathode association: for each chamber, the in-tersection (z-coordinate) between hit wires and stripclusters is calculated by combining information of thetwo cathodes to select the correct association in caseof multiple hits.
– Internal-external chamber association: a criterionbased on the ϕ difference is used to associate the hitsin the two chambers and to calculate the parametersof the tracks.
This paper deals only with polarization observables,so no systematic study of efficiencies has been undertaken
Fig. 3. Detailed view of the tip of the internal cylindricalchamber showing the helicoidal strips and the wires. The pitchangle of the strips is 34◦.
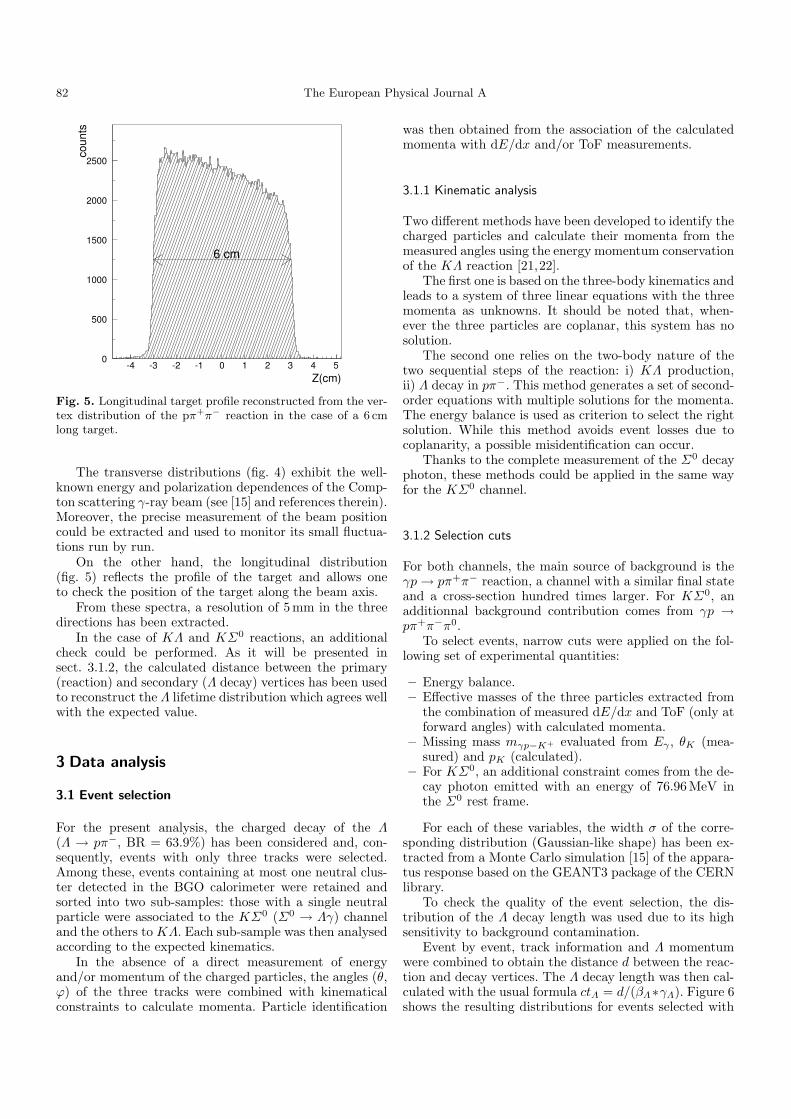
Eγ = 1.4-1.5 GeV
a)
Eγ = 0.7-0.8 GeV
b)
c) d)
Fig. 4. Transverse beam profile at the target for two photonenergy ranges and for the horizontal polarization state. Spec-tra measured with the cylindrical MWPCs (c, d) are comparedto the expected beam profile (a, b). The observed smearing be-tween (a, b) and (c, d) comes from the vertex reconstructionresolution. The scales are in cm.
for multiple charged-particles final states. Single track effi-ciencies have been nevertheless extracted for π0p and π+nreactions and were found to be ≥ 90%, in agreement withthe simulation. Angular resolutions were also estimatedvia simulation, giving 3.5◦ in θ and 4.5◦ in ϕ.
2.2.3 Vertex reconstruction
In order to check the reliability of the track reconstruc-tion (detector+algorithm), we have taken advantage ofthe huge statistics cumulated for the pπ+π− channel, themost abundant three charged-particles reaction. Figures 4and 5 show the transverse and longitudinal vertex dis-tributions for this reaction, as measured by the centraltracking detector (all particles detected in the cylindricalchambers).
82 The European Physical Journal A
0
500
1000
1500
2000
2500
-4 -3 -2 -1 0 1 2 3 4 5Z(cm)
coun
ts
6 cm
Fig. 5. Longitudinal target profile reconstructed from the ver-tex distribution of the pπ+π− reaction in the case of a 6 cmlong target.
The transverse distributions (fig. 4) exhibit the well-known energy and polarization dependences of the Comp-ton scattering γ-ray beam (see [15] and references therein).Moreover, the precise measurement of the beam positioncould be extracted and used to monitor its small fluctua-tions run by run.On the other hand, the longitudinal distribution
(fig. 5) reflects the profile of the target and allows oneto check the position of the target along the beam axis.From these spectra, a resolution of 5mm in the three
directions has been extracted.In the case of KΛ and KΣ0 reactions, an additional
check could be performed. As it will be presented insect. 3.1.2, the calculated distance between the primary(reaction) and secondary (Λ decay) vertices has been usedto reconstruct the Λ lifetime distribution which agrees wellwith the expected value.
3 Data analysis
3.1 Event selection
For the present analysis, the charged decay of the Λ(Λ → pπ−, BR = 63.9%) has been considered and, con-sequently, events with only three tracks were selected.Among these, events containing at most one neutral clus-ter detected in the BGO calorimeter were retained andsorted into two sub-samples: those with a single neutralparticle were associated to the KΣ0 (Σ0 → Λγ) channeland the others to KΛ. Each sub-sample was then analysedaccording to the expected kinematics.In the absence of a direct measurement of energy
and/or momentum of the charged particles, the angles (θ,ϕ) of the three tracks were combined with kinematicalconstraints to calculate momenta. Particle identification
was then obtained from the association of the calculatedmomenta with dE/dx and/or ToF measurements.
3.1.1 Kinematic analysis
Two different methods have been developed to identify thecharged particles and calculate their momenta from themeasured angles using the energy momentum conservationof the KΛ reaction [21,22].The first one is based on the three-body kinematics and
leads to a system of three linear equations with the threemomenta as unknowns. It should be noted that, when-ever the three particles are coplanar, this system has nosolution.The second one relies on the two-body nature of the
two sequential steps of the reaction: i) KΛ production,ii) Λ decay in pπ−. This method generates a set of second-order equations with multiple solutions for the momenta.The energy balance is used as criterion to select the rightsolution. While this method avoids event losses due tocoplanarity, a possible misidentification can occur.Thanks to the complete measurement of the Σ0 decay
photon, these methods could be applied in the same wayfor the KΣ0 channel.
3.1.2 Selection cuts
For both channels, the main source of background is theγp→ pπ+π− reaction, a channel with a similar final stateand a cross-section hundred times larger. For KΣ0, anadditionnal background contribution comes from γp →pπ+π−π0.To select events, narrow cuts were applied on the fol-
lowing set of experimental quantities:
– Energy balance.– Effective masses of the three particles extracted fromthe combination of measured dE/dx and ToF (only atforward angles) with calculated momenta.
– Missing mass mγp−K+ evaluated from Eγ , θK (mea-sured) and pK (calculated).
– For KΣ0, an additional constraint comes from the de-cay photon emitted with an energy of 76.96MeV inthe Σ0 rest frame.
For each of these variables, the width σ of the corre-sponding distribution (Gaussian-like shape) has been ex-tracted from a Monte Carlo simulation [15] of the appara-tus response based on the GEANT3 package of the CERNlibrary.To check the quality of the event selection, the dis-
tribution of the Λ decay length was used due to its highsensitivity to background contamination.Event by event, track information and Λ momentum
were combined to obtain the distance d between the reac-tion and decay vertices. The Λ decay length was then cal-culated with the usual formula ctΛ = d/(βΛ∗γΛ). Figure 6shows the resulting distributions for events selected with
A. Lleres et al.: Polarization observable measurements for γp→ K+Λ . . . 83
10 2
10 3
0 2 4 6 8 10 12 14ct (cm)
Cou
nts
γ+p → K++Λ
γ+p → K++Σ0
γ+p → p+π++π-
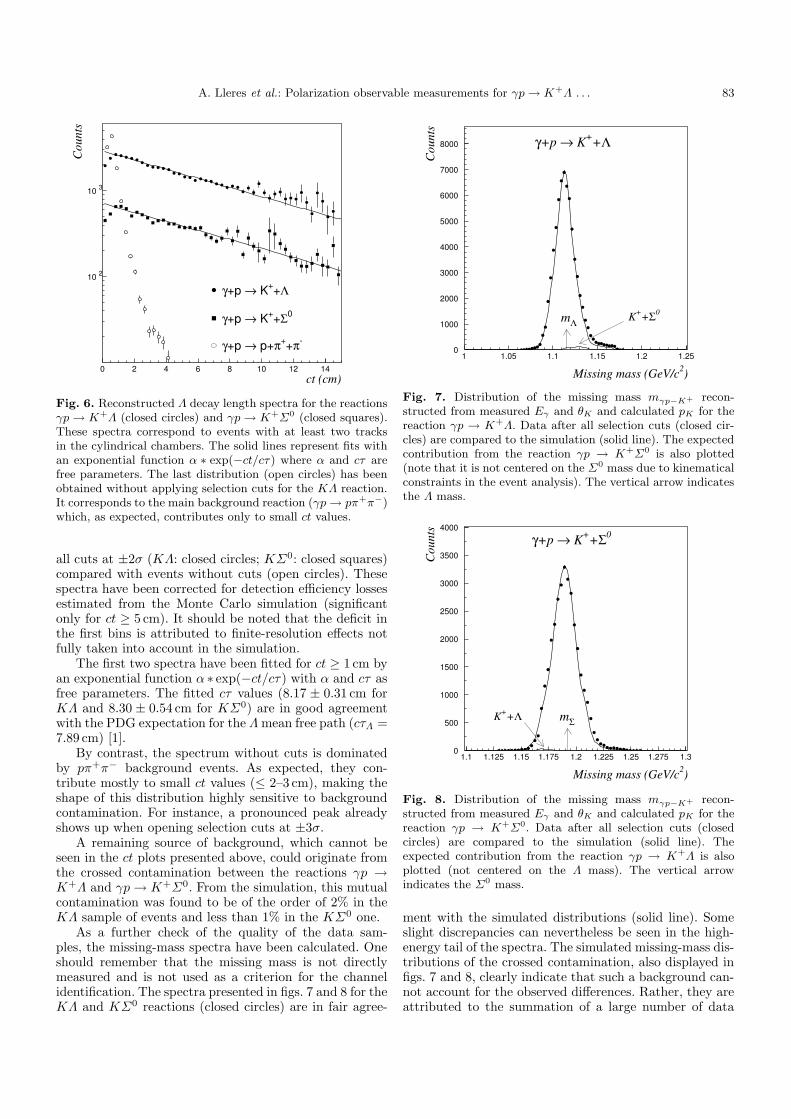
Fig. 6. Reconstructed Λ decay length spectra for the reactionsγp→ K+Λ (closed circles) and γp→ K+Σ0 (closed squares).These spectra correspond to events with at least two tracksin the cylindrical chambers. The solid lines represent fits withan exponential function α ∗ exp(−ct/cτ) where α and cτ arefree parameters. The last distribution (open circles) has beenobtained without applying selection cuts for the KΛ reaction.It corresponds to the main background reaction (γp→ pπ+π−)which, as expected, contributes only to small ct values.
all cuts at ±2σ (KΛ: closed circles; KΣ0: closed squares)compared with events without cuts (open circles). Thesespectra have been corrected for detection efficiency lossesestimated from the Monte Carlo simulation (significantonly for ct ≥ 5 cm). It should be noted that the deficit inthe first bins is attributed to finite-resolution effects notfully taken into account in the simulation.The first two spectra have been fitted for ct ≥ 1 cm by
an exponential function α ∗ exp(−ct/cτ) with α and cτ asfree parameters. The fitted cτ values (8.17 ± 0.31 cm forKΛ and 8.30 ± 0.54 cm for KΣ0) are in good agreementwith the PDG expectation for the Λmean free path (cτΛ =7.89 cm) [1].By contrast, the spectrum without cuts is dominated
by pπ+π− background events. As expected, they con-tribute mostly to small ct values (≤ 2–3 cm), making theshape of this distribution highly sensitive to backgroundcontamination. For instance, a pronounced peak alreadyshows up when opening selection cuts at ±3σ.A remaining source of background, which cannot be
seen in the ct plots presented above, could originate fromthe crossed contamination between the reactions γp →K+Λ and γp→ K+Σ0. From the simulation, this mutualcontamination was found to be of the order of 2% in theKΛ sample of events and less than 1% in the KΣ0 one.As a further check of the quality of the data sam-
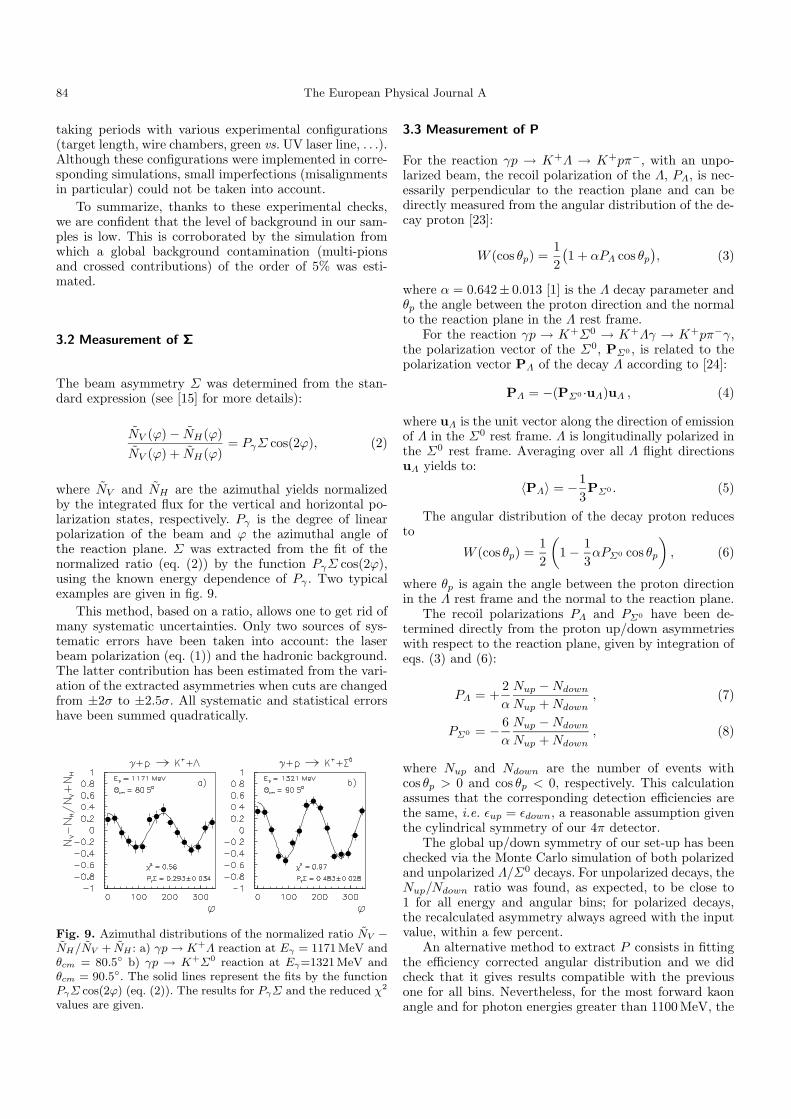
ples, the missing-mass spectra have been calculated. Oneshould remember that the missing mass is not directlymeasured and is not used as a criterion for the channelidentification. The spectra presented in figs. 7 and 8 for theKΛ and KΣ0 reactions (closed circles) are in fair agree-
0
1000
2000
3000
4000
5000
6000
7000
8000
1 1.05 1.1 1.15 1.2 1.25
Missing mass (GeV/c2)
Cou
nts
γ+p → K++Λ
mΛ K++Σ0
Fig. 7. Distribution of the missing mass mγp−K+ recon-structed from measured Eγ and θK and calculated pK for thereaction γp → K+Λ. Data after all selection cuts (closed cir-cles) are compared to the simulation (solid line). The expectedcontribution from the reaction γp → K+Σ0 is also plotted(note that it is not centered on the Σ0 mass due to kinematicalconstraints in the event analysis). The vertical arrow indicatesthe Λ mass.
0
500
1000
1500
2000
2500
3000
3500
4000
1.1 1.125 1.15 1.175 1.2 1.225 1.25 1.275 1.3
Missing mass (GeV/c2)
Cou
nts
γ+p → K++Σ0
mΣK++Λ
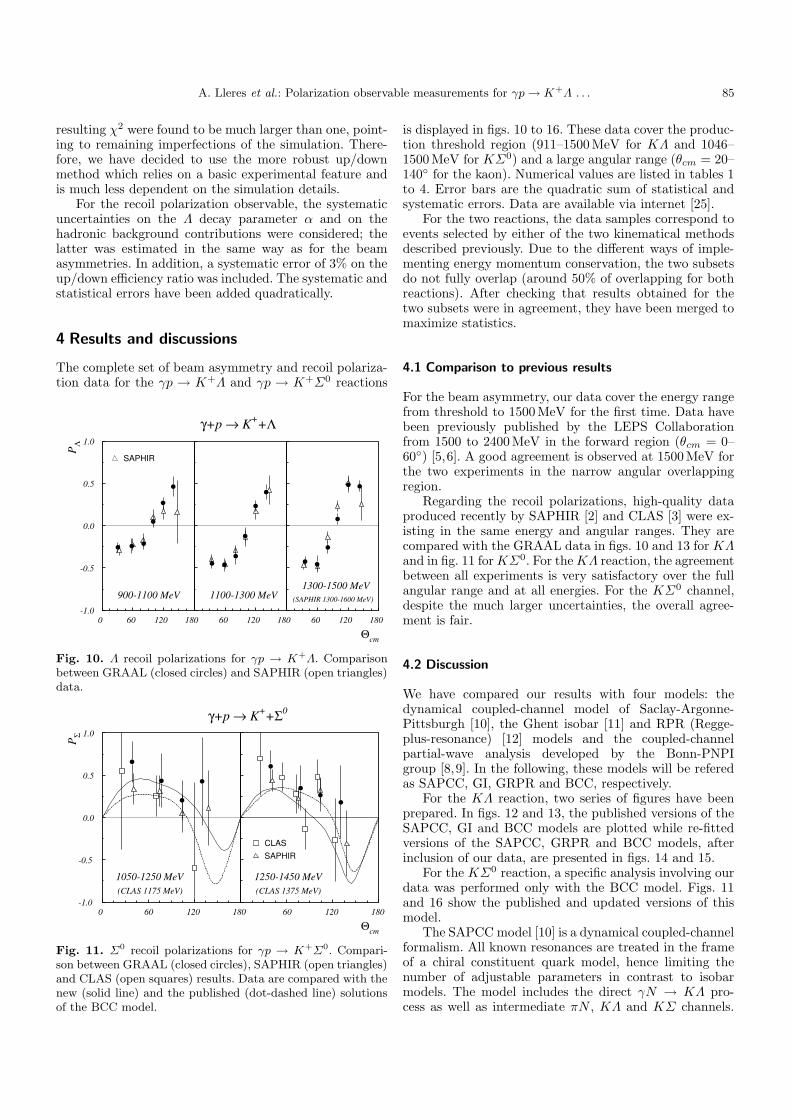
Fig. 8. Distribution of the missing mass mγp−K+ recon-structed from measured Eγ and θK and calculated pK for thereaction γp → K+Σ0. Data after all selection cuts (closedcircles) are compared to the simulation (solid line). Theexpected contribution from the reaction γp → K+Λ is alsoplotted (not centered on the Λ mass). The vertical arrowindicates the Σ0 mass.
ment with the simulated distributions (solid line). Someslight discrepancies can nevertheless be seen in the high-energy tail of the spectra. The simulated missing-mass dis-tributions of the crossed contamination, also displayed infigs. 7 and 8, clearly indicate that such a background can-not account for the observed differences. Rather, they areattributed to the summation of a large number of data
84 The European Physical Journal A
taking periods with various experimental configurations(target length, wire chambers, green vs. UV laser line, . . .).Although these configurations were implemented in corre-sponding simulations, small imperfections (misalignmentsin particular) could not be taken into account.
To summarize, thanks to these experimental checks,we are confident that the level of background in our sam-ples is low. This is corroborated by the simulation fromwhich a global background contamination (multi-pionsand crossed contributions) of the order of 5% was esti-mated.
3.2 Measurement of Σ
The beam asymmetry Σ was determined from the stan-dard expression (see [15] for more details):
NV (ϕ)− NH(ϕ)
NV (ϕ) + NH(ϕ)= PγΣ cos(2ϕ), (2)
where NV and NH are the azimuthal yields normalizedby the integrated flux for the vertical and horizontal po-larization states, respectively. Pγ is the degree of linearpolarization of the beam and ϕ the azimuthal angle ofthe reaction plane. Σ was extracted from the fit of thenormalized ratio (eq. (2)) by the function PγΣ cos(2ϕ),using the known energy dependence of Pγ . Two typicalexamples are given in fig. 9.
This method, based on a ratio, allows one to get rid ofmany systematic uncertainties. Only two sources of sys-tematic errors have been taken into account: the laserbeam polarization (eq. (1)) and the hadronic background.The latter contribution has been estimated from the vari-ation of the extracted asymmetries when cuts are changedfrom ±2σ to ±2.5σ. All systematic and statistical errorshave been summed quadratically.
Fig. 9. Azimuthal distributions of the normalized ratio NV −
NH/NV + NH : a) γp→ K+Λ reaction at Eγ = 1171MeV andθcm = 80.5◦ b) γp → K+Σ0 reaction at Eγ=1321MeV andθcm = 90.5◦. The solid lines represent the fits by the functionPγΣ cos(2ϕ) (eq. (2)). The results for PγΣ and the reduced χ2
values are given.
3.3 Measurement of P
For the reaction γp → K+Λ → K+pπ−, with an unpo-larized beam, the recoil polarization of the Λ, PΛ, is nec-essarily perpendicular to the reaction plane and can bedirectly measured from the angular distribution of the de-cay proton [23]:
W (cos θp) =1
2
(
1 + αPΛ cos θp)
, (3)
where α = 0.642± 0.013 [1] is the Λ decay parameter andθp the angle between the proton direction and the normalto the reaction plane in the Λ rest frame.For the reaction γp → K+Σ0 → K+Λγ → K+pπ−γ,
the polarization vector of the Σ0, PΣ0 , is related to thepolarization vector PΛ of the decay Λ according to [24]:
PΛ = −(PΣ0 ·uΛ)uΛ , (4)
where uΛ is the unit vector along the direction of emissionof Λ in the Σ0 rest frame. Λ is longitudinally polarized inthe Σ0 rest frame. Averaging over all Λ flight directionsuΛ yields to:
〈PΛ〉 = −1
3PΣ0 . (5)
The angular distribution of the decay proton reducesto
W (cos θp) =1
2
(
1−1
3αPΣ0 cos θp
)
, (6)
where θp is again the angle between the proton directionin the Λ rest frame and the normal to the reaction plane.The recoil polarizations PΛ and PΣ0 have been de-
termined directly from the proton up/down asymmetrieswith respect to the reaction plane, given by integration ofeqs. (3) and (6):
PΛ = +2
α
Nup −Ndown
Nup +Ndown
, (7)
PΣ0 = −6
α
Nup −Ndown
Nup +Ndown
, (8)
where Nup and Ndown are the number of events withcos θp > 0 and cos θp < 0, respectively. This calculationassumes that the corresponding detection efficiencies arethe same, i.e. εup = εdown, a reasonable assumption giventhe cylindrical symmetry of our 4π detector.The global up/down symmetry of our set-up has been
checked via the Monte Carlo simulation of both polarizedand unpolarized Λ/Σ0 decays. For unpolarized decays, theNup/Ndown ratio was found, as expected, to be close to1 for all energy and angular bins; for polarized decays,the recalculated asymmetry always agreed with the inputvalue, within a few percent.An alternative method to extract P consists in fitting
the efficiency corrected angular distribution and we didcheck that it gives results compatible with the previousone for all bins. Nevertheless, for the most forward kaonangle and for photon energies greater than 1100MeV, the
A. Lleres et al.: Polarization observable measurements for γp→ K+Λ . . . 85
resulting χ2 were found to be much larger than one, point-ing to remaining imperfections of the simulation. There-fore, we have decided to use the more robust up/downmethod which relies on a basic experimental feature andis much less dependent on the simulation details.For the recoil polarization observable, the systematic
uncertainties on the Λ decay parameter α and on thehadronic background contributions were considered; thelatter was estimated in the same way as for the beamasymmetries. In addition, a systematic error of 3% on theup/down efficiency ratio was included. The systematic andstatistical errors have been added quadratically.
4 Results and discussions
The complete set of beam asymmetry and recoil polariza-tion data for the γp → K+Λ and γp → K+Σ0 reactions
PΛ
900-1100 MeV
1.0
0.5
0.0
-0.5
-1.00 60 120 180
SAPHIR
1100-1300 MeV
60 120 180
γ+p → K++Λ
Θcm
1300-1500 MeV(SAPHIR 1300-1600 MeV)
60 120 180
Fig. 10. Λ recoil polarizations for γp → K+Λ. Comparisonbetween GRAAL (closed circles) and SAPHIR (open triangles)data.
PΣ
1050-1250 MeV(CLAS 1175 MeV)
1.0
0.5
0.0
-0.5
-1.00 60 120 180
Θcm
1250-1450 MeV(CLAS 1375 MeV)
60 120 180
γ+p → K++Σ0
CLASSAPHIR
Fig. 11. Σ0 recoil polarizations for γp → K+Σ0. Compari-son between GRAAL (closed circles), SAPHIR (open triangles)and CLAS (open squares) results. Data are compared with thenew (solid line) and the published (dot-dashed line) solutionsof the BCC model.
is displayed in figs. 10 to 16. These data cover the produc-tion threshold region (911–1500MeV for KΛ and 1046–1500MeV for KΣ0) and a large angular range (θcm = 20–140◦ for the kaon). Numerical values are listed in tables 1to 4. Error bars are the quadratic sum of statistical andsystematic errors. Data are available via internet [25].For the two reactions, the data samples correspond to
events selected by either of the two kinematical methodsdescribed previously. Due to the different ways of imple-menting energy momentum conservation, the two subsetsdo not fully overlap (around 50% of overlapping for bothreactions). After checking that results obtained for thetwo subsets were in agreement, they have been merged tomaximize statistics.
4.1 Comparison to previous results
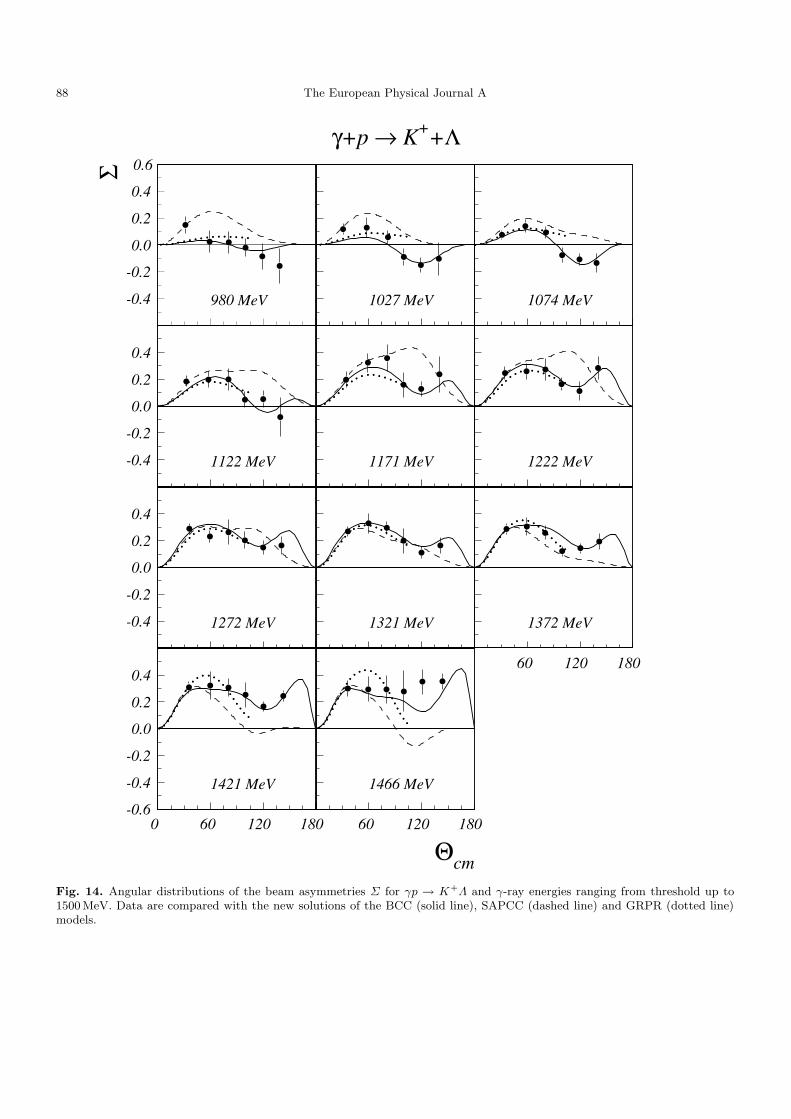
For the beam asymmetry, our data cover the energy rangefrom threshold to 1500MeV for the first time. Data havebeen previously published by the LEPS Collaborationfrom 1500 to 2400MeV in the forward region (θcm = 0–60◦) [5,6]. A good agreement is observed at 1500MeV forthe two experiments in the narrow angular overlappingregion.Regarding the recoil polarizations, high-quality data
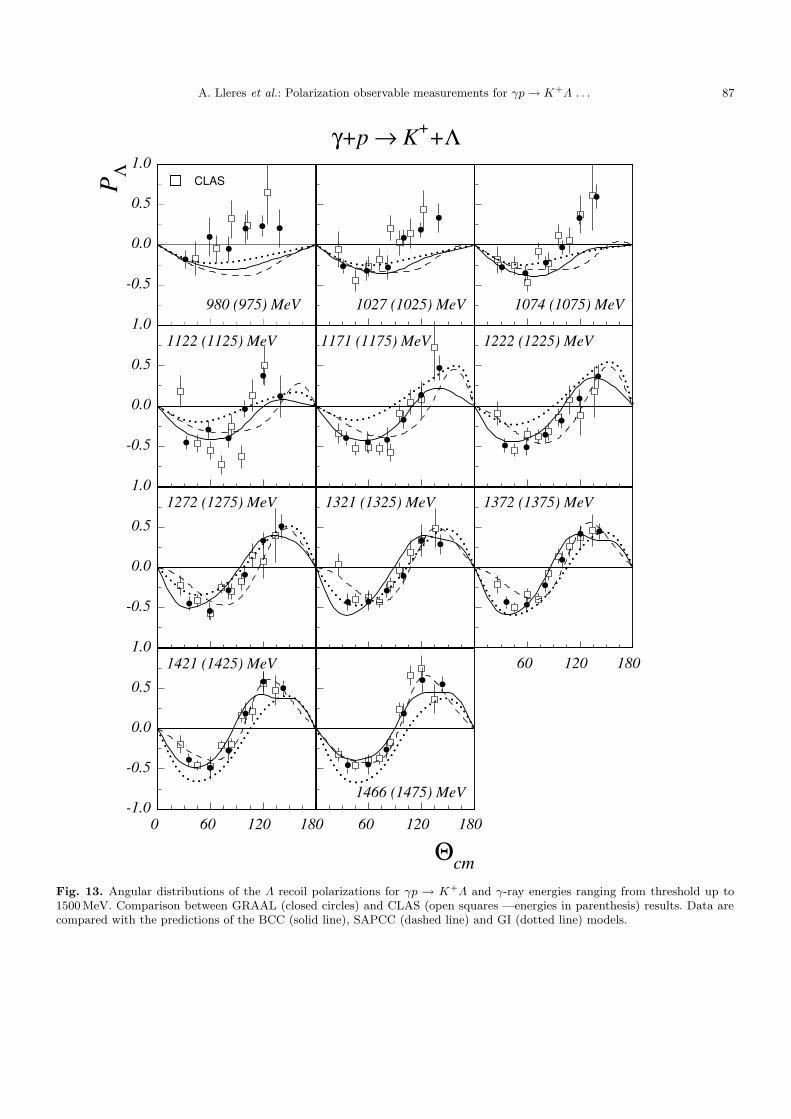
produced recently by SAPHIR [2] and CLAS [3] were ex-isting in the same energy and angular ranges. They arecompared with the GRAAL data in figs. 10 and 13 for KΛand in fig. 11 forKΣ0. For theKΛ reaction, the agreementbetween all experiments is very satisfactory over the fullangular range and at all energies. For the KΣ0 channel,despite the much larger uncertainties, the overall agree-ment is fair.
4.2 Discussion
We have compared our results with four models: thedynamical coupled-channel model of Saclay-Argonne-Pittsburgh [10], the Ghent isobar [11] and RPR (Regge-plus-resonance) [12] models and the coupled-channelpartial-wave analysis developed by the Bonn-PNPIgroup [8,9]. In the following, these models will be referedas SAPCC, GI, GRPR and BCC, respectively.For the KΛ reaction, two series of figures have been
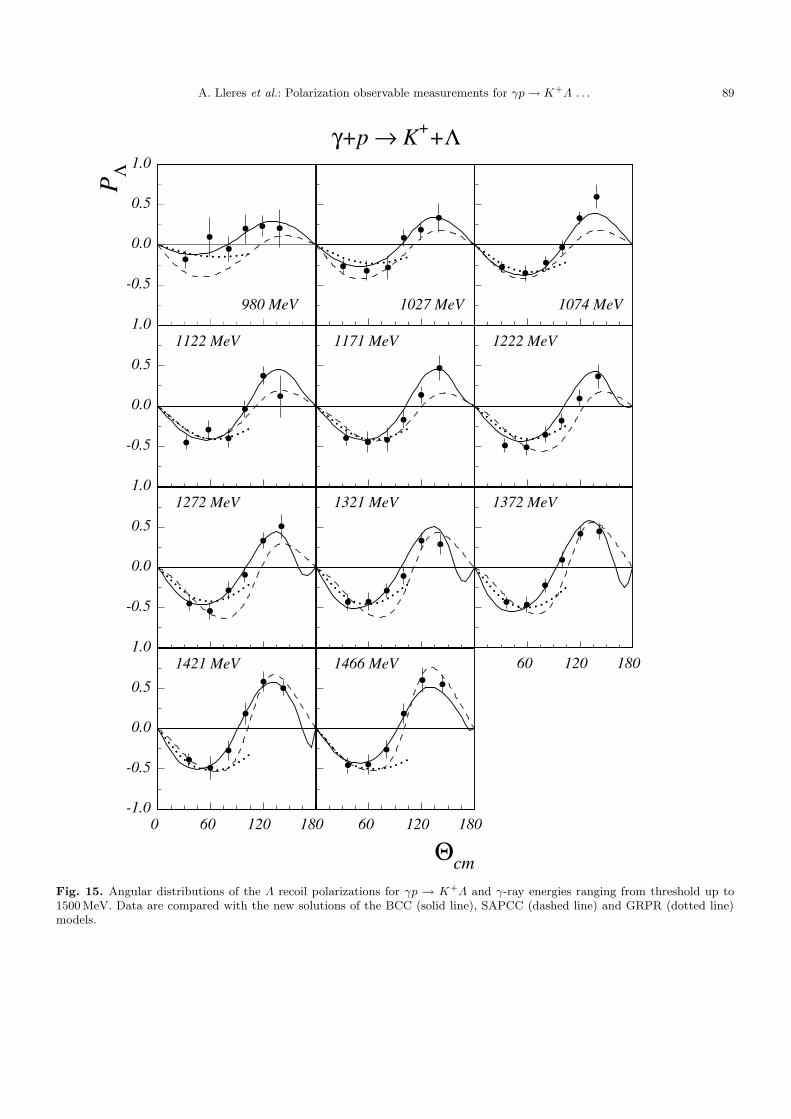
prepared. In figs. 12 and 13, the published versions of theSAPCC, GI and BCC models are plotted while re-fittedversions of the SAPCC, GRPR and BCC models, afterinclusion of our data, are presented in figs. 14 and 15.For the KΣ0 reaction, a specific analysis involving our
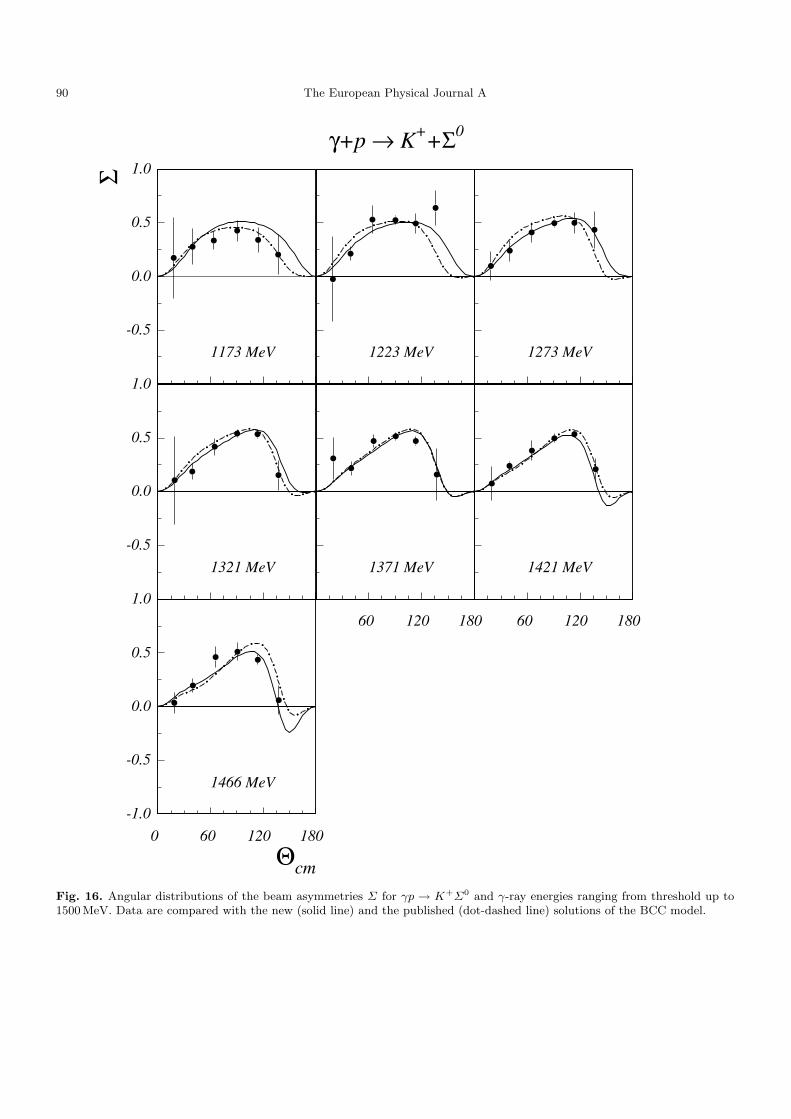
data was performed only with the BCC model. Figs. 11and 16 show the published and updated versions of thismodel.The SAPCCmodel [10] is a dynamical coupled-channel
formalism. All known resonances are treated in the frameof a chiral constituent quark model, hence limiting thenumber of adjustable parameters in contrast to isobarmodels. The model includes the direct γN → KΛ pro-cess as well as intermediate πN , KΛ and KΣ channels.
86 The European Physical Journal A
Σ
980 MeV
0.6
0.4
0.2
0.0
-0.2
-0.4 1027 MeV
γ+p → K++Λ
1074 MeV
1122 MeV
0.4
0.2
0.0
-0.2
-0.4 1171 MeV 1222 MeV
1272 MeV
0.4
0.2
0.0
-0.2
-0.4 1321 MeV 1372 MeV
60 120 180
1421 MeV
0.4
0.2
0.0
-0.2
-0.4
-0.60 60 120 180
Θcm
1466 MeV
60 120 180
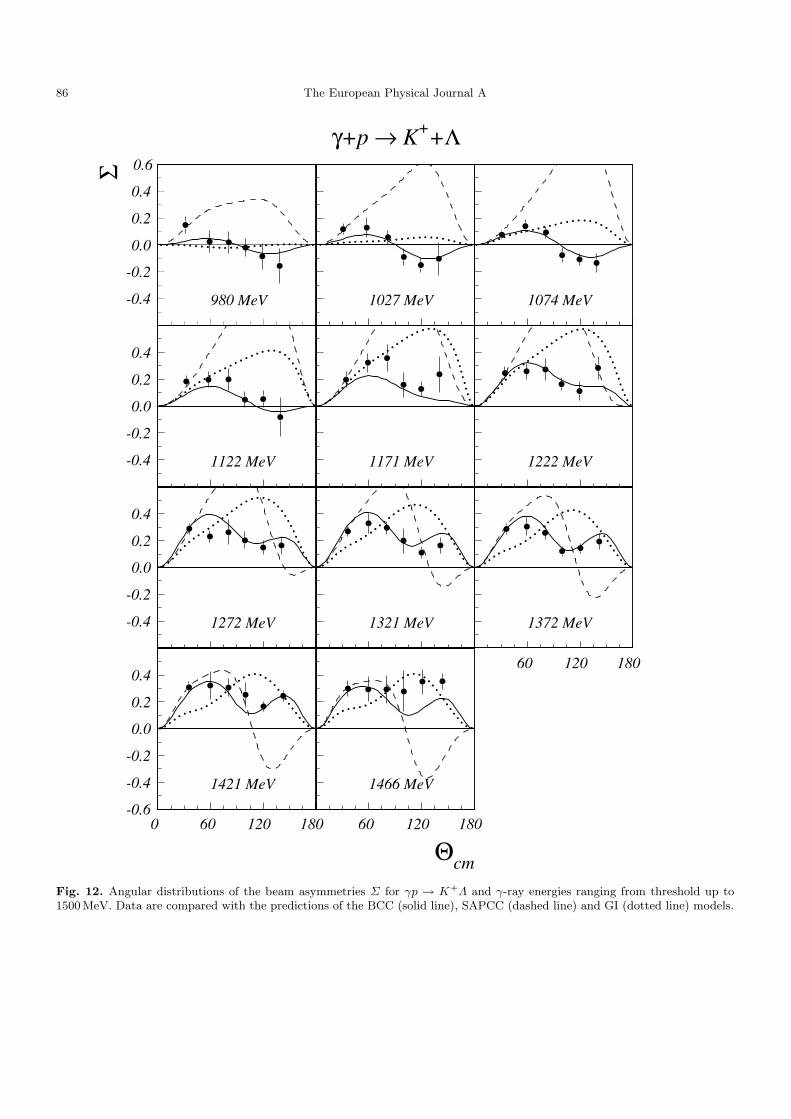
Fig. 12. Angular distributions of the beam asymmetries Σ for γp → K+Λ and γ-ray energies ranging from threshold up to1500MeV. Data are compared with the predictions of the BCC (solid line), SAPCC (dashed line) and GI (dotted line) models.
A. Lleres et al.: Polarization observable measurements for γp→ K+Λ . . . 87
PΛ
980 (975) MeV
1.0
0.5
0.0
-0.5
CLAS
1027 (1025) MeV
γ+p → K++Λ
1074 (1075) MeV
1122 (1125) MeV1.0
0.5
0.0
-0.5
1171 (1175) MeV 1222 (1225) MeV
1272 (1275) MeV1.0
0.5
0.0
-0.5
1321 (1325) MeV 1372 (1375) MeV
60 120 1801421 (1425) MeV1.0
0.5
0.0
-0.5
-1.00 60 120 180
Θcm
1466 (1475) MeV
60 120 180
Fig. 13. Angular distributions of the Λ recoil polarizations for γp → K+Λ and γ-ray energies ranging from threshold up to1500MeV. Comparison between GRAAL (closed circles) and CLAS (open squares —energies in parenthesis) results. Data arecompared with the predictions of the BCC (solid line), SAPCC (dashed line) and GI (dotted line) models.
88 The European Physical Journal A
Σ
980 MeV
0.6
0.4
0.2
0.0
-0.2
-0.4 1027 MeV
γ+p → K++Λ
1074 MeV
1122 MeV
0.4
0.2
0.0
-0.2
-0.4 1171 MeV 1222 MeV
1272 MeV
0.4
0.2
0.0
-0.2
-0.4 1321 MeV 1372 MeV
60 120 180
1421 MeV
0.4
0.2
0.0
-0.2
-0.4
-0.60 60 120 180
Θcm
1466 MeV
60 120 180
Fig. 14. Angular distributions of the beam asymmetries Σ for γp → K+Λ and γ-ray energies ranging from threshold up to1500MeV. Data are compared with the new solutions of the BCC (solid line), SAPCC (dashed line) and GRPR (dotted line)models.
A. Lleres et al.: Polarization observable measurements for γp→ K+Λ . . . 89
PΛ
980 MeV
1.0
0.5
0.0
-0.51027 MeV
γ+p → K++Λ
1074 MeV
1122 MeV1.0
0.5
0.0
-0.5
1171 MeV 1222 MeV
1272 MeV1.0
0.5
0.0
-0.5
1321 MeV 1372 MeV
60 120 1801421 MeV1.0
0.5
0.0
-0.5
-1.00 60 120 180
Θcm
1466 MeV
60 120 180
Fig. 15. Angular distributions of the Λ recoil polarizations for γp → K+Λ and γ-ray energies ranging from threshold up to1500MeV. Data are compared with the new solutions of the BCC (solid line), SAPCC (dashed line) and GRPR (dotted line)models.
90 The European Physical Journal A
Σ
1173 MeV
1.0
0.5
0.0
-0.51223 MeV
γ+p → K++Σ0
1273 MeV
1321 MeV
1.0
0.5
0.0
-0.51371 MeV
60 120 180
1421 MeV
60 120 180
Θcm
1466 MeV
1.0
0.5
0.0
-0.5
-1.00 60 120 180
Fig. 16. Angular distributions of the beam asymmetries Σ for γp → K+Σ0 and γ-ray energies ranging from threshold up to1500MeV. Data are compared with the new (solid line) and the published (dot-dashed line) solutions of the BCC model.
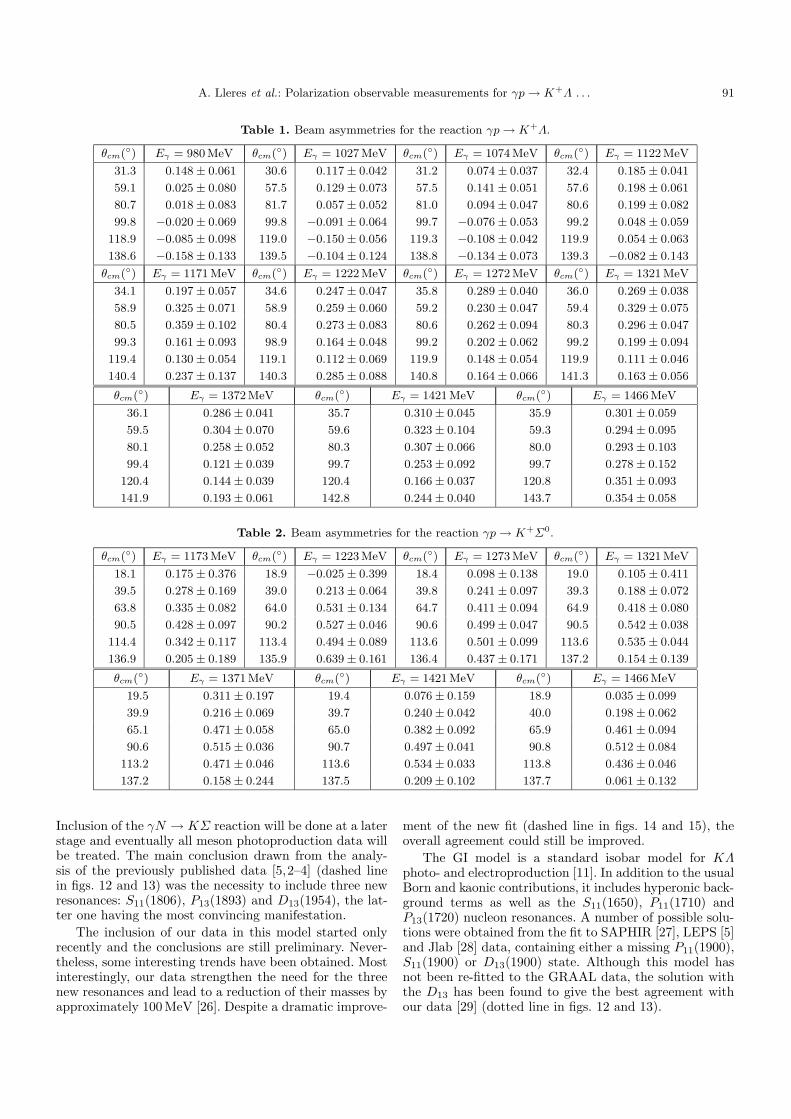
A. Lleres et al.: Polarization observable measurements for γp→ K+Λ . . . 91
Table 1. Beam asymmetries for the reaction γp→ K+Λ.
θcm(◦) Eγ = 980MeV θcm(◦) Eγ = 1027MeV θcm(◦) Eγ = 1074MeV θcm(◦) Eγ = 1122MeV
31.3 0.148± 0.061 30.6 0.117± 0.042 31.2 0.074± 0.037 32.4 0.185± 0.041
59.1 0.025± 0.080 57.5 0.129± 0.073 57.5 0.141± 0.051 57.6 0.198± 0.061
80.7 0.018± 0.083 81.7 0.057± 0.052 81.0 0.094± 0.047 80.6 0.199± 0.082
99.8 −0.020± 0.069 99.8 −0.091± 0.064 99.7 −0.076± 0.053 99.2 0.048± 0.059
118.9 −0.085± 0.098 119.0 −0.150± 0.056 119.3 −0.108± 0.042 119.9 0.054± 0.063
138.6 −0.158± 0.133 139.5 −0.104± 0.124 138.8 −0.134± 0.073 139.3 −0.082± 0.143
θcm(◦) Eγ = 1171MeV θcm(◦) Eγ = 1222MeV θcm(◦) Eγ = 1272MeV θcm(◦) Eγ = 1321MeV
34.1 0.197± 0.057 34.6 0.247± 0.047 35.8 0.289± 0.040 36.0 0.269± 0.038
58.9 0.325± 0.071 58.9 0.259± 0.060 59.2 0.230± 0.047 59.4 0.329± 0.075
80.5 0.359± 0.102 80.4 0.273± 0.083 80.6 0.262± 0.094 80.3 0.296± 0.047
99.3 0.161± 0.093 98.9 0.164± 0.048 99.2 0.202± 0.062 99.2 0.199± 0.094
119.4 0.130± 0.054 119.1 0.112± 0.069 119.9 0.148± 0.054 119.9 0.111± 0.046
140.4 0.237± 0.137 140.3 0.285± 0.088 140.8 0.164± 0.066 141.3 0.163± 0.056
θcm(◦) Eγ = 1372MeV θcm(◦) Eγ = 1421MeV θcm(◦) Eγ = 1466MeV
36.1 0.286± 0.041 35.7 0.310± 0.045 35.9 0.301± 0.059
59.5 0.304± 0.070 59.6 0.323± 0.104 59.3 0.294± 0.095
80.1 0.258± 0.052 80.3 0.307± 0.066 80.0 0.293± 0.103
99.4 0.121± 0.039 99.7 0.253± 0.092 99.7 0.278± 0.152
120.4 0.144± 0.039 120.4 0.166± 0.037 120.8 0.351± 0.093
141.9 0.193± 0.061 142.8 0.244± 0.040 143.7 0.354± 0.058
Table 2. Beam asymmetries for the reaction γp→ K+Σ0.
θcm(◦) Eγ = 1173MeV θcm(◦) Eγ = 1223MeV θcm(◦) Eγ = 1273MeV θcm(◦) Eγ = 1321MeV
18.1 0.175± 0.376 18.9 −0.025± 0.399 18.4 0.098± 0.138 19.0 0.105± 0.411
39.5 0.278± 0.169 39.0 0.213± 0.064 39.8 0.241± 0.097 39.3 0.188± 0.072
63.8 0.335± 0.082 64.0 0.531± 0.134 64.7 0.411± 0.094 64.9 0.418± 0.080
90.5 0.428± 0.097 90.2 0.527± 0.046 90.6 0.499± 0.047 90.5 0.542± 0.038
114.4 0.342± 0.117 113.4 0.494± 0.089 113.6 0.501± 0.099 113.6 0.535± 0.044
136.9 0.205± 0.189 135.9 0.639± 0.161 136.4 0.437± 0.171 137.2 0.154± 0.139
θcm(◦) Eγ = 1371MeV θcm(◦) Eγ = 1421MeV θcm(◦) Eγ = 1466MeV
19.5 0.311± 0.197 19.4 0.076± 0.159 18.9 0.035± 0.099
39.9 0.216± 0.069 39.7 0.240± 0.042 40.0 0.198± 0.062
65.1 0.471± 0.058 65.0 0.382± 0.092 65.9 0.461± 0.094
90.6 0.515± 0.036 90.7 0.497± 0.041 90.8 0.512± 0.084
113.2 0.471± 0.046 113.6 0.534± 0.033 113.8 0.436± 0.046
137.2 0.158± 0.244 137.5 0.209± 0.102 137.7 0.061± 0.132
Inclusion of the γN → KΣ reaction will be done at a laterstage and eventually all meson photoproduction data willbe treated. The main conclusion drawn from the analy-sis of the previously published data [5,2–4] (dashed linein figs. 12 and 13) was the necessity to include three newresonances: S11(1806), P13(1893) and D13(1954), the lat-ter one having the most convincing manifestation.
The inclusion of our data in this model started onlyrecently and the conclusions are still preliminary. Never-theless, some interesting trends have been obtained. Mostinterestingly, our data strengthen the need for the threenew resonances and lead to a reduction of their masses byapproximately 100MeV [26]. Despite a dramatic improve-
ment of the new fit (dashed line in figs. 14 and 15), theoverall agreement could still be improved.
The GI model is a standard isobar model for KΛphoto- and electroproduction [11]. In addition to the usualBorn and kaonic contributions, it includes hyperonic back-ground terms as well as the S11(1650), P11(1710) andP13(1720) nucleon resonances. A number of possible solu-tions were obtained from the fit to SAPHIR [27], LEPS [5]and Jlab [28] data, containing either a missing P11(1900),S11(1900) or D13(1900) state. Although this model hasnot been re-fitted to the GRAAL data, the solution withthe D13 has been found to give the best agreement withour data [29] (dotted line in figs. 12 and 13).
92 The European Physical Journal A
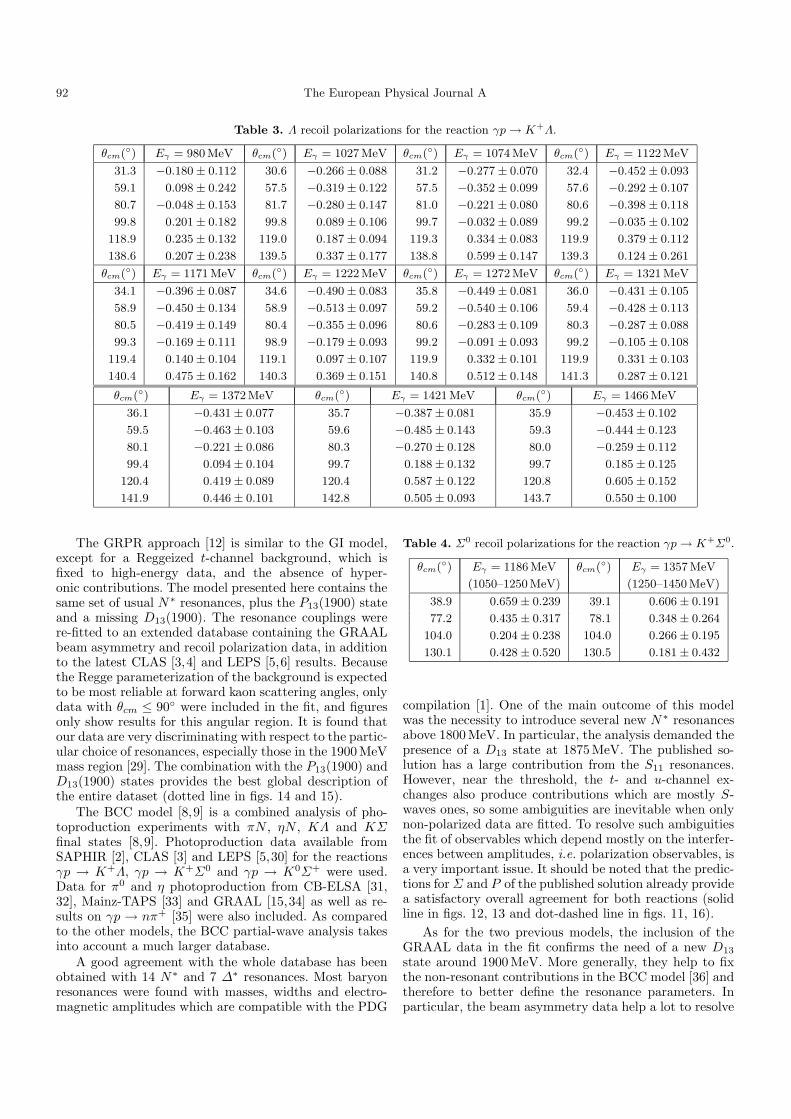
Table 3. Λ recoil polarizations for the reaction γp→ K+Λ.
θcm(◦) Eγ = 980MeV θcm(◦) Eγ = 1027MeV θcm(◦) Eγ = 1074MeV θcm(◦) Eγ = 1122MeV
31.3 −0.180± 0.112 30.6 −0.266± 0.088 31.2 −0.277± 0.070 32.4 −0.452± 0.093
59.1 0.098± 0.242 57.5 −0.319± 0.122 57.5 −0.352± 0.099 57.6 −0.292± 0.107
80.7 −0.048± 0.153 81.7 −0.280± 0.147 81.0 −0.221± 0.080 80.6 −0.398± 0.118
99.8 0.201± 0.182 99.8 0.089± 0.106 99.7 −0.032± 0.089 99.2 −0.035± 0.102
118.9 0.235± 0.132 119.0 0.187± 0.094 119.3 0.334± 0.083 119.9 0.379± 0.112
138.6 0.207± 0.238 139.5 0.337± 0.177 138.8 0.599± 0.147 139.3 0.124± 0.261
θcm(◦) Eγ = 1171MeV θcm(◦) Eγ = 1222MeV θcm(◦) Eγ = 1272MeV θcm(◦) Eγ = 1321MeV
34.1 −0.396± 0.087 34.6 −0.490± 0.083 35.8 −0.449± 0.081 36.0 −0.431± 0.105
58.9 −0.450± 0.134 58.9 −0.513± 0.097 59.2 −0.540± 0.106 59.4 −0.428± 0.113
80.5 −0.419± 0.149 80.4 −0.355± 0.096 80.6 −0.283± 0.109 80.3 −0.287± 0.088
99.3 −0.169± 0.111 98.9 −0.179± 0.093 99.2 −0.091± 0.093 99.2 −0.105± 0.108
119.4 0.140± 0.104 119.1 0.097± 0.107 119.9 0.332± 0.101 119.9 0.331± 0.103
140.4 0.475± 0.162 140.3 0.369± 0.151 140.8 0.512± 0.148 141.3 0.287± 0.121
θcm(◦) Eγ = 1372MeV θcm(◦) Eγ = 1421MeV θcm(◦) Eγ = 1466MeV
36.1 −0.431± 0.077 35.7 −0.387± 0.081 35.9 −0.453± 0.102
59.5 −0.463± 0.103 59.6 −0.485± 0.143 59.3 −0.444± 0.123
80.1 −0.221± 0.086 80.3 −0.270± 0.128 80.0 −0.259± 0.112
99.4 0.094± 0.104 99.7 0.188± 0.132 99.7 0.185± 0.125
120.4 0.419± 0.089 120.4 0.587± 0.122 120.8 0.605± 0.152
141.9 0.446± 0.101 142.8 0.505± 0.093 143.7 0.550± 0.100
The GRPR approach [12] is similar to the GI model,except for a Reggeized t-channel background, which isfixed to high-energy data, and the absence of hyper-onic contributions. The model presented here contains thesame set of usual N∗ resonances, plus the P13(1900) stateand a missing D13(1900). The resonance couplings werere-fitted to an extended database containing the GRAALbeam asymmetry and recoil polarization data, in additionto the latest CLAS [3,4] and LEPS [5,6] results. Becausethe Regge parameterization of the background is expectedto be most reliable at forward kaon scattering angles, onlydata with θcm ≤ 90
◦ were included in the fit, and figuresonly show results for this angular region. It is found thatour data are very discriminating with respect to the partic-ular choice of resonances, especially those in the 1900MeVmass region [29]. The combination with the P13(1900) andD13(1900) states provides the best global description ofthe entire dataset (dotted line in figs. 14 and 15).The BCC model [8,9] is a combined analysis of pho-
toproduction experiments with πN , ηN , KΛ and KΣfinal states [8,9]. Photoproduction data available fromSAPHIR [2], CLAS [3] and LEPS [5,30] for the reactionsγp → K+Λ, γp → K+Σ0 and γp → K0Σ+ were used.Data for π0 and η photoproduction from CB-ELSA [31,32], Mainz-TAPS [33] and GRAAL [15,34] as well as re-sults on γp → nπ+ [35] were also included. As comparedto the other models, the BCC partial-wave analysis takesinto account a much larger database.A good agreement with the whole database has been
obtained with 14 N∗ and 7 ∆∗ resonances. Most baryonresonances were found with masses, widths and electro-magnetic amplitudes which are compatible with the PDG
Table 4. Σ0 recoil polarizations for the reaction γp→ K+Σ0.
θcm(◦) Eγ = 1186MeV θcm(◦) Eγ = 1357MeV
(1050–1250MeV) (1250–1450MeV)
38.9 0.659± 0.239 39.1 0.606± 0.191
77.2 0.435± 0.317 78.1 0.348± 0.264
104.0 0.204± 0.238 104.0 0.266± 0.195
130.1 0.428± 0.520 130.5 0.181± 0.432
compilation [1]. One of the main outcome of this modelwas the necessity to introduce several new N ∗ resonancesabove 1800MeV. In particular, the analysis demanded thepresence of a D13 state at 1875MeV. The published so-lution has a large contribution from the S11 resonances.However, near the threshold, the t- and u-channel ex-changes also produce contributions which are mostly S-waves ones, so some ambiguities are inevitable when onlynon-polarized data are fitted. To resolve such ambiguitiesthe fit of observables which depend mostly on the interfer-ences between amplitudes, i.e. polarization observables, isa very important issue. It should be noted that the predic-tions forΣ and P of the published solution already providea satisfactory overall agreement for both reactions (solidline in figs. 12, 13 and dot-dashed line in figs. 11, 16).
As for the two previous models, the inclusion of theGRAAL data in the fit confirms the need of a new D13
state around 1900MeV. More generally, they help to fixthe non-resonant contributions in the BCC model [36] andtherefore to better define the resonance parameters. Inparticular, the beam asymmetry data help a lot to resolve
A. Lleres et al.: Polarization observable measurements for γp→ K+Λ . . . 93
ambiguities near threshold in the S11 multipole. As a re-sult, the final solution has much less contribution fromS11 resonances and bigger contribution from t-channel ex-changes. The quality of the agreement of the new versionis excellent (solid line in figs. 11, 14, 15 and 16).It is particularly striking that all models, while using
totally different formalisms as well as fitted database, leadto a common conclusion. They all point to the need for anew D13 state around 1900MeV.
5 Summary
In this paper, we have presented new results for the re-actions γp → K+Λ and γp → K+Σ0 from threshold to1500MeV. Precise measurements for beam asymmetriesand hyperon recoil polarizations have been obtained over awide angular range. These results significantly extend thestrangeness photoproduction database and complementthe beam asymmetry measurements below 1500MeV. Wehave compared our results with four models, which areable to reasonably fit the whole set of data. They all con-clude on the need to enrich the nucleon spectrum withseveral new resonances. Among the various candidates,a new D13 state around 1900MeV appears to be neces-sary to describe our beam asymmetry data in all discussedmodels.
We are grateful to A.V. Anisovich, E. Klempt, V.A. Nikonov,A.V. Sarantsev, B. Saghai and T. Corthals for communicationof their most recent analyses. It is a pleasure to thank theESRF as a host institution and its technical staff for the smoothoperation of the beam. Technical assistance of all participatinginstitutions is greatly acknowledged, with special mention toA. Pelissier and A. Maurice from LPSC who took charge of thelong and delicate construction of the cylindrical chambers.
References
1. Review of Particle Physics 2004, Phys. Lett. B 592, 1(2004).
2. K.-H. Glander et al., Eur. Phys. J. A. 19, 251 (2004).3. J.W.C. McNabb et al., Phys. Rev. C 69, 042201(R) (2004);
R. Schumacher, private communication.
4. R. Bradford et al., Phys. Rev. C 73, 035202 (2006).5. R.G.T. Zegers et al., Phys. Rev. Lett. 91, 092001 (2003).6. M. Sumihama et al., Phys. Rev. C 73, 035214 (2006).7. T. Mart, C. Bennhold, H. Haberzettl, L. Tiator, KAON-
MAID isobar model; references and results available at thewebsite www.kph.uni-mainz.de/MAID.
8. A.V. Anisovich et al., Eur. Phys. J. A. 25, 427 (2005).9. A.V. Sarantsev et al., Eur. Phys. J. A. 25, 441 (2005).
10. B. Julia-Diaz, B. Saghai, T.-S.H. Lee, F. Tabakin, Phys.Rev. C 73, 055204 (2006).
11. D.G. Ireland, S. Janssen, J. Ryckebusch, Nucl. Phys. A740, 147 (2004); S. Janssen, J. Ryckebusch, D. Debruyne,T. Van Cauteren, Phys. Rev. C 65, 015201 (2002).
12. T. Corthals, J. Ryckebusch, T. Van Cauteren, Phys. Rev.C 73, 045207 (2006).
13. A. Usov, O. Scholten, Phys. Rev. C 72, 025205 (2005).14. T. Mart, A. Sulaksono, Phys. Rev. C 74, 055203 (2006).15. O. Bartalini et al., Eur. Phys. J. A 26, 399 (2005).16. F.R. Arutyunian et al., Teor. Fiz. 45, 312 (1963).17. P. Levi Sandri et al., Nucl. Instrum. Methods A 370, 396
(1996).18. M. Castoldi et al., Nucl. Instrum. Methods A 403, 22
(1998).19. F. Ghio et al., Nucl. Instrum. Methods A 404, 71 (1998).20. L. Nicoletti, Thesis, Universite J. Fourier (Grenoble) 2002,
unpublished.21. T. Russew, Thesis, Universite J. Fourier (Grenoble) 1995,
unpublished.22. P. Calvat, Thesis, Universite J. Fourier (Grenoble) 1997,
unpublished.23. T.D. Lee, C.N. Yang, Phys. Rev. 108, 1645 (1957).24. R. Gatto, Phys. Rev. 109, 610 (1958).25. The full data set is available at the website http://
lpsc.in2p3.fr/GRAAL1.26. B. Saghai, private communication.27. M.Q. Tran et al., Phys. Lett. B 445, 20 (1998).28. R.M. Mohring et al., Phys. Rev. C 67, 055205 (2003).29. T. Corthals, private communication.30. R. Lawall et al., Eur. Phys. J. A. 24, 275 (2005).31. O. Bartholomy et al., Phys. Rev. Lett. 94, 012003 (2005).32. V. Crede et al., Phys. Rev. Lett. 94, 012004 (2005).33. B. Krusche et al., Phys. Rev. Lett. 74, 3736 (1995).34. J. Ajaka et al., Phys. Rev. Lett. 81, 1797 (1998).35. K.H. Althoff et al., Phys. Rev. C 18, 199 (1983); K. Buech-
ler et al., Nucl. Phys. A 570, 580 (1994).36. A.V. Sarantsev, private communication.

![Finite Element Clifford Algebra: A New Toolkit for ...math.arizona.edu/~agillette/research/pd11talk.pdf · [0;T] k+2 [0;T] k+1 d 6 (r k d 6 (r k k 1 d 6 (r k 2 Finite Element Clifford](https://static.fdocument.org/doc/165x107/5f58c22634ae8b00ca3fa708/finite-element-clifford-algebra-a-new-toolkit-for-math-agilletteresearchpd11talkpdf.jpg)


![) and K · f1(1285)! a0(980)ˇ decay: formalism Vertices: f1 K (K 1) K (K).. it1 = igf1C1ϵ ϵ′ gf1 = 7555 MeV, evaluated as the residue at the pole of T = [1 VG] 1V for K K c:c:](https://static.fdocument.org/doc/165x107/5f08d6ad7e708231d423f7ef/-and-k-f11285-a0980-decay-formalism-vertices-f1-k-k-1-k-k-it1-.jpg)


![Finite Element Clifford Algebra: A New Toolkit for ...ccom.ucsd.edu/~agillette/research/pd11talk.pdf · [0;T] k+2 [0;T] k+1 d 6 (r k d 6 (r k k 1 d 6 (r k 2 Finite Element Clifford](https://static.fdocument.org/doc/165x107/5f58bc148149db2e4503093f/finite-element-clifford-algebra-a-new-toolkit-for-ccomucsdeduagilletteresearch.jpg)