2012 2013 Integrated Report DataTables - Food … 8.6 Hadar18 0.8 8 8.8 Saintpaul 11 6.3 Litchfield...
226
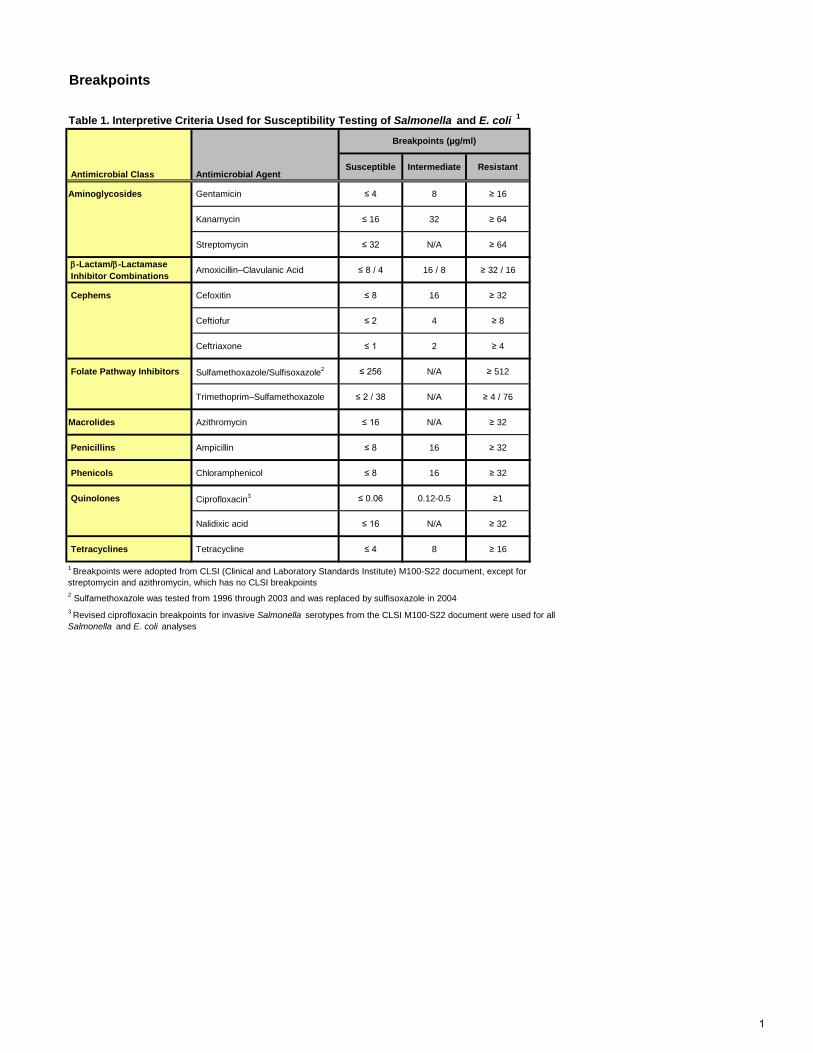
Breakpoints Antimicrobial Class Antimicrobial Agent Aminoglycosides Gentamicin ≤ 4 8 ≥ 16 Kanamycin ≤ 16 32 ≥ 64 Streptomycin ≤ 32 N/A ≥ 64 β-Lactam/β-Lactamase Inhibitor Combinations Amoxicillin–Clavulanic Acid ≤ 8 / 4 16 / 8 ≥ 32 / 16 Cephems Cefoxitin ≤ 8 16 ≥ 32 Ceftiofur ≤ 2 4 ≥ 8 Ceftriaxone ≤ 1 2 ≥ 4 Folate Pathway Inhibitors Sulfamethoxazole/Sulfisoxazole 2 ≤ 256 N/A ≥ 512 Trimethoprim–Sulfamethoxazole ≤ 2 / 38 N/A ≥ 4 / 76 Macrolides Azithromycin ≤ 16 N/A ≥ 32 Penicillins Ampicillin ≤ 8 16 ≥ 32 Phenicols Chloramphenicol ≤ 8 16 ≥ 32 Quinolones Ciprofloxacin 3 ≤ 0.06 0.12-0.5 ≥1 Nalidixic acid ≤ 16 N/A ≥ 32 Tetracyclines Tetracycline ≤ 4 8 ≥ 16 2 Sulfamethoxazole was tested from 1996 through 2003 and was replaced by sulfisoxazole in 2004 1 Breakpoints were adopted from CLSI (Clinical and Laboratory Standards Institute) M100-S22 document, except for streptomycin and azithromycin, which has no CLSI breakpoints Table 1. Interpretive Criteria Used for Susceptibility Testing of Salmonella and E. coli 1 Breakpoints (μg/ml) Susceptible Intermediate Resistant 3 Revised ciprofloxacin breakpoints for invasive Salmonella serotypes from the CLSI M100-S22 document were used for all Salmonella and E. coli analyses 1
Transcript of 2012 2013 Integrated Report DataTables - Food … 8.6 Hadar18 0.8 8 8.8 Saintpaul 11 6.3 Litchfield...
Breakpoints
Antimicrobial Class Antimicrobial Agent
Aminoglycosides Gentamicin ≤ 4 8 ≥ 16
Kanamycin ≤ 16 32 ≥ 64
Streptomycin ≤ 32 N/A ≥ 64
β-Lactam/β-Lactamase Inhibitor Combinations Amoxicillin–Clavulanic Acid ≤ 8 / 4 16 / 8 ≥ 32 / 16
Cephems Cefoxitin ≤ 8 16 ≥ 32
Ceftiofur ≤ 2 4 ≥ 8
Ceftriaxone ≤ 1 2 ≥ 4
Folate Pathway Inhibitors Sulfamethoxazole/Sulfisoxazole2 ≤ 256 N/A ≥ 512
Trimethoprim–Sulfamethoxazole ≤ 2 / 38 N/A ≥ 4 / 76
Macrolides Azithromycin ≤ 16 N/A ≥ 32
Penicillins Ampicillin ≤ 8 16 ≥ 32
Phenicols Chloramphenicol ≤ 8 16 ≥ 32
Quinolones Ciprofloxacin3 ≤ 0.06 0.12-0.5 ≥1
Nalidixic acid ≤ 16 N/A ≥ 32
Tetracyclines Tetracycline ≤ 4 8 ≥ 16
2 Sulfamethoxazole was tested from 1996 through 2003 and was replaced by sulfisoxazole in 2004
1 Breakpoints were adopted from CLSI (Clinical and Laboratory Standards Institute) M100-S22 document, except for streptomycin and azithromycin, which has no CLSI breakpoints
Table 1. Interpretive Criteria Used for Susceptibility Testing of Salmonella and E. coli 1
Breakpoints (µg/ml)
Susceptible Intermediate Resistant
3 Revised ciprofloxacin breakpoints for invasive Salmonella serotypes from the CLSI M100-S22 document were used for all Salmonella and E. coli analyses
1
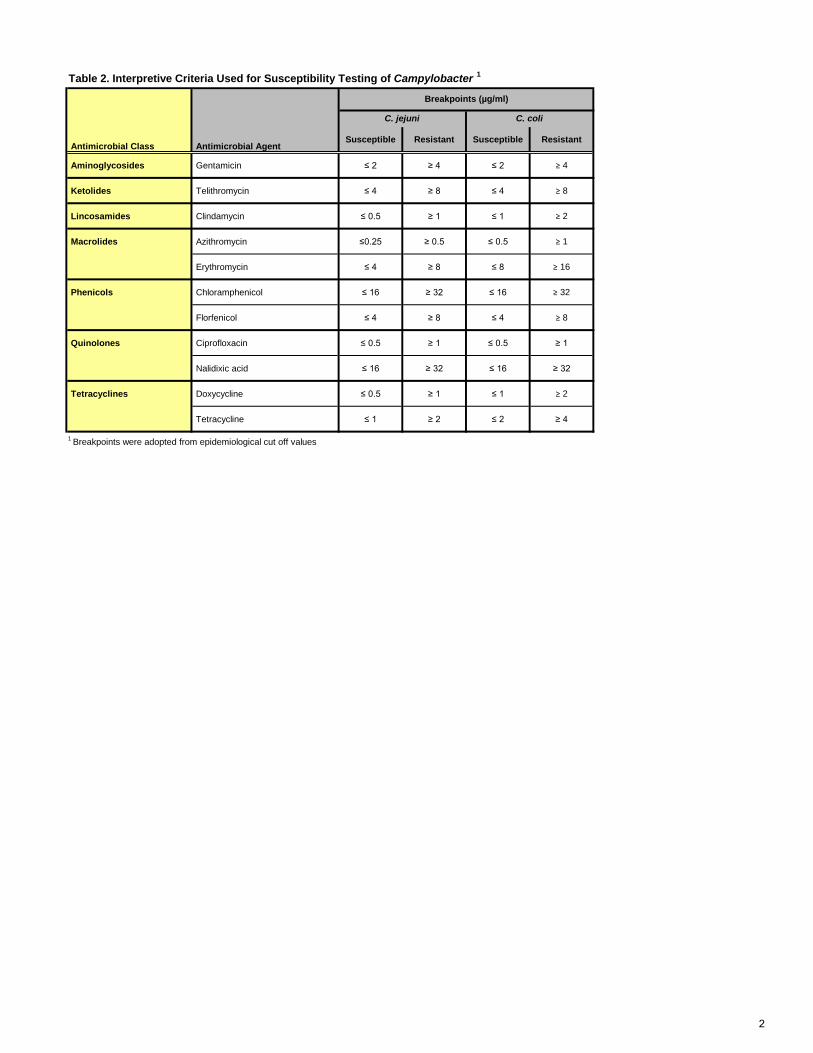
Table 2. Interpretive Criteria Used for Susceptibility Testing of Campylobacter 1
Antimicrobial Class Antimicrobial Agent
Aminoglycosides Gentamicin ≤ 2 ≥ 4 ≤ 2 ≥ 4
Ketolides Telithromycin ≤ 4 ≥ 8 ≤ 4 ≥ 8
Lincosamides Clindamycin ≤ 0.5 ≥ 1 ≤ 1 ≥ 2
Macrolides Azithromycin ≤0.25 ≥ 0.5 ≤ 0.5 ≥ 1
Erythromycin ≤ 4 ≥ 8 ≤ 8 ≥ 16
Phenicols Chloramphenicol ≤ 16 ≥ 32 ≤ 16 ≥ 32
Florfenicol ≤ 4 ≥ 8 ≤ 4 ≥ 8
Quinolones Ciprofloxacin ≤ 0.5 ≥ 1 ≤ 0.5 ≥ 1
Nalidixic acid ≤ 16 ≥ 32 ≤ 16 ≥ 32
Tetracyclines Doxycycline ≤ 0.5 ≥ 1 ≤ 1 ≥ 2
Tetracycline ≤ 1 ≥ 2 ≤ 2 ≥ 4
C. jejuni C. coli
Breakpoints (µg/ml)
1 Breakpoints were adopted from epidemiological cut off values
Susceptible Resistant Susceptible Resistant
2
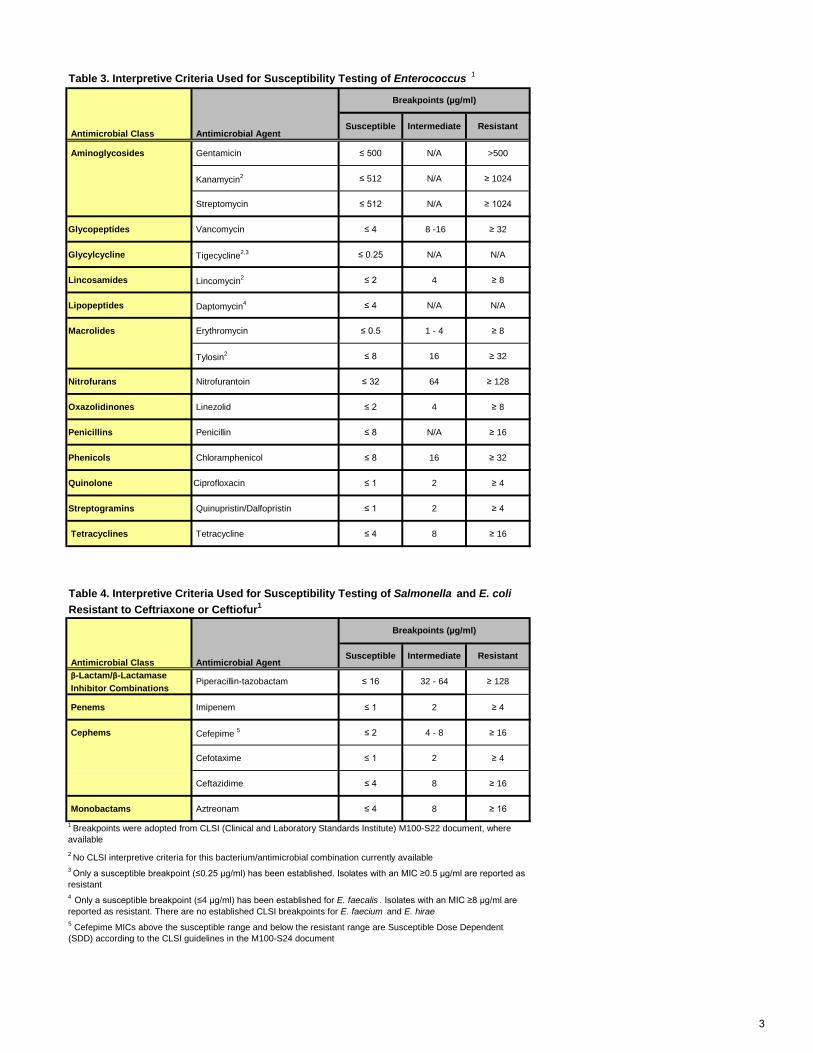
Table 3. Interpretive Criteria Used for Susceptibility Testing of Enterococcus 1
Antimicrobial Class Antimicrobial Agent
Aminoglycosides Gentamicin ≤ 500 N/A >500
Kanamycin2 ≤ 512 N/A ≥ 1024
Streptomycin ≤ 512 N/A ≥ 1024
Glycopeptides Vancomycin ≤ 4 8 -16 ≥ 32
Glycylcycline Tigecycline2,3 ≤ 0.25 N/A N/A
Lincosamides Lincomycin2 ≤ 2 4 ≥ 8
Lipopeptides Daptomycin4 ≤ 4 N/A N/A
Macrolides Erythromycin ≤ 0.5 1 - 4 ≥ 8
Tylosin2 ≤ 8 16 ≥ 32
Nitrofurans Nitrofurantoin ≤ 32 64 ≥ 128
Oxazolidinones Linezolid ≤ 2 4 ≥ 8
Penicillins Penicillin ≤ 8 N/A ≥ 16
Phenicols Chloramphenicol ≤ 8 16 ≥ 32
Quinolone Ciprofloxacin ≤ 1 2 ≥ 4
Streptogramins Quinupristin/Dalfopristin ≤ 1 2 ≥ 4
Tetracyclines Tetracycline ≤ 4 8 ≥ 16
Antimicrobial Class Antimicrobial Agent β-Lactam/β-Lactamase Inhibitor Combinations
Penems Imipenem ≤ 1 2 ≥ 4
Cephems Cefepime 5 ≤ 2 4 - 8 ≥ 16
Cefotaxime ≤ 1 2 ≥ 4
Ceftazidime ≤ 4 8 ≥ 16
Monobactams Aztreonam ≤ 4 8 ≥ 16
Intermediate Resistant
Breakpoints (µg/ml)
Breakpoints (µg/ml)
Susceptible
Susceptible Intermediate Resistant
Table 4. Interpretive Criteria Used for Susceptibility Testing of Salmonella and E. coli Resistant to Ceftriaxone or Ceftiofur1
2 No CLSI interpretive criteria for this bacterium/antimicrobial combination currently available3 Only a susceptible breakpoint (≤0.25 µg/ml) has been established. Isolates with an MIC ≥0.5 µg/ml are reported as resistant4 Only a susceptible breakpoint (≤4 µg/ml) has been established for E. faecalis . Isolates with an MIC ≥8 µg/ml are reported as resistant. There are no established CLSI breakpoints for E. faecium and E. hirae5 Cefepime MICs above the susceptible range and below the resistant range are Susceptible Dose Dependent (SDD) according to the CLSI guidelines in the M100-S24 document
Piperacillin-tazobactam ≤ 16 32 - 64 ≥ 128
1 Breakpoints were adopted from CLSI (Clinical and Laboratory Standards Institute) M100-S22 document, where available
3
Non-Typhoidal Salmonella Data
Non-Typhoidal Salmonella Isolates Tested
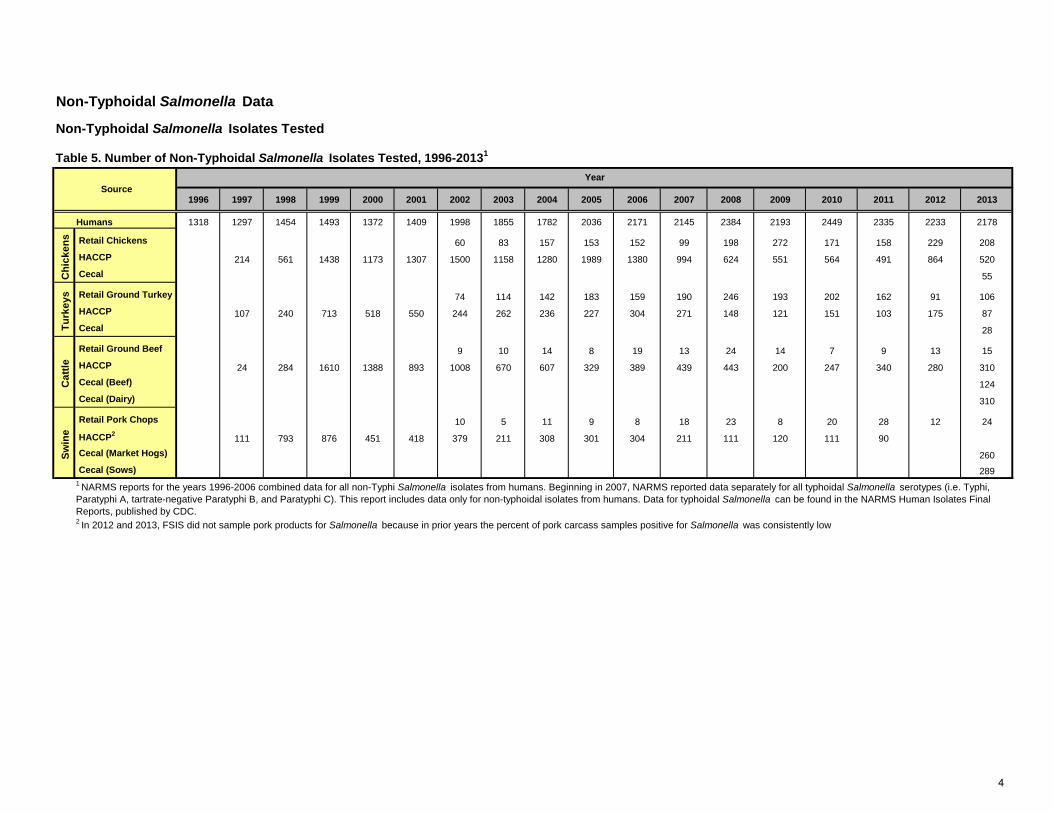
Table 5. Number of Non-Typhoidal Salmonella Isolates Tested, 1996-20131
1996 1997 1998 1999 2000 2001 2002 2003 2004 2005 2006 2007 2008 2009 2010 2011 2012 2013
Humans 1318 1297 1454 1493 1372 1409 1998 1855 1782 2036 2171 2145 2384 2193 2449 2335 2233 2178
Retail Chickens 60 83 157 153 152 99 198 272 171 158 229 208 HACCP 214 561 1438 1173 1307 1500 1158 1280 1989 1380 994 624 551 564 491 864 520 Cecal 55
Retail Ground Turkey 74 114 142 183 159 190 246 193 202 162 91 106 HACCP 107 240 713 518 550 244 262 236 227 304 271 148 121 151 103 175 87 Cecal 28
Retail Ground Beef 9 10 14 8 19 13 24 14 7 9 13 15 HACCP 24 284 1610 1388 893 1008 670 607 329 389 439 443 200 247 340 280 310 Cecal (Beef) 124 Cecal (Dairy) 310
Retail Pork Chops 10 5 11 9 8 18 23 8 20 28 12 24
HACCP2 111 793 876 451 418 379 211 308 301 304 211 111 120 111 90 Cecal (Market Hogs) 260 Cecal (Sows) 289
2 In 2012 and 2013, FSIS did not sample pork products for Salmonella because in prior years the percent of pork carcass samples positive for Salmonella was consistently low
SourceYear
1 NARMS reports for the years 1996-2006 combined data for all non-Typhi Salmonella isolates from humans. Beginning in 2007, NARMS reported data separately for all typhoidal Salmonella serotypes (i.e. Typhi, Paratyphi A, tartrate-negative Paratyphi B, and Paratyphi C). This report includes data only for non-typhoidal isolates from humans. Data for typhoidal Salmonella can be found in the NARMS Human Isolates Final Reports, published by CDC.
Swin
eC
attle
Turk
eys
Chi
cken
s
4
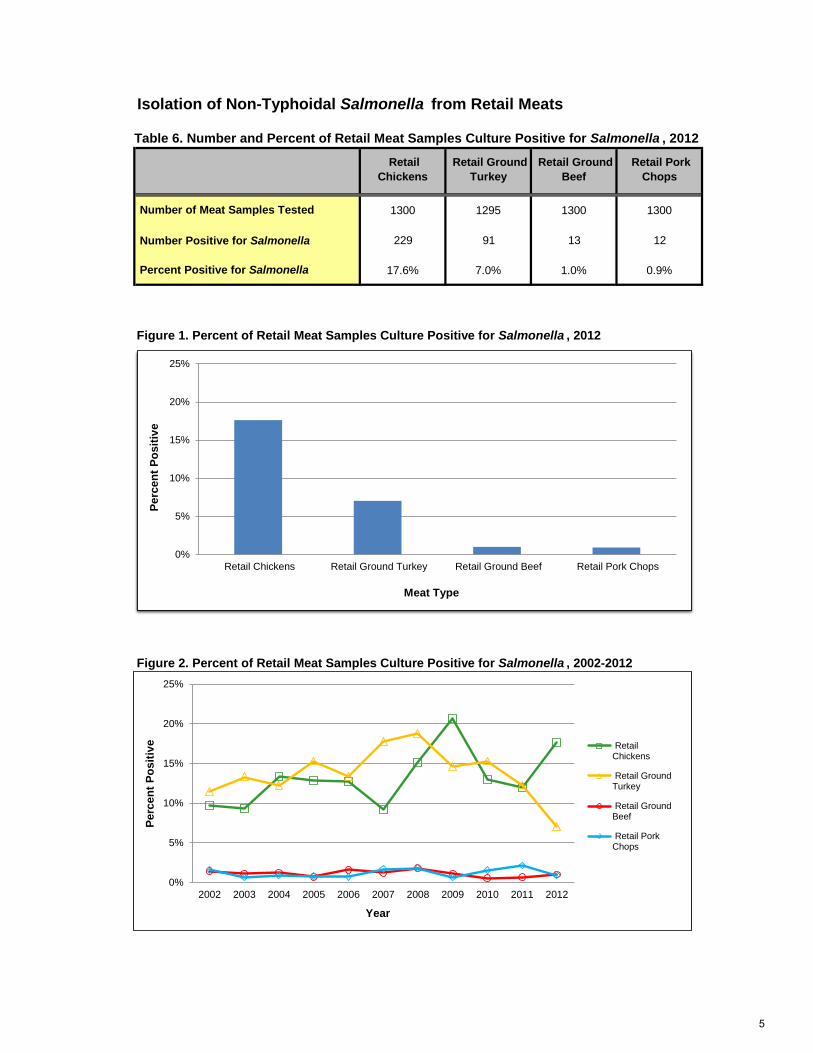
Isolation of Non-Typhoidal Salmonella from Retail Meats
Retail Chickens
Retail Ground Turkey
Retail Ground Beef
Retail Pork Chops
1300 1295 1300 1300
Number Positive for Salmonella 229 91 13 12
17.6% 7.0% 1.0% 0.9% Percent Positive for Salmonella
Table 6. Number and Percent of Retail Meat Samples Culture Positive for Salmonella , 2012
Number of Meat Samples Tested
Figure 2. Percent of Retail Meat Samples Culture Positive for Salmonella , 2002-2012
Figure 1. Percent of Retail Meat Samples Culture Positive for Salmonella , 2012
0%
5%
10%
15%
20%
25%
Retail Chickens Retail Ground Turkey Retail Ground Beef Retail Pork Chops
Perc
ent P
ositi
ve
Meat Type
0%
5%
10%
15%
20%
25%
2002 2003 2004 2005 2006 2007 2008 2009 2010 2011 2012
Perc
ent P
ositi
ve
Year
RetailChickens
Retail GroundTurkey
Retail GroundBeef
Retail PorkChops
5
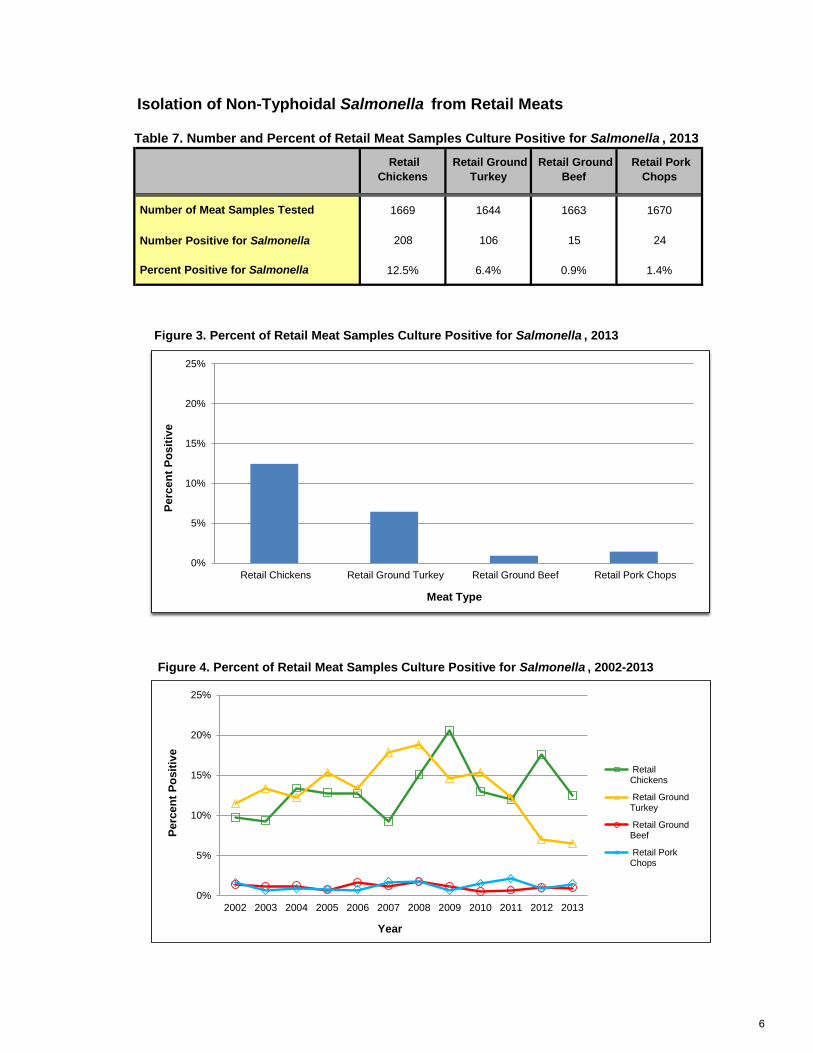
Isolation of Non-Typhoidal Salmonella from Retail Meats
Retail Chickens
Retail Ground Turkey
Retail Ground Beef
Retail Pork Chops
1669 1644 1663 1670
Number Positive for Salmonella 208 106 15 24
12.5% 6.4% 0.9% 1.4%
Table 7. Number and Percent of Retail Meat Samples Culture Positive for Salmonella , 2013
Number of Meat Samples Tested
Percent Positive for Salmonella
Figure 3. Percent of Retail Meat Samples Culture Positive for Salmonella , 2013
Figure 4. Percent of Retail Meat Samples Culture Positive for Salmonella , 2002-2013
0%
5%
10%
15%
20%
25%
Retail Chickens Retail Ground Turkey Retail Ground Beef Retail Pork Chops
Perc
ent P
ositi
ve
Meat Type
0%
5%
10%
15%
20%
25%
2002 2003 2004 2005 2006 2007 2008 2009 2010 2011 2012 2013
Perc
ent P
ositi
ve
Year
RetailChickens
Retail GroundTurkey
Retail GroundBeef
Retail PorkChops
6

Non-Typhoidal Salmonella Serotypes
Humans Source Serotype n % Source Serotype n % Source Serotype n %
Enteritidis 364 16.3 Typhimurium 88 38.4 Kentucky 301 34.8Typhimurium 296 13.3 Kentucky 62 27.1 Enteritidis 203 23.5Newport 258 11.6 Enteritidis 26 11.4 Typhimurium 105 12.2Javiana 134 6.0 Heidelberg 17 7.4 Heidelberg 81 9.4I 4,[5],12:i:- 117 5.2 Thompson 11 4.8 Infantis 31 3.6Infantis 90 4.0 I 4,[5],12:i:- 6 2.6 Thompson 30 3.5Montevideo 60 2.7 Mbandaka 4 1.7 Schwarzengrund 26 3.0Muenchen 58 2.6 Montevideo 4 1.7 Other 87 10.1Oranienburg 50 2.2 Infantis 3 1.3Saintpaul 50 2.2 Braenderup 2 0.9Bareilly 49 2.2 Other 6 2.6Braenderup 48 2.1Heidelberg 41 1.8Thompson 34 1.5 Source Serotype n % Source Serotype n %
Mississippi 27 1.2
Paratyphi B var. L(+) tartrate+ 27 1.2 IIIa 18:z4,z23:- 16 17.6 Hadar 31 17.7
Schwarzengrund 23 1.0 Saintpaul 9 9.9 Heidelberg 19 10.9
Agona 20 0.9 Typhimurium 9 9.9 Albany 15 8.6
Hadar 18 0.8 Hadar 8 8.8 Saintpaul 11 6.3
Litchfield 17 0.8 Agona 7 7.7 Schwarzengrund 11 6.3
Poona 17 0.8 Schwarzengrund 7 7.7 Senftenberg 11 6.3
Unknown serotype 19 0.9 Heidelberg 5 5.5 Agona 10 5.7
Partially serotyped 26 1.2 Enteritidis 4 4.4 Muenchen 10 5.7
Rough/Nonmotile isolates 7 0.3 Reading 4 4.4 Other 57 32.5
Other 383 17.2 Infantis 3 3.3Albany 2 2.2Anatum 2 2.2Brandenburg 2 2.2Newport 2 2.2Senftenberg 2 2.2Other 9 9.9
Source Serotype n % Source Serotype n %
Dublin 4 30.8 Montevideo 84 30.0Cerro 2 15.4 Dublin 30 10.7Agona 1 7.7 Anatum 18 6.4Anatum 1 7.7 Typhimurium 16 5.7Infantis 1 7.7 Cerro 14 5.0Kentucky 1 7.7 Muenchen 13 4.6Montevideo 1 7.7 Kentucky 12 4.3Newport 1 7.7 Meleagridis 12 4.3Typhimurium 1 7.7 Muenster 7 2.5
Mbandaka 5 1.8Newport 5 1.8Other 64 22.9
Source Serotype n % Source Serotype n %
Typhimurium 6 50.0Derby 1 8.3Heidelberg 1 8.3Infantis 1 8.3Kentucky 1 8.3London 1 8.3Reading 1 8.3
Table 8. Top Serotypes among Non-Typhoidal Salmonella Isolates, 2012
1 In 2012 and 2013, FSIS did not sample pork products for Salmonella because in prior years the percent of pork carcass samples positive for Salmonella was consistently low
Chickens
Turkeys
Cattle
Swine
Humans (N=2233)
Retail Chickens (N=229)
HACCP (N=864)
HACCP (N=175)
HACCP (N=280)
HACCP1
(N=0)
Retail Ground Turkey (N=91)
Retail Ground Beef (N=13)
Retail Pork Chops (N=12)
7
Non-Typhoidal Salmonella Serotypes
Humans Source Serotype n % Source Serotype n % Source Serotype n % Source Serotype n %
Enteritidis 382 17.5 Typhimurium 68 32.7 Kentucky 237 45.6 Kentucky 15 27.3Typhimurium 325 14.9 Kentucky 44 21.2 Enteritidis 79 15.2 Typhimurium 15 27.3Newport 209 9.6 Heidelberg 28 13.5 Typhimurium 55 10.6 Heidelberg 9 16.4Javiana 140 6.4 Enteritidis 25 12.0 Infantis 35 6.7 Enteritidis 6 10.9I 4,[5],12:i:- 127 5.8 Schwarzengrund 11 5.3 Heidelberg 29 5.6 I 8,20:-:z6 2 3.6Infantis 76 3.5 Infantis 8 3.8 Schwarzengrund 21 4.0 Ouakam 2 3.6Heidelberg 60 2.8 I 4,[5],12:i:- 3 1.4 I 4,[5],12:i:- 21 4.0 Senftenberg 2 3.6Muenchen 59 2.7 Mbandaka 3 1.4 Other 43 8.3 Other 4 7.3Saintpaul 56 2.6 Thompson 3 1.4Montevideo 53 2.4 Worthington 3 1.4Braenderup 44 2.0 Other 12 5.8Mississippi 36 1.7Oranienburg 34 1.6Thompson 33 1.5 Source Serotype n % Source Serotype n % Source Serotype n %Agona 28 1.3Paratyphi B var. L(+) tartrate+ 28 1.3 Saintpaul 20 18.9 Hadar 12 13.8 Albany 5 17.9Anatum 20 0.9 Heidelberg 17 16.0 Reading 10 11.5 Hadar 4 14.3Bareilly 19 0.9 Hadar 14 13.2 Muenchen 8 9.2 Reading 3 10.7Poona 17 0.8 Muenchen 13 12.3 I 4,[5],12:i:- 6 6.9 Saintpaul 3 10.7Berta 16 0.7 I 4,[5],12:i:- 6 5.7 Heidelberg 6 6.9 Senftenberg 3 10.7Unknown serotype 36 1.7 Reading 5 4.7 Berta 6 6.9 Heidelberg 2 7.1Partially serotyped 13 0.6 Albany 4 3.8 Typhimurium 5 5.7 Schwarzengrund 2 7.1Rough/Nonmotile isolates 6 0.3 Agona 3 2.8 Albany 5 5.7 Typhimurium 2 7.1Other 361 16.6 Litchfield 3 2.8 Other 29 33.3 Agona 1 3.6
Schwarzengrund 3 2.8 Enteritidis 1 3.6
Other 18 17.0 Indiana 1 3.6
Kentucky 1 3.6
Source Serotype n % Source Serotype n % Source Serotype n %
Dublin 4 26.7 Montevideo 89 28.7 Montevideo 21 16.9
Montevideo 4 26.7 Typhimurium 23 7.4 Anatum 18 14.5Infantis 2 13.3 Meleagridis 22 7.1 Typhimurium 14 11.3Anatum 1 6.7 Dublin 21 6.8 Meleagridis 9 7.3
Heidelberg 1 6.7 Anatum 16 5.2 Newport 8 6.5Kentucky 1 6.7 Kentucky 14 4.5 Cerro 6 4.8
Mbandaka 1 6.7 Muenchen 13 4.2 Kentucky 6 4.8Muenster 1 6.7 Newport 13 4.2 Muenchen 4 3.2
Cerro 12 3.9 Muenster 4 3.2Infantis 7 2.2 Uganda 4 3.2Panama 7 2.2 Agona 3 2.4Other 73 23.5 Lille 3 2.4
Mbandaka 3 2.4Senftenberg 3 2.4Other 18 14.5
Cerro 92 29.7
Montevideo 56 18.1
Typhimurium 21 6.8
Anatum 18 5.8
Meleagridis 17 5.5
Muenster 16 5.2
Kentucky 15 4.8
Muenchen 9 2.9
Newport 7 2.3
Other 59 19.0
Source Serotype n % Source Serotype n % Source Serotype n %
Derby 5 20.8 Derby 38 14.6
Typhimurium 4 16.7 Anatum 33 12.7Johannesburg 3 12.5 Johannesburg 21 8.1I 4,[5],12:i:- 2 8.3 Typhimurium 21 8.1Heidelberg 2 8.3 Infantis 20 7.7
Muenchen 2 8.3 Agona 12 4.6
Saintpaul 2 8.3 Uganda 11 4.2Bredeney 1 4.2 Cerro 10 3.8Infantis 1 4.2 Muenchen 9 3.5Liverpool 1 4.2 Meleagridis 6 2.3
Ohio 1 4.2 Senftenberg 6 2.3Other 73 28.1
Anatum 43 14.9
Johannesburg 33 11.4
Infantis 27 9.3
Derby 24 8.3
Uganda 22 7.6
Muenchen 14 4.8
Meleagridis 12 4.2
Adelaide 11 3.8
Agona 11 3.8
Saintpaul 10 3.5
Cerro 8 2.8
Chailey 6 2.1
Other 68 23.5
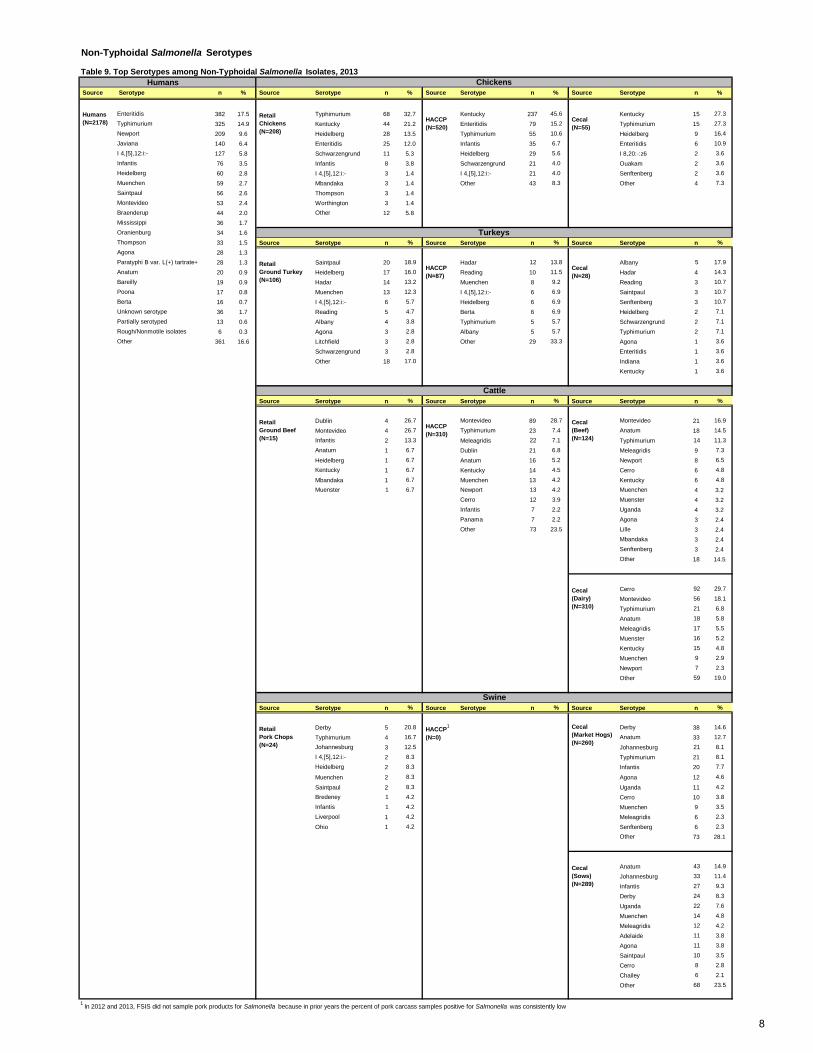
Cecal (Dairy) (N=310)
Swine
1 In 2012 and 2013, FSIS did not sample pork products for Salmonella because in prior years the percent of pork carcass samples positive for Salmonella was consistently low
Retail Pork Chops (N=24)
Cecal (Market Hogs) (N=260)
Cecal (Sows) (N=289)
HACCP1
(N=0)
Table 9. Top Serotypes among Non-Typhoidal Salmonella Isolates, 2013Chickens
Humans (N=2178)
Retail Chickens (N=208)
HACCP (N=520)
Cecal (N=55)
Retail Ground Turkey (N=106)
HACCP (N=87)
Cecal (N=28)
Retail Ground Beef (N=15)
Turkeys
Cattle
HACCP (N=310)
Cecal (Beef) (N=124)
8
Humans Swine
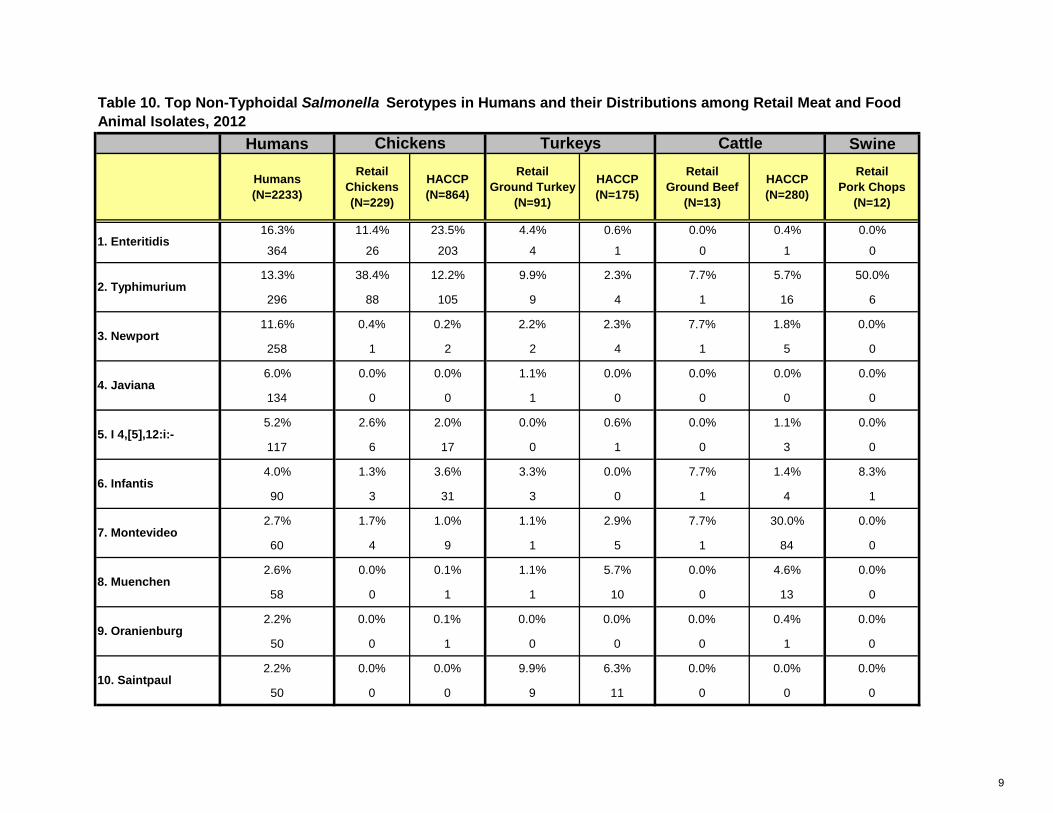
16.3% 11.4% 23.5% 4.4% 0.6% 0.0% 0.4% 0.0%
364 26 203 4 1 0 1 0
13.3% 38.4% 12.2% 9.9% 2.3% 7.7% 5.7% 50.0%
296 88 105 9 4 1 16 6
11.6% 0.4% 0.2% 2.2% 2.3% 7.7% 1.8% 0.0%
258 1 2 2 4 1 5 0
6.0% 0.0% 0.0% 1.1% 0.0% 0.0% 0.0% 0.0%
134 0 0 1 0 0 0 0
5.2% 2.6% 2.0% 0.0% 0.6% 0.0% 1.1% 0.0%
117 6 17 0 1 0 3 0
4.0% 1.3% 3.6% 3.3% 0.0% 7.7% 1.4% 8.3%
90 3 31 3 0 1 4 1
2.7% 1.7% 1.0% 1.1% 2.9% 7.7% 30.0% 0.0%
60 4 9 1 5 1 84 0
2.6% 0.0% 0.1% 1.1% 5.7% 0.0% 4.6% 0.0%
58 0 1 1 10 0 13 0
2.2% 0.0% 0.1% 0.0% 0.0% 0.0% 0.4% 0.0%
50 0 1 0 0 0 1 0
2.2% 0.0% 0.0% 9.9% 6.3% 0.0% 0.0% 0.0%
50 0 0 9 11 0 0 0
8. Muenchen
9. Oranienburg
10. Saintpaul
2. Typhimurium
3. Newport
4. Javiana
5. I 4,[5],12:i:-
6. Infantis
7. Montevideo
1. Enteritidis
Table 10. Top Non-Typhoidal Salmonella Serotypes in Humans and their Distributions among Retail Meat and Food Animal Isolates, 2012
Chickens Turkeys Cattle
Humans (N=2233)
Retail Chickens(N=229)
HACCP (N=864)
Retail Ground Turkey
(N=91)
HACCP (N=175)
Retail Ground Beef
(N=13)
HACCP (N=280)
Retail Pork Chops
(N=12)
9
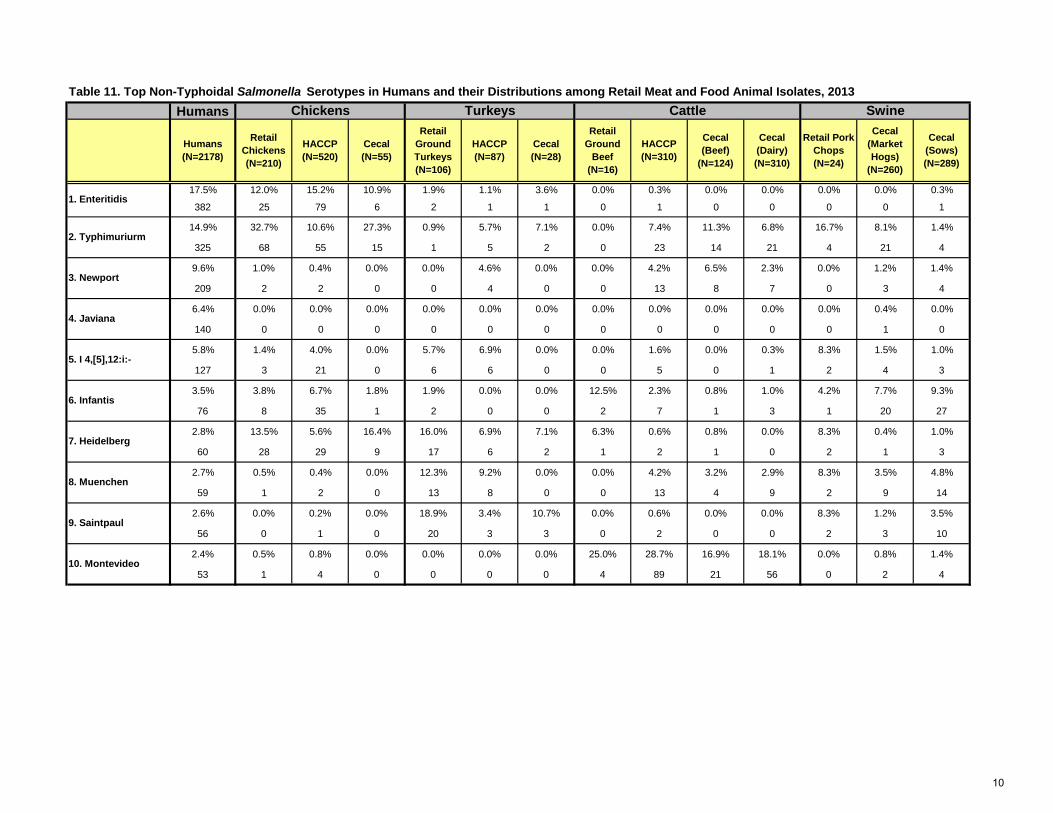
Table 11. Top Non-Typhoidal Salmonella Serotypes in Humans and their Distributions among Retail Meat and Food Animal Isolates, 2013Humans
17.5% 12.0% 15.2% 10.9% 1.9% 1.1% 3.6% 0.0% 0.3% 0.0% 0.0% 0.0% 0.0% 0.3%
382 25 79 6 2 1 1 0 1 0 0 0 0 1
14.9% 32.7% 10.6% 27.3% 0.9% 5.7% 7.1% 0.0% 7.4% 11.3% 6.8% 16.7% 8.1% 1.4%
325 68 55 15 1 5 2 0 23 14 21 4 21 4
9.6% 1.0% 0.4% 0.0% 0.0% 4.6% 0.0% 0.0% 4.2% 6.5% 2.3% 0.0% 1.2% 1.4%
209 2 2 0 0 4 0 0 13 8 7 0 3 4
6.4% 0.0% 0.0% 0.0% 0.0% 0.0% 0.0% 0.0% 0.0% 0.0% 0.0% 0.0% 0.4% 0.0%
140 0 0 0 0 0 0 0 0 0 0 0 1 0
5.8% 1.4% 4.0% 0.0% 5.7% 6.9% 0.0% 0.0% 1.6% 0.0% 0.3% 8.3% 1.5% 1.0%
127 3 21 0 6 6 0 0 5 0 1 2 4 3
3.5% 3.8% 6.7% 1.8% 1.9% 0.0% 0.0% 12.5% 2.3% 0.8% 1.0% 4.2% 7.7% 9.3%
76 8 35 1 2 0 0 2 7 1 3 1 20 27
2.8% 13.5% 5.6% 16.4% 16.0% 6.9% 7.1% 6.3% 0.6% 0.8% 0.0% 8.3% 0.4% 1.0%
60 28 29 9 17 6 2 1 2 1 0 2 1 3
2.7% 0.5% 0.4% 0.0% 12.3% 9.2% 0.0% 0.0% 4.2% 3.2% 2.9% 8.3% 3.5% 4.8%
59 1 2 0 13 8 0 0 13 4 9 2 9 14
2.6% 0.0% 0.2% 0.0% 18.9% 3.4% 10.7% 0.0% 0.6% 0.0% 0.0% 8.3% 1.2% 3.5%
56 0 1 0 20 3 3 0 2 0 0 2 3 10
2.4% 0.5% 0.8% 0.0% 0.0% 0.0% 0.0% 25.0% 28.7% 16.9% 18.1% 0.0% 0.8% 1.4%
53 1 4 0 0 0 0 4 89 21 56 0 2 4
1. Enteritidis
Retail Ground Turkeys(N=106)
HACCP(N=87)
Cecal(N=28)
Retail Ground
Beef(N=16)
Humans (N=2178)
8. Muenchen
9. Saintpaul
10. Montevideo
2. Typhimuriurm
3. Newport
4. Javiana
5. I 4,[5],12:i:-
6. Infantis
7. Heidelberg
Cecal (Beef)
(N=124)
Chickens Turkeys Cattle Swine
Retail Chickens(N=210)
HACCP(N=520)
Cecal(N=55)
Cecal (Dairy)(N=310)
Retail Pork Chops(N=24)
Cecal (Market Hogs)
(N=260)
Cecal (Sows)(N=289)
HACCP(N=310)
10
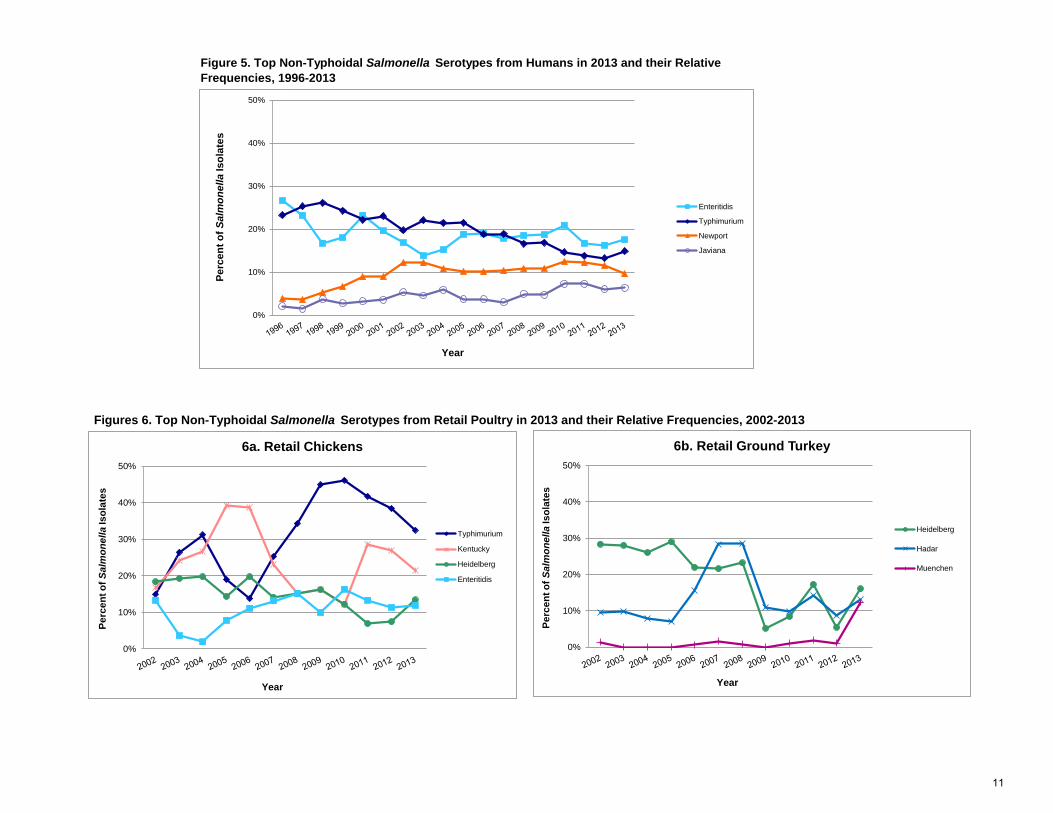
Figure 5. Top Non-Typhoidal Salmonella Serotypes from Humans in 2013 and their Relative Frequencies, 1996-2013
Figures 6. Top Non-Typhoidal Salmonella Serotypes from Retail Poultry in 2013 and their Relative Frequencies, 2002-2013
0%
10%
20%
30%
40%
50%
Perc
ent o
f Sal
mon
ella
Isol
ates
Year
Enteritidis
Typhimurium
Newport
Javiana
0%
10%
20%
30%
40%
50%
Perc
ent o
f Sal
mon
ella
Isol
ates
Year
Enteritidis
Typhimurium
Newport
Javiana
0%
10%
20%
30%
40%
50%
Perc
ent o
f Sal
mon
ella
Isol
ates
Year
6a. Retail Chickens
Typhimurium
Kentucky
Heidelberg
Enteritidis
0%
10%
20%
30%
40%
50%
Perc
ent o
f Sal
mon
ella
Isol
ates
Year
6b. Retail Ground Turkey
Heidelberg
Hadar
Muenchen
11
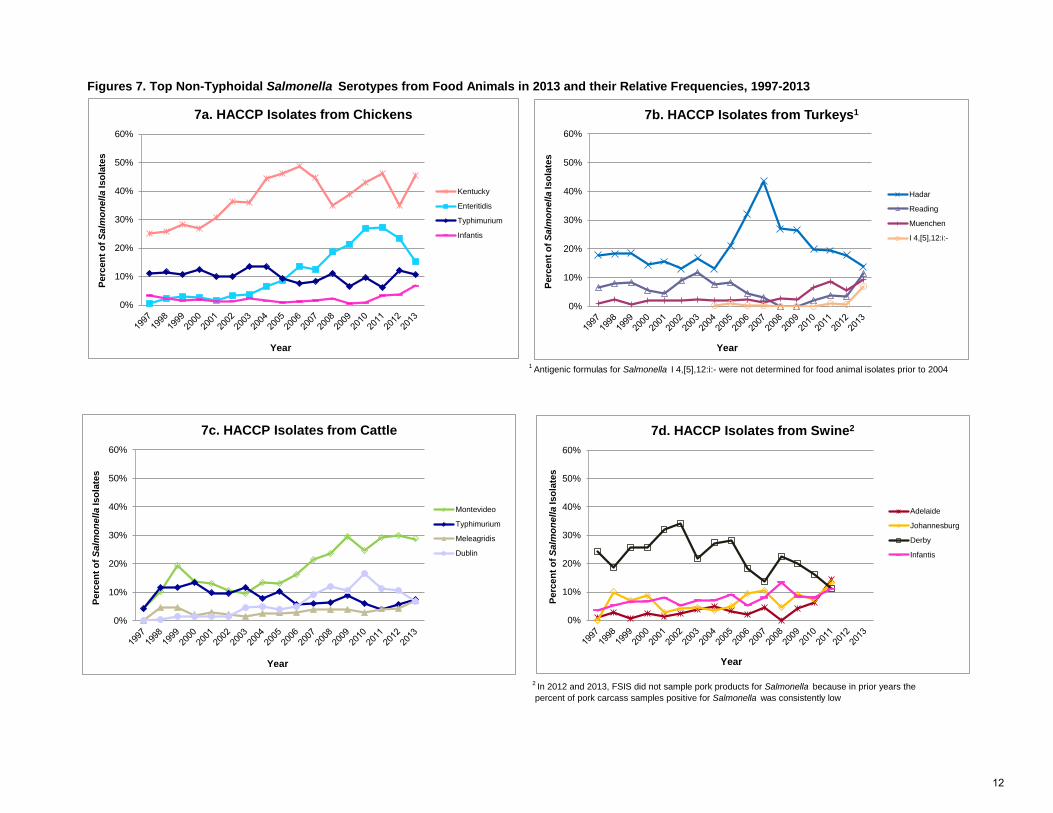
1 Antigenic formulas for Salmonella I 4,[5],12:i:- were not determined for food animal isolates prior to 2004
2 In 2012 and 2013, FSIS did not sample pork products for Salmonella because in prior years the percent of pork carcass samples positive for Salmonella was consistently low
Figures 7. Top Non-Typhoidal Salmonella Serotypes from Food Animals in 2013 and their Relative Frequencies, 1997-2013
0%
10%
20%
30%
40%
50%
60%
Perc
ent o
f Sal
mon
ella
Isol
ates
Year
7a. HACCP Isolates from Chickens
Kentucky
Enteritidis
Typhimurium
Infantis
0%
10%
20%
30%
40%
50%
60%
Perc
ent o
f Sal
mon
ella
Isol
ates
Year
7b. HACCP Isolates from Turkeys1
Hadar
Reading
Muenchen
I 4,[5],12:i:-
0%
10%
20%
30%
40%
50%
60%
Perc
ent o
f Sal
mon
ella
Isol
ates
Year
7c. HACCP Isolates from Cattle
Montevideo
Typhimurium
Meleagridis
Dublin
0%
10%
20%
30%
40%
50%
60%
Perc
ent o
f Sal
mon
ella
Isol
ates
Year
7d. HACCP Isolates from Swine2
Adelaide
Johannesburg
Derby
Infantis
12
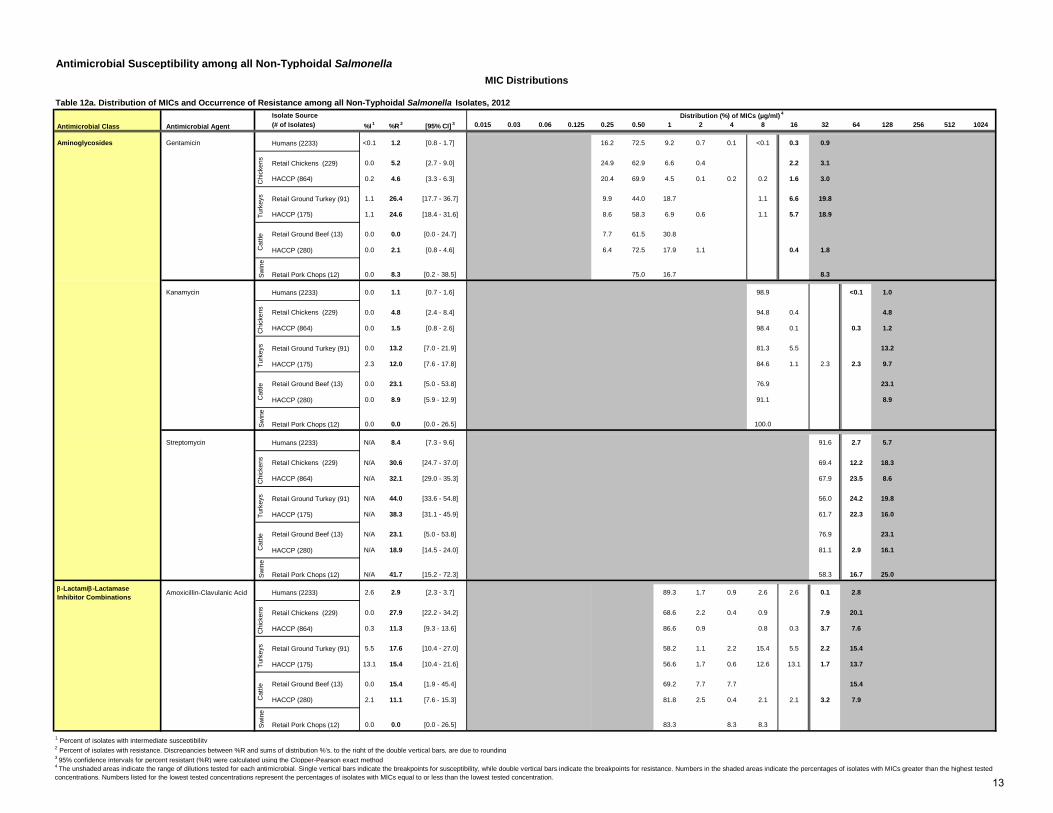
Antimicrobial Susceptibility among all Non-Typhoidal Salmonella
Table 12a. Distribution of MICs and Occurrence of Resistance among all Non-Typhoidal Salmonella Isolates, 2012 Isolate Source (# of Isolates) %I
1 %R 2 [95% CI]
3 0.015 0.03 0.06 0.125 0.25 0.50 1 2 4 8 16 32 64 128 256 512 1024
Aminoglycosides Gentamicin Humans (2233) <0.1 1.2 [0.8 - 1.7] 16.2 72.5 9.2 0.7 0.1 <0.1 0.3 0.9
Retail Chickens (229) 0.0 5.2 [2.7 - 9.0] 24.9 62.9 6.6 0.4 2.2 3.1
HACCP (864) 0.2 4.6 [3.3 - 6.3] 20.4 69.9 4.5 0.1 0.2 0.2 1.6 3.0
Retail Ground Turkey (91) 1.1 26.4 [17.7 - 36.7] 9.9 44.0 18.7 1.1 6.6 19.8
HACCP (175) 1.1 24.6 [18.4 - 31.6] 8.6 58.3 6.9 0.6 1.1 5.7 18.9
Retail Ground Beef (13) 0.0 0.0 [0.0 - 24.7] 7.7 61.5 30.8
HACCP (280) 0.0 2.1 [0.8 - 4.6] 6.4 72.5 17.9 1.1 0.4 1.8
Retail Pork Chops (12) 0.0 8.3 [0.2 - 38.5] 75.0 16.7 8.3
Kanamycin Humans (2233) 0.0 1.1 [0.7 - 1.6] 98.9 <0.1 1.0
Retail Chickens (229) 0.0 4.8 [2.4 - 8.4] 94.8 0.4 4.8
HACCP (864) 0.0 1.5 [0.8 - 2.6] 98.4 0.1 0.3 1.2
Retail Ground Turkey (91) 0.0 13.2 [7.0 - 21.9] 81.3 5.5 13.2
HACCP (175) 2.3 12.0 [7.6 - 17.8] 84.6 1.1 2.3 2.3 9.7
Retail Ground Beef (13) 0.0 23.1 [5.0 - 53.8] 76.9 23.1
HACCP (280) 0.0 8.9 [5.9 - 12.9] 91.1 8.9
Retail Pork Chops (12) 0.0 0.0 [0.0 - 26.5] 100.0
Streptomycin Humans (2233) N/A 8.4 [7.3 - 9.6] 91.6 2.7 5.7
Retail Chickens (229) N/A 30.6 [24.7 - 37.0] 69.4 12.2 18.3
HACCP (864) N/A 32.1 [29.0 - 35.3] 67.9 23.5 8.6
Retail Ground Turkey (91) N/A 44.0 [33.6 - 54.8] 56.0 24.2 19.8
HACCP (175) N/A 38.3 [31.1 - 45.9] 61.7 22.3 16.0
Retail Ground Beef (13) N/A 23.1 [5.0 - 53.8] 76.9 23.1
HACCP (280) N/A 18.9 [14.5 - 24.0] 81.1 2.9 16.1
Retail Pork Chops (12) N/A 41.7 [15.2 - 72.3] 58.3 16.7 25.0
β-Lactam/β-Lactamase Inhibitor Combinations Amoxicillin-Clavulanic Acid Humans (2233) 2.6 2.9 [2.3 - 3.7] 89.3 1.7 0.9 2.6 2.6 0.1 2.8
Retail Chickens (229) 0.0 27.9 [22.2 - 34.2] 68.6 2.2 0.4 0.9 7.9 20.1
HACCP (864) 0.3 11.3 [9.3 - 13.6] 86.6 0.9 0.8 0.3 3.7 7.6
Retail Ground Turkey (91) 5.5 17.6 [10.4 - 27.0] 58.2 1.1 2.2 15.4 5.5 2.2 15.4
HACCP (175) 13.1 15.4 [10.4 - 21.6] 56.6 1.7 0.6 12.6 13.1 1.7 13.7
Retail Ground Beef (13) 0.0 15.4 [1.9 - 45.4] 69.2 7.7 7.7 15.4
HACCP (280) 2.1 11.1 [7.6 - 15.3] 81.8 2.5 0.4 2.1 2.1 3.2 7.9
Retail Pork Chops (12) 0.0 0.0 [0.0 - 26.5] 83.3 8.3 8.3
1 Percent of isolates with intermediate susceptibility 2 Percent of isolates with resistance. Discrepancies between %R and sums of distribution %'s, to the right of the double vertical bars, are due to rounding3 95% confidence intervals for percent resistant (%R) were calculated using the Clopper-Pearson exact method
Chi
cken
sTu
rkey
sC
attle
4 The unshaded areas indicate the range of dilutions tested for each antimicrobial. Single vertical bars indicate the breakpoints for susceptibility, while double vertical bars indicate the breakpoints for resistance. Numbers in the shaded areas indicate the percentages of isolates with MICs greater than the highest tested concentrations. Numbers listed for the lowest tested concentrations represent the percentages of isolates with MICs equal to or less than the lowest tested concentration.
Sw
ine
Cat
tleC
hick
ens
Turk
eys
Cat
tleS
win
eC
hick
ens
Turk
eys
Cat
tleS
win
eS
win
eTu
rkey
s
MIC Distributions
Distribution (%) of MICs (µg/ml) 4
Chi
cken
s
Antimicrobial Class Antimicrobial Agent
13
Isolate Source (# of Isolates) %I
1 %R 2 [95% CI]
3 0.015 0.03 0.06 0.125 0.25 0.50 1 2 4 8 16 32 64 128 256 512 1024
Cephems Cefoxitin Humans (2233) 0.3 2.7 [2.1 - 3.5] 0.1 17.7 62.5 15.0 1.7 0.3 0.9 1.8
Retail Chickens (229) 4.4 22.7 [17.4 - 28.7] 3.5 56.8 11.4 1.3 4.4 14.0 8.7
HACCP (864) 2.1 8.6 [6.8 - 10.6] 15.9 54.9 16.9 1.7 2.1 5.8 2.8
Retail Ground Turkey (91) 1.1 15.4 [8.7 - 24.5] 1.1 58.2 22.0 2.2 1.1 1.1 14.3
HACCP (175) 1.7 14.9 [9.9 - 21.0] 0.6 8.0 52.6 20.6 1.7 1.7 4.6 10.3
Retail Ground Beef (13) 0.0 15.4 [1.9 - 45.4] 30.8 38.5 15.4 15.4
HACCP (280) 0.4 10.4 [7.0 - 14.5] 7.5 48.6 30.0 3.2 0.4 3.2 7.1
Retail Pork Chops (12) 0.0 0.0 [0.0 - 26.5] 75.0 25.0
Ceftiofur Humans (2233) 0.1 2.9 [2.2 - 3.6] 0.3 0.6 23.6 70.8 1.7 0.1 0.1 2.7
Retail Chickens (229) 0.4 27.5 [21.8 - 33.8] 37.1 34.1 0.9 0.4 10.5 17.0
HACCP (864) 0.0 10.2 [8.2 - 12.4]
Retail Ground Turkey (91) 1.1 16.5 [9.5 - 25.7] 29.7 49.5 3.3 1.1 1.1 15.4
HACCP (175) 0.6 14.9 [9.9 - 21.0] 33.7 47.4 3.4 0.6 14.9
Retail Ground Beef (13) 0.0 15.4 [1.9 - 45.4] 15.4 61.5 7.7 15.4
HACCP (280) 0.0 11.1 [7.6 - 15.3] 0.7 37.5 49.6 1.1 2.9 8.2
Retail Pork Chops (12) 0.0 0.0 [0.0 - 26.5] 41.7 58.3
Ceftriaxone Humans (2233) <0.1 2.9 [2.2 - 3.6] 97.0 <0.1 <0.1 <0.1 0.2 1.0 1.2 0.3 0.1
Retail Chickens (229) 0.0 27.9 [22.2 - 34.2] 71.6 0.4 1.3 9.6 13.1 3.5 0.4
HACCP (864) 0.2 11.2 [9.2 - 13.5] 88.1 0.5 0.2 1.5 2.5 5.7 0.9 0.6
Retail Ground Turkey (91) 0.0 17.6 [10.4 - 27.0] 82.4 1.1 1.1 4.4 8.8 2.2
HACCP (175) 0.0 16.0 [10.9 - 22.3] 82.9 0.6 0.6 0.6 1.7 4.6 9.1
Retail Ground Beef (13) 0.0 15.4 [1.9 - 45.4] 84.6 15.4
HACCP (280) 0.4 10.7 [7.3 - 14.9] 88.2 0.4 0.4 0.4 0.7 1.1 4.6 3.9 0.4
Retail Pork Chops (12) 0.0 0.0 [0.0 - 26.5] 100.0
Folate Pathway Inhibitors Sulfisoxazole5 Humans (2233) N/A 8.4 [7.3 - 9.6] 8.8 50.4 31.6 0.7 0.1 8.4
Retail Chickens (229) N/A 37.1 [30.8 - 43.7] 30.6 22.3 10.0 37.1
HACCP (864) N/A 14.4 [12.1 - 16.9] 17.0 54.6 13.5 0.2 0.2 14.4
Retail Ground Turkey (91) N/A 27.5 [18.6 - 37.8] 31.9 26.4 14.3 27.5
HACCP (175) N/A 22.3 [16.4 - 29.2] 18.9 49.7 8.6 0.6 22.3
Retail Ground Beef (13) N/A 23.1 [5.0 - 53.8] 30.8 23.1 23.1 23.1
HACCP (280) N/A 19.6 [15.2 - 24.8] 16.8 48.2 13.2 1.8 0.4 19.6
Retail Pork Chops (12) N/A 33.3 [9.9 - 65.1] 25.0 33.3 8.3 33.3
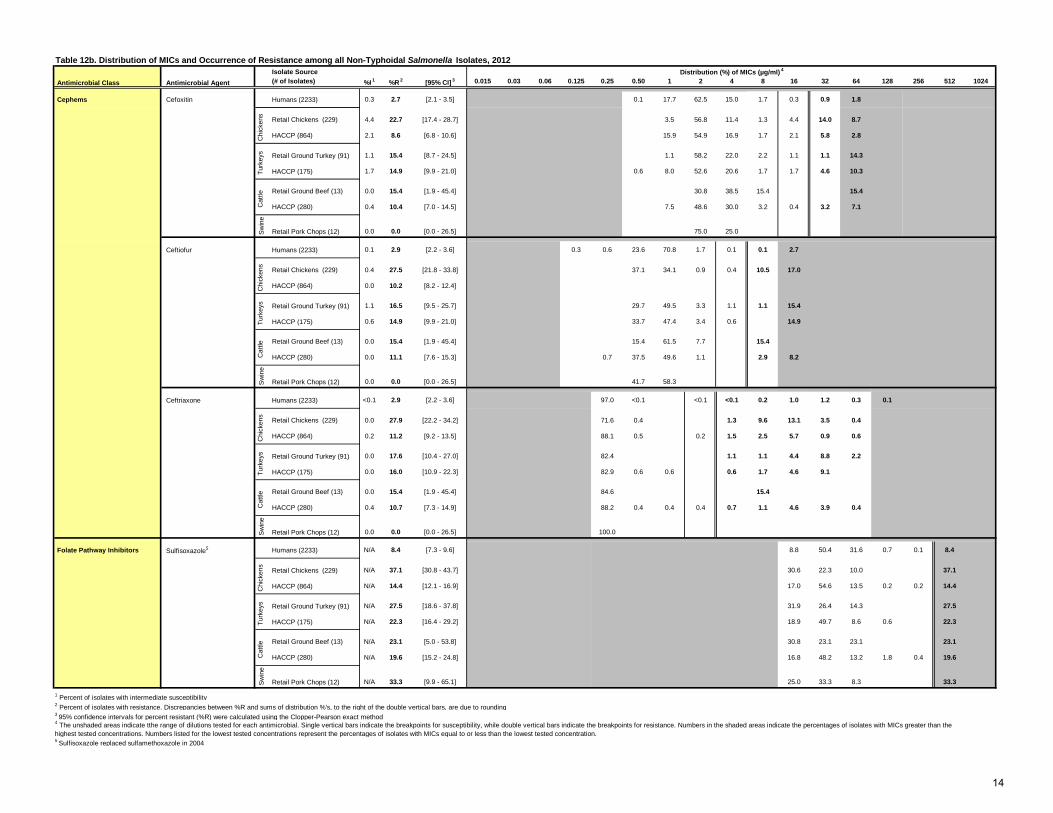
1 Percent of isolates with intermediate susceptibility 2 Percent of isolates with resistance. Discrepancies between %R and sums of distribution %'s, to the right of the double vertical bars, are due to rounding3 95% confidence intervals for percent resistant (%R) were calculated using the Clopper-Pearson exact method
5 Sulfisoxazole replaced sulfamethoxazole in 2004
Cat
tle
4 The unshaded areas indicate tthe range of dilutions tested for each antimicrobial. Single vertical bars indicate the breakpoints for susceptibility, while double vertical bars indicate the breakpoints for resistance. Numbers in the shaded areas indicate the percentages of isolates with MICs greater than the highest tested concentrations. Numbers listed for the lowest tested concentrations represent the percentages of isolates with MICs equal to or less than the lowest tested concentration.
Sw
ine
Turk
eys
Cat
tleC
hick
ens
Turk
eys
Cat
tleC
hick
ens
Sw
ine
Sw
ine
Turk
eys
Distribution (%) of MICs (µg/ml) 4
Chi
cken
sTu
rkey
sC
attle
Chi
cken
s
Table 12b. Distribution of MICs and Occurrence of Resistance among all Non-Typhoidal Salmonella Isolates, 2012
Sw
ine
Antimicrobial Class Antimicrobial Agent
14
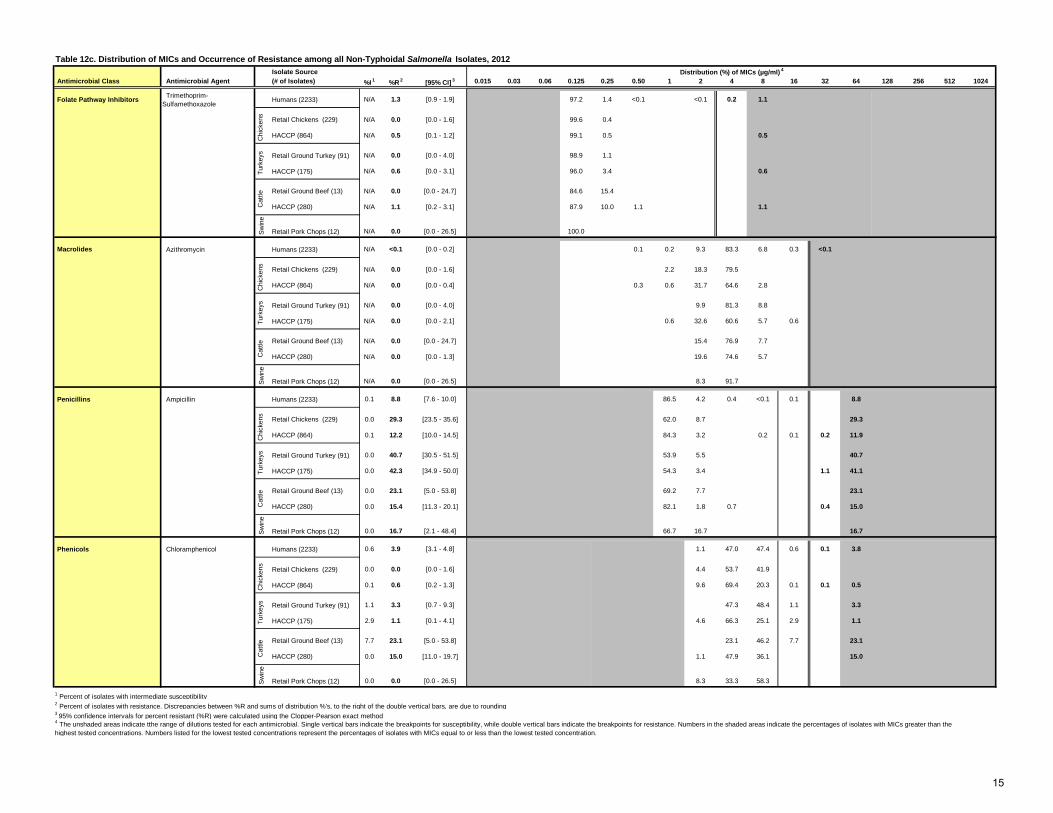
Table 12c. Distribution of MICs and Occurrence of Resistance among all Non-Typhoidal Salmonella Isolates, 2012 Isolate Source
Antimicrobial Class Antimicrobial Agent (# of Isolates) %I 1 %R
2 [95% CI] 3 0.015 0.03 0.06 0.125 0.25 0.50 1 2 4 8 16 32 64 128 256 512 1024
Folate Pathway Inhibitors Trimethoprim-Sulfamethoxazole
Humans (2233) N/A 1.3 [0.9 - 1.9] 97.2 1.4 <0.1 <0.1 0.2 1.1
Retail Chickens (229) N/A 0.0 [0.0 - 1.6] 99.6 0.4
HACCP (864) N/A 0.5 [0.1 - 1.2] 99.1 0.5 0.5
Retail Ground Turkey (91) N/A 0.0 [0.0 - 4.0] 98.9 1.1
HACCP (175) N/A 0.6 [0.0 - 3.1] 96.0 3.4 0.6
Retail Ground Beef (13) N/A 0.0 [0.0 - 24.7] 84.6 15.4
HACCP (280) N/A 1.1 [0.2 - 3.1] 87.9 10.0 1.1 1.1
Retail Pork Chops (12) N/A 0.0 [0.0 - 26.5] 100.0
Macrolides Azithromycin Humans (2233) N/A <0.1 [0.0 - 0.2] 0.1 0.2 9.3 83.3 6.8 0.3 <0.1
Retail Chickens (229) N/A 0.0 [0.0 - 1.6] 2.2 18.3 79.5
HACCP (864) N/A 0.0 [0.0 - 0.4] 0.3 0.6 31.7 64.6 2.8
Retail Ground Turkey (91) N/A 0.0 [0.0 - 4.0] 9.9 81.3 8.8
HACCP (175) N/A 0.0 [0.0 - 2.1] 0.6 32.6 60.6 5.7 0.6
Retail Ground Beef (13) N/A 0.0 [0.0 - 24.7] 15.4 76.9 7.7
HACCP (280) N/A 0.0 [0.0 - 1.3] 19.6 74.6 5.7
Retail Pork Chops (12) N/A 0.0 [0.0 - 26.5] 8.3 91.7
Penicillins Ampicillin Humans (2233) 0.1 8.8 [7.6 - 10.0] 86.5 4.2 0.4 <0.1 0.1 8.8
Retail Chickens (229) 0.0 29.3 [23.5 - 35.6] 62.0 8.7 29.3
HACCP (864) 0.1 12.2 [10.0 - 14.5] 84.3 3.2 0.2 0.1 0.2 11.9
Retail Ground Turkey (91) 0.0 40.7 [30.5 - 51.5] 53.9 5.5 40.7
HACCP (175) 0.0 42.3 [34.9 - 50.0] 54.3 3.4 1.1 41.1
Retail Ground Beef (13) 0.0 23.1 [5.0 - 53.8] 69.2 7.7 23.1
HACCP (280) 0.0 15.4 [11.3 - 20.1] 82.1 1.8 0.7 0.4 15.0
Retail Pork Chops (12) 0.0 16.7 [2.1 - 48.4] 66.7 16.7 16.7
Phenicols Chloramphenicol Humans (2233) 0.6 3.9 [3.1 - 4.8] 1.1 47.0 47.4 0.6 0.1 3.8
Retail Chickens (229) 0.0 0.0 [0.0 - 1.6] 4.4 53.7 41.9
HACCP (864) 0.1 0.6 [0.2 - 1.3] 9.6 69.4 20.3 0.1 0.1 0.5
Retail Ground Turkey (91) 1.1 3.3 [0.7 - 9.3] 47.3 48.4 1.1 3.3
HACCP (175) 2.9 1.1 [0.1 - 4.1] 4.6 66.3 25.1 2.9 1.1
Retail Ground Beef (13) 7.7 23.1 [5.0 - 53.8] 23.1 46.2 7.7 23.1
HACCP (280) 0.0 15.0 [11.0 - 19.7] 1.1 47.9 36.1 15.0
Retail Pork Chops (12) 0.0 0.0 [0.0 - 26.5] 8.3 33.3 58.3
1 Percent of isolates with intermediate susceptibility 2 Percent of isolates with resistance. Discrepancies between %R and sums of distribution %'s, to the right of the double vertical bars, are due to rounding3 95% confidence intervals for percent resistant (%R) were calculated using the Clopper-Pearson exact method
Chi
cken
sTu
rkey
sC
attle
Chi
cken
s
Distribution (%) of MICs (µg/ml) 4
Sw
ine
Turk
eys
Cat
tleTu
rkey
sC
attle
Chi
cken
sC
attle
4 The unshaded areas indicate tthe range of dilutions tested for each antimicrobial. Single vertical bars indicate the breakpoints for susceptibility, while double vertical bars indicate the breakpoints for resistance. Numbers in the shaded areas indicate the percentages of isolates with MICs greater than the highest tested concentrations. Numbers listed for the lowest tested concentrations represent the percentages of isolates with MICs equal to or less than the lowest tested concentration.
Chi
cken
sTu
rkey
sS
win
eS
win
eS
win
e
15
Isolate Source Antimicrobial Class Antimicrobial Agent (# of Isolates) %I
1 %R 2 [95% CI]
3 0.015 0.03 0.06 0.125 0.25 0.50 1 2 4 8 16 32 64 128 256 512 1024
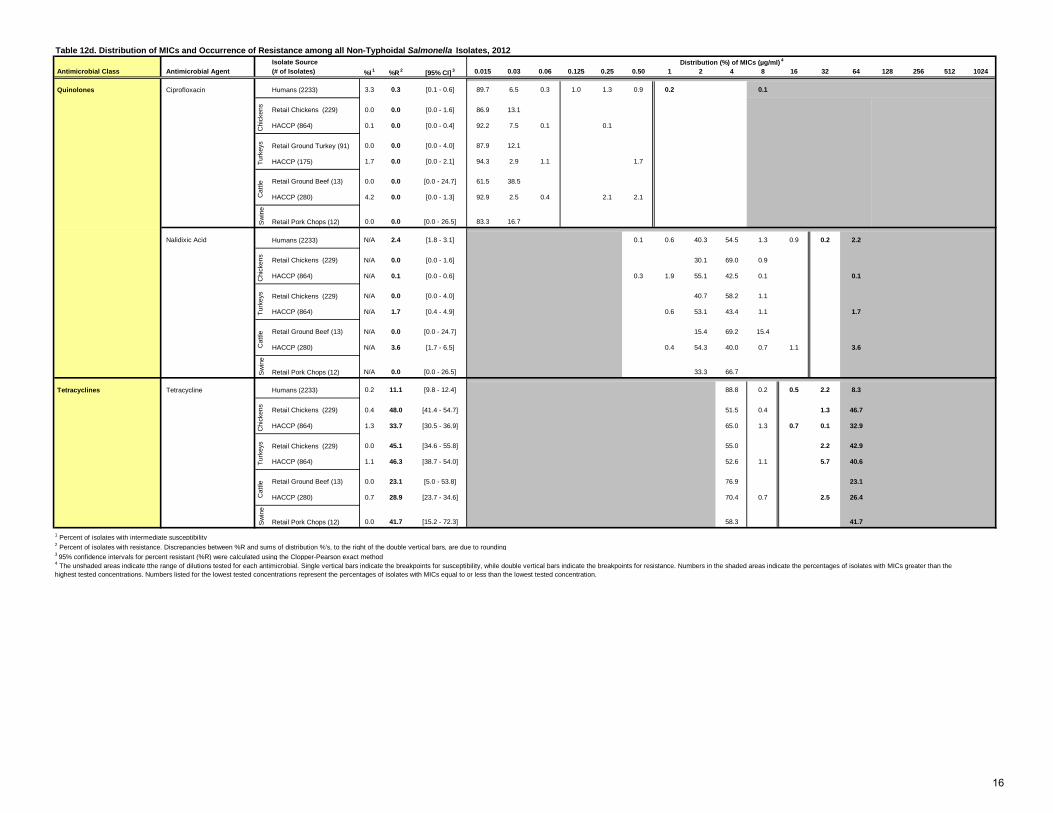
Quinolones Ciprofloxacin Humans (2233) 3.3 0.3 [0.1 - 0.6] 89.7 6.5 0.3 1.0 1.3 0.9 0.2 0.1
Retail Chickens (229) 0.0 0.0 [0.0 - 1.6] 86.9 13.1
HACCP (864) 0.1 0.0 [0.0 - 0.4] 92.2 7.5 0.1 0.1
Retail Ground Turkey (91) 0.0 0.0 [0.0 - 4.0] 87.9 12.1
HACCP (175) 1.7 0.0 [0.0 - 2.1] 94.3 2.9 1.1 1.7
Retail Ground Beef (13) 0.0 0.0 [0.0 - 24.7] 61.5 38.5
HACCP (280) 4.2 0.0 [0.0 - 1.3] 92.9 2.5 0.4 2.1 2.1
Retail Pork Chops (12) 0.0 0.0 [0.0 - 26.5] 83.3 16.7
Nalidixic Acid Humans (2233) N/A 2.4 [1.8 - 3.1] 0.1 0.6 40.3 54.5 1.3 0.9 0.2 2.2
Retail Chickens (229) N/A 0.0 [0.0 - 1.6] 30.1 69.0 0.9
HACCP (864) N/A 0.1 [0.0 - 0.6] 0.3 1.9 55.1 42.5 0.1 0.1
Retail Chickens (229) N/A 0.0 [0.0 - 4.0] 40.7 58.2 1.1
HACCP (864) N/A 1.7 [0.4 - 4.9] 0.6 53.1 43.4 1.1 1.7
Retail Ground Beef (13) N/A 0.0 [0.0 - 24.7] 15.4 69.2 15.4
HACCP (280) N/A 3.6 [1.7 - 6.5] 0.4 54.3 40.0 0.7 1.1 3.6
Retail Pork Chops (12) N/A 0.0 [0.0 - 26.5] 33.3 66.7
Tetracyclines Tetracycline Humans (2233) 0.2 11.1 [9.8 - 12.4] 88.8 0.2 0.5 2.2 8.3
Retail Chickens (229) 0.4 48.0 [41.4 - 54.7] 51.5 0.4 1.3 46.7
HACCP (864) 1.3 33.7 [30.5 - 36.9] 65.0 1.3 0.7 0.1 32.9
Retail Chickens (229) 0.0 45.1 [34.6 - 55.8] 55.0 2.2 42.9
HACCP (864) 1.1 46.3 [38.7 - 54.0] 52.6 1.1 5.7 40.6
Retail Ground Beef (13) 0.0 23.1 [5.0 - 53.8] 76.9 23.1
HACCP (280) 0.7 28.9 [23.7 - 34.6] 70.4 0.7 2.5 26.4
Retail Pork Chops (12) 0.0 41.7 [15.2 - 72.3] 58.3 41.7
1 Percent of isolates with intermediate susceptibility 2 Percent of isolates with resistance. Discrepancies between %R and sums of distribution %'s, to the right of the double vertical bars, are due to rounding3 95% confidence intervals for percent resistant (%R) were calculated using the Clopper-Pearson exact method
Chi
cken
sC
attle
4 The unshaded areas indicate tthe range of dilutions tested for each antimicrobial. Single vertical bars indicate the breakpoints for susceptibility, while double vertical bars indicate the breakpoints for resistance. Numbers in the shaded areas indicate the percentages of isolates with MICs greater than the highest tested concentrations. Numbers listed for the lowest tested concentrations represent the percentages of isolates with MICs equal to or less than the lowest tested concentration.
Sw
ine
Turk
eys
Cat
tleS
win
eC
hick
ens
Turk
eys
Sw
ine
Table 12d. Distribution of MICs and Occurrence of Resistance among all Non-Typhoidal Salmonella Isolates, 2012 Distribution (%) of MICs (µg/ml)
4
Chi
cken
sTu
rkey
sC
attle
16
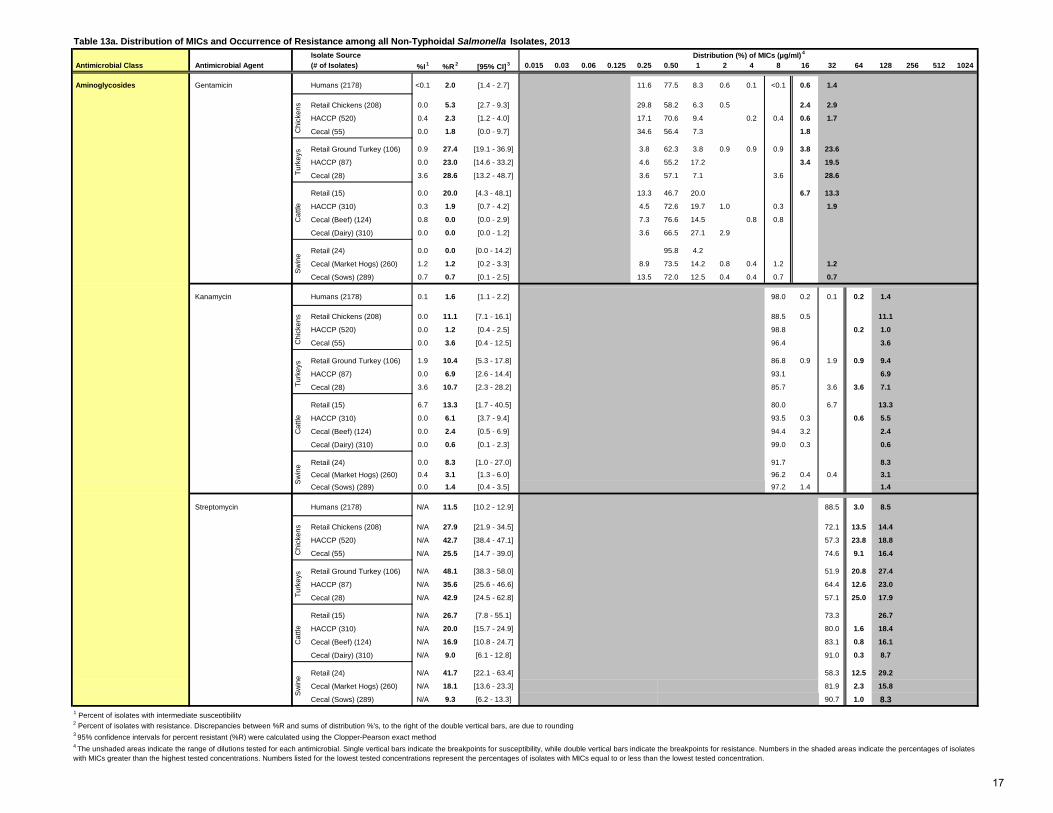
Table 13a. Distribution of MICs and Occurrence of Resistance among all Non-Typhoidal Salmonella Isolates, 2013 Isolate Source
Antimicrobial Class Antimicrobial Agent (# of Isolates) %I 1 %R
2 [95% CI] 3 0.015 0.03 0.06 0.125 0.25 0.50 1 2 4 8 16 32 64 128 256 512 1024
Aminoglycosides Gentamicin Humans (2178) <0.1 2.0 [1.4 - 2.7] 11.6 77.5 8.3 0.6 0.1 <0.1 0.6 1.4
Retail Chickens (208) 0.0 5.3 [2.7 - 9.3] 29.8 58.2 6.3 0.5 2.4 2.9
HACCP (520) 0.4 2.3 [1.2 - 4.0] 17.1 70.6 9.4 0.2 0.4 0.6 1.7
Cecal (55) 0.0 1.8 [0.0 - 9.7] 34.6 56.4 7.3 1.8
Retail Ground Turkey (106) 0.9 27.4 [19.1 - 36.9] 3.8 62.3 3.8 0.9 0.9 0.9 3.8 23.6
HACCP (87) 0.0 23.0 [14.6 - 33.2] 4.6 55.2 17.2 3.4 19.5
Cecal (28) 3.6 28.6 [13.2 - 48.7] 3.6 57.1 7.1 3.6 28.6
Retail (15) 0.0 20.0 [4.3 - 48.1] 13.3 46.7 20.0 6.7 13.3
HACCP (310) 0.3 1.9 [0.7 - 4.2] 4.5 72.6 19.7 1.0 0.3 1.9
Cecal (Beef) (124) 0.8 0.0 [0.0 - 2.9] 7.3 76.6 14.5 0.8 0.8
Cecal (Dairy) (310) 0.0 0.0 [0.0 - 1.2] 3.6 66.5 27.1 2.9
Retail (24) 0.0 0.0 [0.0 - 14.2] 95.8 4.2
Cecal (Market Hogs) (260) 1.2 1.2 [0.2 - 3.3] 8.9 73.5 14.2 0.8 0.4 1.2 1.2
Cecal (Sows) (289) 0.7 0.7 [0.1 - 2.5] 13.5 72.0 12.5 0.4 0.4 0.7 0.7
Kanamycin Humans (2178) 0.1 1.6 [1.1 - 2.2] 98.0 0.2 0.1 0.2 1.4
Retail Chickens (208) 0.0 11.1 [7.1 - 16.1] 88.5 0.5 11.1
HACCP (520) 0.0 1.2 [0.4 - 2.5] 98.8 0.2 1.0
Cecal (55) 0.0 3.6 [0.4 - 12.5] 96.4 3.6
Retail Ground Turkey (106) 1.9 10.4 [5.3 - 17.8] 86.8 0.9 1.9 0.9 9.4
HACCP (87) 0.0 6.9 [2.6 - 14.4] 93.1 6.9
Cecal (28) 3.6 10.7 [2.3 - 28.2] 85.7 3.6 3.6 7.1
Retail (15) 6.7 13.3 [1.7 - 40.5] 80.0 6.7 13.3
HACCP (310) 0.0 6.1 [3.7 - 9.4] 93.5 0.3 0.6 5.5
Cecal (Beef) (124) 0.0 2.4 [0.5 - 6.9] 94.4 3.2 2.4
Cecal (Dairy) (310) 0.0 0.6 [0.1 - 2.3] 99.0 0.3 0.6
Retail (24) 0.0 8.3 [1.0 - 27.0] 91.7 8.3 Cecal (Market Hogs) (260) 0.4 3.1 [1.3 - 6.0] 96.2 0.4 0.4 3.1 Cecal (Sows) (289) 0.0 1.4 [0.4 - 3.5] 97.2 1.4 1.4
Streptomycin Humans (2178) N/A 11.5 [10.2 - 12.9] 88.5 3.0 8.5
Retail Chickens (208) N/A 27.9 [21.9 - 34.5] 72.1 13.5 14.4
HACCP (520) N/A 42.7 [38.4 - 47.1] 57.3 23.8 18.8
Cecal (55) N/A 25.5 [14.7 - 39.0] 74.6 9.1 16.4
Retail Ground Turkey (106) N/A 48.1 [38.3 - 58.0] 51.9 20.8 27.4
HACCP (87) N/A 35.6 [25.6 - 46.6] 64.4 12.6 23.0
Cecal (28) N/A 42.9 [24.5 - 62.8] 57.1 25.0 17.9
Retail (15) N/A 26.7 [7.8 - 55.1] 73.3 26.7
HACCP (310) N/A 20.0 [15.7 - 24.9] 80.0 1.6 18.4
Cecal (Beef) (124) N/A 16.9 [10.8 - 24.7] 83.1 0.8 16.1
Cecal (Dairy) (310) N/A 9.0 [6.1 - 12.8] 91.0 0.3 8.7
Retail (24) N/A 41.7 [22.1 - 63.4] 58.3 12.5 29.2
Cecal (Market Hogs) (260) N/A 18.1 [13.6 - 23.3] 81.9 2.3 15.8
Cecal (Sows) (289) N/A 9.3 [6.2 - 13.3] 90.7 1.0 8.31 Percent of isolates with intermediate susceptibility 2 Percent of isolates with resistance. Discrepancies between %R and sums of distribution %'s, to the right of the double vertical bars, are due to rounding3 95% confidence intervals for percent resistant (%R) were calculated using the Clopper-Pearson exact method
Sw
ine
4 The unshaded areas indicate the range of dilutions tested for each antimicrobial. Single vertical bars indicate the breakpoints for susceptibility, while double vertical bars indicate the breakpoints for resistance. Numbers in the shaded areas indicate the percentages of isolates with MICs greater than the highest tested concentrations. Numbers listed for the lowest tested concentrations represent the percentages of isolates with MICs equal to or less than the lowest tested concentration.
Turk
eys
Distribution (%) of MICs (µg/ml) 4
Chi
cken
sC
attle
Sw
ine
Chi
cken
sTu
rkey
sC
attle
Sw
ine
Chi
cken
sTu
rkey
sC
attle
17
Isolate Source Antimicrobial Class Antimicrobial Agent (# of Isolates) %I
1 %R 2 [95% CI]
3 0.015 0.03 0.06 0.125 0.25 0.50 1 2 4 8 16 32 64 128 256 512 1024
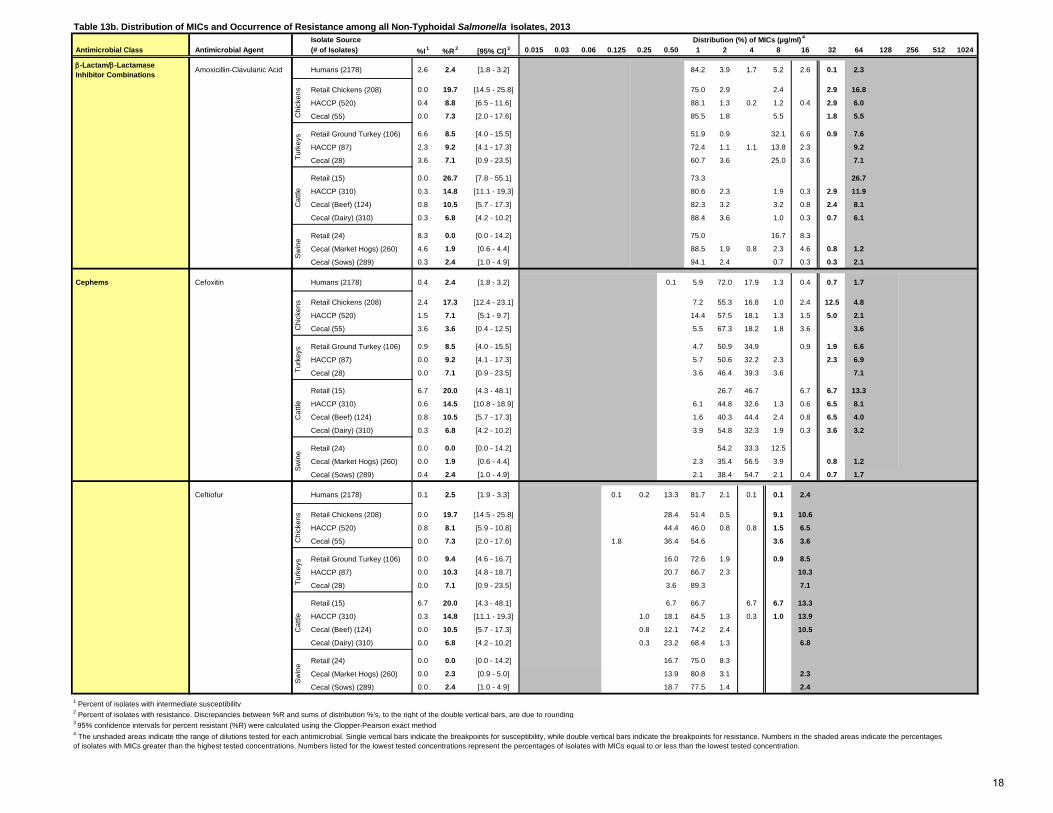
β-Lactam/β-Lactamase Inhibitor Combinations Amoxicillin-Clavulanic Acid Humans (2178) 2.6 2.4 [1.8 - 3.2] 84.2 3.9 1.7 5.2 2.6 0.1 2.3
Retail Chickens (208) 0.0 19.7 [14.5 - 25.8] 75.0 2.9 2.4 2.9 16.8
HACCP (520) 0.4 8.8 [6.5 - 11.6] 88.1 1.3 0.2 1.2 0.4 2.9 6.0
Cecal (55) 0.0 7.3 [2.0 - 17.6] 85.5 1.8 5.5 1.8 5.5
Retail Ground Turkey (106) 6.6 8.5 [4.0 - 15.5] 51.9 0.9 32.1 6.6 0.9 7.6
HACCP (87) 2.3 9.2 [4.1 - 17.3] 72.4 1.1 1.1 13.8 2.3 9.2
Cecal (28) 3.6 7.1 [0.9 - 23.5] 60.7 3.6 25.0 3.6 7.1
Retail (15) 0.0 26.7 [7.8 - 55.1] 73.3 26.7
HACCP (310) 0.3 14.8 [11.1 - 19.3] 80.6 2.3 1.9 0.3 2.9 11.9
Cecal (Beef) (124) 0.8 10.5 [5.7 - 17.3] 82.3 3.2 3.2 0.8 2.4 8.1
Cecal (Dairy) (310) 0.3 6.8 [4.2 - 10.2] 88.4 3.6 1.0 0.3 0.7 6.1
Retail (24) 8.3 0.0 [0.0 - 14.2] 75.0 16.7 8.3
Cecal (Market Hogs) (260) 4.6 1.9 [0.6 - 4.4] 88.5 1.9 0.8 2.3 4.6 0.8 1.2
Cecal (Sows) (289) 0.3 2.4 [1.0 - 4.9] 94.1 2.4 0.7 0.3 0.3 2.1
Cephems Cefoxitin Humans (2178) 0.4 2.4 [1.8 - 3.2] 0.1 5.9 72.0 17.9 1.3 0.4 0.7 1.7
Retail Chickens (208) 2.4 17.3 [12.4 - 23.1] 7.2 55.3 16.8 1.0 2.4 12.5 4.8
HACCP (520) 1.5 7.1 [5.1 - 9.7] 14.4 57.5 18.1 1.3 1.5 5.0 2.1
Cecal (55) 3.6 3.6 [0.4 - 12.5] 5.5 67.3 18.2 1.8 3.6 3.6
Retail Ground Turkey (106) 0.9 8.5 [4.0 - 15.5] 4.7 50.9 34.9 0.9 1.9 6.6
HACCP (87) 0.0 9.2 [4.1 - 17.3] 5.7 50.6 32.2 2.3 2.3 6.9
Cecal (28) 0.0 7.1 [0.9 - 23.5] 3.6 46.4 39.3 3.6 7.1
Retail (15) 6.7 20.0 [4.3 - 48.1] 26.7 46.7 6.7 6.7 13.3
HACCP (310) 0.6 14.5 [10.8 - 18.9] 6.1 44.8 32.6 1.3 0.6 6.5 8.1
Cecal (Beef) (124) 0.8 10.5 [5.7 - 17.3] 1.6 40.3 44.4 2.4 0.8 6.5 4.0
Cecal (Dairy) (310) 0.3 6.8 [4.2 - 10.2] 3.9 54.8 32.3 1.9 0.3 3.6 3.2
Retail (24) 0.0 0.0 [0.0 - 14.2] 54.2 33.3 12.5
Cecal (Market Hogs) (260) 0.0 1.9 [0.6 - 4.4] 2.3 35.4 56.5 3.9 0.8 1.2
Cecal (Sows) (289) 0.4 2.4 [1.0 - 4.9] 2.1 38.4 54.7 2.1 0.4 0.7 1.7
Ceftiofur Humans (2178) 0.1 2.5 [1.9 - 3.3] 0.1 0.2 13.3 81.7 2.1 0.1 0.1 2.4
Retail Chickens (208) 0.0 19.7 [14.5 - 25.8] 28.4 51.4 0.5 9.1 10.6
HACCP (520) 0.8 8.1 [5.9 - 10.8] 44.4 46.0 0.8 0.8 1.5 6.5
Cecal (55) 0.0 7.3 [2.0 - 17.6] 1.8 36.4 54.6 3.6 3.6
Retail Ground Turkey (106) 0.0 9.4 [4.6 - 16.7] 16.0 72.6 1.9 0.9 8.5
HACCP (87) 0.0 10.3 [4.8 - 18.7] 20.7 66.7 2.3 10.3
Cecal (28) 0.0 7.1 [0.9 - 23.5] 3.6 89.3 7.1
Retail (15) 6.7 20.0 [4.3 - 48.1] 6.7 66.7 6.7 6.7 13.3
HACCP (310) 0.3 14.8 [11.1 - 19.3] 1.0 18.1 64.5 1.3 0.3 1.0 13.9
Cecal (Beef) (124) 0.0 10.5 [5.7 - 17.3] 0.8 12.1 74.2 2.4 10.5
Cecal (Dairy) (310) 0.0 6.8 [4.2 - 10.2] 0.3 23.2 68.4 1.3 6.8
Retail (24) 0.0 0.0 [0.0 - 14.2] 16.7 75.0 8.3
Cecal (Market Hogs) (260) 0.0 2.3 [0.9 - 5.0] 13.9 80.8 3.1 2.3
Cecal (Sows) (289) 0.0 2.4 [1.0 - 4.9] 18.7 77.5 1.4 2.4
1 Percent of isolates with intermediate susceptibility 2 Percent of isolates with resistance. Discrepancies between %R and sums of distribution %'s, to the right of the double vertical bars, are due to rounding3 95% confidence intervals for percent resistant (%R) were calculated using the Clopper-Pearson exact method
Cat
tleS
win
e
4 The unshaded areas indicate tthe range of dilutions tested for each antimicrobial. Single vertical bars indicate the breakpoints for susceptibility, while double vertical bars indicate the breakpoints for resistance. Numbers in the shaded areas indicate the percentages of isolates with MICs greater than the highest tested concentrations. Numbers listed for the lowest tested concentrations represent the percentages of isolates with MICs equal to or less than the lowest tested concentration.
Turk
eys
Distribution (%) of MICs (µg/ml) 4
Chi
cken
sTu
rkey
sC
attle
Sw
ine
Chi
cken
sTu
rkey
sC
attle
Sw
ine
Chi
cken
s
Table 13b. Distribution of MICs and Occurrence of Resistance among all Non-Typhoidal Salmonella Isolates, 2013
18
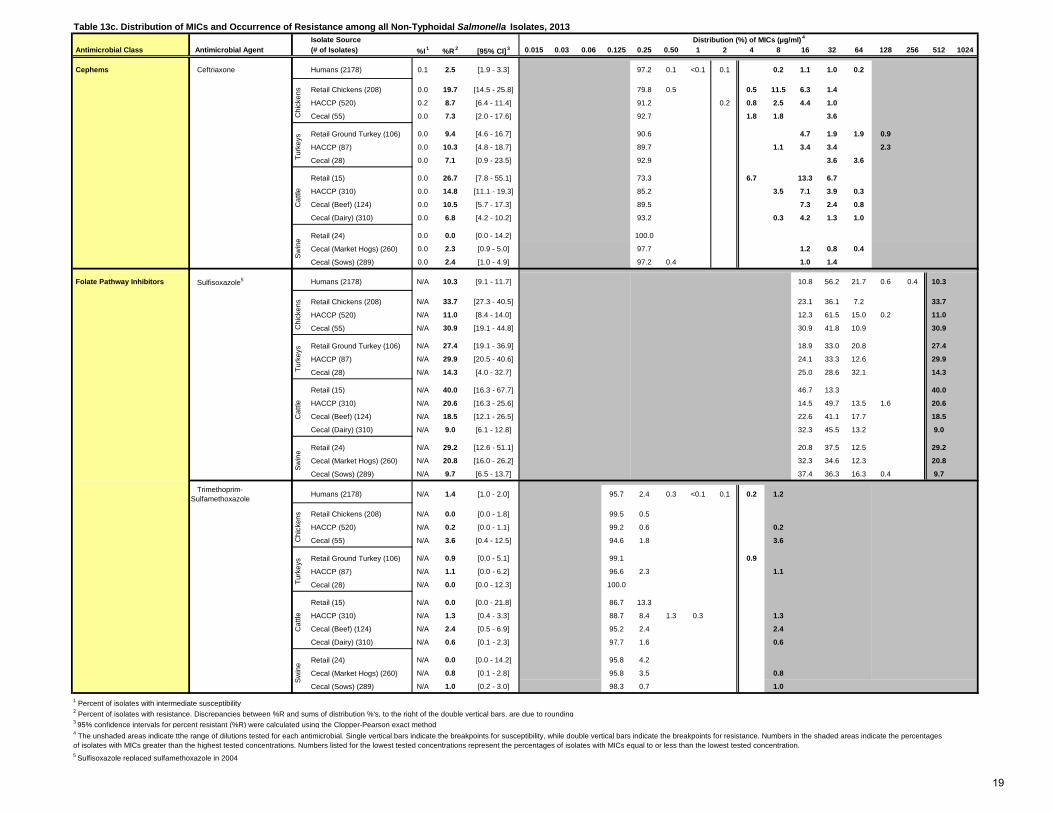
Isolate Source Antimicrobial Class Antimicrobial Agent (# of Isolates) %I
1 %R 2 [95% CI]
3 0.015 0.03 0.06 0.125 0.25 0.50 1 2 4 8 16 32 64 128 256 512 1024
Cephems Ceftriaxone Humans (2178) 0.1 2.5 [1.9 - 3.3] 97.2 0.1 <0.1 0.1 0.2 1.1 1.0 0.2
Retail Chickens (208) 0.0 19.7 [14.5 - 25.8] 79.8 0.5 0.5 11.5 6.3 1.4
HACCP (520) 0.2 8.7 [6.4 - 11.4] 91.2 0.2 0.8 2.5 4.4 1.0
Cecal (55) 0.0 7.3 [2.0 - 17.6] 92.7 1.8 1.8 3.6
Retail Ground Turkey (106) 0.0 9.4 [4.6 - 16.7] 90.6 4.7 1.9 1.9 0.9
HACCP (87) 0.0 10.3 [4.8 - 18.7] 89.7 1.1 3.4 3.4 2.3
Cecal (28) 0.0 7.1 [0.9 - 23.5] 92.9 3.6 3.6
Retail (15) 0.0 26.7 [7.8 - 55.1] 73.3 6.7 13.3 6.7
HACCP (310) 0.0 14.8 [11.1 - 19.3] 85.2 3.5 7.1 3.9 0.3
Cecal (Beef) (124) 0.0 10.5 [5.7 - 17.3] 89.5 7.3 2.4 0.8
Cecal (Dairy) (310) 0.0 6.8 [4.2 - 10.2] 93.2 0.3 4.2 1.3 1.0
Retail (24) 0.0 0.0 [0.0 - 14.2] 100.0
Cecal (Market Hogs) (260) 0.0 2.3 [0.9 - 5.0] 97.7 1.2 0.8 0.4
Cecal (Sows) (289) 0.0 2.4 [1.0 - 4.9] 97.2 0.4 1.0 1.4
Folate Pathway Inhibitors Sulfisoxazole5 Humans (2178) N/A 10.3 [9.1 - 11.7] 10.8 56.2 21.7 0.6 0.4 10.3
Retail Chickens (208) N/A 33.7 [27.3 - 40.5] 23.1 36.1 7.2 33.7
HACCP (520) N/A 11.0 [8.4 - 14.0] 12.3 61.5 15.0 0.2 11.0
Cecal (55) N/A 30.9 [19.1 - 44.8] 30.9 41.8 10.9 30.9
Retail Ground Turkey (106) N/A 27.4 [19.1 - 36.9] 18.9 33.0 20.8 27.4
HACCP (87) N/A 29.9 [20.5 - 40.6] 24.1 33.3 12.6 29.9
Cecal (28) N/A 14.3 [4.0 - 32.7] 25.0 28.6 32.1 14.3
Retail (15) N/A 40.0 [16.3 - 67.7] 46.7 13.3 40.0
HACCP (310) N/A 20.6 [16.3 - 25.6] 14.5 49.7 13.5 1.6 20.6
Cecal (Beef) (124) N/A 18.5 [12.1 - 26.5] 22.6 41.1 17.7 18.5
Cecal (Dairy) (310) N/A 9.0 [6.1 - 12.8] 32.3 45.5 13.2 9.0
Retail (24) N/A 29.2 [12.6 - 51.1] 20.8 37.5 12.5 29.2
Cecal (Market Hogs) (260) N/A 20.8 [16.0 - 26.2] 32.3 34.6 12.3 20.8
Cecal (Sows) (289) N/A 9.7 [6.5 - 13.7] 37.4 36.3 16.3 0.4 9.7
Trimethoprim-Sulfamethoxazole Humans (2178) N/A 1.4 [1.0 - 2.0] 95.7 2.4 0.3 <0.1 0.1 0.2 1.2
Retail Chickens (208) N/A 0.0 [0.0 - 1.8] 99.5 0.5
HACCP (520) N/A 0.2 [0.0 - 1.1] 99.2 0.6 0.2
Cecal (55) N/A 3.6 [0.4 - 12.5] 94.6 1.8 3.6
Retail Ground Turkey (106) N/A 0.9 [0.0 - 5.1] 99.1 0.9
HACCP (87) N/A 1.1 [0.0 - 6.2] 96.6 2.3 1.1
Cecal (28) N/A 0.0 [0.0 - 12.3] 100.0
Retail (15) N/A 0.0 [0.0 - 21.8] 86.7 13.3
HACCP (310) N/A 1.3 [0.4 - 3.3] 88.7 8.4 1.3 0.3 1.3
Cecal (Beef) (124) N/A 2.4 [0.5 - 6.9] 95.2 2.4 2.4
Cecal (Dairy) (310) N/A 0.6 [0.1 - 2.3] 97.7 1.6 0.6
Retail (24) N/A 0.0 [0.0 - 14.2] 95.8 4.2
Cecal (Market Hogs) (260) N/A 0.8 [0.1 - 2.8] 95.8 3.5 0.8
Cecal (Sows) (289) N/A 1.0 [0.2 - 3.0] 98.3 0.7 1.0
1 Percent of isolates with intermediate susceptibility 2 Percent of isolates with resistance. Discrepancies between %R and sums of distribution %'s, to the right of the double vertical bars, are due to rounding3 95% confidence intervals for percent resistant (%R) were calculated using the Clopper-Pearson exact method
5 Sulfisoxazole replaced sulfamethoxazole in 2004
4 The unshaded areas indicate tthe range of dilutions tested for each antimicrobial. Single vertical bars indicate the breakpoints for susceptibility, while double vertical bars indicate the breakpoints for resistance. Numbers in the shaded areas indicate the percentages of isolates with MICs greater than the highest tested concentrations. Numbers listed for the lowest tested concentrations represent the percentages of isolates with MICs equal to or less than the lowest tested concentration.
Cat
tleS
win
eC
hick
ens
Turk
eys
Cat
tleS
win
eTu
rkey
sC
hick
ens
Turk
eys
Cat
tleS
win
e
Table 13c. Distribution of MICs and Occurrence of Resistance among all Non-Typhoidal Salmonella Isolates, 2013 Distribution (%) of MICs (µg/ml)
4
Chi
cken
s
19
Isolate Source Antimicrobial Class Antimicrobial Agent (# of Isolates) %I
1 %R 2 [95% CI]
3 0.015 0.03 0.06 0.125 0.25 0.50 1 2 4 8 16 32 64 128 256 512 1024
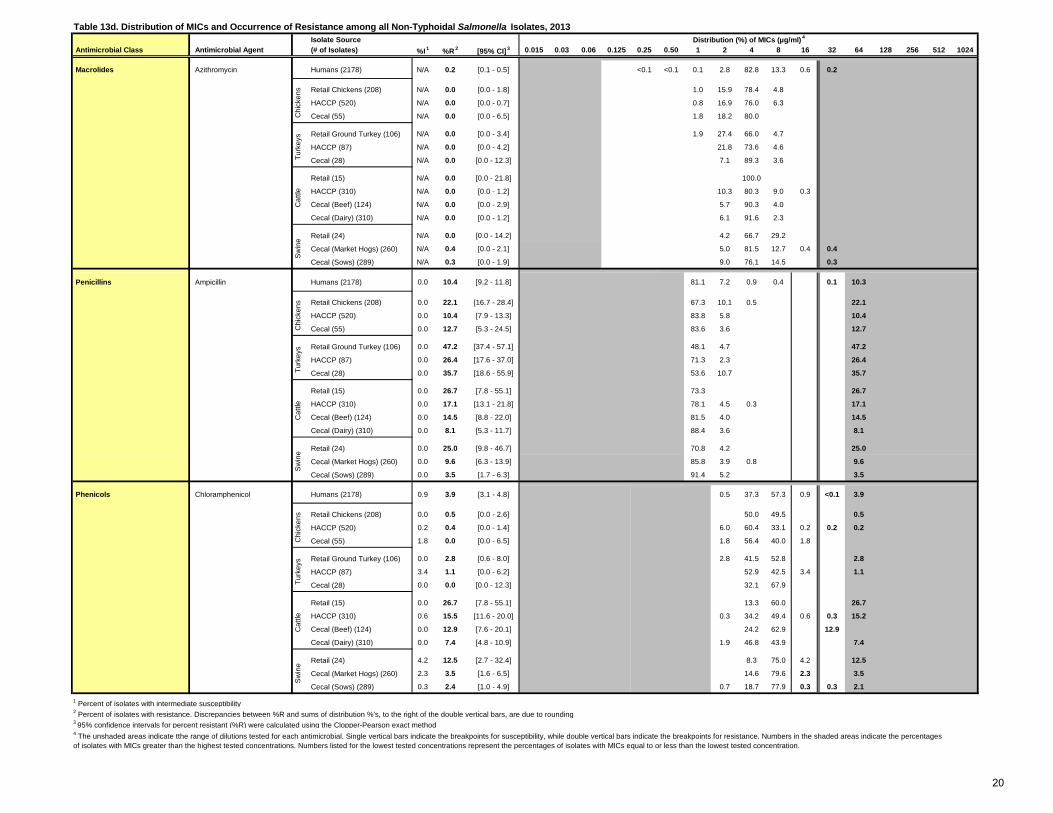
Macrolides Azithromycin Humans (2178) N/A 0.2 [0.1 - 0.5] <0.1 <0.1 0.1 2.8 82.8 13.3 0.6 0.2
Retail Chickens (208) N/A 0.0 [0.0 - 1.8] 1.0 15.9 78.4 4.8
HACCP (520) N/A 0.0 [0.0 - 0.7] 0.8 16.9 76.0 6.3
Cecal (55) N/A 0.0 [0.0 - 6.5] 1.8 18.2 80.0
Retail Ground Turkey (106) N/A 0.0 [0.0 - 3.4] 1.9 27.4 66.0 4.7
HACCP (87) N/A 0.0 [0.0 - 4.2] 21.8 73.6 4.6
Cecal (28) N/A 0.0 [0.0 - 12.3] 7.1 89.3 3.6
Retail (15) N/A 0.0 [0.0 - 21.8] 100.0
HACCP (310) N/A 0.0 [0.0 - 1.2] 10.3 80.3 9.0 0.3
Cecal (Beef) (124) N/A 0.0 [0.0 - 2.9] 5.7 90.3 4.0
Cecal (Dairy) (310) N/A 0.0 [0.0 - 1.2] 6.1 91.6 2.3
Retail (24) N/A 0.0 [0.0 - 14.2] 4.2 66.7 29.2
Cecal (Market Hogs) (260) N/A 0.4 [0.0 - 2.1] 5.0 81.5 12.7 0.4 0.4
Cecal (Sows) (289) N/A 0.3 [0.0 - 1.9] 9.0 76.1 14.5 0.3
Penicillins Ampicillin Humans (2178) 0.0 10.4 [9.2 - 11.8] 81.1 7.2 0.9 0.4 0.1 10.3
Retail Chickens (208) 0.0 22.1 [16.7 - 28.4] 67.3 10.1 0.5 22.1
HACCP (520) 0.0 10.4 [7.9 - 13.3] 83.8 5.8 10.4
Cecal (55) 0.0 12.7 [5.3 - 24.5] 83.6 3.6 12.7
Retail Ground Turkey (106) 0.0 47.2 [37.4 - 57.1] 48.1 4.7 47.2
HACCP (87) 0.0 26.4 [17.6 - 37.0] 71.3 2.3 26.4
Cecal (28) 0.0 35.7 [18.6 - 55.9] 53.6 10.7 35.7
Retail (15) 0.0 26.7 [7.8 - 55.1] 73.3 26.7
HACCP (310) 0.0 17.1 [13.1 - 21.8] 78.1 4.5 0.3 17.1
Cecal (Beef) (124) 0.0 14.5 [8.8 - 22.0] 81.5 4.0 14.5
Cecal (Dairy) (310) 0.0 8.1 [5.3 - 11.7] 88.4 3.6 8.1
Retail (24) 0.0 25.0 [9.8 - 46.7] 70.8 4.2 25.0
Cecal (Market Hogs) (260) 0.0 9.6 [6.3 - 13.9] 85.8 3.9 0.8 9.6
Cecal (Sows) (289) 0.0 3.5 [1.7 - 6.3] 91.4 5.2 3.5
Phenicols Chloramphenicol Humans (2178) 0.9 3.9 [3.1 - 4.8] 0.5 37.3 57.3 0.9 <0.1 3.9
Retail Chickens (208) 0.0 0.5 [0.0 - 2.6] 50.0 49.5 0.5
HACCP (520) 0.2 0.4 [0.0 - 1.4] 6.0 60.4 33.1 0.2 0.2 0.2
Cecal (55) 1.8 0.0 [0.0 - 6.5] 1.8 56.4 40.0 1.8
Retail Ground Turkey (106) 0.0 2.8 [0.6 - 8.0] 2.8 41.5 52.8 2.8
HACCP (87) 3.4 1.1 [0.0 - 6.2] 52.9 42.5 3.4 1.1
Cecal (28) 0.0 0.0 [0.0 - 12.3] 32.1 67.9
Retail (15) 0.0 26.7 [7.8 - 55.1] 13.3 60.0 26.7
HACCP (310) 0.6 15.5 [11.6 - 20.0] 0.3 34.2 49.4 0.6 0.3 15.2
Cecal (Beef) (124) 0.0 12.9 [7.6 - 20.1] 24.2 62.9 12.9
Cecal (Dairy) (310) 0.0 7.4 [4.8 - 10.9] 1.9 46.8 43.9 7.4
Retail (24) 4.2 12.5 [2.7 - 32.4] 8.3 75.0 4.2 12.5
Cecal (Market Hogs) (260) 2.3 3.5 [1.6 - 6.5] 14.6 79.6 2.3 3.5
Cecal (Sows) (289) 0.3 2.4 [1.0 - 4.9] 0.7 18.7 77.9 0.3 0.3 2.1
1 Percent of isolates with intermediate susceptibility 2 Percent of isolates with resistance. Discrepancies between %R and sums of distribution %'s, to the right of the double vertical bars, are due to rounding3 95% confidence intervals for percent resistant (%R) were calculated using the Clopper-Pearson exact method4 The unshaded areas indicate tthe range of dilutions tested for each antimicrobial. Single vertical bars indicate the breakpoints for susceptibility, while double vertical bars indicate the breakpoints for resistance. Numbers in the shaded areas indicate the percentages of isolates with MICs greater than the highest tested concentrations. Numbers listed for the lowest tested concentrations represent the percentages of isolates with MICs equal to or less than the lowest tested concentration.
Chi
cken
sTu
rkey
sC
attle
Sw
ine
Cat
tleS
win
e
Table 13d. Distribution of MICs and Occurrence of Resistance among all Non-Typhoidal Salmonella Isolates, 2013 Distribution (%) of MICs (µg/ml)
4
Turk
eys
Chi
cken
sC
hick
ens
Turk
eys
Cat
tleS
win
e
20
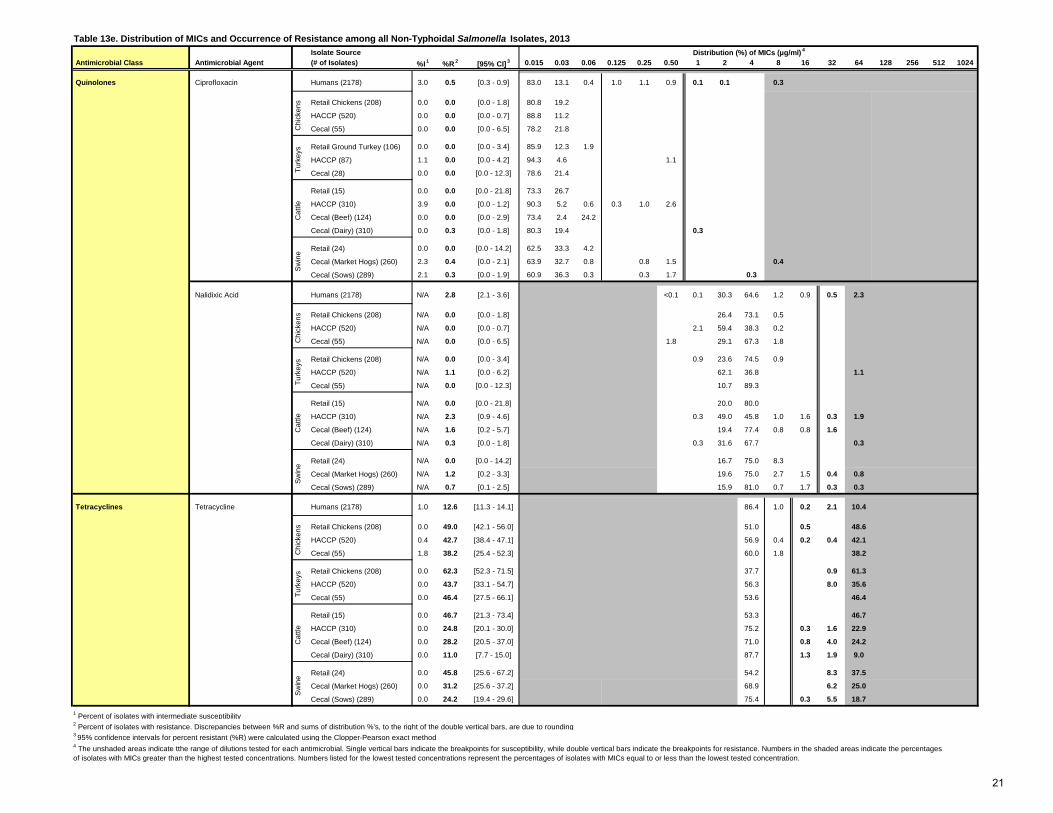
Table 13e. Distribution of MICs and Occurrence of Resistance among all Non-Typhoidal Salmonella Isolates, 2013 Isolate Source
Antimicrobial Class Antimicrobial Agent (# of Isolates) %I 1 %R
2 [95% CI] 3 0.015 0.03 0.06 0.125 0.25 0.50 1 2 4 8 16 32 64 128 256 512 1024
Quinolones Ciprofloxacin Humans (2178) 3.0 0.5 [0.3 - 0.9] 83.0 13.1 0.4 1.0 1.1 0.9 0.1 0.1 0.3
Retail Chickens (208) 0.0 0.0 [0.0 - 1.8] 80.8 19.2
HACCP (520) 0.0 0.0 [0.0 - 0.7] 88.8 11.2
Cecal (55) 0.0 0.0 [0.0 - 6.5] 78.2 21.8
Retail Ground Turkey (106) 0.0 0.0 [0.0 - 3.4] 85.9 12.3 1.9
HACCP (87) 1.1 0.0 [0.0 - 4.2] 94.3 4.6 1.1
Cecal (28) 0.0 0.0 [0.0 - 12.3] 78.6 21.4
Retail (15) 0.0 0.0 [0.0 - 21.8] 73.3 26.7
HACCP (310) 3.9 0.0 [0.0 - 1.2] 90.3 5.2 0.6 0.3 1.0 2.6
Cecal (Beef) (124) 0.0 0.0 [0.0 - 2.9] 73.4 2.4 24.2
Cecal (Dairy) (310) 0.0 0.3 [0.0 - 1.8] 80.3 19.4 0.3
Retail (24) 0.0 0.0 [0.0 - 14.2] 62.5 33.3 4.2
Cecal (Market Hogs) (260) 2.3 0.4 [0.0 - 2.1] 63.9 32.7 0.8 0.8 1.5 0.4
Cecal (Sows) (289) 2.1 0.3 [0.0 - 1.9] 60.9 36.3 0.3 0.3 1.7 0.3
Nalidixic Acid Humans (2178) N/A 2.8 [2.1 - 3.6] <0.1 0.1 30.3 64.6 1.2 0.9 0.5 2.3
Retail Chickens (208) N/A 0.0 [0.0 - 1.8] 26.4 73.1 0.5
HACCP (520) N/A 0.0 [0.0 - 0.7] 2.1 59.4 38.3 0.2
Cecal (55) N/A 0.0 [0.0 - 6.5] 1.8 29.1 67.3 1.8
Retail Chickens (208) N/A 0.0 [0.0 - 3.4] 0.9 23.6 74.5 0.9
HACCP (520) N/A 1.1 [0.0 - 6.2] 62.1 36.8 1.1
Cecal (55) N/A 0.0 [0.0 - 12.3] 10.7 89.3
Retail (15) N/A 0.0 [0.0 - 21.8] 20.0 80.0
HACCP (310) N/A 2.3 [0.9 - 4.6] 0.3 49.0 45.8 1.0 1.6 0.3 1.9
Cecal (Beef) (124) N/A 1.6 [0.2 - 5.7] 19.4 77.4 0.8 0.8 1.6
Cecal (Dairy) (310) N/A 0.3 [0.0 - 1.8] 0.3 31.6 67.7 0.3
Retail (24) N/A 0.0 [0.0 - 14.2] 16.7 75.0 8.3
Cecal (Market Hogs) (260) N/A 1.2 [0.2 - 3.3] 19.6 75.0 2.7 1.5 0.4 0.8
Cecal (Sows) (289) N/A 0.7 [0.1 - 2.5] 15.9 81.0 0.7 1.7 0.3 0.3
Tetracyclines Tetracycline Humans (2178) 1.0 12.6 [11.3 - 14.1] 86.4 1.0 0.2 2.1 10.4
Retail Chickens (208) 0.0 49.0 [42.1 - 56.0] 51.0 0.5 48.6
HACCP (520) 0.4 42.7 [38.4 - 47.1] 56.9 0.4 0.2 0.4 42.1
Cecal (55) 1.8 38.2 [25.4 - 52.3] 60.0 1.8 38.2
Retail Chickens (208) 0.0 62.3 [52.3 - 71.5] 37.7 0.9 61.3
HACCP (520) 0.0 43.7 [33.1 - 54.7] 56.3 8.0 35.6
Cecal (55) 0.0 46.4 [27.5 - 66.1] 53.6 46.4
Retail (15) 0.0 46.7 [21.3 - 73.4] 53.3 46.7
HACCP (310) 0.0 24.8 [20.1 - 30.0] 75.2 0.3 1.6 22.9
Cecal (Beef) (124) 0.0 28.2 [20.5 - 37.0] 71.0 0.8 4.0 24.2
Cecal (Dairy) (310) 0.0 11.0 [7.7 - 15.0] 87.7 1.3 1.9 9.0
Retail (24) 0.0 45.8 [25.6 - 67.2] 54.2 8.3 37.5
Cecal (Market Hogs) (260) 0.0 31.2 [25.6 - 37.2] 68.9 6.2 25.0
Cecal (Sows) (289) 0.0 24.2 [19.4 - 29.6] 75.4 0.3 5.5 18.7
1 Percent of isolates with intermediate susceptibility 2 Percent of isolates with resistance. Discrepancies between %R and sums of distribution %'s, to the right of the double vertical bars, are due to rounding3 95% confidence intervals for percent resistant (%R) were calculated using the Clopper-Pearson exact method
Chi
cken
sTu
rkey
sC
attle
Sw
ine
Sw
ine
Turk
eys
Cat
tleS
win
eC
hick
ens
Turk
eys
Cat
tle
Distribution (%) of MICs (µg/ml) 4
Chi
cken
s
4 The unshaded areas indicate tthe range of dilutions tested for each antimicrobial. Single vertical bars indicate the breakpoints for susceptibility, while double vertical bars indicate the breakpoints for resistance. Numbers in the shaded areas indicate the percentages of isolates with MICs greater than the highest tested concentrations. Numbers listed for the lowest tested concentrations represent the percentages of isolates with MICs equal to or less than the lowest tested concentration.
21
Year 2002 2003 2004 2005 2006 2007 2008 2009 2010 2011 2012 2013
Humans 1998 1855 1782 2036 2171 2145 2384 2193 2449 2335 2233 2178
Retail Chickens 60 83 157 153 152 99 198 272 171 158 229 208 HACCP 1500 1158 1280 1989 1380 994 624 551 564 491 864 520 Cecal 55
Retail Ground Turkey 74 114 142 183 159 190 246 193 202 162 91 106 HACCP 244 262 236 227 304 271 148 121 151 103 175 87 Cecal 28
Retail Ground Beef 9 10 14 8 19 13 24 14 7 9 13 15 HACCP 1008 670 607 329 389 439 443 200 247 340 280 310 Cecal (Beef) 124 Cecal (Dairy) 310
Retail Pork Chops 10 5 11 9 8 18 23 8 20 28 12 24 HACCP1 379 211 308 301 304 211 111 120 111 90 Cecal (Market Hogs) 260 Cecal (Sows) 289
Antimicrobial Class
Antimicrobial (Resistance Breakpoint)
Isolate Source
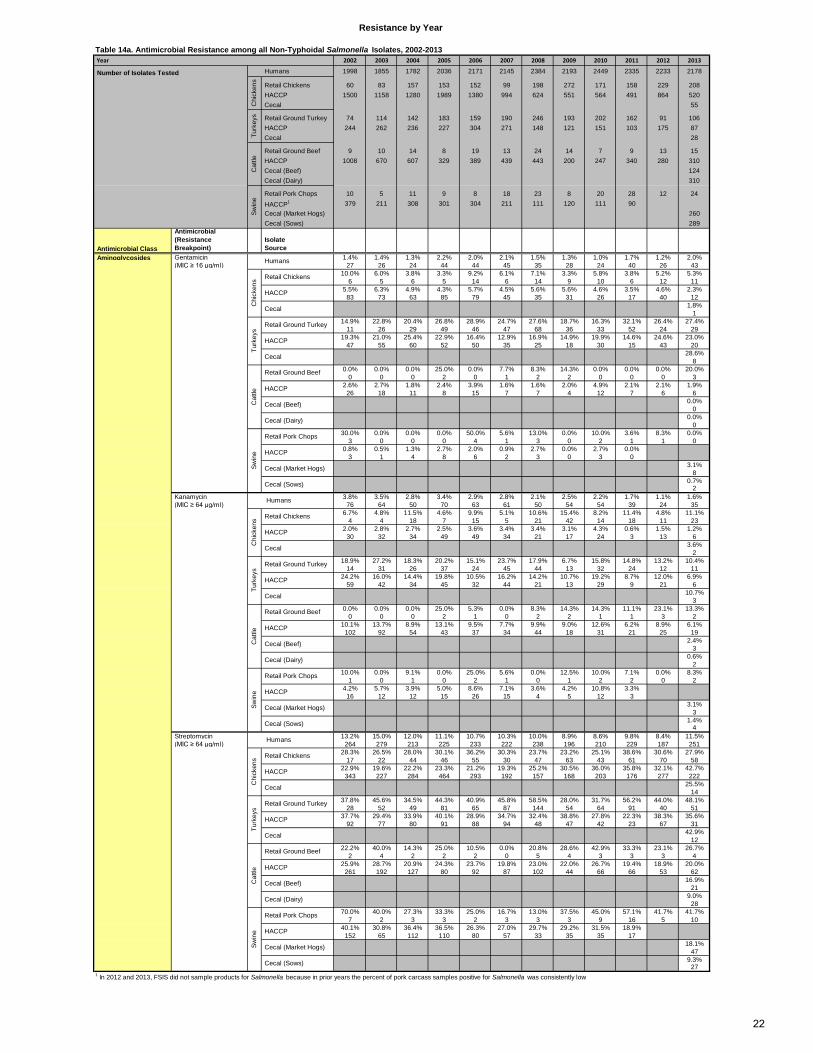
Aminoglycosides Gentamicin 1.4% 1.4% 1.3% 2.2% 2.0% 2.1% 1.5% 1.3% 1.0% 1.7% 1.2% 2.0% (MIC ≥ 16 µg/ml) 27 26 24 44 44 45 35 28 24 40 26 43
10.0% 6.0% 3.8% 3.3% 9.2% 6.1% 7.1% 3.3% 5.8% 3.8% 5.2% 5.3%6 5 6 5 14 6 14 9 10 6 12 11
5.5% 6.3% 4.9% 4.3% 5.7% 4.5% 5.6% 5.6% 4.6% 3.5% 4.6% 2.3%83 73 63 85 79 45 35 31 26 17 40 12
1.8%1
14.9% 22.8% 20.4% 26.8% 28.9% 24.7% 27.6% 18.7% 16.3% 32.1% 26.4% 27.4%11 26 29 49 46 47 68 36 33 52 24 29
19.3% 21.0% 25.4% 22.9% 16.4% 12.9% 16.9% 14.9% 19.9% 14.6% 24.6% 23.0%47 55 60 52 50 35 25 18 30 15 43 20
28.6%8
0.0% 0.0% 0.0% 25.0% 0.0% 7.7% 8.3% 14.3% 0.0% 0.0% 0.0% 20.0%0 0 0 2 0 1 2 2 0 0 0 3
2.6% 2.7% 1.8% 2.4% 3.9% 1.6% 1.6% 2.0% 4.9% 2.1% 2.1% 1.9%26 18 11 8 15 7 7 4 12 7 6 6
0.0%0
0.0%0
30.0% 0.0% 0.0% 0.0% 50.0% 5.6% 13.0% 0.0% 10.0% 3.6% 8.3% 0.0%3 0 0 0 4 1 3 0 2 1 1 0
0.8% 0.5% 1.3% 2.7% 2.0% 0.9% 2.7% 0.0% 2.7% 0.0%3 1 4 8 6 2 3 0 3 0
3.1%8
0.7%2
Kanamycin 3.8% 3.5% 2.8% 3.4% 2.9% 2.8% 2.1% 2.5% 2.2% 1.7% 1.1% 1.6% (MIC ≥ 64 µg/ml) 76 64 50 70 63 61 50 54 54 39 24 35
6.7% 4.8% 11.5% 4.6% 9.9% 5.1% 10.6% 15.4% 8.2% 11.4% 4.8% 11.1%4 4 18 7 15 5 21 42 14 18 11 23
2.0% 2.8% 2.7% 2.5% 3.6% 3.4% 3.4% 3.1% 4.3% 0.6% 1.5% 1.2%30 32 34 49 49 34 21 17 24 3 13 6
3.6%2
18.9% 27.2% 18.3% 20.2% 15.1% 23.7% 17.9% 6.7% 15.8% 14.8% 13.2% 10.4%14 31 26 37 24 45 44 13 32 24 12 11
24.2% 16.0% 14.4% 19.8% 10.5% 16.2% 14.2% 10.7% 19.2% 8.7% 12.0% 6.9%59 42 34 45 32 44 21 13 29 9 21 6
10.7%3
0.0% 0.0% 0.0% 25.0% 5.3% 0.0% 8.3% 14.3% 14.3% 11.1% 23.1% 13.3%0 0 0 2 1 0 2 2 1 1 3 2
10.1% 13.7% 8.9% 13.1% 9.5% 7.7% 9.9% 9.0% 12.6% 6.2% 8.9% 6.1%102 92 54 43 37 34 44 18 31 21 25 19
2.4%3
0.6%2
10.0% 0.0% 9.1% 0.0% 25.0% 5.6% 0.0% 12.5% 10.0% 7.1% 0.0% 8.3%1 0 1 0 2 1 0 1 2 2 0 2
4.2% 5.7% 3.9% 5.0% 8.6% 7.1% 3.6% 4.2% 10.8% 3.3%16 12 12 15 26 15 4 5 12 3
3.1%3
1.4%4
Streptomycin 13.2% 15.0% 12.0% 11.1% 10.7% 10.3% 10.0% 8.9% 8.6% 9.8% 8.4% 11.5% (MIC ≥ 64 µg/ml) 264 279 213 225 233 222 238 196 210 229 187 251
28.3% 26.5% 28.0% 30.1% 36.2% 30.3% 23.7% 23.2% 25.1% 38.6% 30.6% 27.9%17 22 44 46 55 30 47 63 43 61 70 58
22.9% 19.6% 22.2% 23.3% 21.2% 19.3% 25.2% 30.5% 36.0% 35.8% 32.1% 42.7%343 227 284 464 293 192 157 168 203 176 277 222
25.5%14
37.8% 45.6% 34.5% 44.3% 40.9% 45.8% 58.5% 28.0% 31.7% 56.2% 44.0% 48.1%28 52 49 81 65 87 144 54 64 91 40 51
37.7% 29.4% 33.9% 40.1% 28.9% 34.7% 32.4% 38.8% 27.8% 22.3% 38.3% 35.6%92 77 80 91 88 94 48 47 42 23 67 31
42.9%12
22.2% 40.0% 14.3% 25.0% 10.5% 0.0% 20.8% 28.6% 42.9% 33.3% 23.1% 26.7%2 4 2 2 2 0 5 4 3 3 3 4
25.9% 28.7% 20.9% 24.3% 23.7% 19.8% 23.0% 22.0% 26.7% 19.4% 18.9% 20.0%261 192 127 80 92 87 102 44 66 66 53 62
16.9%21
9.0%28
70.0% 40.0% 27.3% 33.3% 25.0% 16.7% 13.0% 37.5% 45.0% 57.1% 41.7% 41.7%7 2 3 3 2 3 3 3 9 16 5 10
40.1% 30.8% 36.4% 36.5% 26.3% 27.0% 29.7% 29.2% 31.5% 18.9%152 65 112 110 80 57 33 35 35 17
18.1%47
9.3%27
1 In 2012 and 2013, FSIS did not sample products for Salmonella because in prior years the percent of pork carcass samples positive for Salmonella was consistently low
Resistance by Year
Swin
e
Retail Pork Chops
HACCP
Cecal (Market Hogs)
Cecal (Sows)
HACCP
Cecal (Beef)Cat
tle
Retail Ground Beef
Cecal (Dairy)
Humans
Chi
cken
s Retail Chickens
Cecal
Turk
eys
Retail Ground Turkey
HACCP
Cecal
HACCP
Retail Ground Beef
Cecal (Dairy)
Swin
e
Retail Pork Chops
HACCP
Cecal (Market Hogs)
Cecal (Sows)
Cat
tle HACCP
Cecal (Beef)
Turk
eys
Retail Ground Turkey
HACCP
Cecal
Humans
Chi
cken
s Retail Chickens
Swin
e
Retail Pork Chops
HACCP
Cecal (Market Hogs)
Cecal (Sows)
HACCP
Cecal
Cecal (Beef)Cat
tle
Retail Ground Beef
Cecal (Dairy)
HACCP
HACCP
Cecal
Turk
eys
Retail Ground Turkey
Table 14a. Antimicrobial Resistance among all Non-Typhoidal Salmonella Isolates, 2002-2013
Number of Isolates Tested
Chi
cken
sTu
rkey
sC
attle
HACCP
Swin
e Humans
Chi
cken
s Retail Chickens
Cecal
22
Year 2002 2003 2004 2005 2006 2007 2008 2009 2010 2011 2012 2013
Number of Isolates Tested Humans 1998 1855 1782 2036 2171 2145 2384 2193 2449 2335 2233 2178
Retail Chickens 60 83 157 153 152 99 198 272 171 158 229 208 HACCP 1500 1158 1280 1989 1380 994 624 551 564 491 864 520 Cecal 55
Retail Ground Turkey 74 114 142 183 159 190 246 193 202 162 91 106 HACCP 244 262 236 227 304 271 148 121 151 103 175 87 Cecal 28
Retail Ground Beef 9 10 14 8 19 13 24 14 7 9 13 15 HACCP 1008 670 607 329 389 439 443 200 247 340 280 310 Cecal (Beef) 124 Cecal (Dairy) 310
Retail Pork Chops 10 5 11 9 8 18 23 8 20 28 12 24 HACCP1 379 211 308 301 304 211 111 120 111 90 Cecal (Market Hogs) 260 Cecal (Sows) 289
Antimicrobial Class
Antimicrobial (Resistance Breakpoint)
Isolate Source
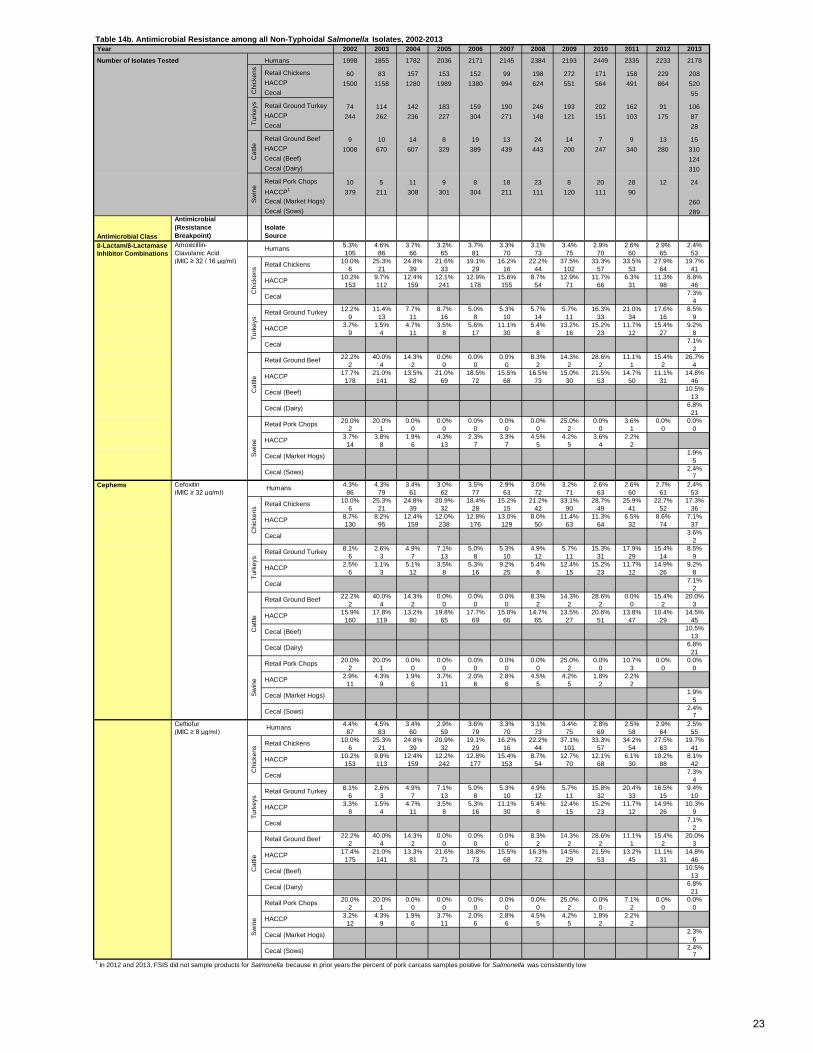
β-Lactam/β-Lactamase Amoxicillin- 5.3% 4.6% 3.7% 3.2% 3.7% 3.3% 3.1% 3.4% 2.9% 2.6% 2.9% 2.4% Inhibitor Combinations Clavulanic Acid 105 86 66 65 81 70 73 75 70 60 65 53
(MIC ≥ 32 / 16 µg/ml) 10.0% 25.3% 24.8% 21.6% 19.1% 16.2% 22.2% 37.5% 33.3% 33.5% 27.9% 19.7%6 21 39 33 29 16 44 102 57 53 64 41
10.2% 9.7% 12.4% 12.1% 12.9% 15.6% 8.7% 12.9% 11.7% 6.3% 11.3% 8.8%153 112 159 241 178 155 54 71 66 31 98 46
7.3%4
12.2% 11.4% 7.7% 8.7% 5.0% 5.3% 5.7% 5.7% 16.3% 21.0% 17.6% 8.5%9 13 11 16 8 10 14 11 33 34 16 9
3.7% 1.5% 4.7% 3.5% 5.6% 11.1% 5.4% 13.2% 15.2% 11.7% 15.4% 9.2%9 4 11 8 17 30 8 16 23 12 27 8
7.1%2
22.2% 40.0% 14.3% 0.0% 0.0% 0.0% 8.3% 14.3% 28.6% 11.1% 15.4% 26.7%2 4 2 0 0 0 2 2 2 1 2 4
17.7% 21.0% 13.5% 21.0% 18.5% 15.5% 16.5% 15.0% 21.5% 14.7% 11.1% 14.8%178 141 82 69 72 68 73 30 53 50 31 46
10.5%13
6.8%21
20.0% 20.0% 0.0% 0.0% 0.0% 0.0% 0.0% 25.0% 0.0% 3.6% 0.0% 0.0%2 1 0 0 0 0 0 2 0 1 0 0
3.7% 3.8% 1.9% 4.3% 2.3% 3.3% 4.5% 4.2% 3.6% 2.2%14 8 6 13 7 7 5 5 4 2
1.9%5
2.4%7
Cefoxitin 4.3% 4.3% 3.4% 3.0% 3.5% 2.9% 3.0% 3.2% 2.6% 2.6% 2.7% 2.4% (MIC ≥ 32 µg/ml) 86 79 61 62 77 63 72 71 63 60 61 53
10.0% 25.3% 24.8% 20.9% 18.4% 15.2% 21.2% 33.1% 28.7% 25.9% 22.7% 17.3%6 21 39 32 28 15 42 90 49 41 52 36
8.7% 8.2% 12.4% 12.0% 12.8% 13.0% 8.0% 11.4% 11.3% 6.5% 8.6% 7.1%130 95 159 238 176 129 50 63 64 32 74 37
3.6%2
8.1% 2.6% 4.9% 7.1% 5.0% 5.3% 4.9% 5.7% 15.3% 17.9% 15.4% 8.5%6 3 7 13 8 10 12 11 31 29 14 9
2.5% 1.1% 5.1% 3.5% 5.3% 9.2% 5.4% 12.4% 15.2% 11.7% 14.9% 9.2%6 3 12 8 16 25 8 15 23 12 26 8
7.1%2
22.2% 40.0% 14.3% 0.0% 0.0% 0.0% 8.3% 14.3% 28.6% 0.0% 15.4% 20.0%2 4 2 0 0 0 2 2 2 0 2 3
15.9% 17.8% 13.2% 19.8% 17.7% 15.0% 14.7% 13.5% 20.6% 13.8% 10.4% 14.5%160 119 80 65 69 66 65 27 51 47 29 45
10.5%13
6.8%21
20.0% 20.0% 0.0% 0.0% 0.0% 0.0% 0.0% 25.0% 0.0% 10.7% 0.0% 0.0%2 1 0 0 0 0 0 2 0 3 0 0
2.9% 4.3% 1.9% 3.7% 2.0% 2.8% 4.5% 4.2% 1.8% 2.2%11 9 6 11 6 6 5 5 2 2
1.9%5
2.4%7
Ceftiofur 4.4% 4.5% 3.4% 2.9% 3.6% 3.3% 3.1% 3.4% 2.8% 2.5% 2.9% 2.5% (MIC ≥ 8 µg/ml) 87 83 60 59 79 70 73 75 69 58 64 55
10.0% 25.3% 24.8% 20.9% 19.1% 16.2% 22.2% 37.1% 33.3% 34.2% 27.5% 19.7%6 21 39 32 29 16 44 101 57 54 63 41
10.2% 9.8% 12.4% 12.2% 12.8% 15.4% 8.7% 12.7% 12.1% 6.1% 10.2% 8.1%153 113 159 242 177 153 54 70 68 30 88 42
7.3%4
8.1% 2.6% 4.9% 7.1% 5.0% 5.3% 4.9% 5.7% 15.8% 20.4% 16.5% 9.4%6 3 7 13 8 10 12 11 32 33 15 10
3.3% 1.5% 4.7% 3.5% 5.3% 11.1% 5.4% 12.4% 15.2% 11.7% 14.9% 10.3%8 4 11 8 16 30 8 15 23 12 26 9
7.1%2
22.2% 40.0% 14.3% 0.0% 0.0% 0.0% 8.3% 14.3% 28.6% 11.1% 15.4% 20.0%2 4 2 0 0 0 2 2 2 1 2 3
17.4% 21.0% 13.3% 21.6% 18.8% 15.5% 16.3% 14.5% 21.5% 13.2% 11.1% 14.8%175 141 81 71 73 68 72 29 53 45 31 46
10.5%13
6.8%21
20.0% 20.0% 0.0% 0.0% 0.0% 0.0% 0.0% 25.0% 0.0% 7.1% 0.0% 0.0%2 1 0 0 0 0 0 2 0 2 0 0
3.2% 4.3% 1.9% 3.7% 2.0% 2.8% 4.5% 4.2% 1.8% 2.2%12 9 6 11 6 6 5 5 2 2
2.3%6
2.4%7
1 In 2012 and 2013, FSIS did not sample products for Salmonella because in prior years the percent of pork carcass samples positive for Salmonella was consistently low
Cecal (Dairy)
Swin
e
Retail Pork Chops
HACCP
Cecal (Market Hogs)
Cecal (Sows)
Cat
tle HACCP
Cecal (Beef)
Retail Ground Beef
Turk
eys
Retail Ground Turkey
HACCP
Cecal
HACCP
Cecal
Humans
Chi
cken
s Retail Chickens
Swin
e
Retail Pork Chops
HACCP
Cecal (Market Hogs)
Cecal (Sows)
HACCP
Cecal (Beef)
Cecal (Dairy)
Cecal (Dairy)
Cat
tle
Retail Ground Beef
Turk
eys
Retail Ground Turkey
HACCP
Cecal
Chi
cken
s
HACCP
Cecal
Retail Chickens
Chi
cken
s
Cephems Humans
Swin
e
Retail Pork Chops
HACCP
Cecal (Market Hogs)
Cecal (Sows)
Cat
tle
Retail Ground Beef
HACCP
Cecal (Beef)
Turk
eys
Retail Ground Turkey
HACCP
Cecal
HACCP
Cecal
Retail Chickens
Turk
eys
Cat
tleSw
ine
Humans
Table 14b. Antimicrobial Resistance among all Non-Typhoidal Salmonella Isolates, 2002-2013
Chi
cken
s
23
Year 2002 2003 2004 2005 2006 2007 2008 2009 2010 2011 2012 2013
Number of Isolates Tested Humans 1998 1855 1782 2036 2171 2145 2384 2193 2449 2335 2233 2178
Retail Chickens 60 83 157 153 152 99 198 272 171 158 229 208 HACCP 1500 1158 1280 1989 1380 994 624 551 564 491 864 520 Cecal 55
Retail Ground Turkey 74 114 142 183 159 190 246 193 202 162 91 106 HACCP 244 262 236 227 304 271 148 121 151 103 175 87 Cecal 28
Retail Ground Beef 9 10 14 8 19 13 24 14 7 9 13 15 HACCP 1008 670 607 329 389 439 443 200 247 340 280 310 Cecal (Beef) 124 Cecal (Dairy) 310
Retail Pork Chops 10 5 11 9 8 18 23 8 20 28 12 24 HACCP1 379 211 308 301 304 211 111 120 111 90 Cecal (Market Hogs) 260 Cecal (Sows) 289
Antimicrobial Class
Antimicrobial (Resistance Breakpoint)
Isolate Source
Ceftriaxone 4.4% 4.4% 3.3% 2.9% 3.7% 3.3% 3.1% 3.4% 2.9% 2.5% 2.9% 2.5% (MIC ≥ 4 µg/ml) 87 81 59 59 80 70 73 75 70 58 64 55
10.0% 26.5% 24.8% 21.6% 19.1% 16.2% 22.2% 37.9% 34.5% 33.5% 27.9% 19.7%6 22 39 33 29 16 44 103 59 53 64 41
9.9% 9.7% 12.3% 12.2% 12.8% 15.6% 8.7% 12.9% 11.9% 6.3% 11.2% 8.7%149 112 158 242 177 155 54 71 67 31 97 45
7.3%4
8.1% 2.6% 5.6% 7.1% 5.0% 5.8% 4.9% 5.7% 16.3% 22.2% 17.6% 9.4%6 3 8 13 8 11 12 11 33 36 16 10
3.3% 1.1% 4.7% 3.5% 5.3% 11.1% 5.4% 12.4% 15.2% 11.7% 16.0% 10.3%8 3 11 8 16 30 8 15 23 12 28 9
7.1%2
22.2% 40.0% 14.3% 0.0% 0.0% 0.0% 8.3% 14.3% 28.6% 11.1% 15.4% 26.7%2 4 2 0 0 0 2 2 2 1 2 4
17.3% 21.0% 13.5% 20.7% 18.5% 15.9% 16.0% 14.5% 21.5% 14.4% 10.7% 14.8%174 141 82 68 72 70 71 29 53 49 30 46
10.5%13
6.8%21
20.0% 20.0% 0.0% 0.0% 0.0% 0.0% 0.0% 25.0% 0.0% 7.1% 0.0% 0.0%2 1 0 0 0 0 0 2 0 2 0 0
2.9% 4.3% 1.6% 3.7% 1.6% 2.4% 4.5% 4.2% 1.8% 2.2%11 9 5 11 5 5 5 5 2 2
2.3%6
2.4%7
Folate Pathway Inhibitor Sulfamethoxazole/ 12.9% 15.1% 13.3% 12.6% 12.1% 12.3% 10.1% 9.9% 9.0% 8.6% 8.4% 10.3% Sulfisoxazole 2 258 280 237 256 263 264 240 217 221 201 188 225 (MIC ≥ 512 µg/ml) 16.7% 14.5% 28.7% 17.0% 23.0% 25.3% 38.9% 48.2% 44.4% 44.9% 37.1% 33.7%
10 12 45 26 35 25 77 131 76 71 85 708.9% 10.3% 11.9% 8.5% 10.7% 10.4% 13.3% 10.0% 12.4% 7.9% 14.4% 11.0%133 119 152 169 148 103 83 55 70 39 124 57
30.9%17
20.3% 33.3% 28.2% 34.4% 32.1% 34.7% 27.6% 20.2% 24.8% 26.5% 27.5% 27.4%15 38 40 63 51 66 68 39 50 43 25 29
30.3% 28.2% 36.4% 37.0% 27.3% 25.5% 24.3% 28.9% 25.2% 22.3% 22.3% 29.9%74 74 86 84 83 69 36 35 38 23 39 26
14.3%4
22.2% 40.0% 14.3% 25.0% 10.5% 7.7% 20.8% 35.7% 42.9% 0.0% 23.1% 40.0%2 4 2 2 2 1 5 5 3 0 3 6
22.3% 25.1% 22.7% 27.4% 24.2% 21.6% 24.8% 24.5% 26.3% 20.0% 19.6% 20.6%225 168 138 90 94 95 110 49 65 68 55 64
18.6%23
9.0%28
70.0% 40.0% 18.2% 33.3% 75.0% 16.7% 30.4% 37.5% 50.0% 25.0% 33.3% 29.2%7 2 2 3 6 3 7 3 10 7 4 7
34.6% 25.1% 37.0% 32.9% 26.6% 30.8% 31.5% 30.8% 28.8% 17.8%131 53 114 99 81 65 35 37 32 16
20.8%54
9.7%28
Trimethoprim- 1.4% 1.9% 1.7% 1.7% 1.7% 1.5% 1.6% 1.7% 1.6% 1.2% 1.3% 1.4% Sulfamethoxazole 28 36 31 34 36 33 37 38 38 28 29 31 (MIC ≥ 4 / 76 µg/ml) 0.0% 0.0% 0.0% 0.0% 1.3% 0.0% 0.0% 0.4% 0.0% 1.3% 0.0% 0.0%
0 0 0 0 2 0 0 1 0 2 0 00.8% 0.3% 0.2% 0.2% 0.1% 0.0% 0.3% 0.2% 0.0% 0.2% 0.5% 0.2%12 4 3 4 1 0 2 1 0 1 4 1
3.6%2
1.4% 0.0% 0.0% 0.5% 0.0% 0.5% 0.4% 1.6% 0.0% 3.7% 0.0% 0.9%1 0 0 1 0 1 1 3 0 6 0 1
2.5% 2.3% 0.8% 1.8% 1.0% 1.1% 1.4% 1.7% 0.0% 0.0% 0.6% 1.1%6 6 2 4 3 3 2 2 0 0 1 1
0.0%0
0.0% 0.0% 7.1% 0.0% 0.0% 0.0% 0.0% 0.0% 0.0% 0.0% 0.0% 0.0%0 0 1 0 0 0 0 0 0 0 0 0
2.5% 3.3% 1.5% 4.9% 4.6% 3.0% 4.5% 1.5% 4.5% 1.8% 1.1% 1.3%25 22 9 16 18 13 20 3 11 6 3 4
2.4%3
0.6%2
20.0% 0.0% 0.0% 11.1% 50.0% 5.6% 0.0% 25.0% 0.0% 0.0% 0.0% 0.0%2 0 0 1 4 1 0 2 0 0 0 0
1.6% 2.4% 1.6% 2.3% 2.0% 1.9% 2.7% 2.5% 1.8% 0.0%6 5 5 7 6 4 3 3 2 0
0.8%2
1.0%3
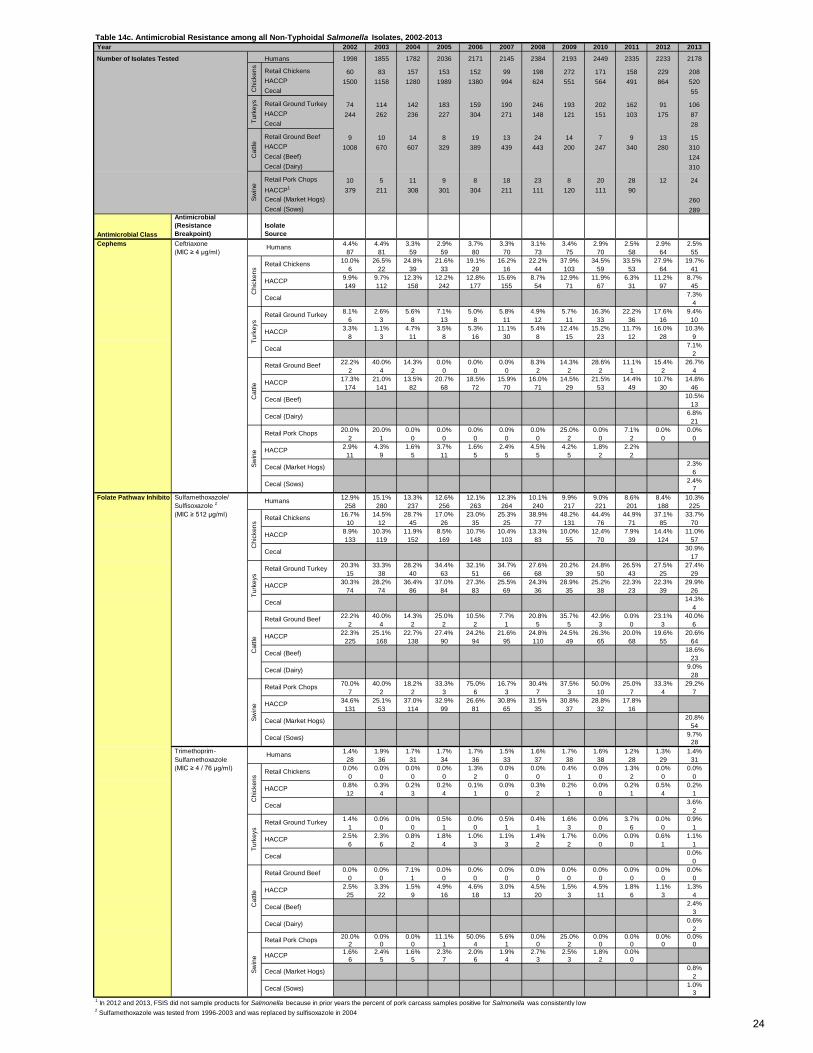
1 In 2012 and 2013, FSIS did not sample products for Salmonella because in prior years the percent of pork carcass samples positive for Salmonella was consistently low2 Sulfamethoxazole was tested from 1996-2003 and was replaced by sulfisoxazole in 2004
Swin
e
Retail Pork Chops
HACCP
Cecal (Market Hogs)
Cecal (Sows)
Cecal (Beef)Cat
tle
Retail Ground Beef
Cecal (Dairy)
HACCP
Turk
eys
Retail Ground Turkey
HACCP
Cecal
HACCP
Humans
Chi
cken
s
Retail Chickens
Cecal
Cecal (Dairy)
Swin
e
Retail Pork Chops
HACCP
Cecal (Market Hogs)
Cecal (Sows)
Cat
tle
HACCP
Cecal (Beef)
Retail Ground Beef
Turk
eys
Retail Ground Turkey
HACCP
Cecal
HACCP
Cecal
Humans
Chi
cken
s
Retail Chickens
Swin
e
Retail Pork Chops
HACCP
Cecal (Market Hogs)
Cecal (Sows)
Cecal (Beef)Cat
tle
Retail Ground Beef
Cecal (Dairy)
HACCP
Turk
eys
Retail Ground Turkey
HACCP
Cecal
HACCP
Cephems HumansC
hick
ens
Retail Chickens
Cecal
Turk
eys
Cat
tleSw
ine
Table 14c. Antimicrobial Resistance among all Non-Typhoidal Salmonella Isolates, 2002-2013
Chi
cken
s
24
Year 2002 2003 2004 2005 2006 2007 2008 2009 2010 2011 2012 2013 Number of Isolates Tested Humans 1998 1855 1782 2036 2171 2145 2384 2193 2449 2335 2233 2178
Retail Chickens 60 83 157 153 152 99 198 272 171 158 229 208 HACCP 1500 1158 1280 1989 1380 994 624 551 564 491 864 520 Cecal 55
Retail Ground Turkey 74 114 142 183 159 190 246 193 202 162 91 106 HACCP 1008 670 607 329 389 439 443 200 247 340 280 310 Cecal 124
Retail Ground Beef 9 10 14 8 19 13 24 14 7 9 13 15 HACCP 1008 670 607 329 389 439 443 200 247 340 280 310 Cecal (Beef) 124 Cecal (Dairy) 310
Retail Pork Chops 10 5 11 9 8 18 23 8 20 28 12 24 HACCP1 379 211 308 301 304 211 111 120 111 90 Cecal (Market Hogs) 260 Cecal (Sows) 289
Antimicrobial Class
Antimicrobial (Resistance Breakpoint)
Isolate Source
Azithromycin 0.2% 0.0% 0.2% (MIC ≥32 µg/ml) 5 1 5
0.6% 0.0% 0.0%1 0 0
0.0% 0.0% 0.0%0 0 0
0.0%0
0.0% 0.0% 0.0%0 0 0
0.0% 0.0% 0.0%0 0 0
0.0%0
0.0% 0.0% 0.0%0 0 0
0.3% 0.0% 0.0%1 0 0
0.0%0
0.0%0
0.0% 0.0% 0.0%0 0 0
0.0%0
0.4%1
0.3%1
Ampicillin 13.0% 13.6% 12.1% 11.3% 10.9% 10.1% 9.7% 9.8% 9.1% 9.1% 8.8% 10.4% (MIC ≥ 32 µg/ml) 259 253 216 231 237 217 232 216 223 213 196 227
16.7% 33.7% 30.6% 26.8% 22.4% 18.2% 28.3% 45.6% 38.0% 40.5% 29.3% 22.1%10 28 48 41 34 18 56 124 65 64 67 46
14.3% 13.7% 14.5% 14.0% 14.9% 17.0% 10.6% 13.8% 13.7% 7.3% 12.2% 10.4%215 159 185 279 205 169 66 76 77 36 105 54
12.7%7
16.2% 28.9% 20.4% 26.8% 25.8% 42.6% 51.2% 58.0% 48.0% 58.0% 40.7% 47.2%12 33 29 49 41 81 126 112 97 94 37 50
18.0% 18.7% 22.0% 22.9% 25.3% 36.9% 32.4% 38.8% 44.4% 27.2% 42.3% 26.4%44 49 52 52 77 100 48 47 67 28 74 23
35.7%10
22.2% 40.0% 21.4% 25.0% 10.5% 0.0% 12.5% 28.6% 28.6% 11.1% 23.1% 26.7%2 4 3 2 2 0 3 4 2 1 3 4
23.9% 28.1% 19.3% 26.7% 22.4% 20.0% 21.7% 22.5% 26.3% 17.1% 15.4% 17.1%241 188 117 88 87 88 96 45 65 58 43 53
14.5%18
8.1%25
40.0% 40.0% 9.1% 22.2% 25.0% 5.6% 13.0% 37.5% 15.0% 46.4% 16.7% 25.0%4 2 1 2 2 1 3 3 3 13 2 6
13.7% 12.8% 16.2% 13.6% 11.5% 18.0% 14.4% 19.2% 17.1% 11.1%52 27 50 41 35 38 16 23 19 10
9.6%25
3.5%10
Chloramphenicol 8.6% 10.1% 7.6% 7.8% 6.4% 7.3% 6.1% 5.7% 5.0% 4.4% 3.9% 3.9% (MIC ≥ 32 µg/ml) 172 187 136 159 139 156 146 125 122 103 87 85
0.0% 2.4% 1.9% 0.7% 2.6% 1.0% 0.5% 0.0% 2.3% 0.6% 0.0% 0.5%0 2 3 1 4 1 1 0 4 1 0 1
2.4% 2.1% 1.3% 1.8% 1.7% 1.8% 1.8% 1.6% 3.0% 0.4% 0.6% 0.4%36 24 16 36 24 18 11 9 17 2 5 2
0.0%0
1.4% 0.9% 2.8% 0.5% 0.6% 1.6% 1.6% 1.6% 2.5% 3.7% 3.3% 2.8%1 1 4 1 1 3 4 3 5 6 3 3
5.3% 4.2% 4.7% 4.8% 3.9% 5.5% 2.7% 3.3% 4.6% 1.0% 1.1% 1.1%13 11 11 11 12 15 4 4 7 1 2 1
0.0%0
22.2% 40.0% 14.3% 12.5% 5.3% 0.0% 12.5% 21.4% 42.9% 0.0% 23.1% 26.7%2 4 2 1 1 0 3 3 3 0 3 4
20.6% 25.1% 17.6% 21.9% 19.8% 20.0% 19.6% 21.0% 25.1% 17.9% 15.0% 15.5%208 168 107 72 77 88 87 42 62 61 42 48
12.9%16
7.4%23
40.0% 40.0% 18.2% 22.2% 0.0% 0.0% 0.0% 12.5% 15.0% 17.9% 0.0% 12.5%4 2 2 2 0 0 0 1 3 5 0 3
10.0% 8.5% 12.7% 10.6% 7.9% 15.2% 9.9% 15.0% 8.1% 4.4%38 18 39 32 24 32 11 18 9 4
3.5%9
2.4%7
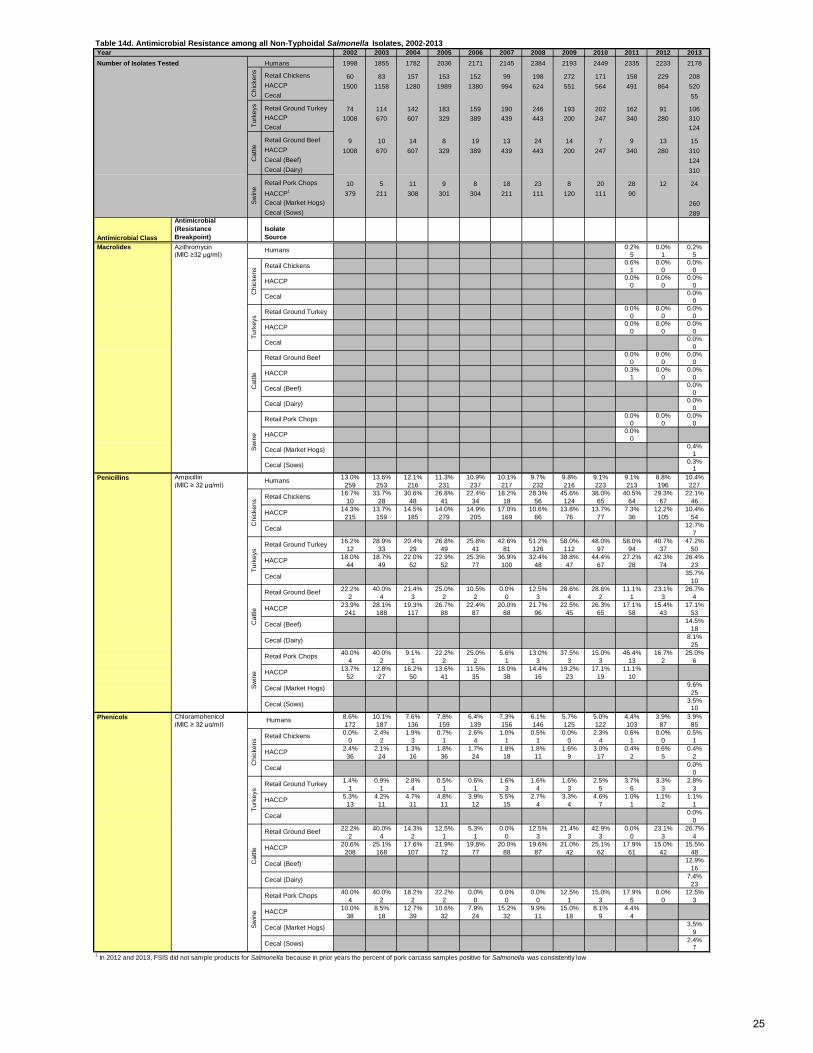
1 In 2012 and 2013, FSIS did not sample products for Salmonella because in prior years the percent of pork carcass samples positive for Salmonella was consistently low
Swin
e
Retail Pork Chops
HACCP
Cecal (Market Hogs)
Cecal (Sows)
Cecal (Beef)Cat
tle
Retail Ground Beef
Cecal (Dairy)
HACCP
Turk
eys
Retail Ground Turkey
HACCP
Cecal
HACCP
Phenicols Humans
Chi
cken
s Retail Chickens
Cecal
Swin
e
Retail Pork Chops
HACCP
Cecal (Market Hogs)
Cecal (Sows)
Cecal (Beef)Cat
tle
Retail Ground Beef
Cecal (Dairy)
HACCP
Turk
eys
Retail Ground Turkey
HACCP
Cecal
HACCP
Penicillins Humans
Chi
cken
s Retail Chickens
Cecal
Chi
cken
sSw
ine
Retail Pork Chops
HACCP
Cecal (Market Hogs)
Cecal (Sows)
Cat
tle
Retail Ground Beef
HACCP
Turk
eys
Retail Ground Turkey
HACCP
Cecal
Cecal (Dairy)
HACCP
Cecal
Retail Chickens
Cecal (Beef)
Table 14d. Antimicrobial Resistance among all Non-Typhoidal Salmonella Isolates, 2002-2013
Chi
cken
sTu
rkey
sC
attle
Swin
e Macrolides Humans
25
Year 2002 2003 2004 2005 2006 2007 2008 2009 2010 2011 2012 2013 Number of Isolates Tested Humans 1998 1855 1782 2036 2171 2145 2384 2193 2449 2335 2233 2178
Retail Chickens 60 83 157 153 152 99 198 272 171 158 229 208 HACCP 1500 1158 1280 1989 1380 994 624 551 564 491 864 520 Cecal 55
Retail Ground Turkey 74 114 142 183 159 190 246 193 202 162 91 106 HACCP 244 262 236 227 304 271 148 121 151 103 175 87 Cecal 28
Retail Ground Beef 9 10 14 8 19 13 24 14 7 9 13 15 HACCP 1008 670 607 329 389 439 443 200 247 340 280 310 Cecal (Beef) 124 Cecal (Dairy) 310
Retail Pork Chops 10 5 11 9 8 18 23 8 20 28 12 24 HACCP1 379 211 308 301 304 211 111 120 111 90 Cecal (Market Hogs) 260 Cecal (Sows) 289
Antimicrobial Class
Antimicrobial (Resistance Breakpoint)
Isolate Source
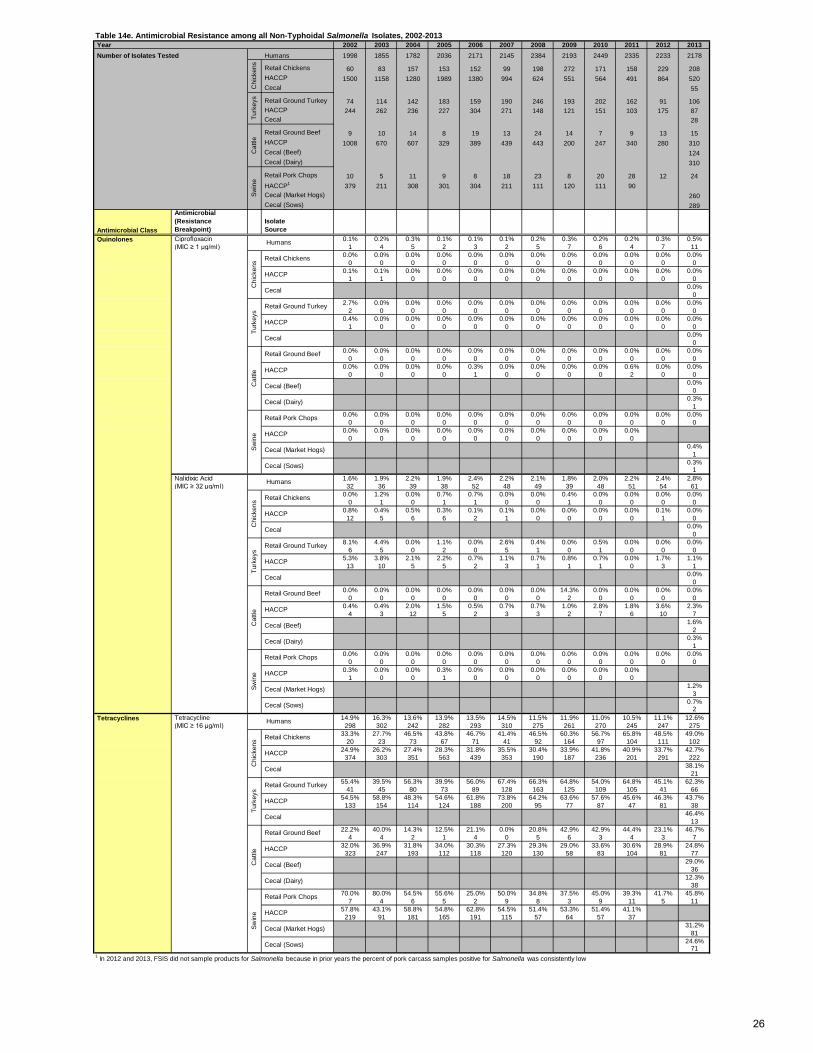
Quinolones Ciprofloxacin 0.1% 0.2% 0.3% 0.1% 0.1% 0.1% 0.2% 0.3% 0.2% 0.2% 0.3% 0.5% (MIC ≥ 1 µg/ml) 1 4 5 2 3 2 5 7 6 4 7 11
0.0% 0.0% 0.0% 0.0% 0.0% 0.0% 0.0% 0.0% 0.0% 0.0% 0.0% 0.0%0 0 0 0 0 0 0 0 0 0 0 0
0.1% 0.1% 0.0% 0.0% 0.0% 0.0% 0.0% 0.0% 0.0% 0.0% 0.0% 0.0%1 1 0 0 0 0 0 0 0 0 0 0
0.0%0
2.7% 0.0% 0.0% 0.0% 0.0% 0.0% 0.0% 0.0% 0.0% 0.0% 0.0% 0.0%2 0 0 0 0 0 0 0 0 0 0 0
0.4% 0.0% 0.0% 0.0% 0.0% 0.0% 0.0% 0.0% 0.0% 0.0% 0.0% 0.0%1 0 0 0 0 0 0 0 0 0 0 0
0.0%0
0.0% 0.0% 0.0% 0.0% 0.0% 0.0% 0.0% 0.0% 0.0% 0.0% 0.0% 0.0%0 0 0 0 0 0 0 0 0 0 0 0
0.0% 0.0% 0.0% 0.0% 0.3% 0.0% 0.0% 0.0% 0.0% 0.6% 0.0% 0.0%0 0 0 0 1 0 0 0 0 2 0 0
0.0%0
0.3%1
0.0% 0.0% 0.0% 0.0% 0.0% 0.0% 0.0% 0.0% 0.0% 0.0% 0.0% 0.0%0 0 0 0 0 0 0 0 0 0 0 0
0.0% 0.0% 0.0% 0.0% 0.0% 0.0% 0.0% 0.0% 0.0% 0.0%0 0 0 0 0 0 0 0 0 0
0.4%1
0.3%1
Nalidixic Acid 1.6% 1.9% 2.2% 1.9% 2.4% 2.2% 2.1% 1.8% 2.0% 2.2% 2.4% 2.8% (MIC ≥ 32 µg/ml) 32 36 39 38 52 48 49 39 48 51 54 61
0.0% 1.2% 0.0% 0.7% 0.7% 0.0% 0.0% 0.4% 0.0% 0.0% 0.0% 0.0%0 1 0 1 1 0 0 1 0 0 0 0
0.8% 0.4% 0.5% 0.3% 0.1% 0.1% 0.0% 0.0% 0.0% 0.0% 0.1% 0.0%12 5 6 6 2 1 0 0 0 0 1 0
0.0%0
8.1% 4.4% 0.0% 1.1% 0.0% 2.6% 0.4% 0.0% 0.5% 0.0% 0.0% 0.0%6 5 0 2 0 5 1 0 1 0 0 0
5.3% 3.8% 2.1% 2.2% 0.7% 1.1% 0.7% 0.8% 0.7% 0.0% 1.7% 1.1%13 10 5 5 2 3 1 1 1 0 3 1
0.0%0
0.0% 0.0% 0.0% 0.0% 0.0% 0.0% 0.0% 14.3% 0.0% 0.0% 0.0% 0.0%0 0 0 0 0 0 0 2 0 0 0 0
0.4% 0.4% 2.0% 1.5% 0.5% 0.7% 0.7% 1.0% 2.8% 1.8% 3.6% 2.3%4 3 12 5 2 3 3 2 7 6 10 7
1.6%2
0.3%1
0.0% 0.0% 0.0% 0.0% 0.0% 0.0% 0.0% 0.0% 0.0% 0.0% 0.0% 0.0%0 0 0 0 0 0 0 0 0 0 0 0
0.3% 0.0% 0.0% 0.3% 0.0% 0.0% 0.0% 0.0% 0.0% 0.0%1 0 0 1 0 0 0 0 0 0
1.2%3
0.7%2
Tetracycline 14.9% 16.3% 13.6% 13.9% 13.5% 14.5% 11.5% 11.9% 11.0% 10.5% 11.1% 12.6% (MIC ≥ 16 µg/ml) 298 302 242 282 293 310 275 261 270 245 247 275
33.3% 27.7% 46.5% 43.8% 46.7% 41.4% 46.5% 60.3% 56.7% 65.8% 48.5% 49.0%20 23 73 67 71 41 92 164 97 104 111 102
24.9% 26.2% 27.4% 28.3% 31.8% 35.5% 30.4% 33.9% 41.8% 40.9% 33.7% 42.7%374 303 351 563 439 353 190 187 236 201 291 222
38.1%21
55.4% 39.5% 56.3% 39.9% 56.0% 67.4% 66.3% 64.8% 54.0% 64.8% 45.1% 62.3%41 45 80 73 89 128 163 125 109 105 41 66
54.5% 58.8% 48.3% 54.6% 61.8% 73.8% 64.2% 63.6% 57.6% 45.6% 46.3% 43.7%133 154 114 124 188 200 95 77 87 47 81 38
46.4%13
22.2% 40.0% 14.3% 12.5% 21.1% 0.0% 20.8% 42.9% 42.9% 44.4% 23.1% 46.7%4 4 2 1 4 0 5 6 3 4 3 7
32.0% 36.9% 31.8% 34.0% 30.3% 27.3% 29.3% 29.0% 33.6% 30.6% 28.9% 24.8%323 247 193 112 118 120 130 58 83 104 81 77
29.0%36
12.3%38
70.0% 80.0% 54.5% 55.6% 25.0% 50.0% 34.8% 37.5% 45.0% 39.3% 41.7% 45.8%7 4 6 5 2 9 8 3 9 11 5 11
57.8% 43.1% 58.8% 54.8% 62.8% 54.5% 51.4% 53.3% 51.4% 41.1%219 91 181 165 191 115 57 64 57 37
31.2%81
24.6%71
1 In 2012 and 2013, FSIS did not sample products for Salmonella because in prior years the percent of pork carcass samples positive for Salmonella was consistently low
Cecal (Market Hogs)
Cecal (Sows)
Cecal (Beef)
Cecal (Dairy)
Swin
e
Retail Pork Chops
HACCP
Cat
tle
Retail Ground Beef
HACCP
Cecal
Turk
eys
Retail Ground Turkey
HACCP
HACCP
Tetracyclines Humans
Chi
cken
s Retail Chickens
Cecal
Cecal (Dairy)
Swin
e
Retail Pork Chops
HACCP
Cecal (Market Hogs)
Cecal (Sows)
Cat
tle HACCP
Cecal (Beef)
Retail Ground Beef
Cecal
Turk
eys
Retail Ground Turkey
HACCP
Cecal
Humans
Chi
cken
s Retail Chickens
Swin
e
Retail Pork Chops
HACCP
Cecal (Market Hogs)
Cecal (Sows)
HACCP
Cat
tle
Retail Ground Beef
Turk
eys
Retail Ground Turkey
HACCP
Cecal
Chi
cken
s
HACCP
Cecal (Beef)
Cecal (Dairy)
HACCP
Cecal
Retail Chickens
Table 14e. Antimicrobial Resistance among all Non-Typhoidal Salmonella Isolates, 2002-2013
Chi
cken
sTu
rkey
sC
attle
Swin
e
Humans
26
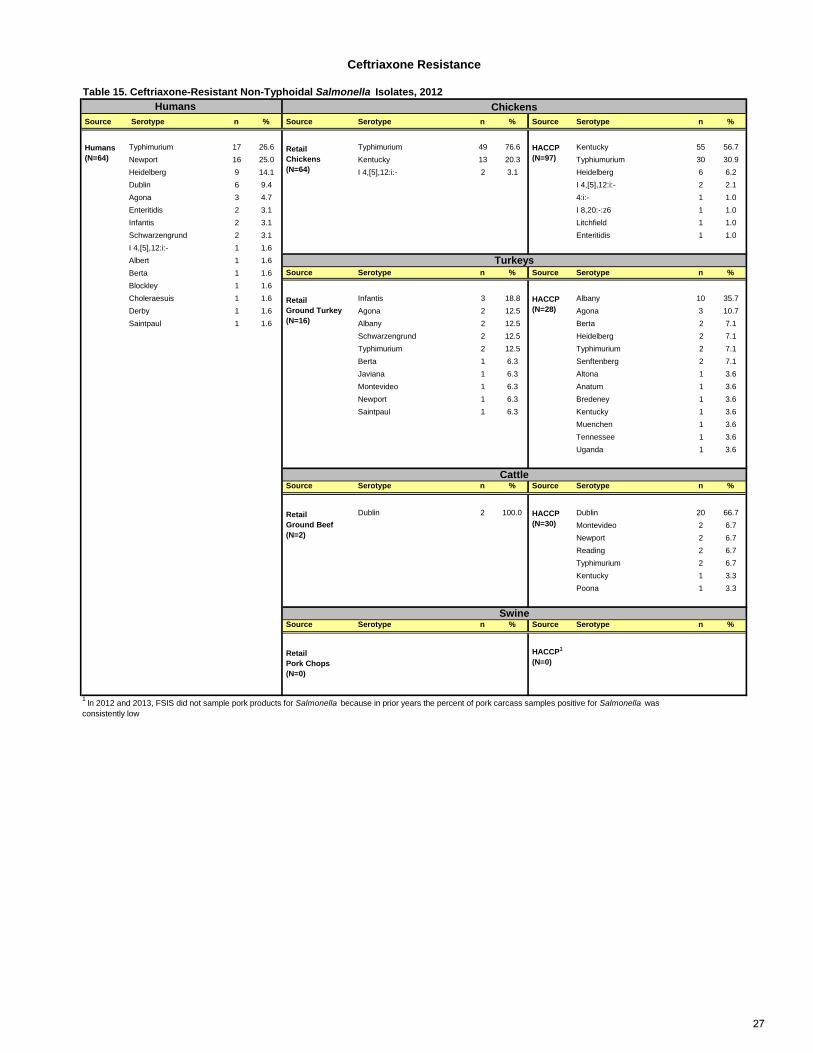
Humans Source Serotype n % Source Serotype n % Source Serotype n %
Typhimurium 17 26.6 Typhimurium 49 76.6 Kentucky 55 56.7Newport 16 25.0 Kentucky 13 20.3 Typhiumurium 30 30.9Heidelberg 9 14.1 I 4,[5],12:i:- 2 3.1 Heidelberg 6 6.2Dublin 6 9.4 I 4,[5],12:i:- 2 2.1Agona 3 4.7 4:i:- 1 1.0Enteritidis 2 3.1 I 8,20:-:z6 1 1.0Infantis 2 3.1 Litchfield 1 1.0Schwarzengrund 2 3.1 Enteritidis 1 1.0I 4,[5],12:i:- 1 1.6Albert 1 1.6Berta 1 1.6 Source Serotype n % Source Serotype n %Blockley 1 1.6Choleraesuis 1 1.6 Infantis 3 18.8 Albany 10 35.7Derby 1 1.6 Agona 2 12.5 Agona 3 10.7Saintpaul 1 1.6 Albany 2 12.5 Berta 2 7.1
Schwarzengrund 2 12.5 Heidelberg 2 7.1Typhimurium 2 12.5 Typhimurium 2 7.1Berta 1 6.3 Senftenberg 2 7.1Javiana 1 6.3 Altona 1 3.6Montevideo 1 6.3 Anatum 1 3.6Newport 1 6.3 Bredeney 1 3.6Saintpaul 1 6.3 Kentucky 1 3.6
Muenchen 1 3.6Tennessee 1 3.6Uganda 1 3.6
Source Serotype n % Source Serotype n %
Dublin 2 100.0 Dublin 20 66.7Montevideo 2 6.7Newport 2 6.7Reading 2 6.7Typhimurium 2 6.7Kentucky 1 3.3Poona 1 3.3
Source Serotype n % Source Serotype n %
Humans (N=64)
HACCP (N=97)
Retail Chickens (N=64)
Turkeys
Retail Ground Turkey (N=16)
HACCP (N=28)
Cattle
Retail Ground Beef (N=2)
HACCP (N=30)
ChickensTable 15. Ceftriaxone-Resistant Non-Typhoidal Salmonella Isolates, 2012
Retail Pork Chops (N=0)
HACCP1
(N=0)
1 In 2012 and 2013, FSIS did not sample pork products for Salmonella because in prior years the percent of pork carcass samples positive for Salmonella was consistently low
Swine
Ceftriaxone Resistance
27
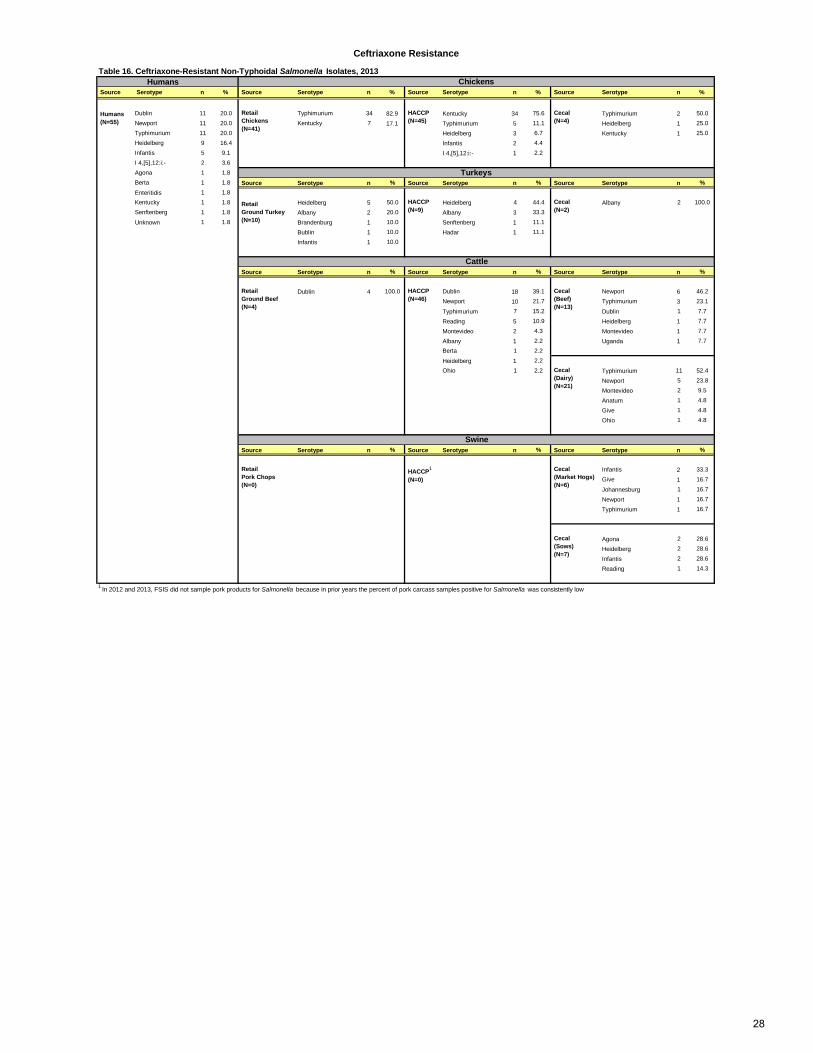
Humans Source Serotype n % Source Serotype n % Source Serotype n % Source Serotype n %
Dublin 11 20.0 Typhimurium 34 82.9 Kentucky 34 75.6 Typhimurium 2 50.0Newport 11 20.0 Kentucky 7 17.1 Typhimurium 5 11.1 Heidelberg 1 25.0Typhimurium 11 20.0 Heidelberg 3 6.7 Kentucky 1 25.0Heidelberg 9 16.4 Infantis 2 4.4Infantis 5 9.1 I 4,[5],12:i:- 1 2.2I 4,[5],12:i:- 2 3.6Agona 1 1.8Berta 1 1.8 Source Serotype n % Source Serotype n % Source Serotype n %Enteritidis 1 1.8Kentucky 1 1.8 Heidelberg 5 50.0 Heidelberg 4 44.4 Albany 2 100.0Senftenberg 1 1.8 Albany 2 20.0 Albany 3 33.3
Unknown 1 1.8 Brandenburg 1 10.0 Senftenberg 1 11.1
Bublin 1 10.0 Hadar 1 11.1
Infantis 1 10.0
Source Serotype n % Source Serotype n % Source Serotype n %
Dublin 4 100.0 Dublin 18 39.1 Newport 6 46.2Newport 10 21.7 Typhimurium 3 23.1
Typhimurium 7 15.2 Dublin 1 7.7
Reading 5 10.9 Heidelberg 1 7.7
Montevideo 2 4.3 Montevideo 1 7.7
Albany 1 2.2 Uganda 1 7.7Berta 1 2.2
Heidelberg 1 2.2Ohio 1 2.2 Typhimurium 11 52.4
Newport 5 23.8
Montevideo 2 9.5
Anatum 1 4.8
Give 1 4.8
Ohio 1 4.8
Source Serotype n % Source Serotype n % Source Serotype n %
Infantis 2 33.3Give 1 16.7
Johannesburg 1 16.7
Newport 1 16.7
Typhimurium 1 16.7
Agona 2 28.6
Heidelberg 2 28.6
Infantis 2 28.6
Reading 1 14.3
Humans (N=55)
Retail Chickens (N=41)
HACCP (N=45)
Cecal (N=4)
Turkeys
Retail Ground Turkey (N=10)
HACCP (N=9)
Cecal (N=2)
1 In 2012 and 2013, FSIS did not sample pork products for Salmonella because in prior years the percent of pork carcass samples positive for Salmonella was consistently low
Cecal (Sows) (N=7)
Ceftriaxone Resistance
Table 16. Ceftriaxone-Resistant Non-Typhoidal Salmonella Isolates, 2013
Cecal (Dairy) (N=21)
Retail Ground Beef (N=4)
HACCP (N=46)
Cecal (Beef) (N=13)
Swine
Retail Pork Chops (N=0)
HACCP1
(N=0)
Cecal (Market Hogs) (N=6)
Cattle
Chickens
28
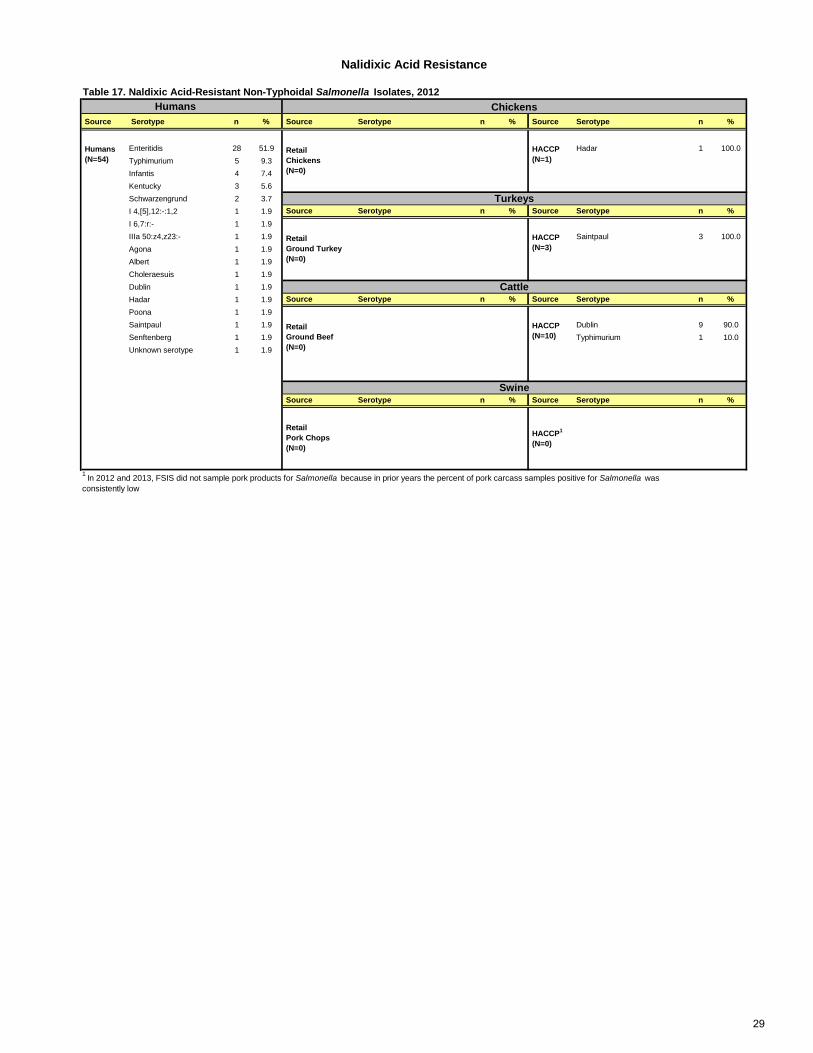
Humans Source Serotype n % Source Serotype n % Source Serotype n %
Enteritidis 28 51.9 Hadar 1 100.0Typhimurium 5 9.3Infantis 4 7.4 Kentucky 3 5.6Schwarzengrund 2 3.7I 4,[5],12:-:1,2 1 1.9 Source Serotype n % Source Serotype n %I 6,7:r:- 1 1.9IIIa 50:z4,z23:- 1 1.9 Saintpaul 3 100.0Agona 1 1.9Albert 1 1.9Choleraesuis 1 1.9Dublin 1 1.9Hadar 1 1.9 Source Serotype n % Source Serotype n %Poona 1 1.9Saintpaul 1 1.9 Dublin 9 90.0Senftenberg 1 1.9 Typhimurium 1 10.0Unknown serotype 1 1.9
Source Serotype n % Source Serotype n %
Nalidixic Acid Resistance
Chickens
Humans (N=54)
Retail Chickens (N=0)
HACCP (N=1)
Table 17. Naldixic Acid-Resistant Non-Typhoidal Salmonella Isolates, 2012
Turkeys
Retail Ground Turkey (N=0)
HACCP (N=3)
Cattle
Retail Ground Beef (N=0)
HACCP (N=10)
Swine
Retail Pork Chops (N=0)
HACCP1
(N=0)
1 In 2012 and 2013, FSIS did not sample pork products for Salmonella because in prior years the percent of pork carcass samples positive for Salmonella was consistently low
29
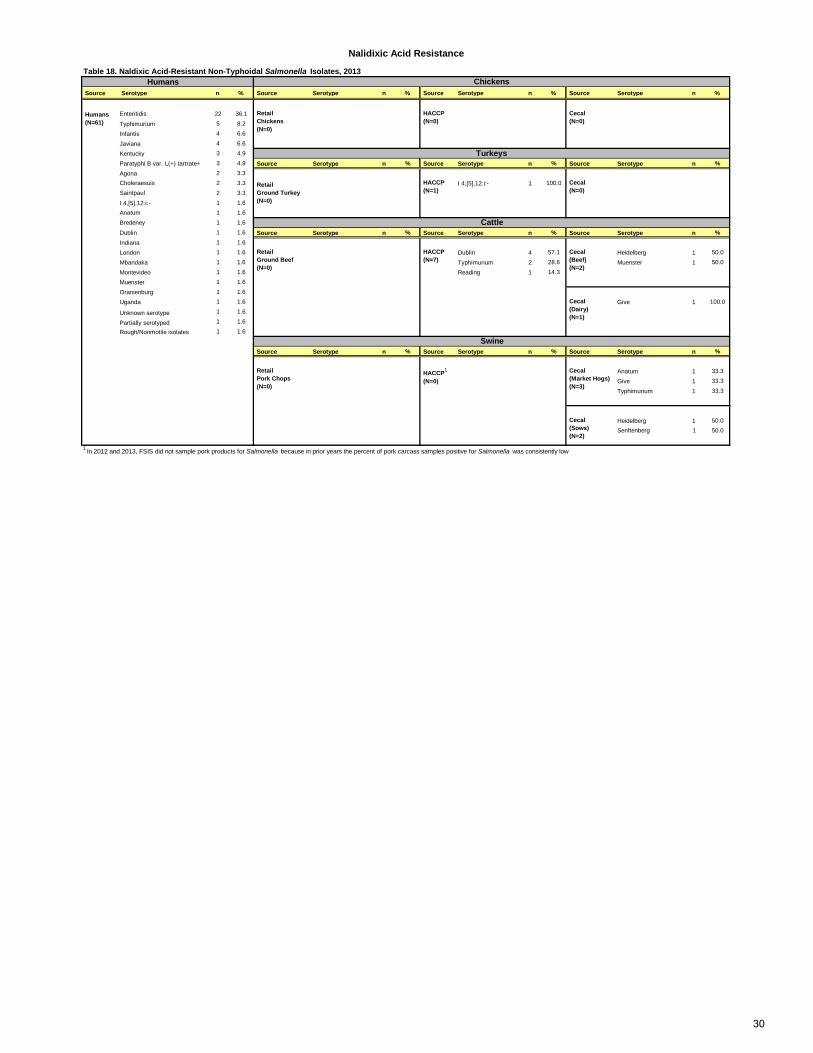
Humans Source Serotype n % Source Serotype n % Source Serotype n % Source Serotype n %
Enteritidis 22 36.1
Typhimurium 5 8.2
Infantis 4 6.6
Javiana 4 6.6
Kentucky 3 4.9
Paratyphi B var. L(+) tartrate+ 3 4.9 Source Serotype n % Source Serotype n % Source Serotype n %Agona 2 3.3Choleraesuis 2 3.3 I 4,[5],12:i:- 1 100.0Saintpaul 2 3.3
I 4,[5],12:i:- 1 1.6Anatum 1 1.6Bredeney 1 1.6
Dublin 1 1.6 Source Serotype n % Source Serotype n % Source Serotype n %Indiana 1 1.6
London 1 1.6 Dublin 4 57.1 Heidelberg 1 50.0
Mbandaka 1 1.6 Typhimurium 2 28.6 Muenster 1 50.0
Montevideo 1 1.6 Reading 1 14.3
Muenster 1 1.6
Oranienburg 1 1.6
Uganda 1 1.6 Give 1 100.0
Unknown serotype 1 1.6
Partially serotyped 1 1.6
Rough/Nonmotile isolates 1 1.6
Source Serotype n % Source Serotype n % Source Serotype n %
Anatum 1 33.3
Give 1 33.3
Typhimurium 1 33.3
Heidelberg 1 50.0Senftenberg 1 50.0
Cattle
Nalidixic Acid Resistance
Table 18. Naldixic Acid-Resistant Non-Typhoidal Salmonella Isolates, 2013Chickens
Humans (N=61)
Retail Chickens (N=0)
HACCP (N=0)
Cecal (N=0)
Turkeys
Retail Ground Turkey (N=0)
HACCP (N=1)
Cecal (N=0)
Cecal (Sows) (N=2)
1 In 2012 and 2013, FSIS did not sample pork products for Salmonella because in prior years the percent of pork carcass samples positive for Salmonella was consistently low
Retail Ground Beef (N=0)
HACCP (N=7)
Cecal (Beef) (N=2)
Cecal (Dairy) (N=1)
Swine
Retail Pork Chops (N=0)
HACCP1
(N=0)
Cecal (Market Hogs) (N=3)
30
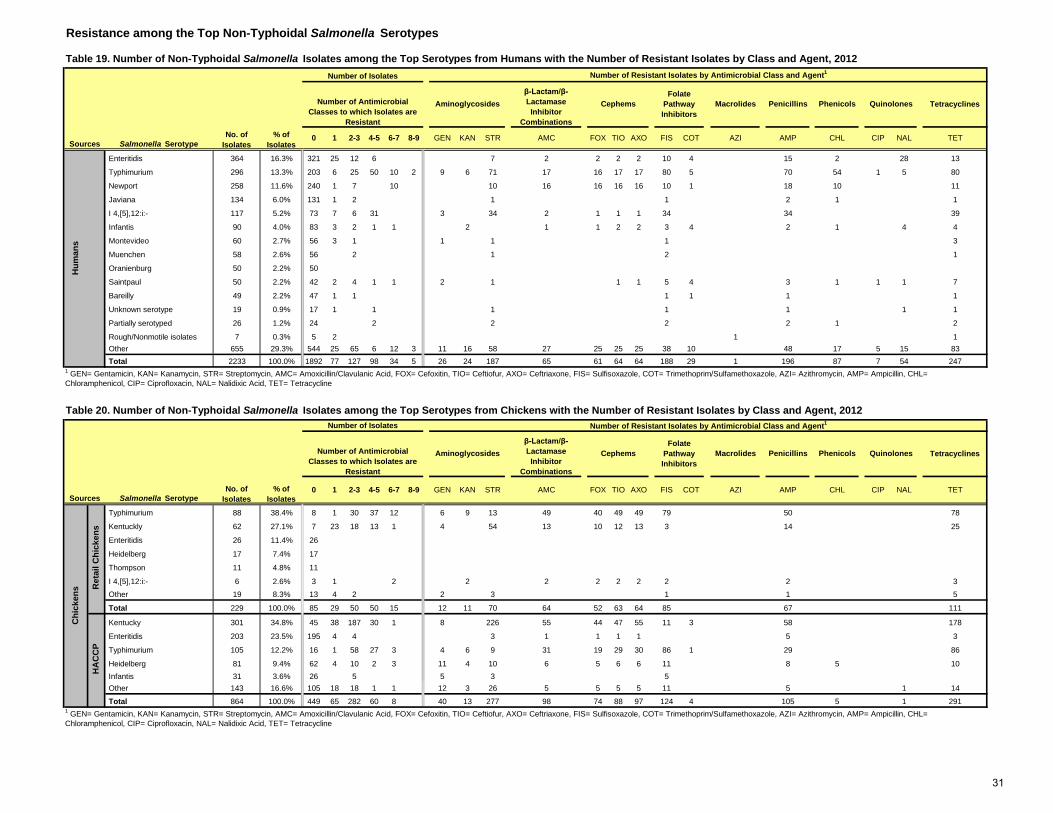
Resistance among the Top Non-Typhoidal Salmonella Serotypes
Table 19. Number of Non-Typhoidal Salmonella Isolates among the Top Serotypes from Humans with the Number of Resistant Isolates by Class and Agent, 2012
Enteritidis 364 16.3% 321 25 12 6 7 2 2 2 2 10 4 15 2 28 13
Typhimurium 296 13.3% 203 6 25 50 10 2 9 6 71 17 16 17 17 80 5 70 54 1 5 80
Newport 258 11.6% 240 1 7 10 10 16 16 16 16 10 1 18 10 11
Javiana 134 6.0% 131 1 2 1 1 2 1 1
I 4,[5],12:i:- 117 5.2% 73 7 6 31 3 34 2 1 1 1 34 34 39
Infantis 90 4.0% 83 3 2 1 1 2 1 1 2 2 3 4 2 1 4 4
Montevideo 60 2.7% 56 3 1 1 1 1 3
Muenchen 58 2.6% 56 2 1 2 1
Oranienburg 50 2.2% 50
Saintpaul 50 2.2% 42 2 4 1 1 2 1 1 1 5 4 3 1 1 1 7
Bareilly 49 2.2% 47 1 1 1 1 1 1
Unknown serotype 19 0.9% 17 1 1 1 1 1 1 1
Partially serotyped 26 1.2% 24 2 2 2 2 1 2
Rough/Nonmotile isolates 7 0.3% 5 2 1 1 Other 655 29.3% 544 25 65 6 12 3 11 16 58 27 25 25 25 38 10 48 17 5 15 83 Total 2233 100.0% 1892 77 127 98 34 5 26 24 187 65 61 64 64 188 29 1 196 87 7 54 247
Typhimurium 88 38.4% 8 1 30 37 12 6 9 13 49 40 49 49 79 50 78
Kentuckly 62 27.1% 7 23 18 13 1 4 54 13 10 12 13 3 14 25
Enteritidis 26 11.4% 26
Heidelberg 17 7.4% 17
Thompson 11 4.8% 11
I 4,[5],12:i:- 6 2.6% 3 1 2 2 2 2 2 2 2 2 3 Other 19 8.3% 13 4 2 2 3 1 1 5
Total 229 100.0% 85 29 50 50 15 12 11 70 64 52 63 64 85 67 111
Kentucky 301 34.8% 45 38 187 30 1 8 226 55 44 47 55 11 3 58 178
Enteritidis 203 23.5% 195 4 4 3 1 1 1 1 5 3
Typhimurium 105 12.2% 16 1 58 27 3 4 6 9 31 19 29 30 86 1 29 86
Heidelberg 81 9.4% 62 4 10 2 3 11 4 10 6 5 6 6 11 8 5 10 Infantis 31 3.6% 26 5 5 3 5 Other 143 16.6% 105 18 18 1 1 12 3 26 5 5 5 5 11 5 1 14
Total 864 100.0% 449 65 282 60 8 40 13 277 98 74 88 97 124 4 105 5 1 291
Cephems Macrolides Penicillins Phenicols Quinolones Tetracyclines
Sources Salmonella Serotype
Number of Isolates Number of Resistant Isolates by Antimicrobial Class and Agent1
No. of Isolates
% of Isolates
Number of Antimicrobial Classes to which Isolates are
Resistant
β-Lactam/β-Lactamase Inhibitor
Combinations
Folate Pathway Inhibitors
Aminoglycosides
CIP NAL TET
Hum
ans
1 GEN= Gentamicin, KAN= Kanamycin, STR= Streptomycin, AMC= Amoxicillin/Clavulanic Acid, FOX= Cefoxitin, TIO= Ceftiofur, AXO= Ceftriaxone, FIS= Sulfisoxazole, COT= Trimethoprim/Sulfamethoxazole, AZI= Azithromycin, AMP= Ampicillin, CHL= Chloramphenicol, CIP= Ciprofloxacin, NAL= Nalidixic Acid, TET= Tetracycline
Table 20. Number of Non-Typhoidal Salmonella Isolates among the Top Serotypes from Chickens with the Number of Resistant Isolates by Class and Agent, 2012
AXO FIS COT AZI AMP CHLGEN KAN STR AMC FOX TIO0 1 2-3 4-5 6-7 8-9
Cephems Macrolides Penicillins Phenicols Quinolones Tetracyclines
Sources Salmonella Serotype
Number of Isolates Number of Resistant Isolates by Antimicrobial Class and Agent1
No. of Isolates
% of Isolates
Number of Antimicrobial Classes to which Isolates are
Resistant
β-Lactam/β-Lactamase Inhibitor
Combinations
Folate Pathway Inhibitors
Aminoglycosides
CIP NAL TET
Chi
cken
s Ret
ail C
hick
ens
HA
CC
P
AXO FIS COT AZI AMP CHLGEN KAN STR AMC FOX TIO0 1 2-3 4-5 6-7 8-9
1 GEN= Gentamicin, KAN= Kanamycin, STR= Streptomycin, AMC= Amoxicillin/Clavulanic Acid, FOX= Cefoxitin, TIO= Ceftiofur, AXO= Ceftriaxone, FIS= Sulfisoxazole, COT= Trimethoprim/Sulfamethoxazole, AZI= Azithromycin, AMP= Ampicillin, CHL= Chloramphenicol, CIP= Ciprofloxacin, NAL= Nalidixic Acid, TET= Tetracycline
31

IIIa 18:z4,z23:- 16 17.6% 16 Saintpaul 9 9.9% 1 8 4 4 1 1 1 1 1 8 6 Typhimurium 9 9.9% 4 1 2 2 1 1 5 2 1 2 2 5 4 4 Hadar 8 8.8% 6 2 3 8 3 2 7 Agona 7 7.7% 6 1 5 1 5 2 2 2 2 6 3 1 Schwarzengrund 7 7.7% 2 1 2 2 2 2 2 2 2 2 2 3 Heidelberg 5 5.5% 4 1 5 4 1 5 5 Enteritidis 4 4.4% 3 1 1 1 Reading 4 4.4% 3 1 1 1 1 1 Infantis 3 3.3% 3 3 3 3 3 3 3 3 3 3 3 3 Albany 2 2.2% 2 2 2 2 2 2 Anatum 2 2.2% 2 2 2 2 2 Brandenburg 2 2.2% 1 1 1 1 1 1 Newport 2 2.2% 1 1 1 1 1 1 1 1 1 1 1 1 Senftenberg 2 2.2% 2 1 1 1 1 1 Other 9 9.9% 1 2 5 1 1 2 3 2 2 3 3 3 5
Total 91 100.0% 32 3 41 8 7 24 12 40 16 14 15 16 25 37 3 41
Hadar 31 17.7% 1 1 29 1 1 29 1 10 30 Heidelberg 19 10.9% 5 2 9 2 1 11 6 12 2 2 2 2 4 11 11 Albany 15 8.6% 4 1 9 1 1 9 9 9 10 10 1 Saintpaul 11 6.3% 2 5 4 9 2 7 4 9 3 6 Schwarzengrund 11 6.3% 7 2 2 0 1 1 2 4 Senftenberg 11 6.3% 2 7 1 1 7 3 2 2 2 2 2 1 9 1 Agona 10 5.7% 2 7 1 3 1 2 3 3 3 3 6 4 3 Muenchen 10 5.7% 7 3 1 1 1 1 2 1 2 Other 57 32.5% 21 6 20 8 2 11 7 14 10 9 9 10 19 1 20 2 23
Total 175 100.0% 51 12 91 16 5 43 21 67 27 26 26 28 39 1 74 2 3 81
Table 21. Number of Non-Typhoidal Salmonella Isolates among the Top Serotypes from Turkeys with the Number of Resistant Isolates by Class and Agent, 2012
Sources Salmonella Serotype
Number of Isolates Number of Resistant Isolates by Antimicrobial Class and Agent1
No. of Isolates
% of Isolates
Number of Antimicrobial Classes to which Isolates are
Resistant
β-Lactam/β-Lactamase Inhibitor
Combinations
Quinolones Tetracyclines
0 1 2-3 4-5 6-7 8-9 GEN KAN
Folate Pathway Inhibitors
Aminoglycosides Cephems Macrolides Penicillins Phenicols
TET
Turk
eys
Ret
ail G
roun
d Tu
rkey
HA
CC
P
1 GEN= Gentamicin, KAN= Kanamycin, STR= Streptomycin, AMC= Amoxicillin/Clavulanic Acid, FOX= Cefoxitin, TIO= Ceftiofur, AXO= Ceftriaxone, FIS= Sulfisoxazole, COT= Trimethoprim/Sulfamethoxazole, AZI= Azithromycin, AMP= Ampicillin, CHL= Chloramphenicol, CIP= Ciprofloxacin, NAL= Nalidixic Acid, TET= Tetracycline
COT AZI AMP CHL CIP NALSTR AMC FOX TIO AXO FIS
32
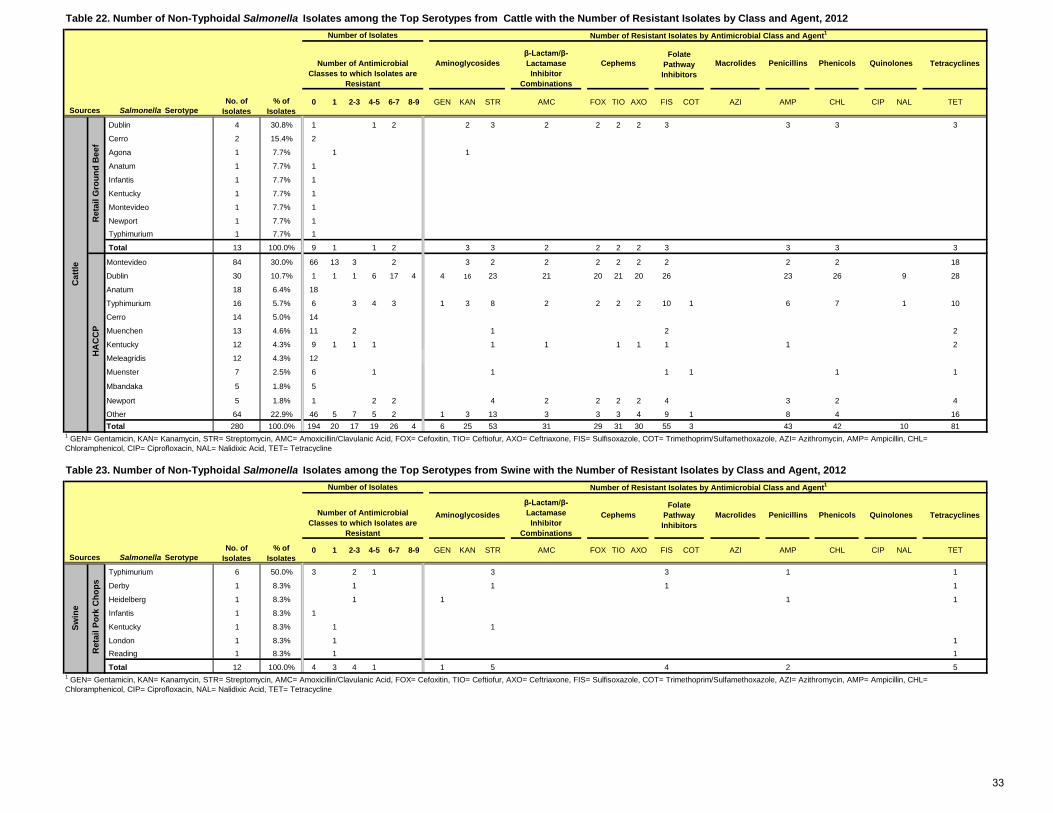
Dublin 4 30.8% 1 1 2 2 3 2 2 2 2 3 3 3 3
Cerro 2 15.4% 2
Agona 1 7.7% 1 1
Anatum 1 7.7% 1
Infantis 1 7.7% 1
Kentucky 1 7.7% 1
Montevideo 1 7.7% 1
Newport 1 7.7% 1 Typhimurium 1 7.7% 1
Total 13 100.0% 9 1 1 2 3 3 2 2 2 2 3 3 3 3
Montevideo 84 30.0% 66 13 3 2 3 2 2 2 2 2 2 2 2 18
Dublin 30 10.7% 1 1 1 6 17 4 4 16 23 21 20 21 20 26 23 26 9 28
Anatum 18 6.4% 18
Typhimurium 16 5.7% 6 3 4 3 1 3 8 2 2 2 2 10 1 6 7 1 10
Cerro 14 5.0% 14
Muenchen 13 4.6% 11 2 1 2 2
Kentucky 12 4.3% 9 1 1 1 1 1 1 1 1 1 2
Meleagridis 12 4.3% 12
Muenster 7 2.5% 6 1 1 1 1 1 1
Mbandaka 5 1.8% 5
Newport 5 1.8% 1 2 2 4 2 2 2 2 4 3 2 4
Other 64 22.9% 46 5 7 5 2 1 3 13 3 3 3 4 9 1 8 4 16Total 280 100.0% 194 20 17 19 26 4 6 25 53 31 29 31 30 55 3 43 42 10 81
Typhimurium 6 50.0% 3 2 1 3 3 1 1
Derby 1 8.3% 1 1 1 1
Heidelberg 1 8.3% 1 1 1 1
Infantis 1 8.3% 1
Kentucky 1 8.3% 1 1
London 1 8.3% 1 1 Reading 1 8.3% 1 1
Total 12 100.0% 4 3 4 1 1 5 4 2 5
Table 22. Number of Non-Typhoidal Salmonella Isolates among the Top Serotypes from Cattle with the Number of Resistant Isolates by Class and Agent, 2012
Cephems Macrolides Penicillins Phenicols Quinolones Tetracyclines
Sources Salmonella Serotype
Number of Isolates Number of Resistant Isolates by Antimicrobial Class and Agent1
No. of Isolates
% of Isolates
Number of Antimicrobial Classes to which Isolates are
Resistant
β-Lactam/β-Lactamase Inhibitor
Combinations
Folate Pathway Inhibitors
Aminoglycosides
CIP NAL TET
Cat
tle
Ret
ail G
roun
d B
eef
HA
CC
PAXO FIS COT AZI AMP CHLGEN KAN STR AMC FOX TIO0 1 2-3 4-5 6-7 8-9
1 GEN= Gentamicin, KAN= Kanamycin, STR= Streptomycin, AMC= Amoxicillin/Clavulanic Acid, FOX= Cefoxitin, TIO= Ceftiofur, AXO= Ceftriaxone, FIS= Sulfisoxazole, COT= Trimethoprim/Sulfamethoxazole, AZI= Azithromycin, AMP= Ampicillin, CHL= Chloramphenicol, CIP= Ciprofloxacin, NAL= Nalidixic Acid, TET= Tetracycline
Table 23. Number of Non-Typhoidal Salmonella Isolates among the Top Serotypes from Swine with the Number of Resistant Isolates by Class and Agent, 2012
Sources Salmonella Serotype
Number of Isolates Number of Resistant Isolates by Antimicrobial Class and Agent1
No. of Isolates
% of Isolates
Number of Antimicrobial Classes to which Isolates are
Resistant
β-Lactam/β-Lactamase Inhibitor
Combinations
Quinolones Tetracyclines
0 1 2-3 4-5 6-7 8-9 GEN KAN
Folate Pathway Inhibitors
Aminoglycosides Cephems Macrolides Penicillins Phenicols
TET
Swin
e
Ret
ail P
ork
Cho
ps
1 GEN= Gentamicin, KAN= Kanamycin, STR= Streptomycin, AMC= Amoxicillin/Clavulanic Acid, FOX= Cefoxitin, TIO= Ceftiofur, AXO= Ceftriaxone, FIS= Sulfisoxazole, COT= Trimethoprim/Sulfamethoxazole, AZI= Azithromycin, AMP= Ampicillin, CHL= Chloramphenicol, CIP= Ciprofloxacin, NAL= Nalidixic Acid, TET= Tetracycline
COT AZI AMP CHL CIP NALSTR AMC FOX TIO AXO FIS
33
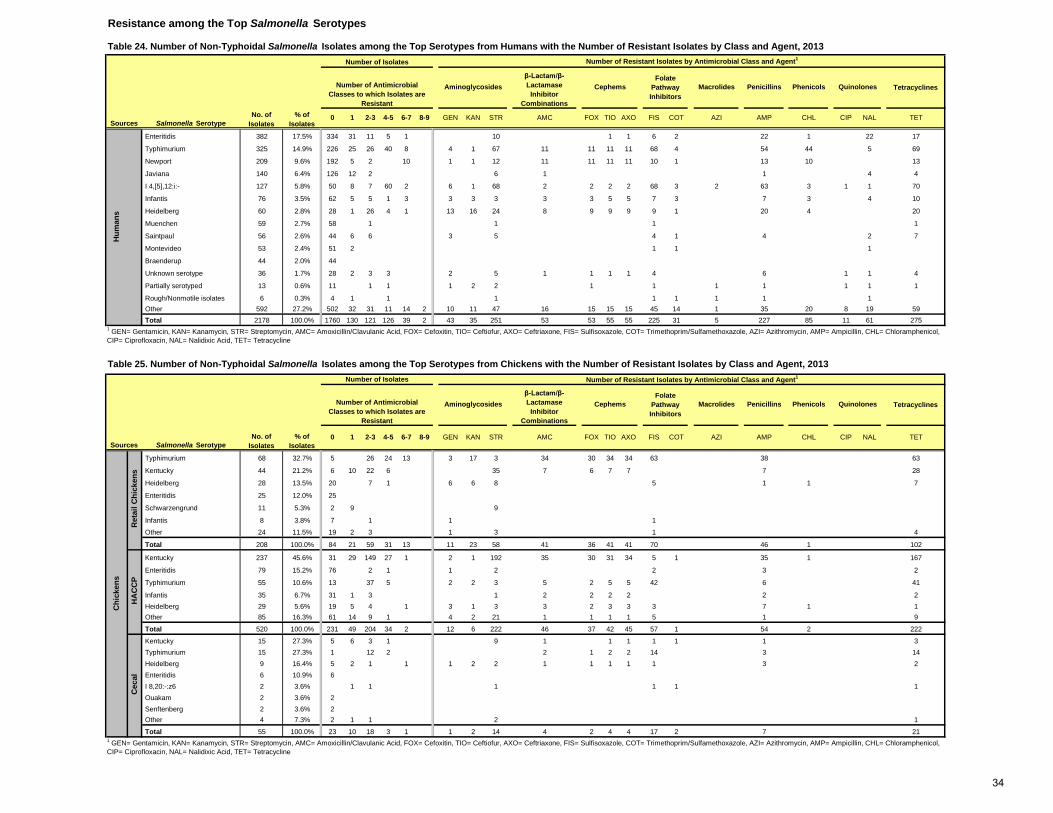
Resistance among the Top Salmonella Serotypes
Table 24. Number of Non-Typhoidal Salmonella Isolates among the Top Serotypes from Humans with the Number of Resistant Isolates by Class and Agent, 2013
Enteritidis 382 17.5% 334 31 11 5 1 10 1 1 6 2 22 1 22 17
Typhimurium 325 14.9% 226 25 26 40 8 4 1 67 11 11 11 11 68 4 54 44 5 69
Newport 209 9.6% 192 5 2 10 1 1 12 11 11 11 11 10 1 13 10 13
Javiana 140 6.4% 126 12 2 6 1 1 4 4
I 4,[5],12:i:- 127 5.8% 50 8 7 60 2 6 1 68 2 2 2 2 68 3 2 63 3 1 1 70
Infantis 76 3.5% 62 5 5 1 3 3 3 3 3 3 5 5 7 3 7 3 4 10
Heidelberg 60 2.8% 28 1 26 4 1 13 16 24 8 9 9 9 9 1 20 4 20
Muenchen 59 2.7% 58 1 1 1 1
Saintpaul 56 2.6% 44 6 6 3 5 4 1 4 2 7
Montevideo 53 2.4% 51 2 1 1 1
Braenderup 44 2.0% 44
Unknown serotype 36 1.7% 28 2 3 3 2 5 1 1 1 1 4 6 1 1 4
Partially serotyped 13 0.6% 11 1 1 1 2 2 1 1 1 1 1 1 1
Rough/Nonmotile isolates 6 0.3% 4 1 1 1 1 1 1 1 1 Other 592 27.2% 502 32 31 11 14 2 10 11 47 16 15 15 15 45 14 1 35 20 8 19 59 Total 2178 100.0% 1760 130 121 126 39 2 43 35 251 53 53 55 55 225 31 5 227 85 11 61 275
Typhimurium 68 32.7% 5 26 24 13 3 17 3 34 30 34 34 63 38 63
Kentucky 44 21.2% 6 10 22 6 35 7 6 7 7 7 28
Heidelberg 28 13.5% 20 7 1 6 6 8 5 1 1 7
Enteritidis 25 12.0% 25
Schwarzengrund 11 5.3% 2 9 9
Infantis 8 3.8% 7 1 1 1
Other 24 11.5% 19 2 3 1 3 1 4
Total 208 100.0% 84 21 59 31 13 11 23 58 41 36 41 41 70 46 1 102
Kentucky 237 45.6% 31 29 149 27 1 2 1 192 35 30 31 34 5 1 35 1 167
Enteritidis 79 15.2% 76 2 1 1 2 2 3 2
Typhimurium 55 10.6% 13 37 5 2 2 3 5 2 5 5 42 6 41
Infantis 35 6.7% 31 1 3 1 2 2 2 2 2 2 Heidelberg 29 5.6% 19 5 4 1 3 1 3 3 2 3 3 3 7 1 1 Other 85 16.3% 61 14 9 1 4 2 21 1 1 1 1 5 1 9
Total 520 100.0% 231 49 204 34 2 12 6 222 46 37 42 45 57 1 54 2 222
Kentucky 15 27.3% 5 6 3 1 9 1 1 1 1 1 1 3 Typhimurium 15 27.3% 1 12 2 2 1 2 2 14 3 14 Heidelberg 9 16.4% 5 2 1 1 1 2 2 1 1 1 1 1 3 2 Enteritidis 6 10.9% 6 I 8,20:-:z6 2 3.6% 1 1 1 1 1 1 Ouakam 2 3.6% 2 Senftenberg 2 3.6% 2 Other 4 7.3% 2 1 1 2 1
Total 55 100.0% 23 10 18 3 1 1 2 14 4 2 4 4 17 2 7 21
TETH
uman
s
1 GEN= Gentamicin, KAN= Kanamycin, STR= Streptomycin, AMC= Amoxicillin/Clavulanic Acid, FOX= Cefoxitin, TIO= Ceftiofur, AXO= Ceftriaxone, FIS= Sulfisoxazole, COT= Trimethoprim/Sulfamethoxazole, AZI= Azithromycin, AMP= Ampicillin, CHL= Chloramphenicol, CIP= Ciprofloxacin, NAL= Nalidixic Acid, TET= Tetracycline
Table 25. Number of Non-Typhoidal Salmonella Isolates among the Top Serotypes from Chickens with the Number of Resistant Isolates by Class and Agent, 2013
AXO CHLGEN KAN STR AMC FOX TIO0 1 2-3 4-5 6-7 8-9
Cephems
CIP NALFIS COT AZI AMP
Phenicols Quinolones Tetracyclines
Cephems Macrolides Penicillins Phenicols Quinolones Tetracyclines
Sources Salmonella Serotype
Number of Isolates Number of Resistant Isolates by Antimicrobial Class and Agent1
No. of Isolates
% of Isolates
Number of Antimicrobial Classes to which Isolates are
Resistant
β-Lactam/β-Lactamase
Inhibitor Combinations
Folate Pathway Inhibitors
Aminoglycosides
Number of Resistant Isolates by Antimicrobial Class and Agent1
No. of Isolates
% of Isolates
Number of Antimicrobial Classes to which Isolates are
Resistant
β-Lactam/β-Lactamase
Inhibitor Combinations
Folate Pathway Inhibitors
AMC FOX TIO0 1 2-3 4-5 6-7 8-9Sources Salmonella Serotype
Number of Isolates
1 GEN= Gentamicin, KAN= Kanamycin, STR= Streptomycin, AMC= Amoxicillin/Clavulanic Acid, FOX= Cefoxitin, TIO= Ceftiofur, AXO= Ceftriaxone, FIS= Sulfisoxazole, COT= Trimethoprim/Sulfamethoxazole, AZI= Azithromycin, AMP= Ampicillin, CHL= Chloramphenicol, CIP= Ciprofloxacin, NAL= Nalidixic Acid, TET= Tetracycline
Aminoglycosides
CIP NAL TETCHL
Macrolides Penicillins
Chi
cken
s
Ret
ail C
hick
ens
HA
CC
P C
ecal
AXO FIS COT AZI AMPGEN KAN STR
34
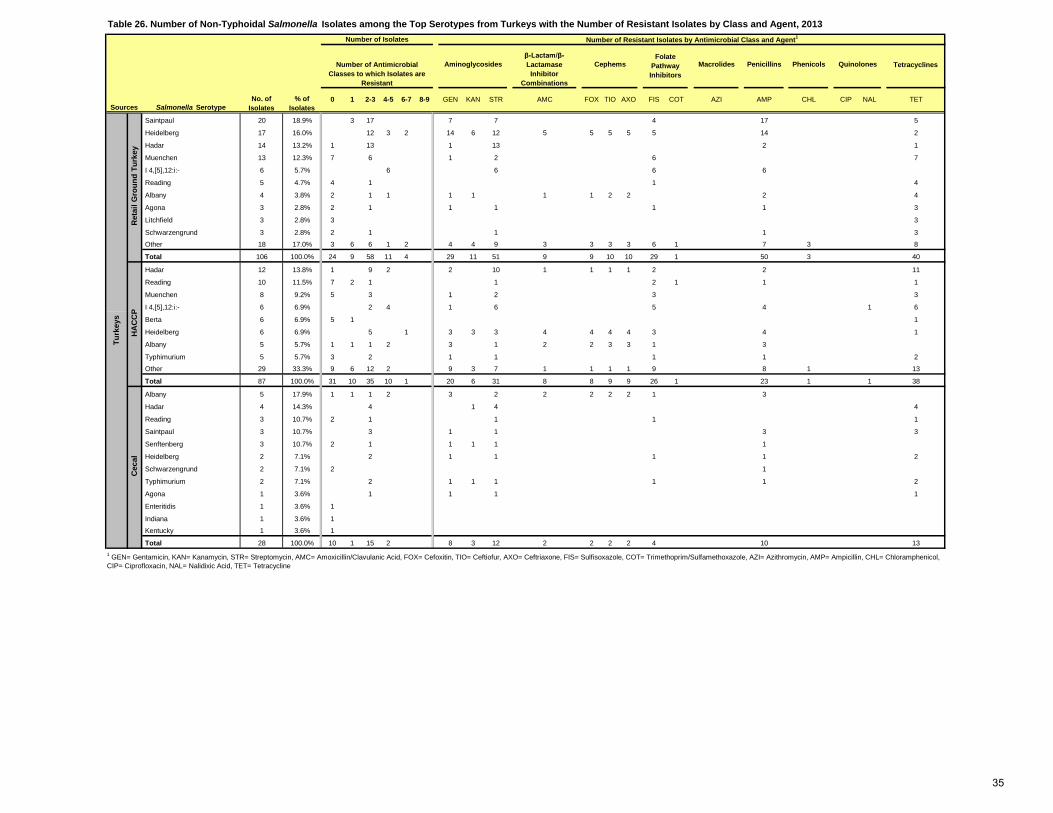
Saintpaul 20 18.9% 3 17 7 7 4 17 5
Heidelberg 17 16.0% 12 3 2 14 6 12 5 5 5 5 5 14 2
Hadar 14 13.2% 1 13 1 13 2 1
Muenchen 13 12.3% 7 6 1 2 6 7
I 4,[5],12:i:- 6 5.7% 6 6 6 6
Reading 5 4.7% 4 1 1 4
Albany 4 3.8% 2 1 1 1 1 1 1 2 2 2 4
Agona 3 2.8% 2 1 1 1 1 1 3
Litchfield 3 2.8% 3 3
Schwarzengrund 3 2.8% 2 1 1 1 3
Other 18 17.0% 3 6 6 1 2 4 4 9 3 3 3 3 6 1 7 3 8
Total 106 100.0% 24 9 58 11 4 29 11 51 9 9 10 10 29 1 50 3 40
Hadar 12 13.8% 1 9 2 2 10 1 1 1 1 2 2 11
Reading 10 11.5% 7 2 1 1 2 1 1 1
Muenchen 8 9.2% 5 3 1 2 3 3
I 4,[5],12:i:- 6 6.9% 2 4 1 6 5 4 1 6
Berta 6 6.9% 5 1 1
Heidelberg 6 6.9% 5 1 3 3 3 4 4 4 4 3 4 1
Albany 5 5.7% 1 1 1 2 3 1 2 2 3 3 1 3
Typhimurium 5 5.7% 3 2 1 1 1 1 2
Other 29 33.3% 9 6 12 2 9 3 7 1 1 1 1 9 8 1 13
Total 87 100.0% 31 10 35 10 1 20 6 31 8 8 9 9 26 1 23 1 1 38
Albany 5 17.9% 1 1 1 2 3 2 2 2 2 2 1 3
Hadar 4 14.3% 4 1 4 4
Reading 3 10.7% 2 1 1 1 1
Saintpaul 3 10.7% 3 1 1 3 3
Senftenberg 3 10.7% 2 1 1 1 1 1
Heidelberg 2 7.1% 2 1 1 1 1 2
Schwarzengrund 2 7.1% 2 1
Typhimurium 2 7.1% 2 1 1 1 1 1 2
Agona 1 3.6% 1 1 1 1
Enteritidis 1 3.6% 1
Indiana 1 3.6% 1
Kentucky 1 3.6% 1
Total 28 100.0% 10 1 15 2 8 3 12 2 2 2 2 4 10 13
Table 26. Number of Non-Typhoidal Salmonella Isolates among the Top Serotypes from Turkeys with the Number of Resistant Isolates by Class and Agent, 2013
β-Lactam/β-Lactamase
Inhibitor Combinations
Quinolones Tetracyclines
0 1 2-3 4-5 6-7 8-9 GEN KAN
Folate Pathway Inhibitors
Aminoglycosides Cephems Macrolides Penicillins Phenicols
TET
Turk
eys
Ret
ail G
roun
d Tu
rkey
HA
CC
P C
ecal
1 GEN= Gentamicin, KAN= Kanamycin, STR= Streptomycin, AMC= Amoxicillin/Clavulanic Acid, FOX= Cefoxitin, TIO= Ceftiofur, AXO= Ceftriaxone, FIS= Sulfisoxazole, COT= Trimethoprim/Sulfamethoxazole, AZI= Azithromycin, AMP= Ampicillin, CHL= Chloramphenicol, CIP= Ciprofloxacin, NAL= Nalidixic Acid, TET= Tetracycline
COT AZI AMP CHL CIP NALSTR AMC FOX TIO AXO FISSources Salmonella Serotype
Number of Isolates Number of Resistant Isolates by Antimicrobial Class and Agent1
No. of Isolates
% of Isolates
Number of Antimicrobial Classes to which Isolates are
Resistant
35
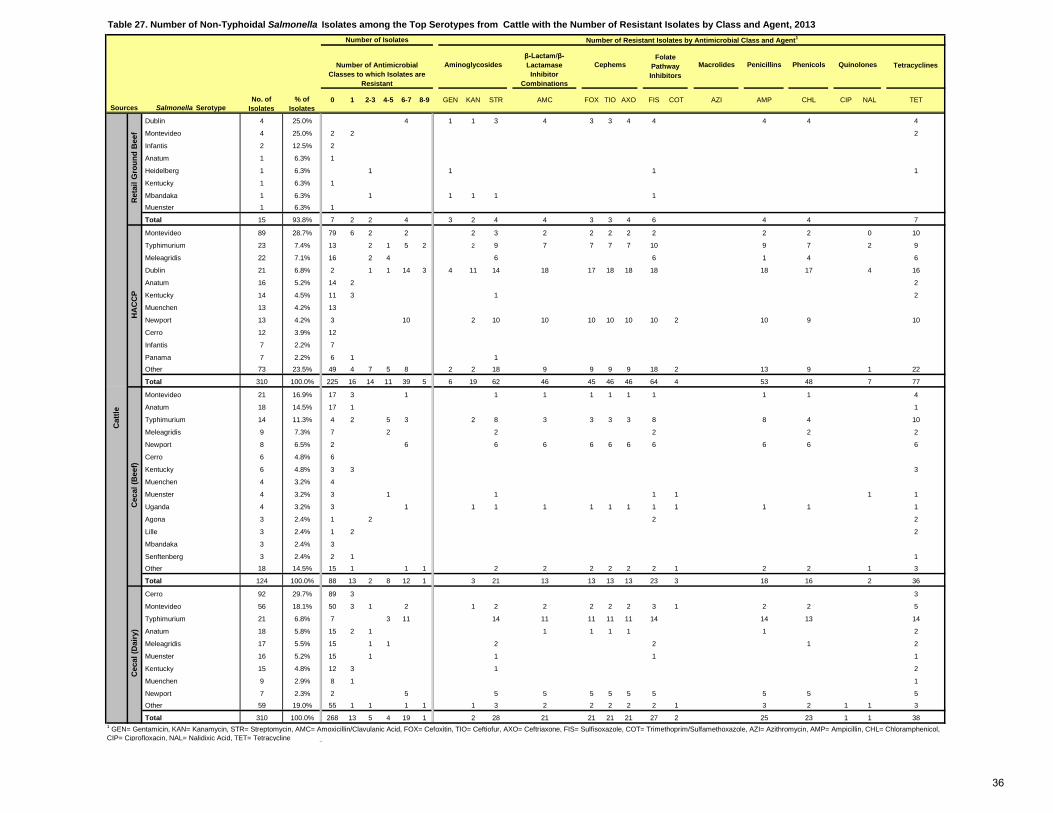
Dublin 4 25.0% 4 1 1 3 4 3 3 4 4 4 4 4
Montevideo 4 25.0% 2 2 2
Infantis 2 12.5% 2
Anatum 1 6.3% 1
Heidelberg 1 6.3% 1 1 1 1
Kentucky 1 6.3% 1
Mbandaka 1 6.3% 1 1 1 1 1
Muenster 1 6.3% 1
Total 15 93.8% 7 2 2 4 3 2 4 4 3 3 4 6 4 4 7
Montevideo 89 28.7% 79 6 2 2 2 3 2 2 2 2 2 2 2 0 10
Typhimurium 23 7.4% 13 2 1 5 2 2 9 7 7 7 7 10 9 7 2 9
Meleagridis 22 7.1% 16 2 4 6 6 1 4 6
Dublin 21 6.8% 2 1 1 14 3 4 11 14 18 17 18 18 18 18 17 4 16
Anatum 16 5.2% 14 2 2
Kentucky 14 4.5% 11 3 1 2
Muenchen 13 4.2% 13
Newport 13 4.2% 3 10 2 10 10 10 10 10 10 2 10 9 10
Cerro 12 3.9% 12
Infantis 7 2.2% 7
Panama 7 2.2% 6 1 1
Other 73 23.5% 49 4 7 5 8 2 2 18 9 9 9 9 18 2 13 9 1 22
Total 310 100.0% 225 16 14 11 39 5 6 19 62 46 45 46 46 64 4 53 48 7 77
Montevideo 21 16.9% 17 3 1 1 1 1 1 1 1 1 1 4
Anatum 18 14.5% 17 1 1
Typhimurium 14 11.3% 4 2 5 3 2 8 3 3 3 3 8 8 4 10
Meleagridis 9 7.3% 7 2 2 2 2 2
Newport 8 6.5% 2 6 6 6 6 6 6 6 6 6 6
Cerro 6 4.8% 6
Kentucky 6 4.8% 3 3 3
Muenchen 4 3.2% 4
Muenster 4 3.2% 3 1 1 1 1 1 1
Uganda 4 3.2% 3 1 1 1 1 1 1 1 1 1 1 1 1
Agona 3 2.4% 1 2 2 2
Lille 3 2.4% 1 2 2
Mbandaka 3 2.4% 3
Senftenberg 3 2.4% 2 1 1
Other 18 14.5% 15 1 1 1 2 2 2 2 2 2 1 2 2 1 3
Total 124 100.0% 88 13 2 8 12 1 3 21 13 13 13 13 23 3 18 16 2 36
Cerro 92 29.7% 89 3 3
Montevideo 56 18.1% 50 3 1 2 1 2 2 2 2 2 3 1 2 2 5
Typhimurium 21 6.8% 7 3 11 14 11 11 11 11 14 14 13 14
Anatum 18 5.8% 15 2 1 1 1 1 1 1 2
Meleagridis 17 5.5% 15 1 1 2 2 1 2
Muenster 16 5.2% 15 1 1 1 1
Kentucky 15 4.8% 12 3 1 2
Muenchen 9 2.9% 8 1 1
Newport 7 2.3% 2 5 5 5 5 5 5 5 5 5 5
Other 59 19.0% 55 1 1 1 1 1 3 2 2 2 2 2 1 3 2 1 1 3
Total 310 100.0% 268 13 5 4 19 1 2 28 21 21 21 21 27 2 25 23 1 1 38
Table 27. Number of Non-Typhoidal Salmonella Isolates among the Top Serotypes from Cattle with the Number of Resistant Isolates by Class and Agent, 2013
Sources Salmonella Serotype
Number of Isolates Number of Resistant Isolates by Antimicrobial Class and Agent1
No. of Isolates
% of Isolates
Number of Antimicrobial Classes to which Isolates are
Resistant
β-Lactam/β-Lactamase
Inhibitor Combinations
Folate Pathway Inhibitors
Tetracyclines
0 1 2-3 4-5 6-7 8-9 GEN KAN STR
Aminoglycosides Cephems Macrolides Penicillins Phenicols Quinolones
Cat
tle
Ret
ail G
roun
d B
eef
HA
CC
P C
ecal
(Bee
f) C
ecal
(Dai
ry)
1 GEN= Gentamicin, KAN= Kanamycin, STR= Streptomycin, AMC= Amoxicillin/Clavulanic Acid, FOX= Cefoxitin, TIO= Ceftiofur, AXO= Ceftriaxone, FIS= Sulfisoxazole, COT= Trimethoprim/Sulfamethoxazole, AZI= Azithromycin, AMP= Ampicillin, CHL= Chloramphenicol, CIP= Ciprofloxacin, NAL= Nalidixic Acid, TET= Tetracycline
AZI AMP CHL CIP NAL TETAMC FOX TIO AXO FIS COT
36
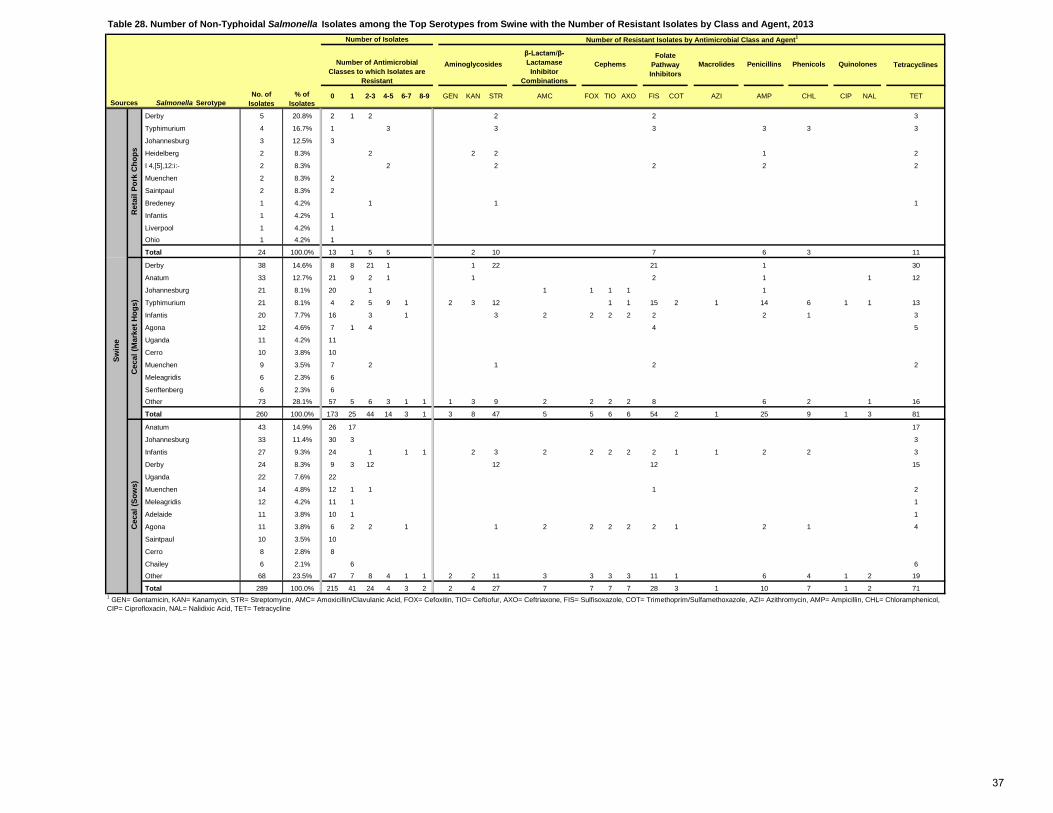
Derby 5 20.8% 2 1 2 2 2 3
Typhimurium 4 16.7% 1 3 3 3 3 3 3
Johannesburg 3 12.5% 3
Heidelberg 2 8.3% 2 2 2 1 2
I 4,[5],12:i:- 2 8.3% 2 2 2 2 2
Muenchen 2 8.3% 2
Saintpaul 2 8.3% 2
Bredeney 1 4.2% 1 1 1
Infantis 1 4.2% 1
Liverpool 1 4.2% 1
Ohio 1 4.2% 1
Total 24 100.0% 13 1 5 5 2 10 7 6 3 11
Derby 38 14.6% 8 8 21 1 1 22 21 1 30
Anatum 33 12.7% 21 9 2 1 1 2 1 1 12
Johannesburg 21 8.1% 20 1 1 1 1 1 1
Typhimurium 21 8.1% 4 2 5 9 1 2 3 12 1 1 15 2 1 14 6 1 1 13
Infantis 20 7.7% 16 3 1 3 2 2 2 2 2 2 1 3
Agona 12 4.6% 7 1 4 4 5
Uganda 11 4.2% 11
Cerro 10 3.8% 10
Muenchen 9 3.5% 7 2 1 2 2
Meleagridis 6 2.3% 6
Senftenberg 6 2.3% 6
Other 73 28.1% 57 5 6 3 1 1 1 3 9 2 2 2 2 8 6 2 1 16
Total 260 100.0% 173 25 44 14 3 1 3 8 47 5 5 6 6 54 2 1 25 9 1 3 81
Anatum 43 14.9% 26 17 17
Johannesburg 33 11.4% 30 3 3
Infantis 27 9.3% 24 1 1 1 2 3 2 2 2 2 2 1 1 2 2 3
Derby 24 8.3% 9 3 12 12 12 15
Uganda 22 7.6% 22
Muenchen 14 4.8% 12 1 1 1 2
Meleagridis 12 4.2% 11 1 1
Adelaide 11 3.8% 10 1 1
Agona 11 3.8% 6 2 2 1 1 2 2 2 2 2 1 2 1 4
Saintpaul 10 3.5% 10
Cerro 8 2.8% 8
Chailey 6 2.1% 6 6
Other 68 23.5% 47 7 8 4 1 1 2 2 11 3 3 3 3 11 1 6 4 1 2 19
Total 289 100.0% 215 41 24 4 3 2 2 4 27 7 7 7 7 28 3 1 10 7 1 2 711 GEN= Gentamicin, KAN= Kanamycin, STR= Streptomycin, AMC= Amoxicillin/Clavulanic Acid, FOX= Cefoxitin, TIO= Ceftiofur, AXO= Ceftriaxone, FIS= Sulfisoxazole, COT= Trimethoprim/Sulfamethoxazole, AZI= Azithromycin, AMP= Ampicillin, CHL= Chloramphenicol, CIP= Ciprofloxacin, NAL= Nalidixic Acid, TET= Tetracycline
Table 28. Number of Non-Typhoidal Salmonella Isolates among the Top Serotypes from Swine with the Number of Resistant Isolates by Class and Agent, 2013
Sources Salmonella Serotype
Number of Isolates Number of Resistant Isolates by Antimicrobial Class and Agent1
No. of Isolates
% of Isolates
Number of Antimicrobial Classes to which Isolates are
Resistant
β-Lactam/β-Lactamase
Inhibitor Combinations
Folate Pathway Inhibitors
NAL TETAMC FOX TIO AXO FIS COT
TetracyclinesAminoglycosides Cephems Macrolides Penicillins Phenicols Quinolones
Swin
e
Ret
ail P
ork
Cho
ps C
ecal
(Mar
ket H
ogs)
Cec
al (S
ows)
AZI AMP CHL CIP0 1 2-3 4-5 6-7 8-9 GEN KAN STR
37
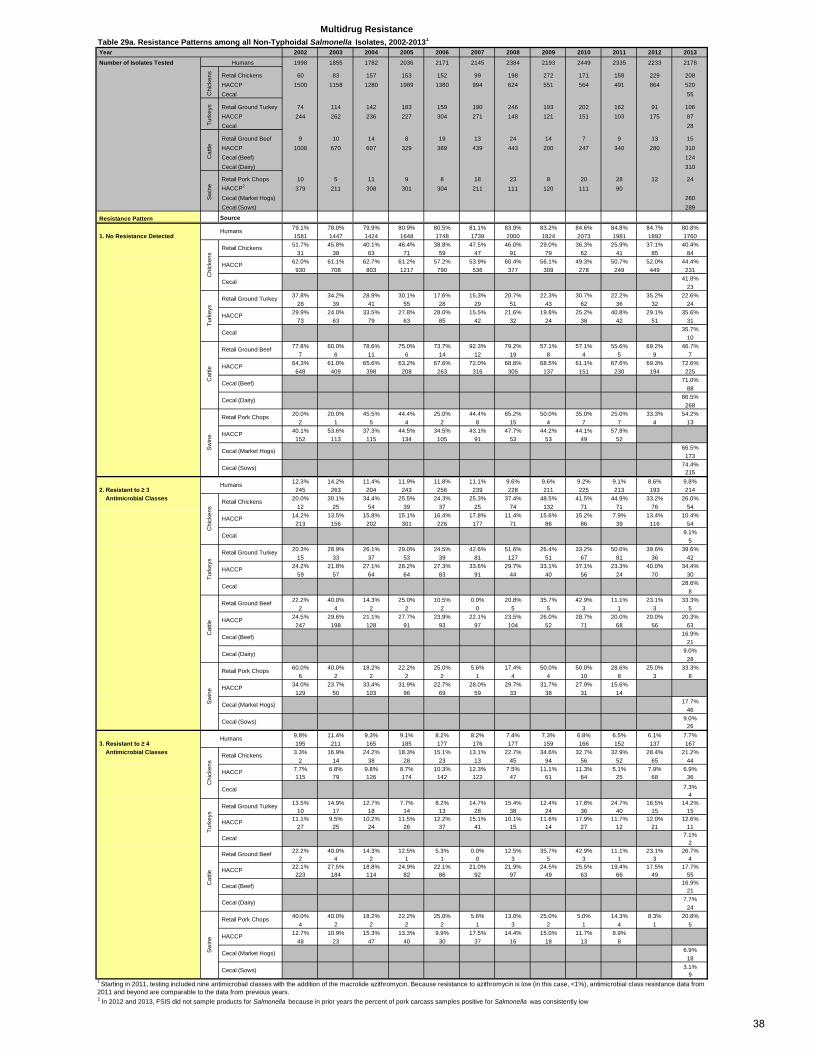
Year 2002 2003 2004 2005 2006 2007 2008 2009 2010 2011 2012 2013
Number of Isolates Tested 1998 1855 1782 2036 2171 2145 2384 2193 2449 2335 2233 2178
Retail Chickens 60 83 157 153 152 99 198 272 171 158 229 208 HACCP 1500 1158 1280 1989 1380 994 624 551 564 491 864 520 Cecal 55
Retail Ground Turkey 74 114 142 183 159 190 246 193 202 162 91 106 HACCP 244 262 236 227 304 271 148 121 151 103 175 87 Cecal 28
Retail Ground Beef 9 10 14 8 19 13 24 14 7 9 13 15 HACCP 1008 670 607 329 389 439 443 200 247 340 280 310 Cecal (Beef) 124 Cecal (Dairy) 310
Retail Pork Chops 10 5 11 9 8 18 23 8 20 28 12 24 HACCP2 379 211 308 301 304 211 111 120 111 90 Cecal (Market Hogs) 260 Cecal (Sows) 289
Resistance Pattern Source79.1% 78.0% 79.9% 80.9% 80.5% 81.1% 83.9% 83.2% 84.6% 84.8% 84.7% 80.8%
1. No Resistance Detected 1581 1447 1424 1648 1748 1739 2000 1824 2073 1981 1892 176051.7% 45.8% 40.1% 46.4% 38.8% 47.5% 46.0% 29.0% 36.3% 25.9% 37.1% 40.4%
31 38 63 71 59 47 91 79 62 41 85 8462.0% 61.1% 62.7% 61.2% 57.2% 53.9% 60.4% 56.1% 49.3% 50.7% 52.0% 44.4%
930 708 803 1217 790 536 377 309 278 249 449 23141.8%
2337.8% 34.2% 28.9% 30.1% 17.6% 15.3% 20.7% 22.3% 30.7% 22.2% 35.2% 22.6%
28 39 41 55 28 29 51 43 62 36 32 2429.9% 24.0% 33.5% 27.8% 28.0% 15.5% 21.6% 19.8% 25.2% 40.8% 29.1% 35.6%
73 63 79 63 85 42 32 24 38 42 51 3135.7%
1077.8% 60.0% 78.6% 75.0% 73.7% 92.3% 79.2% 57.1% 57.1% 55.6% 69.2% 46.7%
7 6 11 6 14 12 19 8 4 5 9 764.3% 61.0% 65.6% 63.2% 67.6% 72.0% 68.8% 68.5% 61.1% 67.6% 69.3% 72.6%
648 409 398 208 263 316 305 137 151 230 194 22571.0%
8886.5%
26820.0% 20.0% 45.5% 44.4% 25.0% 44.4% 65.2% 50.0% 35.0% 25.0% 33.3% 54.2%
2 1 5 4 2 8 15 4 7 7 4 1340.1% 53.6% 37.3% 44.5% 34.5% 43.1% 47.7% 44.2% 44.1% 57.8%
152 113 115 134 105 91 53 53 49 5266.5%
17374.4%
21512.3% 14.2% 11.4% 11.9% 11.8% 11.1% 9.6% 9.6% 9.2% 9.1% 8.6% 9.8%
2. Resistant to ≥ 3 245 263 204 243 256 239 228 211 225 213 193 214 Antimicrobial Classes 20.0% 30.1% 34.4% 25.5% 24.3% 25.3% 37.4% 48.5% 41.5% 44.9% 33.2% 26.0%
12 25 54 39 37 25 74 132 71 71 76 5414.2% 13.5% 15.8% 15.1% 16.4% 17.8% 11.4% 15.6% 15.2% 7.9% 13.4% 10.4%
213 156 202 301 226 177 71 86 86 39 116 549.1%
520.3% 28.9% 26.1% 29.0% 24.5% 42.6% 51.6% 26.4% 33.2% 50.0% 39.6% 39.6%
15 33 37 53 39 81 127 51 67 81 36 4224.2% 21.8% 27.1% 28.2% 27.3% 33.6% 29.7% 33.1% 37.1% 23.3% 40.0% 34.4%
59 57 64 64 83 91 44 40 56 24 70 3028.6%
822.2% 40.0% 14.3% 25.0% 10.5% 0.0% 20.8% 35.7% 42.9% 11.1% 23.1% 33.3%
2 4 2 2 2 0 5 5 3 1 3 524.5% 29.6% 21.1% 27.7% 23.9% 22.1% 23.5% 26.0% 28.7% 20.0% 20.0% 20.3%
247 198 128 91 93 97 104 52 71 68 56 6316.9%
219.0%
2860.0% 40.0% 18.2% 22.2% 25.0% 5.6% 17.4% 50.0% 50.0% 28.6% 25.0% 33.3%
6 2 2 2 2 1 4 4 10 8 3 834.0% 23.7% 33.4% 31.9% 22.7% 28.0% 29.7% 31.7% 27.9% 15.6%
129 50 103 96 69 59 33 38 31 1417.7%
469.0%
269.8% 11.4% 9.3% 9.1% 8.2% 8.2% 7.4% 7.3% 6.8% 6.5% 6.1% 7.7%
3. Resistant to ≥ 4 195 211 165 185 177 176 177 159 166 152 137 167 Antimicrobial Classes 3.3% 16.9% 24.2% 18.3% 15.1% 13.1% 22.7% 34.6% 32.7% 32.9% 28.4% 21.2%
2 14 38 28 23 13 45 94 56 52 65 447.7% 6.8% 9.8% 8.7% 10.3% 12.3% 7.5% 11.1% 11.3% 5.1% 7.9% 6.9%115 79 126 174 142 122 47 61 64 25 68 36
7.3%4
13.5% 14.9% 12.7% 7.7% 8.2% 14.7% 15.4% 12.4% 17.8% 24.7% 16.5% 14.2%10 17 18 14 13 28 38 24 36 40 15 15
11.1% 9.5% 10.2% 11.5% 12.2% 15.1% 10.1% 11.6% 17.9% 11.7% 12.0% 12.6%27 25 24 26 37 41 15 14 27 12 21 11
7.1%2
22.2% 40.0% 14.3% 12.5% 5.3% 0.0% 12.5% 35.7% 42.9% 11.1% 23.1% 26.7%2 4 2 1 1 0 3 5 3 1 3 4
22.1% 27.5% 18.8% 24.9% 22.1% 21.0% 21.9% 24.5% 25.5% 19.4% 17.5% 17.7%223 184 114 82 86 92 97 49 63 66 49 55
16.9%21
7.7%24
40.0% 40.0% 18.2% 22.2% 25.0% 5.6% 13.0% 25.0% 5.0% 14.3% 8.3% 20.8%4 2 2 2 2 1 3 2 1 4 1 5
12.7% 10.9% 15.3% 13.3% 9.9% 17.5% 14.4% 15.0% 11.7% 8.9%48 23 47 40 30 37 16 18 13 8
6.9%18
3.1%9
2 In 2012 and 2013, FSIS did not sample products for Salmonella because in prior years the percent of pork carcass samples positive for Salmonella was consistently low
Sw
ine
Humans
Chi
cken
s
Retail Chickens
HACCP
Cecal
Multidrug ResistanceTable 29a. Resistance Patterns among all Non-Typhoidal Salmonella Isolates, 2002-20131
Humans
Chi
cken
sTu
rkey
sC
attle
Turk
eys
Retail Ground Turkey
HACCP
Cecal
Cat
tle
Retail Ground Beef
HACCP
Cecal (Beef)
Cecal (Dairy)
Chi
cken
s
Retail Chickens
HACCP
Cecal
Turk
eys
Retail Ground Turkey
HACCP
Cecal
Sw
ine
Retail Pork Chops
HACCP
Cecal (Market Hogs)
Cecal (Sows)
Humans
Cat
tle
Retail Ground Beef
HACCP
Cecal (Beef)
Cecal (Dairy)
Sw
ine
Retail Pork Chops
HACCP
Cecal (Market Hogs)
Cecal (Sows)
Humans
Chi
cken
s
Retail Chickens
HACCP
Cecal
Turk
eys
Retail Ground Turkey
HACCP
Cecal
Cat
tle
Retail Ground Beef
HACCP
Cecal (Beef)
Cecal (Dairy)
Sw
ine
Retail Pork Chops
HACCP
Cecal (Market Hogs)
Cecal (Sows)
1 Starting in 2011, testing included nine antimicrobial classes with the addition of the macrolide azithromycin. Because resistance to azithromycin is low (in this case, <1%), antimicrobial class resistance data from 2011 and beyond are comparable to the data from previous years.
38
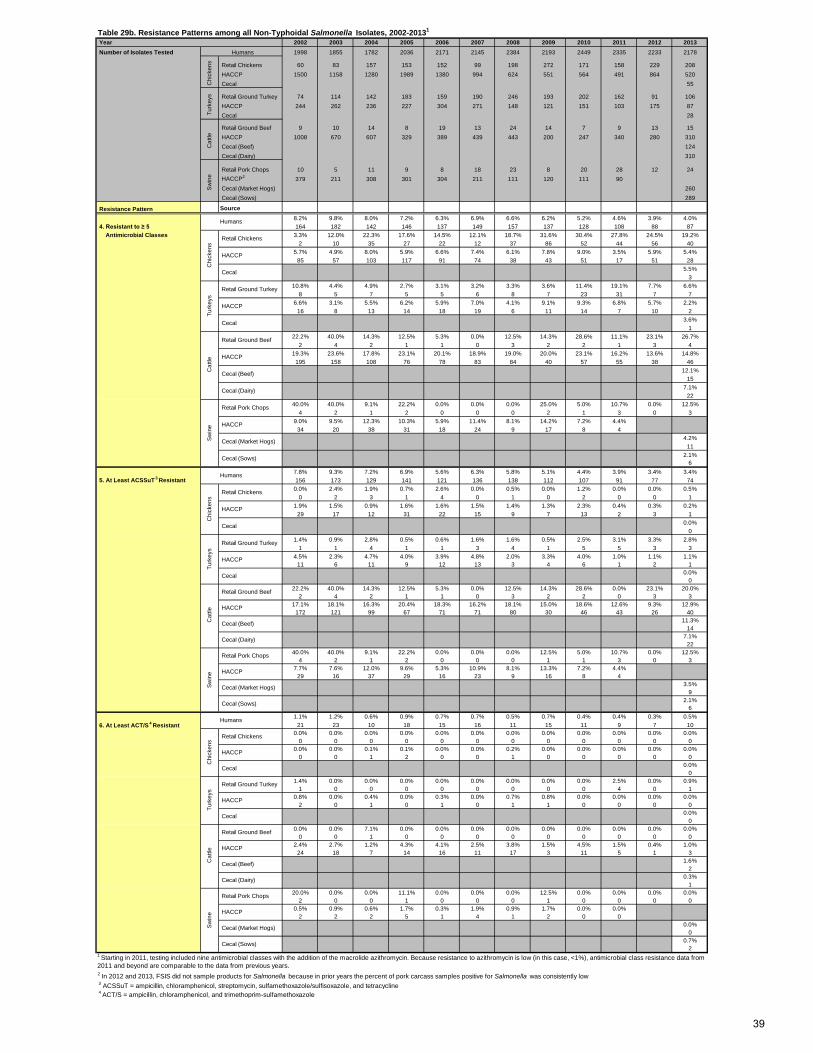
Year 2002 2003 2004 2005 2006 2007 2008 2009 2010 2011 2012 2013 Number of Isolates Tested 1998 1855 1782 2036 2171 2145 2384 2193 2449 2335 2233 2178
Retail Chickens 60 83 157 153 152 99 198 272 171 158 229 208 HACCP 1500 1158 1280 1989 1380 994 624 551 564 491 864 520 Cecal 55
Retail Ground Turkey 74 114 142 183 159 190 246 193 202 162 91 106 HACCP 244 262 236 227 304 271 148 121 151 103 175 87 Cecal 28
Retail Ground Beef 9 10 14 8 19 13 24 14 7 9 13 15 HACCP 1008 670 607 329 389 439 443 200 247 340 280 310 Cecal (Beef) 124 Cecal (Dairy) 310
Retail Pork Chops 10 5 11 9 8 18 23 8 20 28 12 24 HACCP2 379 211 308 301 304 211 111 120 111 90 Cecal (Market Hogs) 260 Cecal (Sows) 289
Resistance Pattern Source8.2% 9.8% 8.0% 7.2% 6.3% 6.9% 6.6% 6.2% 5.2% 4.6% 3.9% 4.0%
4. Resistant to ≥ 5 164 182 142 146 137 149 157 137 128 108 88 87 Antimicrobial Classes 3.3% 12.0% 22.3% 17.6% 14.5% 12.1% 18.7% 31.6% 30.4% 27.8% 24.5% 19.2%
2 10 35 27 22 12 37 86 52 44 56 405.7% 4.9% 8.0% 5.9% 6.6% 7.4% 6.1% 7.8% 9.0% 3.5% 5.9% 5.4%
85 57 103 117 91 74 38 43 51 17 51 285.5%
310.8% 4.4% 4.9% 2.7% 3.1% 3.2% 3.3% 3.6% 11.4% 19.1% 7.7% 6.6%
8 5 7 5 5 6 8 7 23 31 7 76.6% 3.1% 5.5% 6.2% 5.9% 7.0% 4.1% 9.1% 9.3% 6.8% 5.7% 2.2%
16 8 13 14 18 19 6 11 14 7 10 23.6%
122.2% 40.0% 14.3% 12.5% 5.3% 0.0% 12.5% 14.3% 28.6% 11.1% 23.1% 26.7%
2 4 2 1 1 0 3 2 2 1 3 419.3% 23.6% 17.8% 23.1% 20.1% 18.9% 19.0% 20.0% 23.1% 16.2% 13.6% 14.8%
195 158 108 76 78 83 84 40 57 55 38 4612.1%
157.1%
2240.0% 40.0% 9.1% 22.2% 0.0% 0.0% 0.0% 25.0% 5.0% 10.7% 0.0% 12.5%
4 2 1 2 0 0 0 2 1 3 0 39.0% 9.5% 12.3% 10.3% 5.9% 11.4% 8.1% 14.2% 7.2% 4.4%
34 20 38 31 18 24 9 17 8 44.2%
112.1%
67.8% 9.3% 7.2% 6.9% 5.6% 6.3% 5.8% 5.1% 4.4% 3.9% 3.4% 3.4%
5. At Least ACSSuT 3 Resistant 156 173 129 141 121 136 138 112 107 91 77 74
0.0% 2.4% 1.9% 0.7% 2.6% 0.0% 0.5% 0.0% 1.2% 0.0% 0.0% 0.5%0 2 3 1 4 0 1 0 2 0 0 1
1.9% 1.5% 0.9% 1.6% 1.6% 1.5% 1.4% 1.3% 2.3% 0.4% 0.3% 0.2%29 17 12 31 22 15 9 7 13 2 3 1
0.0%0
1.4% 0.9% 2.8% 0.5% 0.6% 1.6% 1.6% 0.5% 2.5% 3.1% 3.3% 2.8%1 1 4 1 1 3 4 1 5 5 3 3
4.5% 2.3% 4.7% 4.0% 3.9% 4.8% 2.0% 3.3% 4.0% 1.0% 1.1% 1.1%11 6 11 9 12 13 3 4 6 1 2 1
0.0%0
22.2% 40.0% 14.3% 12.5% 5.3% 0.0% 12.5% 14.3% 28.6% 0.0% 23.1% 20.0%2 4 2 1 1 0 3 2 2 0 3 3
17.1% 18.1% 16.3% 20.4% 18.3% 16.2% 18.1% 15.0% 18.6% 12.6% 9.3% 12.9%172 121 99 67 71 71 80 30 46 43 26 40
11.3%14
7.1%22
40.0% 40.0% 9.1% 22.2% 0.0% 0.0% 0.0% 12.5% 5.0% 10.7% 0.0% 12.5%4 2 1 2 0 0 0 1 1 3 0 3
7.7% 7.6% 12.0% 9.6% 5.3% 10.9% 8.1% 13.3% 7.2% 4.4%29 16 37 29 16 23 9 16 8 4
3.5%9
2.1%6
1.1% 1.2% 0.6% 0.9% 0.7% 0.7% 0.5% 0.7% 0.4% 0.4% 0.3% 0.5% 6. At Least ACT/S
4 Resistant 21 23 10 18 15 16 11 15 11 9 7 100.0% 0.0% 0.0% 0.0% 0.0% 0.0% 0.0% 0.0% 0.0% 0.0% 0.0% 0.0%
0 0 0 0 0 0 0 0 0 0 0 00.0% 0.0% 0.1% 0.1% 0.0% 0.0% 0.2% 0.0% 0.0% 0.0% 0.0% 0.0%
0 0 1 2 0 0 1 0 0 0 0 00.0%
01.4% 0.0% 0.0% 0.0% 0.0% 0.0% 0.0% 0.0% 0.0% 2.5% 0.0% 0.9%
1 0 0 0 0 0 0 0 0 4 0 10.8% 0.0% 0.4% 0.0% 0.3% 0.0% 0.7% 0.8% 0.0% 0.0% 0.0% 0.0%
2 0 1 0 1 0 1 1 0 0 0 00.0%
00.0% 0.0% 7.1% 0.0% 0.0% 0.0% 0.0% 0.0% 0.0% 0.0% 0.0% 0.0%
0 0 1 0 0 0 0 0 0 0 0 02.4% 2.7% 1.2% 4.3% 4.1% 2.5% 3.8% 1.5% 4.5% 1.5% 0.4% 1.0%
24 18 7 14 16 11 17 3 11 5 1 31.6%
20.3%
120.0% 0.0% 0.0% 11.1% 0.0% 0.0% 0.0% 12.5% 0.0% 0.0% 0.0% 0.0%
2 0 0 1 0 0 0 1 0 0 0 00.5% 0.9% 0.6% 1.7% 0.3% 1.9% 0.9% 1.7% 0.0% 0.0%
2 2 2 5 1 4 1 2 0 00.0%
00.7%
2
2 In 2012 and 2013, FSIS did not sample products for Salmonella because in prior years the percent of pork carcass samples positive for Salmonella was consistently low 3 ACSSuT = ampicillin, chloramphenicol, streptomycin, sulfamethoxazole/sulfisoxazole, and tetracycline 4 ACT/S = ampicillin, chloramphenicol, and trimethoprim-sulfamethoxazole
Cat
tle
Retail Ground Beef
HACCP
Cecal (Beef)
Cecal (Dairy)
Sw
ine
Retail Pork Chops
HACCP
Cecal (Market Hogs)
Cecal (Sows)
Humans
Chi
cken
s
Retail Chickens
HACCP
Cecal
Turk
eys
Retail Ground Turkey
HACCP
Cecal
Cat
tleS
win
e
Humans
Chi
cken
s
Retail Chickens
HACCP
Cecal
Table 29b. Resistance Patterns among all Non-Typhoidal Salmonella Isolates, 2002-20131
Humans
Chi
cken
sTu
rkey
sTu
rkey
s
Retail Ground Turkey
HACCP
Cecal
Cat
tle
Retail Ground Beef
HACCP
Cecal (Beef)
Cecal (Dairy)
Chi
cken
s
Retail Chickens
HACCP
Cecal
Turk
eys
Retail Ground Turkey
HACCP
Cecal
Sw
ine
Retail Pork Chops
HACCP
Cecal (Market Hogs)
Cecal (Sows)
Humans
1 Starting in 2011, testing included nine antimicrobial classes with the addition of the macrolide azithromycin. Because resistance to azithromycin is low (in this case, <1%), antimicrobial class resistance data from 2011 and beyond are comparable to the data from previous years.
Cat
tle
Retail Ground Beef
HACCP
Cecal (Beef)
Cecal (Dairy)
Sw
ine
Retail Pork Chops
HACCP
Cecal (Market Hogs)
Cecal (Sows)
39
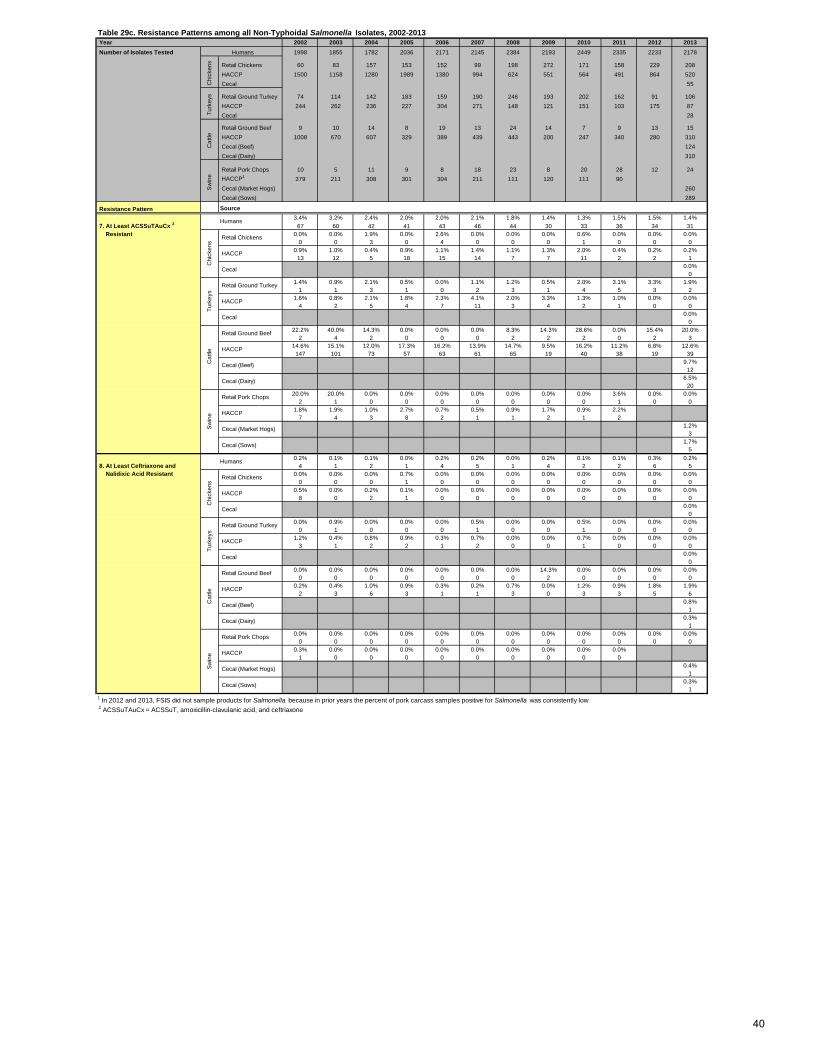
Year 2002 2003 2004 2005 2006 2007 2008 2009 2010 2011 2012 2013 Number of Isolates Tested 1998 1855 1782 2036 2171 2145 2384 2193 2449 2335 2233 2178
Retail Chickens 60 83 157 153 152 99 198 272 171 158 229 208 HACCP 1500 1158 1280 1989 1380 994 624 551 564 491 864 520 Cecal 55
Retail Ground Turkey 74 114 142 183 159 190 246 193 202 162 91 106 HACCP 244 262 236 227 304 271 148 121 151 103 175 87 Cecal 28
Retail Ground Beef 9 10 14 8 19 13 24 14 7 9 13 15 HACCP 1008 670 607 329 389 439 443 200 247 340 280 310 Cecal (Beef) 124 Cecal (Dairy) 310
Retail Pork Chops 10 5 11 9 8 18 23 8 20 28 12 24 HACCP1 379 211 308 301 304 211 111 120 111 90 Cecal (Market Hogs) 260 Cecal (Sows) 289
Resistance Pattern Source3.4% 3.2% 2.4% 2.0% 2.0% 2.1% 1.8% 1.4% 1.3% 1.5% 1.5% 1.4%
7. At Least ACSSuTAuCx 2 67 60 42 41 43 46 44 30 33 36 34 31 Resistant 0.0% 0.0% 1.9% 0.0% 2.6% 0.0% 0.0% 0.0% 0.6% 0.0% 0.0% 0.0%
0 0 3 0 4 0 0 0 1 0 0 00.9% 1.0% 0.4% 0.9% 1.1% 1.4% 1.1% 1.3% 2.0% 0.4% 0.2% 0.2%
13 12 5 18 15 14 7 7 11 2 2 10.0%
01.4% 0.9% 2.1% 0.5% 0.0% 1.1% 1.2% 0.5% 2.0% 3.1% 3.3% 1.9%
1 1 3 1 0 2 3 1 4 5 3 21.6% 0.8% 2.1% 1.8% 2.3% 4.1% 2.0% 3.3% 1.3% 1.0% 0.0% 0.0%
4 2 5 4 7 11 3 4 2 1 0 00.0%
022.2% 40.0% 14.3% 0.0% 0.0% 0.0% 8.3% 14.3% 28.6% 0.0% 15.4% 20.0%
2 4 2 0 0 0 2 2 2 0 2 314.6% 15.1% 12.0% 17.3% 16.2% 13.9% 14.7% 9.5% 16.2% 11.2% 6.8% 12.6%
147 101 73 57 63 61 65 19 40 38 19 399.7%
126.5%
2020.0% 20.0% 0.0% 0.0% 0.0% 0.0% 0.0% 0.0% 0.0% 3.6% 0.0% 0.0%
2 1 0 0 0 0 0 0 0 1 0 01.8% 1.9% 1.0% 2.7% 0.7% 0.5% 0.9% 1.7% 0.9% 2.2%
7 4 3 8 2 1 1 2 1 21.2%
31.7%
50.2% 0.1% 0.1% 0.0% 0.2% 0.2% 0.0% 0.2% 0.1% 0.1% 0.3% 0.2%
8. At Least Ceftriaxone and 4 1 2 1 4 5 1 4 2 2 6 5 Nalidixic Acid Resistant 0.0% 0.0% 0.0% 0.7% 0.0% 0.0% 0.0% 0.0% 0.0% 0.0% 0.0% 0.0%
0 0 0 1 0 0 0 0 0 0 0 00.5% 0.0% 0.2% 0.1% 0.0% 0.0% 0.0% 0.0% 0.0% 0.0% 0.0% 0.0%
8 0 2 1 0 0 0 0 0 0 0 00.0%
00.0% 0.9% 0.0% 0.0% 0.0% 0.5% 0.0% 0.0% 0.5% 0.0% 0.0% 0.0%
0 1 0 0 0 1 0 0 1 0 0 01.2% 0.4% 0.8% 0.9% 0.3% 0.7% 0.0% 0.0% 0.7% 0.0% 0.0% 0.0%
3 1 2 2 1 2 0 0 1 0 0 00.0%
00.0% 0.0% 0.0% 0.0% 0.0% 0.0% 0.0% 14.3% 0.0% 0.0% 0.0% 0.0%
0 0 0 0 0 0 0 2 0 0 0 00.2% 0.4% 1.0% 0.9% 0.3% 0.2% 0.7% 0.0% 1.2% 0.9% 1.8% 1.9%
2 3 6 3 1 1 3 0 3 3 5 60.8%
10.3%
10.0% 0.0% 0.0% 0.0% 0.0% 0.0% 0.0% 0.0% 0.0% 0.0% 0.0% 0.0%
0 0 0 0 0 0 0 0 0 0 0 00.3% 0.0% 0.0% 0.0% 0.0% 0.0% 0.0% 0.0% 0.0% 0.0%
1 0 0 0 0 0 0 0 0 00.4%
10.3%
11 In 2012 and 2013, FSIS did not sample products for Salmonella because in prior years the percent of pork carcass samples positive for Salmonella was consistently low 2 ACSSuTAuCx = ACSSuT, amoxicillin-clavulanic acid, and ceftriaxone
Table 29c. Resistance Patterns among all Non-Typhoidal Salmonella Isolates, 2002-2013
Humans
Chi
cken
sTu
rkey
sC
attle
Sw
ine
Humans
Sw
ine
Retail Pork Chops
HACCP
Cecal (Market Hogs)
Cecal (Sows)
Humans
Chi
cken
s
Retail Chickens
HACCP
Cecal
Turk
eys
Retail Ground Turkey
HACCP
Cecal
Cat
tle
Retail Ground Beef
HACCP
Cecal (Beef)
Cecal (Dairy)
Cecal
Turk
eys
Retail Ground Turkey
Cat
tle
Retail Ground Beef
HACCP
Cecal (Beef)
Cecal (Dairy)
Sw
ine
Retail Pork Chops
HACCP
Cecal (Market Hogs)
Cecal (Sows)
HACCP
Cecal
Chi
cken
s
Retail Chickens
HACCP
40
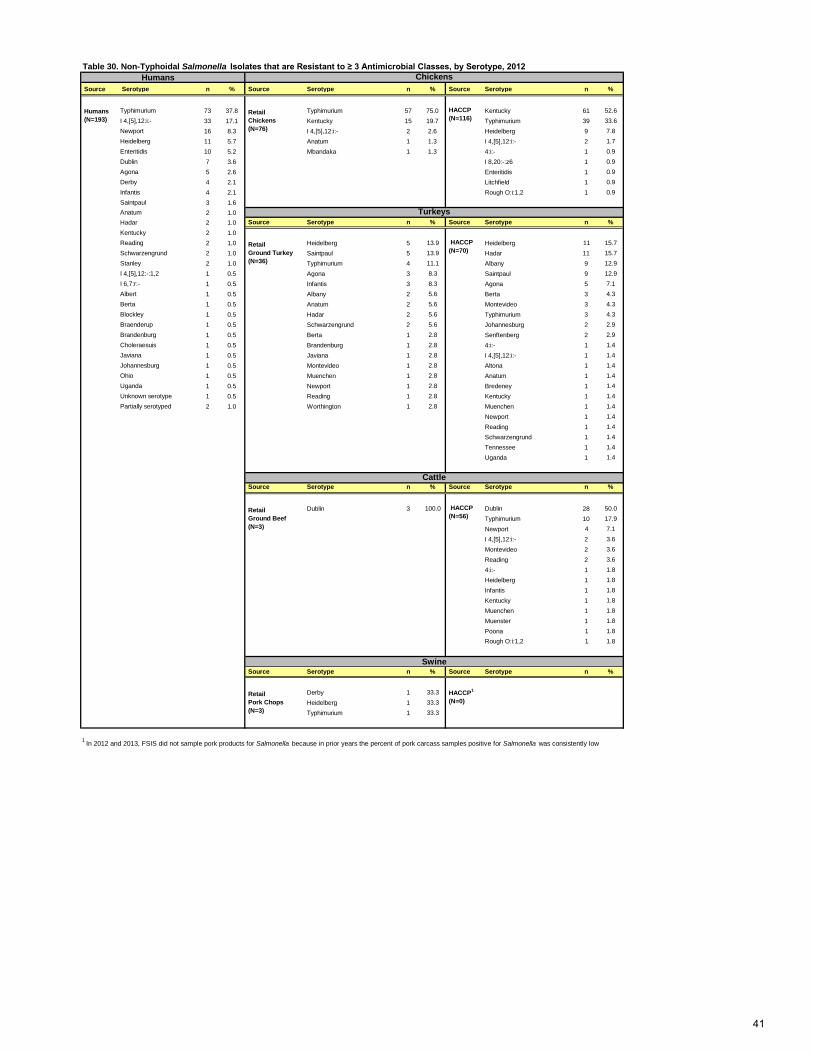
Humans Source Serotype n % Source Serotype n % Source Serotype n %
Typhimurium 73 37.8 Typhimurium 57 75.0 Kentucky 61 52.6I 4,[5],12:i:- 33 17.1 Kentucky 15 19.7 Typhimurium 39 33.6Newport 16 8.3 I 4,[5],12:i:- 2 2.6 Heidelberg 9 7.8Heidelberg 11 5.7 Anatum 1 1.3 I 4,[5],12:i:- 2 1.7Enteritidis 10 5.2 Mbandaka 1 1.3 4:i:- 1 0.9Dublin 7 3.6 I 8,20:-:z6 1 0.9Agona 5 2.6 Enteritidis 1 0.9Derby 4 2.1 Litchfield 1 0.9Infantis 4 2.1 Rough O:i:1,2 1 0.9Saintpaul 3 1.6Anatum 2 1.0Hadar 2 1.0 Source Serotype n % Source Serotype n %Kentucky 2 1.0Reading 2 1.0 Heidelberg 5 13.9 Heidelberg 11 15.7Schwarzengrund 2 1.0 Saintpaul 5 13.9 Hadar 11 15.7Stanley 2 1.0 Typhimurium 4 11.1 Albany 9 12.9I 4,[5],12:-:1,2 1 0.5 Agona 3 8.3 Saintpaul 9 12.9I 6,7:r:- 1 0.5 Infantis 3 8.3 Agona 5 7.1Albert 1 0.5 Albany 2 5.6 Berta 3 4.3Berta 1 0.5 Anatum 2 5.6 Montevideo 3 4.3Blockley 1 0.5 Hadar 2 5.6 Typhimurium 3 4.3Braenderup 1 0.5 Schwarzengrund 2 5.6 Johannesburg 2 2.9Brandenburg 1 0.5 Berta 1 2.8 Senftenberg 2 2.9Choleraesuis 1 0.5 Brandenburg 1 2.8 4:i:- 1 1.4Javiana 1 0.5 Javiana 1 2.8 I 4,[5],12:i:- 1 1.4Johannesburg 1 0.5 Montevideo 1 2.8 Altona 1 1.4Ohio 1 0.5 Muenchen 1 2.8 Anatum 1 1.4Uganda 1 0.5 Newport 1 2.8 Bredeney 1 1.4Unknown serotype 1 0.5 Reading 1 2.8 Kentucky 1 1.4Partially serotyped 2 1.0 Worthington 1 2.8 Muenchen 1 1.4
Newport 1 1.4Reading 1 1.4Schwarzengrund 1 1.4Tennessee 1 1.4Uganda 1 1.4
Source Serotype n % Source Serotype n %
Dublin 3 100.0 Dublin 28 50.0Typhimurium 10 17.9Newport 4 7.1I 4,[5],12:i:- 2 3.6Montevideo 2 3.6Reading 2 3.64:i:- 1 1.8Heidelberg 1 1.8Infantis 1 1.8Kentucky 1 1.8Muenchen 1 1.8Muenster 1 1.8Poona 1 1.8Rough O:i:1,2 1 1.8
Source Serotype n % Source Serotype n %
Derby 1 33.3Heidelberg 1 33.3Typhimurium 1 33.3
Retail Ground Turkey (N=36)
Cattle
Chickens
Humans (N=193)
Retail Chickens (N=76)
Swine
Table 30. Non-Typhoidal Salmonella Isolates that are Resistant to ≥ 3 Antimicrobial Classes, by Serotype, 2012
HACCP (N=116)
HACCP (N=70)
HACCP (N=56)
1 In 2012 and 2013, FSIS did not sample pork products for Salmonella because in prior years the percent of pork carcass samples positive for Salmonella was consistently low
Retail Ground Beef (N=3)
Retail Pork Chops (N=3)
HACCP1
(N=0)
Turkeys
41
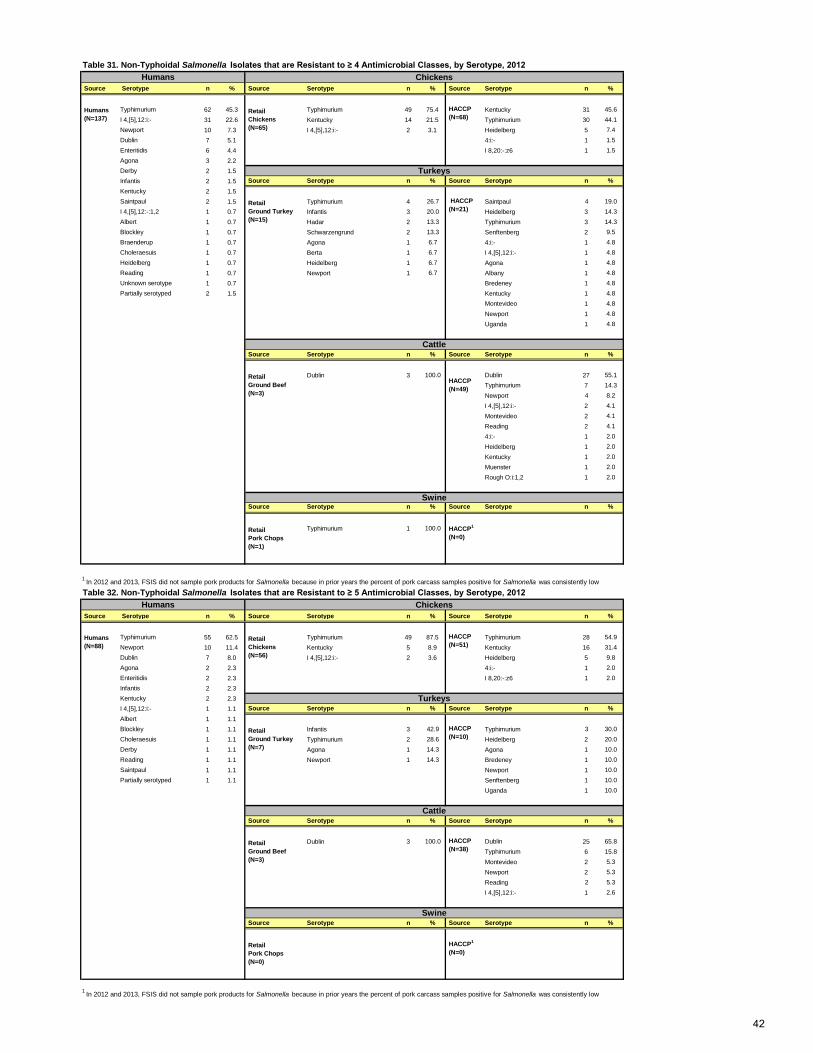
Table 31. Non-Typhoidal Salmonella Isolates that are Resistant to ≥ 4 Antimicrobial Classes, by Serotype, 2012Humans
Source Serotype n % Source Serotype n % Source Serotype n %
Typhimurium 62 45.3 Typhimurium 49 75.4 Kentucky 31 45.6I 4,[5],12:i:- 31 22.6 Kentucky 14 21.5 Typhimurium 30 44.1Newport 10 7.3 I 4,[5],12:i:- 2 3.1 Heidelberg 5 7.4Dublin 7 5.1 4:i:- 1 1.5Enteritidis 6 4.4 I 8,20:-:z6 1 1.5Agona 3 2.2Derby 2 1.5Infantis 2 1.5 Source Serotype n % Source Serotype n %Kentucky 2 1.5Saintpaul 2 1.5 Typhimurium 4 26.7 Saintpaul 4 19.0I 4,[5],12:-:1,2 1 0.7 Infantis 3 20.0 Heidelberg 3 14.3Albert 1 0.7 Hadar 2 13.3 Typhimurium 3 14.3Blockley 1 0.7 Schwarzengrund 2 13.3 Senftenberg 2 9.5Braenderup 1 0.7 Agona 1 6.7 4:i:- 1 4.8Choleraesuis 1 0.7 Berta 1 6.7 I 4,[5],12:i:- 1 4.8Heidelberg 1 0.7 Heidelberg 1 6.7 Agona 1 4.8Reading 1 0.7 Newport 1 6.7 Albany 1 4.8Unknown serotype 1 0.7 Bredeney 1 4.8Partially serotyped 2 1.5 Kentucky 1 4.8
Montevideo 1 4.8Newport 1 4.8Uganda 1 4.8
Source Serotype n % Source Serotype n %
Dublin 3 100.0 Dublin 27 55.1Typhimurium 7 14.3Newport 4 8.2I 4,[5],12:i:- 2 4.1Montevideo 2 4.1Reading 2 4.14:i:- 1 2.0Heidelberg 1 2.0Kentucky 1 2.0Muenster 1 2.0Rough O:i:1,2 1 2.0
Source Serotype n % Source Serotype n %
Typhimurium 1 100.0
Table 32. Non-Typhoidal Salmonella Isolates that are Resistant to ≥ 5 Antimicrobial Classes, by Serotype, 2012Humans
Source Serotype n % Source Serotype n % Source Serotype n %
Typhimurium 55 62.5 Typhimurium 49 87.5 Typhimurium 28 54.9Newport 10 11.4 Kentucky 5 8.9 Kentucky 16 31.4Dublin 7 8.0 I 4,[5],12:i:- 2 3.6 Heidelberg 5 9.8Agona 2 2.3 4:i:- 1 2.0Enteritidis 2 2.3 I 8,20:-:z6 1 2.0Infantis 2 2.3Kentucky 2 2.3I 4,[5],12:i:- 1 1.1 Source Serotype n % Source Serotype n %Albert 1 1.1Blockley 1 1.1 Infantis 3 42.9 Typhimurium 3 30.0Choleraesuis 1 1.1 Typhimurium 2 28.6 Heidelberg 2 20.0Derby 1 1.1 Agona 1 14.3 Agona 1 10.0Reading 1 1.1 Newport 1 14.3 Bredeney 1 10.0Saintpaul 1 1.1 Newport 1 10.0Partially serotyped 1 1.1 Senftenberg 1 10.0
Uganda 1 10.0
Source Serotype n % Source Serotype n %
Dublin 3 100.0 Dublin 25 65.8Typhimurium 6 15.8Montevideo 2 5.3Newport 2 5.3Reading 2 5.3I 4,[5],12:i:- 1 2.6
Source Serotype n % Source Serotype n %
Turkeys
Humans (N=137)
Retail Ground Turkey (N=15)
HACCP (N=21)
Chickens
Retail Chickens (N=65)
HACCP (N=68)
1 In 2012 and 2013, FSIS did not sample pork products for Salmonella because in prior years the percent of pork carcass samples positive for Salmonella was consistently low
Turkeys
Retail Ground Turkey (N=7)
HACCP (N=10)
Cattle
Retail Ground Beef (N=3)
HACCP (N=38)
Swine
Retail Pork Chops (N=0)
HACCP1
(N=0)
1 In 2012 and 2013, FSIS did not sample pork products for Salmonella because in prior years the percent of pork carcass samples positive for Salmonella was consistently low
Chickens
Humans (N=88)
Retail Chickens (N=56)
HACCP (N=51)
Cattle
Retail Ground Beef (N=3)
HACCP (N=49)
Swine
Retail Pork Chops (N=1)
HACCP1
(N=0)
42
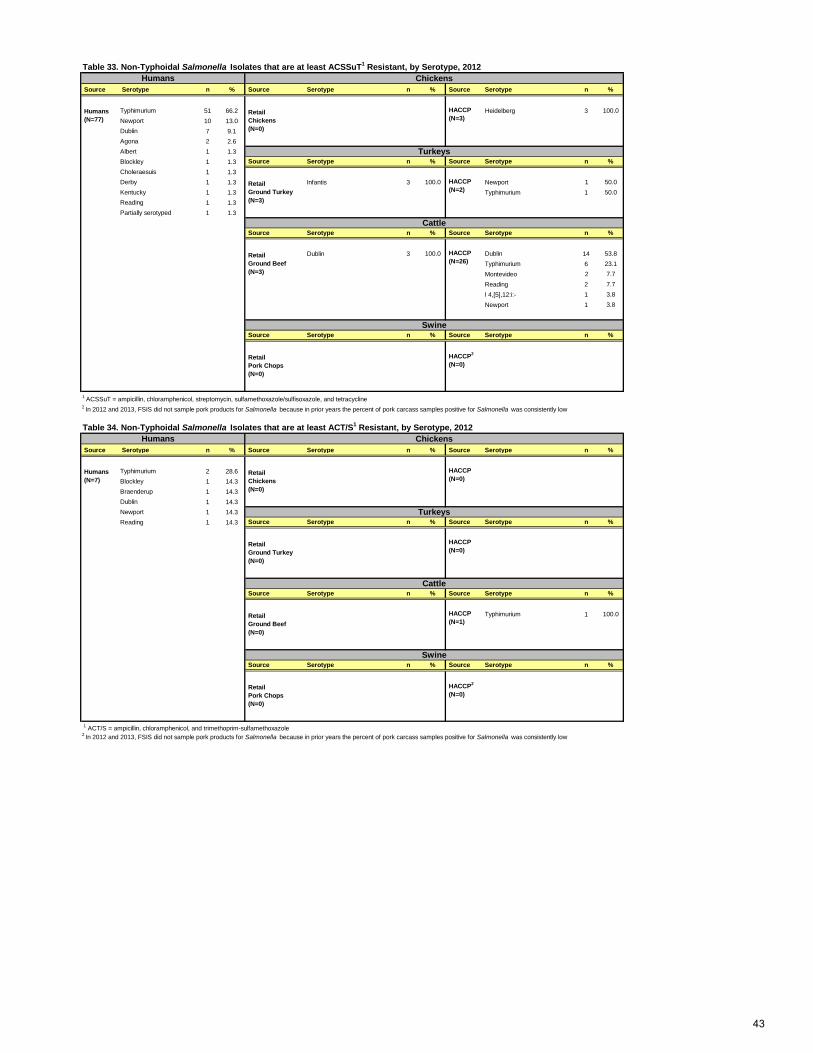
Humans Source Serotype n % Source Serotype n % Source Serotype n %
Typhimurium 51 66.2 Heidelberg 3 100.0Newport 10 13.0Dublin 7 9.1Agona 2 2.6Albert 1 1.3Blockley 1 1.3 Source Serotype n % Source Serotype n %Choleraesuis 1 1.3Derby 1 1.3 Infantis 3 100.0 Newport 1 50.0Kentucky 1 1.3 Typhimurium 1 50.0Reading 1 1.3Partially serotyped 1 1.3
Source Serotype n % Source Serotype n %
Dublin 3 100.0 Dublin 14 53.8Typhimurium 6 23.1Montevideo 2 7.7Reading 2 7.7I 4,[5],12:i:- 1 3.8Newport 1 3.8
Source Serotype n % Source Serotype n %
Humans Source Serotype n % Source Serotype n % Source Serotype n %
Typhimurium 2 28.6Blockley 1 14.3Braenderup 1 14.3Dublin 1 14.3Newport 1 14.3Reading 1 14.3 Source Serotype n % Source Serotype n %
Source Serotype n % Source Serotype n %
Typhimurium 1 100.0
Source Serotype n % Source Serotype n %
Table 33. Non-Typhoidal Salmonella Isolates that are at least ACSSuT1 Resistant, by Serotype, 2012Chickens
Humans (N=77)
Retail Chickens (N=0)
HACCP (N=3)
Turkeys
Retail Ground Turkey (N=3)
HACCP (N=2)
Cattle
Retail Ground Beef (N=0)
HACCP (N=1)
2 In 2012 and 2013, FSIS did not sample pork products for Salmonella because in prior years the percent of pork carcass samples positive for Salmonella was consistently low
1 ACSSuT = ampicillin, chloramphenicol, streptomycin, sulfamethoxazole/sulfisoxazole, and tetracycline
Table 34. Non-Typhoidal Salmonella Isolates that are at least ACT/S1 Resistant, by Serotype, 2012Chickens
Cattle
Retail Ground Beef (N=3)
HACCP (N=26)
Swine
Retail Pork Chops (N=0)
HACCP2
(N=0)
Swine
Retail Pork Chops (N=0)
HACCP2
(N=0)
Humans (N=7)
Retail Chickens (N=0)
HACCP (N=0)
Turkeys
Retail Ground Turkey (N=0)
HACCP (N=0)
1 ACT/S = ampicillin, chloramphenicol, and trimethoprim-sulfamethoxazole2 In 2012 and 2013, FSIS did not sample pork products for Salmonella because in prior years the percent of pork carcass samples positive for Salmonella was consistently low
43
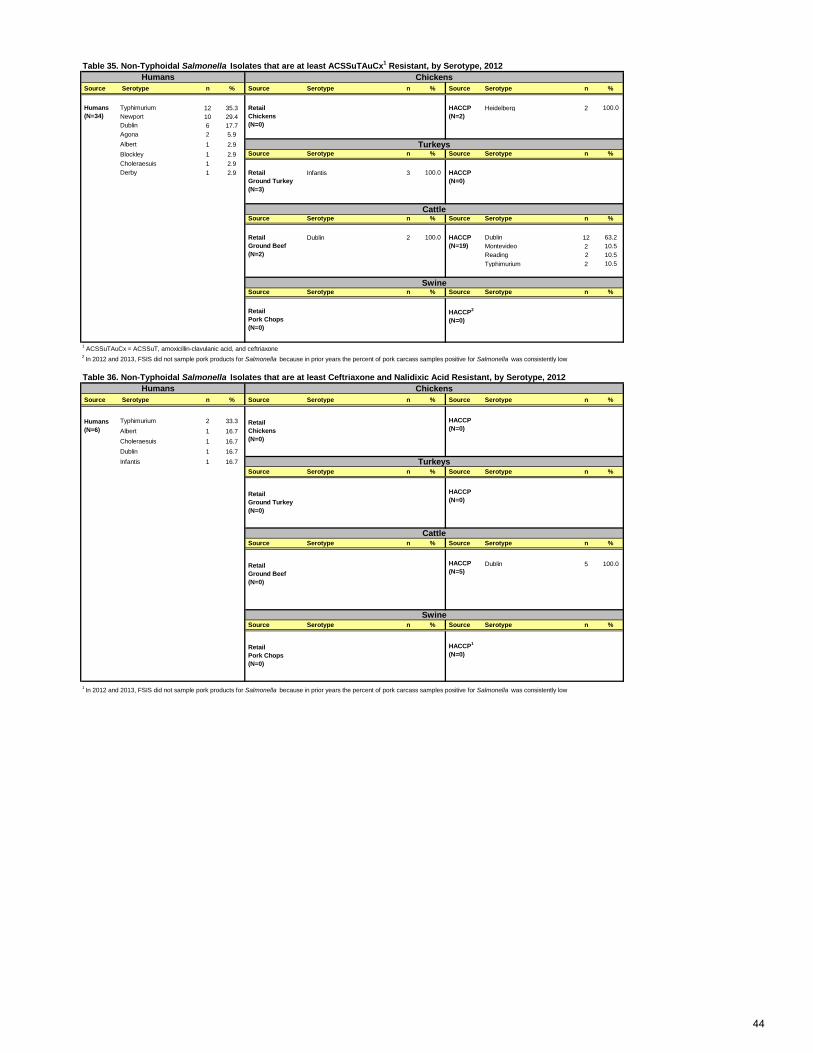
Humans Source Serotype n % Source Serotype n % Source Serotype n %
Typhimurium 12 35.3 Heidelberg 2 100.0Newport 10 29.4Dublin 6 17.7Agona 2 5.9Albert 1 2.9Blockley 1 2.9 Source Serotype n % Source Serotype n %Choleraesuis 1 2.9Derby 1 2.9 Infantis 3 100.0
Source Serotype n % Source Serotype n %
Dublin 2 100.0 Dublin 12 63.2Montevideo 2 10.5Reading 2 10.5Typhimurium 2 10.5
Source Serotype n % Source Serotype n %
Humans Source Serotype n % Source Serotype n % Source Serotype n %
Typhimurium 2 33.3Albert 1 16.7Choleraesuis 1 16.7Dublin 1 16.7Infantis 1 16.7
Source Serotype n % Source Serotype n %
Source Serotype n % Source Serotype n %
Dublin 5 100.0
Source Serotype n % Source Serotype n %
Humans (N=34)
Retail Chickens (N=0)
HACCP (N=2)
Turkeys
Retail Ground Turkey (N=3)
HACCP (N=0)
Table 35. Non-Typhoidal Salmonella Isolates that are at least ACSSuTAuCx1 Resistant, by Serotype, 2012Chickens
1 ACSSuTAuCx = ACSSuT, amoxicillin-clavulanic acid, and ceftriaxone2 In 2012 and 2013, FSIS did not sample pork products for Salmonella because in prior years the percent of pork carcass samples positive for Salmonella was consistently low
Table 36. Non-Typhoidal Salmonella Isolates that are at least Ceftriaxone and Nalidixic Acid Resistant, by Serotype, 2012Chickens
Cattle
Retail Ground Beef (N=2)
HACCP (N=19)
Swine
Retail Pork Chops (N=0)
HACCP2
(N=0)
1 In 2012 and 2013, FSIS did not sample pork products for Salmonella because in prior years the percent of pork carcass samples positive for Salmonella was consistently low
Cattle
Retail Ground Beef (N=0)
HACCP (N=5)
Swine
Retail Pork Chops (N=0)
HACCP1
(N=0)
Humans (N=6)
Retail Chickens (N=0)
HACCP (N=0)
Turkeys
Retail Ground Turkey (N=0)
HACCP (N=0)
44
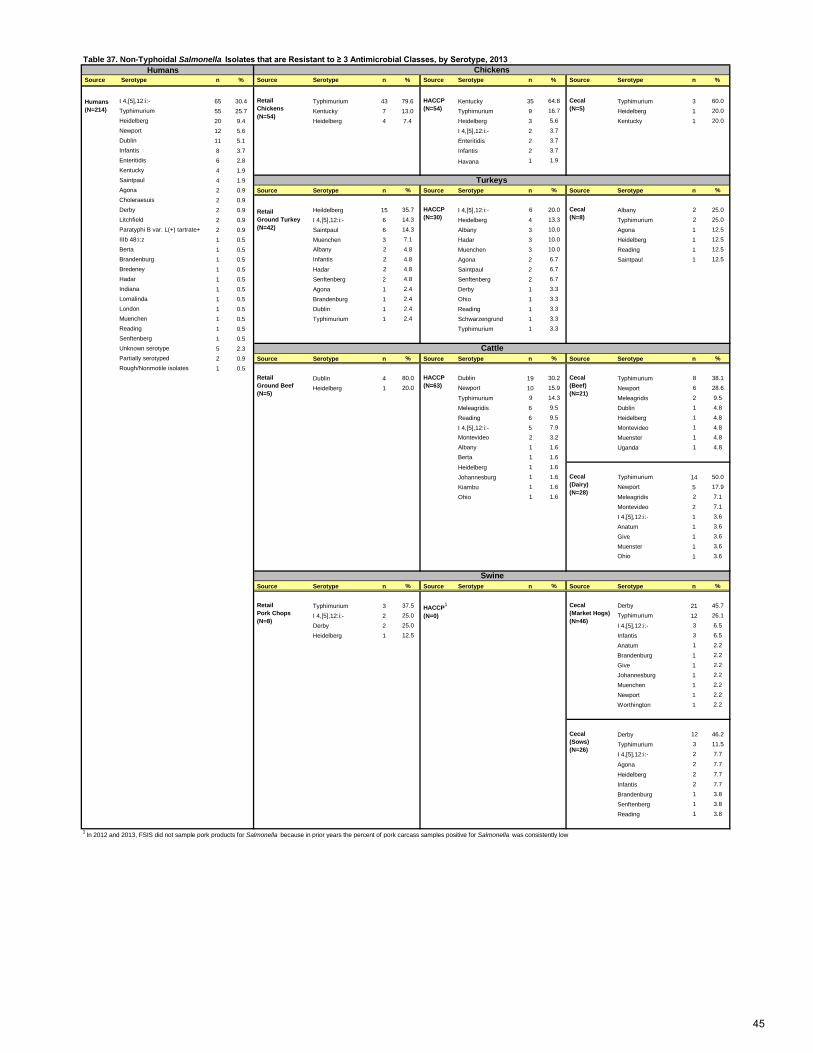
Humans Source Serotype n % Source Serotype n % Source Serotype n % Source Serotype n %
I 4,[5],12:i:- 65 30.4 Typhimurium 43 79.6 Kentucky 35 64.8 Typhimurium 3 60.0Typhimurium 55 25.7 Kentucky 7 13.0 Typhimurium 9 16.7 Heidelberg 1 20.0Heidelberg 20 9.4 Heidelberg 4 7.4 Heidelberg 3 5.6 Kentucky 1 20.0Newport 12 5.6 I 4,[5],12:i:- 2 3.7Dublin 11 5.1 Enteritidis 2 3.7Infantis 8 3.7 Infantis 2 3.7Enteritidis 6 2.8 Havana 1 1.9Kentucky 4 1.9Saintpaul 4 1.9Agona 2 0.9 Source Serotype n % Source Serotype n % Source Serotype n %Choleraesuis 2 0.9Derby 2 0.9 Heildelberg 15 35.7 I 4,[5],12:i:- 6 20.0 Albany 2 25.0Litchfield 2 0.9 I 4,[5],12:i:- 6 14.3 Heidelberg 4 13.3 Typhimurium 2 25.0Paratyphi B var. L(+) tartrate+ 2 0.9 Saintpaul 6 14.3 Albany 3 10.0 Agona 1 12.5IIIb 48:i:z 1 0.5 Muenchen 3 7.1 Hadar 3 10.0 Heidelberg 1 12.5Berta 1 0.5 Albany 2 4.8 Muenchen 3 10.0 Reading 1 12.5Brandenburg 1 0.5 Infantis 2 4.8 Agona 2 6.7 Saintpaul 1 12.5Bredeney 1 0.5 Hadar 2 4.8 Saintpaul 2 6.7Hadar 1 0.5 Senftenberg 2 4.8 Senftenberg 2 6.7Indiana 1 0.5 Agona 1 2.4 Derby 1 3.3Lomalinda 1 0.5 Brandenburg 1 2.4 Ohio 1 3.3London 1 0.5 Dublin 1 2.4 Reading 1 3.3Muenchen 1 0.5 Typhimurium 1 2.4 Schwarzengrund 1 3.3Reading 1 0.5 Typhimurium 1 3.3Senftenberg 1 0.5Unknown serotype 5 2.3Partially serotyped 2 0.9 Source Serotype n % Source Serotype n % Source Serotype n %Rough/Nonmotile isolates 1 0.5
Dublin 4 80.0 Dublin 19 30.2 Typhimurium 8 38.1
Heidelberg 1 20.0 Newport 10 15.9 Newport 6 28.6
Typhimurium 9 14.3 Meleagridis 2 9.5
Meleagridis 6 9.5 Dublin 1 4.8
Reading 6 9.5 Heidelberg 1 4.8
I 4,[5],12:i:- 5 7.9 Montevideo 1 4.8Montevideo 2 3.2 Muenster 1 4.8Albany 1 1.6 Uganda 1 4.8Berta 1 1.6
Heidelberg 1 1.6
Johannesburg 1 1.6 Typhimurium 14 50.0
Kiambu 1 1.6 Newport 5 17.9
Ohio 1 1.6 Meleagridis 2 7.1
Montevideo 2 7.1
I 4,[5],12:i:- 1 3.6
Anatum 1 3.6
Give 1 3.6
Muenster 1 3.6Ohio 1 3.6
Source Serotype n % Source Serotype n % Source Serotype n %
Typhimurium 3 37.5 Derby 21 45.7
I 4,[5],12:i:- 2 25.0 Typhimurium 12 26.1
Derby 2 25.0 I 4,[5],12:i:- 3 6.5
Heidelberg 1 12.5 Infantis 3 6.5
Anatum 1 2.2
Brandenburg 1 2.2
Give 1 2.2
Johannesburg 1 2.2
Muenchen 1 2.2
Newport 1 2.2
Worthington 1 2.2
Derby 12 46.2
Typhimurium 3 11.5
I 4,[5],12:i:- 2 7.7
Agona 2 7.7
Heidelberg 2 7.7
Infantis 2 7.7
Brandenburg 1 3.8
Senftenberg 1 3.8
Reading 1 3.8
Cattle
Table 37. Non-Typhoidal Salmonella Isolates that are Resistant to ≥ 3 Antimicrobial Classes, by Serotype, 2013Chickens
Humans (N=214)
Retail Chickens (N=54)
HACCP (N=54)
Cecal (N=5)
Turkeys
Retail Ground Turkey (N=42)
HACCP (N=30)
Cecal (N=8)
Swine
Cecal (Sows) (N=26)
1 In 2012 and 2013, FSIS did not sample pork products for Salmonella because in prior years the percent of pork carcass samples positive for Salmonella was consistently low
Retail Ground Beef (N=5)
HACCP (N=63)
Cecal (Beef) (N=21)
Cecal (Dairy) (N=28)
Retail Pork Chops (N=8)
HACCP1
(N=0)
Cecal (Market Hogs) (N=46)
45
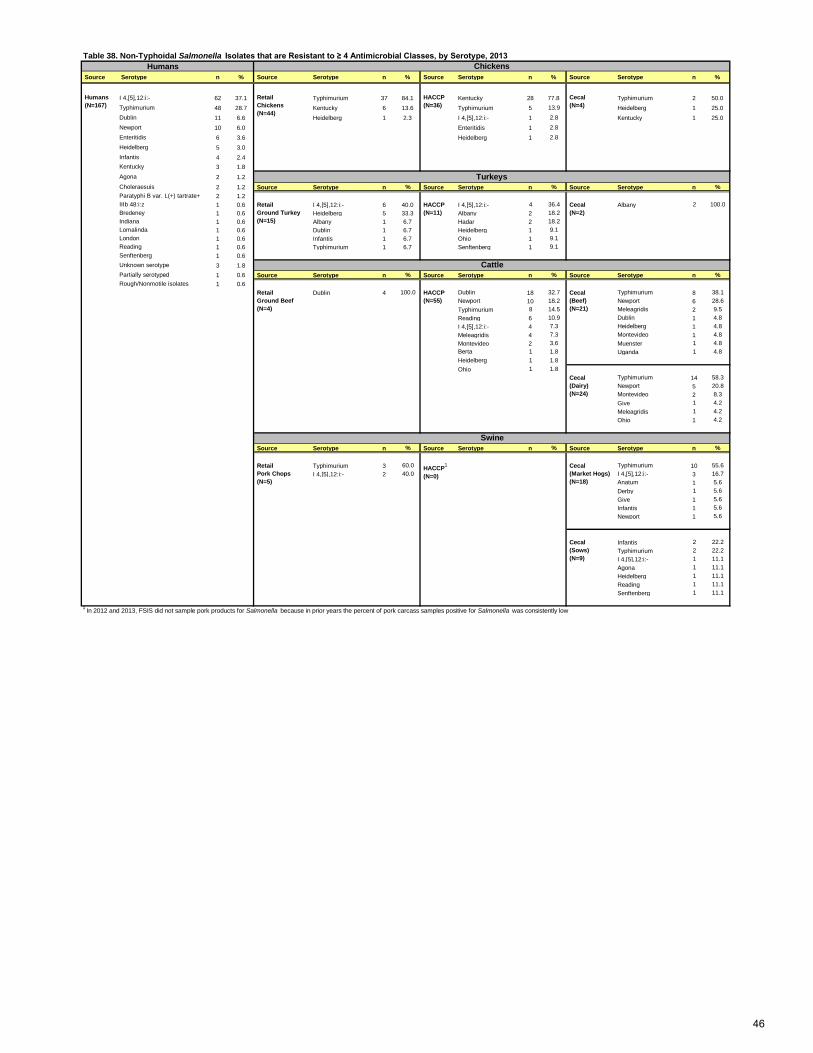
Humans Source Serotype n % Source Serotype n % Source Serotype n % Source Serotype n %
I 4,[5],12:i:- 62 37.1 Typhimurium 37 84.1 Kentucky 28 77.8 Typhimurium 2 50.0Typhimurium 48 28.7 Kentucky 6 13.6 Typhimurium 5 13.9 Heidelberg 1 25.0Dublin 11 6.6 Heidelberg 1 2.3 I 4,[5],12:i:- 1 2.8 Kentucky 1 25.0Newport 10 6.0 Enteritidis 1 2.8Enteritidis 6 3.6 Heidelberg 1 2.8Heidelberg 5 3.0Infantis 4 2.4Kentucky 3 1.8Agona 2 1.2Choleraesuis 2 1.2 Source Serotype n % Source Serotype n % Source Serotype n %Paratyphi B var. L(+) tartrate+ 2 1.2IIIb 48:i:z 1 0.6 I 4,[5],12:i:- 6 40.0 I 4,[5],12:i:- 4 36.4 Albany 2 100.0Bredeney 1 0.6 Heidelberg 5 33.3 Albany 2 18.2Indiana 1 0.6 Albany 1 6.7 Hadar 2 18.2Lomalinda 1 0.6 Dublin 1 6.7 Heidelberg 1 9.1London 1 0.6 Infantis 1 6.7 Ohio 1 9.1Reading 1 0.6 Typhimurium 1 6.7 Senftenberg 1 9.1Senftenberg 1 0.6Unknown serotype 3 1.8Partially serotyped 1 0.6 Source Serotype n % Source Serotype n % Source Serotype n %Rough/Nonmotile isolates 1 0.6
Dublin 4 100.0 Dublin 18 32.7 Typhimurium 8 38.1Newport 10 18.2 Newport 6 28.6Typhimurium 8 14.5 Meleagridis 2 9.5Reading 6 10.9 Dublin 1 4.8I 4,[5],12:i:- 4 7.3 Heidelberg 1 4.8Meleagridis 4 7.3 Montevideo 1 4.8Montevideo 2 3.6 Muenster 1 4.8Berta 1 1.8 Uganda 1 4.8Heidelberg 1 1.8Ohio 1 1.8
Typhimurium 14 58.3Newport 5 20.8Montevideo 2 8.3Give 1 4.2Meleagridis 1 4.2Ohio 1 4.2
Source Serotype n % Source Serotype n % Source Serotype n %
Typhimurium 3 60.0 Typhimurium 10 55.6I 4,[5],12:i:- 2 40.0 I 4,[5],12:i:- 3 16.7
Anatum 1 5.6Derby 1 5.6Give 1 5.6Infantis 1 5.6Newport 1 5.6
Infantis 2 22.2Typhimurium 2 22.2I 4,[5],12:i:- 1 11.1Agona 1 11.1Heidelberg 1 11.1Reading 1 11.1Senftenberg 1 11.1
1 In 2012 and 2013, FSIS did not sample pork products for Salmonella because in prior years the percent of pork carcass samples positive for Salmonella was consistently low
Retail Pork Chops (N=5)
HACCP1
(N=0)
Cecal (Market Hogs) (N=18)
Cecal (Sows) (N=9)
Retail Ground Beef (N=4)
HACCP (N=55)
Cecal (Beef) (N=21)
Cecal (Dairy) (N=24)
Swine
Turkeys
Retail Ground Turkey (N=15)
HACCP (N=11)
Cecal (N=2)
Cattle
Table 38. Non-Typhoidal Salmonella Isolates that are Resistant to ≥ 4 Antimicrobial Classes, by Serotype, 2013Chickens
Retail Chickens (N=44)
HACCP (N=36)
Cecal (N=4)
Humans (N=167)
46
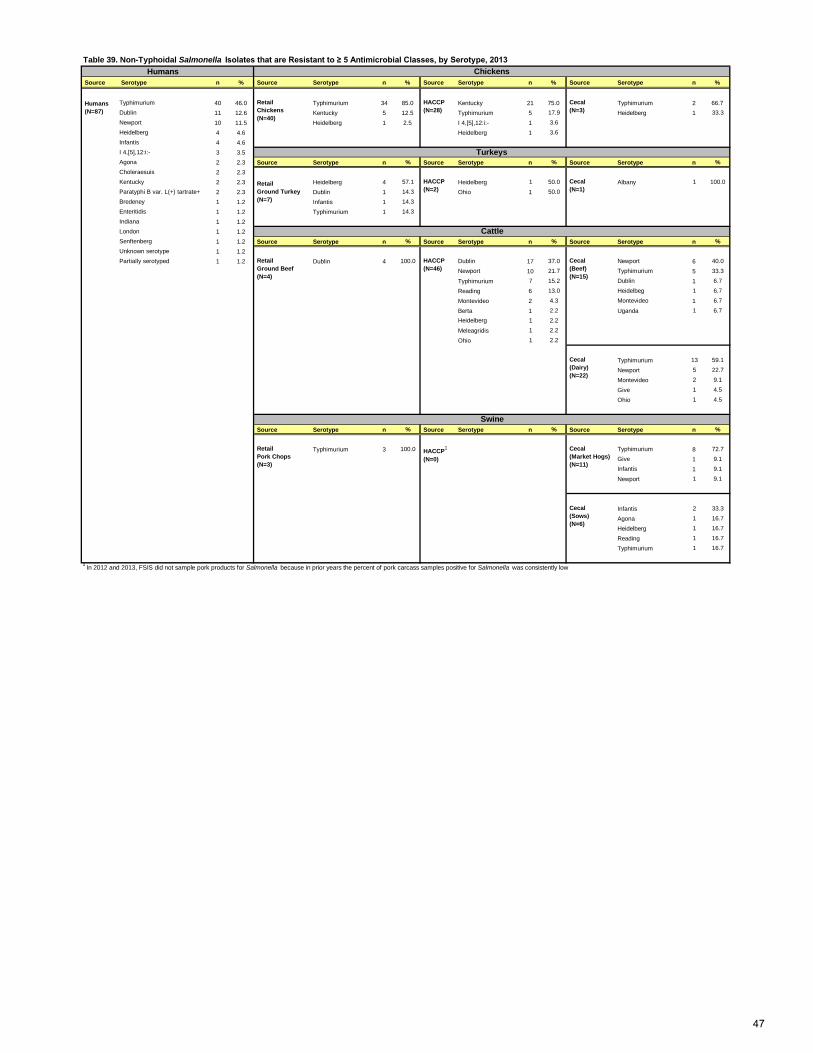
Table 39. Non-Typhoidal Salmonella Isolates that are Resistant to ≥ 5 Antimicrobial Classes, by Serotype, 2013Humans
Source Serotype n % Source Serotype n % Source Serotype n % Source Serotype n %
Typhimurium 40 46.0 Typhimurium 34 85.0 Kentucky 21 75.0 Typhimurium 2 66.7Dublin 11 12.6 Kentucky 5 12.5 Typhimurium 5 17.9 Heidelberg 1 33.3Newport 10 11.5 Heidelberg 1 2.5 I 4,[5],12:i:- 1 3.6Heidelberg 4 4.6 Heidelberg 1 3.6Infantis 4 4.6I 4,[5],12:i:- 3 3.5Agona 2 2.3 Source Serotype n % Source Serotype n % Source Serotype n %Choleraesuis 2 2.3Kentucky 2 2.3 Heidelberg 4 57.1 Heidelberg 1 50.0 Albany 1 100.0Paratyphi B var. L(+) tartrate+ 2 2.3 Dublin 1 14.3 Ohio 1 50.0Bredeney 1 1.2 Infantis 1 14.3Enteritidis 1 1.2 Typhimurium 1 14.3Indiana 1 1.2London 1 1.2Senftenberg 1 1.2 Source Serotype n % Source Serotype n % Source Serotype n %Unknown serotype 1 1.2Partially serotyped 1 1.2 Dublin 4 100.0 Dublin 17 37.0 Newport 6 40.0
Newport 10 21.7 Typhimurium 5 33.3
Typhimurium 7 15.2 Dublin 1 6.7
Reading 6 13.0 Heidelbeg 1 6.7
Montevideo 2 4.3 Montevideo 1 6.7
Berta 1 2.2 Uganda 1 6.7Heidelberg 1 2.2
Meleagridis 1 2.2
Ohio 1 2.2
Typhimurium 13 59.1
Newport 5 22.7
Montevideo 2 9.1
Give 1 4.5
Ohio 1 4.5
Source Serotype n % Source Serotype n % Source Serotype n %
Typhimurium 3 100.0 Typhimurium 8 72.7Give 1 9.1Infantis 1 9.1
Newport 1 9.1
Infantis 2 33.3
Agona 1 16.7
Heidelberg 1 16.7
Reading 1 16.7
Typhimurium 1 16.7
1 In 2012 and 2013, FSIS did not sample pork products for Salmonella because in prior years the percent of pork carcass samples positive for Salmonella was consistently low
Retail Pork Chops (N=3)
HACCP1
(N=0)
Cecal (Market Hogs) (N=11)
Cecal (Sows) (N=6)
Retail Ground Beef (N=4)
HACCP (N=46)
Cecal (Beef) (N=15)
Cecal (Dairy) (N=22)
Swine
Turkeys
Retail Ground Turkey (N=7)
HACCP (N=2)
Cecal (N=1)
Cattle
Chickens
Retail Chickens (N=40)
HACCP (N=28)
Cecal (N=3)
Humans (N=87)
47
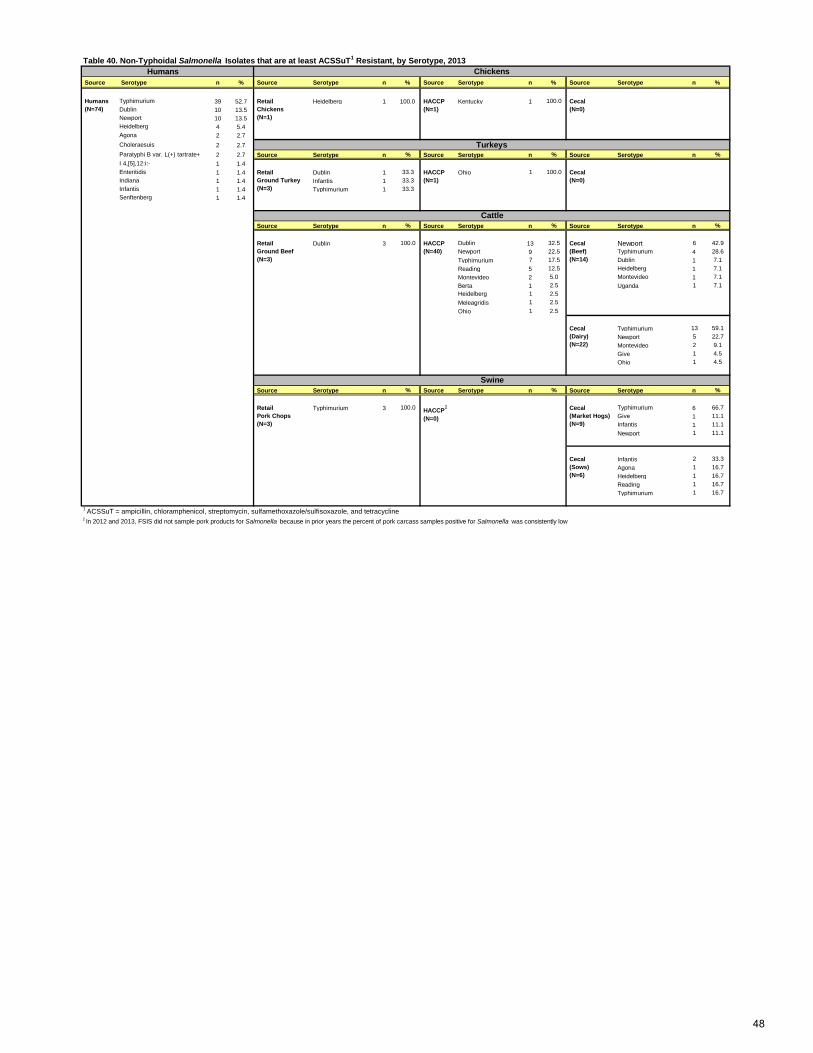
Humans Source Serotype n % Source Serotype n % Source Serotype n % Source Serotype n %
Typhimurium 39 52.7 Heidelberg 1 100.0 Kentucky 1 100.0Dublin 10 13.5Newport 10 13.5Heidelberg 4 5.4Agona 2 2.7Choleraesuis 2 2.7Paratyphi B var. L(+) tartrate+ 2 2.7 Source Serotype n % Source Serotype n % Source Serotype n %I 4,[5],12:i:- 1 1.4Enteritidis 1 1.4 Dublin 1 33.3 Ohio 1 100.0Indiana 1 1.4 Infantis 1 33.3Infantis 1 1.4 Typhimurium 1 33.3Senftenberg 1 1.4
Source Serotype n % Source Serotype n % Source Serotype n %
Dublin 3 100.0 Dublin 13 32.5 Newport 6 42.9Newport 9 22.5 Typhimurium 4 28.6Typhimurium 7 17.5 Dublin 1 7.1Reading 5 12.5 Heidelberg 1 7.1Montevideo 2 5.0 Montevideo 1 7.1Berta 1 2.5 Uganda 1 7.1Heidelberg 1 2.5Meleagridis 1 2.5Ohio 1 2.5
Typhimurium 13 59.1Newport 5 22.7Montevideo 2 9.1Give 1 4.5Ohio 1 4.5
Source Serotype n % Source Serotype n % Source Serotype n %
Typhimurium 3 100.0 Typhimurium 6 66.7Give 1 11.1Infantis 1 11.1Newport 1 11.1
Infantis 2 33.3Agona 1 16.7Heidelberg 1 16.7Reading 1 16.7Typhimurium 1 16.7
Retail Pork Chops (N=3)
HACCP2
(N=0)
Cecal (Market Hogs) (N=9)
Cecal (Sows) (N=6)
2 In 2012 and 2013, FSIS did not sample pork products for Salmonella because in prior years the percent of pork carcass samples positive for Salmonella was consistently low
1 ACSSuT = ampicillin, chloramphenicol, streptomycin, sulfamethoxazole/sulfisoxazole, and tetracycline
Retail Ground Beef (N=3)
HACCP (N=40)
Cecal (Beef) (N=14)
Cecal (Dairy) (N=22)
Swine
Turkeys
Retail Ground Turkey (N=3)
HACCP (N=1)
Cecal (N=0)
Cattle
Table 40. Non-Typhoidal Salmonella Isolates that are at least ACSSuT1 Resistant, by Serotype, 2013Chickens
Humans (N=74)
Retail Chickens (N=1)
HACCP (N=1)
Cecal (N=0)
48
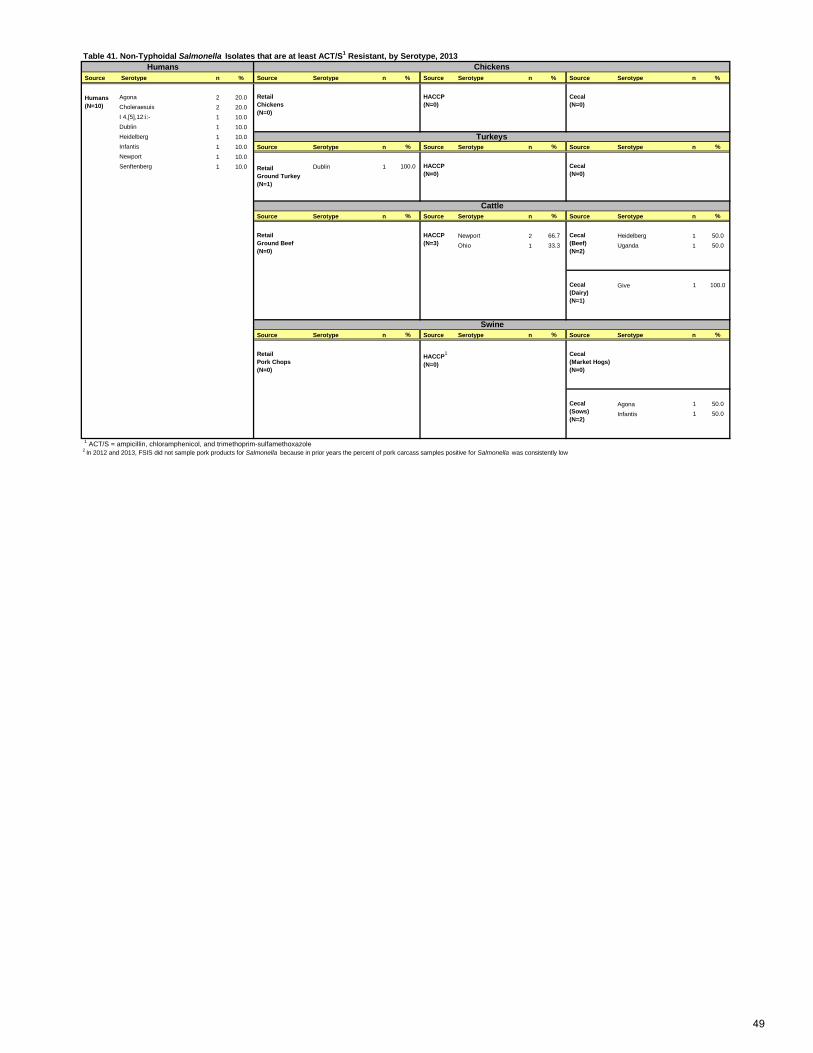
Humans Source Serotype n % Source Serotype n % Source Serotype n % Source Serotype n %
Agona 2 20.0Choleraesuis 2 20.0I 4,[5],12:i:- 1 10.0Dublin 1 10.0Heidelberg 1 10.0Infantis 1 10.0 Source Serotype n % Source Serotype n % Source Serotype n %Newport 1 10.0Senftenberg 1 10.0 Dublin 1 100.0
Source Serotype n % Source Serotype n % Source Serotype n %
Newport 2 66.7 Heidelberg 1 50.0Ohio 1 33.3 Uganda 1 50.0
Give 1 100.0
Source Serotype n % Source Serotype n % Source Serotype n %
Agona 1 50.0
Infantis 1 50.0
1 ACT/S = ampicillin, chloramphenicol, and trimethoprim-sulfamethoxazole2 In 2012 and 2013, FSIS did not sample pork products for Salmonella because in prior years the percent of pork carcass samples positive for Salmonella was consistently low
Retail Pork Chops (N=0)
HACCP1
(N=0)
Cecal (Market Hogs) (N=0)
Cecal (Sows) (N=2)
Retail Ground Beef (N=0)
HACCP (N=3)
Cecal (Beef) (N=2)
Cecal (Dairy) (N=1)
Swine
Turkeys
Retail Ground Turkey (N=1)
HACCP (N=0)
Cecal (N=0)
Cattle
Table 41. Non-Typhoidal Salmonella Isolates that are at least ACT/S1 Resistant, by Serotype, 2013Chickens
Humans (N=10)
Retail Chickens (N=0)
HACCP (N=0)
Cecal (N=0)
49
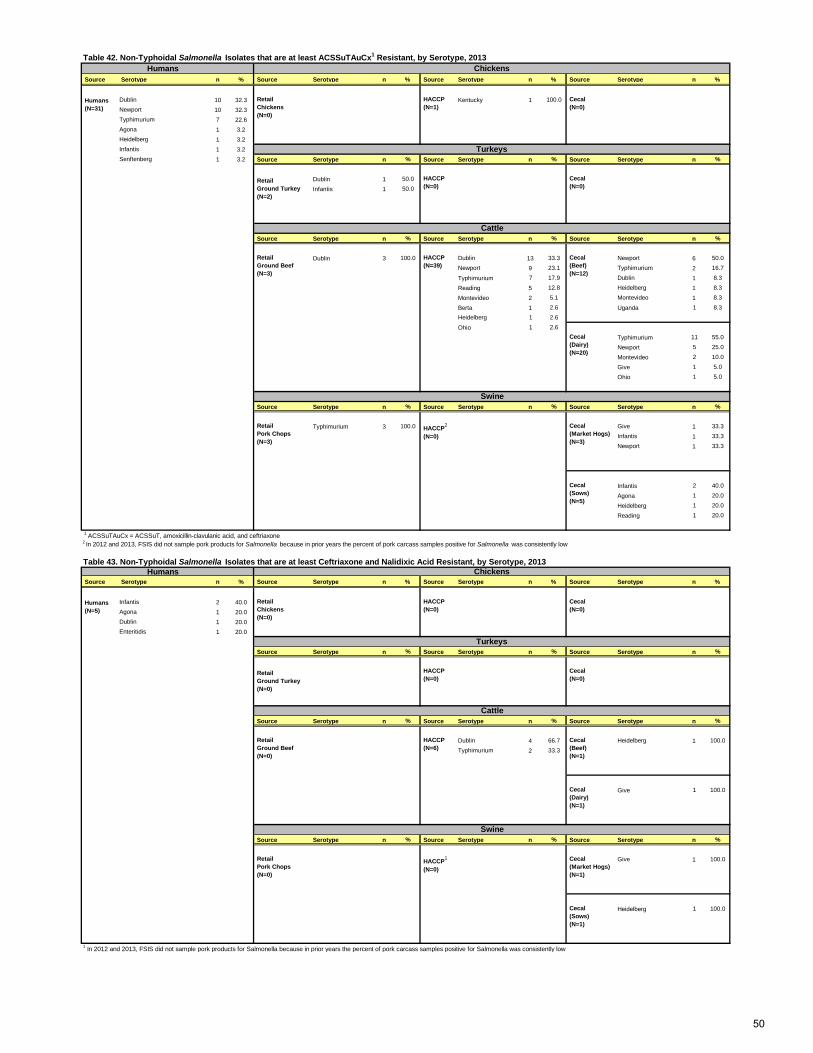
Humans Source Serotype n % Source Serotype n % Source Serotype n % Source Serotype n %
Dublin 10 32.3 Kentucky 1 100.0Newport 10 32.3Typhimurium 7 22.6Agona 1 3.2Heidelberg 1 3.2Infantis 1 3.2Senftenberg 1 3.2 Source Serotype n % Source Serotype n % Source Serotype n %
Dublin 1 50.0
Infantis 1 50.0
Source Serotype n % Source Serotype n % Source Serotype n %
Dublin 3 100.0 Dublin 13 33.3 Newport 6 50.0Newport 9 23.1 Typhimurium 2 16.7
Typhimurium 7 17.9 Dublin 1 8.3
Reading 5 12.8 Heidelberg 1 8.3
Montevideo 2 5.1 Montevideo 1 8.3
Berta 1 2.6 Uganda 1 8.3Heidelberg 1 2.6
Ohio 1 2.6
Typhimurium 11 55.0
Newport 5 25.0
Montevideo 2 10.0
Give 1 5.0
Ohio 1 5.0
Source Serotype n % Source Serotype n % Source Serotype n %
Typhimurium 3 100.0 Give 1 33.3Infantis 1 33.3Newport 1 33.3
Infantis 2 40.0
Agona 1 20.0
Heidelberg 1 20.0
Reading 1 20.0
Humans Source Serotype n % Source Serotype n % Source Serotype n % Source Serotype n %
Infantis 2 40.0Agona 1 20.0Dublin 1 20.0Enteritidis 1 20.0
Source Serotype n % Source Serotype n % Source Serotype n %
Source Serotype n % Source Serotype n % Source Serotype n %
Dublin 4 66.7 Heidelberg 1 100.0Typhimurium 2 33.3
Give 1 100.0
Source Serotype n % Source Serotype n % Source Serotype n %
Give 1 100.0
Heidelberg 1 100.0
Retail Ground Beef (N=3)
HACCP (N=39)
Cecal (Beef) (N=12)
Cecal (Dairy) (N=20)
Swine
2 In 2012 and 2013, FSIS did not sample pork products for Salmonella because in prior years the percent of pork carcass samples positive for Salmonella was consistently low
1 ACSSuTAuCx = ACSSuT, amoxicillin-clavulanic acid, and ceftriaxone
Table 43. Non-Typhoidal Salmonella Isolates that are at least Ceftriaxone and Nalidixic Acid Resistant, by Serotype, 2013
Cattle
Turkeys
Chickens
Retail Ground Turkey (N=0)
HACCP (N=0)
Cecal (N=0)
Humans (N=5)
Retail Chickens (N=0)
HACCP (N=0)
Cecal (N=0)
Retail Pork Chops (N=3)
HACCP2
(N=0)
Cecal (Market Hogs) (N=3)
Cecal (Sows) (N=5)
1 In 2012 and 2013, FSIS did not sample pork products for Salmonella because in prior years the percent of pork carcass samples positive for Salmonella was consistently low
Retail Pork Chops (N=0)
HACCP1
(N=0)
Cecal (Market Hogs) (N=1)
Cecal (Sows) (N=1)
Retail Ground Beef (N=0)
HACCP (N=6)
Cecal (Beef) (N=1)
Cecal (Dairy) (N=1)
Swine
Turkeys
Retail Ground Turkey (N=2)
HACCP (N=0)
Cecal (N=0)
Cattle
Chickens
Humans (N=31)
Retail Chickens (N=0)
HACCP (N=1)
Cecal (N=0)
Table 42. Non-Typhoidal Salmonella Isolates that are at least ACSSuTAuCx1 Resistant, by Serotype, 2013
50
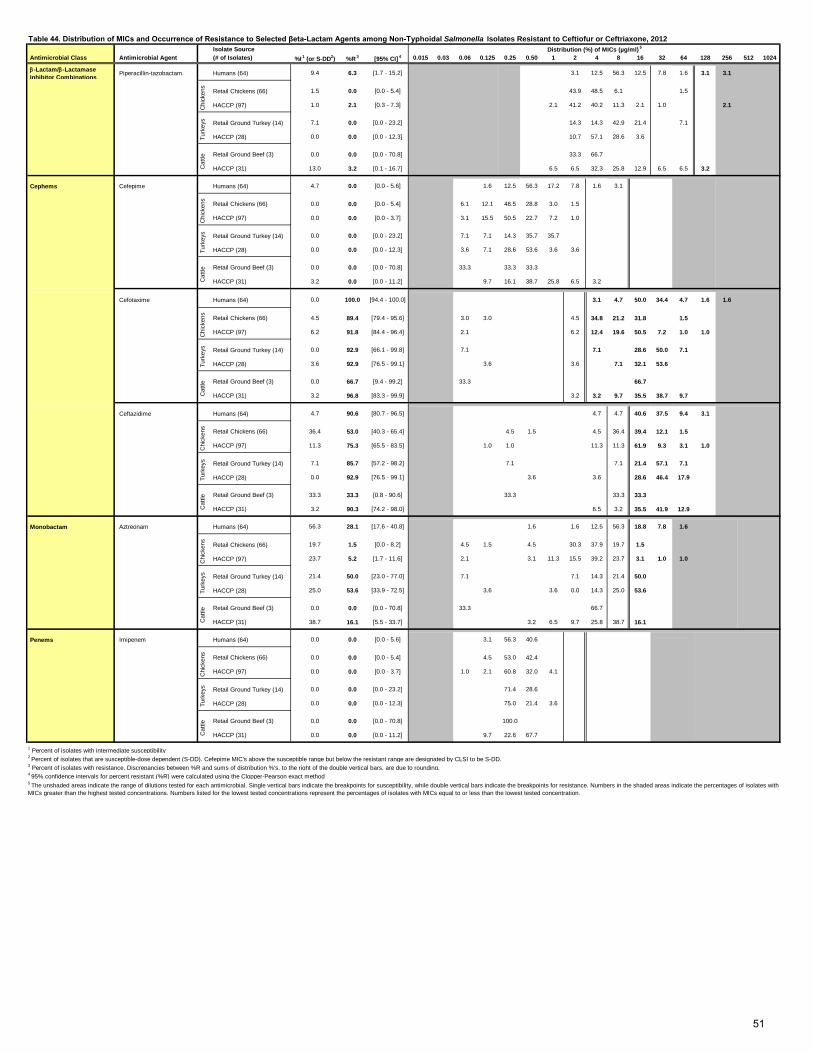
Isolate Source Antimicrobial Class Antimicrobial Agent (# of Isolates) %I
1 (or S-DD2) %R 3 [95% CI]
4 0.015 0.03 0.06 0.125 0.25 0.50 1 2 4 8 16 32 64 128 256 512 1024
β-Lactam/β-Lactamase Inhibitor Combinations Piperacillin-tazobactam Humans (64) 9.4 6.3 [1.7 - 15.2] 3.1 12.5 56.3 12.5 7.8 1.6 3.1 3.1
Retail Chickens (66) 1.5 0.0 [0.0 - 5.4] 43.9 48.5 6.1 1.5
HACCP (97) 1.0 2.1 [0.3 - 7.3] 2.1 41.2 40.2 11.3 2.1 1.0 2.1
Retail Ground Turkey (14) 7.1 0.0 [0.0 - 23.2] 14.3 14.3 42.9 21.4 7.1
HACCP (28) 0.0 0.0 [0.0 - 12.3] 10.7 57.1 28.6 3.6
Retail Ground Beef (3) 0.0 0.0 [0.0 - 70.8] 33.3 66.7
HACCP (31) 13.0 3.2 [0.1 - 16.7] 6.5 6.5 32.3 25.8 12.9 6.5 6.5 3.2
Cephems Cefepime Humans (64) 4.7 0.0 [0.0 - 5.6] 1.6 12.5 56.3 17.2 7.8 1.6 3.1
Retail Chickens (66) 0.0 0.0 [0.0 - 5.4] 6.1 12.1 48.5 28.8 3.0 1.5
HACCP (97) 0.0 0.0 [0.0 - 3.7] 3.1 15.5 50.5 22.7 7.2 1.0
Retail Ground Turkey (14) 0.0 0.0 [0.0 - 23.2] 7.1 7.1 14.3 35.7 35.7
HACCP (28) 0.0 0.0 [0.0 - 12.3] 3.6 7.1 28.6 53.6 3.6 3.6
Retail Ground Beef (3) 0.0 0.0 [0.0 - 70.8] 33.3 33.3 33.3
HACCP (31) 3.2 0.0 [0.0 - 11.2] 9.7 16.1 38.7 25.8 6.5 3.2
Cefotaxime Humans (64) 0.0 100.0 [94.4 - 100.0] 3.1 4.7 50.0 34.4 4.7 1.6 1.6
Retail Chickens (66) 4.5 89.4 [79.4 - 95.6] 3.0 3.0 4.5 34.8 21.2 31.8 1.5
HACCP (97) 6.2 91.8 [84.4 - 96.4] 2.1 6.2 12.4 19.6 50.5 7.2 1.0 1.0
Retail Ground Turkey (14) 0.0 92.9 [66.1 - 99.8] 7.1 7.1 28.6 50.0 7.1
HACCP (28) 3.6 92.9 [76.5 - 99.1] 3.6 3.6 7.1 32.1 53.6
Retail Ground Beef (3) 0.0 66.7 [9.4 - 99.2] 33.3 66.7
HACCP (31) 3.2 96.8 [83.3 - 99.9] 3.2 3.2 9.7 35.5 38.7 9.7
Ceftazidime Humans (64) 4.7 90.6 [80.7 - 96.5] 4.7 4.7 40.6 37.5 9.4 3.1
Retail Chickens (66) 36.4 53.0 [40.3 - 65.4] 4.5 1.5 4.5 36.4 39.4 12.1 1.5
HACCP (97) 11.3 75.3 [65.5 - 83.5] 1.0 1.0 11.3 11.3 61.9 9.3 3.1 1.0
Retail Ground Turkey (14) 7.1 85.7 [57.2 - 98.2] 7.1 7.1 21.4 57.1 7.1
HACCP (28) 0.0 92.9 [76.5 - 99.1] 3.6 3.6 28.6 46.4 17.9
Retail Ground Beef (3) 33.3 33.3 [0.8 - 90.6] 33.3 33.3 33.3
HACCP (31) 3.2 90.3 [74.2 - 98.0] 6.5 3.2 35.5 41.9 12.9
Monobactam Aztreonam Humans (64) 56.3 28.1 [17.6 - 40.8] 1.6 1.6 12.5 56.3 18.8 7.8 1.6
Retail Chickens (66) 19.7 1.5 [0.0 - 8.2] 4.5 1.5 4.5 30.3 37.9 19.7 1.5
HACCP (97) 23.7 5.2 [1.7 - 11.6] 2.1 3.1 11.3 15.5 39.2 23.7 3.1 1.0 1.0
Retail Ground Turkey (14) 21.4 50.0 [23.0 - 77.0] 7.1 7.1 14.3 21.4 50.0
HACCP (28) 25.0 53.6 [33.9 - 72.5] 3.6 3.6 0.0 14.3 25.0 53.6
Retail Ground Beef (3) 0.0 0.0 [0.0 - 70.8] 33.3 66.7
HACCP (31) 38.7 16.1 [5.5 - 33.7] 3.2 6.5 9.7 25.8 38.7 16.1
Penems Imipenem Humans (64) 0.0 0.0 [0.0 - 5.6] 3.1 56.3 40.6
Retail Chickens (66) 0.0 0.0 [0.0 - 5.4] 4.5 53.0 42.4
HACCP (97) 0.0 0.0 [0.0 - 3.7] 1.0 2.1 60.8 32.0 4.1
Retail Ground Turkey (14) 0.0 0.0 [0.0 - 23.2] 71.4 28.6
HACCP (28) 0.0 0.0 [0.0 - 12.3] 75.0 21.4 3.6
Retail Ground Beef (3) 0.0 0.0 [0.0 - 70.8] 100.0
HACCP (31) 0.0 0.0 [0.0 - 11.2] 9.7 22.6 67.7
1 Percent of isolates with intermediate susceptibility2 Percent of isolates that are susceptible-dose dependent (S-DD). Cefepime MIC's above the susceptible range but below the resistant range are designated by CLSI to be S-DD.3 Percent of isolates with resistance. Discrepancies between %R and sums of distribution %'s, to the right of the double vertical bars, are due to rounding.4 95% confidence intervals for percent resistant (%R) were calculated using the Clopper-Pearson exact method
Turk
eys
Cat
tle
5 The unshaded areas indicate the range of dilutions tested for each antimicrobial. Single vertical bars indicate the breakpoints for susceptibility, while double vertical bars indicate the breakpoints for resistance. Numbers in the shaded areas indicate the percentages of isolates with MICs greater than the highest tested concentrations. Numbers listed for the lowest tested concentrations represent the percentages of isolates with MICs equal to or less than the lowest tested concentration.
Chi
cken
sTu
rkey
sC
attle
Chi
cken
sC
attle
Table 44. Distribution of MICs and Occurrence of Resistance to Selected βeta-Lactam Agents among Non-Typhoidal Salmonella Isolates Resistant to Ceftiofur or Ceftriaxone, 2012 Distribution (%) of MICs (µg/ml)
5
Chi
cken
sTu
rkey
sC
attle
Chi
cken
sTu
rkey
sC
attle
Chi
cken
sTu
rkey
sC
attle
Chi
cken
sTu
rkey
s
51
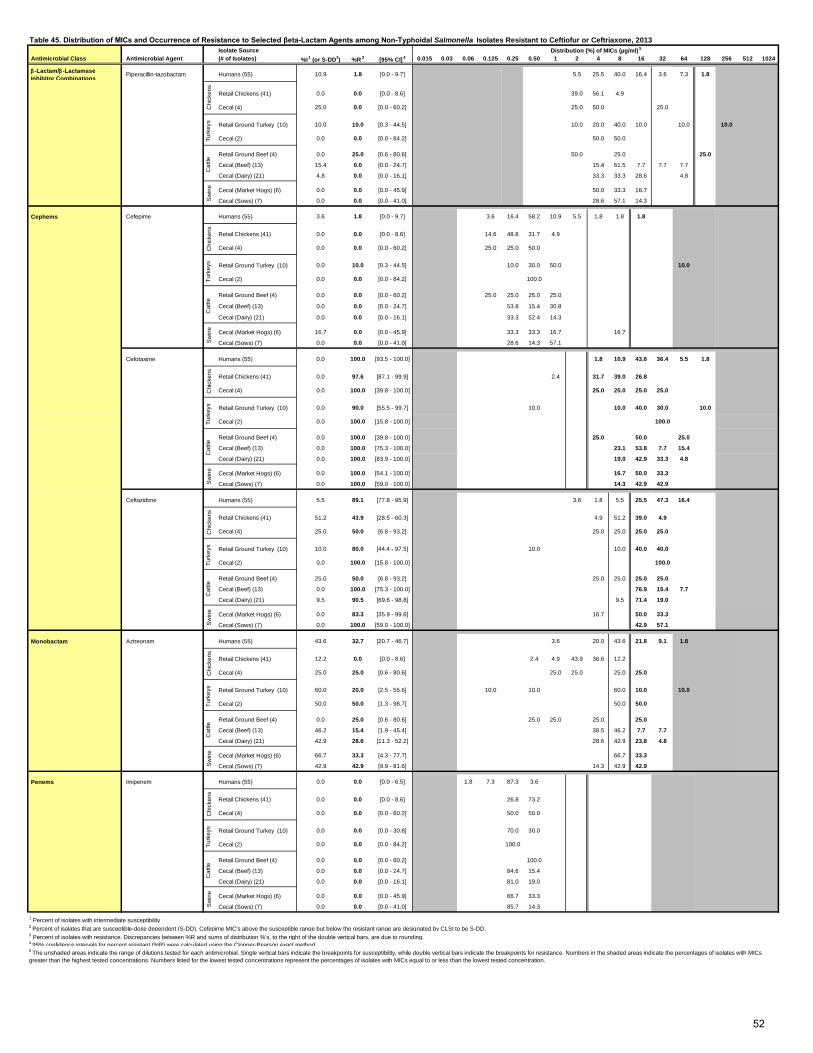
Isolate Source Antimicrobial Class Antimicrobial Agent (# of Isolates) %I
1 (or S-DD2) %R 3 [95% CI]
4 0.015 0.03 0.06 0.125 0.25 0.50 1 2 4 8 16 32 64 128 256 512 1024
β-Lactam/β-Lactamase Inhibitor Combinations
Piperacillin-tazobactam Humans (55) 10.9 1.8 [0.0 - 9.7] 5.5 25.5 40.0 16.4 3.6 7.3 1.8
Retail Chickens (41) 0.0 0.0 [0.0 - 8.6] 39.0 56.1 4.9
Cecal (4) 25.0 0.0 [0.0 - 60.2] 25.0 50.0 25.0
Retail Ground Turkey (10) 10.0 10.0 [0.3 - 44.5] 10.0 20.0 40.0 10.0 10.0 10.0
Cecal (2) 0.0 0.0 [0.0 - 84.2] 50.0 50.0
Retail Ground Beef (4) 0.0 25.0 [0.6 - 80.6] 50.0 25.0 25.0
Cecal (Beef) (13) 15.4 0.0 [0.0 - 24.7] 15.4 61.5 7.7 7.7 7.7
Cecal (Dairy) (21) 4.8 0.0 [0.0 - 16.1] 33.3 33.3 28.6 4.8
Cecal (Market Hogs) (6) 0.0 0.0 [0.0 - 45.9] 50.0 33.3 16.7
Cecal (Sows) (7) 0.0 0.0 [0.0 - 41.0] 28.6 57.1 14.3
Cephems Cefepime Humans (55) 3.6 1.8 [0.0 - 9.7] 3.6 16.4 58.2 10.9 5.5 1.8 1.8 1.8
Retail Chickens (41) 0.0 0.0 [0.0 - 8.6] 14.6 48.8 31.7 4.9
Cecal (4) 0.0 0.0 [0.0 - 60.2] 25.0 25.0 50.0
Retail Ground Turkey (10) 0.0 10.0 [0.3 - 44.5] 10.0 30.0 50.0 10.0
Cecal (2) 0.0 0.0 [0.0 - 84.2] 100.0
Retail Ground Beef (4) 0.0 0.0 [0.0 - 60.2] 25.0 25.0 25.0 25.0
Cecal (Beef) (13) 0.0 0.0 [0.0 - 24.7] 53.8 15.4 30.8
Cecal (Dairy) (21) 0.0 0.0 [0.0 - 16.1] 33.3 52.4 14.3
Cecal (Market Hogs) (6) 16.7 0.0 [0.0 - 45.9] 33.3 33.3 16.7 16.7
Cecal (Sows) (7) 0.0 0.0 [0.0 - 41.0] 28.6 14.3 57.1
Cefotaxime Humans (55) 0.0 100.0 [93.5 - 100.0] 1.8 10.9 43.6 36.4 5.5 1.8
Retail Chickens (41) 0.0 97.6 [87.1 - 99.9] 2.4 31.7 39.0 26.8
Cecal (4) 0.0 100.0 [39.8 - 100.0] 25.0 25.0 25.0 25.0
Retail Ground Turkey (10) 0.0 90.0 [55.5 - 99.7] 10.0 10.0 40.0 30.0 10.0
Cecal (2) 0.0 100.0 [15.8 - 100.0] 100.0
Retail Ground Beef (4) 0.0 100.0 [39.8 - 100.0] 25.0 50.0 25.0
Cecal (Beef) (13) 0.0 100.0 [75.3 - 100.0] 23.1 53.8 7.7 15.4
Cecal (Dairy) (21) 0.0 100.0 [83.9 - 100.0] 19.0 42.9 33.3 4.8
Cecal (Market Hogs) (6) 0.0 100.0 [54.1 - 100.0] 16.7 50.0 33.3
Cecal (Sows) (7) 0.0 100.0 [59.0 - 100.0] 14.3 42.9 42.9
Ceftazidime Humans (55) 5.5 89.1 [77.8 - 95.9] 3.6 1.8 5.5 25.5 47.3 16.4
Retail Chickens (41) 51.2 43.9 [28.5 - 60.3] 4.9 51.2 39.0 4.9
Cecal (4) 25.0 50.0 [6.8 - 93.2] 25.0 25.0 25.0 25.0
Retail Ground Turkey (10) 10.0 80.0 [44.4 - 97.5] 10.0 10.0 40.0 40.0
Cecal (2) 0.0 100.0 [15.8 - 100.0] 100.0
Retail Ground Beef (4) 25.0 50.0 [6.8 - 93.2] 25.0 25.0 25.0 25.0
Cecal (Beef) (13) 0.0 100.0 [75.3 - 100.0] 76.9 15.4 7.7
Cecal (Dairy) (21) 9.5 90.5 [69.6 - 98.8] 9.5 71.4 19.0
Cecal (Market Hogs) (6) 0.0 83.3 [35.9 - 99.6] 16.7 50.0 33.3
Cecal (Sows) (7) 0.0 100.0 [59.0 - 100.0] 42.9 57.1
Monobactam Aztreonam Humans (55) 43.6 32.7 [20.7 - 46.7] 3.6 20.0 43.6 21.8 9.1 1.8
Retail Chickens (41) 12.2 0.0 [0.0 - 8.6] 2.4 4.9 43.9 36.6 12.2
Cecal (4) 25.0 25.0 [0.6 - 80.6] 25.0 25.0 25.0 25.0
Retail Ground Turkey (10) 60.0 20.0 [2.5 - 55.6] 10.0 10.0 60.0 10.0 10.0
Cecal (2) 50.0 50.0 [1.3 - 98.7] 50.0 50.0
Retail Ground Beef (4) 0.0 25.0 [0.6 - 80.6] 25.0 25.0 25.0 25.0
Cecal (Beef) (13) 46.2 15.4 [1.9 - 45.4] 38.5 46.2 7.7 7.7
Cecal (Dairy) (21) 42.9 28.6 [11.3 - 52.2] 28.6 42.9 23.8 4.8
Cecal (Market Hogs) (6) 66.7 33.3 [4.3 - 77.7] 66.7 33.3
Cecal (Sows) (7) 42.9 42.9 [9.9 - 81.6] 14.3 42.9 42.9
Penems Imipenem Humans (55) 0.0 0.0 [0.0 - 6.5] 1.8 7.3 87.3 3.6
Retail Chickens (41) 0.0 0.0 [0.0 - 8.6] 26.8 73.2
Cecal (4) 0.0 0.0 [0.0 - 60.2] 50.0 50.0
Retail Ground Turkey (10) 0.0 0.0 [0.0 - 30.8] 70.0 30.0
Cecal (2) 0.0 0.0 [0.0 - 84.2] 100.0
Retail Ground Beef (4) 0.0 0.0 [0.0 - 60.2] 100.0
Cecal (Beef) (13) 0.0 0.0 [0.0 - 24.7] 84.6 15.4
Cecal (Dairy) (21) 0.0 0.0 [0.0 - 16.1] 81.0 19.0
Cecal (Market Hogs) (6) 0.0 0.0 [0.0 - 45.9] 66.7 33.3
Cecal (Sows) (7) 0.0 0.0 [0.0 - 41.0] 85.7 14.3
1 Percent of isolates with intermediate susceptibility2 Percent of isolates that are susceptible-dose dependent (S-DD). Cefepime MIC's above the susceptible range but below the resistant range are designated by CLSI to be S-DD.3 Percent of isolates with resistance. Discrepancies between %R and sums of distribution %'s, to the right of the double vertical bars, are due to rounding.4 95% confidence intervals for percent resistant (%R) were calculated using the Clopper-Pearson exact method5 The unshaded areas indicate the range of dilutions tested for each antimicrobial. Single vertical bars indicate the breakpoints for susceptibility, while double vertical bars indicate the breakpoints for resistance. Numbers in the shaded areas indicate the percentages of isolates with MICs greater than the highest tested concentrations. Numbers listed for the lowest tested concentrations represent the percentages of isolates with MICs equal to or less than the lowest tested concentration.
Turk
eys
Cat
tleC
hick
ens
Chi
cken
sS
win
eC
attle
Sw
ine
Sw
ine
Turk
eys
Turk
eys
Cat
tleTu
rkey
sC
attle
Turk
eys
Sw
ine
Sw
ine
Sw
ine
Chi
cken
sC
hick
ens
Chi
cken
sC
attle
Cat
tle
Table 45. Distribution of MICs and Occurrence of Resistance to Selected βeta-Lactam Agents among Non-Typhoidal Salmonella Isolates Resistant to Ceftiofur or Ceftriaxone, 2013 Distribution (%) of MICs (µg/ml)
5
Turk
eys
Chi
cken
s
52
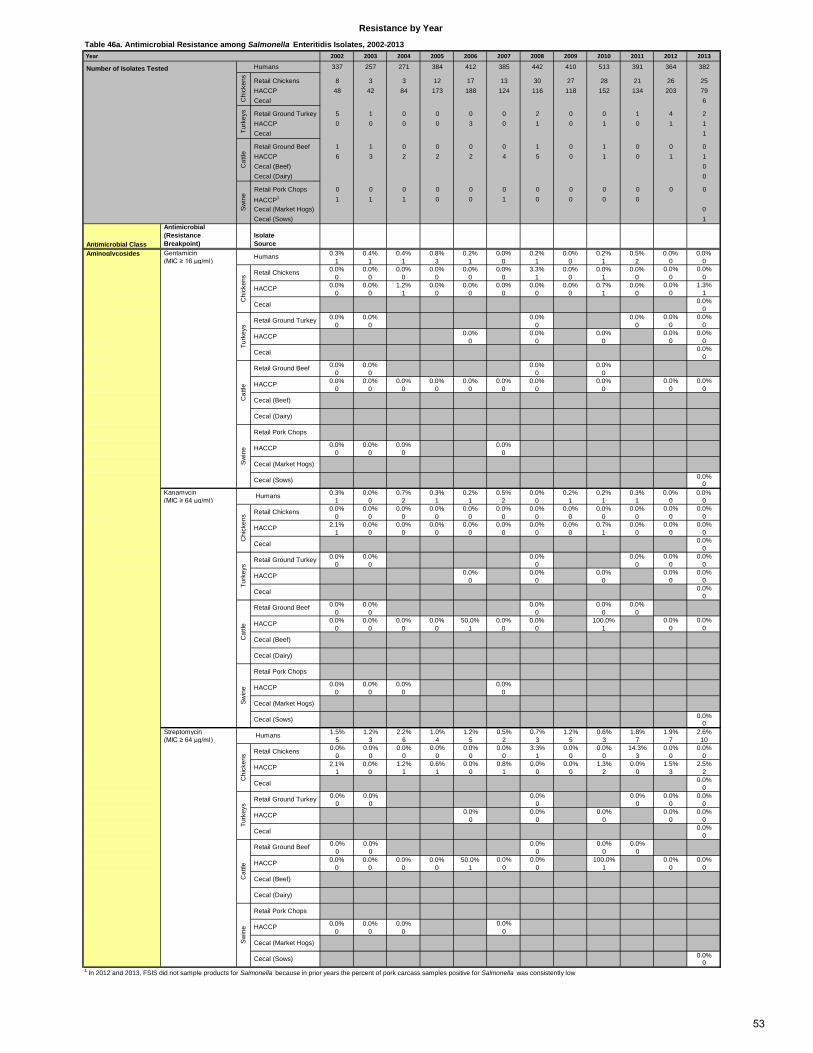
Table 46a. Antimicrobial Resistance among Salmonella Enteritidis Isolates, 2002-2013 Year 2002 2003 2004 2005 2006 2007 2008 2009 2010 2011 2012 2013
Humans 337 257 271 384 412 385 442 410 513 391 364 382
Retail Chickens 8 3 3 12 17 13 30 27 28 21 26 25 HACCP 48 42 84 173 188 124 116 118 152 134 203 79 Cecal 6
Retail Ground Turkey 5 1 0 0 0 0 2 0 0 1 4 2 HACCP 0 0 0 0 3 0 1 0 1 0 1 1 Cecal 1
Retail Ground Beef 1 1 0 0 0 0 1 0 1 0 0 0 HACCP 6 3 2 2 2 4 5 0 1 0 1 1 Cecal (Beef) 0 Cecal (Dairy) 0
Retail Pork Chops 0 0 0 0 0 0 0 0 0 0 0 0 HACCP1 1 1 1 0 0 1 0 0 0 0 Cecal (Market Hogs) 0 Cecal (Sows) 1
Antimicrobial Class
Antimicrobial (Resistance Breakpoint)
Isolate Source
Aminoglycosides Gentamicin 0.3% 0.4% 0.4% 0.8% 0.2% 0.0% 0.2% 0.0% 0.2% 0.5% 0.0% 0.0% (MIC ≥ 16 µg/ml) 1 1 1 3 1 0 1 0 1 2 0 0
0.0% 0.0% 0.0% 0.0% 0.0% 0.0% 3.3% 0.0% 0.0% 0.0% 0.0% 0.0%0 0 0 0 0 0 1 0 1 0 0 0
0.0% 0.0% 1.2% 0.0% 0.0% 0.0% 0.0% 0.0% 0.7% 0.0% 0.0% 1.3%0 0 1 0 0 0 0 0 1 0 0 1
0.0%0
0.0% 0.0% 0.0% 0.0% 0.0% 0.0%0 0 0 0 0 0
0.0% 0.0% 0.0% 0.0% 0.0%0 0 0 0 0
0.0%0
0.0% 0.0% 0.0% 0.0%0 0 0 0
0.0% 0.0% 0.0% 0.0% 0.0% 0.0% 0.0% 0.0% 0.0% 0.0%0 0 0 0 0 0 0 0 0 0
0.0% 0.0% 0.0% 0.0%0 0 0 0
0.0%0
Kanamycin 0.3% 0.0% 0.7% 0.3% 0.2% 0.5% 0.0% 0.2% 0.2% 0.3% 0.0% 0.0% (MIC ≥ 64 µg/ml) 1 0 2 1 1 2 0 1 1 1 0 0
0.0% 0.0% 0.0% 0.0% 0.0% 0.0% 0.0% 0.0% 0.0% 0.0% 0.0% 0.0%0 0 0 0 0 0 0 0 0 0 0 0
2.1% 0.0% 0.0% 0.0% 0.0% 0.0% 0.0% 0.0% 0.7% 0.0% 0.0% 0.0%1 0 0 0 0 0 0 0 1 0 0 0
0.0%0
0.0% 0.0% 0.0% 0.0% 0.0% 0.0%0 0 0 0 0 0
0.0% 0.0% 0.0% 0.0% 0.0%0 0 0 0 0
0.0%0
0.0% 0.0% 0.0% 0.0% 0.0%0 0 0 0 0
0.0% 0.0% 0.0% 0.0% 50.0% 0.0% 0.0% 100.0% 0.0% 0.0%0 0 0 0 1 0 0 1 0 0
0.0% 0.0% 0.0% 0.0%0 0 0 0
0.0%0
Streptomycin 1.5% 1.2% 2.2% 1.0% 1.2% 0.5% 0.7% 1.2% 0.6% 1.8% 1.9% 2.6% (MIC ≥ 64 µg/ml) 5 3 6 4 5 2 3 5 3 7 7 10
0.0% 0.0% 0.0% 0.0% 0.0% 0.0% 3.3% 0.0% 0.0% 14.3% 0.0% 0.0%0 0 0 0 0 0 1 0 0 3 0 0
2.1% 0.0% 1.2% 0.6% 0.0% 0.8% 0.0% 0.0% 1.3% 0.0% 1.5% 2.5%1 0 1 1 0 1 0 0 2 0 3 2
0.0%0
0.0% 0.0% 0.0% 0.0% 0.0% 0.0%0 0 0 0 0 0
0.0% 0.0% 0.0% 0.0% 0.0%0 0 0 0 0
0.0%0
0.0% 0.0% 0.0% 0.0% 0.0%0 0 0 0 0
0.0% 0.0% 0.0% 0.0% 50.0% 0.0% 0.0% 100.0% 0.0% 0.0%0 0 0 0 1 0 0 1 0 0
0.0% 0.0% 0.0% 0.0%0 0 0 0
0.0%0
1 In 2012 and 2013, FSIS did not sample products for Salmonella because in prior years the percent of pork carcass samples positive for Salmonella was consistently low
Resistance by Year
Swin
e
Retail Pork Chops
HACCP
Cecal (Market Hogs)
Cecal (Sows)
Cecal (Beef)Cat
tle
Retail Ground Beef
Cecal (Dairy)
HACCP
Turk
eys
Retail Ground Turkey
HACCP
Cecal
HACCP
Humans
Chi
cken
s Retail Chickens
Cecal
Swin
e
Retail Pork Chops
HACCP
Cecal (Market Hogs)
Cecal (Sows)
HACCP
Cecal (Beef)Cat
tle
Retail Ground Beef
Cecal (Dairy)
Turk
eys
Retail Ground Turkey
HACCP
Cecal
HACCP
Humans
Chi
cken
s Retail Chickens
Cecal
Swin
e
Retail Pork Chops
HACCP
Cecal (Market Hogs)
Cecal (Sows)
HACCP
Cecal (Beef)Cat
tle
Retail Ground Beef
Cecal (Dairy)
Turk
eys
Retail Ground Turkey
HACCP
Cecal
Number of Isolates Tested
Chi
cken
sTu
rkey
sC
attle
HACCP
Swin
e
Humans
Chi
cken
s Retail Chickens
Cecal
53
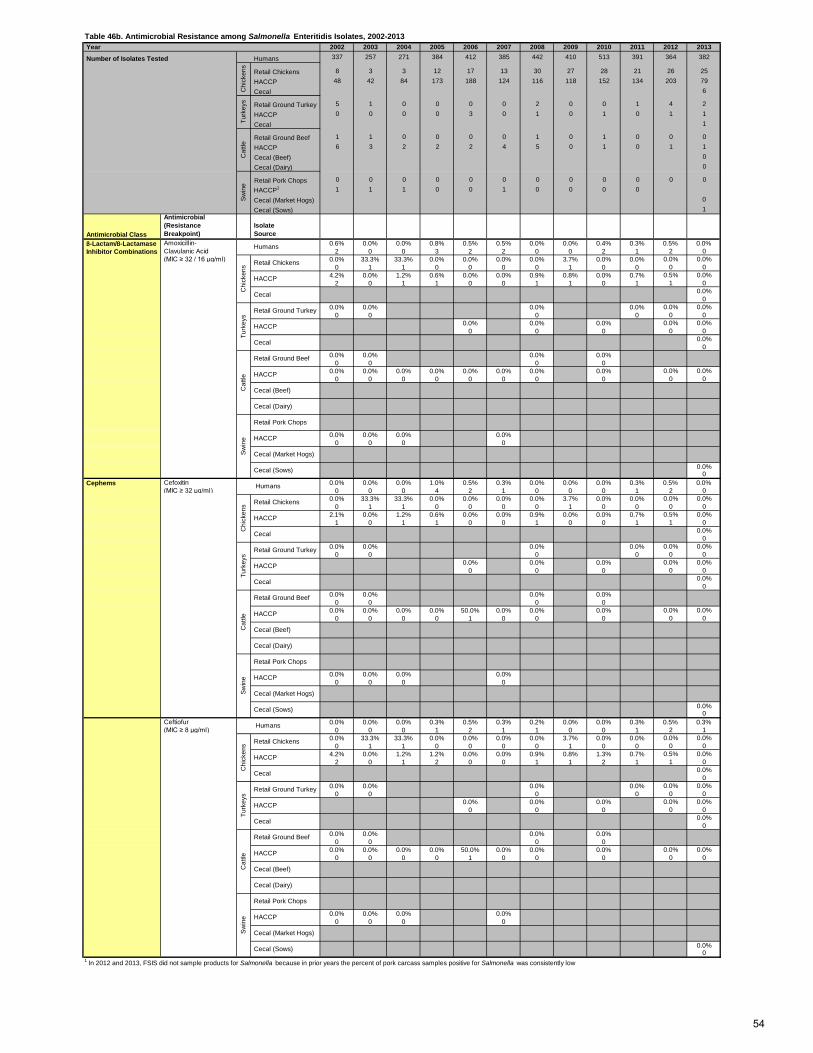
Table 46b. Antimicrobial Resistance among Salmonella Enteritidis Isolates, 2002-2013 Year 2002 2003 2004 2005 2006 2007 2008 2009 2010 2011 2012 2013
Number of Isolates Tested Humans 337 257 271 384 412 385 442 410 513 391 364 382
Retail Chickens 8 3 3 12 17 13 30 27 28 21 26 25 HACCP 48 42 84 173 188 124 116 118 152 134 203 79 Cecal 6
Retail Ground Turkey 5 1 0 0 0 0 2 0 0 1 4 2 HACCP 0 0 0 0 3 0 1 0 1 0 1 1 Cecal 1
Retail Ground Beef 1 1 0 0 0 0 1 0 1 0 0 0 HACCP 6 3 2 2 2 4 5 0 1 0 1 1 Cecal (Beef) 0 Cecal (Dairy) 0
Retail Pork Chops 0 0 0 0 0 0 0 0 0 0 0 0 HACCP1 1 1 1 0 0 1 0 0 0 0 Cecal (Market Hogs) 0 Cecal (Sows) 1
Antimicrobial Class
Antimicrobial (Resistance Breakpoint)
Isolate Source
β-Lactam/β-Lactamase Amoxicillin- 0.6% 0.0% 0.0% 0.8% 0.5% 0.5% 0.0% 0.0% 0.4% 0.3% 0.5% 0.0% Inhibitor Combinations Clavulanic Acid 2 0 0 3 2 2 0 0 2 1 2 0
(MIC ≥ 32 / 16 µg/ml) 0.0% 33.3% 33.3% 0.0% 0.0% 0.0% 0.0% 3.7% 0.0% 0.0% 0.0% 0.0%0 1 1 0 0 0 0 1 0 0 0 0
4.2% 0.0% 1.2% 0.6% 0.0% 0.0% 0.9% 0.8% 0.0% 0.7% 0.5% 0.0%2 0 1 1 0 0 1 1 0 1 1 0
0.0%0
0.0% 0.0% 0.0% 0.0% 0.0% 0.0%0 0 0 0 0 0
0.0% 0.0% 0.0% 0.0% 0.0%0 0 0 0 0
0.0%0
0.0% 0.0% 0.0% 0.0%0 0 0 0
0.0% 0.0% 0.0% 0.0% 0.0% 0.0% 0.0% 0.0% 0.0% 0.0%0 0 0 0 0 0 0 0 0 0
0.0% 0.0% 0.0% 0.0%0 0 0 0
0.0%0
Cefoxitin 0.0% 0.0% 0.0% 1.0% 0.5% 0.3% 0.0% 0.0% 0.0% 0.3% 0.5% 0.0% (MIC ≥ 32 µg/ml) 0 0 0 4 2 1 0 0 0 1 2 0
0.0% 33.3% 33.3% 0.0% 0.0% 0.0% 0.0% 3.7% 0.0% 0.0% 0.0% 0.0%0 1 1 0 0 0 0 1 0 0 0 0
2.1% 0.0% 1.2% 0.6% 0.0% 0.0% 0.9% 0.0% 0.0% 0.7% 0.5% 0.0%1 0 1 1 0 0 1 0 0 1 1 0
0.0%0
0.0% 0.0% 0.0% 0.0% 0.0% 0.0%0 0 0 0 0 0
0.0% 0.0% 0.0% 0.0% 0.0%0 0 0 0 0
0.0%0
0.0% 0.0% 0.0% 0.0%0 0 0 0
0.0% 0.0% 0.0% 0.0% 50.0% 0.0% 0.0% 0.0% 0.0% 0.0%0 0 0 0 1 0 0 0 0 0
0.0% 0.0% 0.0% 0.0%0 0 0 0
0.0%0
Ceftiofur 0.0% 0.0% 0.0% 0.3% 0.5% 0.3% 0.2% 0.0% 0.0% 0.3% 0.5% 0.3% (MIC ≥ 8 µg/ml) 0 0 0 1 2 1 1 0 0 1 2 1
0.0% 33.3% 33.3% 0.0% 0.0% 0.0% 0.0% 3.7% 0.0% 0.0% 0.0% 0.0%0 1 1 0 0 0 0 1 0 0 0 0
4.2% 0.0% 1.2% 1.2% 0.0% 0.0% 0.9% 0.8% 1.3% 0.7% 0.5% 0.0%2 0 1 2 0 0 1 1 2 1 1 0
0.0%0
0.0% 0.0% 0.0% 0.0% 0.0% 0.0%0 0 0 0 0 0
0.0% 0.0% 0.0% 0.0% 0.0%0 0 0 0 0
0.0%0
0.0% 0.0% 0.0% 0.0%0 0 0 0
0.0% 0.0% 0.0% 0.0% 50.0% 0.0% 0.0% 0.0% 0.0% 0.0%0 0 0 0 1 0 0 0 0 0
0.0% 0.0% 0.0% 0.0%0 0 0 0
0.0%0
1 In 2012 and 2013, FSIS did not sample products for Salmonella because in prior years the percent of pork carcass samples positive for Salmonella was consistently low
Cecal (Dairy)
Swin
e
Retail Pork Chops
HACCP
Cecal (Market Hogs)
Cecal (Sows)
Cat
tle HACCP
Cecal (Beef)
Retail Ground Beef
Cecal
Turk
eys
Retail Ground Turkey
HACCP
Cecal
Humans
Chi
cken
s Retail Chickens
Swin
e
Retail Pork Chops
HACCP
Cecal (Market Hogs)
Cecal (Sows)
HACCP
Cat
tle
Retail Ground Beef
HACCP
Cecal (Beef)
Cecal (Dairy)
Turk
eys
Retail Ground Turkey
HACCP
Cecal
Chi
cken
s
HACCP
Cecal
Retail Chickens
HACCP
Cecal (Beef)
Cecal (Dairy)
Chi
cken
s
Cephems Humans
Swin
e
Retail Pork Chops
HACCP
Cecal (Market Hogs)
Cecal (Sows)
Cat
tle
Retail Ground Beef
Turk
eys
Retail Ground Turkey
HACCP
Cecal
HACCP
Cecal
Retail Chickens
Chi
cken
sTu
rkey
sC
attle
Swin
e Humans
54
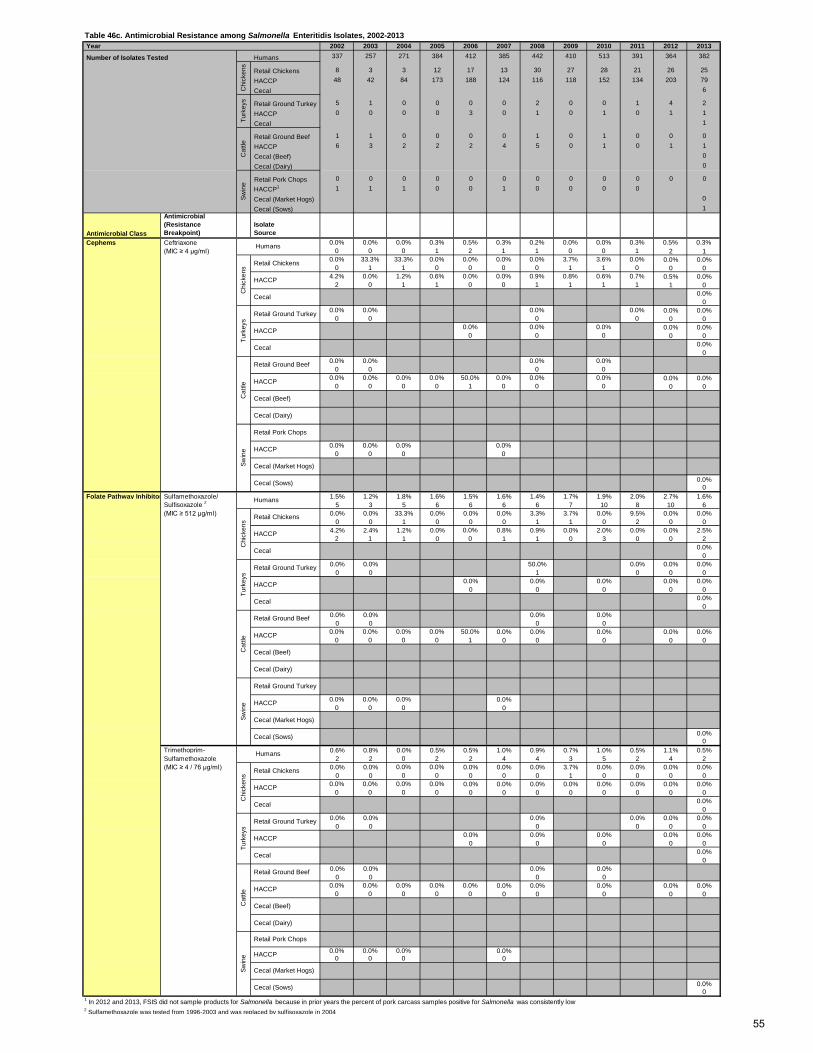
Table 46c. Antimicrobial Resistance among Salmonella Enteritidis Isolates, 2002-2013 Year 2002 2003 2004 2005 2006 2007 2008 2009 2010 2011 2012 2013
Number of Isolates Tested Humans 337 257 271 384 412 385 442 410 513 391 364 382
Retail Chickens 8 3 3 12 17 13 30 27 28 21 26 25 HACCP 48 42 84 173 188 124 116 118 152 134 203 79 Cecal 6
Retail Ground Turkey 5 1 0 0 0 0 2 0 0 1 4 2 HACCP 0 0 0 0 3 0 1 0 1 0 1 1 Cecal 1
Retail Ground Beef 1 1 0 0 0 0 1 0 1 0 0 0 HACCP 6 3 2 2 2 4 5 0 1 0 1 1 Cecal (Beef) 0 Cecal (Dairy) 0
Retail Pork Chops 0 0 0 0 0 0 0 0 0 0 0 0 HACCP1 1 1 1 0 0 1 0 0 0 0 Cecal (Market Hogs) 0 Cecal (Sows) 1
Antimicrobial Class
Antimicrobial (Resistance Breakpoint)
Isolate Source
Ceftriaxone 0.0% 0.0% 0.0% 0.3% 0.5% 0.3% 0.2% 0.0% 0.0% 0.3% 0.5% 0.3% (MIC ≥ 4 µg/ml) 0 0 0 1 2 1 1 0 0 1 2 1
0.0% 33.3% 33.3% 0.0% 0.0% 0.0% 0.0% 3.7% 3.6% 0.0% 0.0% 0.0%0 1 1 0 0 0 0 1 1 0 0 0
4.2% 0.0% 1.2% 0.6% 0.0% 0.0% 0.9% 0.8% 0.6% 0.7% 0.5% 0.0%2 0 1 1 0 0 1 1 1 1 1 0
0.0%0
0.0% 0.0% 0.0% 0.0% 0.0% 0.0%0 0 0 0 0 0
0.0% 0.0% 0.0% 0.0% 0.0%0 0 0 0 0
0.0%0
0.0% 0.0% 0.0% 0.0%0 0 0 0
0.0% 0.0% 0.0% 0.0% 50.0% 0.0% 0.0% 0.0% 0.0% 0.0%0 0 0 0 1 0 0 0 0 0
0.0% 0.0% 0.0% 0.0%0 0 0 0
0.0%0
Folate Pathway Inhibitor Sulfamethoxazole/ 1.5% 1.2% 1.8% 1.6% 1.5% 1.6% 1.4% 1.7% 1.9% 2.0% 2.7% 1.6% Sulfisoxazole 2 5 3 5 6 6 6 6 7 10 8 10 6 (MIC ≥ 512 µg/ml) 0.0% 0.0% 33.3% 0.0% 0.0% 0.0% 3.3% 3.7% 0.0% 9.5% 0.0% 0.0%
0 0 1 0 0 0 1 1 0 2 0 04.2% 2.4% 1.2% 0.0% 0.0% 0.8% 0.9% 0.0% 2.0% 0.0% 0.0% 2.5%
2 1 1 0 0 1 1 0 3 0 0 20.0%
00.0% 0.0% 50.0% 0.0% 0.0% 0.0%
0 0 1 0 0 00.0% 0.0% 0.0% 0.0% 0.0%
0 0 0 0 00.0%
00.0% 0.0% 0.0% 0.0%
0 0 0 00.0% 0.0% 0.0% 0.0% 50.0% 0.0% 0.0% 0.0% 0.0% 0.0%
0 0 0 0 1 0 0 0 0 0
0.0% 0.0% 0.0% 0.0%0 0 0 0
0.0%0
Trimethoprim- 0.6% 0.8% 0.0% 0.5% 0.5% 1.0% 0.9% 0.7% 1.0% 0.5% 1.1% 0.5% Sulfamethoxazole 2 2 0 2 2 4 4 3 5 2 4 2 (MIC ≥ 4 / 76 µg/ml) 0.0% 0.0% 0.0% 0.0% 0.0% 0.0% 0.0% 3.7% 0.0% 0.0% 0.0% 0.0%
0 0 0 0 0 0 0 1 0 0 0 00.0% 0.0% 0.0% 0.0% 0.0% 0.0% 0.0% 0.0% 0.0% 0.0% 0.0% 0.0%
0 0 0 0 0 0 0 0 0 0 0 00.0%
00.0% 0.0% 0.0% 0.0% 0.0% 0.0%
0 0 0 0 0 00.0% 0.0% 0.0% 0.0% 0.0%
0 0 0 0 00.0%
00.0% 0.0% 0.0% 0.0%
0 0 0 00.0% 0.0% 0.0% 0.0% 0.0% 0.0% 0.0% 0.0% 0.0% 0.0%
0 0 0 0 0 0 0 0 0 0
0.0% 0.0% 0.0% 0.0%0 0 0 0
0.0%0
1 In 2012 and 2013, FSIS did not sample products for Salmonella because in prior years the percent of pork carcass samples positive for Salmonella was consistently low2 Sulfamethoxazole was tested from 1996-2003 and was replaced by sulfisoxazole in 2004
Swin
e
Retail Pork Chops
HACCP
Cecal (Market Hogs)
Cecal (Sows)
Cecal (Beef)Cat
tle
Retail Ground Beef
Cecal (Dairy)
HACCP
Turk
eys
Retail Ground Turkey
HACCP
Cecal
HACCP
Humans
Chi
cken
s
Retail Chickens
Cecal
Cecal (Dairy)
Swin
e
Retail Ground Turkey
HACCP
Cecal (Market Hogs)
Cecal (Sows)
Cat
tle
HACCP
Cecal (Beef)
Retail Ground Beef
Turk
eys
Retail Ground Turkey
HACCP
Cecal
HACCP
Cecal
Humans
Chi
cken
s
Retail Chickens
Swin
e
Retail Pork Chops
HACCP
Cecal (Market Hogs)
Cecal (Sows)
Cecal (Beef)Cat
tle
Retail Ground Beef
Cecal (Dairy)
HACCP
Turk
eys
Retail Ground Turkey
HACCP
Cecal
HACCP
Cephems HumansC
hick
ens
Retail Chickens
Cecal
Cat
tleSw
ine
Chi
cken
sTu
rkey
s
55
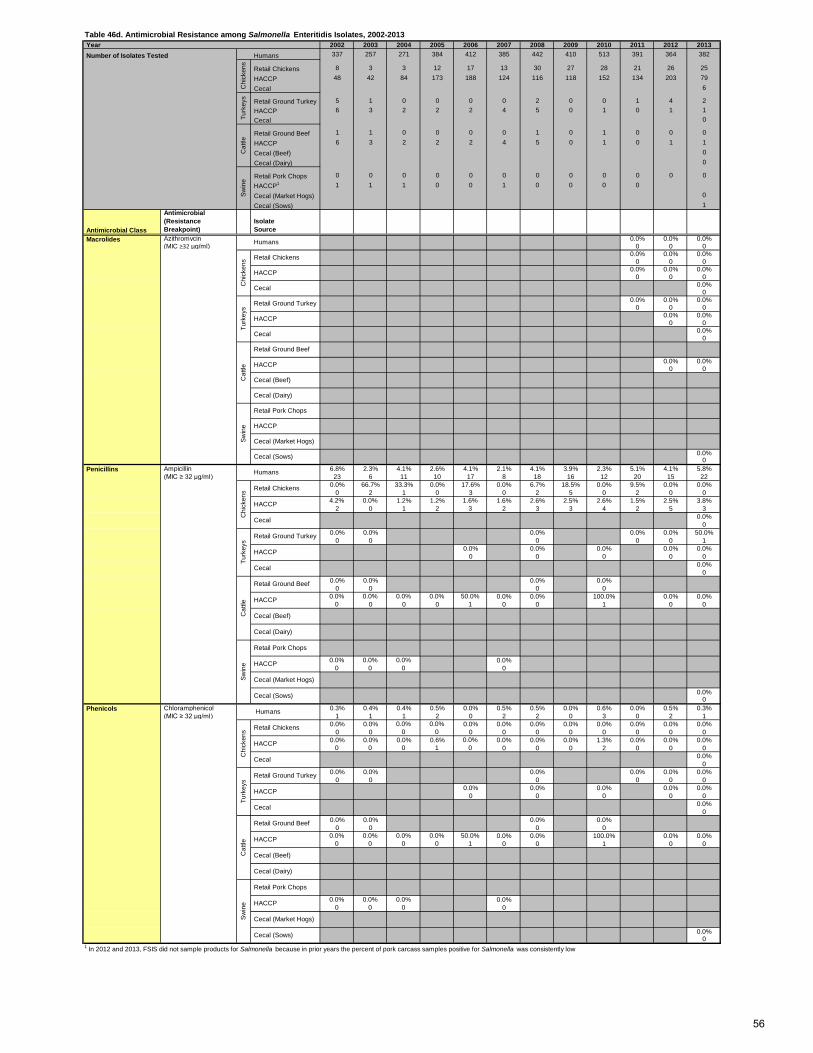
Table 46d. Antimicrobial Resistance among Salmonella Enteritidis Isolates, 2002-2013 Year 2002 2003 2004 2005 2006 2007 2008 2009 2010 2011 2012 2013 Number of Isolates Tested Humans 337 257 271 384 412 385 442 410 513 391 364 382
Retail Chickens 8 3 3 12 17 13 30 27 28 21 26 25 HACCP 48 42 84 173 188 124 116 118 152 134 203 79 Cecal 6
Retail Ground Turkey 5 1 0 0 0 0 2 0 0 1 4 2 HACCP 6 3 2 2 2 4 5 0 1 0 1 1 Cecal 0
Retail Ground Beef 1 1 0 0 0 0 1 0 1 0 0 0 HACCP 6 3 2 2 2 4 5 0 1 0 1 1 Cecal (Beef) 0 Cecal (Dairy) 0
Retail Pork Chops 0 0 0 0 0 0 0 0 0 0 0 0 HACCP1 1 1 1 0 0 1 0 0 0 0 Cecal (Market Hogs) 0 Cecal (Sows) 1
Antimicrobial Class
Antimicrobial (Resistance Breakpoint)
Isolate Source
Azithromycin 0.0% 0.0% 0.0% (MIC ≥32 µg/ml) 0 0 0
0.0% 0.0% 0.0%0 0 0
0.0% 0.0% 0.0%0 0 0
0.0%0
0.0% 0.0% 0.0%0 0 0
0.0% 0.0%0 0
0.0%0
0.0% 0.0%0 0
0.0%0
Ampicillin 6.8% 2.3% 4.1% 2.6% 4.1% 2.1% 4.1% 3.9% 2.3% 5.1% 4.1% 5.8% (MIC ≥ 32 µg/ml) 23 6 11 10 17 8 18 16 12 20 15 22
0.0% 66.7% 33.3% 0.0% 17.6% 0.0% 6.7% 18.5% 0.0% 9.5% 0.0% 0.0%0 2 1 0 3 0 2 5 0 2 0 0
4.2% 0.0% 1.2% 1.2% 1.6% 1.6% 2.6% 2.5% 2.6% 1.5% 2.5% 3.8%2 0 1 2 3 2 3 3 4 2 5 3
0.0%0
0.0% 0.0% 0.0% 0.0% 0.0% 50.0%0 0 0 0 0 1
0.0% 0.0% 0.0% 0.0% 0.0%0 0 0 0 0
0.0%0
0.0% 0.0% 0.0% 0.0%0 0 0 0
0.0% 0.0% 0.0% 0.0% 50.0% 0.0% 0.0% 100.0% 0.0% 0.0%0 0 0 0 1 0 0 1 0 0
0.0% 0.0% 0.0% 0.0%0 0 0 0
0.0%0
Chloramphenicol 0.3% 0.4% 0.4% 0.5% 0.0% 0.5% 0.5% 0.0% 0.6% 0.0% 0.5% 0.3% (MIC ≥ 32 µg/ml) 1 1 1 2 0 2 2 0 3 0 2 1
0.0% 0.0% 0.0% 0.0% 0.0% 0.0% 0.0% 0.0% 0.0% 0.0% 0.0% 0.0%0 0 0 0 0 0 0 0 0 0 0 0
0.0% 0.0% 0.0% 0.6% 0.0% 0.0% 0.0% 0.0% 1.3% 0.0% 0.0% 0.0%0 0 0 1 0 0 0 0 2 0 0 0
0.0%0
0.0% 0.0% 0.0% 0.0% 0.0% 0.0%0 0 0 0 0 0
0.0% 0.0% 0.0% 0.0% 0.0%0 0 0 0 0
0.0%0
0.0% 0.0% 0.0% 0.0%0 0 0 0
0.0% 0.0% 0.0% 0.0% 50.0% 0.0% 0.0% 100.0% 0.0% 0.0%0 0 0 0 1 0 0 1 0 0
0.0% 0.0% 0.0% 0.0%0 0 0 0
0.0%0
1 In 2012 and 2013, FSIS did not sample products for Salmonella because in prior years the percent of pork carcass samples positive for Salmonella was consistently low
Swin
e
Retail Pork Chops
HACCP
Cecal (Market Hogs)
Cecal (Sows)
Cecal (Beef)Cat
tle
Retail Ground Beef
Cecal (Dairy)
HACCP
Turk
eys
Retail Ground Turkey
HACCP
Cecal
HACCP
Phenicols Humans
Chi
cken
s Retail Chickens
Cecal
Swin
e
Retail Pork Chops
HACCP
Cecal (Market Hogs)
Cecal (Sows)
Cecal (Beef)Cat
tle
Retail Ground Beef
Cecal (Dairy)
HACCP
Turk
eys
Retail Ground Turkey
HACCP
Cecal
HACCP
Penicillins Humans
Chi
cken
s Retail Chickens
Cecal
Chi
cken
sSw
ine
Retail Pork Chops
HACCP
Cecal (Market Hogs)
Cecal (Sows)
Cat
tle
Retail Ground Beef
HACCP
Turk
eys
Retail Ground Turkey
HACCP
Cecal
Cecal (Dairy)
HACCP
Cecal
Retail Chickens
Cecal (Beef)
Chi
cken
sTu
rkey
sC
attle
Swin
e Macrolides Humans
56
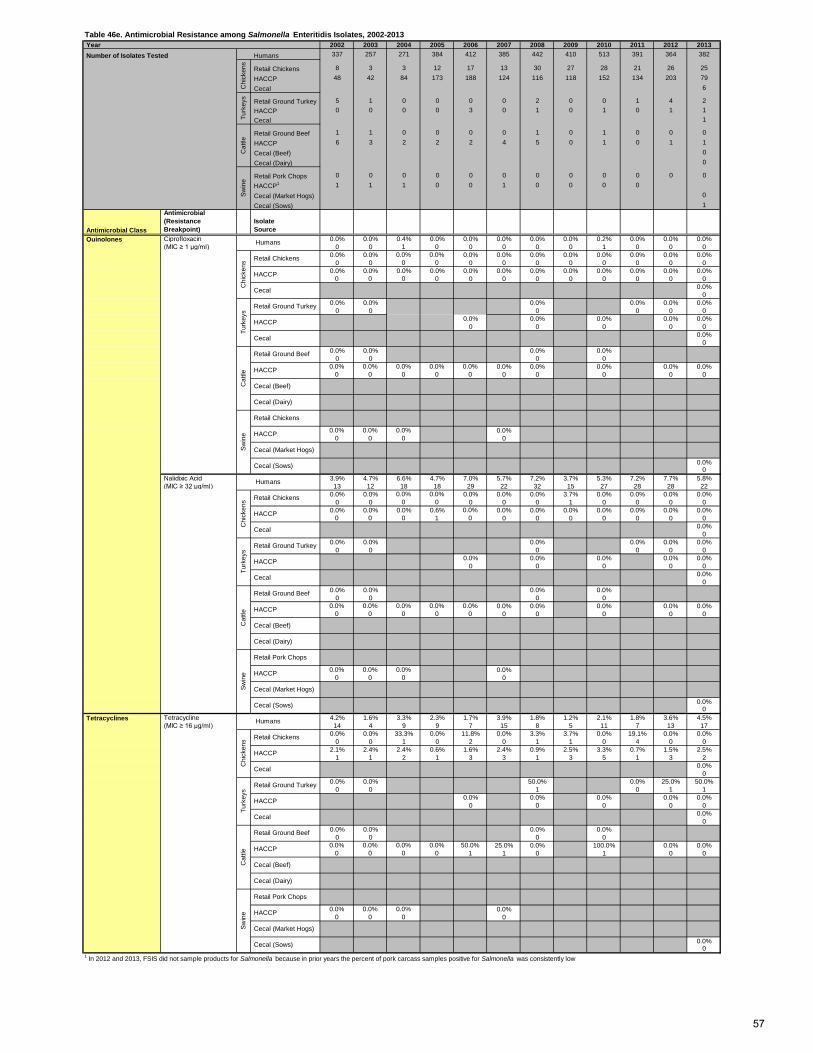
Table 46e. Antimicrobial Resistance among Salmonella Enteritidis Isolates, 2002-2013 Year 2002 2003 2004 2005 2006 2007 2008 2009 2010 2011 2012 2013 Number of Isolates Tested Humans 337 257 271 384 412 385 442 410 513 391 364 382
Retail Chickens 8 3 3 12 17 13 30 27 28 21 26 25 HACCP 48 42 84 173 188 124 116 118 152 134 203 79 Cecal 6
Retail Ground Turkey 5 1 0 0 0 0 2 0 0 1 4 2 HACCP 0 0 0 0 3 0 1 0 1 0 1 1 Cecal 1
Retail Ground Beef 1 1 0 0 0 0 1 0 1 0 0 0 HACCP 6 3 2 2 2 4 5 0 1 0 1 1 Cecal (Beef) 0 Cecal (Dairy) 0
Retail Pork Chops 0 0 0 0 0 0 0 0 0 0 0 0 HACCP1 1 1 1 0 0 1 0 0 0 0 Cecal (Market Hogs) 0 Cecal (Sows) 1
Antimicrobial Class
Antimicrobial (Resistance Breakpoint)
Isolate Source
Quinolones Ciprofloxacin 0.0% 0.0% 0.4% 0.0% 0.0% 0.0% 0.0% 0.0% 0.2% 0.0% 0.0% 0.0% (MIC ≥ 1 µg/ml) 0 0 1 0 0 0 0 0 1 0 0 0
0.0% 0.0% 0.0% 0.0% 0.0% 0.0% 0.0% 0.0% 0.0% 0.0% 0.0% 0.0%0 0 0 0 0 0 0 0 0 0 0 0
0.0% 0.0% 0.0% 0.0% 0.0% 0.0% 0.0% 0.0% 0.0% 0.0% 0.0% 0.0%0 0 0 0 0 0 0 0 0 0 0 0
0.0%0
0.0% 0.0% 0.0% 0.0% 0.0% 0.0%0 0 0 0 0 0
0.0% 0.0% 0.0% 0.0% 0.0%0 0 0 0 0
0.0%0
0.0% 0.0% 0.0% 0.0%0 0 0 0
0.0% 0.0% 0.0% 0.0% 0.0% 0.0% 0.0% 0.0% 0.0% 0.0%0 0 0 0 0 0 0 0 0 0
0.0% 0.0% 0.0% 0.0%0 0 0 0
0.0%0
Nalidixic Acid 3.9% 4.7% 6.6% 4.7% 7.0% 5.7% 7.2% 3.7% 5.3% 7.2% 7.7% 5.8% (MIC ≥ 32 µg/ml) 13 12 18 18 29 22 32 15 27 28 28 22
0.0% 0.0% 0.0% 0.0% 0.0% 0.0% 0.0% 3.7% 0.0% 0.0% 0.0% 0.0%0 0 0 0 0 0 0 1 0 0 0 0
0.0% 0.0% 0.0% 0.6% 0.0% 0.0% 0.0% 0.0% 0.0% 0.0% 0.0% 0.0%0 0 0 1 0 0 0 0 0 0 0 0
0.0%0
0.0% 0.0% 0.0% 0.0% 0.0% 0.0%0 0 0 0 0 0
0.0% 0.0% 0.0% 0.0% 0.0%0 0 0 0 0
0.0%0
0.0% 0.0% 0.0% 0.0%0 0 0 0
0.0% 0.0% 0.0% 0.0% 0.0% 0.0% 0.0% 0.0% 0.0% 0.0%0 0 0 0 0 0 0 0 0 0
0.0% 0.0% 0.0% 0.0%0 0 0 0
0.0%0
Tetracycline 4.2% 1.6% 3.3% 2.3% 1.7% 3.9% 1.8% 1.2% 2.1% 1.8% 3.6% 4.5% (MIC ≥ 16 µg/ml) 14 4 9 9 7 15 8 5 11 7 13 17
0.0% 0.0% 33.3% 0.0% 11.8% 0.0% 3.3% 3.7% 0.0% 19.1% 0.0% 0.0%0 0 1 0 2 0 1 1 0 4 0 0
2.1% 2.4% 2.4% 0.6% 1.6% 2.4% 0.9% 2.5% 3.3% 0.7% 1.5% 2.5%1 1 2 1 3 3 1 3 5 1 3 2
0.0%0
0.0% 0.0% 50.0% 0.0% 25.0% 50.0%0 0 1 0 1 1
0.0% 0.0% 0.0% 0.0% 0.0%0 0 0 0 0
0.0%0
0.0% 0.0% 0.0% 0.0%0 0 0 0
0.0% 0.0% 0.0% 0.0% 50.0% 25.0% 0.0% 100.0% 0.0% 0.0%0 0 0 0 1 1 0 1 0 0
0.0% 0.0% 0.0% 0.0%0 0 0 0
0.0%0
1 In 2012 and 2013, FSIS did not sample products for Salmonella because in prior years the percent of pork carcass samples positive for Salmonella was consistently low
Cecal (Market Hogs)
Cecal (Sows)
Cecal (Beef)
Cecal (Dairy)
Swin
e
Retail Pork Chops
HACCP
Cat
tle
Retail Ground Beef
HACCP
Cecal
Turk
eys
Retail Ground Turkey
HACCP
HACCP
Tetracyclines Humans
Chi
cken
s Retail Chickens
Cecal
Cecal (Dairy)
Swin
e
Retail Pork Chops
HACCP
Cecal (Market Hogs)
Cecal (Sows)
Cat
tle HACCP
Cecal (Beef)
Retail Ground Beef
Cecal
Turk
eys
Retail Ground Turkey
HACCP
Cecal
Humans
Chi
cken
s Retail Chickens
Swin
e
Retail Chickens
HACCP
Cecal (Market Hogs)
Cecal (Sows)
HACCP
Cat
tle
Retail Ground Beef
Turk
eys
Retail Ground Turkey
HACCP
Cecal
Chi
cken
s
HACCP
Cecal (Beef)
Cecal (Dairy)
HACCP
Cecal
Retail Chickens
Chi
cken
sTu
rkey
sC
attle
Swin
e Humans
57

Table 47a. Resistance Patterns among Salmonella Enteritidis Isolates, 2002-20131
Year 2002 2003 2004 2005 2006 2007 2008 2009 2010 2011 2012 2013 Number of Isolates Tested 337 257 271 384 412 385 442 410 513 391 364 382
Retail Chickens 8 3 3 12 17 13 30 27 28 21 26 25 HACCP 48 42 84 173 188 124 116 118 152 134 203 79 Cecal 6
Retail Ground Turkey 5 1 0 0 0 0 2 0 0 1 4 2 HACCP 0 0 0 0 3 0 1 0 1 0 1 1 Cecal 1
Retail Ground Beef 1 1 0 0 0 0 1 0 1 0 0 0 HACCP 6 3 2 2 2 4 5 0 1 0 1 1 Cecal (Beef) 0 Cecal (Dairy) 0
Retail Pork Chops 0 0 0 0 0 0 0 0 0 0 0 0 HACCP2 1 1 1 0 0 1 0 0 0 0 Cecal (Market Hogs) 0 Cecal (Sows) 1
Resistance Pattern Source87.5% 91.8% 86.7% 91.4% 88.8% 90.4% 87.3% 92.0% 92.0% 88.0% 88.2% 87.4%
1. No Resistance Detected 295 236 235 351 366 348 386 377 472 344 321 334100.0% 33.3% 66.7% 100.0% 82.4% 100.0% 90.0% 74.1% 92.9% 81.0% 100.0% 100.0%
8 1 2 12 14 13 27 20 26 17 26 2595.8% 97.6% 97.6% 97.1% 97.9% 96.0% 97.4% 96.6% 95.4% 97.8% 96.1% 96.2%
46 41 82 168 184 119 113 114 145 131 195 76100.0%
6100.0% 100.0% 50.0% 100.0% 75.0% 50.0%
5 1 1 1 3 1100.0% 100.0% 100.0% 100.0% 100.0%
3 1 1 1 1100.0%
1100.0% 100.0% 100.0% 100.0%
1 1 1 1100.0% 100.0% 100.0% 100.0% 50.0% 75.0% 100.0% 0.0% 100.0% 100.0%
6 3 2 2 1 3 1 0 1 1
100.0% 100.0% 100.0% 100.0%1 1 1 1
100.0%1
2.1% 0.4% 1.1% 1.3% 1.7% 1.0% 0.7% 1.0% 2.1% 2.3% 2.7% 1.6% 2. Resistant to ≥ 3 7 1 3 5 7 4 3 4 11 9 10 6 Antimicrobial Classes 0.0% 33.3% 33.3% 0.0% 0.0% 0.0% 3.3% 3.7% 0.0% 9.5% 0.0% 0.0%
0 1 1 0 0 0 1 1 0 2 0 04.2% 0.0% 2.4% 0.6% 0.0% 0.0% 0.9% 0.8% 2.6% 0.7% 0.5% 2.5%
2 0 2 1 0 0 1 1 4 1 1 20.0%
00.0% 0.0% 0.0% 0.0% 0.0% 0.0%
0 0 0 0 0 00.0% 0.0% 0.0% 0.0% 0.0%
0 0 0 0 00.0%
00.0% 0.0% 0.0% 0.0%
0 0 0 00.0% 0.0% 0.0% 0.0% 50.0% 0.0% 0.0% 100.0% 0.0% 0.0%
0 0 0 0 1 0 0 1 0 0
0.0% 0.0% 0.0% 0.0%0 0 0 0
0.0%0
0.6% 0.4% 0.7% 1.0% 0.7% 0.3% 0.2% 0.5% 0.4% 1.3% 1.6% 1.6% 3. Resistant to ≥ 4 2 1 2 4 3 1 1 2 2 5 6 6 Antimicrobial Classes 0.0% 0.0% 33.3% 0.0% 0.0% 0.0% 0.0% 3.7% 0.0% 9.5% 0.0% 0.0%
0 0 1 0 0 0 0 1 0 2 0 04.2% 0.0% 1.2% 0.0% 0.0% 0.0% 0.9% 0.8% 0.6% 0.0% 0.0% 1.3%
2 0 1 0 0 0 1 1 1 0 0 1
0.0%0
0.0% 0.0% 0.0% 0.0% 0.0% 0.0%0 0 0 0 0 0
0.0% 0.0% 0.0% 0.0% 0.0%0 0 0 0 0
0.0%0
0.0% 0.0% 0.0% 0.0%0 0 0 0
0.0% 0.0% 0.0% 0.0% 50.0% 0.0% 0.0% 100.0% 0.0% 0.0%0 0 0 0 1 0 0 1 0 0
0.0% 0.0% 0.0% 0.0%0 0 0 0
0.0%0
2 In 2012 and 2013, FSIS did not sample products for Salmonella because in prior years the percent of pork carcass samples positive for Salmonella was consistently low
Sw
ine
Humans
Chi
cken
s
Retail Chickens
HACCP
Cecal
Multidrug Resistance
Humans
Chi
cken
sTu
rkey
sC
attle
Turk
eys
Retail Ground Turkey
HACCP
Cecal
Cat
tle
Retail Ground Beef
HACCP
Cecal (Beef)
Cecal (Dairy)
Chi
cken
s
Retail Chickens
HACCP
Cecal
Turk
eys
Retail Ground Turkey
HACCP
Cecal
Sw
ine
Retail Pork Chops
HACCP
Cecal (Market Hogs)
Cecal (Sows)
Humans
Cat
tle
Retail Ground Beef
HACCP
Cecal (Beef)
Cecal (Dairy)
Sw
ine
Retail Pork Chops
HACCP
Cecal (Market Hogs)
Cecal (Sows)
Humans
Chi
cken
s
Retail Chickens
HACCP
Cecal
Turk
eys
Retail Ground Turkey
HACCP
Cecal
Cat
tle
Retail Ground Beef
HACCP
Cecal (Beef)
Cecal (Dairy)
Sw
ine
Retail Pork Chops
HACCP
Cecal (Market Hogs)
Cecal (Sows)
1 Starting in 2011, testing included nine antimicrobial classes with the addition of the macrolide azithromycin. Because resistance to azithromycin is low (in this case, <1%), antimicrobial class resistance data from 2011 and beyond are comparable to the data from previous years.
58
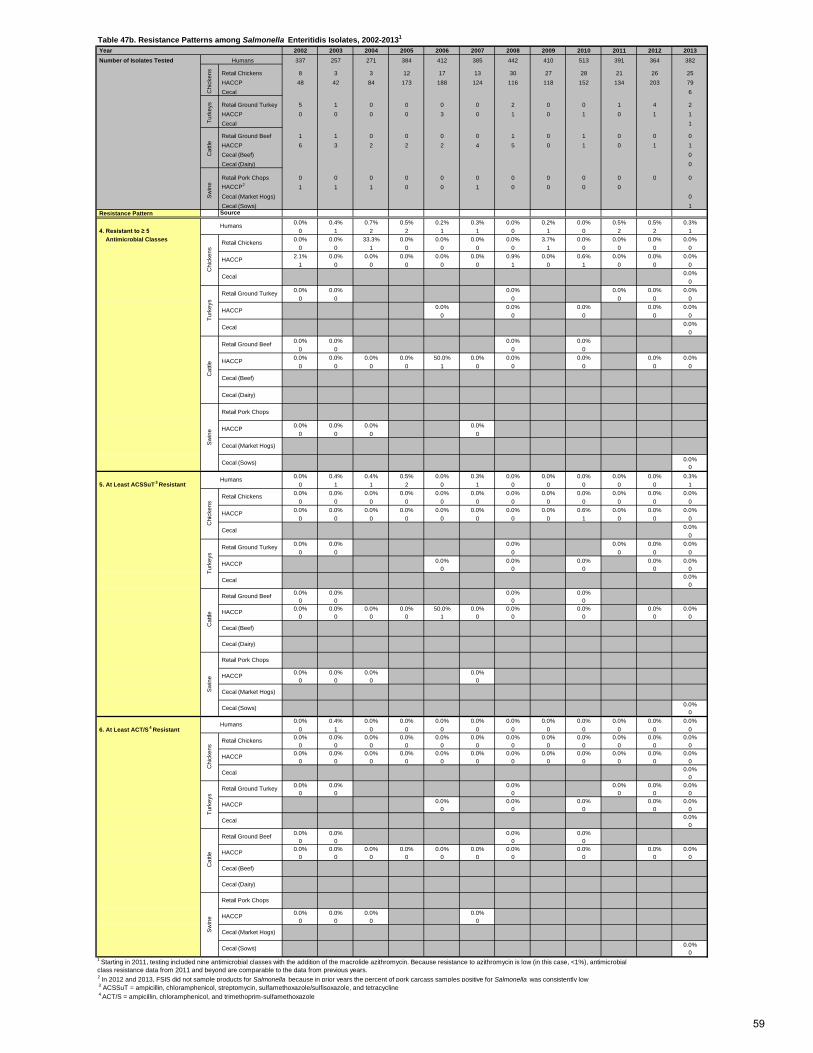
Table 47b. Resistance Patterns among Salmonella Enteritidis Isolates, 2002-20131
Year 2002 2003 2004 2005 2006 2007 2008 2009 2010 2011 2012 2013 Number of Isolates Tested 337 257 271 384 412 385 442 410 513 391 364 382
Retail Chickens 8 3 3 12 17 13 30 27 28 21 26 25 HACCP 48 42 84 173 188 124 116 118 152 134 203 79 Cecal 6
Retail Ground Turkey 5 1 0 0 0 0 2 0 0 1 4 2 HACCP 0 0 0 0 3 0 1 0 1 0 1 1 Cecal 1
Retail Ground Beef 1 1 0 0 0 0 1 0 1 0 0 0 HACCP 6 3 2 2 2 4 5 0 1 0 1 1 Cecal (Beef) 0 Cecal (Dairy) 0
Retail Pork Chops 0 0 0 0 0 0 0 0 0 0 0 0 HACCP2 1 1 1 0 0 1 0 0 0 0 Cecal (Market Hogs) 0 Cecal (Sows) 1
Resistance Pattern Source0.0% 0.4% 0.7% 0.5% 0.2% 0.3% 0.0% 0.2% 0.0% 0.5% 0.5% 0.3%
4. Resistant to ≥ 5 0 1 2 2 1 1 0 1 0 2 2 1 Antimicrobial Classes 0.0% 0.0% 33.3% 0.0% 0.0% 0.0% 0.0% 3.7% 0.0% 0.0% 0.0% 0.0%
0 0 1 0 0 0 0 1 0 0 0 02.1% 0.0% 0.0% 0.0% 0.0% 0.0% 0.9% 0.0% 0.6% 0.0% 0.0% 0.0%
1 0 0 0 0 0 1 0 1 0 0 00.0%
00.0% 0.0% 0.0% 0.0% 0.0% 0.0%
0 0 0 0 0 00.0% 0.0% 0.0% 0.0% 0.0%
0 0 0 0 00.0%
00.0% 0.0% 0.0% 0.0%
0 0 0 00.0% 0.0% 0.0% 0.0% 50.0% 0.0% 0.0% 0.0% 0.0% 0.0%
0 0 0 0 1 0 0 0 0 0
0.0% 0.0% 0.0% 0.0%0 0 0 0
0.0%0
0.0% 0.4% 0.4% 0.5% 0.0% 0.3% 0.0% 0.0% 0.0% 0.0% 0.0% 0.3% 5. At Least ACSSuT
3 Resistant 0 1 1 2 0 1 0 0 0 0 0 10.0% 0.0% 0.0% 0.0% 0.0% 0.0% 0.0% 0.0% 0.0% 0.0% 0.0% 0.0%
0 0 0 0 0 0 0 0 0 0 0 00.0% 0.0% 0.0% 0.0% 0.0% 0.0% 0.0% 0.0% 0.6% 0.0% 0.0% 0.0%
0 0 0 0 0 0 0 0 1 0 0 00.0%
00.0% 0.0% 0.0% 0.0% 0.0% 0.0%
0 0 0 0 0 00.0% 0.0% 0.0% 0.0% 0.0%
0 0 0 0 00.0%
00.0% 0.0% 0.0% 0.0%
0 0 0 00.0% 0.0% 0.0% 0.0% 50.0% 0.0% 0.0% 0.0% 0.0% 0.0%
0 0 0 0 1 0 0 0 0 0
0.0% 0.0% 0.0% 0.0%0 0 0 0
0.0%0
0.0% 0.4% 0.0% 0.0% 0.0% 0.0% 0.0% 0.0% 0.0% 0.0% 0.0% 0.0% 6. At Least ACT/S
4 Resistant 0 1 0 0 0 0 0 0 0 0 0 00.0% 0.0% 0.0% 0.0% 0.0% 0.0% 0.0% 0.0% 0.0% 0.0% 0.0% 0.0%
0 0 0 0 0 0 0 0 0 0 0 00.0% 0.0% 0.0% 0.0% 0.0% 0.0% 0.0% 0.0% 0.0% 0.0% 0.0% 0.0%
0 0 0 0 0 0 0 0 0 0 0 00.0%
00.0% 0.0% 0.0% 0.0% 0.0% 0.0%
0 0 0 0 0 00.0% 0.0% 0.0% 0.0% 0.0%
0 0 0 0 00.0%
00.0% 0.0% 0.0% 0.0%
0 0 0 00.0% 0.0% 0.0% 0.0% 0.0% 0.0% 0.0% 0.0% 0.0% 0.0%
0 0 0 0 0 0 0 0 0 0
0.0% 0.0% 0.0% 0.0%0 0 0 0
0.0%0
2 In 2012 and 2013, FSIS did not sample products for Salmonella because in prior years the percent of pork carcass samples positive for Salmonella was consistently low 3 ACSSuT = ampicillin, chloramphenicol, streptomycin, sulfamethoxazole/sulfisoxazole, and tetracycline 4 ACT/S = ampicillin, chloramphenicol, and trimethoprim-sulfamethoxazole
Cecal
Turk
eys
Retail Ground Turkey
HACCP
Cecal
Cat
tleS
win
e
Humans
Chi
cken
s
Retail Chickens
HACCP
Cecal
Humans
Chi
cken
sTu
rkey
s C
attle
Retail Ground Beef
HACCP
Cecal (Beef)
Cecal (Dairy)
Sw
ine
Retail Pork Chops
HACCP
Cecal (Market Hogs)
Cecal (Sows)
Humans
Chi
cken
s
Retail Chickens
HACCP
Sw
ine
Retail Pork Chops
HACCP
Cecal (Market Hogs)
Cecal (Sows)
Humans
Turk
eys
Retail Ground Turkey
HACCP
Cecal
Cat
tle
Retail Ground Beef
HACCP
Cecal (Beef)
Cecal (Dairy)
1 Starting in 2011, testing included nine antimicrobial classes with the addition of the macrolide azithromycin. Because resistance to azithromycin is low (in this case, <1%), antimicrobial class resistance data from 2011 and beyond are comparable to the data from previous years.
Chi
cken
s
Retail Chickens
HACCP
Cecal
Turk
eys
Retail Ground Turkey
HACCP
Cecal
Cat
tle
Retail Ground Beef
HACCP
Cecal (Beef)
Cecal (Dairy)
Sw
ine
Retail Pork Chops
HACCP
Cecal (Market Hogs)
Cecal (Sows)
59
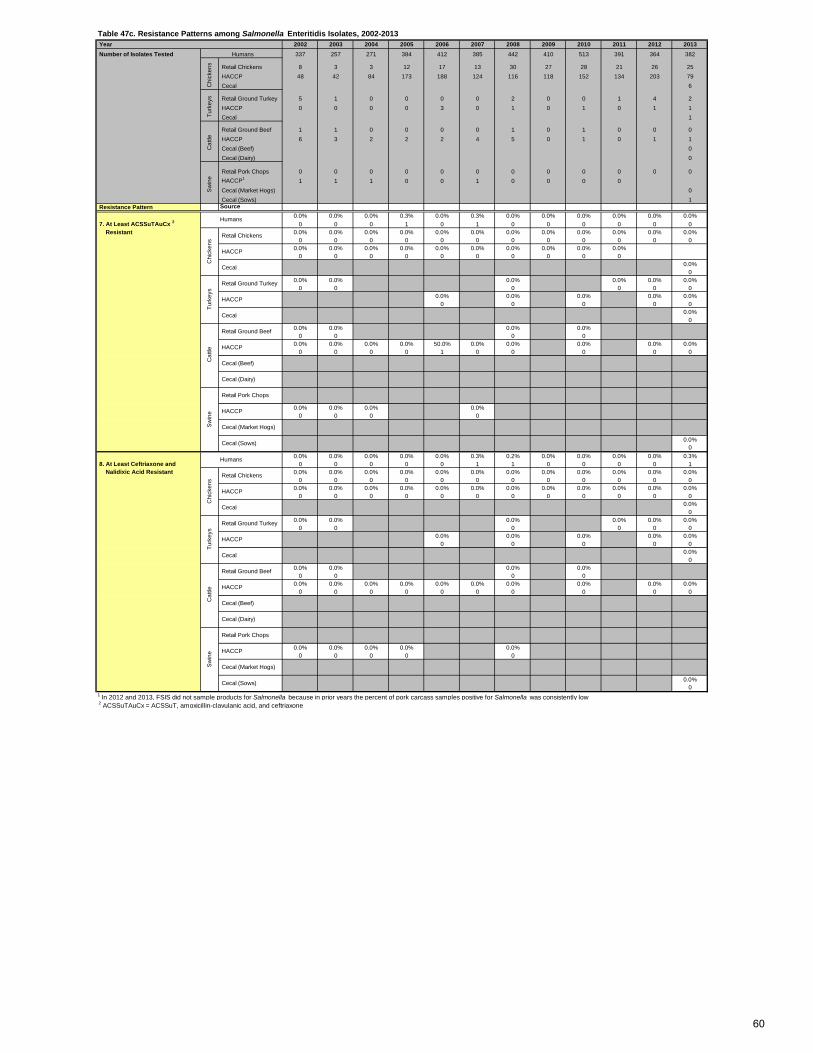
Table 47c. Resistance Patterns among Salmonella Enteritidis Isolates, 2002-2013 Year 2002 2003 2004 2005 2006 2007 2008 2009 2010 2011 2012 2013 Number of Isolates Tested 337 257 271 384 412 385 442 410 513 391 364 382
Retail Chickens 8 3 3 12 17 13 30 27 28 21 26 25 HACCP 48 42 84 173 188 124 116 118 152 134 203 79 Cecal 6
Retail Ground Turkey 5 1 0 0 0 0 2 0 0 1 4 2 HACCP 0 0 0 0 3 0 1 0 1 0 1 1 Cecal 1
Retail Ground Beef 1 1 0 0 0 0 1 0 1 0 0 0 HACCP 6 3 2 2 2 4 5 0 1 0 1 1 Cecal (Beef) 0 Cecal (Dairy) 0
Retail Pork Chops 0 0 0 0 0 0 0 0 0 0 0 0 HACCP1 1 1 1 0 0 1 0 0 0 0 Cecal (Market Hogs) 0 Cecal (Sows) 1
Resistance Pattern Source0.0% 0.0% 0.0% 0.3% 0.0% 0.3% 0.0% 0.0% 0.0% 0.0% 0.0% 0.0%
7. At Least ACSSuTAuCx 2 0 0 0 1 0 1 0 0 0 0 0 0 Resistant 0.0% 0.0% 0.0% 0.0% 0.0% 0.0% 0.0% 0.0% 0.0% 0.0% 0.0% 0.0%
0 0 0 0 0 0 0 0 0 0 0 00.0% 0.0% 0.0% 0.0% 0.0% 0.0% 0.0% 0.0% 0.0% 0.0%
0 0 0 0 0 0 0 0 0 00.0%
00.0% 0.0% 0.0% 0.0% 0.0% 0.0%
0 0 0 0 0 00.0% 0.0% 0.0% 0.0% 0.0%
0 0 0 0 00.0%
00.0% 0.0% 0.0% 0.0%
0 0 0 00.0% 0.0% 0.0% 0.0% 50.0% 0.0% 0.0% 0.0% 0.0% 0.0%
0 0 0 0 1 0 0 0 0 0
0.0% 0.0% 0.0% 0.0%0 0 0 0
0.0%0
0.0% 0.0% 0.0% 0.0% 0.0% 0.3% 0.2% 0.0% 0.0% 0.0% 0.0% 0.3% 8. At Least Ceftriaxone and 0 0 0 0 0 1 1 0 0 0 0 1 Nalidixic Acid Resistant 0.0% 0.0% 0.0% 0.0% 0.0% 0.0% 0.0% 0.0% 0.0% 0.0% 0.0% 0.0%
0 0 0 0 0 0 0 0 0 0 0 00.0% 0.0% 0.0% 0.0% 0.0% 0.0% 0.0% 0.0% 0.0% 0.0% 0.0% 0.0%
0 0 0 0 0 0 0 0 0 0 0 00.0%
00.0% 0.0% 0.0% 0.0% 0.0% 0.0%
0 0 0 0 0 00.0% 0.0% 0.0% 0.0% 0.0%
0 0 0 0 00.0%
00.0% 0.0% 0.0% 0.0%
0 0 0 00.0% 0.0% 0.0% 0.0% 0.0% 0.0% 0.0% 0.0% 0.0% 0.0%
0 0 0 0 0 0 0 0 0 0
0.0% 0.0% 0.0% 0.0% 0.0%0 0 0 0 0
0.0%0
1 In 2012 and 2013, FSIS did not sample products for Salmonella because in prior years the percent of pork carcass samples positive for Salmonella was consistently low 2 ACSSuTAuCx = ACSSuT, amoxicillin-clavulanic acid, and ceftriaxone
Humans
Chi
cken
sTu
rkey
sC
attle
Sw
ine
Sw
ine
Retail Pork Chops
HACCP
Cecal (Market Hogs)
Cecal (Sows)
Humans
Chi
cken
s
Retail Chickens
HACCP
Cecal
Turk
eys
Retail Ground Turkey
HACCP
Cecal
Cat
tle
Retail Ground Beef
HACCP
Cecal (Beef)
Cecal (Dairy)
Humans
Chi
cken
s C
attle
Retail Ground Beef
HACCP
Cecal (Beef)
Cecal (Dairy)
Sw
ine
Retail Pork Chops
HACCP
Cecal (Market Hogs)
Cecal (Sows)
Retail Chickens
HACCP
Cecal
Turk
eys
Retail Ground Turkey
HACCP
Cecal
60

Table 48a. Antimicrobial Resistance among Salmonella Typhimurium Isolates, 2002-2013 Year 2002 2003 2004 2005 2006 2007 2008 2009 2010 2011 2012 2013
Humans 394 409 382 438 408 405 396 370 359 323 296 325
Retail Chickens 9 22 49 29 21 25 68 122 79 66 88 68 HACCP 150 156 171 183 105 83 70 36 54 30 105 55 Cecal 15
Retail Ground Turkey 2 2 2 1 0 1 1 1 6 8 9 1 HACCP 9 6 14 7 5 6 3 2 4 2 4 5 Cecal 2
Retail Ground Beef 2 1 0 0 1 3 2 0 0 0 1 0 HACCP 98 78 48 34 22 26 28 18 15 14 16 23 Cecal (Beef) 14 Cecal (Dairy) 21
Retail Pork Chops 2 1 2 2 2 3 3 1 5 7 6 4 HACCP1 48 27 53 42 25 44 10 20 13 5 Cecal (Market Hogs) 21 Cecal (Sows) 4
Antimicrobial Class
Antimicrobial (Resistance Breakpoint)
Isolate Source
Aminoglycosides Gentamicin 2.3% 2.0% 2.1% 1.8% 2.7% 2.5% 1.5% 1.9% 0.8% 1.9% 3.0% 1.2% (MIC ≥ 16 µg/ml) 9 8 8 8 11 10 6 7 3 6 9 4
0.0% 0.0% 2.0% 0.0% 0.0% 0.0% 1.5% 2.5% 6.3% 3.0% 6.8% 4.4%0 0 1 0 0 0 1 3 5 2 6 3
12.7% 5.1% 4.1% 4.4% 6.7% 3.6% 5.7% 0.0% 5.6% 6.7% 3.8% 3.6%19 8 7 8 7 3 4 0 3 2 4 2
0.0%0
0.0% 0.0% 0.0% 0.0% 0.0% 0.0% 0.0% 0.0% 25.0% 11.1% 0.0%0 0 0 0 0 0 0 0 2 1 0
44.4% 83.3% 64.3% 14.3% 20.0% 16.7% 33.3% 50.0% 0.0% 0.0% 25.0% 20.0%4 5 9 1 1 1 1 1 0 0 1 1
50.0%1
0.0% 0.0% 0.0% 0.0% 0.0% 0.0%0 0 0 0 0 0
2.0% 1.3% 0.0% 0.0% 0.0% 7.7% 0.0% 0.0% 0.0% 0.0% 6.2% 0.0%2 1 0 0 0 2 0 0 0 0 1 0
0.0%0
0.0%0
0.0% 0.0% 0.0% 0.0% 50.0% 0.0% 0.0% 0.0% 0.0% 0.0% 0.0% 0.0%0 0 0 0 1 0 0 0 0 0 0 0
2.1% 0.0% 3.8% 7.1% 8.0% 2.3% 10.0% 0.0% 7.7% 0.0%1 0 2 3 2 1 1 0 1 0
9.5%2
0.0%0
Kanamycin 7.6% 7.1% 5.8% 5.7% 5.1% 5.9% 2.5% 4.9% 7.2% 4.0% 2.0% 0.3% (MIC ≥ 64 µg/ml) 30 29 22 25 21 24 10 18 26 13 6 1
0.0% 18.2% 34.7% 24.1% 47.6% 12.0% 25.0% 27.9% 10.1% 24.2% 10.2% 25.0%0 4 17 7 10 3 17 34 8 16 9 17
5.3% 7.7% 9.9% 7.7% 18.1% 7.2% 8.6% 8.3% 16.7% 0.0% 3.8% 3.6%8 12 17 14 19 6 6 3 9 0 6 2
0.0%0
0.0% 50.0% 50.0% 0.0% 0.0% 0.0% 0.0% 0.0% 0.0% 11.1% 0.0%0 1 1 0 0 0 0 0 0 1 0
55.6% 50.0% 21.4% 0.0% 0.0% 16.7% 0.0% 0.0% 0.0% 0.0% 25.0% 20.0%5 3 3 0 0 1 0 0 0 0 1 0
50.0%1
0.0% 0.0% 0.0% 0.0% 0.0% 0.0%0 0 0 0 0 0
26.5% 16.7% 14.6% 38.2% 13.6% 26.9% 14.3% 33.3% 13.3% 14.3% 18.8% 8.7%26 13 7 13 3 7 4 6 2 2 3 2
14.3%2
0.0%0
0.0% 0.0% 0.0% 0.0% 100.0% 0.0% 0.0% 0.0% 40.0% 0.0% 0.0% 0.0%0 0 0 0 2 0 0 0 2 0 0 0
2.1% 0.0% 9.4% 7.1% 16.0% 9.1% 10.0% 0.0% 15.4% 20.0%1 0 5 3 4 4 1 0 2 1
14.3%3
25.0%1
Streptomycin 32.0% 35.7% 31.9% 28.1% 29.4% 32.3% 28.5% 25.9% 25.6% 25.7% 24.0% 20.6% (MIC ≥ 64 µg/ml) 126 146 122 123 120 131 113 96 92 83 71 67
0.0% 18.2% 14.3% 3.5% 9.5% 28.0% 16.2% 15.6% 22.8% 24.2% 14.8% 4.4%0 4 7 1 2 7 11 19 18 16 13 3
30.0% 16.7% 8.2% 13.7% 17.1% 10.8% 5.7% 5.6% 14.8% 6.7% 8.6% 5.5%45 26 14 25 18 9 4 2 8 2 9 3
0.0%0
0.0% 50.0% 50.0% 0.0% 100.0% 0.0% 0.0% 33.3% 50.0% 55.6% 100.0%0 1 1 0 1 0 0 2 4 5 1
77.8% 100.0% 64.3% 57.1% 60.0% 50.0% 33.3% 100.0% 50.0% 0.0% 25.0% 20.0%7 6 9 4 3 3 1 2 2 0 1 1
50.0%1
0.0% 0.0% 100.0% 0.0% 50.0% 0.0%0 0 1 0 1 0
66.3% 52.6% 56.3% 55.9% 54.5% 50.0% 50.0% 72.2% 53.3% 57.1% 50.0% 39.1%65 41 27 19 12 13 14 13 8 8 8 9
57.1%8
66.7%14
50.0% 100.0% 100.0% 100.0% 100.0% 0.0% 33.3% 100.0% 80.0% 71.4% 50.0% 70.0%1 1 2 2 2 0 1 1 4 5 3 3
77.1% 59.3% 77.4% 69.0% 72.0% 59.1% 80.0% 80.0% 61.5% 80.0%37 16 41 29 18 26 8 16 8 4
57.1%12
100.0%4
1 In 2012 and 2013, FSIS did not sample products for Salmonella because in prior years the percent of pork carcass samples positive for Salmonella was consistently low
Resistance by Year
Swin
e
Retail Pork Chops
HACCP
Cecal (Market Hogs)
Cecal (Sows)
Cecal (Beef)Cat
tle
Retail Ground Beef
Cecal (Dairy)
HACCP
Turk
eys
Retail Ground Turkey
HACCP
Cecal
HACCP
Humans
Chi
cken
s Retail Chickens
Cecal
Cecal (Dairy)
Swin
e
Retail Pork Chops
HACCP
Cecal (Market Hogs)
Cecal (Sows)
Cat
tle HACCP
Cecal (Beef)
Retail Ground Beef
Turk
eys
Retail Ground Turkey
HACCP
Cecal
HACCP
Cecal
Humans
Chi
cken
s Retail Chickens
Swin
e
Retail Pork Chops
HACCP
Cecal (Market Hogs)
Cecal (Sows)
Cecal (Beef)Cat
tle
Retail Ground Beef
Cecal (Dairy)
HACCP
Turk
eys
Retail Ground Turkey
HACCP
Cecal
Number of Isolates Tested
Chi
cken
sTu
rkey
sC
attle
HACCP
Swin
e
Humans
Chi
cken
s Retail Chickens
Cecal
61
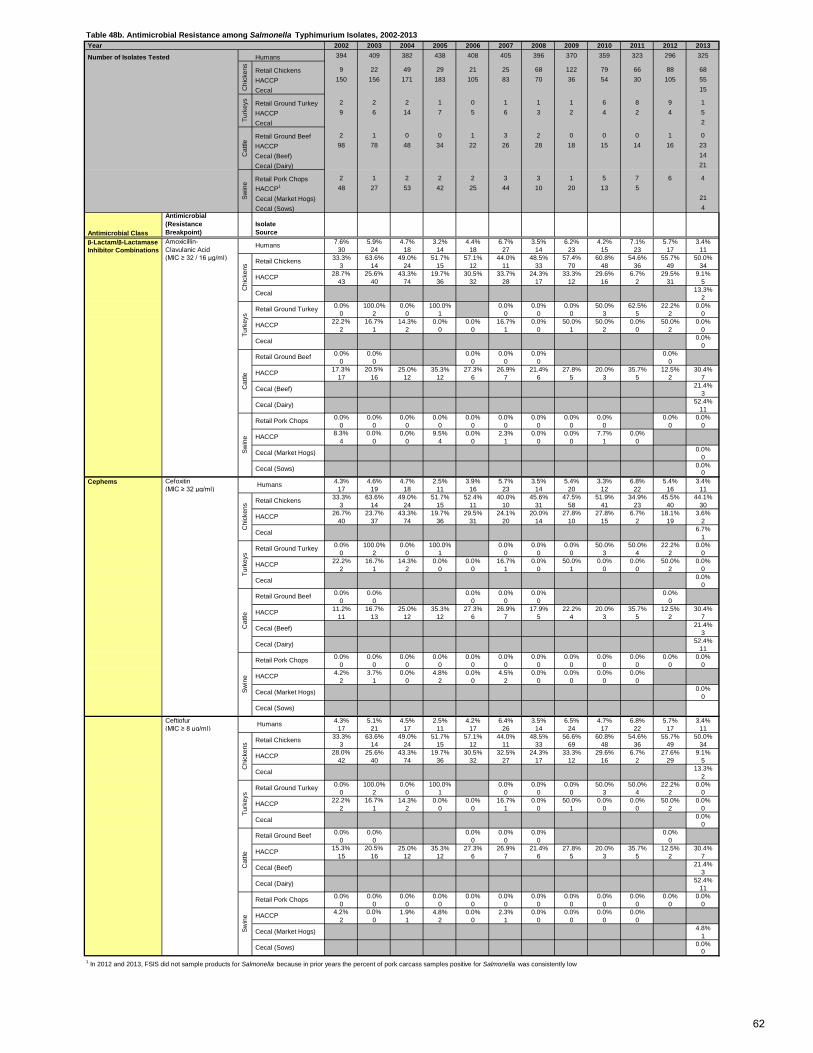
Table 48b. Antimicrobial Resistance among Salmonella Typhimurium Isolates, 2002-2013 Year 2002 2003 2004 2005 2006 2007 2008 2009 2010 2011 2012 2013
Number of Isolates Tested Humans 394 409 382 438 408 405 396 370 359 323 296 325
Retail Chickens 9 22 49 29 21 25 68 122 79 66 88 68 HACCP 150 156 171 183 105 83 70 36 54 30 105 55 Cecal 15
Retail Ground Turkey 2 2 2 1 0 1 1 1 6 8 9 1 HACCP 9 6 14 7 5 6 3 2 4 2 4 5 Cecal 2
Retail Ground Beef 2 1 0 0 1 3 2 0 0 0 1 0 HACCP 98 78 48 34 22 26 28 18 15 14 16 23 Cecal (Beef) 14 Cecal (Dairy) 21
Retail Pork Chops 2 1 2 2 2 3 3 1 5 7 6 4 HACCP1 48 27 53 42 25 44 10 20 13 5 Cecal (Market Hogs) 21 Cecal (Sows) 4
Antimicrobial Class
Antimicrobial (Resistance Breakpoint)
Isolate Source
β-Lactam/β-Lactamase Amoxicillin- 7.6% 5.9% 4.7% 3.2% 4.4% 6.7% 3.5% 6.2% 4.2% 7.1% 5.7% 3.4% Inhibitor Combinations Clavulanic Acid 30 24 18 14 18 27 14 23 15 23 17 11
(MIC ≥ 32 / 16 µg/ml) 33.3% 63.6% 49.0% 51.7% 57.1% 44.0% 48.5% 57.4% 60.8% 54.6% 55.7% 50.0%3 14 24 15 12 11 33 70 48 36 49 34
28.7% 25.6% 43.3% 19.7% 30.5% 33.7% 24.3% 33.3% 29.6% 6.7% 29.5% 9.1%43 40 74 36 32 28 17 12 16 2 31 5
13.3%2
0.0% 100.0% 0.0% 100.0% 0.0% 0.0% 0.0% 50.0% 62.5% 22.2% 0.0%0 2 0 1 0 0 0 3 5 2 0
22.2% 16.7% 14.3% 0.0% 0.0% 16.7% 0.0% 50.0% 50.0% 0.0% 50.0% 0.0%2 1 2 0 0 1 0 1 2 0 2 0
0.0%0
0.0% 0.0% 0.0% 0.0% 0.0% 0.0%0 0 0 0 0 0
17.3% 20.5% 25.0% 35.3% 27.3% 26.9% 21.4% 27.8% 20.0% 35.7% 12.5% 30.4%17 16 12 12 6 7 6 5 3 5 2 7
21.4%3
52.4%11
0.0% 0.0% 0.0% 0.0% 0.0% 0.0% 0.0% 0.0% 0.0% 0.0% 0.0%0 0 0 0 0 0 0 0 0 0 0
8.3% 0.0% 0.0% 9.5% 0.0% 2.3% 0.0% 0.0% 7.7% 0.0%4 0 0 4 0 1 0 0 1 0
0.0%0
0.0%0
Cefoxitin 4.3% 4.6% 4.7% 2.5% 3.9% 5.7% 3.5% 5.4% 3.3% 6.8% 5.4% 3.4% (MIC ≥ 32 µg/ml) 17 19 18 11 16 23 14 20 12 22 16 11
33.3% 63.6% 49.0% 51.7% 52.4% 40.0% 45.6% 47.5% 51.9% 34.9% 45.5% 44.1%3 14 24 15 11 10 31 58 41 23 40 30
26.7% 23.7% 43.3% 19.7% 29.5% 24.1% 20.0% 27.8% 27.8% 6.7% 18.1% 3.6%40 37 74 36 31 20 14 10 15 2 19 2
6.7%1
0.0% 100.0% 0.0% 100.0% 0.0% 0.0% 0.0% 50.0% 50.0% 22.2% 0.0%0 2 0 1 0 0 0 3 4 2 0
22.2% 16.7% 14.3% 0.0% 0.0% 16.7% 0.0% 50.0% 0.0% 0.0% 50.0% 0.0%2 1 2 0 0 1 0 1 0 0 2 0
0.0%0
0.0% 0.0% 0.0% 0.0% 0.0% 0.0%0 0 0 0 0 0
11.2% 16.7% 25.0% 35.3% 27.3% 26.9% 17.9% 22.2% 20.0% 35.7% 12.5% 30.4%11 13 12 12 6 7 5 4 3 5 2 7
21.4%3
52.4%11
0.0% 0.0% 0.0% 0.0% 0.0% 0.0% 0.0% 0.0% 0.0% 0.0% 0.0% 0.0%0 0 0 0 0 0 0 0 0 0 0 0
4.2% 3.7% 0.0% 4.8% 0.0% 4.5% 0.0% 0.0% 0.0% 0.0%2 1 0 2 0 2 0 0 0 0
0.0%0
Ceftiofur 4.3% 5.1% 4.5% 2.5% 4.2% 6.4% 3.5% 6.5% 4.7% 6.8% 5.7% 3.4% (MIC ≥ 8 µg/ml) 17 21 17 11 17 26 14 24 17 22 17 11
33.3% 63.6% 49.0% 51.7% 57.1% 44.0% 48.5% 56.6% 60.8% 54.6% 55.7% 50.0%3 14 24 15 12 11 33 69 48 36 49 34
28.0% 25.6% 43.3% 19.7% 30.5% 32.5% 24.3% 33.3% 29.6% 6.7% 27.6% 9.1%42 40 74 36 32 27 17 12 16 2 29 5
13.3%2
0.0% 100.0% 0.0% 100.0% 0.0% 0.0% 0.0% 50.0% 50.0% 22.2% 0.0%0 2 0 1 0 0 0 3 4 2 0
22.2% 16.7% 14.3% 0.0% 0.0% 16.7% 0.0% 50.0% 0.0% 0.0% 50.0% 0.0%2 1 2 0 0 1 0 1 0 0 2 0
0.0%0
0.0% 0.0% 0.0% 0.0% 0.0% 0.0%0 0 0 0 0 0
15.3% 20.5% 25.0% 35.3% 27.3% 26.9% 21.4% 27.8% 20.0% 35.7% 12.5% 30.4%15 16 12 12 6 7 6 5 3 5 2 7
21.4%3
52.4%11
0.0% 0.0% 0.0% 0.0% 0.0% 0.0% 0.0% 0.0% 0.0% 0.0% 0.0% 0.0%0 0 0 0 0 0 0 0 0 0 0 0
4.2% 0.0% 1.9% 4.8% 0.0% 2.3% 0.0% 0.0% 0.0% 0.0%2 0 1 2 0 1 0 0 0 0
4.8%1
0.0%0
1 In 2012 and 2013, FSIS did not sample products for Salmonella because in prior years the percent of pork carcass samples positive for Salmonella was consistently low
Cecal (Dairy)
Swin
e
Retail Pork Chops
HACCP
Cecal (Market Hogs)
Cecal (Sows)
Cat
tle HACCP
Cecal (Beef)
Retail Ground Beef
Cecal
Turk
eys
Retail Ground Turkey
HACCP
Cecal
Humans
Chi
cken
s Retail Chickens
Swin
e
Retail Pork Chops
HACCP
Cecal (Market Hogs)
Cecal (Sows)
HACCP
Cat
tle
Retail Ground Beef
HACCP
Cecal (Beef)
Cecal (Dairy)
Turk
eys
Retail Ground Turkey
HACCP
Cecal
Chi
cken
s
HACCP
Cecal
Retail Chickens
HACCP
Cecal (Beef)
Cecal (Dairy)
Chi
cken
s
Cephems Humans
Swin
e
Retail Pork Chops
HACCP
Cecal (Market Hogs)
Cecal (Sows)
Cat
tle
Retail Ground Beef
Turk
eys
Retail Ground Turkey
HACCP
Cecal
HACCP
Cecal
Retail Chickens
Chi
cken
sTu
rkey
sC
attle
Swin
e Humans
62

Table 48c. Antimicrobial Resistance among Salmonella Typhimurium Isolates, 2002-2013 Year 2002 2003 2004 2005 2006 2007 2008 2009 2010 2011 2012 2013
Number of Isolates Tested Humans 394 409 382 438 408 405 396 370 359 323 296 325
Retail Chickens 9 22 49 29 21 25 68 122 79 66 88 68 HACCP 150 156 171 183 105 83 70 36 54 30 105 55 Cecal 15
Retail Ground Turkey 2 2 2 1 0 1 1 1 6 8 9 1 HACCP 9 6 14 7 5 6 3 2 4 2 4 5 Cecal 2
Retail Ground Beef 2 1 0 0 1 3 2 0 0 0 1 0 HACCP 98 78 48 34 22 26 28 18 15 14 16 23 Cecal (Beef) 14 Cecal (Dairy) 21
Retail Pork Chops 2 1 2 2 2 3 3 1 5 7 6 4 HACCP1 48 27 53 42 25 44 10 20 13 5 Cecal (Market Hogs) 21 Cecal (Sows) 4
Antimicrobial Class
Antimicrobial (Resistance Breakpoint)
Isolate Source
Ceftriaxone 4.3% 5.1% 4.5% 2.5% 4.2% 6.4% 3.5% 6.5% 4.7% 6.8% 5.7% 3.4% (MIC ≥ 4 µg/ml) 17 21 17 11 17 26 14 24 17 22 17 11
33.3% 63.6% 49.0% 51.7% 57.1% 44.0% 48.5% 57.3% 60.8% 54.6% 55.7% 50.0%3 14 24 15 12 11 33 70 48 36 49 34
26.7% 25.6% 43.3% 19.7% 30.5% 33.7% 24.3% 33.3% 29.6% 6.7% 28.6% 9.1%40 40 74 36 32 28 17 12 16 2 30 5
13.3%2
0.0% 100.0% 0.0% 100.0% 0.0% 0.0% 0.0% 50.0% 62.5% 22.2% 0.0%0 2 0 1 0 0 0 3 5 2 0
22.2% 16.7% 14.3% 0.0% 0.0% 16.7% 0.0% 50.0% 0.0% 0.0% 50.0% 0.0%2 1 2 0 0 1 0 1 0 0 2 0
0.0%0
0.0% 0.0% 0.0% 0.0% 0.0% 0.0%0 0 0 0 0 0
15.3% 20.5% 25.0% 35.3% 27.3% 26.9% 21.4% 27.8% 20.0% 35.7% 12.5% 30.4%15 16 12 12 6 7 6 5 3 5 2 7
21.4%3
52.4%11
0.0% 0.0% 0.0% 0.0% 0.0% 0.0% 0.0% 0.0% 0.0% 0.0% 0.0% 0.0%0 0 0 0 0 0 0 0 0 0 0 0
4.2% 0.0% 0.0% 4.8% 0.0% 2.3% 0.0% 0.0% 0.0% 0.0%2 0 0 2 0 1 0 0 0 0
4.8%1
0.0%0
Folate Pathway Inhibitor Sulfamethoxazole/ 32.2% 38.9% 36.1% 32.0% 33.3% 37.3% 30.3% 30.0% 28.7% 27.2% 27.0% 20.9% Sulfisoxazole 2 127 159 138 140 136 151 120 111 103 88 80 68 (MIC ≥ 512 µg/ml) 44.4% 31.8% 73.5% 69.0% 90.5% 68.0% 94.1% 96.7% 92.4% 93.9% 89.8% 92.7%
4 7 36 20 19 17 64 118 73 62 79 6331.3% 28.2% 47.4% 37.2% 65.7% 60.2% 70.0% 52.8% 74.1% 70.0% 81.9% 76.4%
47 44 81 68 69 50 49 19 40 21 86 4293.3%
140.0% 50.0% 100.0% 0.0% 100.0% 0.0% 100.0% 66.7% 62.5% 55.6% 100.0%
0 1 2 0 1 0 1 4 5 5 177.8% 100.0% 78.6% 57.1% 80.0% 83.3% 66.7% 100.0% 50.0% 0.0% 75.0% 20.0%
7 6 11 4 4 5 2 2 2 0 3 150.0%
10.0% 0.0% 100.0% 0.0% 50.0% 0.0%
0 0 1 0 1 058.2% 44.9% 60.4% 73.5% 59.1% 65.4% 53.6% 83.3% 60.0% 57.1% 62.5% 43.5%
57 35 29 25 13 17 15 15 9 8 10 1057.1%
866.7%
1450.0% 100.0% 100.0% 100.0% 100.0% 0.0% 33.3% 100.0% 80.0% 71.4% 50.0% 75.0%
1 1 2 2 2 0 1 1 4 5 3 368.8% 63.0% 81.1% 69.0% 96.0% 77.3% 80.0% 90.0% 69.2% 80.0%
33 17 43 29 24 34 8 18 9 471.4%
15100.0%
4 Trimethoprim- 2.3% 3.4% 2.6% 2.7% 2.2% 2.5% 1.8% 3.0% 1.9% 1.9% 1.7% 1.2% Sulfamethoxazole 9 14 10 12 9 10 7 11 7 6 5 4 (MIC ≥ 4 / 76 µg/ml) 0.0% 0.0% 0.0% 0.0% 0.0% 0.0% 0.0% 0.0% 0.0% 1.5% 0.0% 0.0%
0 0 0 0 0 0 0 0 0 1 0 01.3% 0.6% 0.0% 0.0% 0.0% 0.0% 0.0% 2.8% 0.0% 0.0% 1.0% 0.0%
2 1 0 0 0 0 0 1 0 0 1 00.0%
00.0% 0.0% 0.0% 0.0% 0.0% 0.0% 0.0% 0.0% 0.0% 0.0% 0.0%
0 0 0 0 0 0 0 0 0 0 00.0% 0.0% 0.0% 0.0% 0.0% 0.0% 0.0% 0.0% 0.0% 0.0% 0.0% 0.0%
0 0 0 0 0 0 0 0 0 0 0 00.0%
00.0% 0.0% 0.0% 0.0% 0.0% 0.0%
0 0 0 0 0 04.1% 2.6% 4.2% 5.9% 4.5% 0.0% 0.0% 5.6% 6.7% 0.0% 6.2% 0.0%
4 2 2 2 1 0 0 1 1 0 1 00.0%
00.0%
00.0% 0.0% 0.0% 50.0% 0.0% 0.0% 0.0% 100.0% 0.0% 0.0% 0.0% 0.0%
0 0 0 1 0 0 0 1 0 0 0 02.1% 3.7% 1.9% 9.5% 4.0% 9.1% 10.0% 5.0% 7.7% 0.0%
1 1 1 4 1 4 1 1 1 09.5%
20.0%
01 In 2012 and 2013, FSIS did not sample products for Salmonella because in prior years the percent of pork carcass samples positive for Salmonella was consistently low2 Sulfamethoxazole was tested from 1996-2003 and was replaced by sulfisoxazole in 2004
Swin
e
Retail Pork Chops
HACCP
Cecal (Market Hogs)
Cecal (Sows)
Cecal (Beef)Cat
tle
Retail Ground Beef
Cecal (Dairy)
HACCP
Turk
eys
Retail Ground Turkey
HACCP
Cecal
HACCP
Humans
Chi
cken
s
Retail Chickens
Cecal
Cecal (Dairy)
Swin
e
Retail Pork Chops
HACCP
Cecal (Market Hogs)
Cecal (Sows)
Cat
tle
HACCP
Cecal (Beef)
Retail Ground Beef
Turk
eys
Retail Ground Turkey
HACCP
Cecal
HACCP
Cecal
Humans
Chi
cken
s
Retail Chickens
Swin
e
Retail Pork Chops
HACCP
Cecal (Market Hogs)
Cecal (Sows)
Cecal (Beef)Cat
tle
Retail Ground Beef
Cecal (Dairy)
HACCP
Turk
eys
Retail Ground Turkey
HACCP
Cecal
HACCP
Cephems HumansC
hick
ens
Retail Chickens
Cecal
Cat
tleSw
ine
Chi
cken
sTu
rkey
s
63
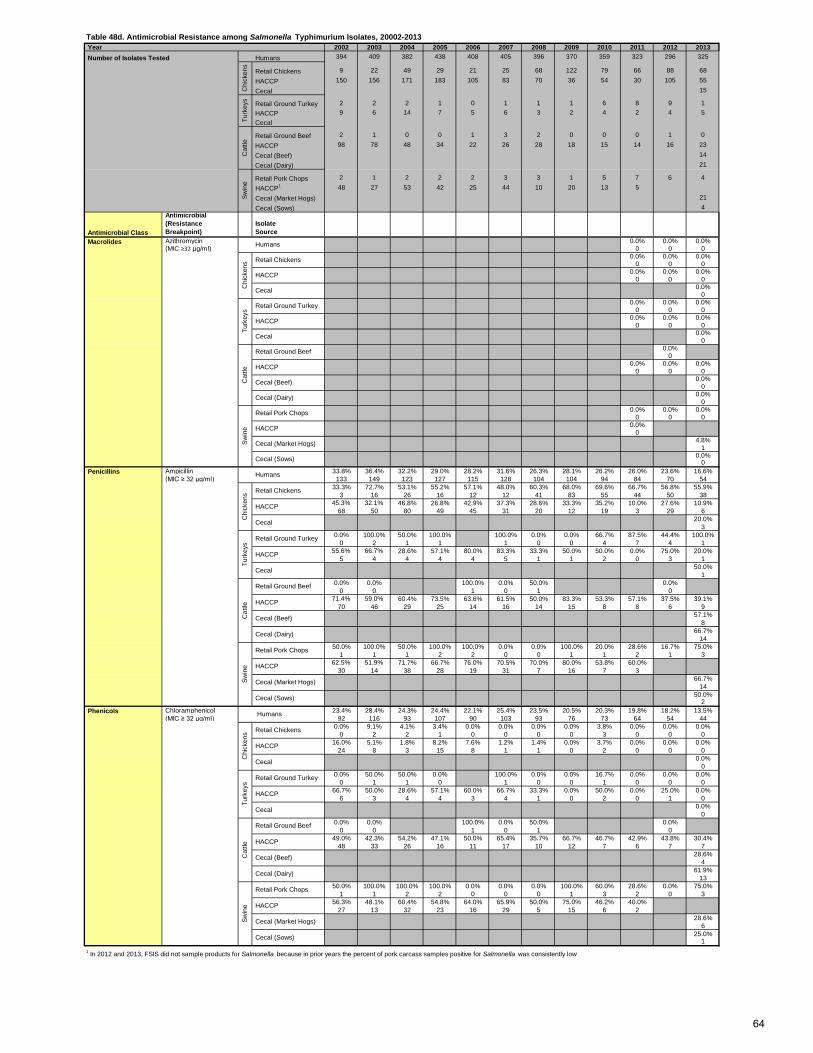
Table 48d. Antimicrobial Resistance among Salmonella Typhimurium Isolates, 20002-2013 Year 2002 2003 2004 2005 2006 2007 2008 2009 2010 2011 2012 2013 Number of Isolates Tested Humans 394 409 382 438 408 405 396 370 359 323 296 325
Retail Chickens 9 22 49 29 21 25 68 122 79 66 88 68 HACCP 150 156 171 183 105 83 70 36 54 30 105 55 Cecal 15
Retail Ground Turkey 2 2 2 1 0 1 1 1 6 8 9 1 HACCP 9 6 14 7 5 6 3 2 4 2 4 5 Cecal
Retail Ground Beef 2 1 0 0 1 3 2 0 0 0 1 0 HACCP 98 78 48 34 22 26 28 18 15 14 16 23 Cecal (Beef) 14 Cecal (Dairy) 21
Retail Pork Chops 2 1 2 2 2 3 3 1 5 7 6 4 HACCP1 48 27 53 42 25 44 10 20 13 5 Cecal (Market Hogs) 21 Cecal (Sows) 4
Antimicrobial Class
Antimicrobial (Resistance Breakpoint)
Isolate Source
Azithromycin 0.0% 0.0% 0.0% (MIC ≥32 µg/ml) 0 0 0
0.0% 0.0% 0.0%0 0 0
0.0% 0.0% 0.0%0 0 0
0.0%0
0.0% 0.0% 0.0%0 0 0
0.0% 0.0% 0.0%0 0 0
0.0%0
0.0%0
0.0% 0.0% 0.0%0 0 0
0.0%0
0.0%0
0.0% 0.0% 0.0%0 0 0
0.0%0
4.8%1
0.0%0
Ampicillin 33.8% 36.4% 32.2% 29.0% 28.2% 31.6% 26.3% 28.1% 26.2% 26.0% 23.6% 16.6% (MIC ≥ 32 µg/ml) 133 149 123 127 115 128 104 104 94 84 70 54
33.3% 72.7% 53.1% 55.2% 57.1% 48.0% 60.3% 68.0% 69.6% 66.7% 56.8% 55.9%3 16 26 16 12 12 41 83 55 44 50 38
45.3% 32.1% 46.8% 26.8% 42.9% 37.3% 28.6% 33.3% 35.2% 10.0% 27.6% 10.9%68 50 80 49 45 31 20 12 19 3 29 6
20.0%3
0.0% 100.0% 50.0% 100.0% 100.0% 0.0% 0.0% 66.7% 87.5% 44.4% 100.0%0 2 1 1 1 0 0 4 7 4 1
55.6% 66.7% 28.6% 57.1% 80.0% 83.3% 33.3% 50.0% 50.0% 0.0% 75.0% 20.0%5 4 4 4 4 5 1 1 2 0 3 1
50.0%1
0.0% 0.0% 100.0% 0.0% 50.0% 0.0%0 0 1 0 1 0
71.4% 59.0% 60.4% 73.5% 63.6% 61.5% 50.0% 83.3% 53.3% 57.1% 37.5% 39.1%70 46 29 25 14 16 14 15 8 8 6 9
57.1%8
66.7%14
50.0% 100.0% 50.0% 100.0% 100.0% 0.0% 0.0% 100.0% 20.0% 28.6% 16.7% 75.0%1 1 1 2 2 0 0 1 1 2 1 3
62.5% 51.9% 71.7% 66.7% 76.0% 70.5% 70.0% 80.0% 53.8% 60.0%30 14 38 28 19 31 7 16 7 3
66.7%14
50.0%2
Chloramphenicol 23.4% 28.4% 24.3% 24.4% 22.1% 25.4% 23.5% 20.5% 20.3% 19.8% 18.2% 13.5% (MIC ≥ 32 µg/ml) 92 116 93 107 90 103 93 76 73 64 54 44
0.0% 9.1% 4.1% 3.4% 0.0% 0.0% 0.0% 0.0% 3.8% 0.0% 0.0% 0.0%0 2 2 1 0 0 0 0 3 0 0 0
16.0% 5.1% 1.8% 8.2% 7.6% 1.2% 1.4% 0.0% 3.7% 0.0% 0.0% 0.0%24 8 3 15 8 1 1 0 2 0 0 0
0.0%0
0.0% 50.0% 50.0% 0.0% 100.0% 0.0% 0.0% 16.7% 0.0% 0.0% 0.0%0 1 1 0 1 0 0 1 0 0 0
66.7% 50.0% 28.6% 57.1% 60.0% 66.7% 33.3% 0.0% 50.0% 0.0% 25.0% 0.0%6 3 4 4 3 4 1 0 2 0 1 0
0.0%0
0.0% 0.0% 100.0% 0.0% 50.0% 0.0%0 0 1 0 1 0
49.0% 42.3% 54.2% 47.1% 50.0% 65.4% 35.7% 66.7% 46.7% 42.9% 43.8% 30.4%48 33 26 16 11 17 10 12 7 6 7 7
28.6%4
61.9%13
50.0% 100.0% 100.0% 100.0% 0.0% 0.0% 0.0% 100.0% 60.0% 28.6% 0.0% 75.0%1 1 2 2 0 0 0 1 3 2 0 3
56.3% 48.1% 60.4% 54.8% 64.0% 65.9% 50.0% 75.0% 46.2% 40.0%27 13 32 23 16 29 5 15 6 2
28.6%6
25.0%1
1 In 2012 and 2013, FSIS did not sample products for Salmonella because in prior years the percent of pork carcass samples positive for Salmonella was consistently low
Swin
e
Retail Pork Chops
HACCP
Cecal (Market Hogs)
Cecal (Sows)
Cecal (Beef)Cat
tle
Retail Ground Beef
Cecal (Dairy)
HACCP
Turk
eys
Retail Ground Turkey
HACCP
Cecal
HACCP
Phenicols Humans
Chi
cken
s Retail Chickens
Cecal
Swin
e
Retail Pork Chops
HACCP
Cecal (Market Hogs)
Cecal (Sows)
Cecal (Beef)Cat
tle
Retail Ground Beef
Cecal (Dairy)
HACCP
Turk
eys
Retail Ground Turkey
HACCP
Cecal
HACCP
Penicillins Humans
Chi
cken
s Retail Chickens
Cecal
Chi
cken
sSw
ine
Retail Pork Chops
HACCP
Cecal (Market Hogs)
Cecal (Sows)
Cat
tle
Retail Ground Beef
HACCP
Turk
eys
Retail Ground Turkey
HACCP
Cecal
Cecal (Dairy)
HACCP
Cecal
Retail Chickens
Cecal (Beef)
Chi
cken
sTu
rkey
sC
attle
Swin
e Macrolides Humans
64
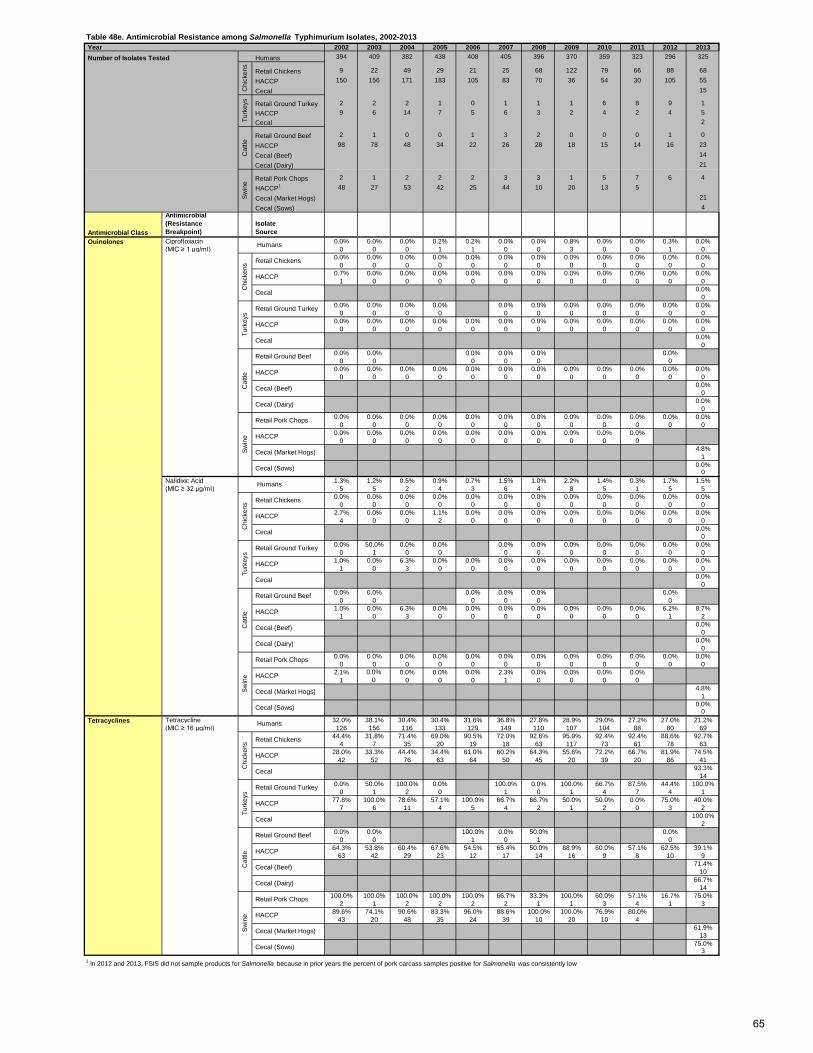
Table 48e. Antimicrobial Resistance among Salmonella Typhimurium Isolates, 2002-2013 Year 2002 2003 2004 2005 2006 2007 2008 2009 2010 2011 2012 2013 Number of Isolates Tested Humans 394 409 382 438 408 405 396 370 359 323 296 325
Retail Chickens 9 22 49 29 21 25 68 122 79 66 88 68 HACCP 150 156 171 183 105 83 70 36 54 30 105 55 Cecal 15
Retail Ground Turkey 2 2 2 1 0 1 1 1 6 8 9 1 HACCP 9 6 14 7 5 6 3 2 4 2 4 5 Cecal 2
Retail Ground Beef 2 1 0 0 1 3 2 0 0 0 1 0 HACCP 98 78 48 34 22 26 28 18 15 14 16 23 Cecal (Beef) 14 Cecal (Dairy) 21
Retail Pork Chops 2 1 2 2 2 3 3 1 5 7 6 4 HACCP1 48 27 53 42 25 44 10 20 13 5 Cecal (Market Hogs) 21 Cecal (Sows) 4
Antimicrobial Class
Antimicrobial (Resistance Breakpoint)
Isolate Source
Quinolones Ciprofloxacin 0.0% 0.0% 0.0% 0.2% 0.2% 0.0% 0.0% 0.8% 0.0% 0.0% 0.3% 0.0% (MIC ≥ 1 µg/ml) 0 0 0 1 1 0 0 3 0 0 1 0
0.0% 0.0% 0.0% 0.0% 0.0% 0.0% 0.0% 0.0% 0.0% 0.0% 0.0% 0.0%0 0 0 0 0 0 0 0 0 0 0 0
0.7% 0.0% 0.0% 0.0% 0.0% 0.0% 0.0% 0.0% 0.0% 0.0% 0.0% 0.0%1 0 0 0 0 0 0 0 0 0 0 0
0.0%0
0.0% 0.0% 0.0% 0.0% 0.0% 0.0% 0.0% 0.0% 0.0% 0.0% 0.0%0 0 0 0 0 0 0 0 0 0 0
0.0% 0.0% 0.0% 0.0% 0.0% 0.0% 0.0% 0.0% 0.0% 0.0% 0.0% 0.0%0 0 0 0 0 0 0 0 0 0 0 0
0.0%0
0.0% 0.0% 0.0% 0.0% 0.0% 0.0%0 0 0 0 0 0
0.0% 0.0% 0.0% 0.0% 0.0% 0.0% 0.0% 0.0% 0.0% 0.0% 0.0% 0.0%0 0 0 0 0 0 0 0 0 0 0 0
0.0%0
0.0%0
0.0% 0.0% 0.0% 0.0% 0.0% 0.0% 0.0% 0.0% 0.0% 0.0% 0.0% 0.0%0 0 0 0 0 0 0 0 0 0 0 0
0.0% 0.0% 0.0% 0.0% 0.0% 0.0% 0.0% 0.0% 0.0% 0.0%0 0 0 0 0 0 0 0 0 0
4.8%1
0.0%0
Nalidixic Acid 1.3% 1.2% 0.5% 0.9% 0.7% 1.5% 1.0% 2.2% 1.4% 0.3% 1.7% 1.5% (MIC ≥ 32 µg/ml) 5 5 2 4 3 6 4 8 5 1 5 5
0.0% 0.0% 0.0% 0.0% 0.0% 0.0% 0.0% 0.0% 0.0% 0.0% 0.0% 0.0%0 0 0 0 0 0 0 0 0 0 0 0
2.7% 0.0% 0.0% 1.1% 0.0% 0.0% 0.0% 0.0% 0.0% 0.0% 0.0% 0.0%4 0 0 2 0 0 0 0 0 0 0 0
0.0%0
0.0% 50.0% 0.0% 0.0% 0.0% 0.0% 0.0% 0.0% 0.0% 0.0% 0.0%0 1 0 0 0 0 0 0 0 0 0
1.0% 0.0% 6.3% 0.0% 0.0% 0.0% 0.0% 0.0% 0.0% 0.0% 0.0% 0.0%1 0 3 0 0 0 0 0 0 0 0 0
0.0%0
0.0% 0.0% 0.0% 0.0% 0.0% 0.0%0 0 0 0 0 0
1.0% 0.0% 6.3% 0.0% 0.0% 0.0% 0.0% 0.0% 0.0% 0.0% 6.2% 8.7%1 0 3 0 0 0 0 0 0 0 1 2
0.0%0
0.0%0
0.0% 0.0% 0.0% 0.0% 0.0% 0.0% 0.0% 0.0% 0.0% 0.0% 0.0% 0.0%0 0 0 0 0 0 0 0 0 0 0 0
2.1% 0.0% 0.0% 0.0% 0.0% 2.3% 0.0% 0.0% 0.0% 0.0%1 0 0 0 0 1 0 0 0 0
4.8%1
0.0%0
Tetracycline 32.0% 38.1% 30.4% 30.4% 31.6% 36.8% 27.8% 28.9% 29.0% 27.2% 27.0% 21.2% (MIC ≥ 16 µg/ml) 126 156 116 133 129 149 110 107 104 88 80 69
44.4% 31.8% 71.4% 69.0% 90.5% 72.0% 92.6% 95.9% 92.4% 92.4% 88.6% 92.7%4 7 35 20 19 18 63 117 73 61 78 63
28.0% 33.3% 44.4% 34.4% 61.0% 60.2% 64.3% 55.6% 72.2% 66.7% 81.9% 74.5%42 52 76 63 64 50 45 20 39 20 86 41
93.3%14
0.0% 50.0% 100.0% 0.0% 100.0% 0.0% 100.0% 66.7% 87.5% 44.4% 100.0%0 1 2 0 1 0 1 4 7 4 1
77.8% 100.0% 78.6% 57.1% 100.0% 66.7% 66.7% 50.0% 50.0% 0.0% 75.0% 40.0%7 6 11 4 5 4 2 1 2 0 3 2
100.0%2
0.0% 0.0% 100.0% 0.0% 50.0% 0.0%0 0 1 0 1 0
64.3% 53.8% 60.4% 67.6% 54.5% 65.4% 50.0% 88.9% 60.0% 57.1% 62.5% 39.1%63 42 29 23 12 17 14 16 9 8 10 9
71.4%10
66.7%14
100.0% 100.0% 100.0% 100.0% 100.0% 66.7% 33.3% 100.0% 60.0% 57.1% 16.7% 75.0%2 1 2 2 2 2 1 1 3 4 1 3
89.6% 74.1% 90.6% 83.3% 96.0% 88.6% 100.0% 100.0% 76.9% 80.0%43 20 48 35 24 39 10 20 10 4
61.9%13
75.0%3
1 In 2012 and 2013, FSIS did not sample products for Salmonella because in prior years the percent of pork carcass samples positive for Salmonella was consistently low
Cecal (Market Hogs)
Cecal (Sows)
Cecal (Beef)
Cecal (Dairy)
Swin
e
Retail Pork Chops
HACCP
Cat
tle
Retail Ground Beef
HACCP
Cecal
Turk
eys
Retail Ground Turkey
HACCP
HACCP
Tetracyclines Humans
Chi
cken
s Retail Chickens
Cecal
Cecal (Dairy)
Swin
e
Retail Pork Chops
HACCP
Cecal (Market Hogs)
Cecal (Sows)
Cat
tle HACCP
Cecal (Beef)
Retail Ground Beef
Cecal
Turk
eys
Retail Ground Turkey
HACCP
Cecal
Humans
Chi
cken
s Retail Chickens
Swin
e
Retail Pork Chops
HACCP
Cecal (Market Hogs)
Cecal (Sows)
HACCP
Cat
tle
Retail Ground Beef
Turk
eys
Retail Ground Turkey
HACCP
Cecal
Chi
cken
s
HACCP
Cecal (Beef)
Cecal (Dairy)
HACCP
Cecal
Retail Chickens
Chi
cken
sTu
rkey
sC
attle
Swin
e Humans
65
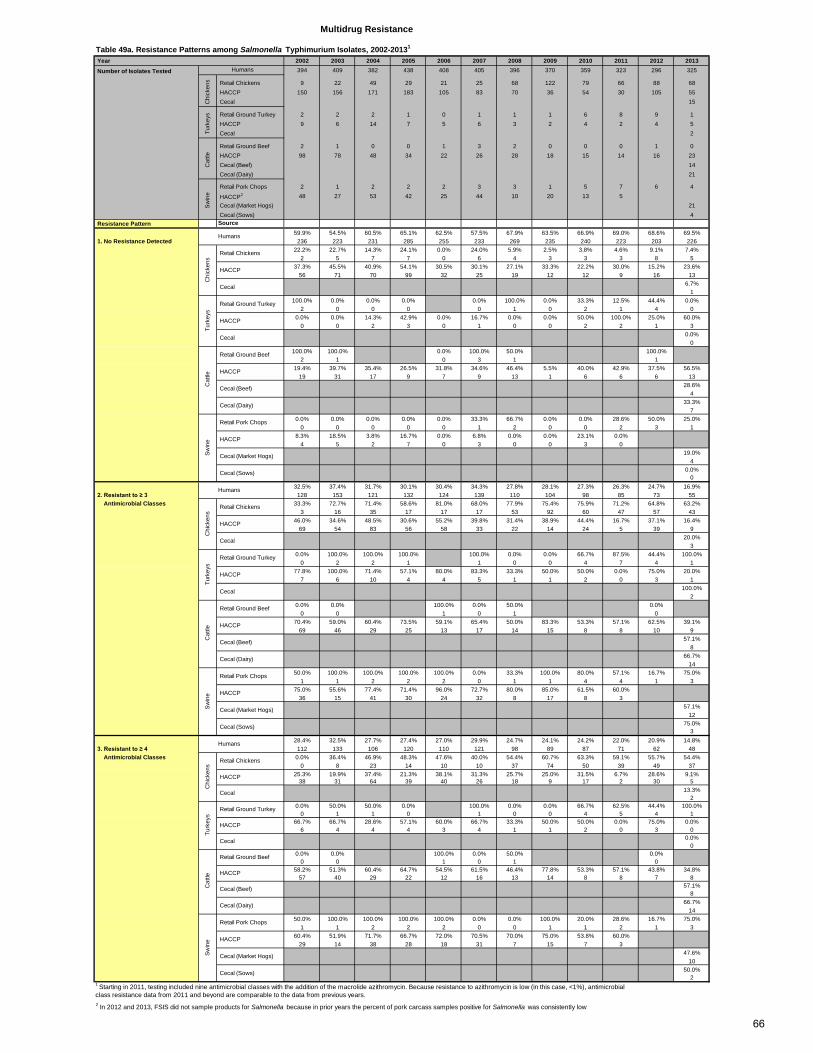
Table 49a. Resistance Patterns among Salmonella Typhimurium Isolates, 2002-20131
Year 2002 2003 2004 2005 2006 2007 2008 2009 2010 2011 2012 2013
Number of Isolates Tested 394 409 382 438 408 405 396 370 359 323 296 325
Retail Chickens 9 22 49 29 21 25 68 122 79 66 88 68 HACCP 150 156 171 183 105 83 70 36 54 30 105 55 Cecal 15
Retail Ground Turkey 2 2 2 1 0 1 1 1 6 8 9 1 HACCP 9 6 14 7 5 6 3 2 4 2 4 5 Cecal 2
Retail Ground Beef 2 1 0 0 1 3 2 0 0 0 1 0 HACCP 98 78 48 34 22 26 28 18 15 14 16 23 Cecal (Beef) 14 Cecal (Dairy) 21
Retail Pork Chops 2 1 2 2 2 3 3 1 5 7 6 4
HACCP2 48 27 53 42 25 44 10 20 13 5 Cecal (Market Hogs) 21 Cecal (Sows) 4
Resistance Pattern Source59.9% 54.5% 60.5% 65.1% 62.5% 57.5% 67.9% 63.5% 66.9% 69.0% 68.6% 69.5%
1. No Resistance Detected 236 223 231 285 255 233 269 235 240 223 203 22622.2% 22.7% 14.3% 24.1% 0.0% 24.0% 5.9% 2.5% 3.8% 4.6% 9.1% 7.4%
2 5 7 7 0 6 4 3 3 3 8 537.3% 45.5% 40.9% 54.1% 30.5% 30.1% 27.1% 33.3% 22.2% 30.0% 15.2% 23.6%
56 71 70 99 32 25 19 12 12 9 16 136.7%
1100.0% 0.0% 0.0% 0.0% 0.0% 100.0% 0.0% 33.3% 12.5% 44.4% 0.0%
2 0 0 0 0 1 0 2 1 4 00.0% 0.0% 14.3% 42.9% 0.0% 16.7% 0.0% 0.0% 50.0% 100.0% 25.0% 60.0%
0 0 2 3 0 1 0 0 2 2 1 30.0%
0100.0% 100.0% 0.0% 100.0% 50.0% 100.0%
2 1 0 3 1 119.4% 39.7% 35.4% 26.5% 31.8% 34.6% 46.4% 5.5% 40.0% 42.9% 37.5% 56.5%
19 31 17 9 7 9 13 1 6 6 6 1328.6%
433.3%
70.0% 0.0% 0.0% 0.0% 0.0% 33.3% 66.7% 0.0% 0.0% 28.6% 50.0% 25.0%
0 0 0 0 0 1 2 0 0 2 3 18.3% 18.5% 3.8% 16.7% 0.0% 6.8% 0.0% 0.0% 23.1% 0.0%
4 5 2 7 0 3 0 0 3 019.0%
40.0%
032.5% 37.4% 31.7% 30.1% 30.4% 34.3% 27.8% 28.1% 27.3% 26.3% 24.7% 16.9%
2. Resistant to ≥ 3 128 153 121 132 124 139 110 104 98 85 73 55 Antimicrobial Classes 33.3% 72.7% 71.4% 58.6% 81.0% 68.0% 77.9% 75.4% 75.9% 71.2% 64.8% 63.2%
3 16 35 17 17 17 53 92 60 47 57 4346.0% 34.6% 48.5% 30.6% 55.2% 39.8% 31.4% 38.9% 44.4% 16.7% 37.1% 16.4%
69 54 83 56 58 33 22 14 24 5 39 920.0%
30.0% 100.0% 100.0% 100.0% 100.0% 0.0% 0.0% 66.7% 87.5% 44.4% 100.0%
0 2 2 1 1 0 0 4 7 4 177.8% 100.0% 71.4% 57.1% 80.0% 83.3% 33.3% 50.0% 50.0% 0.0% 75.0% 20.0%
7 6 10 4 4 5 1 1 2 0 3 1100.0%
20.0% 0.0% 100.0% 0.0% 50.0% 0.0%
0 0 1 0 1 070.4% 59.0% 60.4% 73.5% 59.1% 65.4% 50.0% 83.3% 53.3% 57.1% 62.5% 39.1%
69 46 29 25 13 17 14 15 8 8 10 957.1%
866.7%
1450.0% 100.0% 100.0% 100.0% 100.0% 0.0% 33.3% 100.0% 80.0% 57.1% 16.7% 75.0%
1 1 2 2 2 0 1 1 4 4 1 375.0% 55.6% 77.4% 71.4% 96.0% 72.7% 80.0% 85.0% 61.5% 60.0%
36 15 41 30 24 32 8 17 8 357.1%
1275.0%
328.4% 32.5% 27.7% 27.4% 27.0% 29.9% 24.7% 24.1% 24.2% 22.0% 20.9% 14.8%
3. Resistant to ≥ 4 112 133 106 120 110 121 98 89 87 71 62 48 Antimicrobial Classes 0.0% 36.4% 46.9% 48.3% 47.6% 40.0% 54.4% 60.7% 63.3% 59.1% 55.7% 54.4%
0 8 23 14 10 10 37 74 50 39 49 3725.3% 19.9% 37.4% 21.3% 38.1% 31.3% 25.7% 25.0% 31.5% 6.7% 28.6% 9.1%
38 31 64 39 40 26 18 9 17 2 30 513.3%
20.0% 50.0% 50.0% 0.0% 100.0% 0.0% 0.0% 66.7% 62.5% 44.4% 100.0%
0 1 1 0 1 0 0 4 5 4 166.7% 66.7% 28.6% 57.1% 60.0% 66.7% 33.3% 50.0% 50.0% 0.0% 75.0% 0.0%
6 4 4 4 3 4 1 1 2 0 3 00.0%
00.0% 0.0% 100.0% 0.0% 50.0% 0.0%
0 0 1 0 1 058.2% 51.3% 60.4% 64.7% 54.5% 61.5% 46.4% 77.8% 53.3% 57.1% 43.8% 34.8%
57 40 29 22 12 16 13 14 8 8 7 857.1%
866.7%
1450.0% 100.0% 100.0% 100.0% 100.0% 0.0% 0.0% 100.0% 20.0% 28.6% 16.7% 75.0%
1 1 2 2 2 0 0 1 1 2 1 360.4% 51.9% 71.7% 66.7% 72.0% 70.5% 70.0% 75.0% 53.8% 60.0%
29 14 38 28 18 31 7 15 7 347.6%
1050.0%
2
2 In 2012 and 2013, FSIS did not sample products for Salmonella because in prior years the percent of pork carcass samples positive for Salmonella was consistently low
Sw
ine
Humans
Chi
cken
s
Retail Chickens
HACCP
Cecal
Multidrug Resistance
Humans
Chi
cken
sTu
rkey
sC
attle
Turk
eys
Retail Ground Turkey
HACCP
Cecal
Cat
tle
Retail Ground Beef
HACCP
Cecal (Beef)
Cecal (Dairy)
Chi
cken
s
Retail Chickens
HACCP
Cecal
Turk
eys
Retail Ground Turkey
HACCP
Cecal
Sw
ine
Retail Pork Chops
HACCP
Cecal (Market Hogs)
Cecal (Sows)
Humans
Cat
tle
Retail Ground Beef
HACCP
Cecal (Beef)
Cecal (Dairy)
Sw
ine
Retail Pork Chops
HACCP
Cecal (Market Hogs)
Cecal (Sows)
Humans
Chi
cken
s
Retail Chickens
HACCP
Cecal
Turk
eys
Retail Ground Turkey
HACCP
Cecal
Cat
tle
Retail Ground Beef
HACCP
Cecal (Beef)
Cecal (Dairy)
Sw
ine
Retail Pork Chops
HACCP
Cecal (Market Hogs)
Cecal (Sows)
1 Starting in 2011, testing included nine antimicrobial classes with the addition of the macrolide azithromycin. Because resistance to azithromycin is low (in this case, <1%), antimicrobial class resistance data from 2011 and beyond are comparable to the data from previous years.
66
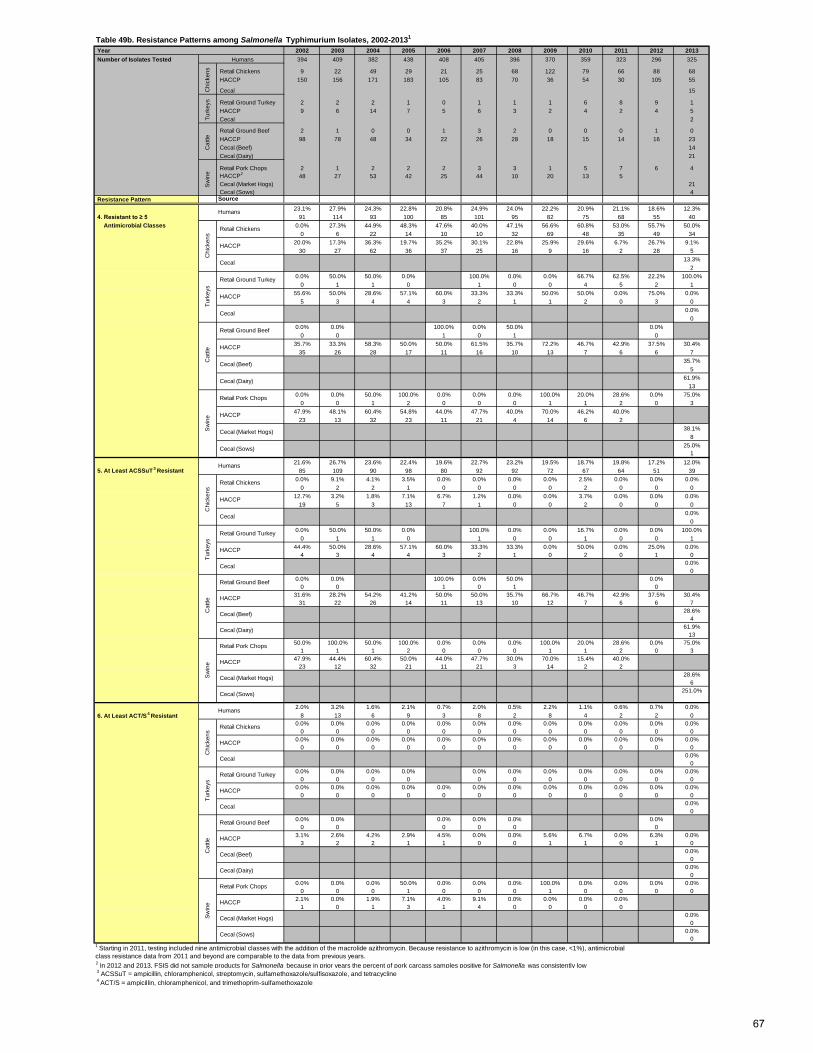
Table 49b. Resistance Patterns among Salmonella Typhimurium Isolates, 2002-20131
Year 2002 2003 2004 2005 2006 2007 2008 2009 2010 2011 2012 2013 Number of Isolates Tested 394 409 382 438 408 405 396 370 359 323 296 325
Retail Chickens 9 22 49 29 21 25 68 122 79 66 88 68 HACCP 150 156 171 183 105 83 70 36 54 30 105 55
Cecal 15
Retail Ground Turkey 2 2 2 1 0 1 1 1 6 8 9 1 HACCP 9 6 14 7 5 6 3 2 4 2 4 5 Cecal 2
Retail Ground Beef 2 1 0 0 1 3 2 0 0 0 1 0 HACCP 98 78 48 34 22 26 28 18 15 14 16 23 Cecal (Beef) 14 Cecal (Dairy) 21
Retail Pork Chops 2 1 2 2 2 3 3 1 5 7 6 4 HACCP2 48 27 53 42 25 44 10 20 13 5 Cecal (Market Hogs) 21 Cecal (Sows) 4
Resistance Pattern Source23.1% 27.9% 24.3% 22.8% 20.8% 24.9% 24.0% 22.2% 20.9% 21.1% 18.6% 12.3%
4. Resistant to ≥ 5 91 114 93 100 85 101 95 82 75 68 55 40 Antimicrobial Classes 0.0% 27.3% 44.9% 48.3% 47.6% 40.0% 47.1% 56.6% 60.8% 53.0% 55.7% 50.0%
0 6 22 14 10 10 32 69 48 35 49 3420.0% 17.3% 36.3% 19.7% 35.2% 30.1% 22.8% 25.9% 29.6% 6.7% 26.7% 9.1%
30 27 62 36 37 25 16 9 16 2 28 513.3%
20.0% 50.0% 50.0% 0.0% 100.0% 0.0% 0.0% 66.7% 62.5% 22.2% 100.0%
0 1 1 0 1 0 0 4 5 2 155.6% 50.0% 28.6% 57.1% 60.0% 33.3% 33.3% 50.0% 50.0% 0.0% 75.0% 0.0%
5 3 4 4 3 2 1 1 2 0 3 00.0%
00.0% 0.0% 100.0% 0.0% 50.0% 0.0%
0 0 1 0 1 035.7% 33.3% 58.3% 50.0% 50.0% 61.5% 35.7% 72.2% 46.7% 42.9% 37.5% 30.4%
35 26 28 17 11 16 10 13 7 6 6 735.7%
561.9%
130.0% 0.0% 50.0% 100.0% 0.0% 0.0% 0.0% 100.0% 20.0% 28.6% 0.0% 75.0%
0 0 1 2 0 0 0 1 1 2 0 347.9% 48.1% 60.4% 54.8% 44.0% 47.7% 40.0% 70.0% 46.2% 40.0%
23 13 32 23 11 21 4 14 6 238.1%
825.0%
121.6% 26.7% 23.6% 22.4% 19.6% 22.7% 23.2% 19.5% 18.7% 19.8% 17.2% 12.0%
5. At Least ACSSuT 3 Resistant 85 109 90 98 80 92 92 72 67 64 51 39
0.0% 9.1% 4.1% 3.5% 0.0% 0.0% 0.0% 0.0% 2.5% 0.0% 0.0% 0.0%0 2 2 1 0 0 0 0 2 0 0 0
12.7% 3.2% 1.8% 7.1% 6.7% 1.2% 0.0% 0.0% 3.7% 0.0% 0.0% 0.0%19 5 3 13 7 1 0 0 2 0 0 0
0.0%0
0.0% 50.0% 50.0% 0.0% 100.0% 0.0% 0.0% 16.7% 0.0% 0.0% 100.0%0 1 1 0 1 0 0 1 0 0 1
44.4% 50.0% 28.6% 57.1% 60.0% 33.3% 33.3% 0.0% 50.0% 0.0% 25.0% 0.0%4 3 4 4 3 2 1 0 2 0 1 0
0.0%0
0.0% 0.0% 100.0% 0.0% 50.0% 0.0%0 0 1 0 1 0
31.6% 28.2% 54.2% 41.2% 50.0% 50.0% 35.7% 66.7% 46.7% 42.9% 37.5% 30.4%31 22 26 14 11 13 10 12 7 6 6 7
28.6%4
61.9%13
50.0% 100.0% 50.0% 100.0% 0.0% 0.0% 0.0% 100.0% 20.0% 28.6% 0.0% 75.0%1 1 1 2 0 0 0 1 1 2 0 3
47.9% 44.4% 60.4% 50.0% 44.0% 47.7% 30.0% 70.0% 15.4% 40.0%23 12 32 21 11 21 3 14 2 2
28.6%6
251.0%
2.0% 3.2% 1.6% 2.1% 0.7% 2.0% 0.5% 2.2% 1.1% 0.6% 0.7% 0.0% 6. At Least ACT/S
4 Resistant 8 13 6 9 3 8 2 8 4 2 2 00.0% 0.0% 0.0% 0.0% 0.0% 0.0% 0.0% 0.0% 0.0% 0.0% 0.0% 0.0%
0 0 0 0 0 0 0 0 0 0 0 00.0% 0.0% 0.0% 0.0% 0.0% 0.0% 0.0% 0.0% 0.0% 0.0% 0.0% 0.0%
0 0 0 0 0 0 0 0 0 0 0 00.0%
00.0% 0.0% 0.0% 0.0% 0.0% 0.0% 0.0% 0.0% 0.0% 0.0% 0.0%
0 0 0 0 0 0 0 0 0 0 00.0% 0.0% 0.0% 0.0% 0.0% 0.0% 0.0% 0.0% 0.0% 0.0% 0.0% 0.0%
0 0 0 0 0 0 0 0 0 0 0 00.0%
00.0% 0.0% 0.0% 0.0% 0.0% 0.0%
0 0 0 0 0 03.1% 2.6% 4.2% 2.9% 4.5% 0.0% 0.0% 5.6% 6.7% 0.0% 6.3% 0.0%
3 2 2 1 1 0 0 1 1 0 1 00.0%
00.0%
00.0% 0.0% 0.0% 50.0% 0.0% 0.0% 0.0% 100.0% 0.0% 0.0% 0.0% 0.0%
0 0 0 1 0 0 0 1 0 0 0 02.1% 0.0% 1.9% 7.1% 4.0% 9.1% 0.0% 0.0% 0.0% 0.0%
1 0 1 3 1 4 0 0 0 00.0%
00.0%
0
2 In 2012 and 2013, FSIS did not sample products for Salmonella because in prior years the percent of pork carcass samples positive for Salmonella was consistently low 3 ACSSuT = ampicillin, chloramphenicol, streptomycin, sulfamethoxazole/sulfisoxazole, and tetracycline 4 ACT/S = ampicillin, chloramphenicol, and trimethoprim-sulfamethoxazole
Cat
tle
Retail Ground Beef
HACCP
Cecal (Beef)
Cecal (Dairy)
Sw
ine
Retail Pork Chops
HACCP
Cecal (Market Hogs)
Cecal (Sows)
HumansC
hick
ens
Retail Chickens
HACCP
Cecal
Turk
eys
Retail Ground Turkey
HACCP
Cecal
Cat
tleS
win
e
Humans
Chi
cken
s
Retail Chickens
HACCP
Cecal
Humans
Chi
cken
sTu
rkey
sS
win
e
Retail Pork Chops
HACCP
Cecal (Market Hogs)
Cecal (Sows)
Humans
Turk
eys
Retail Ground Turkey
HACCP
Cecal
Cat
tle
Retail Ground Beef
HACCP
Cecal (Beef)
Cecal (Dairy)
1 Starting in 2011, testing included nine antimicrobial classes with the addition of the macrolide azithromycin. Because resistance to azithromycin is low (in this case, <1%), antimicrobial class resistance data from 2011 and beyond are comparable to the data from previous years.
Chi
cken
s
Retail Chickens
HACCP
Cecal
Turk
eys
Retail Ground Turkey
HACCP
Cecal
Cat
tle
Retail Ground Beef
HACCP
Cecal (Beef)
Cecal (Dairy)
Sw
ine
Retail Pork Chops
HACCP
Cecal (Market Hogs)
Cecal (Sows)
67
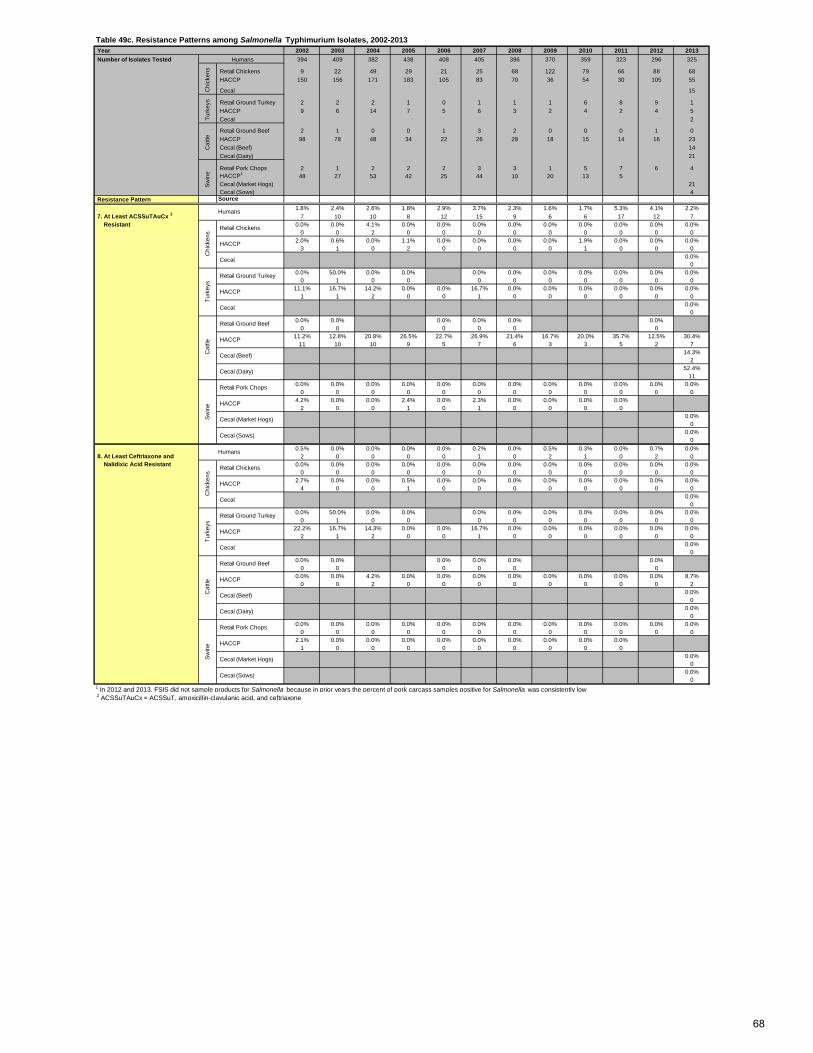
Table 49c. Resistance Patterns among Salmonella Typhimurium Isolates, 2002-2013 Year 2002 2003 2004 2005 2006 2007 2008 2009 2010 2011 2012 2013 Number of Isolates Tested 394 409 382 438 408 405 396 370 359 323 296 325
Retail Chickens 9 22 49 29 21 25 68 122 79 66 88 68 HACCP 150 156 171 183 105 83 70 36 54 30 105 55
Cecal 15
Retail Ground Turkey 2 2 2 1 0 1 1 1 6 8 9 1 HACCP 9 6 14 7 5 6 3 2 4 2 4 5 Cecal 2
Retail Ground Beef 2 1 0 0 1 3 2 0 0 0 1 0 HACCP 98 78 48 34 22 26 28 18 15 14 16 23 Cecal (Beef) 14 Cecal (Dairy) 21
Retail Pork Chops 2 1 2 2 2 3 3 1 5 7 6 4 HACCP1 48 27 53 42 25 44 10 20 13 5 Cecal (Market Hogs) 21 Cecal (Sows) 4
Resistance Pattern Source1.8% 2.4% 2.6% 1.8% 2.9% 3.7% 2.3% 1.6% 1.7% 5.3% 4.1% 2.2%
7. At Least ACSSuTAuCx 2 7 10 10 8 12 15 9 6 6 17 12 7 Resistant 0.0% 0.0% 4.1% 0.0% 0.0% 0.0% 0.0% 0.0% 0.0% 0.0% 0.0% 0.0%
0 0 2 0 0 0 0 0 0 0 0 02.0% 0.6% 0.0% 1.1% 0.0% 0.0% 0.0% 0.0% 1.9% 0.0% 0.0% 0.0%
3 1 0 2 0 0 0 0 1 0 0 00.0%
00.0% 50.0% 0.0% 0.0% 0.0% 0.0% 0.0% 0.0% 0.0% 0.0% 0.0%
0 1 0 0 0 0 0 0 0 0 011.1% 16.7% 14.2% 0.0% 0.0% 16.7% 0.0% 0.0% 0.0% 0.0% 0.0% 0.0%
1 1 2 0 0 1 0 0 0 0 0 00.0%
00.0% 0.0% 0.0% 0.0% 0.0% 0.0%
0 0 0 0 0 011.2% 12.8% 20.8% 26.5% 22.7% 26.9% 21.4% 16.7% 20.0% 35.7% 12.5% 30.4%
11 10 10 9 5 7 6 3 3 5 2 714.3%
252.4%
110.0% 0.0% 0.0% 0.0% 0.0% 0.0% 0.0% 0.0% 0.0% 0.0% 0.0% 0.0%
0 0 0 0 0 0 0 0 0 0 0 04.2% 0.0% 0.0% 2.4% 0.0% 2.3% 0.0% 0.0% 0.0% 0.0%
2 0 0 1 0 1 0 0 0 00.0%
00.0%
00.5% 0.0% 0.0% 0.0% 0.0% 0.2% 0.0% 0.5% 0.3% 0.0% 0.7% 0.0%
8. At Least Ceftriaxone and 2 0 0 0 0 1 0 2 1 0 2 0 Nalidixic Acid Resistant 0.0% 0.0% 0.0% 0.0% 0.0% 0.0% 0.0% 0.0% 0.0% 0.0% 0.0% 0.0%
0 0 0 0 0 0 0 0 0 0 0 02.7% 0.0% 0.0% 0.5% 0.0% 0.0% 0.0% 0.0% 0.0% 0.0% 0.0% 0.0%
4 0 0 1 0 0 0 0 0 0 0 00.0%
00.0% 50.0% 0.0% 0.0% 0.0% 0.0% 0.0% 0.0% 0.0% 0.0% 0.0%
0 1 0 0 0 0 0 0 0 0 022.2% 16.7% 14.3% 0.0% 0.0% 16.7% 0.0% 0.0% 0.0% 0.0% 0.0% 0.0%
2 1 2 0 0 1 0 0 0 0 0 00.0%
00.0% 0.0% 0.0% 0.0% 0.0% 0.0%
0 0 0 0 0 00.0% 0.0% 4.2% 0.0% 0.0% 0.0% 0.0% 0.0% 0.0% 0.0% 0.0% 8.7%
0 0 2 0 0 0 0 0 0 0 0 20.0%
00.0%
00.0% 0.0% 0.0% 0.0% 0.0% 0.0% 0.0% 0.0% 0.0% 0.0% 0.0% 0.0%
0 0 0 0 0 0 0 0 0 0 0 02.1% 0.0% 0.0% 0.0% 0.0% 0.0% 0.0% 0.0% 0.0% 0.0%
1 0 0 0 0 0 0 0 0 00.0%
00.0%
01 In 2012 and 2013, FSIS did not sample products for Salmonella because in prior years the percent of pork carcass samples positive for Salmonella was consistently low 2 ACSSuTAuCx = ACSSuT, amoxicillin-clavulanic acid, and ceftriaxone
Humans
Chi
cken
sTu
rkey
sC
attle
Sw
ine
Sw
ine
Retail Pork Chops
HACCP
Cecal (Market Hogs)
Cecal (Sows)
Humans
Chi
cken
s
Retail Chickens
HACCP
Cecal
Turk
eys
Retail Ground Turkey
HACCP
Cecal
Cat
tle
Retail Ground Beef
HACCP
Cecal (Beef)
Cecal (Dairy)
HumansC
hick
ens
Cat
tle
Retail Ground Beef
HACCP
Cecal (Beef)
Cecal (Dairy)
Sw
ine
Retail Pork Chops
HACCP
Cecal (Market Hogs)
Cecal (Sows)
Retail Chickens
HACCP
Cecal
Turk
eys
Retail Ground Turkey
HACCP
Cecal
68
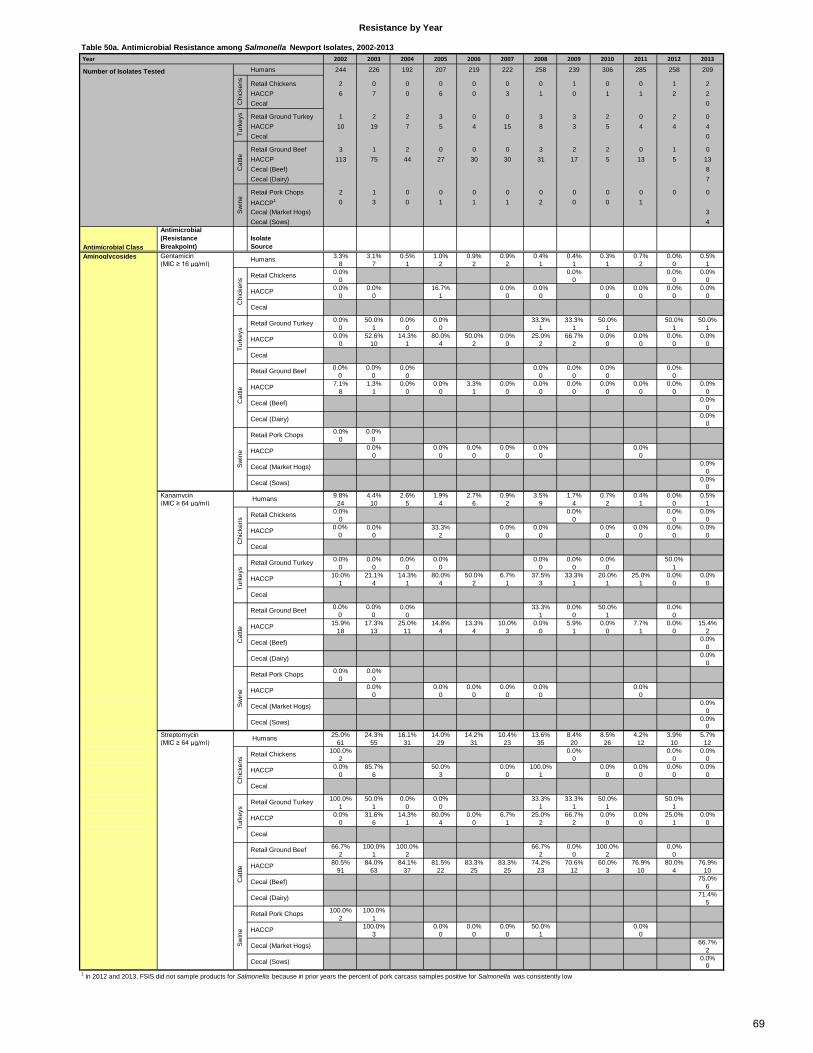
Table 50a. Antimicrobial Resistance among Salmonella Newport Isolates, 2002-2013 Year 2002 2003 2004 2005 2006 2007 2008 2009 2010 2011 2012 2013
Humans 244 226 192 207 219 222 258 239 306 285 258 209
Retail Chickens 2 0 0 0 0 0 0 1 0 0 1 2 HACCP 6 7 0 6 0 3 1 0 1 1 2 2 Cecal 0
Retail Ground Turkey 1 2 2 3 0 0 3 3 2 0 2 0 HACCP 10 19 7 5 4 15 8 3 5 4 4 4 Cecal 0
Retail Ground Beef 3 1 2 0 0 0 3 2 2 0 1 0 HACCP 113 75 44 27 30 30 31 17 5 13 5 13 Cecal (Beef) 8 Cecal (Dairy) 7
Retail Pork Chops 2 1 0 0 0 0 0 0 0 0 0 0 HACCP1 0 3 0 1 1 1 2 0 0 1 Cecal (Market Hogs) 3 Cecal (Sows) 4
Antimicrobial Class
Antimicrobial (Resistance Breakpoint)
Isolate Source
Aminoglycosides Gentamicin 3.3% 3.1% 0.5% 1.0% 0.9% 0.9% 0.4% 0.4% 0.3% 0.7% 0.0% 0.5% (MIC ≥ 16 µg/ml) 8 7 1 2 2 2 1 1 1 2 0 1
0.0% 0.0% 0.0% 0.0%0 0 0 0
0.0% 0.0% 16.7% 0.0% 0.0% 0.0% 0.0% 0.0% 0.0%0 0 1 0 0 0 0 0 0
0.0% 50.0% 0.0% 0.0% 33.3% 33.3% 50.0% 50.0% 50.0%0 1 0 0 1 1 1 1 1
0.0% 52.6% 14.3% 80.0% 50.0% 0.0% 25.0% 66.7% 0.0% 0.0% 0.0% 0.0%0 10 1 4 2 0 2 2 0 0 0 0
0.0% 0.0% 0.0% 0.0% 0.0% 0.0% 0.0%0 0 0 0 0 0 0
7.1% 1.3% 0.0% 0.0% 3.3% 0.0% 0.0% 0.0% 0.0% 0.0% 0.0% 0.0%8 1 0 0 1 0 0 0 0 0 0 0
0.0%0
0.0%0
0.0% 0.0%0 0
0.0% 0.0% 0.0% 0.0% 0.0% 0.0%0 0 0 0 0 0
0.0%0
0.0%0
Kanamycin 9.8% 4.4% 2.6% 1.9% 2.7% 0.9% 3.5% 1.7% 0.7% 0.4% 0.0% 0.5% (MIC ≥ 64 µg/ml) 24 10 5 4 6 2 9 4 2 1 0 1
0.0% 0.0% 0.0% 0.0%0 0 0 0
0.0% 0.0% 33.3% 0.0% 0.0% 0.0% 0.0% 0.0% 0.0%0 0 2 0 0 0 0 0 0
0.0% 0.0% 0.0% 0.0% 0.0% 0.0% 0.0% 50.0%0 0 0 0 0 0 0 1
10.0% 21.1% 14.3% 80.0% 50.0% 6.7% 37.5% 33.3% 20.0% 25.0% 0.0% 0.0%1 4 1 4 2 1 3 1 1 1 0 0
0.0% 0.0% 0.0% 33.3% 0.0% 50.0% 0.0%0 0 0 1 0 1 0
15.9% 17.3% 25.0% 14.8% 13.3% 10.0% 0.0% 5.9% 0.0% 7.7% 0.0% 15.4%18 13 11 4 4 3 0 1 0 1 0 2
0.0%0
0.0%0
0.0% 0.0%0 0
0.0% 0.0% 0.0% 0.0% 0.0% 0.0%0 0 0 0 0 0
0.0%0
0.0%0
Streptomycin 25.0% 24.3% 16.1% 14.0% 14.2% 10.4% 13.6% 8.4% 8.5% 4.2% 3.9% 5.7% (MIC ≥ 64 µg/ml) 61 55 31 29 31 23 35 20 26 12 10 12
100.0% 0.0% 0.0% 0.0%2 0 0 0
0.0% 85.7% 50.0% 0.0% 100.0% 0.0% 0.0% 0.0% 0.0%0 6 3 0 1 0 0 0 0
100.0% 50.0% 0.0% 0.0% 33.3% 33.3% 50.0% 50.0%1 1 0 0 1 1 1 1
0.0% 31.6% 14.3% 80.0% 0.0% 6.7% 25.0% 66.7% 0.0% 0.0% 25.0% 0.0%0 6 1 4 0 1 2 2 0 0 1 0
66.7% 100.0% 100.0% 66.7% 0.0% 100.0% 0.0%2 1 2 2 0 2 0
80.5% 84.0% 84.1% 81.5% 83.3% 83.3% 74.2% 70.6% 60.0% 76.9% 80.0% 76.9%91 63 37 22 25 25 23 12 3 10 4 10
75.0%6
71.4%5
100.0% 100.0%2 1
100.0% 0.0% 0.0% 0.0% 50.0% 0.0%3 0 0 0 1 0
66.7%2
0.0%0
1 In 2012 and 2013, FSIS did not sample products for Salmonella because in prior years the percent of pork carcass samples positive for Salmonella was consistently low
Resistance by Year
Swin
e
Retail Pork Chops
HACCP
Cecal (Market Hogs)
Cecal (Sows)
Cecal (Beef)Cat
tle
Retail Ground Beef
Cecal (Dairy)
HACCP
Turk
eys
Retail Ground Turkey
HACCP
Cecal
HACCP
Humans
Chi
cken
s Retail Chickens
Cecal
Cecal (Dairy)
Swin
e
Retail Pork Chops
HACCP
Cecal (Market Hogs)
Cecal (Sows)
Cat
tle HACCP
Cecal (Beef)
Retail Ground Beef
Turk
eys
Retail Ground Turkey
HACCP
Cecal
HACCP
Humans
Chi
cken
s Retail Chickens
Cecal
Swin
e
Retail Pork Chops
HACCP
Cecal (Market Hogs)
Cecal (Sows)
Cecal (Beef)Cat
tle
Retail Ground Beef
Cecal (Dairy)
HACCP
Turk
eys
Retail Ground Turkey
HACCP
Cecal
Number of Isolates Tested
Chi
cken
sTu
rkey
sC
attle
HACCP
Swin
e
Humans
Chi
cken
s Retail Chickens
Cecal
69
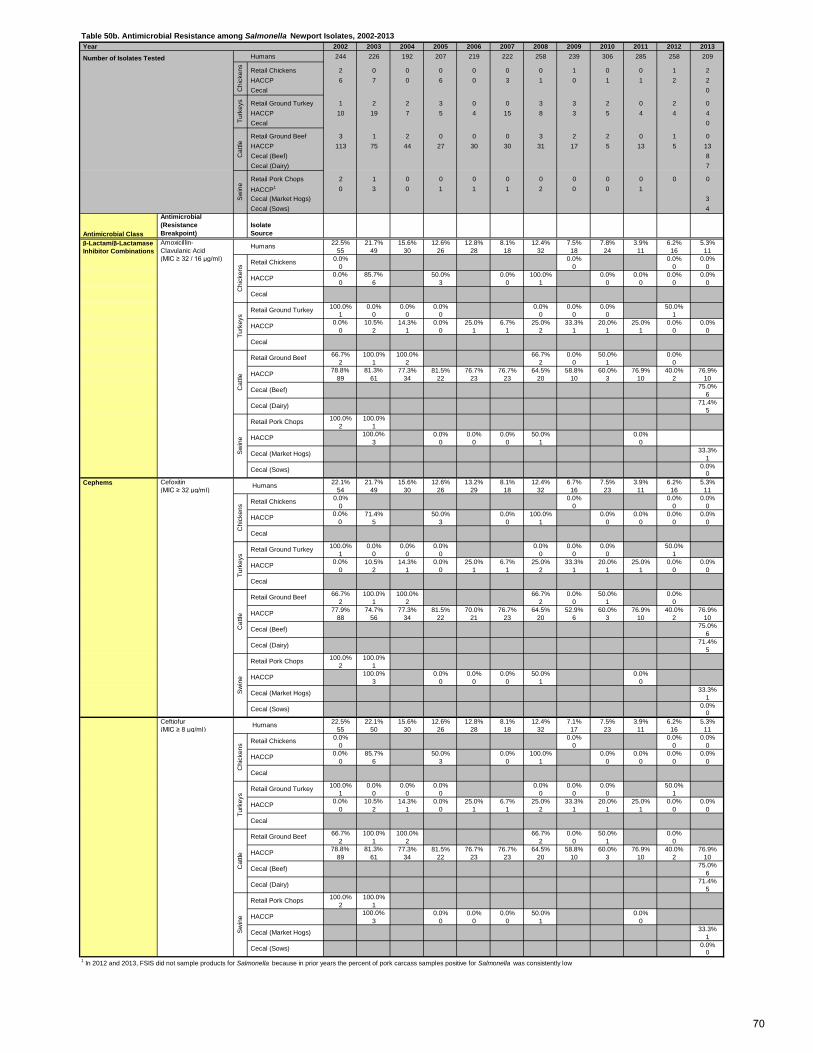
Table 50b. Antimicrobial Resistance among Salmonella Newport Isolates, 2002-2013 Year 2002 2003 2004 2005 2006 2007 2008 2009 2010 2011 2012 2013
Number of Isolates Tested Humans 244 226 192 207 219 222 258 239 306 285 258 209
Retail Chickens 2 0 0 0 0 0 0 1 0 0 1 2 HACCP 6 7 0 6 0 3 1 0 1 1 2 2 Cecal 0
Retail Ground Turkey 1 2 2 3 0 0 3 3 2 0 2 0 HACCP 10 19 7 5 4 15 8 3 5 4 4 4 Cecal 0
Retail Ground Beef 3 1 2 0 0 0 3 2 2 0 1 0 HACCP 113 75 44 27 30 30 31 17 5 13 5 13 Cecal (Beef) 8 Cecal (Dairy) 7
Retail Pork Chops 2 1 0 0 0 0 0 0 0 0 0 0 HACCP1 0 3 0 1 1 1 2 0 0 1 Cecal (Market Hogs) 3 Cecal (Sows) 4
Antimicrobial Class
Antimicrobial (Resistance Breakpoint)
Isolate Source
β-Lactam/β-Lactamase Amoxicillin- 22.5% 21.7% 15.6% 12.6% 12.8% 8.1% 12.4% 7.5% 7.8% 3.9% 6.2% 5.3% Inhibitor Combinations Clavulanic Acid 55 49 30 26 28 18 32 18 24 11 16 11
(MIC ≥ 32 / 16 µg/ml) 0.0% 0.0% 0.0% 0.0%0 0 0 0
0.0% 85.7% 50.0% 0.0% 100.0% 0.0% 0.0% 0.0% 0.0%0 6 3 0 1 0 0 0 0
100.0% 0.0% 0.0% 0.0% 0.0% 0.0% 0.0% 50.0%1 0 0 0 0 0 0 1
0.0% 10.5% 14.3% 0.0% 25.0% 6.7% 25.0% 33.3% 20.0% 25.0% 0.0% 0.0%0 2 1 0 1 1 2 1 1 1 0 0
66.7% 100.0% 100.0% 66.7% 0.0% 50.0% 0.0%2 1 2 2 0 1 0
78.8% 81.3% 77.3% 81.5% 76.7% 76.7% 64.5% 58.8% 60.0% 76.9% 40.0% 76.9%89 61 34 22 23 23 20 10 3 10 2 10
75.0%6
71.4%5
100.0% 100.0%2 1
100.0% 0.0% 0.0% 0.0% 50.0% 0.0%3 0 0 0 1 0
33.3%1
0.0%0
Cefoxitin 22.1% 21.7% 15.6% 12.6% 13.2% 8.1% 12.4% 6.7% 7.5% 3.9% 6.2% 5.3% (MIC ≥ 32 µg/ml) 54 49 30 26 29 18 32 16 23 11 16 11
0.0% 0.0% 0.0% 0.0%0 0 0 0
0.0% 71.4% 50.0% 0.0% 100.0% 0.0% 0.0% 0.0% 0.0%0 5 3 0 1 0 0 0 0
100.0% 0.0% 0.0% 0.0% 0.0% 0.0% 0.0% 50.0%1 0 0 0 0 0 0 1
0.0% 10.5% 14.3% 0.0% 25.0% 6.7% 25.0% 33.3% 20.0% 25.0% 0.0% 0.0%0 2 1 0 1 1 2 1 1 1 0 0
66.7% 100.0% 100.0% 66.7% 0.0% 50.0% 0.0%2 1 2 2 0 1 0
77.9% 74.7% 77.3% 81.5% 70.0% 76.7% 64.5% 52.9% 60.0% 76.9% 40.0% 76.9%88 56 34 22 21 23 20 6 3 10 2 10
75.0%6
71.4%5
100.0% 100.0%2 1
100.0% 0.0% 0.0% 0.0% 50.0% 0.0%3 0 0 0 1 0
33.3%1
0.0%0
Ceftiofur 22.5% 22.1% 15.6% 12.6% 12.8% 8.1% 12.4% 7.1% 7.5% 3.9% 6.2% 5.3% (MIC ≥ 8 µg/ml) 55 50 30 26 28 18 32 17 23 11 16 11
0.0% 0.0% 0.0% 0.0%0 0 0 0
0.0% 85.7% 50.0% 0.0% 100.0% 0.0% 0.0% 0.0% 0.0%0 6 3 0 1 0 0 0 0
100.0% 0.0% 0.0% 0.0% 0.0% 0.0% 0.0% 50.0%1 0 0 0 0 0 0 1
0.0% 10.5% 14.3% 0.0% 25.0% 6.7% 25.0% 33.3% 20.0% 25.0% 0.0% 0.0%0 2 1 0 1 1 2 1 1 1 0 0
66.7% 100.0% 100.0% 66.7% 0.0% 50.0% 0.0%2 1 2 2 0 1 0
78.8% 81.3% 77.3% 81.5% 76.7% 76.7% 64.5% 58.8% 60.0% 76.9% 40.0% 76.9%89 61 34 22 23 23 20 10 3 10 2 10
75.0%6
71.4%5
100.0% 100.0%2 1
100.0% 0.0% 0.0% 0.0% 50.0% 0.0%3 0 0 0 1 0
33.3%1
0.0%0
1 In 2012 and 2013, FSIS did not sample products for Salmonella because in prior years the percent of pork carcass samples positive for Salmonella was consistently low
Swin
e
Retail Pork Chops
HACCP
Cecal (Market Hogs)
Cecal (Sows)
Cecal (Beef)Cat
tle
Retail Ground Beef
Cecal (Dairy)
HACCP
Turk
eys
Retail Ground Turkey
HACCP
Cecal
HACCP
Humans
Chi
cken
s Retail Chickens
Cecal
Cecal (Dairy)
Swin
e
Retail Pork Chops
HACCP
Cecal (Market Hogs)
Cecal (Sows)
Cat
tle HACCP
Cecal (Beef)
Retail Ground Beef
Turk
eys
Retail Ground Turkey
HACCP
Cecal
HACCP
Cecal
Chi
cken
s Retail Chickens
Cephems Humans
Cecal (Dairy)
Swin
e
Retail Pork Chops
HACCP
Cecal (Market Hogs)
Cecal (Sows)
Cat
tle HACCP
Cecal (Beef)
Retail Ground Beef
Turk
eys
Retail Ground Turkey
HACCP
Cecal
Chi
cken
s
HACCP
Cecal
Retail Chickens
Chi
cken
sTu
rkey
sC
attle
Swin
e Humans
70
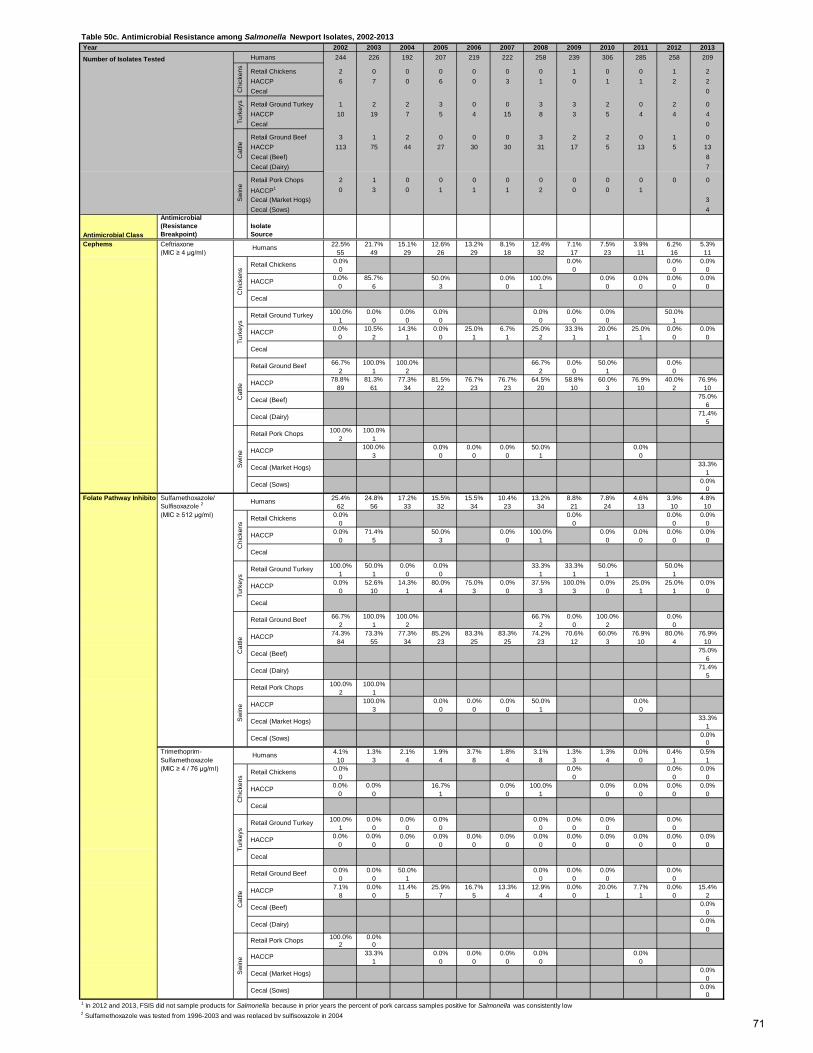
Table 50c. Antimicrobial Resistance among Salmonella Newport Isolates, 2002-2013 Year 2002 2003 2004 2005 2006 2007 2008 2009 2010 2011 2012 2013
Number of Isolates Tested Humans 244 226 192 207 219 222 258 239 306 285 258 209
Retail Chickens 2 0 0 0 0 0 0 1 0 0 1 2 HACCP 6 7 0 6 0 3 1 0 1 1 2 2 Cecal 0
Retail Ground Turkey 1 2 2 3 0 0 3 3 2 0 2 0 HACCP 10 19 7 5 4 15 8 3 5 4 4 4 Cecal 0
Retail Ground Beef 3 1 2 0 0 0 3 2 2 0 1 0 HACCP 113 75 44 27 30 30 31 17 5 13 5 13 Cecal (Beef) 8 Cecal (Dairy) 7
Retail Pork Chops 2 1 0 0 0 0 0 0 0 0 0 0 HACCP1 0 3 0 1 1 1 2 0 0 1 Cecal (Market Hogs) 3 Cecal (Sows) 4
Antimicrobial Class
Antimicrobial (Resistance Breakpoint)
Isolate Source
Ceftriaxone 22.5% 21.7% 15.1% 12.6% 13.2% 8.1% 12.4% 7.1% 7.5% 3.9% 6.2% 5.3% (MIC ≥ 4 µg/ml) 55 49 29 26 29 18 32 17 23 11 16 11
0.0% 0.0% 0.0% 0.0%0 0 0 0
0.0% 85.7% 50.0% 0.0% 100.0% 0.0% 0.0% 0.0% 0.0%0 6 3 0 1 0 0 0 0
100.0% 0.0% 0.0% 0.0% 0.0% 0.0% 0.0% 50.0%1 0 0 0 0 0 0 1
0.0% 10.5% 14.3% 0.0% 25.0% 6.7% 25.0% 33.3% 20.0% 25.0% 0.0% 0.0%0 2 1 0 1 1 2 1 1 1 0 0
66.7% 100.0% 100.0% 66.7% 0.0% 50.0% 0.0%2 1 2 2 0 1 0
78.8% 81.3% 77.3% 81.5% 76.7% 76.7% 64.5% 58.8% 60.0% 76.9% 40.0% 76.9%89 61 34 22 23 23 20 10 3 10 2 10
75.0%6
71.4%5
100.0% 100.0%2 1
100.0% 0.0% 0.0% 0.0% 50.0% 0.0%3 0 0 0 1 0
33.3%1
0.0%0
Folate Pathway Inhibitor Sulfamethoxazole/ 25.4% 24.8% 17.2% 15.5% 15.5% 10.4% 13.2% 8.8% 7.8% 4.6% 3.9% 4.8% Sulfisoxazole 2 62 56 33 32 34 23 34 21 24 13 10 10 (MIC ≥ 512 µg/ml) 0.0% 0.0% 0.0% 0.0%
0 0 0 00.0% 71.4% 50.0% 0.0% 100.0% 0.0% 0.0% 0.0% 0.0%
0 5 3 0 1 0 0 0 0
100.0% 50.0% 0.0% 0.0% 33.3% 33.3% 50.0% 50.0%1 1 0 0 1 1 1 1
0.0% 52.6% 14.3% 80.0% 75.0% 0.0% 37.5% 100.0% 0.0% 25.0% 25.0% 0.0%0 10 1 4 3 0 3 3 0 1 1 0
66.7% 100.0% 100.0% 66.7% 0.0% 100.0% 0.0%2 1 2 2 0 2 0
74.3% 73.3% 77.3% 85.2% 83.3% 83.3% 74.2% 70.6% 60.0% 76.9% 80.0% 76.9%84 55 34 23 25 25 23 12 3 10 4 10
75.0%6
71.4%5
100.0% 100.0%2 1
100.0% 0.0% 0.0% 0.0% 50.0% 0.0%3 0 0 0 1 0
33.3%1
0.0%0
Trimethoprim- 4.1% 1.3% 2.1% 1.9% 3.7% 1.8% 3.1% 1.3% 1.3% 0.0% 0.4% 0.5% Sulfamethoxazole 10 3 4 4 8 4 8 3 4 0 1 1 (MIC ≥ 4 / 76 µg/ml) 0.0% 0.0% 0.0% 0.0%
0 0 0 00.0% 0.0% 16.7% 0.0% 100.0% 0.0% 0.0% 0.0% 0.0%
0 0 1 0 1 0 0 0 0
100.0% 0.0% 0.0% 0.0% 0.0% 0.0% 0.0% 0.0%1 0 0 0 0 0 0 0
0.0% 0.0% 0.0% 0.0% 0.0% 0.0% 0.0% 0.0% 0.0% 0.0% 0.0% 0.0%0 0 0 0 0 0 0 0 0 0 0 0
0.0% 0.0% 50.0% 0.0% 0.0% 0.0% 0.0%0 0 1 0 0 0 0
7.1% 0.0% 11.4% 25.9% 16.7% 13.3% 12.9% 0.0% 20.0% 7.7% 0.0% 15.4%8 0 5 7 5 4 4 0 1 1 0 2
0.0%0
0.0%0
100.0% 0.0%2 0
33.3% 0.0% 0.0% 0.0% 0.0% 0.0%1 0 0 0 0 0
0.0%0
0.0%0
1 In 2012 and 2013, FSIS did not sample products for Salmonella because in prior years the percent of pork carcass samples positive for Salmonella was consistently low2 Sulfamethoxazole was tested from 1996-2003 and was replaced by sulfisoxazole in 2004
Cecal (Dairy)
Swin
e
Retail Pork Chops
HACCP
Cecal (Market Hogs)
Cecal (Sows)
Cat
tle
HACCP
Cecal (Beef)
Retail Ground Beef
Turk
eys
Retail Ground Turkey
HACCP
Cecal
HACCP
Humans
Chi
cken
s
Retail Chickens
Cecal
Swin
e
Retail Pork Chops
HACCP
Cecal (Market Hogs)
Cecal (Sows)
Cecal (Beef)Cat
tle
Retail Ground Beef
Cecal (Dairy)
HACCP
Turk
eys
Retail Ground Turkey
HACCP
Cecal
HACCP
Humans
Chi
cken
s
Retail Chickens
Cecal
Cecal (Dairy)
Swin
e
Retail Pork Chops
HACCP
Cecal (Market Hogs)
Cecal (Sows)
Cat
tle
HACCP
Cecal (Beef)
Retail Ground Beef
Turk
eys
Retail Ground Turkey
HACCP
Cecal
Chi
cken
s
HACCP
Cecal
Retail Chickens
Chi
cken
sTu
rkey
sC
attle
Swin
e Cephems Humans
71

Table 50d. Antimicrobial Resistance among Salmonella Newport Isolates, 2002-2013 Year 2002 2003 2004 2005 2006 2007 2008 2009 2010 2011 2012 2013 Number of Isolates Tested Humans 244 226 192 207 219 222 258 239 306 285 258 209
Retail Chickens 2 0 0 0 0 0 0 1 0 0 1 2 HACCP 6 7 0 6 0 3 1 0 1 1 2 2 Cecal 0
Retail Ground Turkey 1 2 2 3 0 0 3 3 2 0 2 0 HACCP 113 75 44 27 30 30 31 17 5 13 5 13 Cecal 8
Retail Ground Beef 3 1 2 0 0 0 3 2 2 0 1 0 HACCP 113 75 44 27 30 30 31 17 5 13 5 13 Cecal (Beef) 8 Cecal (Dairy) 7
Retail Pork Chops 2 1 0 0 0 0 0 0 0 0 0 0 HACCP1 0 3 0 1 1 1 2 0 0 1 Cecal (Market Hogs) 3 Cecal (Sows) 4
Antimicrobial Class
Antimicrobial (Resistance Breakpoint)
Isolate Source
Azithromycin 0.0% 0.0% 0.0% (MIC ≥32 µg/ml) 0 0 0
0.0% 0.0%0 0
0.0% 0.0% 0.0%0 0 0
0.0%0
0.0% 0.0% 0.0%0 0 0
0.0%0
0.0% 0.0% 0.0%0 0 0
0.0%0
0.0%0
0.0%0
0.0%0
0.0%0
Ampicillin 24.6% 23.0% 16.1% 14.0% 15.5% 9.9% 14.3% 8.4% 7.8% 3.9% 7.0% 6.2% (MIC ≥ 32 µg/ml) 60 52 31 29 34 22 37 20 24 11 18 13
0.0% 0.0% 0.0% 0.0%0 0 0 0
16.7% 85.7% 50.0% 0.0% 100.0% 0.0% 0.0% 0.0% 0.0%1 6 3 0 1 0 0 0 0
100.0% 0.0% 0.0% 0.0% 0.0% 0.0% 0.0% 50.0%1 0 0 0 0 0 0 1
0.0% 15.8% 28.6% 20.0% 75.0% 6.7% 25.0% 33.3% 20.0% 25.0% 25.0% 0.0%0 3 2 1 3 1 2 1 1 1 1 0
66.7% 100.0% 100.0% 66.7% 0.0% 50.0% 0.0%2 1 2 2 0 1 0
78.8% 82.7% 81.8% 85.2% 80.0% 76.7% 74.2% 64.7% 60.0% 76.9% 60.0% 76.9%89 62 36 23 24 23 23 11 3 10 3 10
75.0%6
71.4%5
100.0% 100.0%2 1
100.0% 0.0% 0.0% 0.0% 50.0% 0.0%3 0 0 0 1 0
33.3%1
0.0%0
Chloramphenicol 25.0% 22.6% 15.6% 13.5% 12.8% 9.5% 12.0% 7.5% 7.5% 3.5% 3.9% 4.8% (MIC ≥ 32 µg/ml) 61 51 30 28 28 21 31 18 23 10 10 10
0.0% 0.0% 0.0% 0.0%0 0 0 0
0.0% 85.7% 50.0% 0.0% 100.0% 0.0% 0.0% 0.0% 0.0%0 6 3 0 1 0 0 0 0
100.0% 0.0% 0.0% 0.0% 0.0% 0.0% 0.0% 0.0%1 0 0 0 0 0 0 0
0.0% 21.1% 14.3% 0.0% 0.0% 0.0% 12.5% 0.0% 0.0% 0.0% 25.0% 0.0%0 4 1 0 0 0 1 0 0 0 1 0
66.7% 100.0% 100.0% 66.7% 0.0% 100.0% 0.0%2 1 2 2 0 2 0
77.9% 78.7% 77.3% 81.5% 66.7% 76.7% 64.5% 52.9% 60.0% 76.9% 40.0% 69.2%88 59 34 22 20 23 20 9 3 10 2 9
75.0%6
71.4%5
100.0% 100.0%2 1
100.0% 0.0% 0.0% 0.0% 50.0% 0.0%3 0 0 0 1 0
33.3%1
0.0%0
1 In 2012 and 2013, FSIS did not sample products for Salmonella because in prior years the percent of pork carcass samples positive for Salmonella was consistently low
Swin
e
Retail Pork Chops
HACCP
Cecal (Market Hogs)
Cecal (Sows)
Cecal (Beef)Cat
tle
Retail Ground Beef
Cecal (Dairy)
HACCP
Turk
eys
Retail Ground Turkey
HACCP
Cecal
HACCP
Phenicols Humans
Chi
cken
s Retail Chickens
Cecal
Swin
e
Retail Pork Chops
HACCP
Cecal (Market Hogs)
Cecal (Sows)
Cecal (Beef)Cat
tle
Retail Ground Beef
Cecal (Dairy)
HACCP
Turk
eys
Retail Ground Turkey
HACCP
Cecal
HACCP
Penicillins Humans
Chi
cken
s Retail Chickens
Cecal
Swin
e
Retail Pork Chops
HACCP
Cecal (Market Hogs)
Cecal (Sows)
Cecal (Beef)Cat
tle
Retail Ground Beef
Cecal (Dairy)
HACCP
Turk
eys
Retail Ground Turkey
HACCP
Cecal
HACCP
Macrolides HumansC
hick
ens Retail Chickens
Cecal
Cat
tleSw
ine
Chi
cken
sTu
rkey
s
72
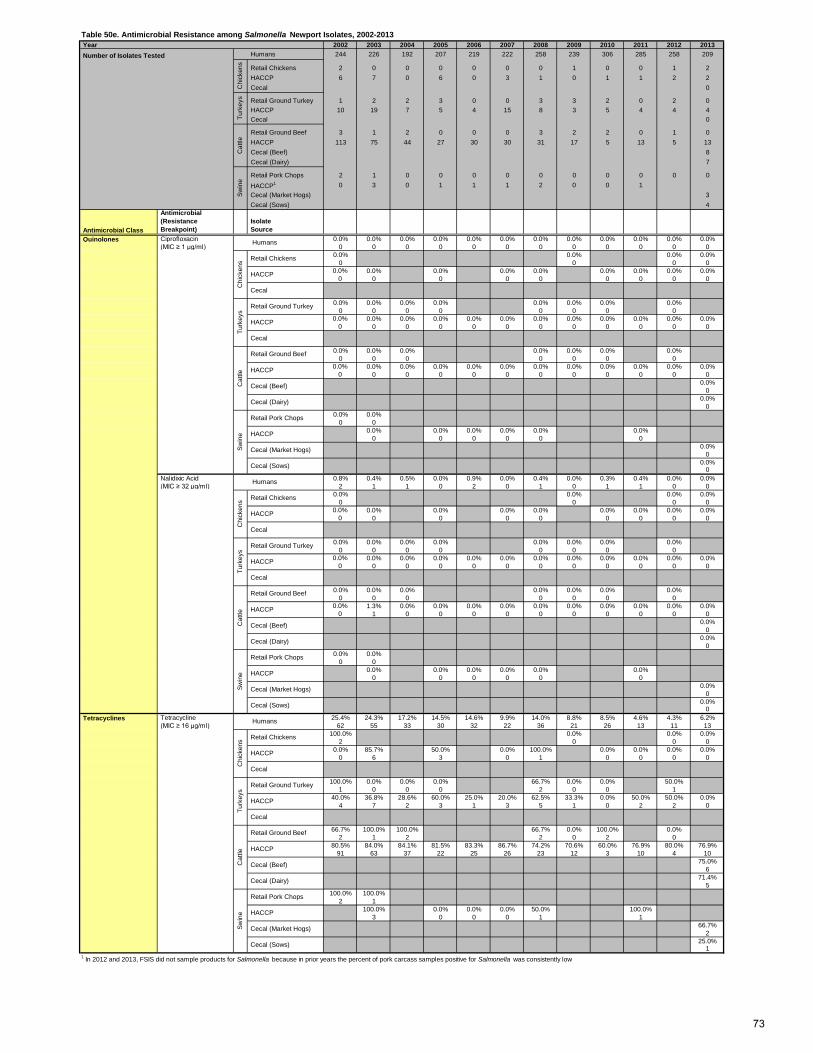
Table 50e. Antimicrobial Resistance among Salmonella Newport Isolates, 2002-2013 Year 2002 2003 2004 2005 2006 2007 2008 2009 2010 2011 2012 2013 Number of Isolates Tested Humans 244 226 192 207 219 222 258 239 306 285 258 209
Retail Chickens 2 0 0 0 0 0 0 1 0 0 1 2 HACCP 6 7 0 6 0 3 1 0 1 1 2 2 Cecal 0
Retail Ground Turkey 1 2 2 3 0 0 3 3 2 0 2 0 HACCP 10 19 7 5 4 15 8 3 5 4 4 4 Cecal 0
Retail Ground Beef 3 1 2 0 0 0 3 2 2 0 1 0 HACCP 113 75 44 27 30 30 31 17 5 13 5 13 Cecal (Beef) 8 Cecal (Dairy) 7
Retail Pork Chops 2 1 0 0 0 0 0 0 0 0 0 0 HACCP1 0 3 0 1 1 1 2 0 0 1 Cecal (Market Hogs) 3 Cecal (Sows) 4
Antimicrobial Class
Antimicrobial (Resistance Breakpoint)
Isolate Source
Quinolones Ciprofloxacin 0.0% 0.0% 0.0% 0.0% 0.0% 0.0% 0.0% 0.0% 0.0% 0.0% 0.0% 0.0% (MIC ≥ 1 µg/ml) 0 0 0 0 0 0 0 0 0 0 0 0
0.0% 0.0% 0.0% 0.0%0 0 0 0
0.0% 0.0% 0.0% 0.0% 0.0% 0.0% 0.0% 0.0% 0.0%0 0 0 0 0 0 0 0 0
0.0% 0.0% 0.0% 0.0% 0.0% 0.0% 0.0% 0.0%0 0 0 0 0 0 0 0
0.0% 0.0% 0.0% 0.0% 0.0% 0.0% 0.0% 0.0% 0.0% 0.0% 0.0% 0.0%0 0 0 0 0 0 0 0 0 0 0 0
0.0% 0.0% 0.0% 0.0% 0.0% 0.0% 0.0%0 0 0 0 0 0 0
0.0% 0.0% 0.0% 0.0% 0.0% 0.0% 0.0% 0.0% 0.0% 0.0% 0.0% 0.0%0 0 0 0 0 0 0 0 0 0 0 0
0.0%0
0.0%0
0.0% 0.0%0 0
0.0% 0.0% 0.0% 0.0% 0.0% 0.0%0 0 0 0 0 0
0.0%0
0.0%0
Nalidixic Acid 0.8% 0.4% 0.5% 0.0% 0.9% 0.0% 0.4% 0.0% 0.3% 0.4% 0.0% 0.0% (MIC ≥ 32 µg/ml) 2 1 1 0 2 0 1 0 1 1 0 0
0.0% 0.0% 0.0% 0.0%0 0 0 0
0.0% 0.0% 0.0% 0.0% 0.0% 0.0% 0.0% 0.0% 0.0%0 0 0 0 0 0 0 0 0
0.0% 0.0% 0.0% 0.0% 0.0% 0.0% 0.0% 0.0%0 0 0 0 0 0 0 0
0.0% 0.0% 0.0% 0.0% 0.0% 0.0% 0.0% 0.0% 0.0% 0.0% 0.0% 0.0%0 0 0 0 0 0 0 0 0 0 0 0
0.0% 0.0% 0.0% 0.0% 0.0% 0.0% 0.0%0 0 0 0 0 0 0
0.0% 1.3% 0.0% 0.0% 0.0% 0.0% 0.0% 0.0% 0.0% 0.0% 0.0% 0.0%0 1 0 0 0 0 0 0 0 0 0 0
0.0%0
0.0%0
0.0% 0.0%0 0
0.0% 0.0% 0.0% 0.0% 0.0% 0.0%0 0 0 0 0 0
0.0%0
0.0%0
Tetracycline 25.4% 24.3% 17.2% 14.5% 14.6% 9.9% 14.0% 8.8% 8.5% 4.6% 4.3% 6.2% (MIC ≥ 16 µg/ml) 62 55 33 30 32 22 36 21 26 13 11 13
100.0% 0.0% 0.0% 0.0%2 0 0 0
0.0% 85.7% 50.0% 0.0% 100.0% 0.0% 0.0% 0.0% 0.0%0 6 3 0 1 0 0 0 0
100.0% 0.0% 0.0% 0.0% 66.7% 0.0% 0.0% 50.0%1 0 0 0 2 0 0 1
40.0% 36.8% 28.6% 60.0% 25.0% 20.0% 62.5% 33.3% 0.0% 50.0% 50.0% 0.0%4 7 2 3 1 3 5 1 0 2 2 0
66.7% 100.0% 100.0% 66.7% 0.0% 100.0% 0.0%2 1 2 2 0 2 0
80.5% 84.0% 84.1% 81.5% 83.3% 86.7% 74.2% 70.6% 60.0% 76.9% 80.0% 76.9%91 63 37 22 25 26 23 12 3 10 4 10
75.0%6
71.4%5
100.0% 100.0%2 1
100.0% 0.0% 0.0% 0.0% 50.0% 100.0%3 0 0 0 1 1
66.7%2
25.0%1
1 In 2012 and 2013, FSIS did not sample products for Salmonella because in prior years the percent of pork carcass samples positive for Salmonella was consistently low
Cecal (Market Hogs)
Cecal (Sows)
Cecal (Beef)
Cecal (Dairy)
Swin
e
Retail Pork Chops
HACCP
Cat
tle
Retail Ground Beef
HACCP
Cecal
Turk
eys
Retail Ground Turkey
HACCP
Tetracyclines Humans
Chi
cken
s Retail Chickens
HACCP
Cecal
Cecal (Dairy)
Swin
e
Retail Pork Chops
HACCP
Cecal (Market Hogs)
Cecal (Sows)
Cat
tle HACCP
Cecal (Beef)
Retail Ground Beef
Cecal
Turk
eys
Retail Ground Turkey
HACCP
Cecal
Humans
Chi
cken
s Retail Chickens
Swin
e
Retail Pork Chops
HACCP
Cecal (Market Hogs)
Cecal (Sows)
HACCP
Cat
tle
Retail Ground Beef
Turk
eys
Retail Ground Turkey
HACCP
Cecal
Chi
cken
s
HACCP
Cecal (Beef)
Cecal (Dairy)
HACCP
Cecal
Retail Chickens
Chi
cken
sTu
rkey
sC
attle
Swin
e Humans
73
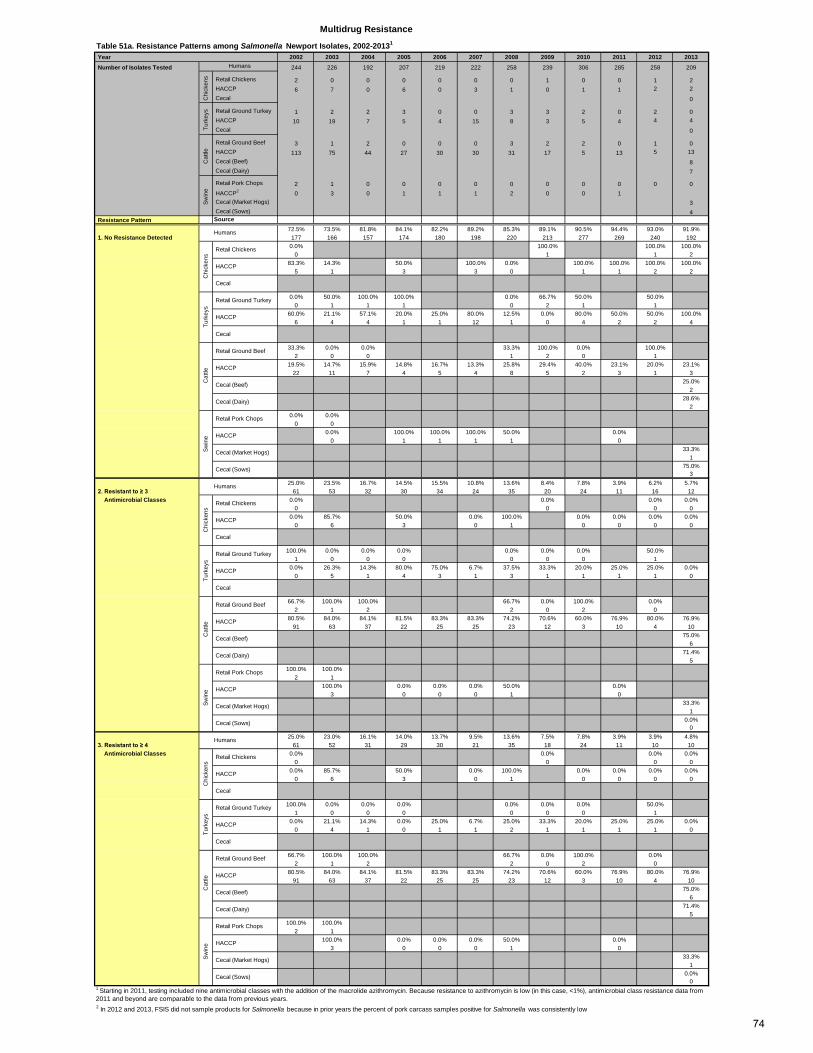
Table 51a. Resistance Patterns among Salmonella Newport Isolates, 2002-20131
Year 2002 2003 2004 2005 2006 2007 2008 2009 2010 2011 2012 2013
Number of Isolates Tested 244 226 192 207 219 222 258 239 306 285 258 209
Retail Chickens 2 0 0 0 0 0 0 1 0 0 1 2 HACCP 6 7 0 6 0 3 1 0 1 1 2 2 Cecal 0
Retail Ground Turkey 1 2 2 3 0 0 3 3 2 0 2 0 HACCP 10 19 7 5 4 15 8 3 5 4 4 4 Cecal 0
Retail Ground Beef 3 1 2 0 0 0 3 2 2 0 1 0 HACCP 113 75 44 27 30 30 31 17 5 13 5 13 Cecal (Beef) 8 Cecal (Dairy) 7
Retail Pork Chops 2 1 0 0 0 0 0 0 0 0 0 0 HACCP2 0 3 0 1 1 1 2 0 0 1 Cecal (Market Hogs) 3 Cecal (Sows) 4
Resistance Pattern Source72.5% 73.5% 81.8% 84.1% 82.2% 89.2% 85.3% 89.1% 90.5% 94.4% 93.0% 91.9%
1. No Resistance Detected 177 166 157 174 180 198 220 213 277 269 240 1920.0% 100.0% 100.0% 100.0%
0 1 1 283.3% 14.3% 50.0% 100.0% 0.0% 100.0% 100.0% 100.0% 100.0%
5 1 3 3 0 1 1 2 2
0.0% 50.0% 100.0% 100.0% 0.0% 66.7% 50.0% 50.0%0 1 1 1 0 2 1 1
60.0% 21.1% 57.1% 20.0% 25.0% 80.0% 12.5% 0.0% 80.0% 50.0% 50.0% 100.0%6 4 4 1 1 12 1 0 4 2 2 4
33.3% 0.0% 0.0% 33.3% 100.0% 0.0% 100.0%2 0 0 1 2 0 1
19.5% 14.7% 15.9% 14.8% 16.7% 13.3% 25.8% 29.4% 40.0% 23.1% 20.0% 23.1%22 11 7 4 5 4 8 5 2 3 1 3
25.0%2
28.6%2
0.0% 0.0%0 0
0.0% 100.0% 100.0% 100.0% 50.0% 0.0%0 1 1 1 1 0
33.3%1
75.0%3
25.0% 23.5% 16.7% 14.5% 15.5% 10.8% 13.6% 8.4% 7.8% 3.9% 6.2% 5.7% 2. Resistant to ≥ 3 61 53 32 30 34 24 35 20 24 11 16 12 Antimicrobial Classes 0.0% 0.0% 0.0% 0.0%
0 0 0 00.0% 85.7% 50.0% 0.0% 100.0% 0.0% 0.0% 0.0% 0.0%
0 6 3 0 1 0 0 0 0
100.0% 0.0% 0.0% 0.0% 0.0% 0.0% 0.0% 50.0%1 0 0 0 0 0 0 1
0.0% 26.3% 14.3% 80.0% 75.0% 6.7% 37.5% 33.3% 20.0% 25.0% 25.0% 0.0%0 5 1 4 3 1 3 1 1 1 1 0
66.7% 100.0% 100.0% 66.7% 0.0% 100.0% 0.0%2 1 2 2 0 2 0
80.5% 84.0% 84.1% 81.5% 83.3% 83.3% 74.2% 70.6% 60.0% 76.9% 80.0% 76.9%91 63 37 22 25 25 23 12 3 10 4 10
75.0%6
71.4%5
100.0% 100.0%2 1
100.0% 0.0% 0.0% 0.0% 50.0% 0.0%3 0 0 0 1 0
33.3%1
0.0%0
25.0% 23.0% 16.1% 14.0% 13.7% 9.5% 13.6% 7.5% 7.8% 3.9% 3.9% 4.8% 3. Resistant to ≥ 4 61 52 31 29 30 21 35 18 24 11 10 10 Antimicrobial Classes 0.0% 0.0% 0.0% 0.0%
0 0 0 00.0% 85.7% 50.0% 0.0% 100.0% 0.0% 0.0% 0.0% 0.0%
0 6 3 0 1 0 0 0 0
100.0% 0.0% 0.0% 0.0% 0.0% 0.0% 0.0% 50.0%1 0 0 0 0 0 0 1
0.0% 21.1% 14.3% 0.0% 25.0% 6.7% 25.0% 33.3% 20.0% 25.0% 25.0% 0.0%0 4 1 0 1 1 2 1 1 1 1 0
66.7% 100.0% 100.0% 66.7% 0.0% 100.0% 0.0%2 1 2 2 0 2 0
80.5% 84.0% 84.1% 81.5% 83.3% 83.3% 74.2% 70.6% 60.0% 76.9% 80.0% 76.9%91 63 37 22 25 25 23 12 3 10 4 10
75.0%6
71.4%5
100.0% 100.0%2 1
100.0% 0.0% 0.0% 0.0% 50.0% 0.0%3 0 0 0 1 0
33.3%1
0.0%0
2 In 2012 and 2013, FSIS did not sample products for Salmonella because in prior years the percent of pork carcass samples positive for Salmonella was consistently low
Sw
ine
Humans
Chi
cken
s
Retail Chickens
HACCP
Cecal
Multidrug Resistance
Humans
Chi
cken
sTu
rkey
sC
attle
Turk
eys
Retail Ground Turkey
HACCP
Cecal
Cat
tle
Retail Ground Beef
HACCP
Cecal (Beef)
Cecal (Dairy)
Chi
cken
s
Retail Chickens
HACCP
Cecal
Turk
eys
Retail Ground Turkey
HACCP
Cecal
Sw
ine
Retail Pork Chops
HACCP
Cecal (Market Hogs)
Cecal (Sows)
Humans
Cat
tle
Retail Ground Beef
HACCP
Cecal (Beef)
Cecal (Dairy)
Sw
ine
Retail Pork Chops
HACCP
Cecal (Market Hogs)
Cecal (Sows)
Humans
Chi
cken
s
Retail Chickens
HACCP
Cecal
Turk
eys
Retail Ground Turkey
HACCP
Cecal
Cat
tle
Retail Ground Beef
HACCP
Cecal (Beef)
Cecal (Dairy)
Sw
ine
Retail Pork Chops
HACCP
Cecal (Market Hogs)
Cecal (Sows)
1 Starting in 2011, testing included nine antimicrobial classes with the addition of the macrolide azithromycin. Because resistance to azithromycin is low (in this case, <1%), antimicrobial class resistance data from 2011 and beyond are comparable to the data from previous years.
74

Table 51b. Resistance Patterns among Salmonella Newport Isolates, 2002-20131
Year 2002 2003 2004 2005 2006 2007 2008 2009 2010 2011 2012 2013
Number of Isolates Tested 244 226 192 207 219 222 258 239 306 285 258 209
Retail Chickens 2 0 0 0 0 0 0 1 0 0 1 2
HACCP 6 7 0 6 0 3 1 0 1 1 2 2
Cecal 0
Retail Ground Turkey 1 2 2 3 0 0 3 3 2 0 2 0
HACCP 10 19 7 5 4 15 8 3 5 4 4 4
Cecal 0
Retail Ground Beef 3 1 2 0 0 0 3 2 2 0 1 0
HACCP 113 75 44 27 30 30 31 17 5 13 5 13
Cecal (Beef) 8
Cecal (Dairy) 7
Retail Pork Chops 2 1 0 0 0 0 0 0 0 0 0 0
HACCP2 0 3 0 1 1 1 2 0 0 1 0
Cecal (Market Hogs) 3
Cecal (Sows) 4 Resistance Pattern Source
23.4% 22.6% 15.1% 12.6% 13.2% 8.6% 12.8% 7.1% 7.5% 3.5% 3.9% 4.8% 4. Resistant to ≥ 5 57 51 29 26 29 19 33 17 23 10 10 10 Antimicrobial Classes 0.0% 0.0% 0.0% 0.0%
0 0 0 00.0% 85.7% 50.0% 0.0% 100.0% 0.0% 0.0% 0.0% 0.0%
0 6 3 0 1 0 0 0 0
100.0% 0.0% 0.0% 0.0% 0.0% 0.0% 0.0% 0.0% 0.0% 50.0%0 0 0 0 0 0 0 4 0 1
0.0% 10.5% 14.3% 0.0% 25.0% 6.7% 12.5% 33.3% 0.0% 25.0% 25.0% 0.0%0 2 1 0 1 1 1 1 0 1 80 0
66.7% 100.0% 100.0% 66.7% 0.0% 50.0% 0.0%2 1 2 2 0 1 0
78.8% 81.3% 79.5% 81.5% 76.7% 76.7% 64.5% 58.8% 60.0% 76.9% 40.0% 76.9%89 61 35 22 23 23 20 10 3 10 2 10
75.0%6
71.4%5
100.0% 100.0%1 1
100.0% 0.0% 0.0% 0.0% 50.0% 0.0%3 0 0 0 1 0
33.3%1
0.0%0
23.4% 22.1% 15.1% 12.6% 12.3% 8.6% 11.6% 7.1% 7.5% 3.5% 3.9% 4.8% 5. At Least ACSSuT
3 Resistant 57 50 29 26 27 19 30 17 23 10 10 100.0% 0.0% 0.0% 0.0%
0 0 0 00.0% 71.4% 50.0% 0.0% 100.0% 0.0% 0.0% 0.0% 0.0%
0 5 3 0 1 0 0 0 0
100.0% 0.0% 0.0% 0.0% 0.0% 0.0% 0.0% 0.0%1 0 0 0 0 0 0 0
0.0% 5.3% 14.3% 0.0% 0.0% 0.0% 0.0% 0.0% 0.0% 0.0% 25.0% 0.0%0 1 1 0 0 0 0 0 0 0 1 0
66.7% 100.0% 100.0% 66.7% 0.0% 50.0% 0.0%2 1 2 2 0 1 0
70.8% 66.7% 75.0% 81.5% 63.3% 70.0% 64.5% 47.1% 60.0% 76.9% 20.0% 69.2%80 50 33 22 19 21 20 8 3 10 1 9
75.0%6
71.4%5
100.0% 100.0%2 1
100.0% 0.0% 0.0% 0.0% 50.0% 0.0%3 0 0 0 1 0
33.3%1
0.0%0
3.7% 1.3% 1.0% 1.9% 2.7% 0.5% 2.7% 1.3% 1.3% 0.0% 0.4% 0.5% 6. At Least ACT/S
4 Resistant 9 3 2 4 6 1 7 3 4 0 1 10.0% 0.0% 0.0% 0.0%
0 0 0 00.0% 0.0% 16.7% 0.0% 100.0% 0.0% 0.0% 0.0% 0.0%
0 0 1 0 1 0 0 0 0
100.0% 0.0% 0.0% 0.0% 0.0% 0.0% 0.0% 0.0%1 0 0 0 0 0 0 0
0.0% 0.0% 14.3% 0.0% 0.0% 0.0% 0.0% 0.0% 0.0% 0.0% 0.0% 0.0%0 0 1 0 0 0 0 0 0 0 0 0
0.0% 0.0% 50.0% 0.0% 0.0% 0.0% 0.0%0 0 1 0 0 0 0
7.1% 0.0% 2.3% 25.9% 10.0% 13.3% 12.9% 0.0% 20.0% 7.7% 0.0% 15.4%8 0 1 7 3 4 4 0 1 1 0 2
0.0%0
0.0%0
100.0% 0.0%2 0
33.3% 0.0% 0.0% 0.0% 0.0% 0.0%1 0 0 0 0 0
0.0%0
0.0%0
2 In 2012 and 2013, FSIS did not sample products for Salmonella because in prior years the percent of pork carcass samples positive for Salmonella was consistently low 3 ACSSuT = ampicillin, chloramphenicol, streptomycin, sulfamethoxazole/sulfisoxazole, and tetracycline 4 ACT/S = ampicillin, chloramphenicol, and trimethoprim-sulfamethoxazole
Cat
tle
Retail Ground Beef
HACCP
Cecal (Beef)
Cecal (Dairy)
Sw
ine
Retail Pork Chops
HACCP
Cecal (Market Hogs)
Cecal (Sows)
Humans
Chi
cken
s
Retail Chickens
HACCP
Cecal
Turk
eys
Retail Ground Turkey
HACCP
Cecal
Cat
tleS
win
e
Humans
Chi
cken
s
Retail Chickens
HACCP
Cecal
Humans
Chi
cken
sTu
rkey
sS
win
e
Retail Pork Chops
HACCP
Cecal (Market Hogs)
Cecal (Sows)
Humans
Turk
eys
Retail Ground Turkey
HACCP
Cecal
Cat
tle
Retail Ground Beef
HACCP
Cecal (Beef)
Cecal (Dairy)
1 Starting in 2011, testing included nine antimicrobial classes with the addition of the macrolide azithromycin. Because resistance to azithromycin is low (in this case, <1%), antimicrobial class resistance data from 2011 and beyond are comparable to the data from previous years.
Chi
cken
s
Retail Chickens
HACCP
Cecal
Turk
eys
Retail Ground Turkey
HACCP
Cecal
Cat
tle
Retail Ground Beef
HACCP
Cecal (Beef)
Cecal (Dairy)
Sw
ine
Retail Pork Chops
HACCP
Cecal (Market Hogs)
Cecal (Sows)
75
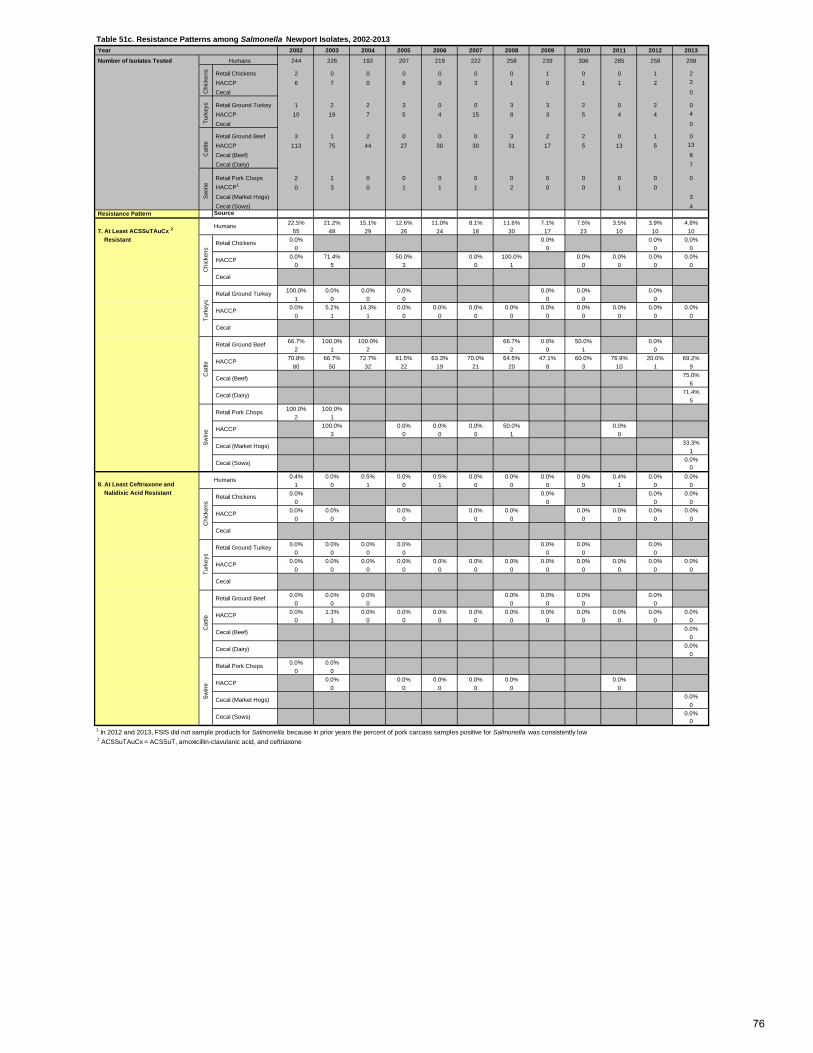
Table 51c. Resistance Patterns among Salmonella Newport Isolates, 2002-2013 Year 2002 2003 2004 2005 2006 2007 2008 2009 2010 2011 2012 2013
Number of Isolates Tested 244 226 192 207 219 222 258 239 306 285 258 209
Retail Chickens 2 0 0 0 0 0 0 1 0 0 1 2 HACCP 6 7 0 6 0 3 1 0 1 1 2 2
Cecal 0
Retail Ground Turkey 1 2 2 3 0 0 3 3 2 0 2 0 HACCP 10 19 7 5 4 15 8 3 5 4 4 4
Cecal 0
Retail Ground Beef 3 1 2 0 0 0 3 2 2 0 1 0 HACCP 113 75 44 27 30 30 31 17 5 13 5 13
Cecal (Beef) 8 Cecal (Dairy) 7
Retail Pork Chops 2 1 0 0 0 0 0 0 0 0 0 0 HACCP1 0 3 0 1 1 1 2 0 0 1 0 Cecal (Market Hogs) 3 Cecal (Sows) 4
Resistance Pattern Source22.5% 21.2% 15.1% 12.6% 11.0% 8.1% 11.6% 7.1% 7.5% 3.5% 3.9% 4.8%
7. At Least ACSSuTAuCx 2 55 48 29 26 24 18 30 17 23 10 10 10 Resistant 0.0% 0.0% 0.0% 0.0%
0 0 0 00.0% 71.4% 50.0% 0.0% 100.0% 0.0% 0.0% 0.0% 0.0%
0 5 3 0 1 0 0 0 0
100.0% 0.0% 0.0% 0.0% 0.0% 0.0% 0.0%1 0 0 0 0 0 0
0.0% 5.2% 14.3% 0.0% 0.0% 0.0% 0.0% 0.0% 0.0% 0.0% 0.0% 0.0%0 1 1 0 0 0 0 0 0 0 0 0
66.7% 100.0% 100.0% 66.7% 0.0% 50.0% 0.0%2 1 2 2 0 1 0
70.8% 66.7% 72.7% 81.5% 63.3% 70.0% 64.5% 47.1% 60.0% 76.9% 20.0% 69.2%80 50 32 22 19 21 20 8 3 10 1 9
75.0%6
71.4%5
100.0% 100.0%2 1
100.0% 0.0% 0.0% 0.0% 50.0% 0.0%3 0 0 0 1 0
33.3%1
0.0%0
0.4% 0.0% 0.5% 0.0% 0.5% 0.0% 0.0% 0.0% 0.0% 0.4% 0.0% 0.0% 8. At Least Ceftriaxone and 1 0 1 0 1 0 0 0 0 1 0 0 Nalidixic Acid Resistant 0.0% 0.0% 0.0% 0.0%
0 0 0 00.0% 0.0% 0.0% 0.0% 0.0% 0.0% 0.0% 0.0% 0.0%
0 0 0 0 0 0 0 0 0
0.0% 0.0% 0.0% 0.0% 0.0% 0.0% 0.0%0 0 0 0 0 0 0
0.0% 0.0% 0.0% 0.0% 0.0% 0.0% 0.0% 0.0% 0.0% 0.0% 0.0% 0.0%0 0 0 0 0 0 0 0 0 0 0 0
0.0% 0.0% 0.0% 0.0% 0.0% 0.0% 0.0%0 0 0 0 0 0 0
0.0% 1.3% 0.0% 0.0% 0.0% 0.0% 0.0% 0.0% 0.0% 0.0% 0.0% 0.0%0 1 0 0 0 0 0 0 0 0 0 0
0.0%0
0.0%0
0.0% 0.0%0 0
0.0% 0.0% 0.0% 0.0% 0.0% 0.0%0 0 0 0 0 0
0.0%0
0.0%0
1 In 2012 and 2013, FSIS did not sample products for Salmonella because in prior years the percent of pork carcass samples positive for Salmonella was consistently low 2 ACSSuTAuCx = ACSSuT, amoxicillin-clavulanic acid, and ceftriaxone
Humans
Chi
cken
sTu
rkey
sC
attle
Sw
ine
Sw
ine
Retail Pork Chops
HACCP
Cecal (Market Hogs)
Cecal (Sows)
Humans
Chi
cken
s
Retail Chickens
HACCP
Cecal
Turk
eys
Retail Ground Turkey
HACCP
Cecal
Cat
tle
Retail Ground Beef
HACCP
Cecal (Beef)
Cecal (Dairy)
Humans
Chi
cken
s C
attle
Retail Ground Beef
HACCP
Cecal (Beef)
Cecal (Dairy)
Sw
ine
Retail Pork Chops
HACCP
Cecal (Market Hogs)
Cecal (Sows)
Retail Chickens
HACCP
Cecal
Turk
eys
Retail Ground Turkey
HACCP
Cecal
76
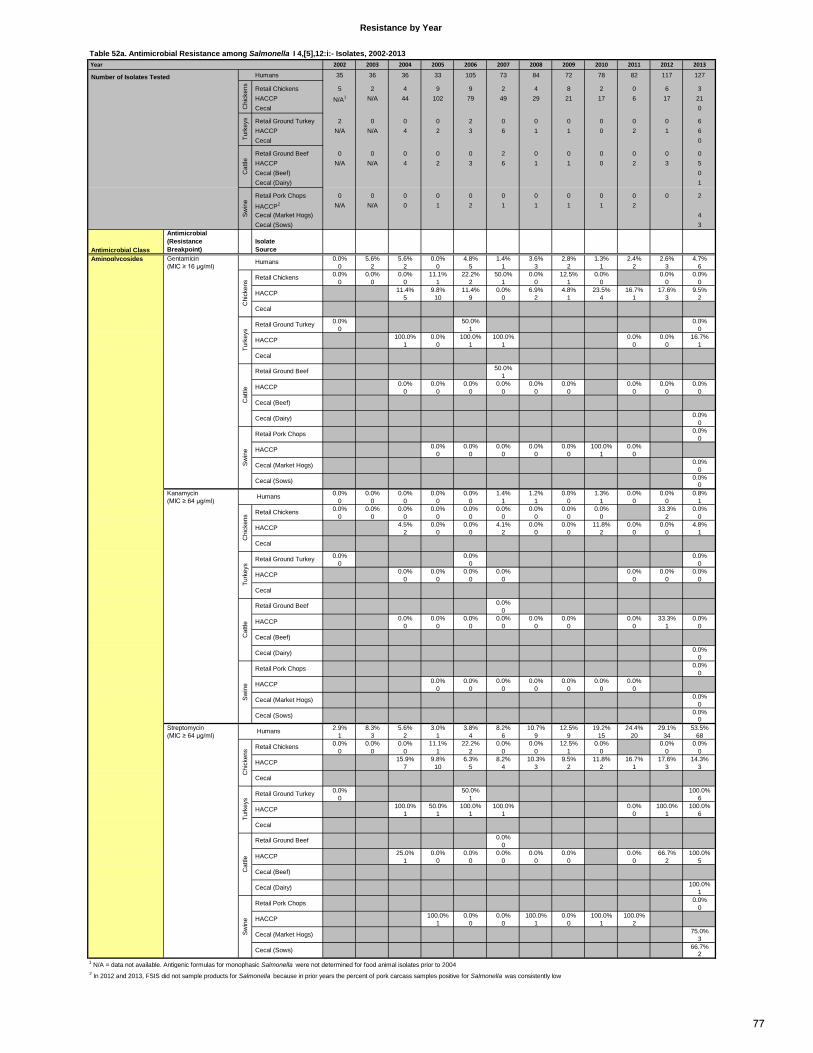
Table 52a. Antimicrobial Resistance among Salmonella I 4,[5],12:i:- Isolates, 2002-2013 Year 2002 2003 2004 2005 2006 2007 2008 2009 2010 2011 2012 2013
Humans 35 36 36 33 105 73 84 72 78 82 117 127
Retail Chickens 5 2 4 9 9 2 4 8 2 0 6 3 HACCP N/A1 N/A 44 102 79 49 29 21 17 6 17 21 Cecal 0
Retail Ground Turkey 2 0 0 0 2 0 0 0 0 0 0 6 HACCP N/A N/A 4 2 3 6 1 1 0 2 1 6 Cecal 0
Retail Ground Beef 0 0 0 0 0 2 0 0 0 0 0 0 HACCP N/A N/A 4 2 3 6 1 1 0 2 3 5 Cecal (Beef) 0 Cecal (Dairy) 1
Retail Pork Chops 0 0 0 0 0 0 0 0 0 0 0 2
HACCP2 N/A N/A 0 1 2 1 1 1 1 2 Cecal (Market Hogs) 4 Cecal (Sows) 3
Antimicrobial Class
Antimicrobial (Resistance Breakpoint)
Isolate Source
Aminoglycosides Gentamicin 0.0% 5.6% 5.6% 0.0% 4.8% 1.4% 3.6% 2.8% 1.3% 2.4% 2.6% 4.7% (MIC ≥ 16 µg/ml) 0 2 2 0 5 1 3 2 1 2 3 6
0.0% 0.0% 0.0% 11.1% 22.2% 50.0% 0.0% 12.5% 0.0% 0.0% 0.0%0 0 0 1 2 1 0 1 0 0 0
11.4% 9.8% 11.4% 0.0% 6.9% 4.8% 23.5% 16.7% 17.6% 9.5%5 10 9 0 2 1 4 1 3 2
0.0% 50.0% 0.0%0 1 0
100.0% 0.0% 100.0% 100.0% 0.0% 0.0% 16.7%1 0 1 1 0 0 1
50.0%1
0.0% 0.0% 0.0% 0.0% 0.0% 0.0% 0.0% 0.0% 0.0%0 0 0 0 0 0 0 0 0
0.0%0
0.0%0
0.0% 0.0% 0.0% 0.0% 0.0% 100.0% 0.0%0 0 0 0 0 1 0
0.0%0
0.0%0
Kanamycin 0.0% 0.0% 0.0% 0.0% 0.0% 1.4% 1.2% 0.0% 1.3% 0.0% 0.0% 0.8% (MIC ≥ 64 µg/ml) 0 0 0 0 0 1 1 0 1 0 0 1
0.0% 0.0% 0.0% 0.0% 0.0% 0.0% 0.0% 0.0% 0.0% 33.3% 0.0%0 0 0 0 0 0 0 0 0 2 0
4.5% 0.0% 0.0% 4.1% 0.0% 0.0% 11.8% 0.0% 0.0% 4.8%2 0 0 2 0 0 2 0 0 1
0.0% 0.0% 0.0%0 0 0
0.0% 0.0% 0.0% 0.0% 0.0% 0.0% 0.0%0 0 0 0 0 0 0
0.0%0
0.0% 0.0% 0.0% 0.0% 0.0% 0.0% 0.0% 33.3% 0.0%0 0 0 0 0 0 0 1 0
0.0%0
0.0%0
0.0% 0.0% 0.0% 0.0% 0.0% 0.0% 0.0%0 0 0 0 0 0 0
0.0%0
0.0%0
Streptomycin 2.9% 8.3% 5.6% 3.0% 3.8% 8.2% 10.7% 12.5% 19.2% 24.4% 29.1% 53.5% (MIC ≥ 64 µg/ml) 1 3 2 1 4 6 9 9 15 20 34 68
0.0% 0.0% 0.0% 11.1% 22.2% 0.0% 0.0% 12.5% 0.0% 0.0% 0.0%0 0 0 1 2 0 0 1 0 0 0
15.9% 9.8% 6.3% 8.2% 10.3% 9.5% 11.8% 16.7% 17.6% 14.3%7 10 5 4 3 2 2 1 3 3
0.0% 50.0% 100.0%0 1 6
100.0% 50.0% 100.0% 100.0% 0.0% 100.0% 100.0%1 1 1 1 0 1 6
0.0%0
25.0% 0.0% 0.0% 0.0% 0.0% 0.0% 0.0% 66.7% 100.0%1 0 0 0 0 0 0 2 5
100.0%1
0.0%0
100.0% 0.0% 0.0% 100.0% 0.0% 100.0% 100.0%1 0 0 1 0 1 2
75.0%3
66.7%2
1 N/A = data not available. Antigenic formulas for monophasic Salmonella were not determined for food animal isolates prior to 20042 In 2012 and 2013, FSIS did not sample products for Salmonella because in prior years the percent of pork carcass samples positive for Salmonella was consistently low
Resistance by Year
Sw
ine
Retail Pork Chops
HACCP
Cecal (Market Hogs)
Cecal (Sows)
Cat
tle
Retail Ground Beef
Cecal (Dairy)
HACCP
Cecal (Beef)
Turk
eys
Retail Ground Turkey
HACCP
Cecal
HACCP
Humans
Chi
cken
s Retail Chickens
Cecal
Cecal (Dairy)
Sw
ine
Retail Pork Chops
HACCP
Cecal (Market Hogs)
Cecal (Sows)
Cat
tle HACCP
Cecal (Beef)
Turk
eys
Retail Ground Turkey
HACCP
Cecal
Retail Ground Beef
HACCP
Cecal
Chi
cken
s Retail Chickens
Sw
ine
Retail Pork Chops
HACCP
Cecal (Market Hogs)
Cecal (Sows)
Cat
tle
Retail Ground Beef
Cecal (Dairy)
Humans
HACCP
Cecal (Beef)
Turk
eys
Retail Ground Turkey
HACCP
Cecal
Number of Isolates Tested
Chi
cken
sTu
rkey
sC
attle
HACCP
Sw
ine
Humans
Chi
cken
s Retail Chickens
Cecal
77
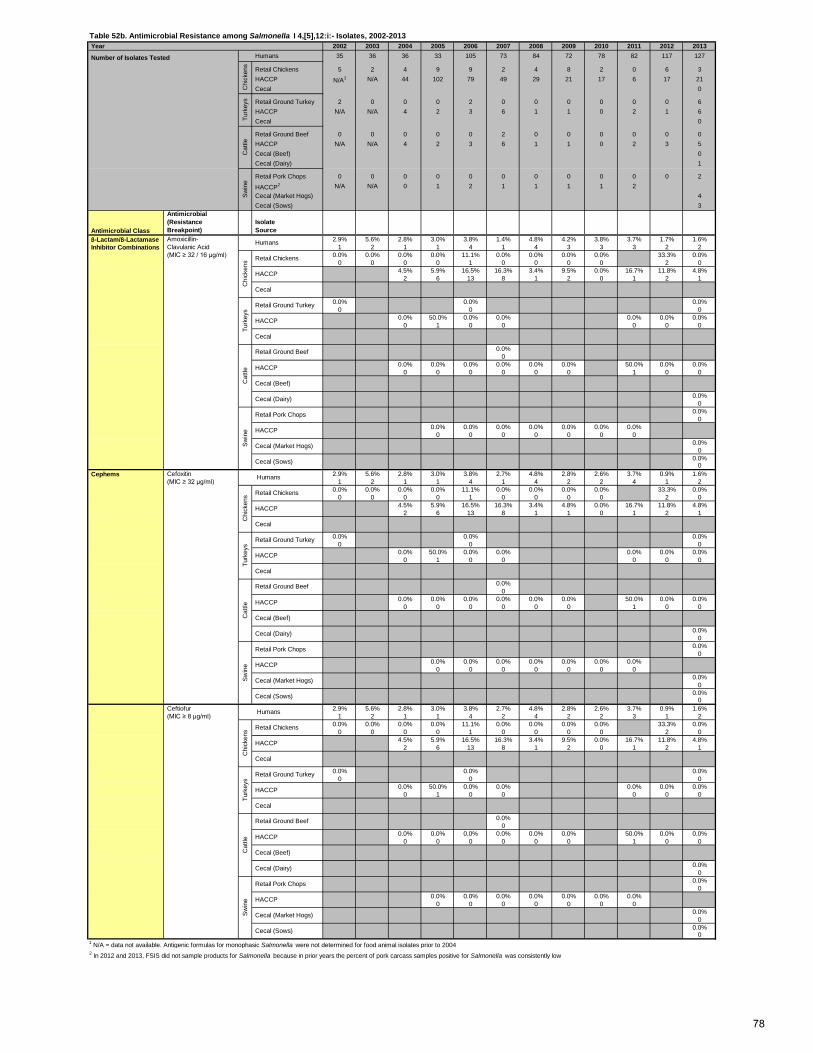
Table 52b. Antimicrobial Resistance among Salmonella I 4,[5],12:i:- Isolates, 2002-2013 Year 2002 2003 2004 2005 2006 2007 2008 2009 2010 2011 2012 2013
Number of Isolates Tested Humans 35 36 36 33 105 73 84 72 78 82 117 127
Retail Chickens 5 2 4 9 9 2 4 8 2 0 6 3 HACCP N/A1 N/A 44 102 79 49 29 21 17 6 17 21 Cecal 0
Retail Ground Turkey 2 0 0 0 2 0 0 0 0 0 0 6 HACCP N/A N/A 4 2 3 6 1 1 0 2 1 6 Cecal 0
Retail Ground Beef 0 0 0 0 0 2 0 0 0 0 0 0 HACCP N/A N/A 4 2 3 6 1 1 0 2 3 5 Cecal (Beef) 0 Cecal (Dairy) 1
Retail Pork Chops 0 0 0 0 0 0 0 0 0 0 0 2
HACCP2 N/A N/A 0 1 2 1 1 1 1 2 Cecal (Market Hogs) 4 Cecal (Sows) 3
Antimicrobial Class
Antimicrobial (Resistance Breakpoint)
Isolate Source
β-Lactam/β-Lactamase Amoxicillin- 2.9% 5.6% 2.8% 3.0% 3.8% 1.4% 4.8% 4.2% 3.8% 3.7% 1.7% 1.6% Inhibitor Combinations Clavulanic Acid 1 2 1 1 4 1 4 3 3 3 2 2
(MIC ≥ 32 / 16 µg/ml) 0.0% 0.0% 0.0% 0.0% 11.1% 0.0% 0.0% 0.0% 0.0% 33.3% 0.0%0 0 0 0 1 0 0 0 0 2 0
4.5% 5.9% 16.5% 16.3% 3.4% 9.5% 0.0% 16.7% 11.8% 4.8%2 6 13 8 1 2 0 1 2 1
0.0% 0.0% 0.0%0 0 0
0.0% 50.0% 0.0% 0.0% 0.0% 0.0% 0.0%0 1 0 0 0 0 0
0.0%0
0.0% 0.0% 0.0% 0.0% 0.0% 0.0% 50.0% 0.0% 0.0%0 0 0 0 0 0 1 0 0
0.0%0
0.0%0
0.0% 0.0% 0.0% 0.0% 0.0% 0.0% 0.0%0 0 0 0 0 0 0
0.0%0
0.0%0
Cefoxitin 2.9% 5.6% 2.8% 3.0% 3.8% 2.7% 4.8% 2.8% 2.6% 3.7% 0.9% 1.6% (MIC ≥ 32 µg/ml) 1 2 1 1 4 1 4 2 2 4 1 2
0.0% 0.0% 0.0% 0.0% 11.1% 0.0% 0.0% 0.0% 0.0% 33.3% 0.0%0 0 0 0 1 0 0 0 0 2 0
4.5% 5.9% 16.5% 16.3% 3.4% 4.8% 0.0% 16.7% 11.8% 4.8%2 6 13 8 1 1 0 1 2 1
0.0% 0.0% 0.0%0 0 0
0.0% 50.0% 0.0% 0.0% 0.0% 0.0% 0.0%0 1 0 0 0 0 0
0.0%0
0.0% 0.0% 0.0% 0.0% 0.0% 0.0% 50.0% 0.0% 0.0%0 0 0 0 0 0 1 0 0
0.0%0
0.0%0
0.0% 0.0% 0.0% 0.0% 0.0% 0.0% 0.0%0 0 0 0 0 0 0
0.0%0
0.0%0
Ceftiofur 2.9% 5.6% 2.8% 3.0% 3.8% 2.7% 4.8% 2.8% 2.6% 3.7% 0.9% 1.6% (MIC ≥ 8 µg/ml) 1 2 1 1 4 2 4 2 2 3 1 2
0.0% 0.0% 0.0% 0.0% 11.1% 0.0% 0.0% 0.0% 0.0% 33.3% 0.0%0 0 0 0 1 0 0 0 0 2 0
4.5% 5.9% 16.5% 16.3% 3.4% 9.5% 0.0% 16.7% 11.8% 4.8%2 6 13 8 1 2 0 1 2 1
0.0% 0.0% 0.0%0 0 0
0.0% 50.0% 0.0% 0.0% 0.0% 0.0% 0.0%0 1 0 0 0 0 0
0.0%0
0.0% 0.0% 0.0% 0.0% 0.0% 0.0% 50.0% 0.0% 0.0%0 0 0 0 0 0 1 0 0
0.0%0
0.0%0
0.0% 0.0% 0.0% 0.0% 0.0% 0.0% 0.0%0 0 0 0 0 0 0
0.0%0
0.0%0
1 N/A = data not available. Antigenic formulas for monophasic Salmonella were not determined for food animal isolates prior to 20042 In 2012 and 2013, FSIS did not sample products for Salmonella because in prior years the percent of pork carcass samples positive for Salmonella was consistently low
Cecal (Dairy)
Sw
ine
Retail Pork Chops
HACCP
Cecal (Market Hogs)
Cecal (Sows)
Cat
tle HACCP
Cecal (Beef)
Retail Ground Beef
Cecal
Turk
eys
Retail Ground Turkey
HACCP
Cecal
Humans
Chi
cken
s Retail Chickens
Sw
ine
Retail Pork Chops
HACCP
Cecal (Market Hogs)
Cecal (Sows)
HACCP
Cat
tle
Retail Ground Beef
HACCP
Cecal (Beef)
Cecal (Dairy)
Turk
eys
Retail Ground Turkey
HACCP
Cecal
Chi
cken
s
HACCP
Cecal
Retail Chickens
HACCP
Cecal (Beef)
Cecal (Dairy)
Turk
eys
Retail Ground Turkey
HACCP
Cecal
Retail Chickens
Cephems Humans
Sw
ine
Retail Pork Chops
HACCP
Cecal (Market Hogs)
Cecal (Sows)
Cat
tle
Retail Ground Beef
Turk
eys
Cat
tleS
win
e Humans
Chi
cken
s
HACCP
Cecal
Chi
cken
s
78
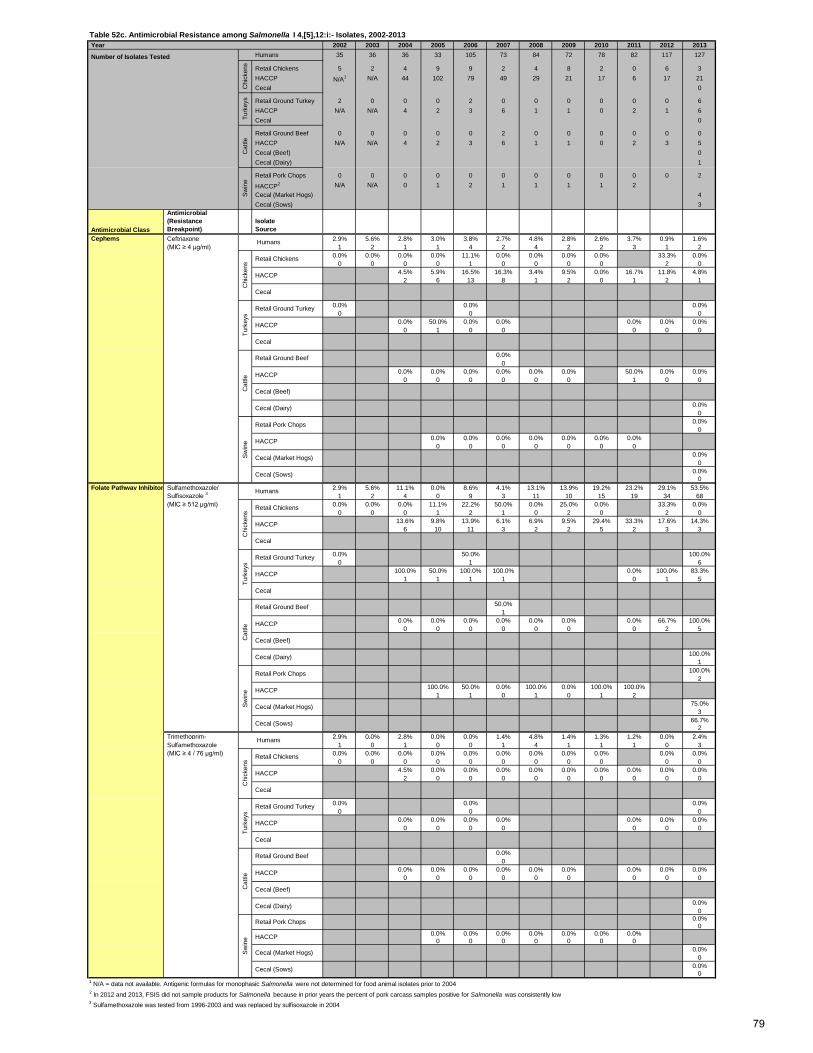
Table 52c. Antimicrobial Resistance among Salmonella I 4,[5],12:i:- Isolates, 2002-2013 Year 2002 2003 2004 2005 2006 2007 2008 2009 2010 2011 2012 2013
Number of Isolates Tested Humans 35 36 36 33 105 73 84 72 78 82 117 127
Retail Chickens 5 2 4 9 9 2 4 8 2 0 6 3 HACCP N/A1 N/A 44 102 79 49 29 21 17 6 17 21 Cecal 0
Retail Ground Turkey 2 0 0 0 2 0 0 0 0 0 0 6 HACCP N/A N/A 4 2 3 6 1 1 0 2 1 6 Cecal 0
Retail Ground Beef 0 0 0 0 0 2 0 0 0 0 0 0 HACCP N/A N/A 4 2 3 6 1 1 0 2 3 5 Cecal (Beef) 0 Cecal (Dairy) 1
Retail Pork Chops 0 0 0 0 0 0 0 0 0 0 0 2
HACCP2 N/A N/A 0 1 2 1 1 1 1 2 Cecal (Market Hogs) 4 Cecal (Sows) 3
Antimicrobial Class
Antimicrobial (Resistance Breakpoint)
Isolate Source
Ceftriaxone 2.9% 5.6% 2.8% 3.0% 3.8% 2.7% 4.8% 2.8% 2.6% 3.7% 0.9% 1.6% (MIC ≥ 4 µg/ml) 1 2 1 1 4 2 4 2 2 3 1 2
0.0% 0.0% 0.0% 0.0% 11.1% 0.0% 0.0% 0.0% 0.0% 33.3% 0.0%0 0 0 0 1 0 0 0 0 2 0
4.5% 5.9% 16.5% 16.3% 3.4% 9.5% 0.0% 16.7% 11.8% 4.8%2 6 13 8 1 2 0 1 2 1
0.0% 0.0% 0.0%0 0 0
0.0% 50.0% 0.0% 0.0% 0.0% 0.0% 0.0%0 1 0 0 0 0 0
0.0%0
0.0% 0.0% 0.0% 0.0% 0.0% 0.0% 50.0% 0.0% 0.0%0 0 0 0 0 0 1 0 0
0.0%0
0.0%0
0.0% 0.0% 0.0% 0.0% 0.0% 0.0% 0.0%0 0 0 0 0 0 0
0.0%0
0.0%0
Folate Pathway Inhibitor Sulfamethoxazole/ 2.9% 5.6% 11.1% 0.0% 8.6% 4.1% 13.1% 13.9% 19.2% 23.2% 29.1% 53.5% Sulfisoxazole 3 1 2 4 0 9 3 11 10 15 19 34 68 (MIC ≥ 512 µg/ml) 0.0% 0.0% 0.0% 11.1% 22.2% 50.0% 0.0% 25.0% 0.0% 33.3% 0.0%
0 0 0 1 2 1 0 2 0 2 013.6% 9.8% 13.9% 6.1% 6.9% 9.5% 29.4% 33.3% 17.6% 14.3%
6 10 11 3 2 2 5 2 3 3
0.0% 50.0% 100.0%0 1 6
100.0% 50.0% 100.0% 100.0% 0.0% 100.0% 83.3%1 1 1 1 0 1 5
50.0%1
0.0% 0.0% 0.0% 0.0% 0.0% 0.0% 0.0% 66.7% 100.0%0 0 0 0 0 0 0 2 5
100.0%1
100.0%2
100.0% 50.0% 0.0% 100.0% 0.0% 100.0% 100.0%1 1 0 1 0 1 2
75.0%3
66.7%2
Trimethoprim- 2.9% 0.0% 2.8% 0.0% 0.0% 1.4% 4.8% 1.4% 1.3% 1.2% 0.0% 2.4% Sulfamethoxazole 1 0 1 0 0 1 4 1 1 1 0 3 (MIC ≥ 4 / 76 µg/ml) 0.0% 0.0% 0.0% 0.0% 0.0% 0.0% 0.0% 0.0% 0.0% 0.0% 0.0%
0 0 0 0 0 0 0 0 0 0 04.5% 0.0% 0.0% 0.0% 0.0% 0.0% 0.0% 0.0% 0.0% 0.0%
2 0 0 0 0 0 0 0 0 0
0.0% 0.0% 0.0%0 0 0
0.0% 0.0% 0.0% 0.0% 0.0% 0.0% 0.0%0 0 0 0 0 0 0
0.0%0
0.0% 0.0% 0.0% 0.0% 0.0% 0.0% 0.0% 0.0% 0.0%0 0 0 0 0 0 0 0 0
0.0%0
0.0%0
0.0% 0.0% 0.0% 0.0% 0.0% 0.0% 0.0%0 0 0 0 0 0 0
0.0%0
0.0%0
1 N/A = data not available. Antigenic formulas for monophasic Salmonella were not determined for food animal isolates prior to 20042 In 2012 and 2013, FSIS did not sample products for Salmonella because in prior years the percent of pork carcass samples positive for Salmonella was consistently low3 Sulfamethoxazole was tested from 1996-2003 and was replaced by sulfisoxazole in 2004
Sw
ine
Retail Pork Chops
HACCP
Cecal (Market Hogs)
Cecal (Sows)
Cat
tle
Retail Ground Beef
Cecal (Dairy)
HACCP
Cecal (Beef)
Turk
eys
Retail Ground Turkey
HACCP
Cecal
HACCP
Humans
Chi
cken
s
Retail Chickens
Cecal
Cecal (Dairy)
Sw
ine
Retail Pork Chops
HACCP
Cecal (Market Hogs)
Cecal (Sows)
Cat
tle
HACCP
Cecal (Beef)
Turk
eys
Retail Ground Turkey
HACCP
Cecal
Retail Ground Beef
HACCP
Cecal
Chi
cken
s
Retail Chickens
Sw
ine
Retail Pork Chops
HACCP
Cecal (Market Hogs)
Cecal (Sows)
Cat
tle
Retail Ground Beef
Cecal (Dairy)
Humans
HACCP
Cecal (Beef)
Turk
eys
Retail Ground Turkey
HACCP
Cecal
HACCP
Cephems HumansC
hick
ens
Retail Chickens
Cecal
Cat
tleS
win
eC
hick
ens
Turk
eys
79
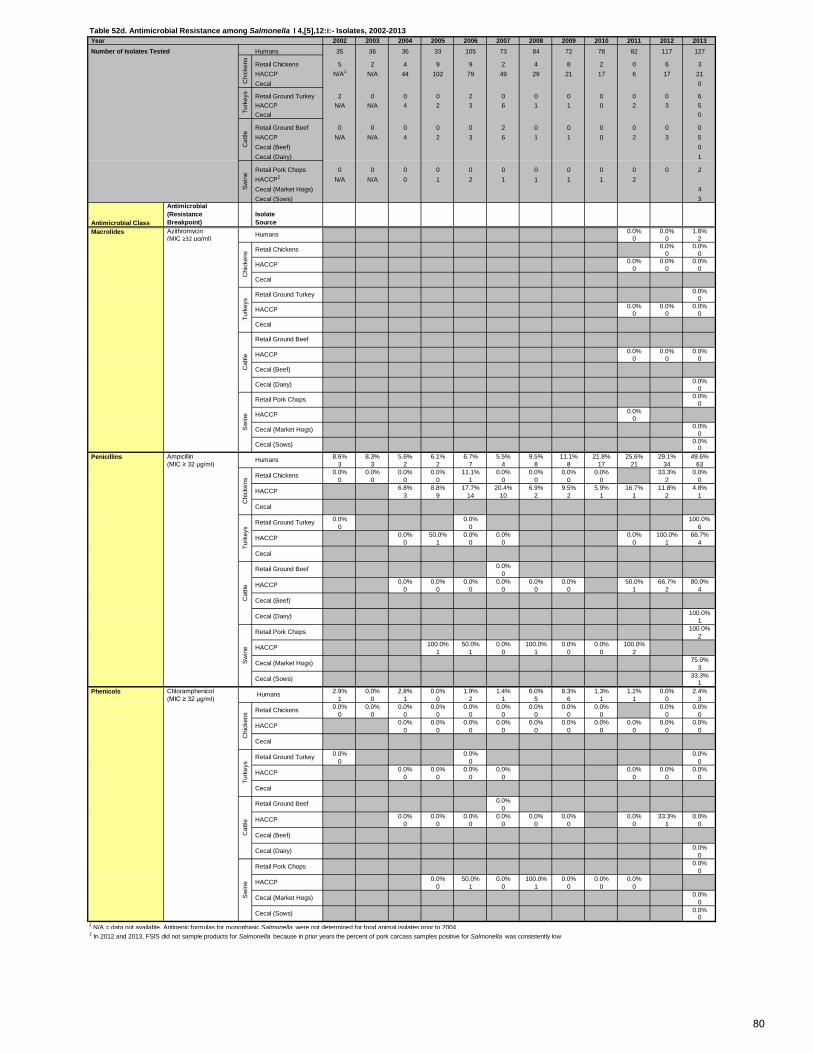
Table 52d. Antimicrobial Resistance among Salmonella I 4,[5],12:i:- Isolates, 2002-2013 Year 2002 2003 2004 2005 2006 2007 2008 2009 2010 2011 2012 2013 Number of Isolates Tested Humans 35 36 36 33 105 73 84 72 78 82 117 127
Retail Chickens 5 2 4 9 9 2 4 8 2 0 6 3 HACCP N/A1 N/A 44 102 79 49 29 21 17 6 17 21 Cecal 0
Retail Ground Turkey 2 0 0 0 2 0 0 0 0 0 0 6 HACCP N/A N/A 4 2 3 6 1 1 0 2 3 5 Cecal 0
Retail Ground Beef 0 0 0 0 0 2 0 0 0 0 0 0 HACCP N/A N/A 4 2 3 6 1 1 0 2 3 5 Cecal (Beef) 0 Cecal (Dairy) 1
Retail Pork Chops 0 0 0 0 0 0 0 0 0 0 0 2 HACCP2 N/A N/A 0 1 2 1 1 1 1 2 Cecal (Market Hogs) 4 Cecal (Sows) 3
Antimicrobial Class
Antimicrobial (Resistance Breakpoint)
Isolate Source
Azithromycin 0.0% 0.0% 1.6% (MIC ≥32 µg/ml) 0 0 2
0.0% 0.0%0 0
0.0% 0.0% 0.0%0 0 0
0.0%0
0.0% 0.0% 0.0%0 0 0
0.0% 0.0% 0.0%0 0 0
0.0%0
0.0%0
0.0%0
0.0%0
0.0%0
Ampicillin 8.6% 8.3% 5.6% 6.1% 6.7% 5.5% 9.5% 11.1% 21.8% 25.6% 29.1% 49.6% (MIC ≥ 32 µg/ml) 3 3 2 2 7 4 8 8 17 21 34 63
0.0% 0.0% 0.0% 0.0% 11.1% 0.0% 0.0% 0.0% 0.0% 33.3% 0.0%0 0 0 0 1 0 0 0 0 2 0
6.8% 8.8% 17.7% 20.4% 6.9% 9.5% 5.9% 16.7% 11.8% 4.8%3 9 14 10 2 2 1 1 2 1
0.0% 0.0% 100.0%0 0 6
0.0% 50.0% 0.0% 0.0% 0.0% 100.0% 66.7%0 1 0 0 0 1 4
0.0%0
0.0% 0.0% 0.0% 0.0% 0.0% 0.0% 50.0% 66.7% 80.0%0 0 0 0 0 0 1 2 4
100.0%1
100.0%2
100.0% 50.0% 0.0% 100.0% 0.0% 0.0% 100.0%1 1 0 1 0 0 2
75.0%3
33.3%1
Chloramphenicol 2.9% 0.0% 2.8% 0.0% 1.9% 1.4% 6.0% 8.3% 1.3% 1.2% 0.0% 2.4% (MIC ≥ 32 µg/ml) 1 0 1 0 2 1 5 6 1 1 0 3
0.0% 0.0% 0.0% 0.0% 0.0% 0.0% 0.0% 0.0% 0.0% 0.0% 0.0%0 0 0 0 0 0 0 0 0 0 0
0.0% 0.0% 0.0% 0.0% 0.0% 0.0% 0.0% 0.0% 0.0% 0.0%0 0 0 0 0 0 0 0 0 0
0.0% 0.0% 0.0%0 0 0
0.0% 0.0% 0.0% 0.0% 0.0% 0.0% 0.0%0 0 0 0 0 0 0
0.0%0
0.0% 0.0% 0.0% 0.0% 0.0% 0.0% 0.0% 33.3% 0.0%0 0 0 0 0 0 0 1 0
0.0%0
0.0%0
0.0% 50.0% 0.0% 100.0% 0.0% 0.0% 0.0%0 1 0 1 0 0 0
0.0%0
0.0%0
1 N/A = data not available. Antigenic formulas for monophasic Salmonella were not determined for food animal isolates prior to 20042 In 2012 and 2013, FSIS did not sample products for Salmonella because in prior years the percent of pork carcass samples positive for Salmonella was consistently low
Sw
ine
Retail Pork Chops
HACCP
Cecal (Market Hogs)
Cecal (Sows)
Cecal (Beef)Cat
tle
Retail Ground Beef
Cecal (Dairy)
HACCP
Turk
eys
Retail Ground Turkey
HACCP
Cecal
HACCP
Phenicols Humans
Chi
cken
s Retail Chickens
Cecal
Cat
tle
Retail Ground Beef
Cecal (Dairy)
Sw
ine
Retail Pork Chops
HACCP
Cecal (Market Hogs)
Cecal (Sows)
HACCP
Cecal (Beef)
Turk
eys
Retail Ground Turkey
HACCP
Cecal
HACCP
Penicillins Humans
Chi
cken
s Retail Chickens
Cecal
Chi
cken
sS
win
e
Retail Pork Chops
HACCP
Cecal (Market Hogs)
Cecal (Sows)
Cat
tle
Retail Ground Beef
HACCP
Turk
eys
Retail Ground Turkey
HACCP
Cecal
Cecal (Dairy)
HACCP
Cecal
Retail Chickens
Cecal (Beef)
Turk
eys
Cat
tleS
win
e
Macrolides HumansC
hick
ens
80
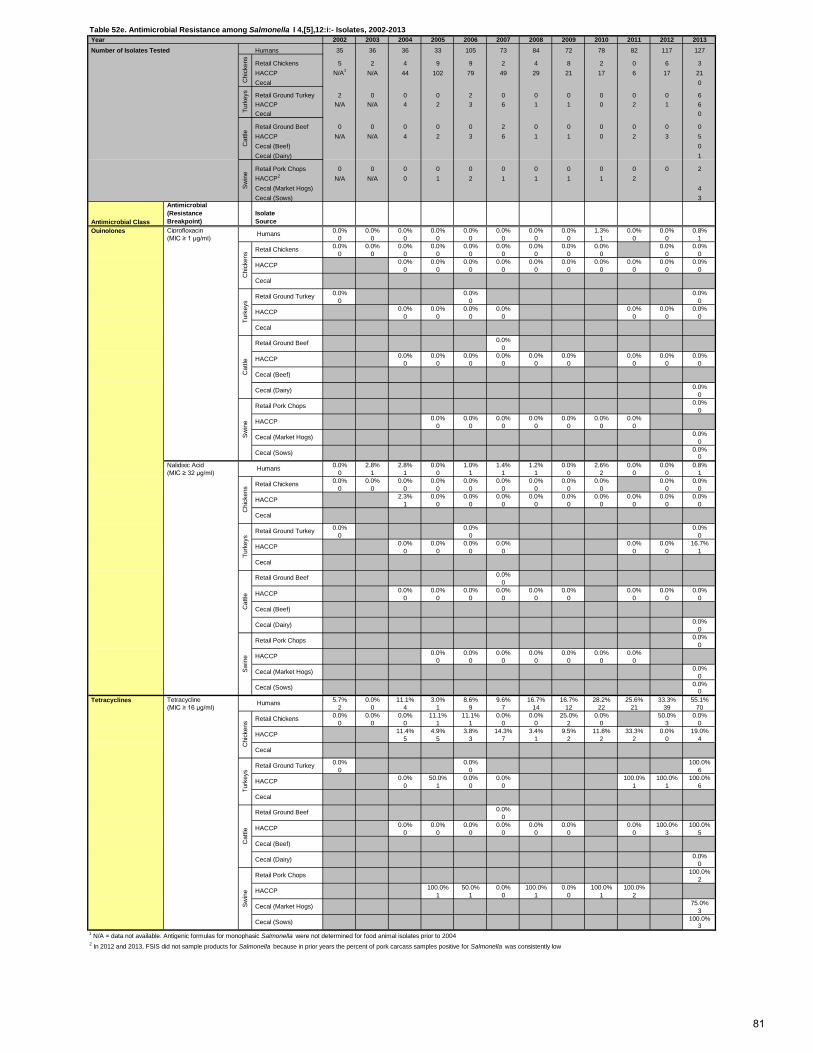
Table 52e. Antimicrobial Resistance among Salmonella I 4,[5],12:i:- Isolates, 2002-2013 Year 2002 2003 2004 2005 2006 2007 2008 2009 2010 2011 2012 2013 Number of Isolates Tested Humans 35 36 36 33 105 73 84 72 78 82 117 127
Retail Chickens 5 2 4 9 9 2 4 8 2 0 6 3 HACCP N/A1 N/A 44 102 79 49 29 21 17 6 17 21 Cecal 0
Retail Ground Turkey 2 0 0 0 2 0 0 0 0 0 0 6 HACCP N/A N/A 4 2 3 6 1 1 0 2 1 6 Cecal 0
Retail Ground Beef 0 0 0 0 0 2 0 0 0 0 0 0 HACCP N/A N/A 4 2 3 6 1 1 0 2 3 5 Cecal (Beef) 0 Cecal (Dairy) 1
Retail Pork Chops 0 0 0 0 0 0 0 0 0 0 0 2 HACCP2 N/A N/A 0 1 2 1 1 1 1 2 Cecal (Market Hogs) 4 Cecal (Sows) 3
Antimicrobial Class
Antimicrobial (Resistance Breakpoint)
Isolate Source
Quinolones Ciprofloxacin 0.0% 0.0% 0.0% 0.0% 0.0% 0.0% 0.0% 0.0% 1.3% 0.0% 0.0% 0.8% (MIC ≥ 1 µg/ml) 0 0 0 0 0 0 0 0 1 0 0 1
0.0% 0.0% 0.0% 0.0% 0.0% 0.0% 0.0% 0.0% 0.0% 0.0% 0.0%0 0 0 0 0 0 0 0 0 0 0
0.0% 0.0% 0.0% 0.0% 0.0% 0.0% 0.0% 0.0% 0.0% 0.0%0 0 0 0 0 0 0 0 0 0
0.0% 0.0% 0.0%0 0 0
0.0% 0.0% 0.0% 0.0% 0.0% 0.0% 0.0%0 0 0 0 0 0 0
0.0%0
0.0% 0.0% 0.0% 0.0% 0.0% 0.0% 0.0% 0.0% 0.0%0 0 0 0 0 0 0 0 0
0.0%0
0.0%0
0.0% 0.0% 0.0% 0.0% 0.0% 0.0% 0.0%0 0 0 0 0 0 0
0.0%0
0.0%0
Nalidixic Acid 0.0% 2.8% 2.8% 0.0% 1.0% 1.4% 1.2% 0.0% 2.6% 0.0% 0.0% 0.8% (MIC ≥ 32 µg/ml) 0 1 1 0 1 1 1 0 2 0 0 1
0.0% 0.0% 0.0% 0.0% 0.0% 0.0% 0.0% 0.0% 0.0% 0.0% 0.0%0 0 0 0 0 0 0 0 0 0 0
2.3% 0.0% 0.0% 0.0% 0.0% 0.0% 0.0% 0.0% 0.0% 0.0%1 0 0 0 0 0 0 0 0 0
0.0% 0.0% 0.0%0 0 0
0.0% 0.0% 0.0% 0.0% 0.0% 0.0% 16.7%0 0 0 0 0 0 1
0.0%0
0.0% 0.0% 0.0% 0.0% 0.0% 0.0% 0.0% 0.0% 0.0%0 0 0 0 0 0 0 0 0
0.0%0
0.0%0
0.0% 0.0% 0.0% 0.0% 0.0% 0.0% 0.0%0 0 0 0 0 0 0
0.0%0
0.0%0
Tetracycline 5.7% 0.0% 11.1% 3.0% 8.6% 9.6% 16.7% 16.7% 28.2% 25.6% 33.3% 55.1% (MIC ≥ 16 µg/ml) 2 0 4 1 9 7 14 12 22 21 39 70
0.0% 0.0% 0.0% 11.1% 11.1% 0.0% 0.0% 25.0% 0.0% 50.0% 0.0%0 0 0 1 1 0 0 2 0 3 0
11.4% 4.9% 3.8% 14.3% 3.4% 9.5% 11.8% 33.3% 0.0% 19.0%5 5 3 7 1 2 2 2 0 4
0.0% 0.0% 100.0%0 0 6
0.0% 50.0% 0.0% 0.0% 100.0% 100.0% 100.0%0 1 0 0 1 1 6
0.0%0
0.0% 0.0% 0.0% 0.0% 0.0% 0.0% 0.0% 100.0% 100.0%0 0 0 0 0 0 0 3 5
0.0%0
100.0%2
100.0% 50.0% 0.0% 100.0% 0.0% 100.0% 100.0%1 1 0 1 0 1 2
75.0%3
100.0%3
1 N/A = data not available. Antigenic formulas for monophasic Salmonella were not determined for food animal isolates prior to 20042 In 2012 and 2013, FSIS did not sample products for Salmonella because in prior years the percent of pork carcass samples positive for Salmonella was consistently low
Cecal (Dairy)
Sw
ine
Retail Pork Chops
HACCP
Cecal (Market Hogs)
Cecal (Sows)
HACCP
Cecal (Beef)Cat
tle
Retail Ground Beef
Turk
eys
Retail Ground Turkey
HACCP
Cecal
HACCP
Cecal
Tetracyclines Humans
Chi
cken
s Retail Chickens
Cecal (Dairy)
Sw
ine
Retail Pork Chops
HACCP
Cecal (Market Hogs)
Cecal (Sows)
Cat
tle HACCP
Cecal (Beef)
Retail Ground Beef
Cecal
Turk
eys
Retail Ground Turkey
HACCP
Cecal
Humans
Chi
cken
s Retail Chickens
Sw
ine
Retail Pork Chops
HACCP
Cecal (Market Hogs)
Cecal (Sows)
HACCP
Cat
tle
Retail Ground Beef
Turk
eys
Retail Ground Turkey
HACCP
Cecal
Chi
cken
s
HACCP
Cecal (Beef)
Cecal (Dairy)
HACCP
Cecal
Retail ChickensC
hick
ens
Turk
eys
Cat
tleS
win
e
Humans
81
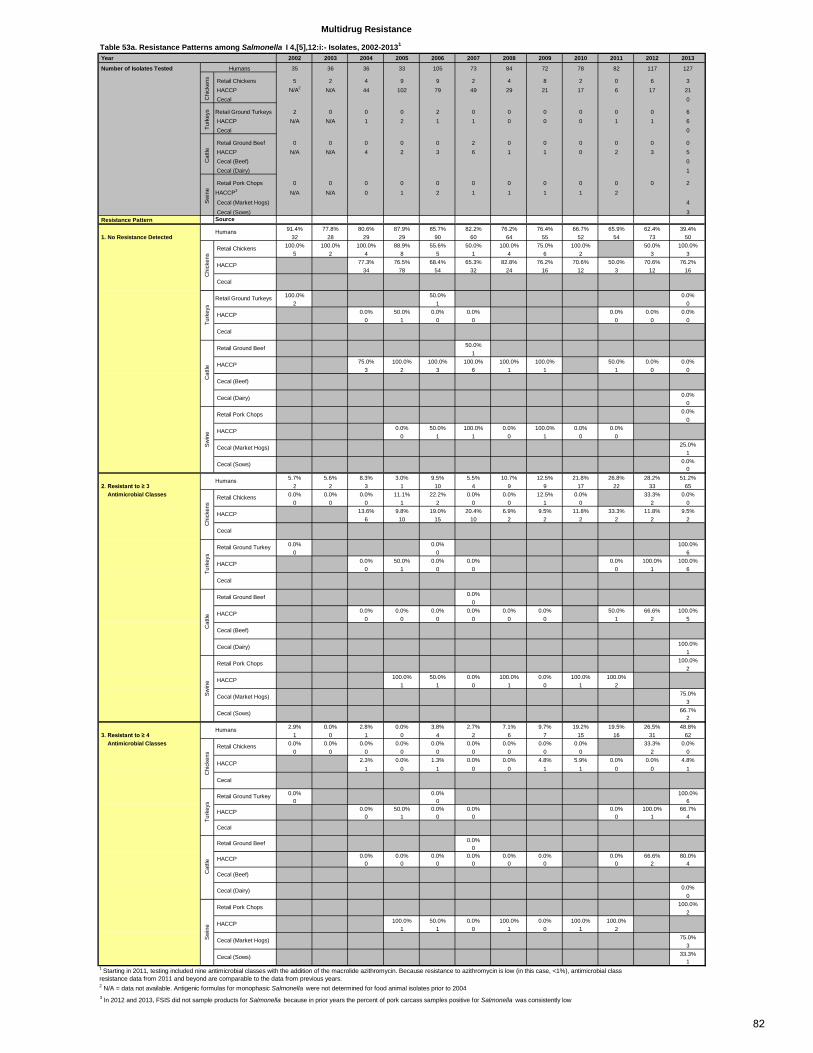
Table 53a. Resistance Patterns among Salmonella I 4,[5],12:i:- Isolates, 2002-20131
Year 2002 2003 2004 2005 2006 2007 2008 2009 2010 2011 2012 2013
Number of Isolates Tested 35 36 36 33 105 73 84 72 78 82 117 127
Retail Chickens 5 2 4 9 9 2 4 8 2 0 6 3 HACCP N/A2 N/A 44 102 79 49 29 21 17 6 17 21 Cecal 0
Retail Ground Turkeys 2 0 0 0 2 0 0 0 0 0 0 6 HACCP N/A N/A 1 2 1 1 0 0 0 1 1 6 Cecal 0
Retail Ground Beef 0 0 0 0 0 2 0 0 0 0 0 0 HACCP N/A N/A 4 2 3 6 1 1 0 2 3 5 Cecal (Beef) 0 Cecal (Dairy) 1
Retail Pork Chops 0 0 0 0 0 0 0 0 0 0 0 2
HACCP3 N/A N/A 0 1 2 1 1 1 1 2
Cecal (Market Hogs) 4
Cecal (Sows) 3 Resistance Pattern Source
91.4% 77.8% 80.6% 87.9% 85.7% 82.2% 76.2% 76.4% 66.7% 65.9% 62.4% 39.4% 1. No Resistance Detected 32 28 29 29 90 60 64 55 52 54 73 50
100.0% 100.0% 100.0% 88.9% 55.6% 50.0% 100.0% 75.0% 100.0% 50.0% 100.0%5 2 4 8 5 1 4 6 2 3 3
77.3% 76.5% 68.4% 65.3% 82.8% 76.2% 70.6% 50.0% 70.6% 76.2%34 78 54 32 24 16 12 3 12 16
100.0% 50.0% 0.0%2 1 0
0.0% 50.0% 0.0% 0.0% 0.0% 0.0% 0.0%0 1 0 0 0 0 0
50.0%1
75.0% 100.0% 100.0% 100.0% 100.0% 100.0% 50.0% 0.0% 0.0%3 2 3 6 1 1 1 0 0
0.0%0
0.0%0
0.0% 50.0% 100.0% 0.0% 100.0% 0.0% 0.0%0 1 1 0 1 0 0
25.0%1
0.0%0
5.7% 5.6% 8.3% 3.0% 9.5% 5.5% 10.7% 12.5% 21.8% 26.8% 28.2% 51.2% 2. Resistant to ≥ 3 2 2 3 1 10 4 9 9 17 22 33 65 Antimicrobial Classes 0.0% 0.0% 0.0% 11.1% 22.2% 0.0% 0.0% 12.5% 0.0% 33.3% 0.0%
0 0 0 1 2 0 0 1 0 2 013.6% 9.8% 19.0% 20.4% 6.9% 9.5% 11.8% 33.3% 11.8% 9.5%
6 10 15 10 2 2 2 2 2 2
0.0% 0.0% 100.0%0 0 6
0.0% 50.0% 0.0% 0.0% 0.0% 100.0% 100.0%0 1 0 0 0 1 6
0.0%0
0.0% 0.0% 0.0% 0.0% 0.0% 0.0% 50.0% 66.6% 100.0%0 0 0 0 0 0 1 2 5
100.0%1
100.0%2
100.0% 50.0% 0.0% 100.0% 0.0% 100.0% 100.0%1 1 0 1 0 1 2
75.0%3
66.7%2
2.9% 0.0% 2.8% 0.0% 3.8% 2.7% 7.1% 9.7% 19.2% 19.5% 26.5% 48.8% 3. Resistant to ≥ 4 1 0 1 0 4 2 6 7 15 16 31 62 Antimicrobial Classes 0.0% 0.0% 0.0% 0.0% 0.0% 0.0% 0.0% 0.0% 0.0% 33.3% 0.0%
0 0 0 0 0 0 0 0 0 2 02.3% 0.0% 1.3% 0.0% 0.0% 4.8% 5.9% 0.0% 0.0% 4.8%
1 0 1 0 0 1 1 0 0 1
0.0% 0.0% 100.0%0 0 6
0.0% 50.0% 0.0% 0.0% 0.0% 100.0% 66.7%0 1 0 0 0 1 4
0.0%0
0.0% 0.0% 0.0% 0.0% 0.0% 0.0% 0.0% 66.6% 80.0%0 0 0 0 0 0 0 2 4
0.0%0
100.0%2
100.0% 50.0% 0.0% 100.0% 0.0% 100.0% 100.0%1 1 0 1 0 1 2
75.0%3
33.3%1
3 In 2012 and 2013, FSIS did not sample products for Salmonella because in prior years the percent of pork carcass samples positive for Salmonella was consistently low
Sw
ine
Humans
Chi
cken
s
Retail Chickens
HACCP
Cecal
Multidrug Resistance
Humans
Chi
cken
sTu
rkey
sC
attle
Turk
eys
Retail Ground Turkeys
HACCP
Cecal
Cat
tle
Retail Ground Beef
HACCP
Cecal (Beef)
Cecal (Dairy)
Chi
cken
s
Retail Chickens
HACCP
Cecal
Turk
eys
Retail Ground Turkey
HACCP
Cecal
Sw
ine
Retail Pork Chops
HACCP
Cecal (Market Hogs)
Cecal (Sows)
Humans
Cat
tle
Retail Ground Beef
HACCP
Cecal (Beef)
Cecal (Dairy)
Sw
ine
Retail Pork Chops
HACCP
Cecal (Market Hogs)
Cecal (Sows)
Humans
Chi
cken
s
Retail Chickens
HACCP
Cecal
Turk
eys
Retail Ground Turkey
HACCP
Cecal
Cat
tle
Retail Ground Beef
HACCP
Cecal (Beef)
Cecal (Dairy)
Sw
ine
Retail Pork Chops
HACCP
Cecal (Market Hogs)
Cecal (Sows)
2 N/A = data not available. Antigenic formulas for monophasic Salmonella were not determined for food animal isolates prior to 2004
1 Starting in 2011, testing included nine antimicrobial classes with the addition of the macrolide azithromycin. Because resistance to azithromycin is low (in this case, <1%), antimicrobial class resistance data from 2011 and beyond are comparable to the data from previous years.
82
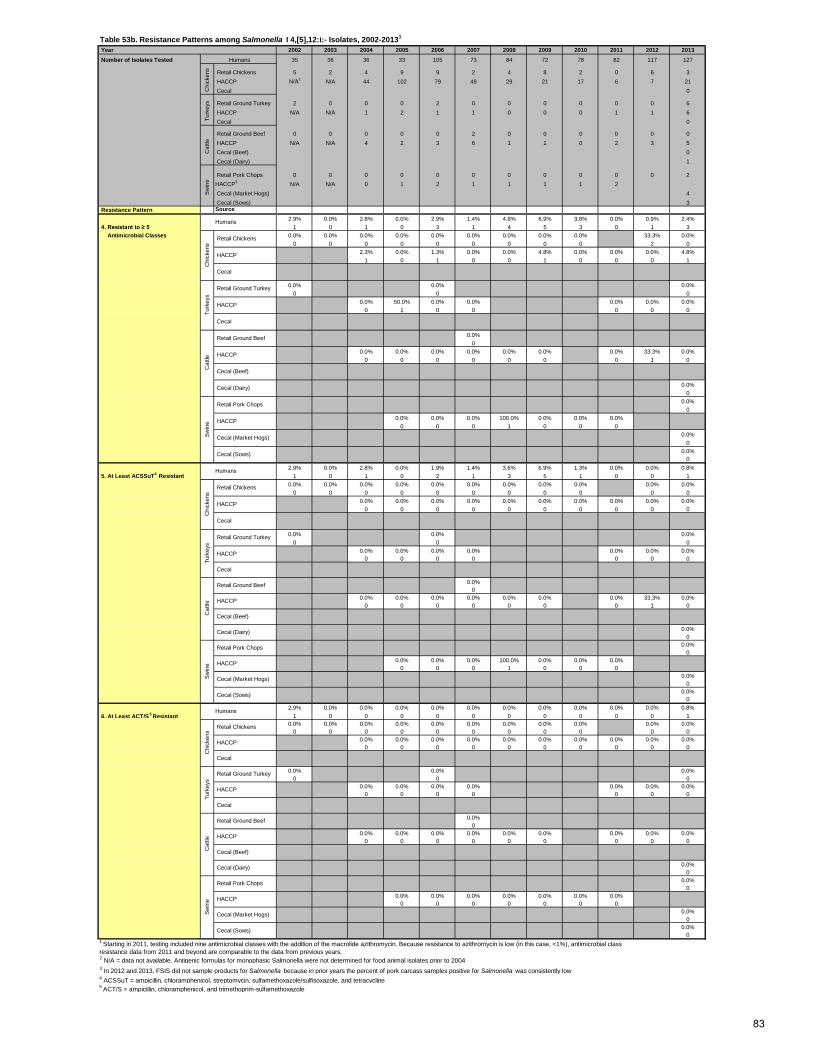
Table 53b. Resistance Patterns among Salmonella I 4,[5],12:i:- Isolates, 2002-20131
Year 2002 2003 2004 2005 2006 2007 2008 2009 2010 2011 2012 2013 Number of Isolates Tested 35 36 36 33 105 73 84 72 78 82 117 127
Retail Chickens 5 2 4 9 9 2 4 8 2 0 6 3 HACCP N/A2 N/A 44 102 79 49 29 21 17 6 7 21 Cecal 0
Retail Ground Turkey 2 0 0 0 2 0 0 0 0 0 0 6 HACCP N/A N/A 1 2 1 1 0 0 0 1 1 6 Cecal 0
Retail Ground Beef 0 0 0 0 0 2 0 0 0 0 0 0 HACCP N/A N/A 4 2 3 6 1 1 0 2 3 5 Cecal (Beef) 0 Cecal (Dairy) 1
Retail Pork Chops 0 0 0 0 0 0 0 0 0 0 0 2HACCP3 N/A N/A 0 1 2 1 1 1 1 2 Cecal (Market Hogs) 4 Cecal (Sows) 3
Resistance Pattern Source2.9% 0.0% 2.8% 0.0% 2.9% 1.4% 4.8% 6.9% 3.8% 0.0% 0.9% 2.4%
4. Resistant to ≥ 5 1 0 1 0 3 1 4 5 3 0 1 3 Antimicrobial Classes 0.0% 0.0% 0.0% 0.0% 0.0% 0.0% 0.0% 0.0% 0.0% 33.3% 0.0%
0 0 0 0 0 0 0 0 0 2 02.3% 0.0% 1.3% 0.0% 0.0% 4.8% 0.0% 0.0% 0.0% 4.8%
1 0 1 0 0 1 0 0 0 1
0.0% 0.0% 0.0%0 0 0
0.0% 50.0% 0.0% 0.0% 0.0% 0.0% 0.0%0 1 0 0 0 0 0
0.0%0
0.0% 0.0% 0.0% 0.0% 0.0% 0.0% 0.0% 33.3% 0.0%0 0 0 0 0 0 0 1 0
0.0%0
0.0%0
0.0% 0.0% 0.0% 100.0% 0.0% 0.0% 0.0%0 0 0 1 0 0 0
0.0%0
0.0%0
2.9% 0.0% 2.8% 0.0% 1.9% 1.4% 3.6% 6.9% 1.3% 0.0% 0.0% 0.8% 5. At Least ACSSuT4 Resistant 1 0 1 0 2 1 3 5 1 0 0 1
0.0% 0.0% 0.0% 0.0% 0.0% 0.0% 0.0% 0.0% 0.0% 0.0% 0.0%0 0 0 0 0 0 0 0 0 0 0
0.0% 0.0% 0.0% 0.0% 0.0% 0.0% 0.0% 0.0% 0.0% 0.0%0 0 0 0 0 0 0 0 0 0
0.0% 0.0% 0.0%0 0 0
0.0% 0.0% 0.0% 0.0% 0.0% 0.0% 0.0%0 0 0 0 0 0 0
0.0%0
0.0% 0.0% 0.0% 0.0% 0.0% 0.0% 0.0% 33.3% 0.0%0 0 0 0 0 0 0 1 0
0.0%0
0.0%0
0.0% 0.0% 0.0% 100.0% 0.0% 0.0% 0.0%0 0 0 1 0 0 0
0.0%0
0.0%0
2.9% 0.0% 0.0% 0.0% 0.0% 0.0% 0.0% 0.0% 0.0% 0.0% 0.0% 0.8% 6. At Least ACT/S
5 Resistant 1 0 0 0 0 0 0 0 0 0 0 10.0% 0.0% 0.0% 0.0% 0.0% 0.0% 0.0% 0.0% 0.0% 0.0% 0.0%
0 0 0 0 0 0 0 0 0 0 00.0% 0.0% 0.0% 0.0% 0.0% 0.0% 0.0% 0.0% 0.0% 0.0%
0 0 0 0 0 0 0 0 0 0
0.0% 0.0% 0.0%0 0 0
0.0% 0.0% 0.0% 0.0% 0.0% 0.0% 0.0%0 0 0 0 0 0 0
0.0%0
0.0% 0.0% 0.0% 0.0% 0.0% 0.0% 0.0% 0.0% 0.0%0 0 0 0 0 0 0 0 0
0.0%0
0.0%0
0.0% 0.0% 0.0% 0.0% 0.0% 0.0% 0.0%0 0 0 0 0 0 0
0.0%0
0.0%0
2 N/A = data not available. Antigenic formulas for monophasic Salmonella were not determined for food animal isolates prior to 20043 In 2012 and 2013, FSIS did not sample products for Salmonella because in prior years the percent of pork carcass samples positive for Salmonella was consistently low4 ACSSuT = ampicillin, chloramphenicol, streptomycin, sulfamethoxazole/sulfisoxazole, and tetracycline5 ACT/S = ampicillin, chloramphenicol, and trimethoprim-sulfamethoxazole
Turk
eys
Retail Ground Turkey
HACCP
Cecal
Turk
eys
Cat
tleS
win
e
Humans
Chi
cken
s
Retail Chickens
HACCP
Cecal
Humans
Chi
cken
s C
attle
Retail Ground Beef
HACCP
Cecal (Beef)
Cecal (Dairy)
Sw
ine
Retail Pork Chops
HACCP
Cecal (Market Hogs)
Cecal (Sows)
Humans
Chi
cken
s
Retail Chickens
HACCP
Cecal
Sw
ine
Retail Pork Chops
HACCP
Cecal (Market Hogs)
Cecal (Sows)
Humans
Turk
eys
Retail Ground Turkey
HACCP
Cecal
Cat
tle
Retail Ground Beef
HACCP
Cecal (Beef)
Cecal (Dairy)
1 Starting in 2011, testing included nine antimicrobial classes with the addition of the macrolide azithromycin. Because resistance to azithromycin is low (in this case, <1%), antimicrobial class resistance data from 2011 and beyond are comparable to the data from previous years.
Chi
cken
s
Retail Chickens
HACCP
Cecal
Turk
eys
Retail Ground Turkey
HACCP
Cecal
Cat
tle
Retail Ground Beef
HACCP
Cecal (Beef)
Cecal (Dairy)
Sw
ine
Retail Pork Chops
HACCP
Cecal (Market Hogs)
Cecal (Sows)
83

Table 53c. Resistance Patterns among Salmonella I 4,[5],12:i:- Isolates, 2002-2013 Year 2002 2003 2004 2005 2006 2007 2008 2009 2010 2011 2012 2013 Number of Isolates Tested 35 36 36 33 105 73 84 72 78 82 117 127
Retail Chickens 5 2 4 9 9 2 4 8 2 0 6 3 HACCP N/A1 N/A 44 102 79 49 29 21 17 6 7 21 Cecal 0
Retail Ground Turkey 2 0 0 0 2 0 0 0 0 0 0 6 HACCP N/A N/A 1 2 1 1 0 0 0 1 1 6 Cecal 0
Retail Ground Beef 0 0 0 0 0 2 0 0 0 0 0 0 HACCP N/A N/A 4 2 3 6 1 1 0 2 3 5 Cecal (Beef) 0 Cecal (Dairy) 1
Retail Pork Chops 0 0 0 0 0 0 0 0 0 0 0 2 HACCP2 N/A N/A 0 1 2 1 1 1 1 2 Cecal (Market Hogs) 4 Cecal (Sows) 3
Resistance Pattern Source0.0% 0.0% 0.0% 0.0% 0.0% 0.0% 2.4% 0.0% 0.0% 0.0% 0.0% 0.0%
7. At Least ACSSuTAuCx 3 0 0 0 0 0 0 2 0 0 0 0 0 Resistant 0.0% 0.0% 0.0% 0.0% 0.0% 0.0% 0.0% 0.0% 0.0% 0.0% 0.0%
0 0 0 0 0 0 0 0 0 0 00.0% 0.0% 0.0% 0.0% 0.0% 0.0% 0.0% 0.0% 0.0% 0.0%
0 0 0 0 0 0 0 0 0 0
0.0% 0.0% 0.0%0 0 0
0.0% 0.0% 0.0% 0.0% 0.0% 0.0% 0.0%0 0 0 0 0 0 0
0.0%0
0.0% 0.0% 0.0% 0.0% 0.0% 0.0% 0.0% 0.0% 0.0%0 0 0 0 0 0 0 0 0
0.0%0
0.0%0
0.0% 0.0% 0.0% 0.0% 0.0% 0.0% 0.0%0 0 0 0 0 0 0
0.0%0
0.0%0
0.0% 0.0% 0.0% 0.0% 0.0% 0.0% 0.0% 0.0% 0.0% 0.0% 0.0% 0.0% 8. At Least Ceftriaxone and 0 0 0 0 0 0 0 0 0 0 0 0 Nalidixic Acid Resistant 0.0% 0.0% 0.0% 0.0% 0.0% 0.0% 0.0% 0.0% 0.0% 0.0% 0.0%
0 0 0 0 0 0 0 0 0 0 02.3% 0.0% 0.0% 0.0% 0.0% 0.0% 0.0% 0.0% 0.0% 0.0%
1 0 0 0 0 0 0 0 0 0
0.0% 0.0% 0.0%0 0 0
0.0% 0.0% 0.0% 0.0% 0.0% 0.0% 0.0%0 0 0 0 0 0 0
0.0%0
0.0% 0.0% 0.0% 0.0% 0.0% 0.0% 0.0% 0.0% 0.0%0 0 0 0 0 0 0 0 0
0.0%0
0.0%0
0.0% 0.0% 0.0% 0.0% 0.0% 0.0% 0.0%0 0 0 0 0 0 0
0.0%0
0.0%0
1 N/A = data not available. Antigenic formulas for monophasic Salmonella were not determined for food animal isolates prior to 20042 In 2012 and 2013, FSIS did not sample products for Salmonella because in prior years the percent of pork carcass samples positive for Salmonella was consistently low3 ACSSuTAuCx = ACSSuT, amoxicillin-clavulanic acid, and ceftriaxone
Humans
Chi
cken
sTu
rkey
sC
attle
Sw
ine
Sw
ine
Retail Pork Chops
HACCP
Cecal (Market Hogs)
Cecal (Sows)
Humans
Chi
cken
s
Retail Chickens
HACCP
Cecal
Turk
eys
Retail Ground Turkey
HACCP
Cecal
Cat
tle
Retail Ground Beef
HACCP
Cecal (Beef)
Cecal (Dairy)
Humans
Chi
cken
s C
attle
Retail Ground Beef
HACCP
Cecal (Beef)
Cecal (Dairy)
Sw
ine
Retail Pork Chops
HACCP
Cecal (Market Hogs)
Cecal (Sows)
Retail Chickens
HACCP
Cecal
Turk
eys
Retail Ground Turkey
HACCP
Cecal
84
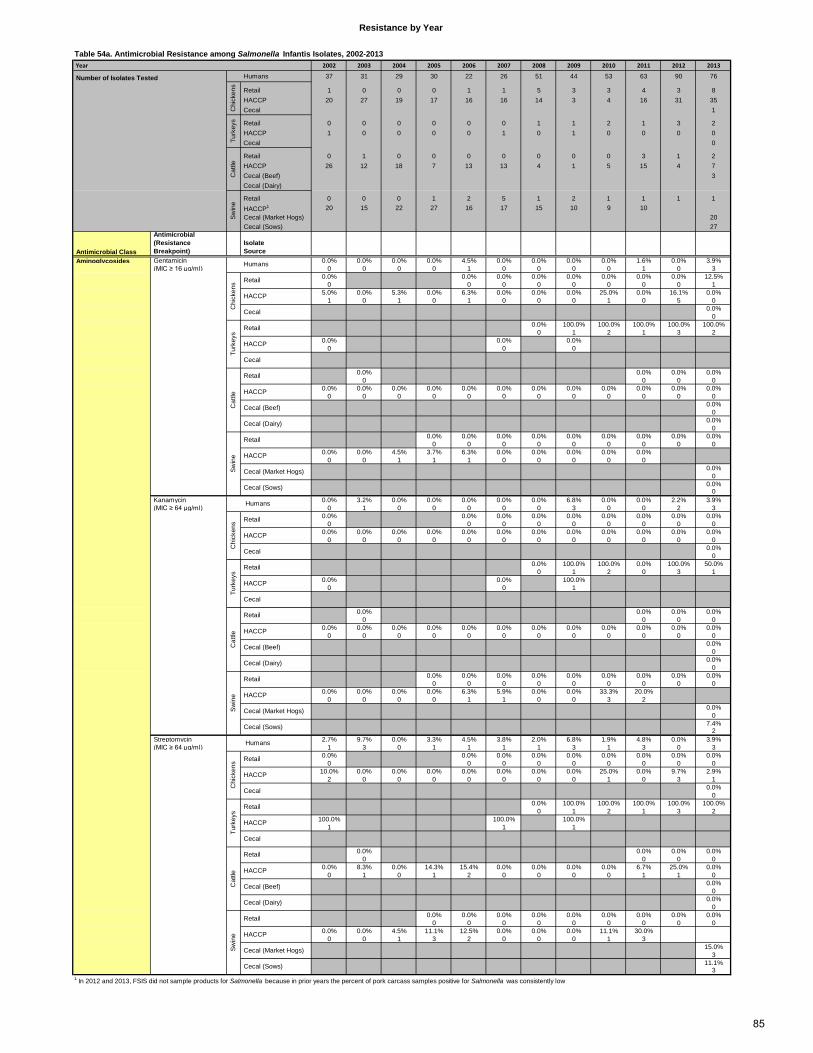
Table 54a. Antimicrobial Resistance among Salmonella Infantis Isolates, 2002-2013 Year 2002 2003 2004 2005 2006 2007 2008 2009 2010 2011 2012 2013
Humans 37 31 29 30 22 26 51 44 53 63 90 76
Retail 1 0 0 0 1 1 5 3 3 4 3 8 HACCP 20 27 19 17 16 16 14 3 4 16 31 35 Cecal 1
Retail 0 0 0 0 0 0 1 1 2 1 3 2 HACCP 1 0 0 0 0 1 0 1 0 0 0 0 Cecal 0
Retail 0 1 0 0 0 0 0 0 0 3 1 2 HACCP 26 12 18 7 13 13 4 1 5 15 4 7 Cecal (Beef) 3 Cecal (Dairy)
Retail 0 0 0 1 2 5 1 2 1 1 1 1 HACCP1 20 15 22 27 16 17 15 10 9 10 Cecal (Market Hogs) 20 Cecal (Sows) 27
Antimicrobial Class
Antimicrobial (Resistance Breakpoint)
Isolate Source
Aminoglycosides Gentamicin 0.0% 0.0% 0.0% 0.0% 4.5% 0.0% 0.0% 0.0% 0.0% 1.6% 0.0% 3.9% (MIC ≥ 16 µg/ml) 0 0 0 0 1 0 0 0 0 1 0 3
0.0% 0.0% 0.0% 0.0% 0.0% 0.0% 0.0% 0.0% 12.5%0 0 0 0 0 0 0 0 1
5.0% 0.0% 5.3% 0.0% 6.3% 0.0% 0.0% 0.0% 25.0% 0.0% 16.1% 0.0%1 0 1 0 1 0 0 0 1 0 5 0
0.0%0
0.0% 100.0% 100.0% 100.0% 100.0% 100.0%0 1 2 1 3 2
0.0% 0.0% 0.0%0 0 0
0.0% 0.0% 0.0% 0.0%0 0 0 0
0.0% 0.0% 0.0% 0.0% 0.0% 0.0% 0.0% 0.0% 0.0% 0.0% 0.0% 0.0%0 0 0 0 0 0 0 0 0 0 0 0
0.0%0
0.0%0
0.0% 0.0% 0.0% 0.0% 0.0% 0.0% 0.0% 0.0% 0.0%0 0 0 0 0 0 0 0 0
0.0% 0.0% 4.5% 3.7% 6.3% 0.0% 0.0% 0.0% 0.0% 0.0%0 0 1 1 1 0 0 0 0 0
0.0%0
0.0%0
Kanamycin 0.0% 3.2% 0.0% 0.0% 0.0% 0.0% 0.0% 6.8% 0.0% 0.0% 2.2% 3.9% (MIC ≥ 64 µg/ml) 0 1 0 0 0 0 0 3 0 0 2 3
0.0% 0.0% 0.0% 0.0% 0.0% 0.0% 0.0% 0.0% 0.0%0 0 0 0 0 0 0 0 0
0.0% 0.0% 0.0% 0.0% 0.0% 0.0% 0.0% 0.0% 0.0% 0.0% 0.0% 0.0%0 0 0 0 0 0 0 0 0 0 0 0
0.0%0
0.0% 100.0% 100.0% 0.0% 100.0% 50.0%0 1 2 0 3 1
0.0% 0.0% 100.0%0 0 1
0.0% 0.0% 0.0% 0.0%0 0 0 0
0.0% 0.0% 0.0% 0.0% 0.0% 0.0% 0.0% 0.0% 0.0% 0.0% 0.0% 0.0%0 0 0 0 0 0 0 0 0 0 0 0
0.0%0
0.0%0
0.0% 0.0% 0.0% 0.0% 0.0% 0.0% 0.0% 0.0% 0.0%0 0 0 0 0 0 0 0 0
0.0% 0.0% 0.0% 0.0% 6.3% 5.9% 0.0% 0.0% 33.3% 20.0%0 0 0 0 1 1 0 0 3 2
0.0%0
7.4%2
Streptomycin 2.7% 9.7% 0.0% 3.3% 4.5% 3.8% 2.0% 6.8% 1.9% 4.8% 0.0% 3.9% (MIC ≥ 64 µg/ml) 1 3 0 1 1 1 1 3 1 3 0 3
0.0% 0.0% 0.0% 0.0% 0.0% 0.0% 0.0% 0.0% 0.0%0 0 0 0 0 0 0 0 0
10.0% 0.0% 0.0% 0.0% 0.0% 0.0% 0.0% 0.0% 25.0% 0.0% 9.7% 2.9%2 0 0 0 0 0 0 0 1 0 3 1
0.0%0
0.0% 100.0% 100.0% 100.0% 100.0% 100.0%0 1 2 1 3 2
100.0% 100.0% 100.0%1 1 1
0.0% 0.0% 0.0% 0.0%0 0 0 0
0.0% 8.3% 0.0% 14.3% 15.4% 0.0% 0.0% 0.0% 0.0% 6.7% 25.0% 0.0%0 1 0 1 2 0 0 0 0 1 1 0
0.0%0
0.0%0
0.0% 0.0% 0.0% 0.0% 0.0% 0.0% 0.0% 0.0% 0.0%0 0 0 0 0 0 0 0 0
0.0% 0.0% 4.5% 11.1% 12.5% 0.0% 0.0% 0.0% 11.1% 30.0%0 0 1 3 2 0 0 0 1 3
15.0%3
11.1%3
1 In 2012 and 2013, FSIS did not sample products for Salmonella because in prior years the percent of pork carcass samples positive for Salmonella was consistently low
HACCP
Cecal (Market Hogs)
Cecal (Sows)
Swin
e
Retail
Cat
tle
Retail
Cecal (Beef)
Cecal (Dairy)
Turk
eys
Retail
HACCP
Cecal
HACCP
HACCP
HACCP
Cecal (Market Hogs)
Cecal (Sows)
Humans
HACCP
Cecal
Swin
e
Retail
Cat
tle
Retail
Chi
cken
s Retail
Cecal (Beef)
Cecal (Dairy)
HACCP
Cecal
Retail
HACCP
Cecal (Market Hogs)
Cecal (Sows)
Humans
Chi
cken
s Retail
Swin
e
Retail
Turk
eys
HACCP
Cecal
Cecal (Beef)
Cecal (Dairy)
Cat
tle HACCP
Retail
HACCP
Cecal
Retail
Turk
eys
Resistance by Year
Number of Isolates Tested
Chi
cken
sTu
rkey
sC
attle
HACCP
Swin
e
Humans
Chi
cken
s Retail
Cecal
85
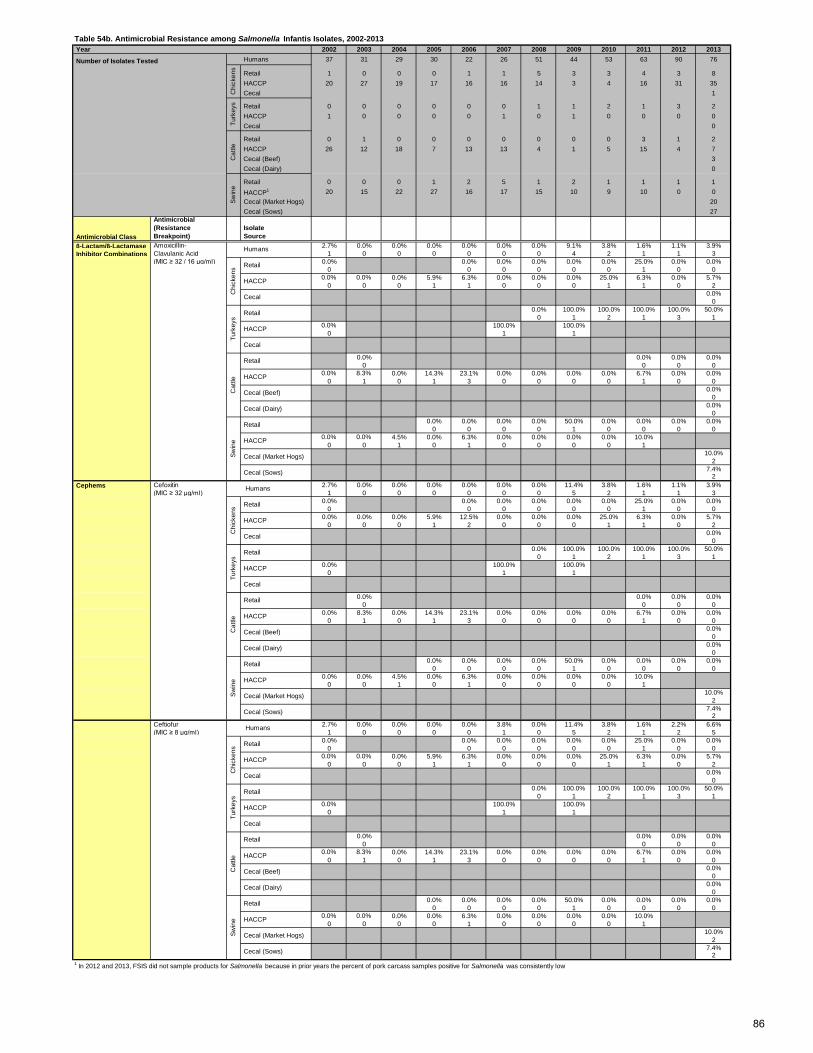
Table 54b. Antimicrobial Resistance among Salmonella Infantis Isolates, 2002-2013 Year 2002 2003 2004 2005 2006 2007 2008 2009 2010 2011 2012 2013
Number of Isolates Tested Humans 37 31 29 30 22 26 51 44 53 63 90 76
Retail 1 0 0 0 1 1 5 3 3 4 3 8 HACCP 20 27 19 17 16 16 14 3 4 16 31 35 Cecal 1
Retail 0 0 0 0 0 0 1 1 2 1 3 2 HACCP 1 0 0 0 0 1 0 1 0 0 0 0 Cecal 0
Retail 0 1 0 0 0 0 0 0 0 3 1 2 HACCP 26 12 18 7 13 13 4 1 5 15 4 7 Cecal (Beef) 3 Cecal (Dairy) 0
Retail 0 0 0 1 2 5 1 2 1 1 1 1 HACCP1 20 15 22 27 16 17 15 10 9 10 0 0 Cecal (Market Hogs) 20 Cecal (Sows) 27
Antimicrobial Class
Antimicrobial (Resistance Breakpoint)
Isolate Source
β-Lactam/β-Lactamase Amoxicillin- 2.7% 0.0% 0.0% 0.0% 0.0% 0.0% 0.0% 9.1% 3.8% 1.6% 1.1% 3.9% Inhibitor Combinations Clavulanic Acid 1 0 0 0 0 0 0 4 2 1 1 3
(MIC ≥ 32 / 16 µg/ml) 0.0% 0.0% 0.0% 0.0% 0.0% 0.0% 25.0% 0.0% 0.0%0 0 0 0 0 0 1 0 0
0.0% 0.0% 0.0% 5.9% 6.3% 0.0% 0.0% 0.0% 25.0% 6.3% 0.0% 5.7%0 0 0 1 1 0 0 0 1 1 0 2
0.0%0
0.0% 100.0% 100.0% 100.0% 100.0% 50.0%0 1 2 1 3 1
0.0% 100.0% 100.0%0 1 1
0.0% 0.0% 0.0% 0.0%0 0 0 0
0.0% 8.3% 0.0% 14.3% 23.1% 0.0% 0.0% 0.0% 0.0% 6.7% 0.0% 0.0%0 1 0 1 3 0 0 0 0 1 0 0
0.0%0
0.0%0
0.0% 0.0% 0.0% 0.0% 50.0% 0.0% 0.0% 0.0% 0.0%0 0 0 0 1 0 0 0 0
0.0% 0.0% 4.5% 0.0% 6.3% 0.0% 0.0% 0.0% 0.0% 10.0%0 0 1 0 1 0 0 0 0 1
10.0%2
7.4%2
Cefoxitin 2.7% 0.0% 0.0% 0.0% 0.0% 0.0% 0.0% 11.4% 3.8% 1.6% 1.1% 3.9% (MIC ≥ 32 µg/ml) 1 0 0 0 0 0 0 5 2 1 1 3
0.0% 0.0% 0.0% 0.0% 0.0% 0.0% 25.0% 0.0% 0.0%0 0 0 0 0 0 1 0 0
0.0% 0.0% 0.0% 5.9% 12.5% 0.0% 0.0% 0.0% 25.0% 6.3% 0.0% 5.7%0 0 0 1 2 0 0 0 1 1 0 2
0.0%0
0.0% 100.0% 100.0% 100.0% 100.0% 50.0%0 1 2 1 3 1
0.0% 100.0% 100.0%0 1 1
0.0% 0.0% 0.0% 0.0%0 0 0 0
0.0% 8.3% 0.0% 14.3% 23.1% 0.0% 0.0% 0.0% 0.0% 6.7% 0.0% 0.0%0 1 0 1 3 0 0 0 0 1 0 0
0.0%0
0.0%0
0.0% 0.0% 0.0% 0.0% 50.0% 0.0% 0.0% 0.0% 0.0%0 0 0 0 1 0 0 0 0
0.0% 0.0% 4.5% 0.0% 6.3% 0.0% 0.0% 0.0% 0.0% 10.0%0 0 1 0 1 0 0 0 0 1
10.0%2
7.4%2
Ceftiofur 2.7% 0.0% 0.0% 0.0% 0.0% 3.8% 0.0% 11.4% 3.8% 1.6% 2.2% 6.6% (MIC ≥ 8 µg/ml) 1 0 0 0 0 1 0 5 2 1 2 5
0.0% 0.0% 0.0% 0.0% 0.0% 0.0% 25.0% 0.0% 0.0%0 0 0 0 0 0 1 0 0
0.0% 0.0% 0.0% 5.9% 6.3% 0.0% 0.0% 0.0% 25.0% 6.3% 0.0% 5.7%0 0 0 1 1 0 0 0 1 1 0 2
0.0%0
0.0% 100.0% 100.0% 100.0% 100.0% 50.0%0 1 2 1 3 1
0.0% 100.0% 100.0%0 1 1
0.0% 0.0% 0.0% 0.0%0 0 0 0
0.0% 8.3% 0.0% 14.3% 23.1% 0.0% 0.0% 0.0% 0.0% 6.7% 0.0% 0.0%0 1 0 1 3 0 0 0 0 1 0 0
0.0%0
0.0%0
0.0% 0.0% 0.0% 0.0% 50.0% 0.0% 0.0% 0.0% 0.0%0 0 0 0 1 0 0 0 0
0.0% 0.0% 0.0% 0.0% 6.3% 0.0% 0.0% 0.0% 0.0% 10.0%0 0 0 0 1 0 0 0 0 1
10.0%2
7.4%2
1 In 2012 and 2013, FSIS did not sample products for Salmonella because in prior years the percent of pork carcass samples positive for Salmonella was consistently low
Swin
e
Retail
Cat
tle
HACCP
Cecal (Market Hogs)
Cecal (Sows)
HACCP
Cecal (Beef)
Retail
Cecal (Dairy)
Turk
eys
Retail
HACCP
Chi
cken
s
Cecal
HACCP
Cecal
Cecal (Sows)
Humans
Retail
Cecal (Dairy)
Swin
e
Retail
HACCP
Cecal (Market Hogs)
Cat
tleTu
rkey
s
Retail
HACCP
Cecal
HACCP
Cecal (Beef)
Retail
HACCP
Cecal
Turk
eys
Retail
HACCP
Chi
cken
s Retail
Cecal (Sows)
Cephems Humans
Cecal (Dairy)
Swin
e
Retail
Cat
tle
HACCP
Cecal (Market Hogs)
HACCP
Cecal (Beef)
Retail
Cecal
Swin
e
Humans
Cecal
Retail
HACCP
Chi
cken
sC
hick
ens
Turk
eys
Cat
tle
86
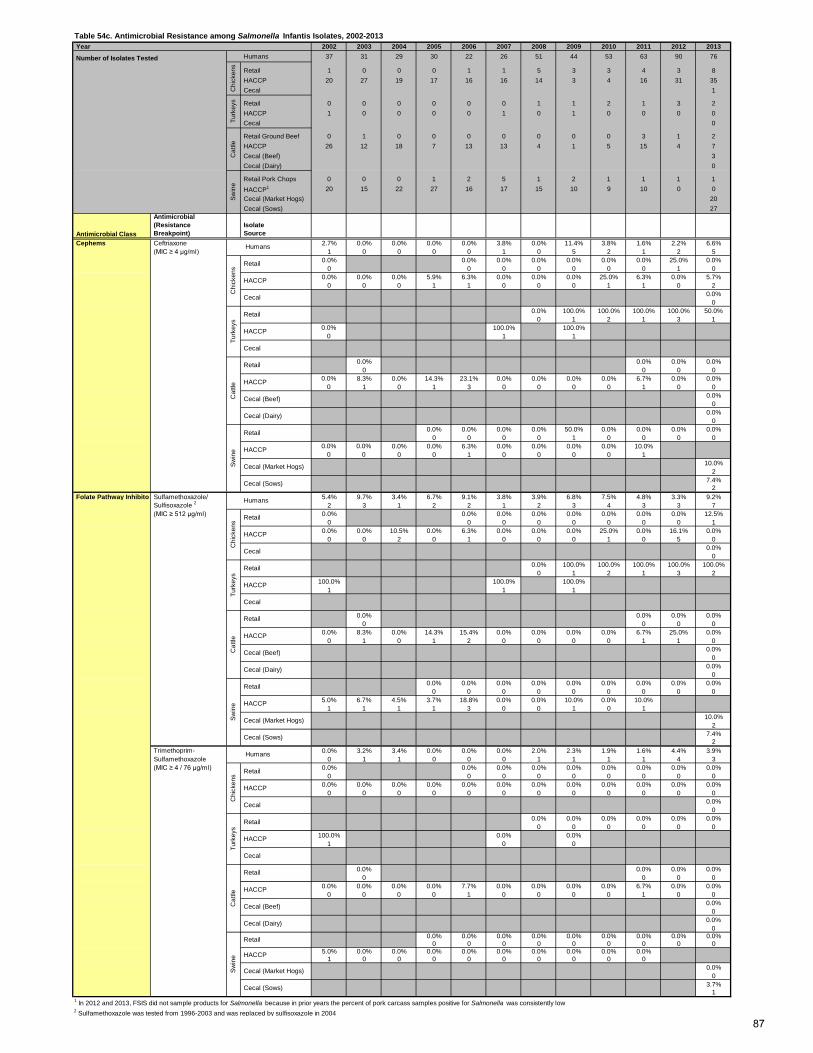
Table 54c. Antimicrobial Resistance among Salmonella Infantis Isolates, 2002-2013 Year 2002 2003 2004 2005 2006 2007 2008 2009 2010 2011 2012 2013
Number of Isolates Tested Humans 37 31 29 30 22 26 51 44 53 63 90 76
Retail 1 0 0 0 1 1 5 3 3 4 3 8 HACCP 20 27 19 17 16 16 14 3 4 16 31 35 Cecal 1
Retail 0 0 0 0 0 0 1 1 2 1 3 2 HACCP 1 0 0 0 0 1 0 1 0 0 0 0 Cecal 0
Retail Ground Beef 0 1 0 0 0 0 0 0 0 3 1 2 HACCP 26 12 18 7 13 13 4 1 5 15 4 7 Cecal (Beef) 3 Cecal (Dairy) 0
Retail Pork Chops 0 0 0 1 2 5 1 2 1 1 1 1 HACCP1 20 15 22 27 16 17 15 10 9 10 0 0 Cecal (Market Hogs) 20 Cecal (Sows) 27
Antimicrobial Class
Antimicrobial (Resistance Breakpoint)
Isolate Source
Ceftriaxone 2.7% 0.0% 0.0% 0.0% 0.0% 3.8% 0.0% 11.4% 3.8% 1.6% 2.2% 6.6% (MIC ≥ 4 µg/ml) 1 0 0 0 0 1 0 5 2 1 2 5
0.0% 0.0% 0.0% 0.0% 0.0% 0.0% 0.0% 25.0% 0.0%0 0 0 0 0 0 0 1 0
0.0% 0.0% 0.0% 5.9% 6.3% 0.0% 0.0% 0.0% 25.0% 6.3% 0.0% 5.7%0 0 0 1 1 0 0 0 1 1 0 2
0.0%0
0.0% 100.0% 100.0% 100.0% 100.0% 50.0%0 1 2 1 3 1
0.0% 100.0% 100.0%0 1 1
0.0% 0.0% 0.0% 0.0%0 0 0 0
0.0% 8.3% 0.0% 14.3% 23.1% 0.0% 0.0% 0.0% 0.0% 6.7% 0.0% 0.0%0 1 0 1 3 0 0 0 0 1 0 0
0.0%0
0.0%0
0.0% 0.0% 0.0% 0.0% 50.0% 0.0% 0.0% 0.0% 0.0%0 0 0 0 1 0 0 0 0
0.0% 0.0% 0.0% 0.0% 6.3% 0.0% 0.0% 0.0% 0.0% 10.0%0 0 0 0 1 0 0 0 0 1
10.0%2
7.4%2
Folate Pathway Inhibitor Sulfamethoxazole/ 5.4% 9.7% 3.4% 6.7% 9.1% 3.8% 3.9% 6.8% 7.5% 4.8% 3.3% 9.2% Sulfisoxazole 2 2 3 1 2 2 1 2 3 4 3 3 7 (MIC ≥ 512 µg/ml) 0.0% 0.0% 0.0% 0.0% 0.0% 0.0% 0.0% 0.0% 12.5%
0 0 0 0 0 0 0 0 10.0% 0.0% 10.5% 0.0% 6.3% 0.0% 0.0% 0.0% 25.0% 0.0% 16.1% 0.0%
0 0 2 0 1 0 0 0 1 0 5 00.0%
00.0% 100.0% 100.0% 100.0% 100.0% 100.0%
0 1 2 1 3 2100.0% 100.0% 100.0%
1 1 1
0.0% 0.0% 0.0% 0.0%0 0 0 0
0.0% 8.3% 0.0% 14.3% 15.4% 0.0% 0.0% 0.0% 0.0% 6.7% 25.0% 0.0%0 1 0 1 2 0 0 0 0 1 1 0
0.0%0
0.0%0
0.0% 0.0% 0.0% 0.0% 0.0% 0.0% 0.0% 0.0% 0.0%0 0 0 0 0 0 0 0 0
5.0% 6.7% 4.5% 3.7% 18.8% 0.0% 0.0% 10.0% 0.0% 10.0%1 1 1 1 3 0 0 1 0 1
10.0%2
7.4%2
Trimethoprim- 0.0% 3.2% 3.4% 0.0% 0.0% 0.0% 2.0% 2.3% 1.9% 1.6% 4.4% 3.9% Sulfamethoxazole 0 1 1 0 0 0 1 1 1 1 4 3 (MIC ≥ 4 / 76 µg/ml) 0.0% 0.0% 0.0% 0.0% 0.0% 0.0% 0.0% 0.0% 0.0%
0 0 0 0 0 0 0 0 00.0% 0.0% 0.0% 0.0% 0.0% 0.0% 0.0% 0.0% 0.0% 0.0% 0.0% 0.0%
0 0 0 0 0 0 0 0 0 0 0 00.0%
00.0% 0.0% 0.0% 0.0% 0.0% 0.0%
0 0 0 0 0 0100.0% 0.0% 0.0%
1 0 0
0.0% 0.0% 0.0% 0.0%0 0 0 0
0.0% 0.0% 0.0% 0.0% 7.7% 0.0% 0.0% 0.0% 0.0% 6.7% 0.0% 0.0%0 0 0 0 1 0 0 0 0 1 0 0
0.0%0
0.0%0
0.0% 0.0% 0.0% 0.0% 0.0% 0.0% 0.0% 0.0% 0.0%0 0 0 0 0 0 0 0 0
5.0% 0.0% 0.0% 0.0% 0.0% 0.0% 0.0% 0.0% 0.0% 0.0%1 0 0 0 0 0 0 0 0 0
0.0%0
3.7%1
1 In 2012 and 2013, FSIS did not sample products for Salmonella because in prior years the percent of pork carcass samples positive for Salmonella was consistently low2 Sulfamethoxazole was tested from 1996-2003 and was replaced by sulfisoxazole in 2004
HACCP
Cecal (Market Hogs)
Cecal (Sows)
Swin
e
Retail
HACCP
Cat
tle
Retail
Cecal (Beef)
Cecal (Dairy)
Turk
eys
Retail
HACCP
Cecal
HACCP
Cecal (Market Hogs)
Cecal (Sows)
HACCP
Humans
Chi
cken
s
Retail
HACCP
Cecal
Swin
e
Retail
Cat
tle
Retail
Cecal (Beef)
Cecal (Dairy)
Turk
eys
Retail
HACCP
Cecal
HACCP
Cecal
Retail
Humans
Chi
cken
s
Retail
Turk
eys
HACCP
Cecal
HACCP
Cat
tle
Retail
Cecal (Beef)
Cecal (Dairy)
HACCP
Swin
e
Retail
Cecal (Market Hogs)
Cecal (Sows)
Cephems Humans
Chi
cken
s
Retail
Cecal
Chi
cken
sTu
rkey
sC
attle
Swin
e
HACCP
87
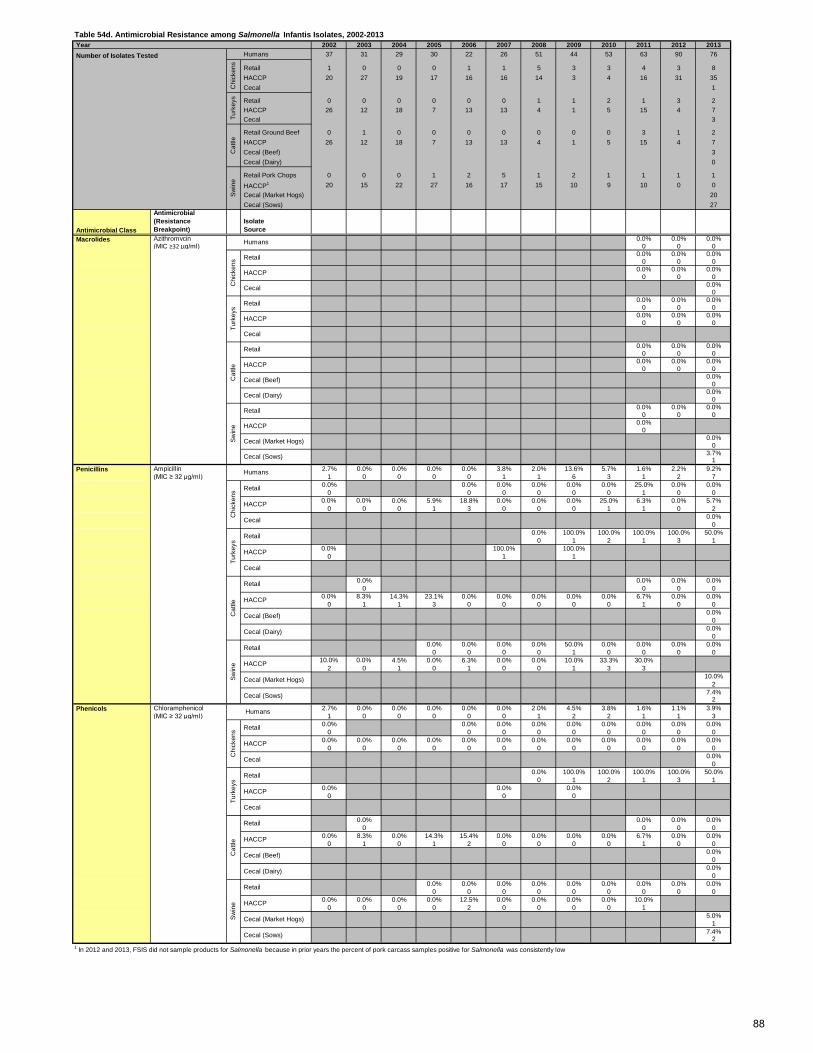
Table 54d. Antimicrobial Resistance among Salmonella Infantis Isolates, 2002-2013 Year 2002 2003 2004 2005 2006 2007 2008 2009 2010 2011 2012 2013 Number of Isolates Tested Humans 37 31 29 30 22 26 51 44 53 63 90 76
Retail 1 0 0 0 1 1 5 3 3 4 3 8 HACCP 20 27 19 17 16 16 14 3 4 16 31 35 Cecal 1
Retail 0 0 0 0 0 0 1 1 2 1 3 2 HACCP 26 12 18 7 13 13 4 1 5 15 4 7 Cecal 3
Retail Ground Beef 0 1 0 0 0 0 0 0 0 3 1 2 HACCP 26 12 18 7 13 13 4 1 5 15 4 7 Cecal (Beef) 3 Cecal (Dairy) 0
Retail Pork Chops 0 0 0 1 2 5 1 2 1 1 1 1 HACCP1 20 15 22 27 16 17 15 10 9 10 0 0 Cecal (Market Hogs) 20 Cecal (Sows) 27
Antimicrobial Class
Antimicrobial (Resistance Breakpoint)
Isolate Source
Azithromycin 0.0% 0.0% 0.0% (MIC ≥32 µg/ml) 0 0 0
0.0% 0.0% 0.0%0 0 0
0.0% 0.0% 0.0%0 0 0
0.0%0
0.0% 0.0% 0.0%0 0 0
0.0% 0.0% 0.0%0 0 0
0.0% 0.0% 0.0%0 0 0
0.0% 0.0% 0.0%0 0 0
0.0%0
0.0%0
0.0% 0.0% 0.0%0 0 0
0.0%0
0.0%0
3.7%1
Ampicillin 2.7% 0.0% 0.0% 0.0% 0.0% 3.8% 2.0% 13.6% 5.7% 1.6% 2.2% 9.2% (MIC ≥ 32 µg/ml) 1 0 0 0 0 1 1 6 3 1 2 7
0.0% 0.0% 0.0% 0.0% 0.0% 0.0% 25.0% 0.0% 0.0%0 0 0 0 0 0 1 0 0
0.0% 0.0% 0.0% 5.9% 18.8% 0.0% 0.0% 0.0% 25.0% 6.3% 0.0% 5.7%0 0 0 1 3 0 0 0 1 1 0 2
0.0%0
0.0% 100.0% 100.0% 100.0% 100.0% 50.0%0 1 2 1 3 1
0.0% 100.0% 100.0%0 1 1
0.0% 0.0% 0.0% 0.0%0 0 0 0
0.0% 8.3% 14.3% 23.1% 0.0% 0.0% 0.0% 0.0% 0.0% 6.7% 0.0% 0.0%0 1 1 3 0 0 0 0 0 1 0 0
0.0%0
0.0%0
0.0% 0.0% 0.0% 0.0% 50.0% 0.0% 0.0% 0.0% 0.0%0 0 0 0 1 0 0 0 0
10.0% 0.0% 4.5% 0.0% 6.3% 0.0% 0.0% 10.0% 33.3% 30.0%2 0 1 0 1 0 0 1 3 3
10.0%2
7.4%2
Chloramphenicol 2.7% 0.0% 0.0% 0.0% 0.0% 0.0% 2.0% 4.5% 3.8% 1.6% 1.1% 3.9% (MIC ≥ 32 µg/ml) 1 0 0 0 0 0 1 2 2 1 1 3
0.0% 0.0% 0.0% 0.0% 0.0% 0.0% 0.0% 0.0% 0.0%0 0 0 0 0 0 0 0 0
0.0% 0.0% 0.0% 0.0% 0.0% 0.0% 0.0% 0.0% 0.0% 0.0% 0.0% 0.0%0 0 0 0 0 0 0 0 0 0 0 0
0.0%0
0.0% 100.0% 100.0% 100.0% 100.0% 50.0%0 1 2 1 3 1
0.0% 0.0% 0.0%0 0 0
0.0% 0.0% 0.0% 0.0%0 0 0 0
0.0% 8.3% 0.0% 14.3% 15.4% 0.0% 0.0% 0.0% 0.0% 6.7% 0.0% 0.0%0 1 0 1 2 0 0 0 0 1 0 0
0.0%0
0.0%0
0.0% 0.0% 0.0% 0.0% 0.0% 0.0% 0.0% 0.0% 0.0%0 0 0 0 0 0 0 0 0
0.0% 0.0% 0.0% 0.0% 12.5% 0.0% 0.0% 0.0% 0.0% 10.0%0 0 0 0 2 0 0 0 0 1
5.0%1
7.4%2
1 In 2012 and 2013, FSIS did not sample products for Salmonella because in prior years the percent of pork carcass samples positive for Salmonella was consistently low
Swin
e
Retail
HACCP
Cecal (Market Hogs)
Cecal (Sows)
Cat
tle
Retail
Cecal (Beef)
Cecal (Dairy)
HACCP
Turk
eys
Retail
HACCP
Cecal
HACCP
Phenicols Humans
Chi
cken
s Retail
Cecal
Swin
e
Retail
HACCP
Cecal (Market Hogs)
Cecal (Sows)
Cat
tle
Retail
Cecal (Beef)
Cecal (Dairy)
HACCP
Turk
eys
Retail
HACCP
Cecal
HACCP
Penicillins Humans
Chi
cken
s Retail
Cecal
Chi
cken
sSw
ine
Retail
HACCP
Cecal (Market Hogs)
Cecal (Sows)
Cat
tle
Retail
HACCP
Turk
eys
Retail
HACCP
Cecal
Cecal (Dairy)
HACCP
Cecal
Retail
Cecal (Beef)
Macrolides HumansC
hick
ens
Turk
eys
Cat
tleSw
ine
88
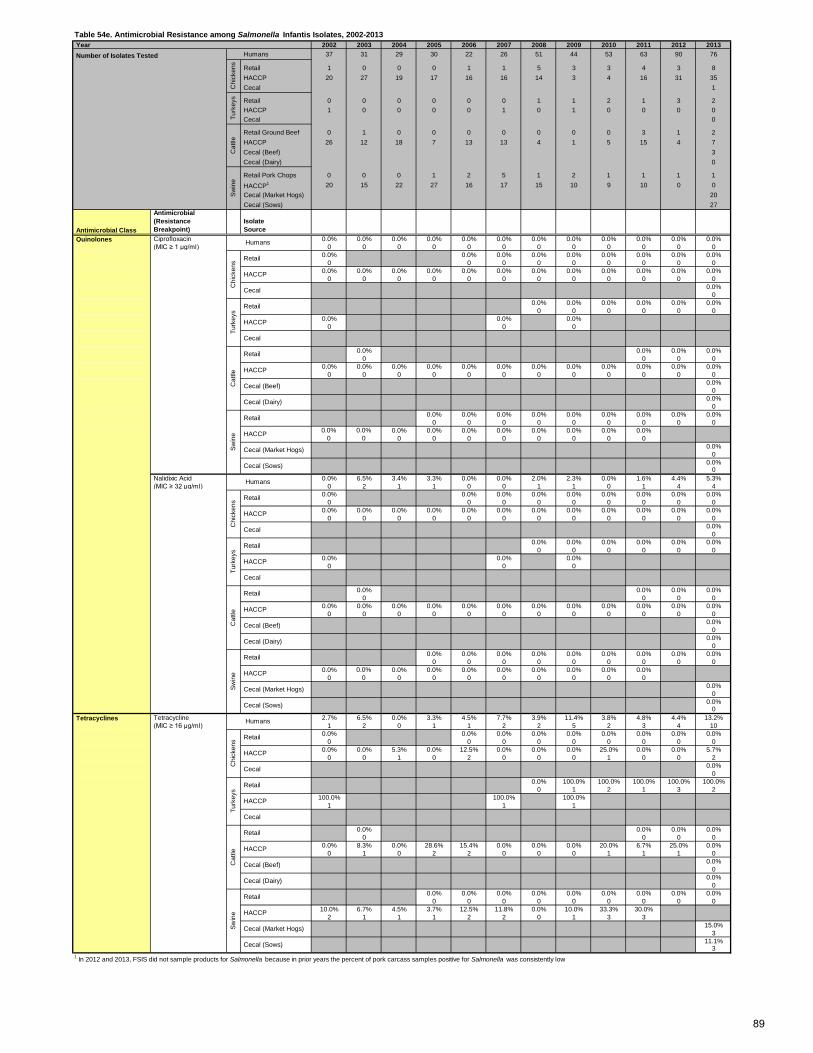
Table 54e. Antimicrobial Resistance among Salmonella Infantis Isolates, 2002-2013 Year 2002 2003 2004 2005 2006 2007 2008 2009 2010 2011 2012 2013 Number of Isolates Tested Humans 37 31 29 30 22 26 51 44 53 63 90 76
Retail 1 0 0 0 1 1 5 3 3 4 3 8 HACCP 20 27 19 17 16 16 14 3 4 16 31 35 Cecal 1
Retail 0 0 0 0 0 0 1 1 2 1 3 2 HACCP 1 0 0 0 0 1 0 1 0 0 0 0 Cecal 0
Retail Ground Beef 0 1 0 0 0 0 0 0 0 3 1 2 HACCP 26 12 18 7 13 13 4 1 5 15 4 7 Cecal (Beef) 3 Cecal (Dairy) 0
Retail Pork Chops 0 0 0 1 2 5 1 2 1 1 1 1 HACCP1 20 15 22 27 16 17 15 10 9 10 0 0 Cecal (Market Hogs) 20 Cecal (Sows) 27
Antimicrobial Class
Antimicrobial (Resistance Breakpoint)
Isolate Source
Quinolones Ciprofloxacin 0.0% 0.0% 0.0% 0.0% 0.0% 0.0% 0.0% 0.0% 0.0% 0.0% 0.0% 0.0% (MIC ≥ 1 µg/ml) 0 0 0 0 0 0 0 0 0 0 0 0
0.0% 0.0% 0.0% 0.0% 0.0% 0.0% 0.0% 0.0% 0.0%0 0 0 0 0 0 0 0 0
0.0% 0.0% 0.0% 0.0% 0.0% 0.0% 0.0% 0.0% 0.0% 0.0% 0.0% 0.0%0 0 0 0 0 0 0 0 0 0 0 0
0.0%0
0.0% 0.0% 0.0% 0.0% 0.0% 0.0%0 0 0 0 0 0
0.0% 0.0% 0.0%0 0 0
0.0% 0.0% 0.0% 0.0%0 0 0 0
0.0% 0.0% 0.0% 0.0% 0.0% 0.0% 0.0% 0.0% 0.0% 0.0% 0.0% 0.0%0 0 0 0 0 0 0 0 0 0 0 0
0.0%0
0.0%0
0.0% 0.0% 0.0% 0.0% 0.0% 0.0% 0.0% 0.0% 0.0%0 0 0 0 0 0 0 0 0
0.0% 0.0% 0.0% 0.0% 0.0% 0.0% 0.0% 0.0% 0.0% 0.0%0 0 0 0 0 0 0 0 0 0
0.0%0
0.0%0
Nalidixic Acid 0.0% 6.5% 3.4% 3.3% 0.0% 0.0% 2.0% 2.3% 0.0% 1.6% 4.4% 5.3% (MIC ≥ 32 µg/ml) 0 2 1 1 0 0 1 1 0 1 4 4
0.0% 0.0% 0.0% 0.0% 0.0% 0.0% 0.0% 0.0% 0.0%0 0 0 0 0 0 0 0 0
0.0% 0.0% 0.0% 0.0% 0.0% 0.0% 0.0% 0.0% 0.0% 0.0% 0.0% 0.0%0 0 0 0 0 0 0 0 0 0 0 0
0.0%0
0.0% 0.0% 0.0% 0.0% 0.0% 0.0%0 0 0 0 0 0
0.0% 0.0% 0.0%0 0 0
0.0% 0.0% 0.0% 0.0%0 0 0 0
0.0% 0.0% 0.0% 0.0% 0.0% 0.0% 0.0% 0.0% 0.0% 0.0% 0.0% 0.0%0 0 0 0 0 0 0 0 0 0 0 0
0.0%0
0.0%0
0.0% 0.0% 0.0% 0.0% 0.0% 0.0% 0.0% 0.0% 0.0%0 0 0 0 0 0 0 0 0
0.0% 0.0% 0.0% 0.0% 0.0% 0.0% 0.0% 0.0% 0.0% 0.0%0 0 0 0 0 0 0 0 0 0
0.0%0
0.0%0
Tetracycline 2.7% 6.5% 0.0% 3.3% 4.5% 7.7% 3.9% 11.4% 3.8% 4.8% 4.4% 13.2% (MIC ≥ 16 µg/ml) 1 2 0 1 1 2 2 5 2 3 4 10
0.0% 0.0% 0.0% 0.0% 0.0% 0.0% 0.0% 0.0% 0.0%0 0 0 0 0 0 0 0 0
0.0% 0.0% 5.3% 0.0% 12.5% 0.0% 0.0% 0.0% 25.0% 0.0% 0.0% 5.7%0 0 1 0 2 0 0 0 1 0 0 2
0.0%0
0.0% 100.0% 100.0% 100.0% 100.0% 100.0%0 1 2 1 3 2
100.0% 100.0% 100.0%1 1 1
0.0% 0.0% 0.0% 0.0%0 0 0 0
0.0% 8.3% 0.0% 28.6% 15.4% 0.0% 0.0% 0.0% 20.0% 6.7% 25.0% 0.0%0 1 0 2 2 0 0 0 1 1 1 0
0.0%0
0.0%0
0.0% 0.0% 0.0% 0.0% 0.0% 0.0% 0.0% 0.0% 0.0%0 0 0 0 0 0 0 0 0
10.0% 6.7% 4.5% 3.7% 12.5% 11.8% 0.0% 10.0% 33.3% 30.0%2 1 1 1 2 2 0 1 3 3
15.0%3
11.1%3
1 In 2012 and 2013, FSIS did not sample products for Salmonella because in prior years the percent of pork carcass samples positive for Salmonella was consistently low
Swin
e
Retail
HACCP
Cecal (Market Hogs)
Cecal (Sows)
Cecal (Beef)Cat
tle
Retail
Cecal (Dairy)
Cecal
Turk
eys
Retail
HACCP
HACCP
Tetracyclines Humans
Chi
cken
s Retail
Cecal
HACCP
Cecal (Dairy)
Swin
e
Retail
HACCP
Cecal (Market Hogs)
Cecal (Sows)
Cat
tle HACCP
Cecal (Beef)
Retail
Turk
eys
Retail
HACCP
Cecal
Humans
Chi
cken
s Retail
Swin
e
Retail
HACCP
Cecal (Market Hogs)
Cecal (Sows)
HACCP
Cecal
Cat
tle
Retail
Turk
eys
Retail
HACCP
Cecal
Chi
cken
s
HACCP
Cecal (Beef)
Cecal (Dairy)
HACCP
Cecal
Retail
Chi
cken
sTu
rkey
sC
attle
Swin
e Humans
89
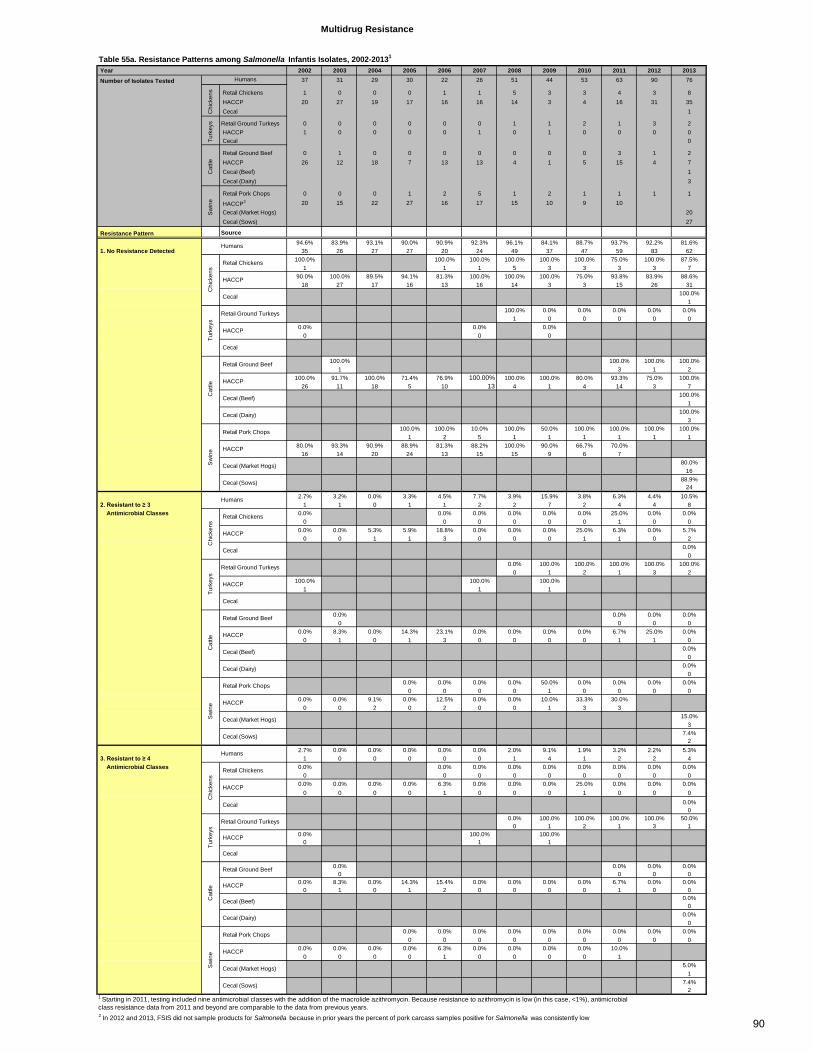
Table 55a. Resistance Patterns among Salmonella Infantis Isolates, 2002-20131
Year 2002 2003 2004 2005 2006 2007 2008 2009 2010 2011 2012 2013
Number of Isolates Tested 37 31 29 30 22 26 51 44 53 63 90 76
Retail Chickens 1 0 0 0 1 1 5 3 3 4 3 8 HACCP 20 27 19 17 16 16 14 3 4 16 31 35 Cecal 1
Retail Ground Turkeys 0 0 0 0 0 0 1 1 2 1 3 2 HACCP 1 0 0 0 0 1 0 1 0 0 0 0 Cecal 0
Retail Ground Beef 0 1 0 0 0 0 0 0 0 3 1 2 HACCP 26 12 18 7 13 13 4 1 5 15 4 7 Cecal (Beef) 1 Cecal (Dairy) 3
Retail Pork Chops 0 0 0 1 2 5 1 2 1 1 1 1
HACCP2 20 15 22 27 16 17 15 10 9 10 Cecal (Market Hogs) 20 Cecal (Sows) 27
Resistance Pattern Source94.6% 83.9% 93.1% 90.0% 90.9% 92.3% 96.1% 84.1% 88.7% 93.7% 92.2% 81.6%
1. No Resistance Detected 35 26 27 27 20 24 49 37 47 59 83 62100.0% 100.0% 100.0% 100.0% 100.0% 100.0% 75.0% 100.0% 87.5%
1 1 1 5 3 3 3 3 790.0% 100.0% 89.5% 94.1% 81.3% 100.0% 100.0% 100.0% 75.0% 93.8% 83.9% 88.6%
18 27 17 16 13 16 14 3 3 15 26 31100.0%
1100.0% 0.0% 0.0% 0.0% 0.0% 0.0%
1 0 0 0 0 00.0% 0.0% 0.0%
0 0 0
100.0% 100.0% 100.0% 100.0%1 3 1 2
100.0% 91.7% 100.0% 71.4% 76.9% 100.00% 100.0% 100.0% 80.0% 93.3% 75.0% 100.0%26 11 18 5 10 13 4 1 4 14 3 7
100.0%1
100.0%3
100.0% 100.0% 10.0% 100.0% 50.0% 100.0% 100.0% 100.0% 100.0%1 2 5 1 1 1 1 1 1
80.0% 93.3% 90.9% 88.9% 81.3% 88.2% 100.0% 90.0% 66.7% 70.0%16 14 20 24 13 15 15 9 6 7
80.0%16
88.9%24
2.7% 3.2% 0.0% 3.3% 4.5% 7.7% 3.9% 15.9% 3.8% 6.3% 4.4% 10.5% 2. Resistant to ≥ 3 1 1 0 1 1 2 2 7 2 4 4 8 Antimicrobial Classes 0.0% 0.0% 0.0% 0.0% 0.0% 0.0% 25.0% 0.0% 0.0%
0 0 0 0 0 0 1 0 00.0% 0.0% 5.3% 5.9% 18.8% 0.0% 0.0% 0.0% 25.0% 6.3% 0.0% 5.7%
0 0 1 1 3 0 0 0 1 1 0 20.0%
00.0% 100.0% 100.0% 100.0% 100.0% 100.0%
0 1 2 1 3 2100.0% 100.0% 100.0%
1 1 1
0.0% 0.0% 0.0% 0.0%0 0 0 0
0.0% 8.3% 0.0% 14.3% 23.1% 0.0% 0.0% 0.0% 0.0% 6.7% 25.0% 0.0%0 1 0 1 3 0 0 0 0 1 1 0
0.0%0
0.0%0
0.0% 0.0% 0.0% 0.0% 50.0% 0.0% 0.0% 0.0% 0.0%0 0 0 0 1 0 0 0 0
0.0% 0.0% 9.1% 0.0% 12.5% 0.0% 0.0% 10.0% 33.3% 30.0%0 0 2 0 2 0 0 1 3 3
15.0%3
7.4%2
2.7% 0.0% 0.0% 0.0% 0.0% 0.0% 2.0% 9.1% 1.9% 3.2% 2.2% 5.3% 3. Resistant to ≥ 4 1 0 0 0 0 0 1 4 1 2 2 4 Antimicrobial Classes 0.0% 0.0% 0.0% 0.0% 0.0% 0.0% 0.0% 0.0% 0.0%
0 0 0 0 0 0 0 0 00.0% 0.0% 0.0% 0.0% 6.3% 0.0% 0.0% 0.0% 25.0% 0.0% 0.0% 0.0%
0 0 0 0 1 0 0 0 1 0 0 00.0%
00.0% 100.0% 100.0% 100.0% 100.0% 50.0%
0 1 2 1 3 10.0% 100.0% 100.0%
0 1 1
0.0% 0.0% 0.0% 0.0%0 0 0 0
0.0% 8.3% 0.0% 14.3% 15.4% 0.0% 0.0% 0.0% 0.0% 6.7% 0.0% 0.0%0 1 0 1 2 0 0 0 0 1 0 0
0.0%0
0.0%0
0.0% 0.0% 0.0% 0.0% 0.0% 0.0% 0.0% 0.0% 0.0%0 0 0 0 0 0 0 0 0
0.0% 0.0% 0.0% 0.0% 6.3% 0.0% 0.0% 0.0% 0.0% 10.0%0 0 0 0 1 0 0 0 0 1
5.0%1
7.4%2
2 In 2012 and 2013, FSIS did not sample products for Salmonella because in prior years the percent of pork carcass samples positive for Salmonella was consistently low
Sw
ine
Retail Pork Chops
HACCP
Cecal (Market Hogs)
Cecal (Sows)
1 Starting in 2011, testing included nine antimicrobial classes with the addition of the macrolide azithromycin. Because resistance to azithromycin is low (in this case, <1%), antimicrobial class resistance data from 2011 and beyond are comparable to the data from previous years.
Turk
eys
Retail Ground Turkeys
HACCP
Cecal
Cat
tle
Retail Ground Beef
HACCP
Cecal (Beef)
Cecal (Dairy)
Sw
ine
Retail Pork Chops
HACCP
Cecal (Market Hogs)
Cecal (Sows)
Humans
Chi
cken
s
Retail Chickens
HACCP
Cecal
HACCP
Cecal
Sw
ine
Retail Pork Chops
HACCP
Cecal (Market Hogs)
Cecal (Sows)
Humans
Cat
tle
Retail Ground Beef
HACCP
Cecal (Beef)
Cecal (Dairy)
Multidrug Resistance
Humans
Chi
cken
sTu
rkey
sC
attle
Turk
eys
Retail Ground Turkeys
HACCP
Cecal
Sw
ine
Humans
Chi
cken
s
Retail Chickens
HACCP
Cecal
Cat
tle
Retail Ground Beef
HACCP
Cecal (Beef)
Cecal (Dairy)
Chi
cken
s
Retail Chickens
HACCP
Cecal
Turk
eys
Retail Ground Turkeys
90
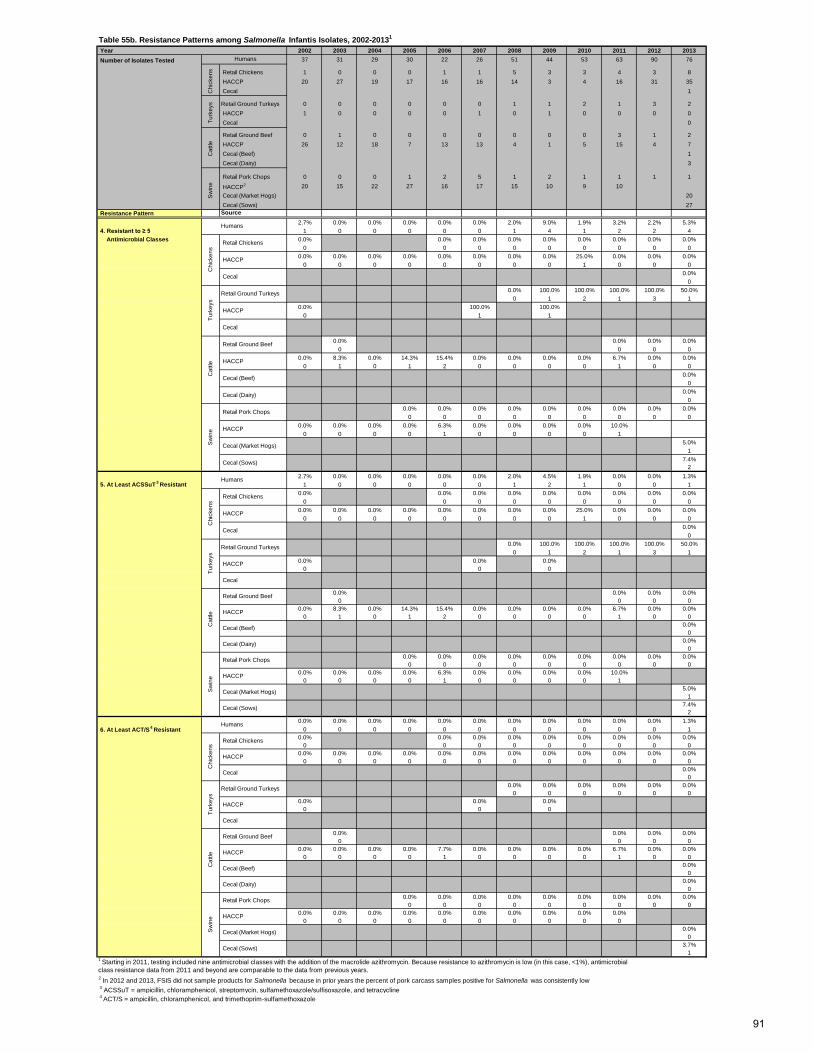
Table 55b. Resistance Patterns among Salmonella Infantis Isolates, 2002-20131
Year 2002 2003 2004 2005 2006 2007 2008 2009 2010 2011 2012 2013 Number of Isolates Tested 37 31 29 30 22 26 51 44 53 63 90 76
Retail Chickens 1 0 0 0 1 1 5 3 3 4 3 8 HACCP 20 27 19 17 16 16 14 3 4 16 31 35 Cecal 1
Retail Ground Turkeys 0 0 0 0 0 0 1 1 2 1 3 2 HACCP 1 0 0 0 0 1 0 1 0 0 0 0 Cecal 0
Retail Ground Beef 0 1 0 0 0 0 0 0 0 3 1 2 HACCP 26 12 18 7 13 13 4 1 5 15 4 7 Cecal (Beef) 1 Cecal (Dairy) 3
Retail Pork Chops 0 0 0 1 2 5 1 2 1 1 1 1
HACCP2 20 15 22 27 16 17 15 10 9 10 Cecal (Market Hogs) 20 Cecal (Sows) 27
Resistance Pattern Source2.7% 0.0% 0.0% 0.0% 0.0% 0.0% 2.0% 9.0% 1.9% 3.2% 2.2% 5.3%
4. Resistant to ≥ 5 1 0 0 0 0 0 1 4 1 2 2 4 Antimicrobial Classes 0.0% 0.0% 0.0% 0.0% 0.0% 0.0% 0.0% 0.0% 0.0%
0 0 0 0 0 0 0 0 00.0% 0.0% 0.0% 0.0% 0.0% 0.0% 0.0% 0.0% 25.0% 0.0% 0.0% 0.0%
0 0 0 0 0 0 0 0 1 0 0 00.0%
00.0% 100.0% 100.0% 100.0% 100.0% 50.0%
0 1 2 1 3 10.0% 100.0% 100.0%
0 1 1
0.0% 0.0% 0.0% 0.0%0 0 0 0
0.0% 8.3% 0.0% 14.3% 15.4% 0.0% 0.0% 0.0% 0.0% 6.7% 0.0% 0.0%0 1 0 1 2 0 0 0 0 1 0 0
0.0%0
0.0%0
0.0% 0.0% 0.0% 0.0% 0.0% 0.0% 0.0% 0.0% 0.0%0 0 0 0 0 0 0 0 0
0.0% 0.0% 0.0% 0.0% 6.3% 0.0% 0.0% 0.0% 0.0% 10.0%0 0 0 0 1 0 0 0 0 1
5.0%1
7.4%2
2.7% 0.0% 0.0% 0.0% 0.0% 0.0% 2.0% 4.5% 1.9% 0.0% 0.0% 1.3% 5. At Least ACSSuT
3 Resistant 1 0 0 0 0 0 1 2 1 0 0 10.0% 0.0% 0.0% 0.0% 0.0% 0.0% 0.0% 0.0% 0.0%
0 0 0 0 0 0 0 0 00.0% 0.0% 0.0% 0.0% 0.0% 0.0% 0.0% 0.0% 25.0% 0.0% 0.0% 0.0%
0 0 0 0 0 0 0 0 1 0 0 00.0%
00.0% 100.0% 100.0% 100.0% 100.0% 50.0%
0 1 2 1 3 10.0% 0.0% 0.0%
0 0 0
0.0% 0.0% 0.0% 0.0%0 0 0 0
0.0% 8.3% 0.0% 14.3% 15.4% 0.0% 0.0% 0.0% 0.0% 6.7% 0.0% 0.0%0 1 0 1 2 0 0 0 0 1 0 0
0.0%0
0.0%0
0.0% 0.0% 0.0% 0.0% 0.0% 0.0% 0.0% 0.0% 0.0%0 0 0 0 0 0 0 0 0
0.0% 0.0% 0.0% 0.0% 6.3% 0.0% 0.0% 0.0% 0.0% 10.0%0 0 0 0 1 0 0 0 0 1
5.0%1
7.4%2
0.0% 0.0% 0.0% 0.0% 0.0% 0.0% 0.0% 0.0% 0.0% 0.0% 0.0% 1.3% 6. At Least ACT/S
4 Resistant 0 0 0 0 0 0 0 0 0 0 0 10.0% 0.0% 0.0% 0.0% 0.0% 0.0% 0.0% 0.0% 0.0%
0 0 0 0 0 0 0 0 00.0% 0.0% 0.0% 0.0% 0.0% 0.0% 0.0% 0.0% 0.0% 0.0% 0.0% 0.0%
0 0 0 0 0 0 0 0 0 0 0 00.0%
00.0% 0.0% 0.0% 0.0% 0.0% 0.0%
0 0 0 0 0 00.0% 0.0% 0.0%
0 0 0
0.0% 0.0% 0.0% 0.0%0 0 0 0
0.0% 0.0% 0.0% 0.0% 7.7% 0.0% 0.0% 0.0% 0.0% 6.7% 0.0% 0.0%0 0 0 0 1 0 0 0 0 1 0 0
0.0%0
0.0%0
0.0% 0.0% 0.0% 0.0% 0.0% 0.0% 0.0% 0.0% 0.0%0 0 0 0 0 0 0 0 0
0.0% 0.0% 0.0% 0.0% 0.0% 0.0% 0.0% 0.0% 0.0% 0.0%0 0 0 0 0 0 0 0 0 0
0.0%0
3.7%1
2 In 2012 and 2013, FSIS did not sample products for Salmonella because in prior years the percent of pork carcass samples positive for Salmonella was consistently low 3 ACSSuT = ampicillin, chloramphenicol, streptomycin, sulfamethoxazole/sulfisoxazole, and tetracycline 4 ACT/S = ampicillin, chloramphenicol, and trimethoprim-sulfamethoxazole
Cat
tle
Retail Ground Beef
HACCP
Cecal (Beef)
Cecal (Dairy)
Sw
ine
Retail Pork Chops
HACCP
Cecal (Market Hogs)
Cecal (Sows)
Chi
cken
s
Retail Chickens
HACCP
Cecal
Turk
eys
Retail Ground Turkeys
HACCP
Cecal
Sw
ine
Retail Pork Chops
HACCP
Cecal (Market Hogs)
Cecal (Sows)
Humans
Turk
eys
Retail Ground Turkeys
HACCP
Cecal
Cat
tle
Retail Ground Beef
HACCP
Cecal (Beef)
Cecal (Dairy)
Sw
ine
Retail Pork Chops
HACCP
Cecal (Market Hogs)
Cecal (Sows)
Cat
tleS
win
e
Humans
Chi
cken
s
Retail Chickens
HACCP
Cecal
Turk
eys
Retail Ground Turkeys
HACCP
Cecal
Cat
tle
Retail Ground Beef
HACCP
Cecal (Beef)
Cecal (Dairy)
Humans
Chi
cken
s
Retail Chickens
HACCP
Cecal
Humans
Chi
cken
sTu
rkey
s
1 Starting in 2011, testing included nine antimicrobial classes with the addition of the macrolide azithromycin. Because resistance to azithromycin is low (in this case, <1%), antimicrobial class resistance data from 2011 and beyond are comparable to the data from previous years.
91
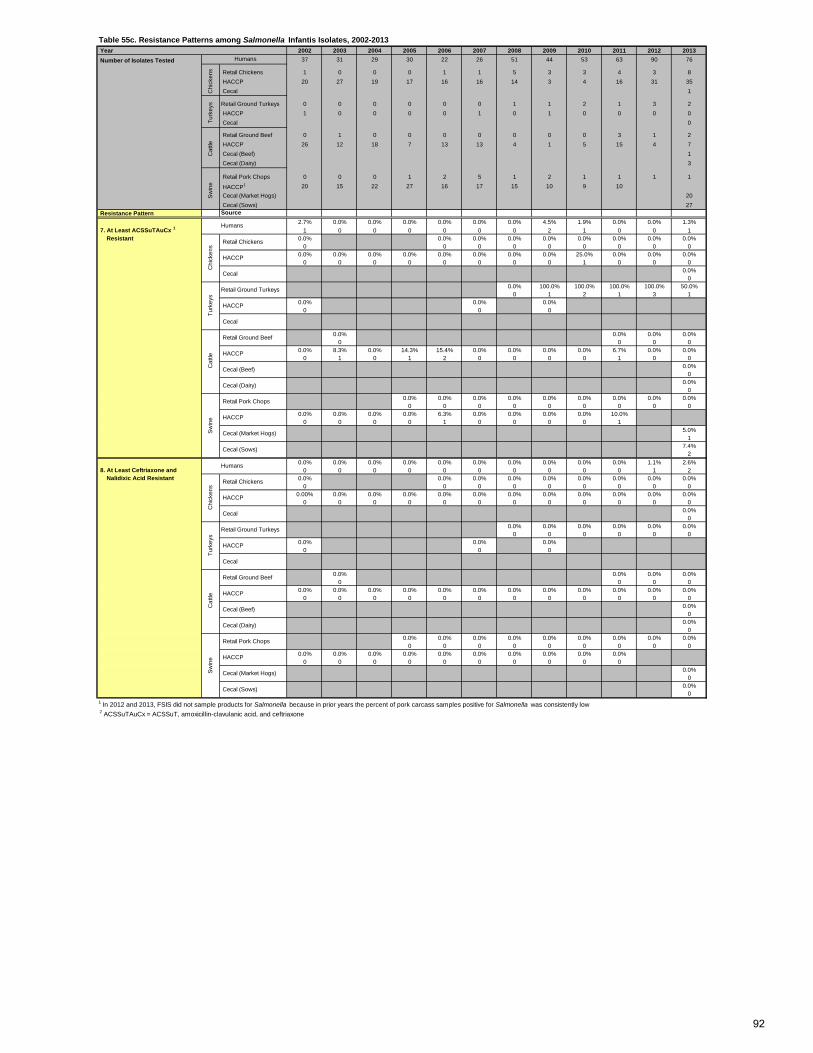
Table 55c. Resistance Patterns among Salmonella Infantis Isolates, 2002-2013 Year 2002 2003 2004 2005 2006 2007 2008 2009 2010 2011 2012 2013 Number of Isolates Tested 37 31 29 30 22 26 51 44 53 63 90 76
Retail Chickens 1 0 0 0 1 1 5 3 3 4 3 8 HACCP 20 27 19 17 16 16 14 3 4 16 31 35 Cecal 1
Retail Ground Turkeys 0 0 0 0 0 0 1 1 2 1 3 2 HACCP 1 0 0 0 0 1 0 1 0 0 0 0 Cecal 0
Retail Ground Beef 0 1 0 0 0 0 0 0 0 3 1 2 HACCP 26 12 18 7 13 13 4 1 5 15 4 7 Cecal (Beef) 1 Cecal (Dairy) 3
Retail Pork Chops 0 0 0 1 2 5 1 2 1 1 1 1
HACCP1 20 15 22 27 16 17 15 10 9 10 Cecal (Market Hogs) 20 Cecal (Sows) 27
Resistance Pattern Source2.7% 0.0% 0.0% 0.0% 0.0% 0.0% 0.0% 4.5% 1.9% 0.0% 0.0% 1.3%
7. At Least ACSSuTAuCx 1 1 0 0 0 0 0 0 2 1 0 0 1 Resistant 0.0% 0.0% 0.0% 0.0% 0.0% 0.0% 0.0% 0.0% 0.0%
0 0 0 0 0 0 0 0 00.0% 0.0% 0.0% 0.0% 0.0% 0.0% 0.0% 0.0% 25.0% 0.0% 0.0% 0.0%
0 0 0 0 0 0 0 0 1 0 0 00.0%
00.0% 100.0% 100.0% 100.0% 100.0% 50.0%
0 1 2 1 3 10.0% 0.0% 0.0%
0 0 0
0.0% 0.0% 0.0% 0.0%0 0 0 0
0.0% 8.3% 0.0% 14.3% 15.4% 0.0% 0.0% 0.0% 0.0% 6.7% 0.0% 0.0%0 1 0 1 2 0 0 0 0 1 0 0
0.0%0
0.0%0
0.0% 0.0% 0.0% 0.0% 0.0% 0.0% 0.0% 0.0% 0.0%0 0 0 0 0 0 0 0 0
0.0% 0.0% 0.0% 0.0% 6.3% 0.0% 0.0% 0.0% 0.0% 10.0%0 0 0 0 1 0 0 0 0 1
5.0%1
7.4%2
0.0% 0.0% 0.0% 0.0% 0.0% 0.0% 0.0% 0.0% 0.0% 0.0% 1.1% 2.6% 8. At Least Ceftriaxone and 0 0 0 0 0 0 0 0 0 0 1 2 Nalidixic Acid Resistant 0.0% 0.0% 0.0% 0.0% 0.0% 0.0% 0.0% 0.0% 0.0%
0 0 0 0 0 0 0 0 00.00% 0.0% 0.0% 0.0% 0.0% 0.0% 0.0% 0.0% 0.0% 0.0% 0.0% 0.0%
0 0 0 0 0 0 0 0 0 0 0 00.0%
00.0% 0.0% 0.0% 0.0% 0.0% 0.0%
0 0 0 0 0 00.0% 0.0% 0.0%
0 0 0
0.0% 0.0% 0.0% 0.0%0 0 0 0
0.0% 0.0% 0.0% 0.0% 0.0% 0.0% 0.0% 0.0% 0.0% 0.0% 0.0% 0.0%0 0 0 0 0 0 0 0 0 0 0 0
0.0%0
0.0%0
0.0% 0.0% 0.0% 0.0% 0.0% 0.0% 0.0% 0.0% 0.0%0 0 0 0 0 0 0 0 0
0.0% 0.0% 0.0% 0.0% 0.0% 0.0% 0.0% 0.0% 0.0% 0.0%0 0 0 0 0 0 0 0 0 0
0.0%0
0.0%0
1 In 2012 and 2013, FSIS did not sample products for Salmonella because in prior years the percent of pork carcass samples positive for Salmonella was consistently low 2 ACSSuTAuCx = ACSSuT, amoxicillin-clavulanic acid, and ceftriaxone
Cat
tle
Retail Ground Beef
HACCP
Cecal (Beef)
Cecal (Dairy)
Sw
ine
Retail Pork Chops
HACCP
Cecal (Market Hogs)
Cecal (Sows)
Humans
Chi
cken
s
Retail Chickens
HACCP
Cecal
Turk
eys
Retail Ground Turkeys
HACCP
Cecal
Cat
tle
Retail Ground Beef
HACCP
Cecal (Beef)
Cecal (Dairy)
Sw
ine
Retail Pork Chops
HACCP
Cecal (Market Hogs)
Cecal (Sows)
Humans
Chi
cken
s
Retail Chickens
HACCP
Cecal
Turk
eys
Retail Ground Turkeys
HACCP
Cecal
Humans
Chi
cken
sTu
rkey
sC
attle
Sw
ine
92
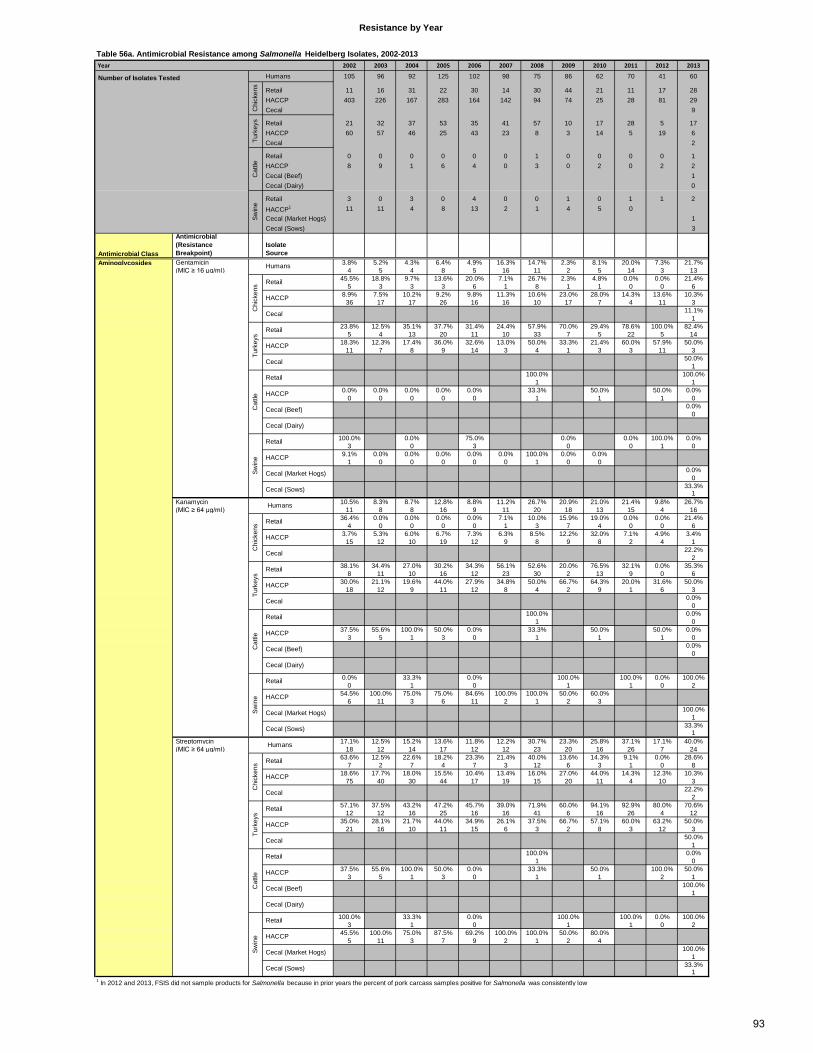
Table 56a. Antimicrobial Resistance among Salmonella Heidelberg Isolates, 2002-2013 Year 2002 2003 2004 2005 2006 2007 2008 2009 2010 2011 2012 2013
Humans 105 96 92 125 102 98 75 86 62 70 41 60
Retail 11 16 31 22 30 14 30 44 21 11 17 28 HACCP 403 226 167 283 164 142 94 74 25 28 81 29 Cecal 9
Retail 21 32 37 53 35 41 57 10 17 28 5 17 HACCP 60 57 46 25 43 23 8 3 14 5 19 6 Cecal 2
Retail 0 0 0 0 0 0 1 0 0 0 0 1 HACCP 8 9 1 6 4 0 3 0 2 0 2 2 Cecal (Beef) 1 Cecal (Dairy) 0
Retail 3 0 3 0 4 0 0 1 0 1 1 2 HACCP1 11 11 4 8 13 2 1 4 5 0 Cecal (Market Hogs) 1 Cecal (Sows) 3
Antimicrobial Class
Antimicrobial (Resistance Breakpoint)
Isolate Source
Aminoglycosides Gentamicin 3.8% 5.2% 4.3% 6.4% 4.9% 16.3% 14.7% 2.3% 8.1% 20.0% 7.3% 21.7% (MIC ≥ 16 µg/ml) 4 5 4 8 5 16 11 2 5 14 3 13
45.5% 18.8% 9.7% 13.6% 20.0% 7.1% 26.7% 2.3% 4.8% 0.0% 0.0% 21.4%5 3 3 3 6 1 8 1 1 0 0 6
8.9% 7.5% 10.2% 9.2% 9.8% 11.3% 10.6% 23.0% 28.0% 14.3% 13.6% 10.3%36 17 17 26 16 16 10 17 7 4 11 3
11.1%1
23.8% 12.5% 35.1% 37.7% 31.4% 24.4% 57.9% 70.0% 29.4% 78.6% 100.0% 82.4%5 4 13 20 11 10 33 7 5 22 5 14
18.3% 12.3% 17.4% 36.0% 32.6% 13.0% 50.0% 33.3% 21.4% 60.0% 57.9% 50.0%11 7 8 9 14 3 4 1 3 3 11 3
50.0%1
100.0% 100.0%1 1
0.0% 0.0% 0.0% 0.0% 0.0% 33.3% 50.0% 50.0% 0.0%0 0 0 0 0 1 1 1 0
0.0%0
100.0% 0.0% 75.0% 0.0% 0.0% 100.0% 0.0%3 0 3 0 0 1 0
9.1% 0.0% 0.0% 0.0% 0.0% 0.0% 100.0% 0.0% 0.0%1 0 0 0 0 0 1 0 0
0.0%0
33.3%1
Kanamycin 10.5% 8.3% 8.7% 12.8% 8.8% 11.2% 26.7% 20.9% 21.0% 21.4% 9.8% 26.7% (MIC ≥ 64 µg/ml) 11 8 8 16 9 11 20 18 13 15 4 16
36.4% 0.0% 0.0% 0.0% 0.0% 7.1% 10.0% 15.9% 19.0% 0.0% 0.0% 21.4%4 0 0 0 0 1 3 7 4 0 0 6
3.7% 5.3% 6.0% 6.7% 7.3% 6.3% 8.5% 12.2% 32.0% 7.1% 4.9% 3.4%15 12 10 19 12 9 8 9 8 2 4 1
22.2%2
38.1% 34.4% 27.0% 30.2% 34.3% 56.1% 52.6% 20.0% 76.5% 32.1% 0.0% 35.3%8 11 10 16 12 23 30 2 13 9 0 6
30.0% 21.1% 19.6% 44.0% 27.9% 34.8% 50.0% 66.7% 64.3% 20.0% 31.6% 50.0%18 12 9 11 12 8 4 2 9 1 6 3
0.0%0
100.0% 0.0%1 0
37.5% 55.6% 100.0% 50.0% 0.0% 33.3% 50.0% 50.0% 0.0%3 5 1 3 0 1 1 1 0
0.0%0
0.0% 33.3% 0.0% 100.0% 100.0% 0.0% 100.0%0 1 0 1 1 0 2
54.5% 100.0% 75.0% 75.0% 84.6% 100.0% 100.0% 50.0% 60.0%6 11 3 6 11 2 1 2 3
100.0%1
33.3%1
Streptomycin 17.1% 12.5% 15.2% 13.6% 11.8% 12.2% 30.7% 23.3% 25.8% 37.1% 17.1% 40.0% (MIC ≥ 64 µg/ml) 18 12 14 17 12 12 23 20 16 26 7 24
63.6% 12.5% 22.6% 18.2% 23.3% 21.4% 40.0% 13.6% 14.3% 9.1% 0.0% 28.6%7 2 7 4 7 3 12 6 3 1 0 8
18.6% 17.7% 18.0% 15.5% 10.4% 13.4% 16.0% 27.0% 44.0% 14.3% 12.3% 10.3%75 40 30 44 17 19 15 20 11 4 10 3
22.2%2
57.1% 37.5% 43.2% 47.2% 45.7% 39.0% 71.9% 60.0% 94.1% 92.9% 80.0% 70.6%12 12 16 25 16 16 41 6 16 26 4 12
35.0% 28.1% 21.7% 44.0% 34.9% 26.1% 37.5% 66.7% 57.1% 60.0% 63.2% 50.0%21 16 10 11 15 6 3 2 8 3 12 3
50.0%1
100.0% 0.0%1 0
37.5% 55.6% 100.0% 50.0% 0.0% 33.3% 50.0% 100.0% 50.0%3 5 1 3 0 1 1 2 1
100.0%1
100.0% 33.3% 0.0% 100.0% 100.0% 0.0% 100.0%3 1 0 1 1 0 2
45.5% 100.0% 75.0% 87.5% 69.2% 100.0% 100.0% 50.0% 80.0%5 11 3 7 9 2 1 2 4
100.0%1
33.3%1
1 In 2012 and 2013, FSIS did not sample products for Salmonella because in prior years the percent of pork carcass samples positive for Salmonella was consistently low
Resistance by Year
HACCP
HACCP
Cecal (Market Hogs)
Cecal (Sows)
Swin
e
Retail
Cat
tle
Retail
Cecal (Beef)
Cecal (Dairy)
Turk
eys
Retail
HACCP
Cecal
HACCP
Cecal (Market Hogs)
Cecal (Sows)
Swin
e
Retail
Humans
Chi
cken
s Retail
HACCP
Cecal
HACCP
Cat
tle
Retail
Cecal (Beef)
Cecal (Dairy)
Turk
eys
Retail
HACCP
Cecal
HACCP
Cecal
Humans
Chi
cken
s Retail
Swin
e
Retail
HACCP
Cecal (Market Hogs)
Cecal (Sows)
HACCP
HACCP
Cecal
Cat
tle
Retail
Cecal (Beef)
Cecal (Dairy)
Turk
eys
Number of Isolates Tested
Chi
cken
sTu
rkey
sC
attle
HACCP
Swin
e
Humans
Chi
cken
s Retail
Cecal
Retail
93
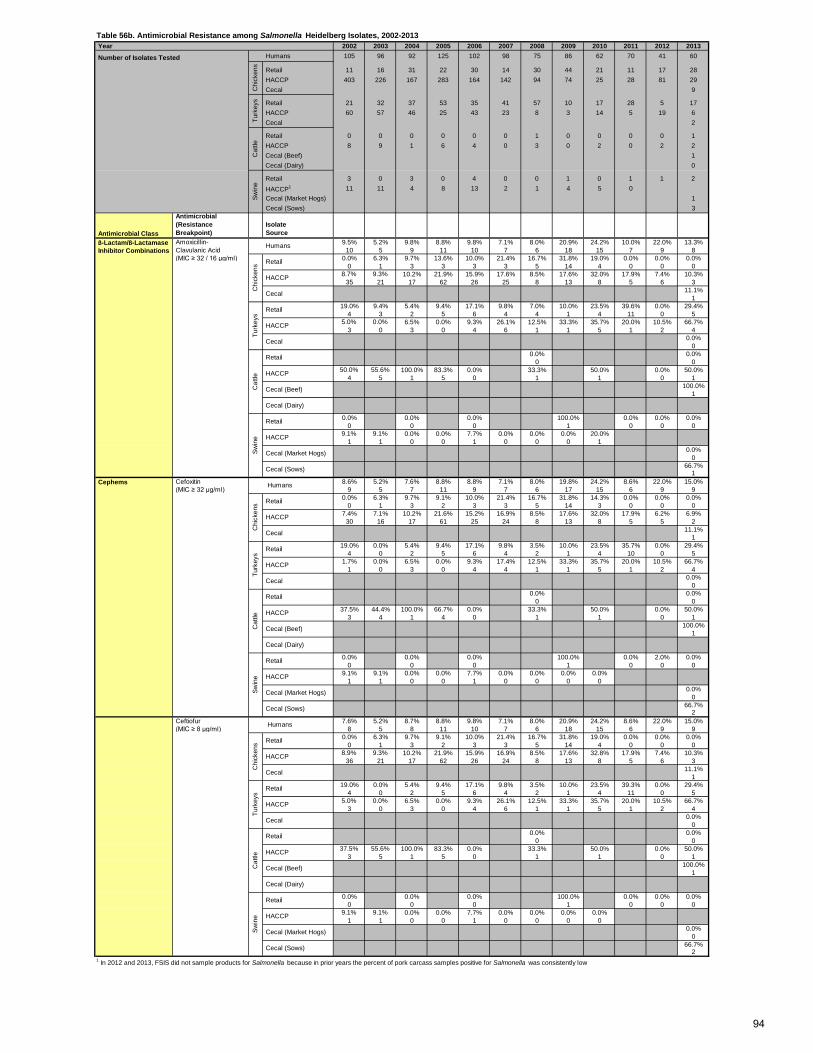
Table 56b. Antimicrobial Resistance among Salmonella Heidelberg Isolates, 2002-2013 Year 2002 2003 2004 2005 2006 2007 2008 2009 2010 2011 2012 2013
Number of Isolates Tested Humans 105 96 92 125 102 98 75 86 62 70 41 60
Retail 11 16 31 22 30 14 30 44 21 11 17 28 HACCP 403 226 167 283 164 142 94 74 25 28 81 29 Cecal 9
Retail 21 32 37 53 35 41 57 10 17 28 5 17 HACCP 60 57 46 25 43 23 8 3 14 5 19 6 Cecal 2
Retail 0 0 0 0 0 0 1 0 0 0 0 1 HACCP 8 9 1 6 4 0 3 0 2 0 2 2 Cecal (Beef) 1 Cecal (Dairy) 0
Retail 3 0 3 0 4 0 0 1 0 1 1 2 HACCP1 11 11 4 8 13 2 1 4 5 0 Cecal (Market Hogs) 1 Cecal (Sows) 3
Antimicrobial Class
Antimicrobial (Resistance Breakpoint)
Isolate Source
β-Lactam/β-Lactamase Amoxicillin- 9.5% 5.2% 9.8% 8.8% 9.8% 7.1% 8.0% 20.9% 24.2% 10.0% 22.0% 13.3% Inhibitor Combinations Clavulanic Acid 10 5 9 11 10 7 6 18 15 7 9 8
(MIC ≥ 32 / 16 µg/ml) 0.0% 6.3% 9.7% 13.6% 10.0% 21.4% 16.7% 31.8% 19.0% 0.0% 0.0% 0.0%0 1 3 3 3 3 5 14 4 0 0 0
8.7% 9.3% 10.2% 21.9% 15.9% 17.6% 8.5% 17.6% 32.0% 17.9% 7.4% 10.3%35 21 17 62 26 25 8 13 8 5 6 3
11.1%1
19.0% 9.4% 5.4% 9.4% 17.1% 9.8% 7.0% 10.0% 23.5% 39.6% 0.0% 29.4%4 3 2 5 6 4 4 1 4 11 0 5
5.0% 0.0% 6.5% 0.0% 9.3% 26.1% 12.5% 33.3% 35.7% 20.0% 10.5% 66.7%3 0 3 0 4 6 1 1 5 1 2 4
0.0%0
0.0% 0.0%0 0
50.0% 55.6% 100.0% 83.3% 0.0% 33.3% 50.0% 0.0% 50.0%4 5 1 5 0 1 1 0 1
100.0%1
0.0% 0.0% 0.0% 100.0% 0.0% 0.0% 0.0%0 0 0 1 0 0 0
9.1% 9.1% 0.0% 0.0% 7.7% 0.0% 0.0% 0.0% 20.0%1 1 0 0 1 0 0 0 1
0.0%0
66.7%1
Cefoxitin 8.6% 5.2% 7.6% 8.8% 8.8% 7.1% 8.0% 19.8% 24.2% 8.6% 22.0% 15.0% (MIC ≥ 32 µg/ml) 9 5 7 11 9 7 6 17 15 6 9 9
0.0% 6.3% 9.7% 9.1% 10.0% 21.4% 16.7% 31.8% 14.3% 0.0% 0.0% 0.0%0 1 3 2 3 3 5 14 3 0 0 0
7.4% 7.1% 10.2% 21.6% 15.2% 16.9% 8.5% 17.6% 32.0% 17.9% 6.2% 6.9%30 16 17 61 25 24 8 13 8 5 5 2
11.1%1
19.0% 0.0% 5.4% 9.4% 17.1% 9.8% 3.5% 10.0% 23.5% 35.7% 0.0% 29.4%4 0 2 5 6 4 2 1 4 10 0 5
1.7% 0.0% 6.5% 0.0% 9.3% 17.4% 12.5% 33.3% 35.7% 20.0% 10.5% 66.7%1 0 3 0 4 4 1 1 5 1 2 4
0.0%0
0.0% 0.0%0 0
37.5% 44.4% 100.0% 66.7% 0.0% 33.3% 50.0% 0.0% 50.0%3 4 1 4 0 1 1 0 1
100.0%1
0.0% 0.0% 0.0% 100.0% 0.0% 2.0% 0.0%0 0 0 1 0 0 0
9.1% 9.1% 0.0% 0.0% 7.7% 0.0% 0.0% 0.0% 0.0%1 1 0 0 1 0 0 0 0
0.0%0
66.7%2
Ceftiofur 7.6% 5.2% 8.7% 8.8% 9.8% 7.1% 8.0% 20.9% 24.2% 8.6% 22.0% 15.0% (MIC ≥ 8 µg/ml) 8 5 8 11 10 7 6 18 15 6 9 9
0.0% 6.3% 9.7% 9.1% 10.0% 21.4% 16.7% 31.8% 19.0% 0.0% 0.0% 0.0%0 1 3 2 3 3 5 14 4 0 0 0
8.9% 9.3% 10.2% 21.9% 15.9% 16.9% 8.5% 17.6% 32.8% 17.9% 7.4% 10.3%36 21 17 62 26 24 8 13 8 5 6 3
11.1%1
19.0% 0.0% 5.4% 9.4% 17.1% 9.8% 3.5% 10.0% 23.5% 39.3% 0.0% 29.4%4 0 2 5 6 4 2 1 4 11 0 5
5.0% 0.0% 6.5% 0.0% 9.3% 26.1% 12.5% 33.3% 35.7% 20.0% 10.5% 66.7%3 0 3 0 4 6 1 1 5 1 2 4
0.0%0
0.0% 0.0%0 0
37.5% 55.6% 100.0% 83.3% 0.0% 33.3% 50.0% 0.0% 50.0%3 5 1 5 0 1 1 0 1
100.0%1
0.0% 0.0% 0.0% 100.0% 0.0% 0.0% 0.0%0 0 0 1 0 0 0
9.1% 9.1% 0.0% 0.0% 7.7% 0.0% 0.0% 0.0% 0.0%1 1 0 0 1 0 0 0 0
0.0%0
66.7%2
1 In 2012 and 2013, FSIS did not sample products for Salmonella because in prior years the percent of pork carcass samples positive for Salmonella was consistently low
Swin
e
Retail
Cat
tle
HACCP
Cecal (Market Hogs)
Cecal (Sows)
HACCP
Cecal (Beef)
Retail
Cecal (Dairy)
Turk
eys
Retail
HACCP
Chi
cken
s
Cecal
HACCP
Cecal
Cecal (Sows)
Humans
Retail
Cecal (Dairy)
Swin
e
Retail
HACCP
Cecal (Market Hogs)
Cat
tle HACCP
Cecal (Beef)
Retail
Turk
eys
Retail
HACCP
Cecal
HACCP
Cecal
Chi
cken
s Retail
Cecal (Sows)
Cephems Humans
Cecal (Dairy)
Swin
e
Retail
Cat
tle
HACCP
HACCP
Cecal (Market Hogs)
HACCP
Cecal (Beef)
Retail
RetailC
hick
ens
Turk
eys
Retail
HACCP
Cecal
Chi
cken
sTu
rkey
sC
attle
Swin
e Humans
Cecal
94

Table 56c. Antimicrobial Resistance among Salmonella Heidelberg Isolates, 2002-2013 Year 2002 2003 2004 2005 2006 2007 2008 2009 2010 2011 2012 2013
Number of Isolates Tested Humans 105 96 92 125 102 98 75 86 62 70 41 60
Retail 11 16 31 22 30 14 30 44 21 11 17 28 HACCP 403 226 167 283 164 142 94 74 25 28 81 29 Cecal 9
Retail 21 32 37 53 35 41 57 10 17 28 5 17 HACCP 60 57 46 25 43 23 8 3 14 5 19 6 Cecal 2
Retail Ground Beef 0 0 0 0 0 0 1 0 0 0 0 1 HACCP 8 9 1 6 4 0 3 0 2 0 2 2 Cecal (Beef) 1 Cecal (Dairy) 0
Retail Pork Chops 3 0 3 0 4 0 0 1 0 1 1 2 HACCP1 11 11 4 8 13 2 1 4 5 0 Cecal (Market Hogs) 1 Cecal (Sows) 3
Antimicrobial Class
Antimicrobial (Resistance Breakpoint)
Isolate Source
Ceftriaxone 7.6% 5.2% 8.7% 8.8% 9.8% 7.1% 8.0% 20.9% 24.2% 8.6% 22.0% 15.0% (MIC ≥ 4 µg/ml) 8 5 8 11 10 7 6 18 15 6 9 9
0.0% 6.3% 9.7% 9.1% 10.0% 21.4% 16.7% 31.8% 23.8% 0.0% 0.0% 0.0%0 1 3 2 3 3 5 14 5 0 0 0
8.9% 9.3% 10.2% 21.9% 15.9% 17.6% 8.5% 17.6% 32.0% 17.9% 7.4% 10.3%36 21 17 62 26 25 8 13 8 5 6 3
11.1%1
19.1% 0.0% 5.4% 9.4% 17.1% 9.8% 3.5% 10.0% 23.5% 39.3% 0.0% 29.4%4 0 2 5 6 4 2 1 4 11 0 5
5.0% 0.0% 6.5% 0.0% 9.3% 26.1% 12.5% 33.3% 35.7% 20.0% 10.5% 66.7%3 0 3 0 4 6 1 1 5 1 2 4
0.0%0
0.0% 0.0%0 0
37.5% 55.6% 100.0% 83.3% 0.0% 33.3% 50.0% 0.0% 50.0%3 5 1 5 0 1 1 0 1
100.0%1
0.0% 0.0% 0.0% 100.0% 0.0% 0.0% 0.0%0 0 0 1 0 0 0
9.1% 9.1% 0.0% 0.0% 7.7% 0.0% 0.0% 0.0% 0.0%1 1 0 0 1 0 0 0 0
0.0%0
66.7%2
Folate Pathway Inhibitor Sulfamethoxazole/ 6.7% 7.3% 7.6% 8.0% 4.9% 18.4% 12.0% 7.0% 11.3% 7.1% 2.4% 15.0% Sulfisoxazole 2 7 7 7 10 5 18 9 6 7 5 1 9 (MIC ≥ 512 µg/ml) 45.5% 12.5% 12.9% 13.6% 26.7% 7.1% 26.7% 2.3% 9.5% 0.0% 0.0% 17.9%
5 2 4 3 8 1 8 1 2 0 0 59.7% 11.1% 12.6% 10.6% 7.9% 13.4% 12.8% 21.6% 36.0% 17.9% 13.6% 10.3%
39 25 21 30 13 19 12 16 9 5 11 311.1%
128.6% 15.6% 37.8% 35.8% 37.1% 26.8% 29.8% 50.0% 35.3% 32.1% 20.0% 29.4%
6 5 14 19 13 11 17 5 6 9 1 530.0% 19.3% 26.1% 52.0% 30.2% 34.8% 37.5% 0.0% 28.6% 40.0% 21.1% 50.0%
18 11 12 13 13 8 3 0 4 2 4 350.0%
1100.0% 100.0%
1 112.5% 44.4% 100.0% 50.0% 0.0% 33.3% 50.0% 50.0% 50.0%
1 4 1 3 0 1 1 1 1100.0%
1
100.0% 0.0% 100.0% 100.0% 0.0% 0.0% 0.0%3 0 4 1 0 0 0
0.0% 0.0% 0.0% 12.5% 0.0% 0.0% 100.0% 0.0% 0.0%0 0 0 1 0 0 1 0 0
0.0%0
33.3%1
Trimethoprim- 1.0% 2.1% 0.0% 0.8% 0.0% 0.0% 2.7% 3.5% 0.0% 1.4% 0.0% 1.7% Sulfamethoxazole 1 2 0 1 0 0 2 3 0 1 0 1 (MIC ≥ 4 / 76 µg/ml) 0.0% 0.0% 0.0% 0.0% 6.7% 0.0% 0.0% 0.0% 0.0% 0.0% 0.0% 0.0%
0 0 0 0 2 0 0 0 0 0 0 00.7% 0.9% 0.0% 0.4% 0.0% 0.0% 0.0% 0.0% 0.0% 0.0% 0.0% 0.0%
3 2 0 1 0 0 0 0 0 0 0 00.0%
00.0% 0.0% 0.0% 0.0% 0.0% 0.0% 0.0% 0.0% 0.0% 10.7% 0.0% 0.0%
0 0 0 0 0 0 0 0 0 3 0 03.3% 3.5% 0.0% 0.0% 0.0% 4.3% 0.0% 0.0% 0.0% 0.0% 0.0% 0.0%
2 2 0 0 0 1 0 0 0 0 0 00.0%
00.0% 0.0%
0 00.0% 55.6% 100.0% 50.0% 0.0% 0.0% 0.0% 50.0% 0.0%
0 5 1 3 0 0 0 1 0100.0%
1
0.0% 0.0% 100.0% 100.0% 0.0% 0.0% 0.0%0 0 4 1 0 0 0
9.1% 0.0% 0.0% 0.0% 0.0% 0.0% 0.0% 0.0% 0.0%1 0 0 0 0 0 0 0 0
0.0%0
0.0%0
1 In 2012 and 2013, FSIS did not sample products for Salmonella because in prior years the percent of pork carcass samples positive for Salmonella was consistently low2 Sulfamethoxazole was tested from 1996-2003 and was replaced by sulfisoxazole in 2004
HACCP
Cecal (Market Hogs)
Cecal (Sows)
Swin
e
Retail
HACCP
Cat
tle
Retail
Cecal (Beef)
Cecal (Dairy)
Turk
eys
Retail
HACCP
Cecal
HACCP
Cecal (Market Hogs)
Cecal (Sows)
Swin
e
Retail
Humans
Chi
cken
s
Retail
HACCP
Cecal
HACCP
Cat
tle
Retail
Cecal (Beef)
Cecal (Dairy)
Turk
eys
Retail
HACCP
Cecal
HACCP
Cecal
Retail
Cecal (Market Hogs)
Cecal (Sows)
Turk
eys
Retail
HACCP
Cecal
Humans
Chi
cken
s
Retail
HACCP
Cat
tle
Retail
Cecal (Beef)
Cecal (Dairy)
HACCP
Swin
e
Cephems HumansC
hick
ens
Retail
Cecal
Chi
cken
sTu
rkey
sC
attle
Swin
e
HACCP
95
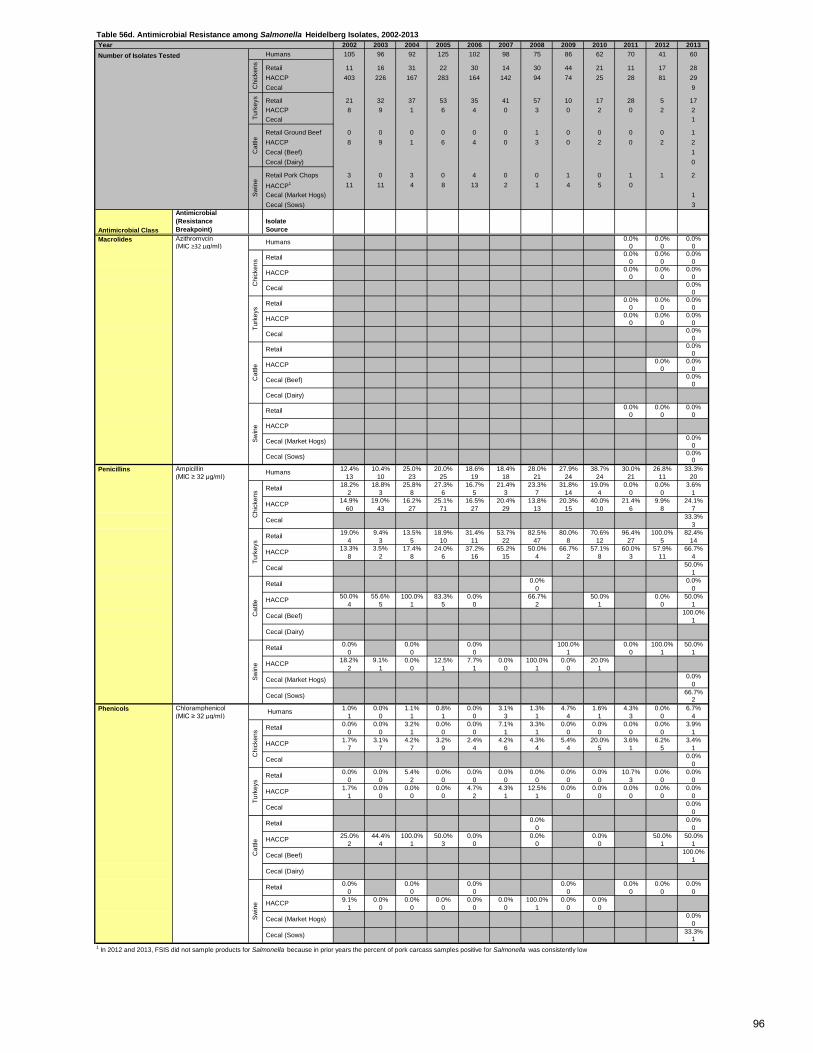
Table 56d. Antimicrobial Resistance among Salmonella Heidelberg Isolates, 2002-2013 Year 2002 2003 2004 2005 2006 2007 2008 2009 2010 2011 2012 2013 Number of Isolates Tested Humans 105 96 92 125 102 98 75 86 62 70 41 60
Retail 11 16 31 22 30 14 30 44 21 11 17 28 HACCP 403 226 167 283 164 142 94 74 25 28 81 29 Cecal 9
Retail 21 32 37 53 35 41 57 10 17 28 5 17 HACCP 8 9 1 6 4 0 3 0 2 0 2 2 Cecal 1
Retail Ground Beef 0 0 0 0 0 0 1 0 0 0 0 1 HACCP 8 9 1 6 4 0 3 0 2 0 2 2 Cecal (Beef) 1 Cecal (Dairy) 0
Retail Pork Chops 3 0 3 0 4 0 0 1 0 1 1 2 HACCP1 11 11 4 8 13 2 1 4 5 0 Cecal (Market Hogs) 1 Cecal (Sows) 3
Antimicrobial Class
Antimicrobial (Resistance Breakpoint)
Isolate Source
Azithromycin 0.0% 0.0% 0.0% (MIC ≥32 µg/ml) 0 0 0
0.0% 0.0% 0.0%0 0 0
0.0% 0.0% 0.0%0 0 0
0.0%0
0.0% 0.0% 0.0%0 0 0
0.0% 0.0% 0.0%0 0 0
0.0%0
0.0%0
0.0% 0.0%0 0
0.0%0
0.0% 0.0% 0.0%0 0 0
0.0%0
0.0%0
Ampicillin 12.4% 10.4% 25.0% 20.0% 18.6% 18.4% 28.0% 27.9% 38.7% 30.0% 26.8% 33.3% (MIC ≥ 32 µg/ml) 13 10 23 25 19 18 21 24 24 21 11 20
18.2% 18.8% 25.8% 27.3% 16.7% 21.4% 23.3% 31.8% 19.0% 0.0% 0.0% 3.6%2 3 8 6 5 3 7 14 4 0 0 1
14.9% 19.0% 16.2% 25.1% 16.5% 20.4% 13.8% 20.3% 40.0% 21.4% 9.9% 24.1%60 43 27 71 27 29 13 15 10 6 8 7
33.3%3
19.0% 9.4% 13.5% 18.9% 31.4% 53.7% 82.5% 80.0% 70.6% 96.4% 100.0% 82.4%4 3 5 10 11 22 47 8 12 27 5 14
13.3% 3.5% 17.4% 24.0% 37.2% 65.2% 50.0% 66.7% 57.1% 60.0% 57.9% 66.7%8 2 8 6 16 15 4 2 8 3 11 4
50.0%1
0.0% 0.0%0 0
50.0% 55.6% 100.0% 83.3% 0.0% 66.7% 50.0% 0.0% 50.0%4 5 1 5 0 2 1 0 1
100.0%1
0.0% 0.0% 0.0% 100.0% 0.0% 100.0% 50.0%0 0 0 1 0 1 1
18.2% 9.1% 0.0% 12.5% 7.7% 0.0% 100.0% 0.0% 20.0%2 1 0 1 1 0 1 0 1
0.0%0
66.7%2
Chloramphenicol 1.0% 0.0% 1.1% 0.8% 0.0% 3.1% 1.3% 4.7% 1.6% 4.3% 0.0% 6.7% (MIC ≥ 32 µg/ml) 1 0 1 1 0 3 1 4 1 3 0 4
0.0% 0.0% 3.2% 0.0% 0.0% 7.1% 3.3% 0.0% 0.0% 0.0% 0.0% 3.9%0 0 1 0 0 1 1 0 0 0 0 1
1.7% 3.1% 4.2% 3.2% 2.4% 4.2% 4.3% 5.4% 20.0% 3.6% 6.2% 3.4%7 7 7 9 4 6 4 4 5 1 5 1
0.0%0
0.0% 0.0% 5.4% 0.0% 0.0% 0.0% 0.0% 0.0% 0.0% 10.7% 0.0% 0.0%0 0 2 0 0 0 0 0 0 3 0 0
1.7% 0.0% 0.0% 0.0% 4.7% 4.3% 12.5% 0.0% 0.0% 0.0% 0.0% 0.0%1 0 0 0 2 1 1 0 0 0 0 0
0.0%0
0.0% 0.0%0 0
25.0% 44.4% 100.0% 50.0% 0.0% 0.0% 0.0% 50.0% 50.0%2 4 1 3 0 0 0 1 1
100.0%1
0.0% 0.0% 0.0% 0.0% 0.0% 0.0% 0.0%0 0 0 0 0 0 0
9.1% 0.0% 0.0% 0.0% 0.0% 0.0% 100.0% 0.0% 0.0%1 0 0 0 0 0 1 0 0
0.0%0
33.3%1
1 In 2012 and 2013, FSIS did not sample products for Salmonella because in prior years the percent of pork carcass samples positive for Salmonella was consistently low
Swin
e
Retail
HACCP
Cecal (Market Hogs)
Cecal (Sows)
HACCP
Cat
tle
Retail
Cecal (Beef)
Cecal (Dairy)
Turk
eys
Retail
HACCP
Cecal
HACCP
Phenicols Humans
Chi
cken
s Retail
Cecal
Swin
e
Retail
HACCP
Cecal (Market Hogs)
Cecal (Sows)
HACCP
Cat
tle
Retail
Cecal (Beef)
Cecal (Dairy)
Turk
eys
Retail
HACCP
Cecal
HACCP
Penicillins Humans
Chi
cken
s Retail
Cecal
Chi
cken
sSw
ine
Retail
HACCP
Cecal (Market Hogs)
Cecal (Sows)
Cat
tle
Retail
HACCP
Turk
eys
Retail
HACCP
Cecal
Cecal (Dairy)
HACCP
Cecal
Retail
Cecal (Beef)
Macrolides Humans
Chi
cken
sTu
rkey
sC
attle
Swin
e
96
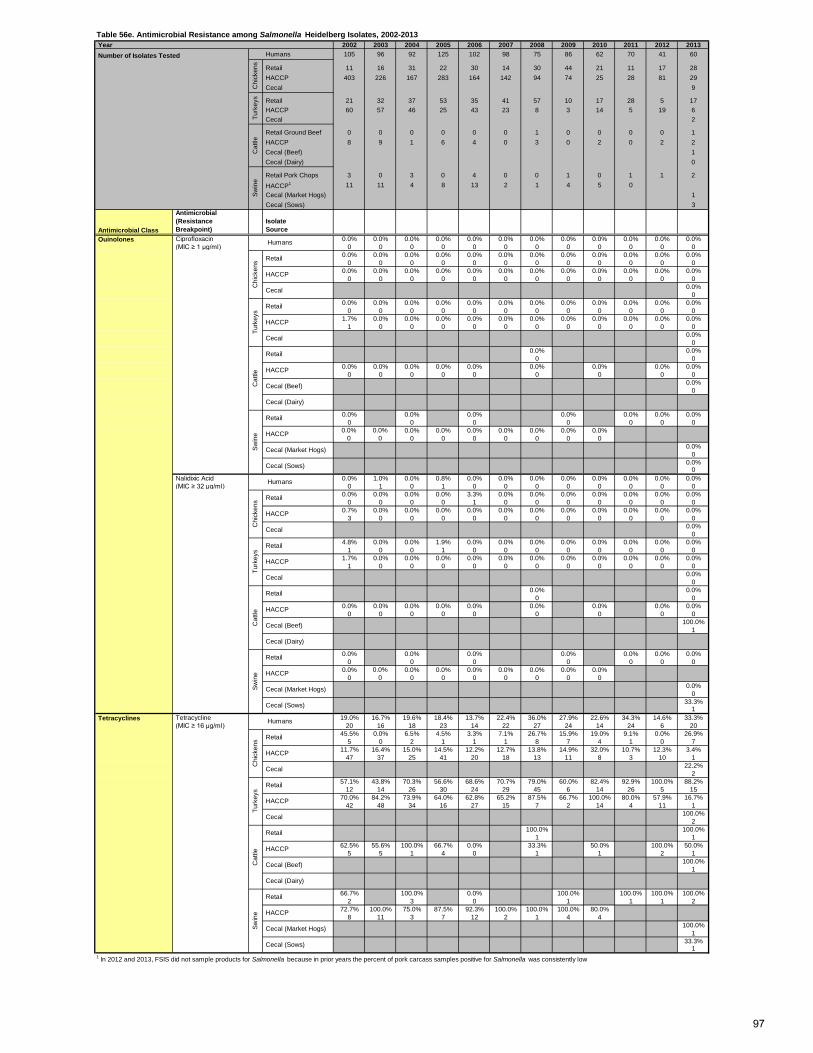
Table 56e. Antimicrobial Resistance among Salmonella Heidelberg Isolates, 2002-2013 Year 2002 2003 2004 2005 2006 2007 2008 2009 2010 2011 2012 2013 Number of Isolates Tested Humans 105 96 92 125 102 98 75 86 62 70 41 60
Retail 11 16 31 22 30 14 30 44 21 11 17 28 HACCP 403 226 167 283 164 142 94 74 25 28 81 29 Cecal 9
Retail 21 32 37 53 35 41 57 10 17 28 5 17 HACCP 60 57 46 25 43 23 8 3 14 5 19 6 Cecal 2
Retail Ground Beef 0 0 0 0 0 0 1 0 0 0 0 1 HACCP 8 9 1 6 4 0 3 0 2 0 2 2 Cecal (Beef) 1 Cecal (Dairy) 0
Retail Pork Chops 3 0 3 0 4 0 0 1 0 1 1 2 HACCP1 11 11 4 8 13 2 1 4 5 0 Cecal (Market Hogs) 1 Cecal (Sows) 3
Antimicrobial Class
Antimicrobial (Resistance Breakpoint)
Isolate Source
Quinolones Ciprofloxacin 0.0% 0.0% 0.0% 0.0% 0.0% 0.0% 0.0% 0.0% 0.0% 0.0% 0.0% 0.0% (MIC ≥ 1 µg/ml) 0 0 0 0 0 0 0 0 0 0 0 0
0.0% 0.0% 0.0% 0.0% 0.0% 0.0% 0.0% 0.0% 0.0% 0.0% 0.0% 0.0%0 0 0 0 0 0 0 0 0 0 0 0
0.0% 0.0% 0.0% 0.0% 0.0% 0.0% 0.0% 0.0% 0.0% 0.0% 0.0% 0.0%0 0 0 0 0 0 0 0 0 0 0 0
0.0%0
0.0% 0.0% 0.0% 0.0% 0.0% 0.0% 0.0% 0.0% 0.0% 0.0% 0.0% 0.0%0 0 0 0 0 0 0 0 0 0 0 0
1.7% 0.0% 0.0% 0.0% 0.0% 0.0% 0.0% 0.0% 0.0% 0.0% 0.0% 0.0%1 0 0 0 0 0 0 0 0 0 0 0
0.0%0
0.0% 0.0%0 0
0.0% 0.0% 0.0% 0.0% 0.0% 0.0% 0.0% 0.0% 0.0%0 0 0 0 0 0 0 0 0
0.0%0
0.0% 0.0% 0.0% 0.0% 0.0% 0.0% 0.0%0 0 0 0 0 0 0
0.0% 0.0% 0.0% 0.0% 0.0% 0.0% 0.0% 0.0% 0.0%0 0 0 0 0 0 0 0 0
0.0%0
0.0%0
Nalidixic Acid 0.0% 1.0% 0.0% 0.8% 0.0% 0.0% 0.0% 0.0% 0.0% 0.0% 0.0% 0.0% (MIC ≥ 32 µg/ml) 0 1 0 1 0 0 0 0 0 0 0 0
0.0% 0.0% 0.0% 0.0% 3.3% 0.0% 0.0% 0.0% 0.0% 0.0% 0.0% 0.0%0 0 0 0 1 0 0 0 0 0 0 0
0.7% 0.0% 0.0% 0.0% 0.0% 0.0% 0.0% 0.0% 0.0% 0.0% 0.0% 0.0%3 0 0 0 0 0 0 0 0 0 0 0
0.0%0
4.8% 0.0% 0.0% 1.9% 0.0% 0.0% 0.0% 0.0% 0.0% 0.0% 0.0% 0.0%1 0 0 1 0 0 0 0 0 0 0 0
1.7% 0.0% 0.0% 0.0% 0.0% 0.0% 0.0% 0.0% 0.0% 0.0% 0.0% 0.0%1 0 0 0 0 0 0 0 0 0 0 0
0.0%0
0.0% 0.0%0 0
0.0% 0.0% 0.0% 0.0% 0.0% 0.0% 0.0% 0.0% 0.0%0 0 0 0 0 0 0 0 0
100.0%1
0.0% 0.0% 0.0% 0.0% 0.0% 0.0% 0.0%0 0 0 0 0 0 0
0.0% 0.0% 0.0% 0.0% 0.0% 0.0% 0.0% 0.0% 0.0%0 0 0 0 0 0 0 0 0
0.0%0
33.3%1
Tetracycline 19.0% 16.7% 19.6% 18.4% 13.7% 22.4% 36.0% 27.9% 22.6% 34.3% 14.6% 33.3% (MIC ≥ 16 µg/ml) 20 16 18 23 14 22 27 24 14 24 6 20
45.5% 0.0% 6.5% 4.5% 3.3% 7.1% 26.7% 15.9% 19.0% 9.1% 0.0% 26.9%5 0 2 1 1 1 8 7 4 1 0 7
11.7% 16.4% 15.0% 14.5% 12.2% 12.7% 13.8% 14.9% 32.0% 10.7% 12.3% 3.4%47 37 25 41 20 18 13 11 8 3 10 1
22.2%2
57.1% 43.8% 70.3% 56.6% 68.6% 70.7% 79.0% 60.0% 82.4% 92.9% 100.0% 88.2%12 14 26 30 24 29 45 6 14 26 5 15
70.0% 84.2% 73.9% 64.0% 62.8% 65.2% 87.5% 66.7% 100.0% 80.0% 57.9% 16.7%42 48 34 16 27 15 7 2 14 4 11 1
100.0%2
100.0% 100.0%1 1
62.5% 55.6% 100.0% 66.7% 0.0% 33.3% 50.0% 100.0% 50.0%5 5 1 4 0 1 1 2 1
100.0%1
66.7% 100.0% 0.0% 100.0% 100.0% 100.0% 100.0%2 3 0 1 1 1 2
72.7% 100.0% 75.0% 87.5% 92.3% 100.0% 100.0% 100.0% 80.0%8 11 3 7 12 2 1 4 4
100.0%1
33.3%1
1 In 2012 and 2013, FSIS did not sample products for Salmonella because in prior years the percent of pork carcass samples positive for Salmonella was consistently low
Swin
e
Retail
HACCP
Cecal (Market Hogs)
Cecal (Sows)
HACCP
Cecal (Beef)Cat
tle
Retail
Turk
eys
Retail
HACCP
Cecal (Dairy)
Cecal
HACCP
Tetracyclines Humans
Chi
cken
s Retail
Cecal
Cecal (Dairy)
Swin
e
Retail
HACCP
Cecal (Market Hogs)
Cecal (Sows)
Cat
tle HACCP
Cecal (Beef)
Retail
Cecal
Turk
eys
Retail
HACCP
Cecal
Humans
Chi
cken
s Retail
Swin
e
Retail
HACCP
Cecal (Market Hogs)
Cecal (Sows)
HACCP
Cat
tle
Retail
Turk
eys
Retail
HACCP
Cecal
Chi
cken
s
HACCP
Cecal (Beef)
Cecal (Dairy)
HACCP
Cecal
RetailC
hick
ens
Turk
eys
Cat
tleSw
ine
Humans
97
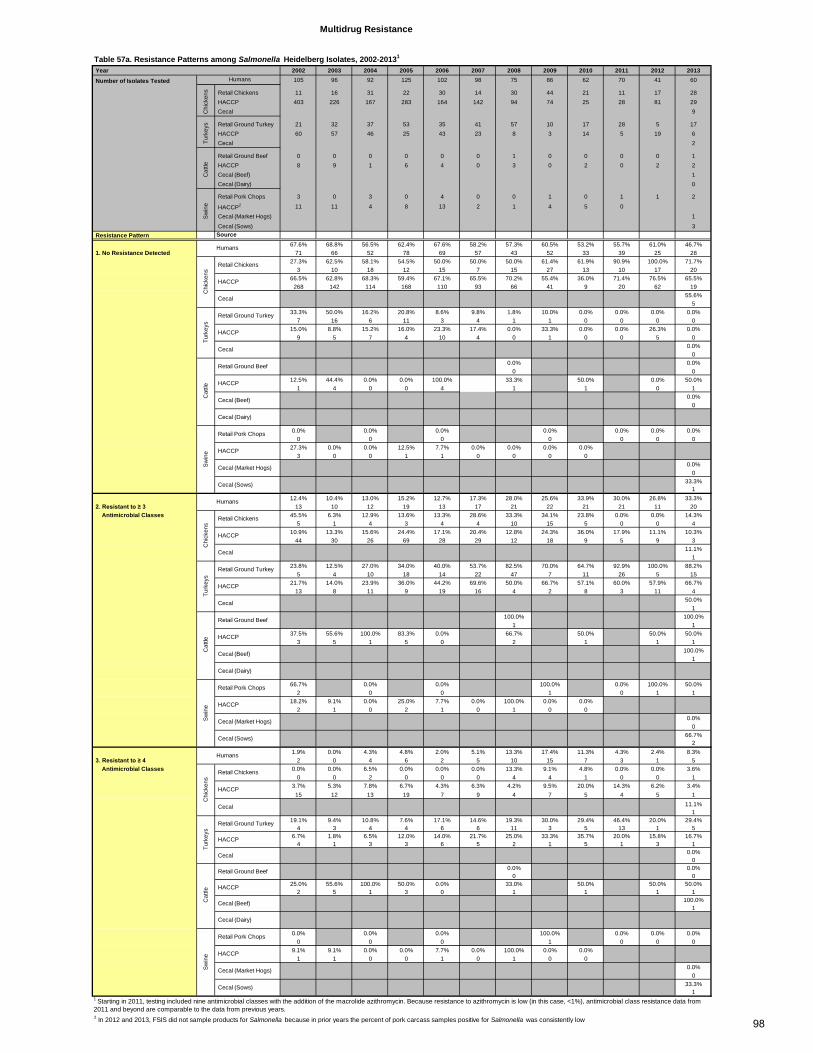
Table 57a. Resistance Patterns among Salmonella Heidelberg Isolates, 2002-20131
Year 2002 2003 2004 2005 2006 2007 2008 2009 2010 2011 2012 2013
Number of Isolates Tested 105 96 92 125 102 98 75 86 62 70 41 60
Retail Chickens 11 16 31 22 30 14 30 44 21 11 17 28 HACCP 403 226 167 283 164 142 94 74 25 28 81 29 Cecal 9
Retail Ground Turkey 21 32 37 53 35 41 57 10 17 28 5 17 HACCP 60 57 46 25 43 23 8 3 14 5 19 6 Cecal 2
Retail Ground Beef 0 0 0 0 0 0 1 0 0 0 0 1 HACCP 8 9 1 6 4 0 3 0 2 0 2 2 Cecal (Beef) 1 Cecal (Dairy) 0
Retail Pork Chops 3 0 3 0 4 0 0 1 0 1 1 2
HACCP2 11 11 4 8 13 2 1 4 5 0
Cecal (Market Hogs) 1
Cecal (Sows) 3 Resistance Pattern Source
67.6% 68.8% 56.5% 62.4% 67.6% 58.2% 57.3% 60.5% 53.2% 55.7% 61.0% 46.7% 1. No Resistance Detected 71 66 52 78 69 57 43 52 33 39 25 28
27.3% 62.5% 58.1% 54.5% 50.0% 50.0% 50.0% 61.4% 61.9% 90.9% 100.0% 71.7%3 10 18 12 15 7 15 27 13 10 17 20
66.5% 62.8% 68.3% 59.4% 67.1% 65.5% 70.2% 55.4% 36.0% 71.4% 76.5% 65.5%268 142 114 168 110 93 66 41 9 20 62 19
55.6%5
33.3% 50.0% 16.2% 20.8% 8.6% 9.8% 1.8% 10.0% 0.0% 0.0% 0.0% 0.0%7 16 6 11 3 4 1 1 0 0 0 0
15.0% 8.8% 15.2% 16.0% 23.3% 17.4% 0.0% 33.3% 0.0% 0.0% 26.3% 0.0%9 5 7 4 10 4 0 1 0 0 5 0
0.0%0
0.0% 0.0%0 0
12.5% 44.4% 0.0% 0.0% 100.0% 33.3% 50.0% 0.0% 50.0%1 4 0 0 4 1 1 0 1
0.0%0
0.0% 0.0% 0.0% 0.0% 0.0% 0.0% 0.0%0 0 0 0 0 0 0
27.3% 0.0% 0.0% 12.5% 7.7% 0.0% 0.0% 0.0% 0.0%3 0 0 1 1 0 0 0 0
0.0%0
33.3%1
12.4% 10.4% 13.0% 15.2% 12.7% 17.3% 28.0% 25.6% 33.9% 30.0% 26.8% 33.3% 2. Resistant to ≥ 3 13 10 12 19 13 17 21 22 21 21 11 20 Antimicrobial Classes 45.5% 6.3% 12.9% 13.6% 13.3% 28.6% 33.3% 34.1% 23.8% 0.0% 0.0% 14.3%
5 1 4 3 4 4 10 15 5 0 0 410.9% 13.3% 15.6% 24.4% 17.1% 20.4% 12.8% 24.3% 36.0% 17.9% 11.1% 10.3%
44 30 26 69 28 29 12 18 9 5 9 311.1%
123.8% 12.5% 27.0% 34.0% 40.0% 53.7% 82.5% 70.0% 64.7% 92.9% 100.0% 88.2%
5 4 10 18 14 22 47 7 11 26 5 1521.7% 14.0% 23.9% 36.0% 44.2% 69.6% 50.0% 66.7% 57.1% 60.0% 57.9% 66.7%
13 8 11 9 19 16 4 2 8 3 11 450.0%
1100.0% 100.0%
1 137.5% 55.6% 100.0% 83.3% 0.0% 66.7% 50.0% 50.0% 50.0%
3 5 1 5 0 2 1 1 1100.0%
1
66.7% 0.0% 0.0% 100.0% 0.0% 100.0% 50.0%2 0 0 1 0 1 1
18.2% 9.1% 0.0% 25.0% 7.7% 0.0% 100.0% 0.0% 0.0%2 1 0 2 1 0 1 0 0
0.0%0
66.7%2
1.9% 0.0% 4.3% 4.8% 2.0% 5.1% 13.3% 17.4% 11.3% 4.3% 2.4% 8.3% 3. Resistant to ≥ 4 2 0 4 6 2 5 10 15 7 3 1 5 Antimicrobial Classes 0.0% 0.0% 6.5% 0.0% 0.0% 0.0% 13.3% 9.1% 4.8% 0.0% 0.0% 3.6%
0 0 2 0 0 0 4 4 1 0 0 13.7% 5.3% 7.8% 6.7% 4.3% 6.3% 4.2% 9.5% 20.0% 14.3% 6.2% 3.4%
15 12 13 19 7 9 4 7 5 4 5 111.1%
119.1% 9.4% 10.8% 7.6% 17.1% 14.6% 19.3% 30.0% 29.4% 46.4% 20.0% 29.4%
4 3 4 4 6 6 11 3 5 13 1 56.7% 1.8% 6.5% 12.0% 14.0% 21.7% 25.0% 33.3% 35.7% 20.0% 15.8% 16.7%
4 1 3 3 6 5 2 1 5 1 3 10.0%
00.0% 0.0%
0 025.0% 55.6% 100.0% 50.0% 0.0% 33.0% 50.0% 50.0% 50.0%
2 5 1 3 0 1 1 1 1100.0%
1
0.0% 0.0% 0.0% 100.0% 0.0% 0.0% 0.0%0 0 0 1 0 0 0
9.1% 9.1% 0.0% 0.0% 7.7% 0.0% 100.0% 0.0% 0.0%1 1 0 0 1 0 1 0 0
0.0%0
33.3%1
2 In 2012 and 2013, FSIS did not sample products for Salmonella because in prior years the percent of pork carcass samples positive for Salmonella was consistently low
Sw
ine
Humans
Chi
cken
s
Retail Chickens
HACCP
Cecal
Multidrug Resistance
Humans
Chi
cken
sTu
rkey
sC
attle
Turk
eys
Retail Ground Turkey
HACCP
Cecal
Cat
tle
Retail Ground Beef
HACCP
Cecal (Beef)
Cecal (Dairy)
Chi
cken
s
Retail Chickens
HACCP
Cecal
Turk
eys
Retail Ground Turkey
HACCP
Cecal
Sw
ine
Retail Pork Chops
HACCP
Cecal (Market Hogs)
Cecal (Sows)
Humans
Cat
tle
Retail Ground Beef
HACCP
Cecal (Beef)
Cecal (Dairy)
Sw
ine
Retail Pork Chops
HACCP
Cecal (Market Hogs)
Cecal (Sows)
Humans
Chi
cken
s
Retail Chickens
HACCP
Cecal
Turk
eys
Retail Ground Turkey
HACCP
Cecal
Cat
tle
Retail Ground Beef
HACCP
Cecal (Beef)
Cecal (Dairy)
Sw
ine
Retail Pork Chops
HACCP
Cecal (Market Hogs)
Cecal (Sows)
1 Starting in 2011, testing included nine antimicrobial classes with the addition of the macrolide azithromycin. Because resistance to azithromycin is low (in this case, <1%), antimicrobial class resistance data from 2011 and beyond are comparable to the data from previous years.
98
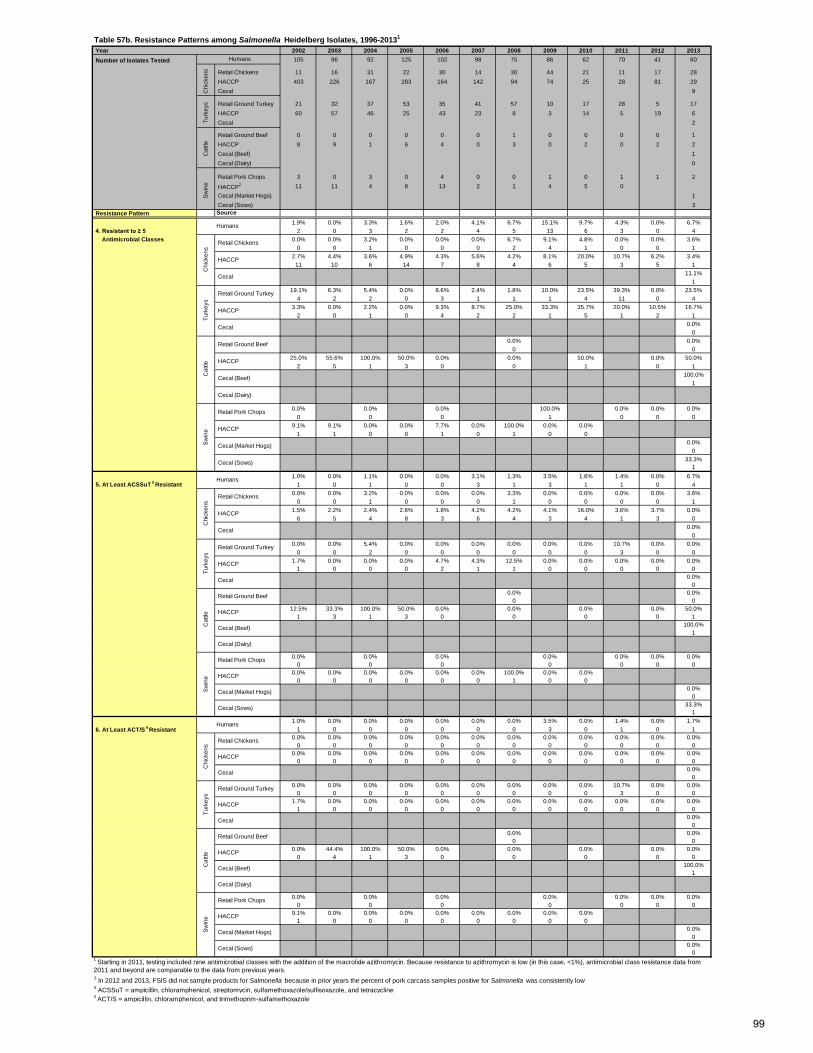
Table 57b. Resistance Patterns among Salmonella Heidelberg Isolates, 1996-20131
Year 2002 2003 2004 2005 2006 2007 2008 2009 2010 2011 2012 2013 Number of Isolates Tested 105 96 92 125 102 98 75 86 62 70 41 60
Retail Chickens 11 16 31 22 30 14 30 44 21 11 17 28 HACCP 403 226 167 283 164 142 94 74 25 28 81 29 Cecal 9
Retail Ground Turkey 21 32 37 53 35 41 57 10 17 28 5 17 HACCP 60 57 46 25 43 23 8 3 14 5 19 6 Cecal 2
Retail Ground Beef 0 0 0 0 0 0 1 0 0 0 0 1 HACCP 8 9 1 6 4 0 3 0 2 0 2 2 Cecal (Beef) 1 Cecal (Dairy) 0
Retail Pork Chops 3 0 3 0 4 0 0 1 0 1 1 2
HACCP2 11 11 4 8 13 2 1 4 5 0 Cecal (Market Hogs) 1 Cecal (Sows) 3
Resistance Pattern Source1.9% 0.0% 3.3% 1.6% 2.0% 4.1% 6.7% 15.1% 9.7% 4.3% 0.0% 6.7%
4. Resistant to ≥ 5 2 0 3 2 2 4 5 13 6 3 0 4 Antimicrobial Classes 0.0% 0.0% 3.2% 0.0% 0.0% 0.0% 6.7% 9.1% 4.8% 0.0% 0.0% 3.6%
0 0 1 0 0 0 2 4 1 0 0 12.7% 4.4% 3.6% 4.9% 4.3% 5.6% 4.2% 8.1% 20.0% 10.7% 6.2% 3.4%
11 10 6 14 7 8 4 6 5 3 5 111.1%
119.1% 6.3% 5.4% 0.0% 8.6% 2.4% 1.8% 10.0% 23.5% 39.3% 0.0% 23.5%
4 2 2 0 3 1 1 1 4 11 0 43.3% 0.0% 2.2% 0.0% 9.3% 8.7% 25.0% 33.3% 35.7% 20.0% 10.5% 16.7%
2 0 1 0 4 2 2 1 5 1 2 10.0%
00.0% 0.0%
0 025.0% 55.6% 100.0% 50.0% 0.0% 0.0% 50.0% 0.0% 50.0%
2 5 1 3 0 0 1 0 1100.0%
1
0.0% 0.0% 0.0% 100.0% 0.0% 0.0% 0.0%0 0 0 1 0 0 0
9.1% 9.1% 0.0% 0.0% 7.7% 0.0% 100.0% 0.0% 0.0%1 1 0 0 1 0 1 0 0
0.0%0
33.3%1
1.0% 0.0% 1.1% 0.0% 0.0% 3.1% 1.3% 3.5% 1.6% 1.4% 0.0% 6.7% 5. At Least ACSSuT
3 Resistant 1 0 1 0 0 3 1 3 1 1 0 40.0% 0.0% 3.2% 0.0% 0.0% 0.0% 3.3% 0.0% 0.0% 0.0% 0.0% 3.6%
0 0 1 0 0 0 1 0 0 0 0 11.5% 2.2% 2.4% 2.8% 1.8% 4.2% 4.2% 4.1% 16.0% 3.6% 3.7% 0.0%
6 5 4 8 3 6 4 3 4 1 3 00.0%
00.0% 0.0% 5.4% 0.0% 0.0% 0.0% 0.0% 0.0% 0.0% 10.7% 0.0% 0.0%
0 0 2 0 0 0 0 0 0 3 0 01.7% 0.0% 0.0% 0.0% 4.7% 4.3% 12.5% 0.0% 0.0% 0.0% 0.0% 0.0%
1 0 0 0 2 1 1 0 0 0 0 00.0%
00.0% 0.0%
0 012.5% 33.3% 100.0% 50.0% 0.0% 0.0% 0.0% 0.0% 50.0%
1 3 1 3 0 0 0 0 1100.0%
1
0.0% 0.0% 0.0% 0.0% 0.0% 0.0% 0.0%0 0 0 0 0 0 0
0.0% 0.0% 0.0% 0.0% 0.0% 0.0% 100.0% 0.0% 0.0%0 0 0 0 0 0 1 0 0
0.0%0
33.3%1
1.0% 0.0% 0.0% 0.0% 0.0% 0.0% 0.0% 3.5% 0.0% 1.4% 0.0% 1.7% 6. At Least ACT/S
4 Resistant 1 0 0 0 0 0 0 3 0 1 0 10.0% 0.0% 0.0% 0.0% 0.0% 0.0% 0.0% 0.0% 0.0% 0.0% 0.0% 0.0%
0 0 0 0 0 0 0 0 0 0 0 00.0% 0.0% 0.0% 0.0% 0.0% 0.0% 0.0% 0.0% 0.0% 0.0% 0.0% 0.0%
0 0 0 0 0 0 0 0 0 0 0 00.0%
00.0% 0.0% 0.0% 0.0% 0.0% 0.0% 0.0% 0.0% 0.0% 10.7% 0.0% 0.0%
0 0 0 0 0 0 0 0 0 3 0 01.7% 0.0% 0.0% 0.0% 0.0% 0.0% 0.0% 0.0% 0.0% 0.0% 0.0% 0.0%
1 0 0 0 0 0 0 0 0 0 0 00.0%
00.0% 0.0%
0 00.0% 44.4% 100.0% 50.0% 0.0% 0.0% 0.0% 0.0% 0.0%
0 4 1 3 0 0 0 0 0100.0%
1
0.0% 0.0% 0.0% 0.0% 0.0% 0.0% 0.0%0 0 0 0 0 0 0
9.1% 0.0% 0.0% 0.0% 0.0% 0.0% 0.0% 0.0% 0.0%1 0 0 0 0 0 0 0 0
0.0%0
0.0%0
2 In 2012 and 2013, FSIS did not sample products for Salmonella because in prior years the percent of pork carcass samples positive for Salmonella was consistently low3 ACSSuT = ampicillin, chloramphenicol, streptomycin, sulfamethoxazole/sulfisoxazole, and tetracycline4 ACT/S = ampicillin, chloramphenicol, and trimethoprim-sulfamethoxazole
Turk
eys
Retail Ground Turkey
HACCP
Cecal
Cat
tleS
win
e
Humans
Chi
cken
s
Retail Chickens
HACCP
Cecal
Humans
Chi
cken
sTu
rkey
s C
attle
Retail Ground Beef
HACCP
Cecal (Beef)
Cecal (Dairy)
Sw
ine
Retail Pork Chops
HACCP
Cecal (Market Hogs)
Cecal (Sows)
Humans
Chi
cken
s
Retail Chickens
HACCP
Cecal
Turk
eys
Retail Ground Turkey
HACCP
Cecal
Cat
tle
Retail Ground Beef
HACCP
Cecal (Beef)
Cecal (Dairy)
Sw
ine
Retail Pork Chops
HACCP
Cecal (Market Hogs)
Sw
ine
Retail Pork Chops
HACCP
Cecal (Market Hogs)
Cecal (Sows)
Humans
Chi
cken
s
Retail Chickens
HACCP
Cecal
Turk
eys
Retail Ground Turkey
HACCP
Cecal
Cat
tle
Retail Ground Beef
HACCP
Cecal (Beef)
Cecal (Dairy)
Cecal (Sows)
1 Starting in 2011, testing included nine antimicrobial classes with the addition of the macrolide azithromycin. Because resistance to azithromycin is low (in this case, <1%), antimicrobial class resistance data from 2011 and beyond are comparable to the data from previous years.
99

Table 57c. Resistance Patterns among Salmonella Heidelberg Isolates, 2002-2013 Year 2002 2003 2004 2005 2006 2007 2008 2009 2010 2011 2012 2013 Number of Isolates Tested 105 96 92 125 102 98 75 86 62 70 41 60
Retail Chickens 11 16 31 22 30 14 30 44 21 11 17 28 HACCP 403 226 167 283 164 142 94 74 25 28 81 29 Cecal 9
Retail Ground Turkey 21 32 37 53 35 41 57 10 17 28 5 17 HACCP 60 57 46 25 43 23 8 3 14 5 19 6 Cecal 2
Retail Ground Beef 0 0 0 0 0 0 1 0 0 0 0 1 HACCP 8 9 1 6 4 0 3 0 2 0 2 2 Cecal (Beef) 1 Cecal (Dairy) 0
Retail Pork Chops 3 0 3 0 4 0 0 1 0 1 1 2 HACCP1 11 11 4 8 13 2 1 4 5 0 Cecal (Market Hogs) 1 Cecal (Sows) 3
Resistance Pattern Source1.0% 0.0% 0.0% 0.0% 0.0% 0.0% 0.0% 1.2% 0.0% 1.4% 0.0% 1.7%
7. At Least ACSSuTAuCx 2 1 0 0 0 0 0 0 1 0 1 0 1 Resistant 0.0% 0.0% 3.2% 0.0% 0.0% 0.0% 0.0% 0.0% 0.0% 0.0% 0.0% 0.0%
0 0 1 0 0 0 0 0 0 0 0 01.5% 2.2% 2.4% 2.8% 1.8% 4.2% 2.1% 4.1% 16.0% 3.6% 2.5% 0.0%
6 5 4 8 3 6 2 3 4 1 2 00.0%
00.0% 0.0% 5.4% 0.0% 0.0% 0.0% 0.0% 0.0% 0.0% 10.7% 0.0% 0.0%
0 0 2 0 0 0 0 0 0 3 0 01.7% 0.0% 0.0% 0.0% 4.7% 4.3% 0.0% 0.0% 0.0% 0.0% 0.0% 0.0%
1 0 0 0 2 1 0 0 0 0 0 00.0%
00.0% 0.0%
0 012.5% 33.3% 100.0% 50.0% 0.0% 0.0% 0.0% 0.0% 50.0%
1 3 1 3 0 0 0 0 1100.0%
1
0.0% 0.0% 0.0% 0.0% 0.0% 0.0% 0.0%0 0 0 0 0 0 0
0.0% 0.0% 0.0% 0.0% 0.0% 0.0% 0.0% 0.0% 0.0%0 0 0 0 0 0 0 0 0
0.0%0
33.3%1
0.0% 0.0% 0.0% 0.0% 0.0% 0.0% 0.0% 0.0% 0.0% 0.0% 0.0% 0.0% 8. At Least Ceftriaxone and 0 0 0 0 0 0 0 0 0 0 0 0 Nalidixic Acid Resistant 0.0% 0.0% 0.0% 0.0% 0.0% 0.0% 0.0% 0.0% 0.0% 0.0% 0.0% 0.0%
0 0 0 0 0 0 0 0 0 0 0 00.70% 0.0% 0.0% 0.0% 0.0% 0.0% 0.0% 0.0% 0.0% 0.0% 0.0% 0.0%
3 0 0 0 0 0 0 0 0 0 0 00.0%
00.0% 0.0% 0.0% 0.0% 0.0% 0.0% 0.0% 0.0% 0.0% 0.0% 0.0% 0.0%
0 0 0 0 0 0 0 0 0 0 0 01.7% 0.0% 0.0% 0.0% 0.0% 0.0% 0.0% 0.0% 0.0% 0.0% 0.0% 0.0%
1 0 0 0 0 0 0 0 0 0 0 00.0%
00.0% 0.0%
0 00.0% 0.0% 0.0% 0.0% 0.0% 0.0% 0.0% 0.0% 0.0%
0 0 0 0 0 0 0 0 0100.0%
1
0.0% 0.0% 0.0% 0.0% 0.0% 0.0% 0.0%0 0 0 0 0 0 0
0.0% 0.0% 0.0% 0.0% 0.0% 0.0% 0.0% 0.0% 0.0%0 0 0 0 0 0 0 0 0
0.0%0
33.3%1
1 In 2012 and 2013, FSIS did not sample products for Salmonella because in prior years the percent of pork carcass samples positive for Salmonella was consistently low2 ACSSuTAuCx = ACSSuT, amoxicillin-clavulanic acid, and ceftriaxone
Sw
ine
Retail Pork Chops
HACCP
Cecal (Market Hogs)
Cecal (Sows)
Humans
Chi
cken
s
Retail Chickens
HACCP
Cecal
Turk
eys
Retail Ground Turkey
HACCP
Cecal
Cat
tle
Retail Ground Beef
HACCP
Cecal (Beef)
Cecal (Dairy)
Sw
ine
Retail Pork Chops
HACCP
Cecal (Market Hogs)
Cecal (Sows)
Retail Chickens
HACCP
Cecal
Turk
eys
Retail Ground Turkey
HACCP
Cecal
Cat
tleS
win
eHumans
Chi
cken
s C
attle
Retail Ground Beef
HACCP
Cecal (Beef)
Cecal (Dairy)
Humans
Chi
cken
sTu
rkey
s
100
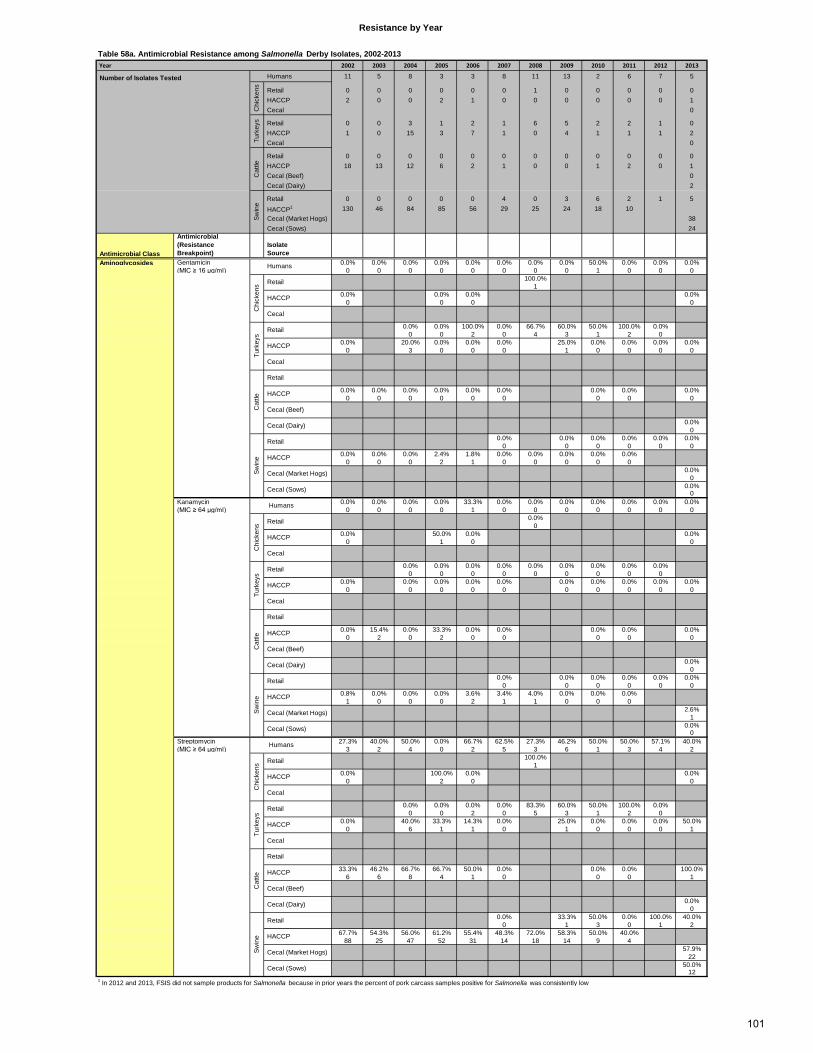
Table 58a. Antimicrobial Resistance among Salmonella Derby Isolates, 2002-2013 Year 2002 2003 2004 2005 2006 2007 2008 2009 2010 2011 2012 2013
Humans 11 5 8 3 3 8 11 13 2 6 7 5
Retail 0 0 0 0 0 0 1 0 0 0 0 0 HACCP 2 0 0 2 1 0 0 0 0 0 0 1 Cecal 0
Retail 0 0 3 1 2 1 6 5 2 2 1 0 HACCP 1 0 15 3 7 1 0 4 1 1 1 2 Cecal 0
Retail 0 0 0 0 0 0 0 0 0 0 0 0 HACCP 18 13 12 6 2 1 0 0 1 2 0 1 Cecal (Beef) 0 Cecal (Dairy) 2
Retail 0 0 0 0 0 4 0 3 6 2 1 5 HACCP1 130 46 84 85 56 29 25 24 18 10 Cecal (Market Hogs) 38 Cecal (Sows) 24
Antimicrobial Class
Antimicrobial (Resistance Breakpoint)
Isolate Source
Aminoglycosides Gentamicin 0.0% 0.0% 0.0% 0.0% 0.0% 0.0% 0.0% 0.0% 50.0% 0.0% 0.0% 0.0% (MIC ≥ 16 µg/ml) 0 0 0 0 0 0 0 0 1 0 0 0
100.0%1
0.0% 0.0% 0.0% 0.0%0 0 0 0
0.0% 0.0% 100.0% 0.0% 66.7% 60.0% 50.0% 100.0% 0.0%0 0 2 0 4 3 1 2 0
0.0% 20.0% 0.0% 0.0% 0.0% 25.0% 0.0% 0.0% 0.0% 0.0%0 3 0 0 0 1 0 0 0 0
0.0% 0.0% 0.0% 0.0% 0.0% 0.0% 0.0% 0.0% 0.0%0 0 0 0 0 0 0 0 0
0.0%0
0.0% 0.0% 0.0% 0.0% 0.0% 0.0%0 0 0 0 0 0
0.0% 0.0% 0.0% 2.4% 1.8% 0.0% 0.0% 0.0% 0.0% 0.0%0 0 0 2 1 0 0 0 0 0
0.0%0
0.0%0
Kanamycin 0.0% 0.0% 0.0% 0.0% 33.3% 0.0% 0.0% 0.0% 0.0% 0.0% 0.0% 0.0% (MIC ≥ 64 µg/ml) 0 0 0 0 1 0 0 0 0 0 0 0
0.0%0
0.0% 50.0% 0.0% 0.0%0 1 0 0
0.0% 0.0% 0.0% 0.0% 0.0% 0.0% 0.0% 0.0% 0.0%0 0 0 0 0 0 0 0 0
0.0% 0.0% 0.0% 0.0% 0.0% 0.0% 0.0% 0.0% 0.0% 0.0%0 0 0 0 0 0 0 0 0 0
0.0% 15.4% 0.0% 33.3% 0.0% 0.0% 0.0% 0.0% 0.0%0 2 0 2 0 0 0 0 0
0.0%0
0.0% 0.0% 0.0% 0.0% 0.0% 0.0%0 0 0 0 0 0
0.8% 0.0% 0.0% 0.0% 3.6% 3.4% 4.0% 0.0% 0.0% 0.0%1 0 0 0 2 1 1 0 0 0
2.6%1
0.0%0
Streptomycin 27.3% 40.0% 50.0% 0.0% 66.7% 62.5% 27.3% 46.2% 50.0% 50.0% 57.1% 40.0% (MIC ≥ 64 µg/ml) 3 2 4 0 2 5 3 6 1 3 4 2
100.0%1
0.0% 100.0% 0.0% 0.0%0 2 0 0
0.0% 0.0% 0.0% 0.0% 83.3% 60.0% 50.0% 100.0% 0.0%0 0 2 0 5 3 1 2 0
0.0% 40.0% 33.3% 14.3% 0.0% 25.0% 0.0% 0.0% 0.0% 50.0%0 6 1 1 0 1 0 0 0 1
33.3% 46.2% 66.7% 66.7% 50.0% 0.0% 0.0% 0.0% 100.0%6 6 8 4 1 0 0 0 1
0.0%0
0.0% 33.3% 50.0% 0.0% 100.0% 40.0%0 1 3 0 1 2
67.7% 54.3% 56.0% 61.2% 55.4% 48.3% 72.0% 58.3% 50.0% 40.0%88 25 47 52 31 14 18 14 9 4
57.9%22
50.0%12
1 In 2012 and 2013, FSIS did not sample products for Salmonella because in prior years the percent of pork carcass samples positive for Salmonella was consistently low
Resistance by Year
Swin
e
Retail
HACCP
Cecal (Market Hogs)
Cecal (Sows)
Cat
tle
Retail
Cecal (Dairy)
HACCP
Cecal (Beef)
Turk
eys
Retail
HACCP
Cecal
HACCP
Humans
Chi
cken
s Retail
Cecal
Cecal (Dairy)
Swin
e
Retail
HACCP
Cecal (Market Hogs)
Cecal (Sows)
Cat
tle HACCP
Cecal (Beef)
Turk
eys
Retail
HACCP
Cecal
Retail
HACCP
Cecal
Chi
cken
s Retail
Swin
e
Retail
HACCP
Cecal (Market Hogs)
Cecal (Sows)
Cat
tle
Retail
Cecal (Dairy)
Humans
HACCP
Cecal (Beef)
Turk
eys
Retail
HACCP
Cecal
Number of Isolates Tested
Chi
cken
sTu
rkey
sC
attle
HACCP
Swin
e Humans
Chi
cken
s Retail
Cecal
101

Table 58b. Antimicrobial Resistance among Salmonella Derby Isolates, 2002-2013 Year 2002 2003 2004 2005 2006 2007 2008 2009 2010 2011 2012 2013
Number of Isolates Tested Humans 11 5 8 3 3 8 11 13 2 6 7 5
Retail 0 0 0 0 0 0 1 0 0 0 0 0 HACCP 2 0 0 2 1 0 0 0 0 0 0 1 Cecal 0
Retail 0 0 3 1 2 1 6 5 2 2 1 0 HACCP 1 0 15 3 7 1 0 4 1 1 1 2 Cecal 0
Retail 0 0 0 0 0 0 0 0 0 0 0 0 HACCP 18 13 12 6 2 1 0 0 1 2 0 1 Cecal (Beef) 0 Cecal (Dairy) 2
Retail 0 0 0 0 0 4 0 3 6 2 1 5 HACCP1 130 46 84 85 56 29 25 24 18 10 Cecal (Market Hogs) 38 Cecal (Sows) 24
Antimicrobial Class
Antimicrobial (Resistance Breakpoint)
Isolate Source
β-Lactam/β-Lactamase Amoxicillin- 0.0% 0.0% 0.0% 0.0% 0.0% 0.0% 0.0% 7.7% 0.0% 0.0% 14.3% 0.0% Inhibitor Combinations Clavulanic Acid 0 0 0 0 0 0 0 1 0 0 1 0
(MIC ≥ 32 / 16 µg/ml) 0.0%0
0.0% 50.0% 0.0% 0.0%0 1 0 0
66.7% 0.0% 0.0% 0.0% 0.0% 40.0% 0.0% 0.0% 0.0%2 0 0 0 0 2 0 0 0
0.0% 0.0% 0.0% 0.0% 0.0% 25.0% 0.0% 0.0% 0.0% 0.0%0 0 0 0 0 1 0 0 0 0
5.6% 15.4% 0.0% 16.7% 0.0% 0.0% 0.0% 0.0% 0.0%1 2 0 1 0 0 0 0 0
0.0%0
0.0% 0.0% 0.0% 0.0% 0.0% 0.0%0 0 0 0 0 0
1.5% 2.2% 1.2% 0.0% 0.0% 0.0% 8.0% 4.2% 0.0% 0.0%2 1 1 0 0 0 2 1 0 0
0.0%0
0.0%0
Cefoxitin 0.0% 0.0% 0.0% 0.0% 0.0% 0.0% 0.0% 7.7% 0.0% 0.0% 14.3% 0.0% (MIC ≥ 32 µg/ml) 0 0 0 0 0 0 0 1 0 0 1 0
0.0%0
0.0% 50.0% 0.0% 0.0%0 1 0 0
66.7% 0.0% 0.0% 0.0% 0.0% 40.0% 0.0% 0.0% 0.0%2 0 0 0 0 2 0 0 0
0.0% 0.0% 0.0% 0.0% 0.0% 25.0% 0.0% 0.0% 0.0% 0.0%0 0 0 0 0 1 0 0 0 0
5.6% 15.4% 0.0% 16.7% 0.0% 0.0% 0.0% 0.0% 0.0%1 2 0 1 0 0 0 0 0
0.0%0
0.0% 0.0% 0.0% 0.0% 0.0% 0.0%0 0 0 0 0 0
1.5% 2.2% 1.2% 0.0% 0.0% 0.0% 8.0% 4.2% 0.0% 0.0%2 1 1 0 0 0 2 1 0 0
0.0%0
0.0%0
Ceftiofur 0.0% 0.0% 0.0% 0.0% 0.0% 0.0% 0.0% 7.7% 0.0% 0.0% 14.3% 0.0% (MIC ≥ 8 µg/ml) 0 0 0 0 0 0 0 1 0 0 1 0
0.0%0
0.0% 50.0% 0.0% 0.0%0 1 0 0
66.7% 0.0% 0.0% 0.0% 0.0% 40.0% 0.0% 0.0% 0.0%2 0 0 0 0 2 0 0 0
0.0% 0.0% 0.0% 0.0% 0.0% 25.0% 0.0% 0.0% 0.0% 0.0%0 0 0 0 0 1 0 0 0 0
5.6% 15.4% 0.0% 16.7% 0.0% 0.0% 0.0% 0.0% 0.0%1 2 0 1 0 0 0 0 0
0.0%0
0.0% 0.0% 0.0% 0.0% 0.0% 0.0%0 0 0 0 0 0
1.5% 2.2% 1.2% 0.0% 0.0% 0.0% 8.0% 4.2% 0.0% 0.0%2 1 1 0 0 0 2 1 0 0
0.0%0
0.0%0
1 In 2012 and 2013, FSIS did not sample products for Salmonella because in prior years the percent of pork carcass samples positive for Salmonella was consistently low
Cecal (Dairy)
Swin
e
Retail
HACCP
Cecal (Market Hogs)
Cecal (Sows)
Cat
tle HACCP
Cecal (Beef)
Retail
Cecal
Turk
eys
Retail
HACCP
Cecal
Humans
Chi
cken
s Retail
Swin
e
Retail
HACCP
Cecal (Market Hogs)
Cecal (Sows)
HACCP
Cat
tle
Retail
HACCP
Cecal (Beef)
Cecal (Dairy)
HACCP
Cecal (Beef)
Cecal (Dairy)
Turk
eys
Retail
HACCP
Cecal
Chi
cken
s
HACCP
Cecal
Retail
Chi
cken
sC
attle
Retail
Turk
eys
Retail
HACCP
Cecal
Cephems Humans
Swin
e
Retail
HACCP
Cecal (Market Hogs)
Cecal (Sows)
HACCP
Cecal
RetailTu
rkey
sC
attle
Swin
e Humans
Chi
cken
s
102
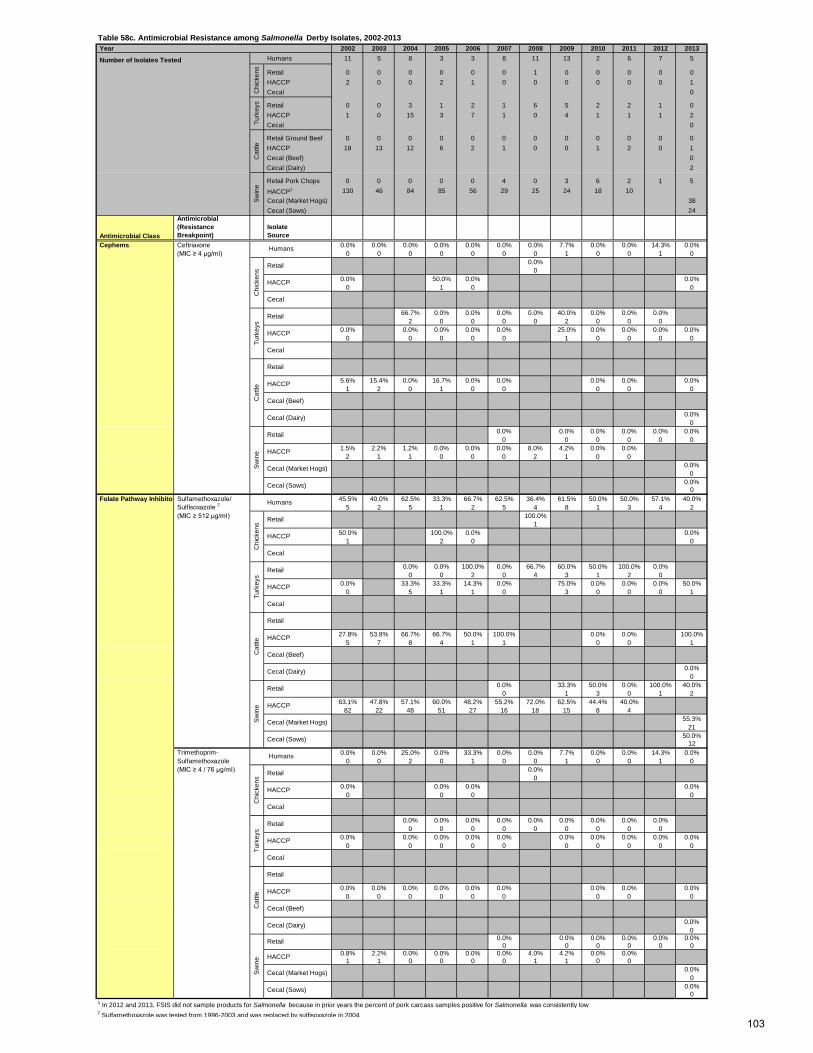
Table 58c. Antimicrobial Resistance among Salmonella Derby Isolates, 2002-2013 Year 2002 2003 2004 2005 2006 2007 2008 2009 2010 2011 2012 2013
Number of Isolates Tested Humans 11 5 8 3 3 8 11 13 2 6 7 5
Retail 0 0 0 0 0 0 1 0 0 0 0 0 HACCP 2 0 0 2 1 0 0 0 0 0 0 1 Cecal 0
Retail 0 0 3 1 2 1 6 5 2 2 1 0 HACCP 1 0 15 3 7 1 0 4 1 1 1 2 Cecal 0
Retail Ground Beef 0 0 0 0 0 0 0 0 0 0 0 0 HACCP 18 13 12 6 2 1 0 0 1 2 0 1 Cecal (Beef) 0 Cecal (Dairy) 2
Retail Pork Chops 0 0 0 0 0 4 0 3 6 2 1 5 HACCP1 130 46 84 85 56 29 25 24 18 10 Cecal (Market Hogs) 38 Cecal (Sows) 24
Antimicrobial Class
Antimicrobial (Resistance Breakpoint)
Isolate Source
Ceftriaxone 0.0% 0.0% 0.0% 0.0% 0.0% 0.0% 0.0% 7.7% 0.0% 0.0% 14.3% 0.0% (MIC ≥ 4 µg/ml) 0 0 0 0 0 0 0 1 0 0 1 0
0.0%0
0.0% 50.0% 0.0% 0.0%0 1 0 0
66.7% 0.0% 0.0% 0.0% 0.0% 40.0% 0.0% 0.0% 0.0%2 0 0 0 0 2 0 0 0
0.0% 0.0% 0.0% 0.0% 0.0% 25.0% 0.0% 0.0% 0.0% 0.0%0 0 0 0 0 1 0 0 0 0
5.6% 15.4% 0.0% 16.7% 0.0% 0.0% 0.0% 0.0% 0.0%1 2 0 1 0 0 0 0 0
0.0%0
0.0% 0.0% 0.0% 0.0% 0.0% 0.0%0 0 0 0 0 0
1.5% 2.2% 1.2% 0.0% 0.0% 0.0% 8.0% 4.2% 0.0% 0.0%2 1 1 0 0 0 2 1 0 0
0.0%0
0.0%0
Folate Pathway Inhibitor Sulfamethoxazole/ 45.5% 40.0% 62.5% 33.3% 66.7% 62.5% 36.4% 61.5% 50.0% 50.0% 57.1% 40.0% Sulfisoxazole 2 5 2 5 1 2 5 4 8 1 3 4 2 (MIC ≥ 512 µg/ml) 100.0%
150.0% 100.0% 0.0% 0.0%
1 2 0 0
0.0% 0.0% 100.0% 0.0% 66.7% 60.0% 50.0% 100.0% 0.0%0 0 2 0 4 3 1 2 0
0.0% 33.3% 33.3% 14.3% 0.0% 75.0% 0.0% 0.0% 0.0% 50.0%0 5 1 1 0 3 0 0 0 1
27.8% 53.8% 66.7% 66.7% 50.0% 100.0% 0.0% 0.0% 100.0%5 7 8 4 1 1 0 0 1
0.0%0
0.0% 33.3% 50.0% 0.0% 100.0% 40.0%0 1 3 0 1 2
63.1% 47.8% 57.1% 60.0% 48.2% 55.2% 72.0% 62.5% 44.4% 40.0%82 22 48 51 27 16 18 15 8 4
55.3%21
50.0%12
Trimethoprim- 0.0% 0.0% 25.0% 0.0% 33.3% 0.0% 0.0% 7.7% 0.0% 0.0% 14.3% 0.0% Sulfamethoxazole 0 0 2 0 1 0 0 1 0 0 1 0 (MIC ≥ 4 / 76 µg/ml) 0.0%
00.0% 0.0% 0.0% 0.0%
0 0 0 0
0.0% 0.0% 0.0% 0.0% 0.0% 0.0% 0.0% 0.0% 0.0%0 0 0 0 0 0 0 0 0
0.0% 0.0% 0.0% 0.0% 0.0% 0.0% 0.0% 0.0% 0.0% 0.0%0 0 0 0 0 0 0 0 0 0
0.0% 0.0% 0.0% 0.0% 0.0% 0.0% 0.0% 0.0% 0.0%0 0 0 0 0 0 0 0 0
0.0%0
0.0% 0.0% 0.0% 0.0% 0.0% 0.0%0 0 0 0 0 0
0.8% 2.2% 0.0% 0.0% 0.0% 0.0% 4.0% 4.2% 0.0% 0.0%1 1 0 0 0 0 1 1 0 0
0.0%0
0.0%0
1 In 2012 and 2013, FSIS did not sample products for Salmonella because in prior years the percent of pork carcass samples positive for Salmonella was consistently low2 Sulfamethoxazole was tested from 1996-2003 and was replaced by sulfisoxazole in 2004
Swin
e
Retail
HACCP
Cecal (Market Hogs)
Cecal (Sows)
Cat
tle
Retail
Cecal (Dairy)
HACCP
Cecal (Beef)
Turk
eys
Retail
HACCP
Cecal
HACCP
Humans
Chi
cken
s
Retail
Cecal
Cecal (Dairy)
Swin
e
Retail
HACCP
Cecal (Market Hogs)
Cecal (Sows)
Cat
tle
HACCP
Cecal (Beef)
Turk
eys
Retail
HACCP
Cecal
Retail
HACCP
Cecal
Chi
cken
s
Retail
Swin
e
Retail
HACCP
Cecal (Market Hogs)
Cecal (Sows)
Cat
tle
Retail
Cecal (Dairy)
Humans
HACCP
Cecal (Beef)
Turk
eys
Retail
HACCP
Cecal
HACCP
Cephems HumansC
hick
ens
Retail
Cecal
Cat
tleSw
ine
Chi
cken
sTu
rkey
s
103
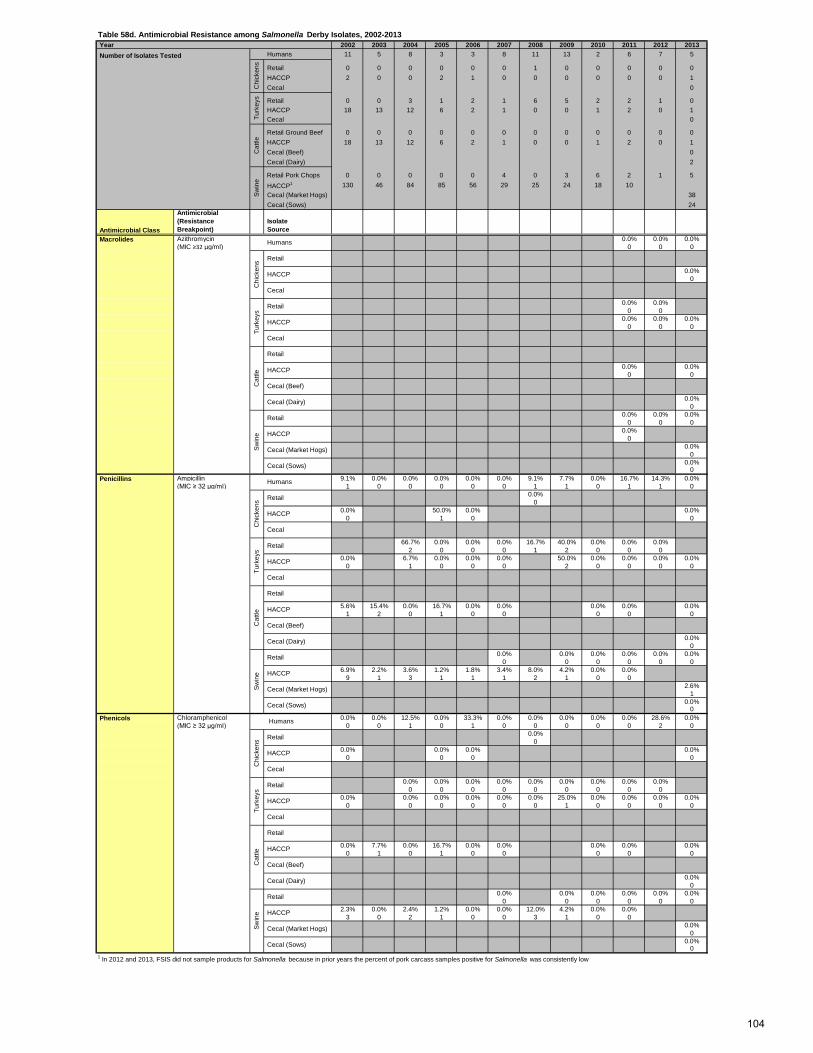
Table 58d. Antimicrobial Resistance among Salmonella Derby Isolates, 2002-2013 Year 2002 2003 2004 2005 2006 2007 2008 2009 2010 2011 2012 2013 Number of Isolates Tested Humans 11 5 8 3 3 8 11 13 2 6 7 5
Retail 0 0 0 0 0 0 1 0 0 0 0 0 HACCP 2 0 0 2 1 0 0 0 0 0 0 1 Cecal 0
Retail 0 0 3 1 2 1 6 5 2 2 1 0 HACCP 18 13 12 6 2 1 0 0 1 2 0 1 Cecal 0
Retail Ground Beef 0 0 0 0 0 0 0 0 0 0 0 0 HACCP 18 13 12 6 2 1 0 0 1 2 0 1 Cecal (Beef) 0 Cecal (Dairy) 2
Retail Pork Chops 0 0 0 0 0 4 0 3 6 2 1 5 HACCP1 130 46 84 85 56 29 25 24 18 10 Cecal (Market Hogs) 38 Cecal (Sows) 24
Antimicrobial Class
Antimicrobial (Resistance Breakpoint)
Isolate Source
Azithromycin 0.0% 0.0% 0.0% (MIC ≥32 µg/ml) 0 0 0
0.0%0
0.0% 0.0%0 0
0.0% 0.0% 0.0%0 0 0
0.0% 0.0%0 0
0.0%0
0.0% 0.0% 0.0%0 0 0
0.0%0
0.0%0
0.0%0
Ampicillin 9.1% 0.0% 0.0% 0.0% 0.0% 0.0% 9.1% 7.7% 0.0% 16.7% 14.3% 0.0% (MIC ≥ 32 µg/ml) 1 0 0 0 0 0 1 1 0 1 1 0
0.0%0
0.0% 50.0% 0.0% 0.0%0 1 0 0
66.7% 0.0% 0.0% 0.0% 16.7% 40.0% 0.0% 0.0% 0.0%2 0 0 0 1 2 0 0 0
0.0% 6.7% 0.0% 0.0% 0.0% 50.0% 0.0% 0.0% 0.0% 0.0%0 1 0 0 0 2 0 0 0 0
5.6% 15.4% 0.0% 16.7% 0.0% 0.0% 0.0% 0.0% 0.0%1 2 0 1 0 0 0 0 0
0.0%0
0.0% 0.0% 0.0% 0.0% 0.0% 0.0%0 0 0 0 0 0
6.9% 2.2% 3.6% 1.2% 1.8% 3.4% 8.0% 4.2% 0.0% 0.0%9 1 3 1 1 1 2 1 0 0
2.6%1
0.0%0
Chloramphenicol 0.0% 0.0% 12.5% 0.0% 33.3% 0.0% 0.0% 0.0% 0.0% 0.0% 28.6% 0.0% (MIC ≥ 32 µg/ml) 0 0 1 0 1 0 0 0 0 0 2 0
0.0%0
0.0% 0.0% 0.0% 0.0%0 0 0 0
0.0% 0.0% 0.0% 0.0% 0.0% 0.0% 0.0% 0.0% 0.0%0 0 0 0 0 0 0 0 0
0.0% 0.0% 0.0% 0.0% 0.0% 0.0% 25.0% 0.0% 0.0% 0.0% 0.0%0 0 0 0 0 0 1 0 0 0 0
0.0% 7.7% 0.0% 16.7% 0.0% 0.0% 0.0% 0.0% 0.0%0 1 0 1 0 0 0 0 0
0.0%0
0.0% 0.0% 0.0% 0.0% 0.0% 0.0%0 0 0 0 0 0
2.3% 0.0% 2.4% 1.2% 0.0% 0.0% 12.0% 4.2% 0.0% 0.0%3 0 2 1 0 0 3 1 0 0
0.0%0
0.0%0
1 In 2012 and 2013, FSIS did not sample products for Salmonella because in prior years the percent of pork carcass samples positive for Salmonella was consistently low
Swin
e
Retail
HACCP
Cecal (Market Hogs)
Cecal (Sows)
Cat
tle
Retail
Cecal (Dairy)
HACCP
Cecal (Beef)
Turk
eys
Retail
HACCP
Cecal
HACCP
Phenicols Humans
Chi
cken
s Retail
Cecal
Cat
tle
Retail
Cecal (Dairy)
Swin
e
Retail
HACCP
Cecal (Market Hogs)
Cecal (Sows)
HACCP
Cecal (Beef)
Turk
eys
Retail
HACCP
Cecal
HACCP
Penicillins Humans
Chi
cken
s Retail
Cecal
Chi
cken
sSw
ine
Retail
HACCP
Cecal (Market Hogs)
Cecal (Sows)
Cat
tle
Retail
HACCP
Turk
eys
Retail
HACCP
Cecal
Cecal (Dairy)
HACCP
Cecal
Retail
Cecal (Beef)
Turk
eys
Cat
tleSw
ine
Macrolides Humans
Chi
cken
s
104

Table 58e. Antimicrobial Resistance among Salmonella Derby Isolates, 2002-2013 Year 2002 2003 2004 2005 2006 2007 2008 2009 2010 2011 2012 2013 Number of Isolates Tested Humans 11 5 8 3 3 8 11 13 2 6 7 5
Retail 0 0 0 0 0 0 1 0 0 0 0 0 HACCP 2 0 0 2 1 0 0 0 0 0 0 1 Cecal 0
Retail 0 0 3 1 2 1 6 5 2 2 1 0 HACCP 1 0 15 3 7 1 0 4 1 1 1 2 Cecal 0
Retail Ground Beef 0 0 0 0 0 0 0 0 0 0 0 0 HACCP 18 13 12 6 2 1 0 0 1 2 0 1 Cecal (Beef) 0 Cecal (Dairy) 2
Retail Pork Chops 0 0 0 0 0 4 0 3 6 2 1 5 HACCP1 130 46 84 85 56 29 25 24 18 10 Cecal (Market Hogs) 38 Cecal (Sows) 24
Antimicrobial Class
Antimicrobial (Resistance Breakpoint)
Isolate Source
Quinolones Ciprofloxacin 0.0% 0.0% 0.0% 0.0% 0.0% 0.0% 0.0% 0.0% 0.0% 0.0% 0.0% 0.0% (MIC ≥ 1 µg/ml) 0 0 0 0 0 0 0 0 0 0 0 0
0.0%0
0.0% 0.0% 0.0% 0.0%0 0 0 0
0.0% 0.0% 0.0% 0.0% 0.0% 0.0% 0.0% 0.0% 0.0%0 0 0 0 0 0 0 0 0
0.0% 0.0% 0.0% 0.0% 0.0% 0.0% 0.0% 0.0% 0.0% 0.0%0 0 0 0 0 0 0 0 0 0
0.0% 0.0% 0.0% 0.0% 0.0% 0.0% 0.0% 0.0% 0.0%0 0 0 0 0 0 0 0 0
0.0%0
0.0% 0.0% 0.0% 0.0% 0.0% 0.0%0 0 0 0 0 0
0.0% 0.0% 0.0% 0.0% 0.0% 0.0% 0.0% 0.0% 0.0% 0.0%0 0 0 0 0 0 0 0 0 0
0.0%0
0.0%0
Nalidixic Acid 0.0% 0.0% 12.5% 0.0% 0.0% 0.0% 0.0% 7.7% 0.0% 0.0% 0.0% 0.0% (MIC ≥ 32 µg/ml) 0 0 1 0 0 0 0 1 0 0 0 0
0.0%0
0.0% 0.0% 0.0% 0.0%0 0 0 0
0.0% 0.0% 0.0% 0.0% 0.0% 0.0% 0.0% 0.0% 0.0%0 0 0 0 0 0 0 0 0
0.0% 0.0% 0.0% 0.0% 0.0% 0.0% 0.0% 0.0% 0.0% 0.0%0 0 0 0 0 0 0 0 0 0
0.0% 0.0% 0.0% 0.0% 0.0% 0.0% 0.0% 0.0% 0.0%0 0 0 0 0 0 0 0 0
0.0%0
0.0% 0.0% 0.0% 0.0% 0.0% 0.0%0 0 0 0 0 0
0.0% 0.0% 0.0% 1.2% 0.0% 0.0% 0.0% 0.0% 0.0% 0.0%0 0 0 1 0 0 0 0 0 0
0.0%0
0.0%0
Tetracycline 54.5% 60.0% 50.0% 33.3% 66.7% 62.5% 36.4% 69.2% 0.0% 83.3% 71.4% 60.0% (MIC ≥ 16 µg/ml) 6 3 4 1 2 5 4 9 0 5 5 3
100.0%1
50.0% 100.0% 100.0% 0.0%1 2 1 0
100.0% 10.0% 100.0% 100.0% 83.3% 10.0% 100.0% 100.0% 100.0%3 1 2 1 5 5 2 2 1
0.0% 20.0% 66.7% 85.7% 100.0% 100.0% 100.0% 0.0% 0.0% 100.0%0 3 2 6 1 4 1 0 0 2
38.9% 69.2% 66.7% 66.7% 50.0% 100.0% 0.0% 0.0% 0.0%7 9 8 4 1 1 0 0 0
0.0%0
100.0% 33.3% 66.7% 50.0% 100.0% 60.0%4 1 4 1 1 3
75.4% 60.9% 65.5% 69.4% 67.9% 75.9% 92.0% 83.3% 77.8% 70.0%98 28 55 59 38 22 23 20 14 7
78.9%30
62.5%15
1 In 2012 and 2013, FSIS did not sample products for Salmonella because in prior years the percent of pork carcass samples positive for Salmonella was consistently low
Cecal (Market Hogs)
Cecal (Sows)
Cecal (Beef)
Cecal (Dairy)
Swin
e
Retail
HACCP
Cat
tle
Retail
HACCP
Cecal
Turk
eys
Retail
HACCP
HACCP
Tetracyclines Humans
Chi
cken
s Retail
Cecal
Cecal (Dairy)
Swin
e
Retail
HACCP
Cecal (Market Hogs)
Cecal (Sows)
Cat
tle HACCP
Cecal (Beef)
Retail
Turk
eys
Retail
HACCP
Cecal
Humans
Chi
cken
s Retail
Swin
e
Retail
HACCP
Cecal (Market Hogs)
Cecal (Sows)
HACCP
Cecal
Cat
tle
Retail
Turk
eys
Retail
HACCP
Cecal
Chi
cken
s
HACCP
Cecal (Beef)
Cecal (Dairy)
HACCP
Cecal
RetailTu
rkey
sC
attle
Swin
e
Humans
Chi
cken
s
105

Table 59a. Resistance Patterns among Salmonella Derby Isolates, 2002-20131
Year 2002 2003 2004 2005 2006 2007 2008 2009 2010 2011 2012 2013
Number of Isolates Tested 11 5 8 3 3 8 11 13 2 6 7 5
Retail Chickens 0 0 0 0 0 0 1 0 0 0 0 0 HACCP 2 0 0 2 1 0 0 0 0 0 0 1 Cecal 0
Retail Ground Turkey 0 0 3 1 2 1 6 5 2 2 1 0 HACCP 1 0 15 3 7 1 0 4 1 1 1 2 Cecal 0
Retail Ground Beef 0 0 0 0 0 0 0 0 0 0 0 0 HACCP 18 13 12 6 2 1 0 0 1 2 0 1 Cecal (Beef) 0 Cecal (Dairy) 2
Retail Pork Chops 0 0 0 0 0 4 0 3 6 2 1 5
HACCP2 130 46 84 85 56 29 25 24 18 10 Cecal (Market Hogs) 38 Cecal (Sows) 24
Resistance Pattern Source45.5% 40.0% 0.4% 0.7% 0.0% 37.5% 45.5% 23.1% 50.0% 16.7% 28.6% 40.0%
1. No Resistance Detected 5 2 3 2 0 3 5 3 1 1 2 20.0%
050.0% 0.0% 0.0% 100.0%
1 0 0 1
0.0% 0.0% 0.0% 0.0% 16.7% 0.0% 0.0% 0.0% 0.0%0 0 0 0 1 0 0 0 0
100.0% 53.3% 33.3% 14.3% 0.0% 0.0% 0.0% 100.0% 100.0% 0.0%1 8 1 1 0 0 0 1 1 0
50.0% 30.8% 33.3% 33.3% 50.0% 0.0% 100.0% 100.0% 0.0%9 4 4 2 1 0 1 2 0
100.0%2
0.0% 66.7% 33.3% 50.0% 0.0% 40.0%0 2 2 1 0 2
23.1% 39.1% 32.1% 30.6% 32.1% 24.1% 8.0% 16.7% 16.7% 30.0%30 18 27 26 18 7 2 4 3 3
21.1%8
37.5%9
27.3% 40.0% 0.4% 0.0% 0.7% 62.5% 18.2% 46.2% 0.0% 50.0% 57.1% 40.0% 2. Resistant to ≥ 3 3 2 3 0 2 5 2 6 0 3 4 2 Antimicrobial Classes 100.0%
10.0% 100.0% 0.0% 0.0%
0 2 0 0
66.7% 0.0% 100.0% 0.0% 66.7% 100.0% 50.0% 100.0% 0.0%2 0 2 0 4 5 1 2 0
0.0% 20.0% 33.3% 14.3% 0.0% 50.0% 0.0% 0.0% 0.0% 50.0%0 3 1 1 0 2 0 0 0 1
27.8% 38.5% 66.7% 66.7% 50.0% 0.0% 0.0% 0.0% 0.0%5 5 8 4 1 0 0 0 0
0.0%0
0.0% 33.3% 50.0% 0.0% 100.0% 40.0%0 1 3 0 1 2
60.0% 47.8% 57.1% 61.2% 48.2% 48.3% 72.0% 62.5% 38.9% 40.0%78 22 48 52 27 14 18 15 7 4
55.3%21
50.0%12
0.0% 0.0% 0.1% 0.0% 0.3% 0.0% 0.0% 7.7% 0.0% 16.7% 28.6% 0.0% 3. Resistant to ≥ 4 0 0 1 0 1 0 0 1 0 1 2 0 Antimicrobial Classes 0.0%
00.0% 50.0% 0.0% 0.0%
0 1 0 0
66.7% 0.0% 0.0% 0.0% 16.7% 40.0% 0.0% 0.0% 0.0%2 0 0 0 1 2 0 0 0
0.0% 0.0% 0.0% 0.0% 0.0% 50.0% 0.0% 0.0% 0.0% 0.0%0 0 0 0 0 2 0 0 0 0
5.6% 15.4% 0.0% 16.7% 0.0% 0.0% 0.0% 0.0% 0.0%1 2 0 1 0 0 0 0 0
0.0%0
0.0% 0.0% 0.0% 0.0% 0.0% 0.0%0 0 0 0 0 0
6.9% 2.2% 2.4% 1.2% 1.8% 3.4% 12.0% 4.2% 0.0% 0.0%9 1 2 1 1 1 3 1 0 0
2.6%1
0.0%0
2 In 2012 and 2013, FSIS did not sample products for Salmonella because in prior years the percent of pork carcass samples positive for Salmonella was consistently low
Sw
ine
Humans
Chi
cken
s
Retail Chickens
HACCP
Cecal
Cat
tle
Retail Ground Beef
HACCP
Cecal (Beef)
Cecal (Dairy)
Chi
cken
s
Retail Chickens
HACCP
Cecal
Turk
eys
Retail Ground Turkey
Multidrug Resistance
Humans
Chi
cken
sTu
rkey
sC
attle
Turk
eys
Retail Ground Turkey
HACCP
Cecal
HACCP
Cecal
Sw
ine
Retail Pork Chops
HACCP
Cecal (Market Hogs)
Cecal (Sows)
Humans
Cat
tle
Retail Ground Beef
HACCP
Cecal (Beef)
Cecal (Dairy)
Sw
ine
Retail Pork Chops
HACCP
Cecal (Market Hogs)
Cecal (Sows)
Humans
Chi
cken
s
Retail Chickens
HACCP
Cecal
1 Starting in 2011, testing included nine antimicrobial classes with the addition of the macrolide azithromycin. Because resistance to azithromycin is low (in this case, <1%), antimicrobial class resistance data from 2011 and beyond are comparable to the data from previous years.
Turk
eys
Retail Ground Turkey
HACCP
Cecal
Cat
tle
Retail Ground Beef
HACCP
Cecal (Beef)
Cecal (Dairy)
Sw
ine
Retail Pork Chops
HACCP
Cecal (Market Hogs)
Cecal (Sows)
106
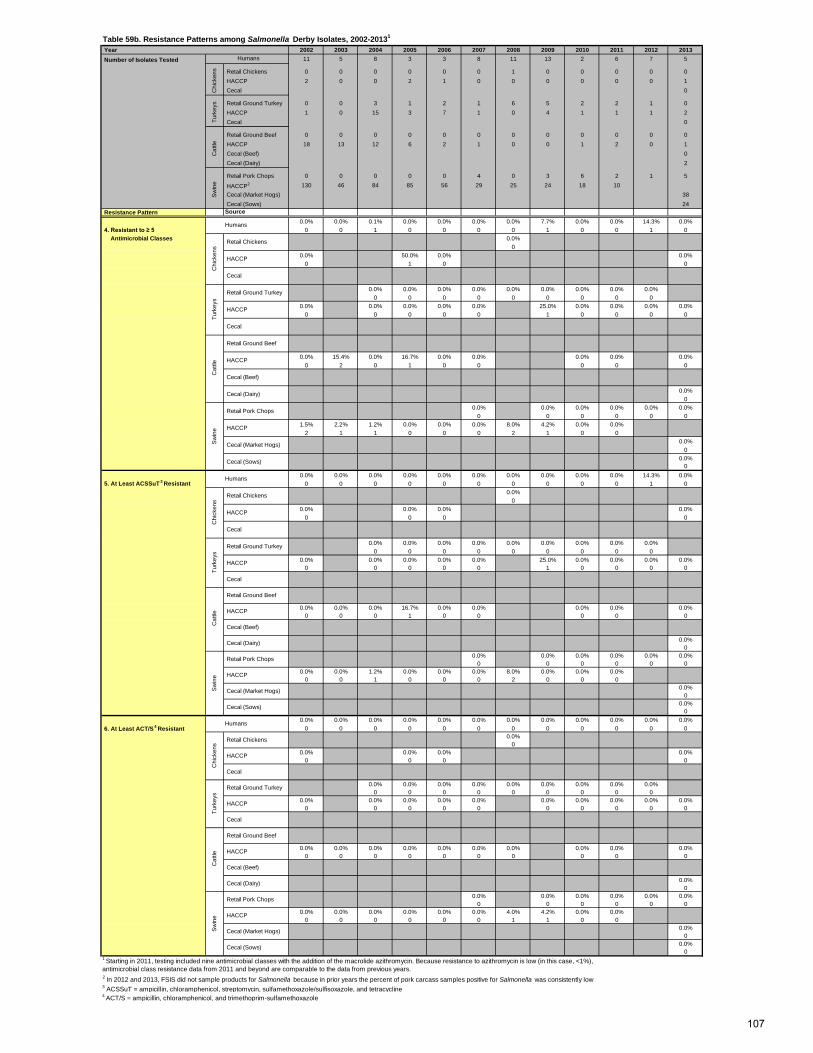
Table 59b. Resistance Patterns among Salmonella Derby Isolates, 2002-20131
Year 2002 2003 2004 2005 2006 2007 2008 2009 2010 2011 2012 2013 Number of Isolates Tested 11 5 8 3 3 8 11 13 2 6 7 5
Retail Chickens 0 0 0 0 0 0 1 0 0 0 0 0 HACCP 2 0 0 2 1 0 0 0 0 0 0 1 Cecal 0
Retail Ground Turkey 0 0 3 1 2 1 6 5 2 2 1 0 HACCP 1 0 15 3 7 1 0 4 1 1 1 2 Cecal 0
Retail Ground Beef 0 0 0 0 0 0 0 0 0 0 0 0 HACCP 18 13 12 6 2 1 0 0 1 2 0 1 Cecal (Beef) 0 Cecal (Dairy) 2
Retail Pork Chops 0 0 0 0 0 4 0 3 6 2 1 5
HACCP2 130 46 84 85 56 29 25 24 18 10 Cecal (Market Hogs) 38 Cecal (Sows) 24
Resistance Pattern Source0.0% 0.0% 0.1% 0.0% 0.0% 0.0% 0.0% 7.7% 0.0% 0.0% 14.3% 0.0%
4. Resistant to ≥ 5 0 0 1 0 0 0 0 1 0 0 1 0 Antimicrobial Classes 0.0%
00.0% 50.0% 0.0% 0.0%
0 1 0 0
0.0% 0.0% 0.0% 0.0% 0.0% 0.0% 0.0% 0.0% 0.0%0 0 0 0 0 0 0 0 0
0.0% 0.0% 0.0% 0.0% 0.0% 25.0% 0.0% 0.0% 0.0% 0.0%0 0 0 0 0 1 0 0 0 0
0.0% 15.4% 0.0% 16.7% 0.0% 0.0% 0.0% 0.0% 0.0%0 2 0 1 0 0 0 0 0
0.0%0
0.0% 0.0% 0.0% 0.0% 0.0% 0.0%0 0 0 0 0 0
1.5% 2.2% 1.2% 0.0% 0.0% 0.0% 8.0% 4.2% 0.0% 0.0%2 1 1 0 0 0 2 1 0 0
0.0%0
0.0%0
0.0% 0.0% 0.0% 0.0% 0.0% 0.0% 0.0% 0.0% 0.0% 0.0% 14.3% 0.0% 5. At Least ACSSuT
3 Resistant 0 0 0 0 0 0 0 0 0 0 1 00.0%
00.0% 0.0% 0.0% 0.0%
0 0 0 0
0.0% 0.0% 0.0% 0.0% 0.0% 0.0% 0.0% 0.0% 0.0%0 0 0 0 0 0 0 0 0
0.0% 0.0% 0.0% 0.0% 0.0% 25.0% 0.0% 0.0% 0.0% 0.0%0 0 0 0 0 1 0 0 0 0
0.0% 0.0% 0.0% 16.7% 0.0% 0.0% 0.0% 0.0% 0.0%0 0 0 1 0 0 0 0 0
0.0%0
0.0% 0.0% 0.0% 0.0% 0.0% 0.0%0 0 0 0 0 0
0.0% 0.0% 1.2% 0.0% 0.0% 0.0% 8.0% 0.0% 0.0% 0.0%0 0 1 0 0 0 2 0 0 0
0.0%0
0.0%0
0.0% 0.0% 0.0% 0.0% 0.0% 0.0% 0.0% 0.0% 0.0% 0.0% 0.0% 0.0% 6. At Least ACT/S
4 Resistant 0 0 0 0 0 0 0 0 0 0 0 00.0%
00.0% 0.0% 0.0% 0.0%
0 0 0 0
0.0% 0.0% 0.0% 0.0% 0.0% 0.0% 0.0% 0.0% 0.0%0 0 0 0 0 0 0 0 0
0.0% 0.0% 0.0% 0.0% 0.0% 0.0% 0.0% 0.0% 0.0% 0.0%0 0 0 0 0 0 0 0 0 0
0.0% 0.0% 0.0% 0.0% 0.0% 0.0% 0.0% 0.0% 0.0% 0.0%0 0 0 0 0 0 0 0 0 0
0.0%0
0.0% 0.0% 0.0% 0.0% 0.0% 0.0%0 0 0 0 0 0
0.0% 0.0% 0.0% 0.0% 0.0% 0.0% 4.0% 4.2% 0.0% 0.0%0 0 0 0 0 0 1 1 0 0
0.0%0
0.0%0
2 In 2012 and 2013, FSIS did not sample products for Salmonella because in prior years the percent of pork carcass samples positive for Salmonella was consistently low3 ACSSuT = ampicillin, chloramphenicol, streptomycin, sulfamethoxazole/sulfisoxazole, and tetracycline4 ACT/S = ampicillin, chloramphenicol, and trimethoprim-sulfamethoxazole
1 Starting in 2011, testing included nine antimicrobial classes with the addition of the macrolide azithromycin. Because resistance to azithromycin is low (in this case, <1%), antimicrobial class resistance data from 2011 and beyond are comparable to the data from previous years.
HACCP
Cecal
Humans
Chi
cken
sTu
rkey
sS
win
e
Retail Pork Chops
HACCP
Cecal (Market Hogs)
Cecal (Sows)
Cat
tleS
win
e
Humans
Chi
cken
s
Retail Chickens
HACCP
Cecal
Turk
eys
Retail Ground Turkey
HACCP
Cecal
Cat
tle
Retail Ground Beef
HACCP
Cecal (Beef)
Cecal (Dairy)
Humans
Chi
cken
s
Retail Chickens
Turk
eys
Retail Ground Turkey
HACCP
Cecal
Cat
tle
Retail Ground Beef
HACCP
Cecal (Beef)
Cecal (Dairy)
Chi
cken
s
Retail Chickens
HACCP
Cecal
Turk
eys
Retail Ground Turkey
HACCP
Cecal
Sw
ine
Retail Pork Chops
HACCP
Cecal (Market Hogs)
Cecal (Sows)
Humans
Cat
tle
Retail Ground Beef
HACCP
Cecal (Beef)
Cecal (Dairy)
Sw
ine
Retail Pork Chops
HACCP
Cecal (Market Hogs)
Cecal (Sows)
107
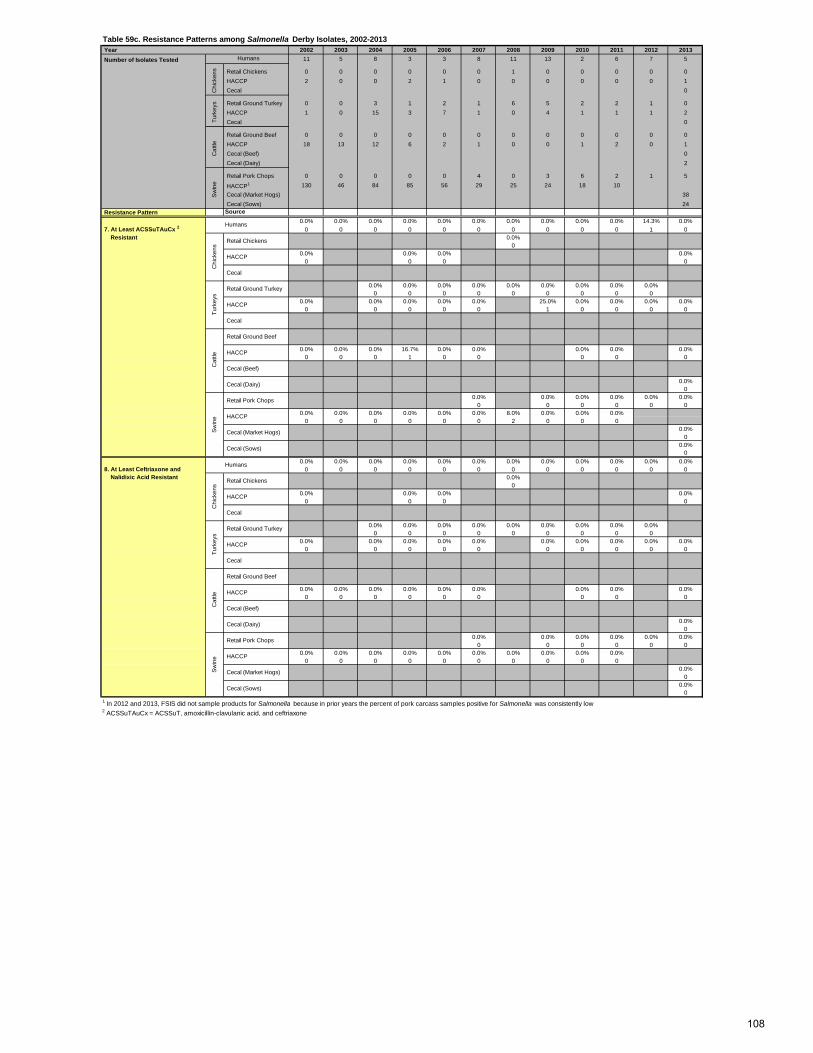
Table 59c. Resistance Patterns among Salmonella Derby Isolates, 2002-2013 Year 2002 2003 2004 2005 2006 2007 2008 2009 2010 2011 2012 2013 Number of Isolates Tested 11 5 8 3 3 8 11 13 2 6 7 5
Retail Chickens 0 0 0 0 0 0 1 0 0 0 0 0 HACCP 2 0 0 2 1 0 0 0 0 0 0 1 Cecal 0
Retail Ground Turkey 0 0 3 1 2 1 6 5 2 2 1 0 HACCP 1 0 15 3 7 1 0 4 1 1 1 2 Cecal 0
Retail Ground Beef 0 0 0 0 0 0 0 0 0 0 0 0 HACCP 18 13 12 6 2 1 0 0 1 2 0 1 Cecal (Beef) 0 Cecal (Dairy) 2
Retail Pork Chops 0 0 0 0 0 4 0 3 6 2 1 5
HACCP1 130 46 84 85 56 29 25 24 18 10 Cecal (Market Hogs) 38 Cecal (Sows) 24
Resistance Pattern Source0.0% 0.0% 0.0% 0.0% 0.0% 0.0% 0.0% 0.0% 0.0% 0.0% 14.3% 0.0%
7. At Least ACSSuTAuCx 2 0 0 0 0 0 0 0 0 0 0 1 0 Resistant 0.0%
00.0% 0.0% 0.0% 0.0%
0 0 0 0
0.0% 0.0% 0.0% 0.0% 0.0% 0.0% 0.0% 0.0% 0.0%0 0 0 0 0 0 0 0 0
0.0% 0.0% 0.0% 0.0% 0.0% 25.0% 0.0% 0.0% 0.0% 0.0%0 0 0 0 0 1 0 0 0 0
0.0% 0.0% 0.0% 16.7% 0.0% 0.0% 0.0% 0.0% 0.0%0 0 0 1 0 0 0 0 0
0.0%0
0.0% 0.0% 0.0% 0.0% 0.0% 0.0%0 0 0 0 0 0
0.0% 0.0% 0.0% 0.0% 0.0% 0.0% 8.0% 0.0% 0.0% 0.0%0 0 0 0 0 0 2 0 0 0
0.0%0
0.0%0
0.0% 0.0% 0.0% 0.0% 0.0% 0.0% 0.0% 0.0% 0.0% 0.0% 0.0% 0.0% 8. At Least Ceftriaxone and 0 0 0 0 0 0 0 0 0 0 0 0 Nalidixic Acid Resistant 0.0%
00.0% 0.0% 0.0% 0.0%
0 0 0 0
0.0% 0.0% 0.0% 0.0% 0.0% 0.0% 0.0% 0.0% 0.0%0 0 0 0 0 0 0 0 0
0.0% 0.0% 0.0% 0.0% 0.0% 0.0% 0.0% 0.0% 0.0% 0.0%0 0 0 0 0 0 0 0 0 0
0.0% 0.0% 0.0% 0.0% 0.0% 0.0% 0.0% 0.0% 0.0%0 0 0 0 0 0 0 0 0
0.0%0
0.0% 0.0% 0.0% 0.0% 0.0% 0.0%0 0 0 0 0 0
0.0% 0.0% 0.0% 0.0% 0.0% 0.0% 0.0% 0.0% 0.0% 0.0%0 0 0 0 0 0 0 0 0 0
0.0%0
0.0%0
1 In 2012 and 2013, FSIS did not sample products for Salmonella because in prior years the percent of pork carcass samples positive for Salmonella was consistently low2 ACSSuTAuCx = ACSSuT, amoxicillin-clavulanic acid, and ceftriaxone
Humans
Chi
cken
sTu
rkey
sC
attle
Sw
ine
Humans
Chi
cken
s
Retail Chickens
HACCP
Cecal
Turk
eys
Retail Ground Turkey
HACCP
Cecal
Cat
tle
Retail Ground Beef
HACCP
Cecal (Beef)
Cecal (Dairy)
Sw
ine
Retail Pork Chops
HACCP
Cecal (Market Hogs)
Cecal (Sows)
Humans
Chi
cken
s
Retail Chickens
HACCP
Cecal
Turk
eys
Retail Ground Turkey
HACCP
Cecal
Cat
tle
Retail Ground Beef
HACCP
Cecal (Beef)
Cecal (Dairy)
Sw
ine
Retail Pork Chops
HACCP
Cecal (Market Hogs)
Cecal (Sows)
108
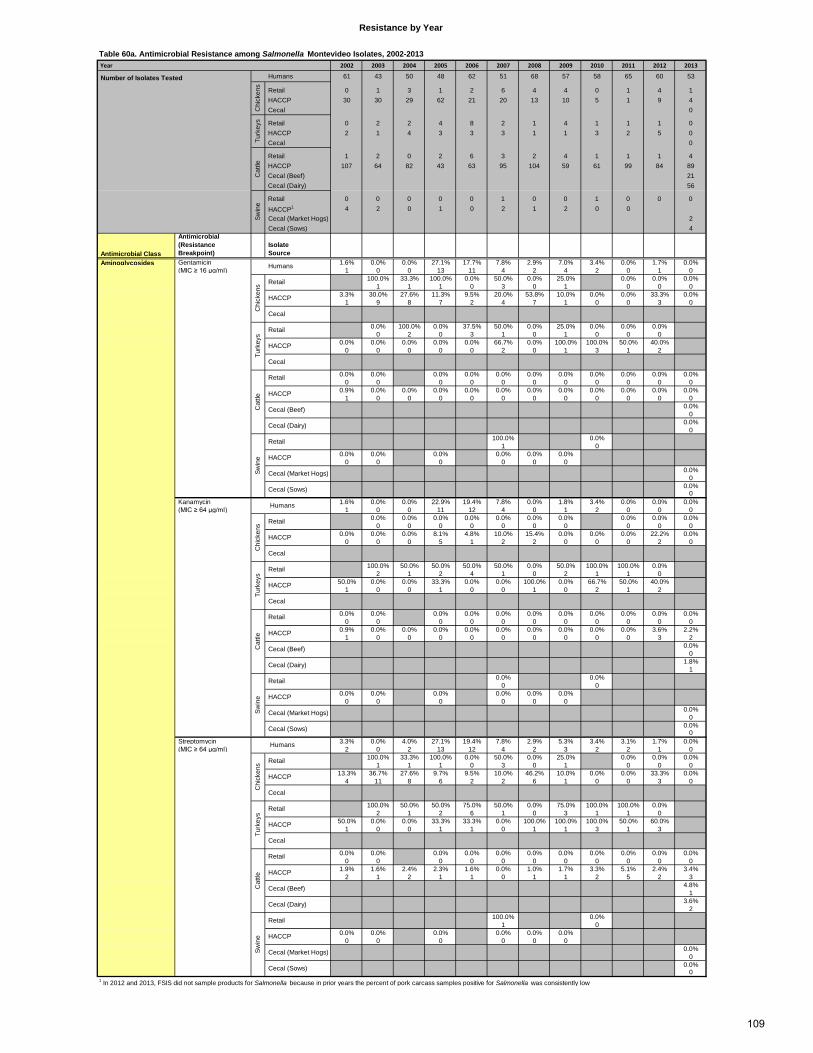
Table 60a. Antimicrobial Resistance among Salmonella Montevideo Isolates, 2002-2013 Year 2002 2003 2004 2005 2006 2007 2008 2009 2010 2011 2012 2013
Humans 61 43 50 48 62 51 68 57 58 65 60 53
Retail 0 1 3 1 2 6 4 4 0 1 4 1 HACCP 30 30 29 62 21 20 13 10 5 1 9 4 Cecal 0
Retail 0 2 2 4 8 2 1 4 1 1 1 0 HACCP 2 1 4 3 3 3 1 1 3 2 5 0 Cecal 0
Retail 1 2 0 2 6 3 2 4 1 1 1 4 HACCP 107 64 82 43 63 95 104 59 61 99 84 89 Cecal (Beef) 21 Cecal (Dairy) 56
Retail 0 0 0 0 0 1 0 0 1 0 0 0 HACCP1 4 2 0 1 0 2 1 2 0 0 Cecal (Market Hogs) 2 Cecal (Sows) 4
Antimicrobial Class
Antimicrobial (Resistance Breakpoint)
Isolate Source
Aminoglycosides Gentamicin 1.6% 0.0% 0.0% 27.1% 17.7% 7.8% 2.9% 7.0% 3.4% 0.0% 1.7% 0.0% (MIC ≥ 16 µg/ml) 1 0 0 13 11 4 2 4 2 0 1 0
100.0% 33.3% 100.0% 0.0% 50.0% 0.0% 25.0% 0.0% 0.0% 0.0%1 1 1 0 3 0 1 0 0 0
3.3% 30.0% 27.6% 11.3% 9.5% 20.0% 53.8% 10.0% 0.0% 0.0% 33.3% 0.0%1 9 8 7 2 4 7 1 0 0 3 0
0.0% 100.0% 0.0% 37.5% 50.0% 0.0% 25.0% 0.0% 0.0% 0.0%0 2 0 3 1 0 1 0 0 0
0.0% 0.0% 0.0% 0.0% 0.0% 66.7% 0.0% 100.0% 100.0% 50.0% 40.0%0 0 0 0 0 2 0 1 3 1 2
0.0% 0.0% 0.0% 0.0% 0.0% 0.0% 0.0% 0.0% 0.0% 0.0% 0.0%0 0 0 0 0 0 0 0 0 0 0
0.9% 0.0% 0.0% 0.0% 0.0% 0.0% 0.0% 0.0% 0.0% 0.0% 0.0% 0.0%1 0 0 0 0 0 0 0 0 0 0 0
0.0%0
0.0%0
100.0% 0.0%1 0
0.0% 0.0% 0.0% 0.0% 0.0% 0.0%0 0 0 0 0 0
0.0%0
0.0%0
Kanamycin 1.6% 0.0% 0.0% 22.9% 19.4% 7.8% 0.0% 1.8% 3.4% 0.0% 0.0% 0.0% (MIC ≥ 64 µg/ml) 1 0 0 11 12 4 0 1 2 0 0 0
0.0% 0.0% 0.0% 0.0% 0.0% 0.0% 0.0% 0.0% 0.0% 0.0%0 0 0 0 0 0 0 0 0 0
0.0% 0.0% 0.0% 8.1% 4.8% 10.0% 15.4% 0.0% 0.0% 0.0% 22.2% 0.0%0 0 0 5 1 2 2 0 0 0 2 0
100.0% 50.0% 50.0% 50.0% 50.0% 0.0% 50.0% 100.0% 100.0% 0.0%2 1 2 4 1 0 2 1 1 0
50.0% 0.0% 0.0% 33.3% 0.0% 0.0% 100.0% 0.0% 66.7% 50.0% 40.0%1 0 0 1 0 0 1 0 2 1 2
0.0% 0.0% 0.0% 0.0% 0.0% 0.0% 0.0% 0.0% 0.0% 0.0% 0.0%0 0 0 0 0 0 0 0 0 0 0
0.9% 0.0% 0.0% 0.0% 0.0% 0.0% 0.0% 0.0% 0.0% 0.0% 3.6% 2.2%1 0 0 0 0 0 0 0 0 0 3 2
0.0%0
1.8%1
0.0% 0.0%0 0
0.0% 0.0% 0.0% 0.0% 0.0% 0.0%0 0 0 0 0 0
0.0%0
0.0%0
Streptomycin 3.3% 0.0% 4.0% 27.1% 19.4% 7.8% 2.9% 5.3% 3.4% 3.1% 1.7% 0.0% (MIC ≥ 64 µg/ml) 2 0 2 13 12 4 2 3 2 2 1 0
100.0% 33.3% 100.0% 0.0% 50.0% 0.0% 25.0% 0.0% 0.0% 0.0%1 1 1 0 3 0 1 0 0 0
13.3% 36.7% 27.6% 9.7% 9.5% 10.0% 46.2% 10.0% 0.0% 0.0% 33.3% 0.0%4 11 8 6 2 2 6 1 0 0 3 0
100.0% 50.0% 50.0% 75.0% 50.0% 0.0% 75.0% 100.0% 100.0% 0.0%2 1 2 6 1 0 3 1 1 0
50.0% 0.0% 0.0% 33.3% 33.3% 0.0% 100.0% 100.0% 100.0% 50.0% 60.0%1 0 0 1 1 0 1 1 3 1 3
0.0% 0.0% 0.0% 0.0% 0.0% 0.0% 0.0% 0.0% 0.0% 0.0% 0.0%0 0 0 0 0 0 0 0 0 0 0
1.9% 1.6% 2.4% 2.3% 1.6% 0.0% 1.0% 1.7% 3.3% 5.1% 2.4% 3.4%2 1 2 1 1 0 1 1 2 5 2 3
4.8%1
3.6%2
100.0% 0.0%1 0
0.0% 0.0% 0.0% 0.0% 0.0% 0.0%0 0 0 0 0 0
0.0%0
0.0%0
1 In 2012 and 2013, FSIS did not sample products for Salmonella because in prior years the percent of pork carcass samples positive for Salmonella was consistently low
Resistance by Year
Swin
e
Retail
HACCP
Cecal (Market Hogs)
Cecal (Sows)
HACCP
Turk
eys
Retail
HACCP
Cecal
Cecal (Beef)Cat
tle
Retail
Cecal (Dairy)
HACCP
Humans
Chi
cken
s Retail
Cecal
Cecal (Dairy)
Swin
e
Retail
HACCP
Cecal (Market Hogs)
Cecal (Sows)
Cat
tle HACCP
Cecal (Beef)
Retail
Turk
eys
Retail
HACCP
Cecal
HACCP
Cecal
Humans
Chi
cken
s Retail
Swin
e
Retail
HACCP
Cecal (Market Hogs)
Cecal (Sows)
Cecal (Beef)Cat
tle
Retail
Cecal (Dairy)
HACCP
Turk
eys
Retail
HACCP
Cecal
Number of Isolates Tested
Chi
cken
sTu
rkey
sC
attle
HACCP
Swin
e Humans
Chi
cken
s Retail
Cecal
109

Table 60b. Antimicrobial Resistance among Salmonella Montevideo Isolates, 2002-2013 Year 2002 2003 2004 2005 2006 2007 2008 2009 2010 2011 2012 2013
Number of Isolates Tested Humans 61 43 50 48 62 51 68 57 58 65 60 53
Retail 0 1 3 1 2 6 4 4 0 1 4 1 HACCP 30 30 29 62 21 20 13 10 5 1 9 4 Cecal 0
Retail 0 2 2 4 8 2 1 4 1 1 1 0 HACCP 2 1 4 3 3 3 1 1 3 2 5 0 Cecal 0
Retail 1 2 0 2 6 3 2 4 1 1 1 4 HACCP 107 64 82 43 63 95 104 59 61 99 84 89 Cecal (Beef) 21 Cecal (Dairy) 56
Retail 0 0 0 0 0 1 0 0 1 0 0 0 HACCP1 4 2 0 1 0 2 1 2 0 0 Cecal (Market Hogs) 2 Cecal (Sows) 4
Antimicrobial Class
Antimicrobial (Resistance Breakpoint)
Isolate Source
β-Lactam/β-Lactamase Amoxicillin- 0.0% 0.0% 0.0% 0.0% 0.0% 0.0% 0.0% 0.0% 0.0% 1.5% 0.0% 0.0% Inhibitor Combinations Clavulanic Acid 0 0 0 0 0 0 0 0 0 1 0 0
(MIC ≥ 32 / 16 µg/ml) 0.0% 0.0% 0.0% 0.0% 0.0% 0.0% 0.0% 0.0% 0.0% 0.0%0 0 0 0 0 0 0 0 0 0
3.3% 3.3% 0.0% 0.0% 0.0% 0.0% 0.0% 0.0% 0.0% 0.0% 0.0% 0.0%1 1 0 0 0 0 0 0 0 0 0 0
0.0% 0.0% 0.0% 0.0% 0.0% 0.0% 0.0% 0.0% 0.0% 100.0%0 0 0 0 0 0 0 0 0 1
0.0% 0.0% 0.0% 0.0% 0.0% 0.0% 0.0% 0.0% 0.0% 0.0% 0.0%0 0 0 0 0 0 0 0 0 0 0
0.0% 0.0% 0.0% 0.0% 0.0% 0.0% 0.0% 0.0% 0.0% 0.0% 0.0%0 0 0 0 0 0 0 0 0 0 0
1.9% 1.6% 0.0% 0.0% 0.0% 0.0% 0.0% 1.7% 0.0% 4.0% 2.4% 2.2%2 1 0 0 0 0 0 1 0 4 2 2
4.8%1
3.6%2
0.0% 0.0%0 0
0.0% 0.0% 0.0% 0.0% 0.0% 0.0%0 0 0 0 0 0
0.0%0
0.0%0
Cefoxitin 0.0% 0.0% 0.0% 0.0% 0.0% 0.0% 0.0% 0.0% 0.0% 1.5% 0.0% 0.0% (MIC ≥ 32 µg/ml) 0 0 0 0 0 0 0 0 0 1 0 0
0.0% 0.0% 0.0% 0.0% 0.0% 0.0% 0.0% 0.0% 0.0% 0.0%0 0 0 0 0 0 0 0 0 0
3.3% 3.3% 0.0% 0.0% 4.8% 0.0% 0.0% 0.0% 0.0% 0.0% 0.0% 0.0%1 1 0 0 1 0 0 0 0 0 0 0
0.0% 0.0% 0.0% 0.0% 0.0% 0.0% 0.0% 0.0% 0.0% 100.0%0 0 0 0 0 0 0 0 0 1
0.0% 0.0% 0.0% 0.0% 0.0% 0.0% 0.0% 0.0% 0.0% 0.0% 0.0%0 0 0 0 0 0 0 0 0 0 0
0.0% 0.0% 0.0% 0.0% 0.0% 0.0% 0.0% 0.0% 0.0% 0.0% 0.0%0 0 0 0 0 0 0 0 0 0 0
1.9% 0.0% 0.0% 0.0% 0.0% 0.0% 0.0% 1.7% 0.0% 4.0% 2.4% 2.2%2 0 0 0 0 0 0 1 0 4 2 2
4.8%1
3.6%2
0.0% 0.0%0 0
0.0% 0.0% 0.0% 0.0% 0.0% 0.0%0 0 0 0 0 0
0.0%0
0.0%0
Ceftiofur 0.0% 0.0% 0.0% 0.0% 0.0% 0.0% 0.0% 0.0% 0.0% 1.5% 0.0% 0.0% (MIC ≥ 8 µg/ml) 0 0 0 0 0 0 0 0 0 1 0 0
0.0% 0.0% 0.0% 0.0% 0.0% 0.0% 0.0% 0.0% 0.0% 0.0%0 0 0 0 0 0 0 0 0 0
3.3% 3.3% 0.0% 0.0% 0.0% 0.0% 0.0% 0.0% 0.0% 0.0% 0.0% 0.0%1 1 0 0 0 0 0 0 0 0 0 0
0.0% 0.0% 0.0% 0.0% 0.0% 0.0% 0.0% 0.0% 0.0% 100.0%0 0 0 0 0 0 0 0 0 1
0.0% 0.0% 0.0% 0.0% 0.0% 0.0% 0.0% 0.0% 0.0% 0.0% 0.0%0 0 0 0 0 0 0 0 0 0 0
0.0% 0.0% 0.0% 0.0% 0.0% 0.0% 0.0% 0.0% 0.0% 0.0% 0.0%0 0 0 0 0 0 0 0 0 0 0
1.9% 0.0% 0.0% 0.0% 1.6% 0.0% 0.0% 1.7% 0.0% 4.0% 2.4% 2.2%2 0 0 0 1 0 0 1 0 4 2 2
4.8%1
3.6%2
0.0% 0.0%0 0
0.0% 0.0% 0.0% 0.0% 0.0% 0.0%0 0 0 0 0 0
0.0%0
0.0%0
1 In 2012 and 2013, FSIS did not sample products for Salmonella because in prior years the percent of pork carcass samples positive for Salmonella was consistently low
Cecal (Dairy)
Swin
e
Retail
HACCP
Cecal (Market Hogs)
Cecal (Sows)
Cat
tle HACCP
Cecal (Beef)
Retail
Cecal
Turk
eys
Retail
HACCP
Cecal
Humans
Chi
cken
s Retail
Swin
e
Retail
HACCP
Cecal (Market Hogs)
Cecal (Sows)
HACCP
Cat
tle
Retail
HACCP
Cecal (Beef)
Cecal (Dairy)
Turk
eys
Retail
HACCP
Cecal
Chi
cken
s
HACCP
Cecal
Retail
HACCP
Cecal (Beef)
Cecal (Dairy)
Chi
cken
s
Cephems Humans
Swin
e
Retail
HACCP
Cecal (Market Hogs)
Cecal (Sows)
Cat
tle
Retail
Turk
eys
Retail
HACCP
Cecal
HACCP
Cecal
RetailC
hick
ens
Turk
eys
Cat
tleSw
ine
Humans
110
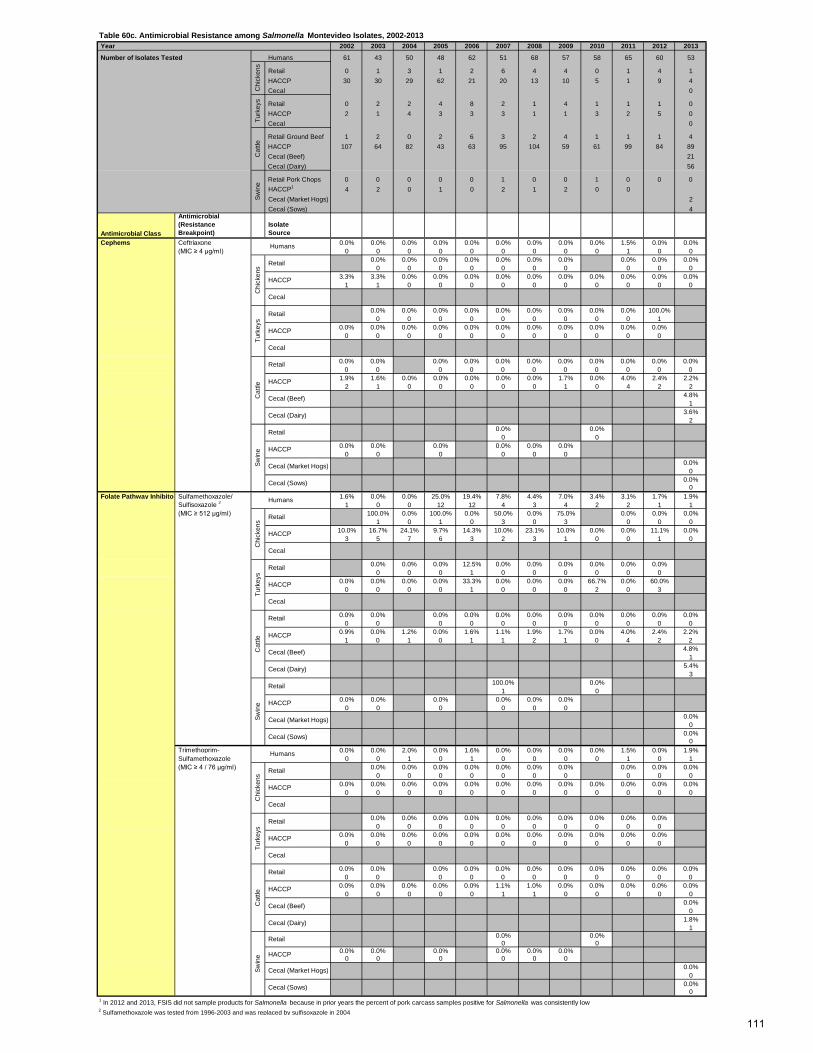
Table 60c. Antimicrobial Resistance among Salmonella Montevideo Isolates, 2002-2013 Year 2002 2003 2004 2005 2006 2007 2008 2009 2010 2011 2012 2013
Number of Isolates Tested Humans 61 43 50 48 62 51 68 57 58 65 60 53
Retail 0 1 3 1 2 6 4 4 0 1 4 1 HACCP 30 30 29 62 21 20 13 10 5 1 9 4 Cecal 0
Retail 0 2 2 4 8 2 1 4 1 1 1 0 HACCP 2 1 4 3 3 3 1 1 3 2 5 0 Cecal 0
Retail Ground Beef 1 2 0 2 6 3 2 4 1 1 1 4 HACCP 107 64 82 43 63 95 104 59 61 99 84 89 Cecal (Beef) 21 Cecal (Dairy) 56
Retail Pork Chops 0 0 0 0 0 1 0 0 1 0 0 0 HACCP1 4 2 0 1 0 2 1 2 0 0 Cecal (Market Hogs) 2 Cecal (Sows) 4
Antimicrobial Class
Antimicrobial (Resistance Breakpoint)
Isolate Source
Ceftriaxone 0.0% 0.0% 0.0% 0.0% 0.0% 0.0% 0.0% 0.0% 0.0% 1.5% 0.0% 0.0% (MIC ≥ 4 µg/ml) 0 0 0 0 0 0 0 0 0 1 0 0
0.0% 0.0% 0.0% 0.0% 0.0% 0.0% 0.0% 0.0% 0.0% 0.0%0 0 0 0 0 0 0 0 0 0
3.3% 3.3% 0.0% 0.0% 0.0% 0.0% 0.0% 0.0% 0.0% 0.0% 0.0% 0.0%1 1 0 0 0 0 0 0 0 0 0 0
0.0% 0.0% 0.0% 0.0% 0.0% 0.0% 0.0% 0.0% 0.0% 100.0%0 0 0 0 0 0 0 0 0 1
0.0% 0.0% 0.0% 0.0% 0.0% 0.0% 0.0% 0.0% 0.0% 0.0% 0.0%0 0 0 0 0 0 0 0 0 0 0
0.0% 0.0% 0.0% 0.0% 0.0% 0.0% 0.0% 0.0% 0.0% 0.0% 0.0%0 0 0 0 0 0 0 0 0 0 0
1.9% 1.6% 0.0% 0.0% 0.0% 0.0% 0.0% 1.7% 0.0% 4.0% 2.4% 2.2%2 1 0 0 0 0 0 1 0 4 2 2
4.8%1
3.6%2
0.0% 0.0%0 0
0.0% 0.0% 0.0% 0.0% 0.0% 0.0%0 0 0 0 0 0
0.0%0
0.0%0
Folate Pathway Inhibitor Sulfamethoxazole/ 1.6% 0.0% 0.0% 25.0% 19.4% 7.8% 4.4% 7.0% 3.4% 3.1% 1.7% 1.9% Sulfisoxazole 2 1 0 0 12 12 4 3 4 2 2 1 1 (MIC ≥ 512 µg/ml) 100.0% 0.0% 100.0% 0.0% 50.0% 0.0% 75.0% 0.0% 0.0% 0.0%
1 0 1 0 3 0 3 0 0 010.0% 16.7% 24.1% 9.7% 14.3% 10.0% 23.1% 10.0% 0.0% 0.0% 11.1% 0.0%
3 5 7 6 3 2 3 1 0 0 1 0
0.0% 0.0% 0.0% 12.5% 0.0% 0.0% 0.0% 0.0% 0.0% 0.0%0 0 0 1 0 0 0 0 0 0
0.0% 0.0% 0.0% 0.0% 33.3% 0.0% 0.0% 0.0% 66.7% 0.0% 60.0%0 0 0 0 1 0 0 0 2 0 3
0.0% 0.0% 0.0% 0.0% 0.0% 0.0% 0.0% 0.0% 0.0% 0.0% 0.0%0 0 0 0 0 0 0 0 0 0 0
0.9% 0.0% 1.2% 0.0% 1.6% 1.1% 1.9% 1.7% 0.0% 4.0% 2.4% 2.2%1 0 1 0 1 1 2 1 0 4 2 2
4.8%1
5.4%3
100.0% 0.0%1 0
0.0% 0.0% 0.0% 0.0% 0.0% 0.0%0 0 0 0 0 0
0.0%0
0.0%0
Trimethoprim- 0.0% 0.0% 2.0% 0.0% 1.6% 0.0% 0.0% 0.0% 0.0% 1.5% 0.0% 1.9% Sulfamethoxazole 0 0 1 0 1 0 0 0 0 1 0 1 (MIC ≥ 4 / 76 µg/ml) 0.0% 0.0% 0.0% 0.0% 0.0% 0.0% 0.0% 0.0% 0.0% 0.0%
0 0 0 0 0 0 0 0 0 00.0% 0.0% 0.0% 0.0% 0.0% 0.0% 0.0% 0.0% 0.0% 0.0% 0.0% 0.0%
0 0 0 0 0 0 0 0 0 0 0 0
0.0% 0.0% 0.0% 0.0% 0.0% 0.0% 0.0% 0.0% 0.0% 0.0%0 0 0 0 0 0 0 0 0 0
0.0% 0.0% 0.0% 0.0% 0.0% 0.0% 0.0% 0.0% 0.0% 0.0% 0.0%0 0 0 0 0 0 0 0 0 0 0
0.0% 0.0% 0.0% 0.0% 0.0% 0.0% 0.0% 0.0% 0.0% 0.0% 0.0%0 0 0 0 0 0 0 0 0 0 0
0.0% 0.0% 0.0% 0.0% 0.0% 1.1% 1.0% 0.0% 0.0% 0.0% 0.0% 0.0%0 0 0 0 0 1 1 0 0 0 0 0
0.0%0
1.8%1
0.0% 0.0%0 0
0.0% 0.0% 0.0% 0.0% 0.0% 0.0%0 0 0 0 0 0
0.0%0
0.0%0
1 In 2012 and 2013, FSIS did not sample products for Salmonella because in prior years the percent of pork carcass samples positive for Salmonella was consistently low2 Sulfamethoxazole was tested from 1996-2003 and was replaced by sulfisoxazole in 2004
Swin
e
Retail
HACCP
Cecal (Market Hogs)
Cecal (Sows)
HACCP
Turk
eys
Retail
HACCP
Cecal
Cecal (Beef)Cat
tle
Retail
Cecal (Dairy)
HACCP
Humans
Chi
cken
s
Retail
Cecal
Cecal (Dairy)
Swin
e
Retail
HACCP
Cecal (Market Hogs)
Cecal (Sows)
Cat
tle
HACCP
Cecal (Beef)
Retail
Turk
eys
Retail
HACCP
Cecal
HACCP
Cecal
Humans
Chi
cken
s
Retail
Swin
e
Retail
HACCP
Cecal (Market Hogs)
Cecal (Sows)
HACCP
Turk
eys
Retail
HACCP
Cecal
Cecal (Beef)Cat
tle
Retail
Cecal (Dairy)
HACCP
Cephems Humans
Chi
cken
s Retail
Cecal
Cat
tleSw
ine
Chi
cken
sTu
rkey
s
111
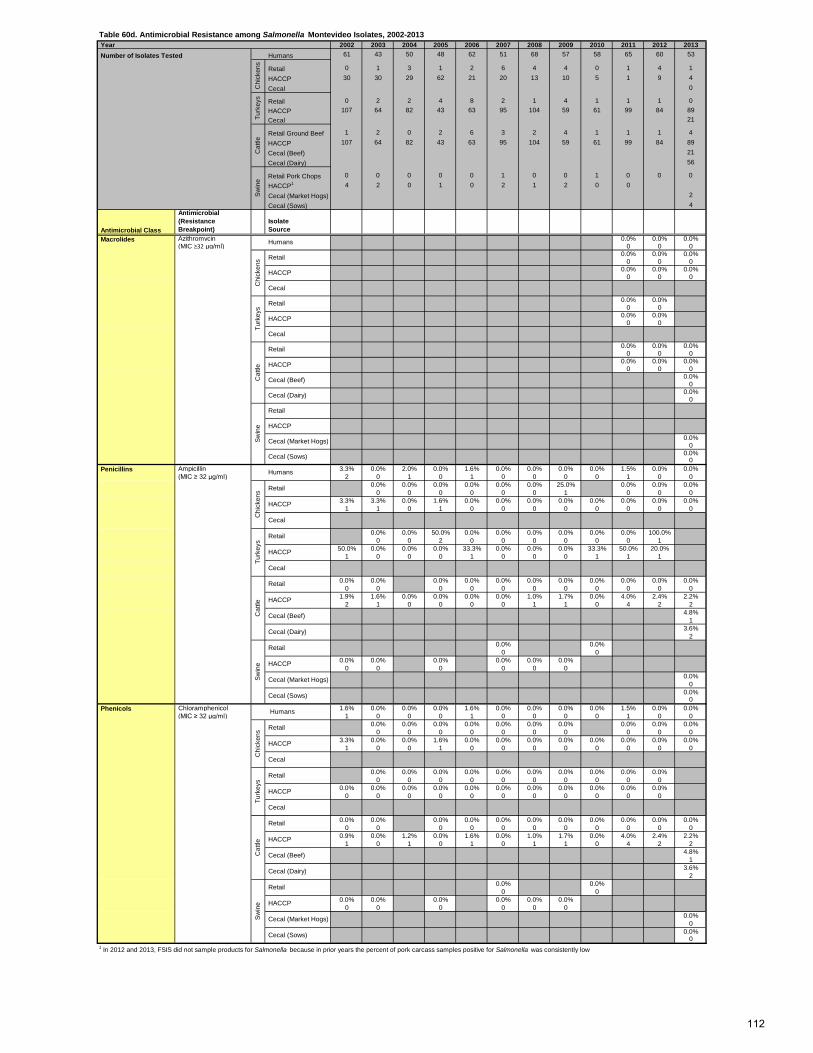
Table 60d. Antimicrobial Resistance among Salmonella Montevideo Isolates, 2002-2013 Year 2002 2003 2004 2005 2006 2007 2008 2009 2010 2011 2012 2013 Number of Isolates Tested Humans 61 43 50 48 62 51 68 57 58 65 60 53
Retail 0 1 3 1 2 6 4 4 0 1 4 1 HACCP 30 30 29 62 21 20 13 10 5 1 9 4 Cecal 0
Retail 0 2 2 4 8 2 1 4 1 1 1 0 HACCP 107 64 82 43 63 95 104 59 61 99 84 89 Cecal 21
Retail Ground Beef 1 2 0 2 6 3 2 4 1 1 1 4 HACCP 107 64 82 43 63 95 104 59 61 99 84 89 Cecal (Beef) 21 Cecal (Dairy) 56
Retail Pork Chops 0 0 0 0 0 1 0 0 1 0 0 0 HACCP1 4 2 0 1 0 2 1 2 0 0 Cecal (Market Hogs) 2 Cecal (Sows) 4
Antimicrobial Class
Antimicrobial (Resistance Breakpoint)
Isolate Source
Azithromycin 0.0% 0.0% 0.0% (MIC ≥32 µg/ml) 0 0 0
0.0% 0.0% 0.0%0 0 0
0.0% 0.0% 0.0%0 0 0
0.0% 0.0%0 0
0.0% 0.0%0 0
0.0% 0.0% 0.0%0 0 0
0.0% 0.0% 0.0%0 0 0
0.0%0
0.0%0
0.0%0
0.0%0
Ampicillin 3.3% 0.0% 2.0% 0.0% 1.6% 0.0% 0.0% 0.0% 0.0% 1.5% 0.0% 0.0% (MIC ≥ 32 µg/ml) 2 0 1 0 1 0 0 0 0 1 0 0
0.0% 0.0% 0.0% 0.0% 0.0% 0.0% 25.0% 0.0% 0.0% 0.0%0 0 0 0 0 0 1 0 0 0
3.3% 3.3% 0.0% 1.6% 0.0% 0.0% 0.0% 0.0% 0.0% 0.0% 0.0% 0.0%1 1 0 1 0 0 0 0 0 0 0 0
0.0% 0.0% 50.0% 0.0% 0.0% 0.0% 0.0% 0.0% 0.0% 100.0%0 0 2 0 0 0 0 0 0 1
50.0% 0.0% 0.0% 0.0% 33.3% 0.0% 0.0% 0.0% 33.3% 50.0% 20.0%1 0 0 0 1 0 0 0 1 1 1
0.0% 0.0% 0.0% 0.0% 0.0% 0.0% 0.0% 0.0% 0.0% 0.0% 0.0%0 0 0 0 0 0 0 0 0 0 0
1.9% 1.6% 0.0% 0.0% 0.0% 0.0% 1.0% 1.7% 0.0% 4.0% 2.4% 2.2%2 1 0 0 0 0 1 1 0 4 2 2
4.8%1
3.6%2
0.0% 0.0%0 0
0.0% 0.0% 0.0% 0.0% 0.0% 0.0%0 0 0 0 0 0
0.0%0
0.0%0
Chloramphenicol 1.6% 0.0% 0.0% 0.0% 1.6% 0.0% 0.0% 0.0% 0.0% 1.5% 0.0% 0.0% (MIC ≥ 32 µg/ml) 1 0 0 0 1 0 0 0 0 1 0 0
0.0% 0.0% 0.0% 0.0% 0.0% 0.0% 0.0% 0.0% 0.0% 0.0%0 0 0 0 0 0 0 0 0 0
3.3% 0.0% 0.0% 1.6% 0.0% 0.0% 0.0% 0.0% 0.0% 0.0% 0.0% 0.0%1 0 0 1 0 0 0 0 0 0 0 0
0.0% 0.0% 0.0% 0.0% 0.0% 0.0% 0.0% 0.0% 0.0% 0.0%0 0 0 0 0 0 0 0 0 0
0.0% 0.0% 0.0% 0.0% 0.0% 0.0% 0.0% 0.0% 0.0% 0.0% 0.0%0 0 0 0 0 0 0 0 0 0 0
0.0% 0.0% 0.0% 0.0% 0.0% 0.0% 0.0% 0.0% 0.0% 0.0% 0.0%0 0 0 0 0 0 0 0 0 0 0
0.9% 0.0% 1.2% 0.0% 1.6% 0.0% 1.0% 1.7% 0.0% 4.0% 2.4% 2.2%1 0 1 0 1 0 1 1 0 4 2 2
4.8%1
3.6%2
0.0% 0.0%0 0
0.0% 0.0% 0.0% 0.0% 0.0% 0.0%0 0 0 0 0 0
0.0%0
0.0%0
1 In 2012 and 2013, FSIS did not sample products for Salmonella because in prior years the percent of pork carcass samples positive for Salmonella was consistently low
Swin
e
Retail
HACCP
Cecal (Market Hogs)
Cecal (Sows)
HACCP
Turk
eys
Retail
HACCP
Cecal
Cecal (Beef)Cat
tle
Retail
Cecal (Dairy)
HACCP
Phenicols Humans
Chi
cken
s Retail
Cecal
Swin
e
Retail
HACCP
Cecal (Market Hogs)
Cecal (Sows)
Cecal (Beef)Cat
tle
Retail
Cecal (Dairy)
HACCP
Turk
eys
Retail
HACCP
Cecal
HACCP
Penicillins Humans
Chi
cken
s Retail
Cecal
Chi
cken
sSw
ine
Retail
HACCP
Cecal (Market Hogs)
Cecal (Sows)
Cat
tle
Retail
HACCP
Turk
eys
Retail
HACCP
Cecal
Cecal (Dairy)
HACCP
Cecal
Retail
Cecal (Beef)
Chi
cken
sTu
rkey
sC
attle
Swin
e
Macrolides Humans
112
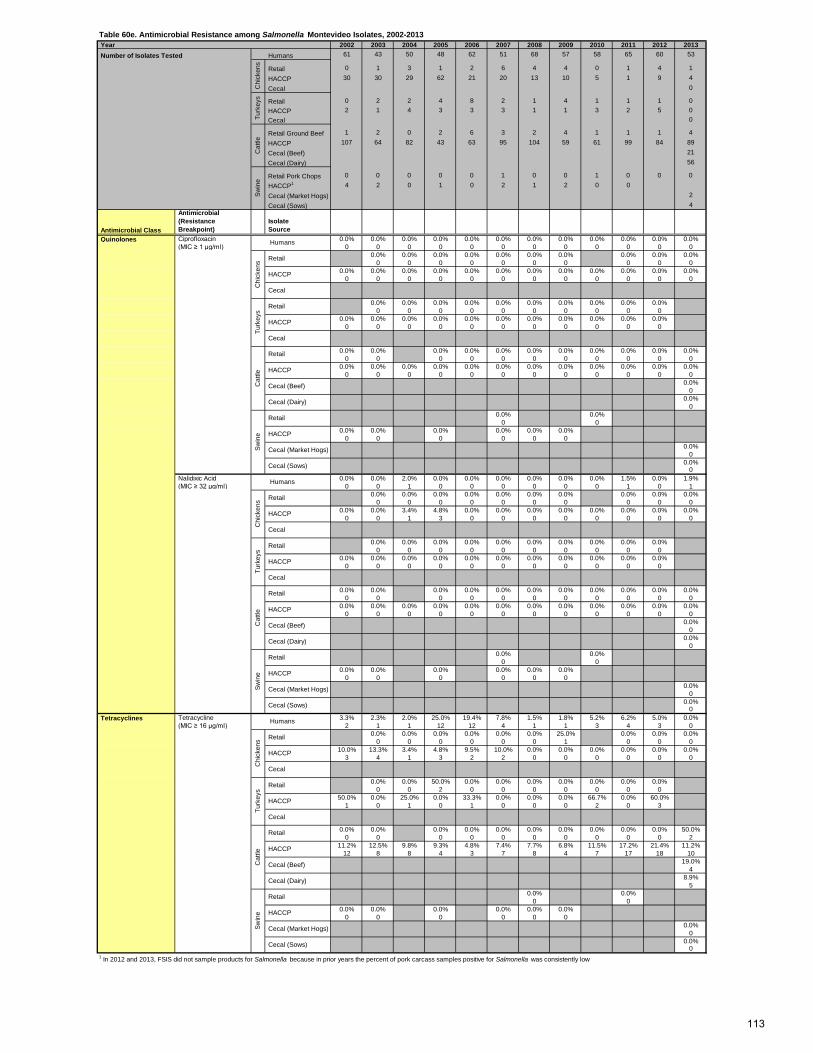
Table 60e. Antimicrobial Resistance among Salmonella Montevideo Isolates, 2002-2013 Year 2002 2003 2004 2005 2006 2007 2008 2009 2010 2011 2012 2013 Number of Isolates Tested Humans 61 43 50 48 62 51 68 57 58 65 60 53
Retail 0 1 3 1 2 6 4 4 0 1 4 1 HACCP 30 30 29 62 21 20 13 10 5 1 9 4 Cecal 0
Retail 0 2 2 4 8 2 1 4 1 1 1 0 HACCP 2 1 4 3 3 3 1 1 3 2 5 0 Cecal 0
Retail Ground Beef 1 2 0 2 6 3 2 4 1 1 1 4 HACCP 107 64 82 43 63 95 104 59 61 99 84 89 Cecal (Beef) 21 Cecal (Dairy) 56
Retail Pork Chops 0 0 0 0 0 1 0 0 1 0 0 0 HACCP1 4 2 0 1 0 2 1 2 0 0 Cecal (Market Hogs) 2 Cecal (Sows) 4
Antimicrobial Class
Antimicrobial (Resistance Breakpoint)
Isolate Source
Quinolones Ciprofloxacin 0.0% 0.0% 0.0% 0.0% 0.0% 0.0% 0.0% 0.0% 0.0% 0.0% 0.0% 0.0% (MIC ≥ 1 µg/ml) 0 0 0 0 0 0 0 0 0 0 0 0
0.0% 0.0% 0.0% 0.0% 0.0% 0.0% 0.0% 0.0% 0.0% 0.0%0 0 0 0 0 0 0 0 0 0
0.0% 0.0% 0.0% 0.0% 0.0% 0.0% 0.0% 0.0% 0.0% 0.0% 0.0% 0.0%0 0 0 0 0 0 0 0 0 0 0 0
0.0% 0.0% 0.0% 0.0% 0.0% 0.0% 0.0% 0.0% 0.0% 0.0%0 0 0 0 0 0 0 0 0 0
0.0% 0.0% 0.0% 0.0% 0.0% 0.0% 0.0% 0.0% 0.0% 0.0% 0.0%0 0 0 0 0 0 0 0 0 0 0
0.0% 0.0% 0.0% 0.0% 0.0% 0.0% 0.0% 0.0% 0.0% 0.0% 0.0%0 0 0 0 0 0 0 0 0 0 0
0.0% 0.0% 0.0% 0.0% 0.0% 0.0% 0.0% 0.0% 0.0% 0.0% 0.0% 0.0%0 0 0 0 0 0 0 0 0 0 0 0
0.0%0
0.0%0
0.0% 0.0%0 0
0.0% 0.0% 0.0% 0.0% 0.0% 0.0%0 0 0 0 0 0
0.0%0
0.0%0
Nalidixic Acid 0.0% 0.0% 2.0% 0.0% 0.0% 0.0% 0.0% 0.0% 0.0% 1.5% 0.0% 1.9% (MIC ≥ 32 µg/ml) 0 0 1 0 0 0 0 0 0 1 0 1
0.0% 0.0% 0.0% 0.0% 0.0% 0.0% 0.0% 0.0% 0.0% 0.0%0 0 0 0 0 0 0 0 0 0
0.0% 0.0% 3.4% 4.8% 0.0% 0.0% 0.0% 0.0% 0.0% 0.0% 0.0% 0.0%0 0 1 3 0 0 0 0 0 0 0 0
0.0% 0.0% 0.0% 0.0% 0.0% 0.0% 0.0% 0.0% 0.0% 0.0%0 0 0 0 0 0 0 0 0 0
0.0% 0.0% 0.0% 0.0% 0.0% 0.0% 0.0% 0.0% 0.0% 0.0% 0.0%0 0 0 0 0 0 0 0 0 0 0
0.0% 0.0% 0.0% 0.0% 0.0% 0.0% 0.0% 0.0% 0.0% 0.0% 0.0%0 0 0 0 0 0 0 0 0 0 0
0.0% 0.0% 0.0% 0.0% 0.0% 0.0% 0.0% 0.0% 0.0% 0.0% 0.0% 0.0%0 0 0 0 0 0 0 0 0 0 0 0
0.0%0
0.0%0
0.0% 0.0%0 0
0.0% 0.0% 0.0% 0.0% 0.0% 0.0%0 0 0 0 0 0
0.0%0
0.0%0
Tetracycline 3.3% 2.3% 2.0% 25.0% 19.4% 7.8% 1.5% 1.8% 5.2% 6.2% 5.0% 0.0% (MIC ≥ 16 µg/ml) 2 1 1 12 12 4 1 1 3 4 3 0
0.0% 0.0% 0.0% 0.0% 0.0% 0.0% 25.0% 0.0% 0.0% 0.0%0 0 0 0 0 0 1 0 0 0
10.0% 13.3% 3.4% 4.8% 9.5% 10.0% 0.0% 0.0% 0.0% 0.0% 0.0% 0.0%3 4 1 3 2 2 0 0 0 0 0 0
0.0% 0.0% 50.0% 0.0% 0.0% 0.0% 0.0% 0.0% 0.0% 0.0%0 0 2 0 0 0 0 0 0 0
50.0% 0.0% 25.0% 0.0% 33.3% 0.0% 0.0% 0.0% 66.7% 0.0% 60.0%1 0 1 0 1 0 0 0 2 0 3
0.0% 0.0% 0.0% 0.0% 0.0% 0.0% 0.0% 0.0% 0.0% 0.0% 50.0%0 0 0 0 0 0 0 0 0 0 2
11.2% 12.5% 9.8% 9.3% 4.8% 7.4% 7.7% 6.8% 11.5% 17.2% 21.4% 11.2%12 8 8 4 3 7 8 4 7 17 18 10
19.0%4
8.9%5
0.0% 0.0%0 0
0.0% 0.0% 0.0% 0.0% 0.0% 0.0%0 0 0 0 0 0
0.0%0
0.0%0
1 In 2012 and 2013, FSIS did not sample products for Salmonella because in prior years the percent of pork carcass samples positive for Salmonella was consistently low
Cecal (Market Hogs)
Cecal (Sows)
Cecal (Beef)
Cecal (Dairy)
Swin
e
Retail
HACCP
Cat
tle
Retail
HACCP
Cecal
Turk
eys
Retail
HACCP
HACCP
Tetracyclines Humans
Chi
cken
s Retail
Cecal
Cecal (Dairy)
Swin
e
Retail
HACCP
Cecal (Market Hogs)
Cecal (Sows)
Cat
tle
Cecal (Dairy)
HACCP
Cecal (Beef)
Retail
Cecal
Turk
eys
Retail
HACCP
Cecal
Humans
Chi
cken
s Retail
Swin
e
Retail
HACCP
Cecal (Market Hogs)
Cecal (Sows)
HACCP
Cat
tleTu
rkey
s
Retail
HACCP
Cecal
Chi
cken
s
HACCP
Cecal (Beef)
Retail
HACCP
Cecal
RetailC
hick
ens
Turk
eys
Cat
tleSw
ine
Humans
113
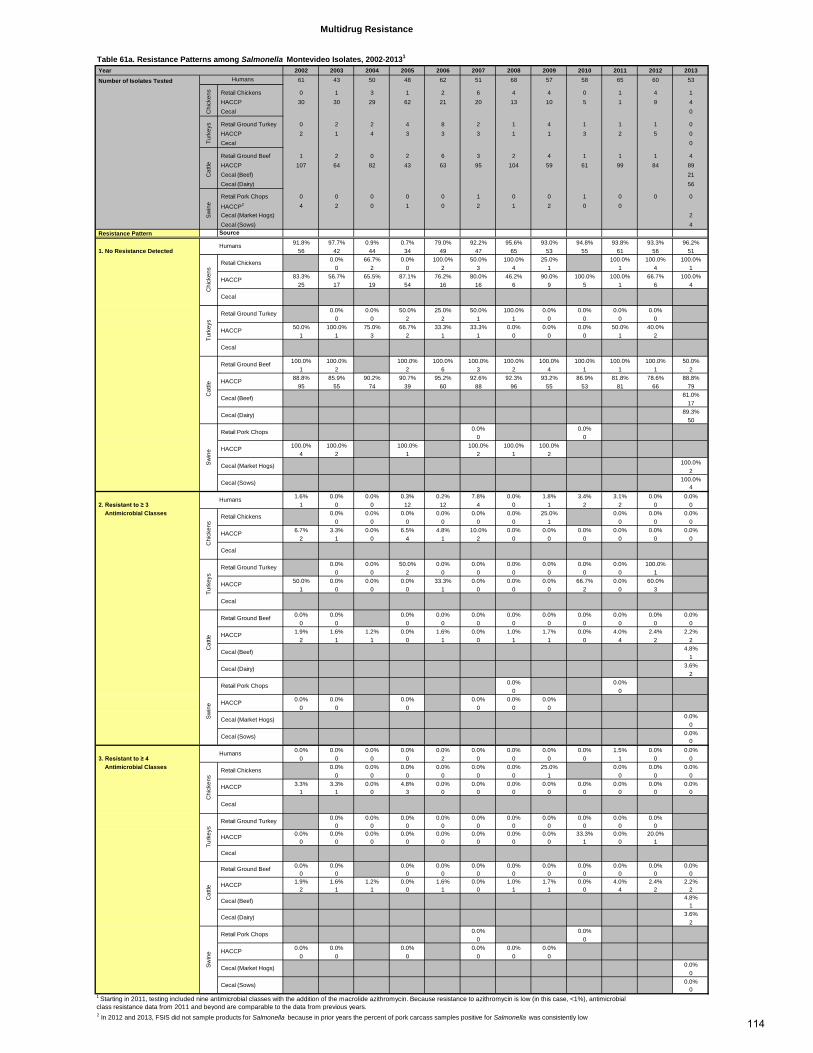
Table 61a. Resistance Patterns among Salmonella Montevideo Isolates, 2002-20131
Year 2002 2003 2004 2005 2006 2007 2008 2009 2010 2011 2012 2013
Number of Isolates Tested 61 43 50 48 62 51 68 57 58 65 60 53
Retail Chickens 0 1 3 1 2 6 4 4 0 1 4 1 HACCP 30 30 29 62 21 20 13 10 5 1 9 4 Cecal 0
Retail Ground Turkey 0 2 2 4 8 2 1 4 1 1 1 0 HACCP 2 1 4 3 3 3 1 1 3 2 5 0 Cecal 0
Retail Ground Beef 1 2 0 2 6 3 2 4 1 1 1 4 HACCP 107 64 82 43 63 95 104 59 61 99 84 89 Cecal (Beef) 21 Cecal (Dairy) 56
Retail Pork Chops 0 0 0 0 0 1 0 0 1 0 0 0
HACCP2 4 2 0 1 0 2 1 2 0 0 Cecal (Market Hogs) 2 Cecal (Sows) 4
Resistance Pattern Source91.8% 97.7% 0.9% 0.7% 79.0% 92.2% 95.6% 93.0% 94.8% 93.8% 93.3% 96.2%
1. No Resistance Detected 56 42 44 34 49 47 65 53 55 61 56 510.0% 66.7% 0.0% 100.0% 50.0% 100.0% 25.0% 100.0% 100.0% 100.0%
0 2 0 2 3 4 1 1 4 183.3% 56.7% 65.5% 87.1% 76.2% 80.0% 46.2% 90.0% 100.0% 100.0% 66.7% 100.0%
25 17 19 54 16 16 6 9 5 1 6 4
0.0% 0.0% 50.0% 25.0% 50.0% 100.0% 0.0% 0.0% 0.0% 0.0%0 0 2 2 1 1 0 0 0 0
50.0% 100.0% 75.0% 66.7% 33.3% 33.3% 0.0% 0.0% 0.0% 50.0% 40.0%1 1 3 2 1 1 0 0 0 1 2
100.0% 100.0% 100.0% 100.0% 100.0% 100.0% 100.0% 100.0% 100.0% 100.0% 50.0%1 2 2 6 3 2 4 1 1 1 2
88.8% 85.9% 90.2% 90.7% 95.2% 92.6% 92.3% 93.2% 86.9% 81.8% 78.6% 88.8%95 55 74 39 60 88 96 55 53 81 66 79
81.0%17
89.3%50
0.0% 0.0%0 0
100.0% 100.0% 100.0% 100.0% 100.0% 100.0%4 2 1 2 1 2
100.0%2
100.0%4
1.6% 0.0% 0.0% 0.3% 0.2% 7.8% 0.0% 1.8% 3.4% 3.1% 0.0% 0.0% 2. Resistant to ≥ 3 1 0 0 12 12 4 0 1 2 2 0 0 Antimicrobial Classes 0.0% 0.0% 0.0% 0.0% 0.0% 0.0% 25.0% 0.0% 0.0% 0.0%
0 0 0 0 0 0 1 0 0 06.7% 3.3% 0.0% 6.5% 4.8% 10.0% 0.0% 0.0% 0.0% 0.0% 0.0% 0.0%
2 1 0 4 1 2 0 0 0 0 0 0
0.0% 0.0% 50.0% 0.0% 0.0% 0.0% 0.0% 0.0% 0.0% 100.0%0 0 2 0 0 0 0 0 0 1
50.0% 0.0% 0.0% 0.0% 33.3% 0.0% 0.0% 0.0% 66.7% 0.0% 60.0%1 0 0 0 1 0 0 0 2 0 3
0.0% 0.0% 0.0% 0.0% 0.0% 0.0% 0.0% 0.0% 0.0% 0.0% 0.0%0 0 0 0 0 0 0 0 0 0 0
1.9% 1.6% 1.2% 0.0% 1.6% 0.0% 1.0% 1.7% 0.0% 4.0% 2.4% 2.2%2 1 1 0 1 0 1 1 0 4 2 2
4.8%1
3.6%2
0.0% 0.0%0 0
0.0% 0.0% 0.0% 0.0% 0.0% 0.0%0 0 0 0 0 0
0.0%0
0.0%0
0.0% 0.0% 0.0% 0.0% 0.0% 0.0% 0.0% 0.0% 0.0% 1.5% 0.0% 0.0% 3. Resistant to ≥ 4 0 0 0 0 2 0 0 0 0 1 0 0 Antimicrobial Classes 0.0% 0.0% 0.0% 0.0% 0.0% 0.0% 25.0% 0.0% 0.0% 0.0%
0 0 0 0 0 0 1 0 0 03.3% 3.3% 0.0% 4.8% 0.0% 0.0% 0.0% 0.0% 0.0% 0.0% 0.0% 0.0%
1 1 0 3 0 0 0 0 0 0 0 0
0.0% 0.0% 0.0% 0.0% 0.0% 0.0% 0.0% 0.0% 0.0% 0.0%0 0 0 0 0 0 0 0 0 0
0.0% 0.0% 0.0% 0.0% 0.0% 0.0% 0.0% 0.0% 33.3% 0.0% 20.0%0 0 0 0 0 0 0 0 1 0 1
0.0% 0.0% 0.0% 0.0% 0.0% 0.0% 0.0% 0.0% 0.0% 0.0% 0.0%0 0 0 0 0 0 0 0 0 0 0
1.9% 1.6% 1.2% 0.0% 1.6% 0.0% 1.0% 1.7% 0.0% 4.0% 2.4% 2.2%2 1 1 0 1 0 1 1 0 4 2 2
4.8%1
3.6%2
0.0% 0.0%0 0
0.0% 0.0% 0.0% 0.0% 0.0% 0.0%0 0 0 0 0 0
0.0%0
0.0%0
2 In 2012 and 2013, FSIS did not sample products for Salmonella because in prior years the percent of pork carcass samples positive for Salmonella was consistently low
Sw
ine
Humans
Chi
cken
s
Retail Chickens
HACCP
Cecal
Cat
tle
Retail Ground Beef
HACCP
Cecal (Beef)
Cecal (Dairy)
Chi
cken
s
Retail Chickens
HACCP
Cecal
Turk
eys
Retail Ground Turkey
Multidrug Resistance
Humans
Chi
cken
sTu
rkey
sC
attle
Turk
eys
Retail Ground Turkey
HACCP
Cecal
HACCP
Cecal
Sw
ine
Retail Pork Chops
HACCP
Cecal (Market Hogs)
Cecal (Sows)
Humans
Cat
tle
Retail Ground Beef
HACCP
Cecal (Beef)
Cecal (Dairy)
Sw
ine
Retail Pork Chops
HACCP
Cecal (Market Hogs)
Cecal (Sows)
Humans
Chi
cken
s
Retail Chickens
HACCP
Cecal
1 Starting in 2011, testing included nine antimicrobial classes with the addition of the macrolide azithromycin. Because resistance to azithromycin is low (in this case, <1%), antimicrobial class resistance data from 2011 and beyond are comparable to the data from previous years.
Turk
eys
Retail Ground Turkey
HACCP
Cecal
Cat
tle
Retail Ground Beef
HACCP
Cecal (Beef)
Cecal (Dairy)
Sw
ine
Retail Pork Chops
HACCP
Cecal (Market Hogs)
Cecal (Sows)
114
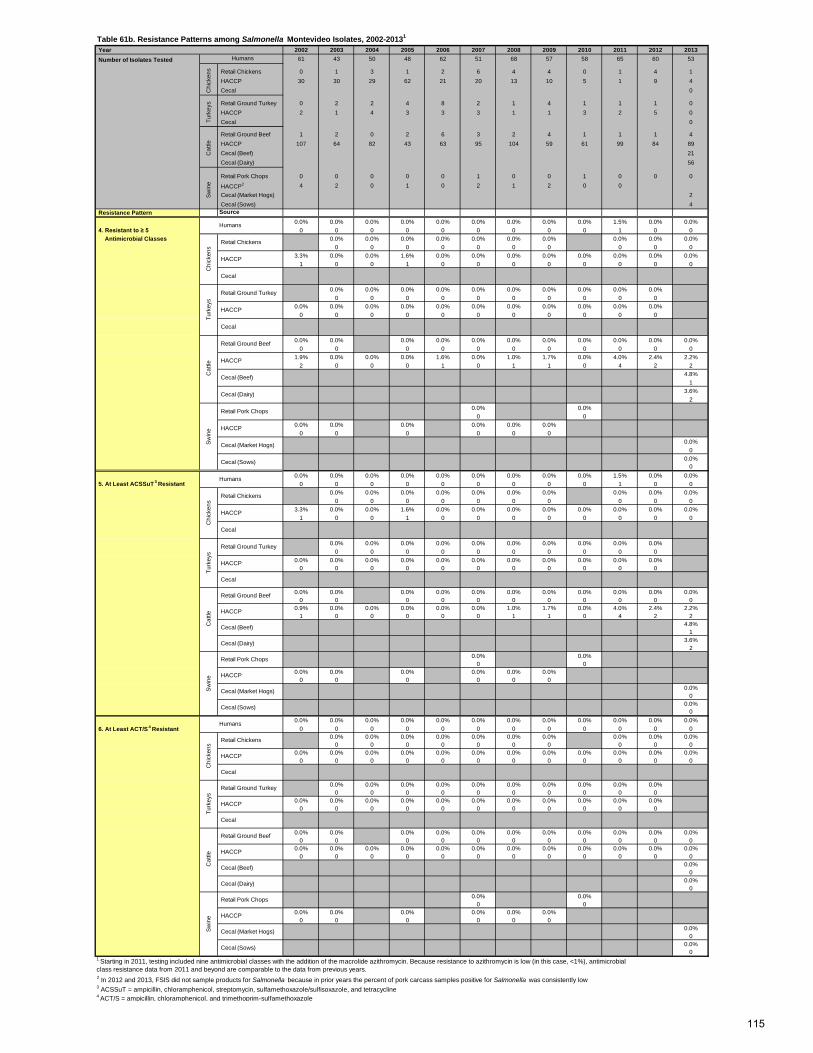
Table 61b. Resistance Patterns among Salmonella Montevideo Isolates, 2002-20131
Year 2002 2003 2004 2005 2006 2007 2008 2009 2010 2011 2012 2013 Number of Isolates Tested 61 43 50 48 62 51 68 57 58 65 60 53
Retail Chickens 0 1 3 1 2 6 4 4 0 1 4 1 HACCP 30 30 29 62 21 20 13 10 5 1 9 4 Cecal 0
Retail Ground Turkey 0 2 2 4 8 2 1 4 1 1 1 0 HACCP 2 1 4 3 3 3 1 1 3 2 5 0 Cecal 0
Retail Ground Beef 1 2 0 2 6 3 2 4 1 1 1 4 HACCP 107 64 82 43 63 95 104 59 61 99 84 89 Cecal (Beef) 21 Cecal (Dairy) 56
Retail Pork Chops 0 0 0 0 0 1 0 0 1 0 0 0
HACCP2 4 2 0 1 0 2 1 2 0 0 Cecal (Market Hogs) 2 Cecal (Sows) 4
Resistance Pattern Source0.0% 0.0% 0.0% 0.0% 0.0% 0.0% 0.0% 0.0% 0.0% 1.5% 0.0% 0.0%
4. Resistant to ≥ 5 0 0 0 0 0 0 0 0 0 1 0 0 Antimicrobial Classes 0.0% 0.0% 0.0% 0.0% 0.0% 0.0% 0.0% 0.0% 0.0% 0.0%
0 0 0 0 0 0 0 0 0 03.3% 0.0% 0.0% 1.6% 0.0% 0.0% 0.0% 0.0% 0.0% 0.0% 0.0% 0.0%
1 0 0 1 0 0 0 0 0 0 0 0
0.0% 0.0% 0.0% 0.0% 0.0% 0.0% 0.0% 0.0% 0.0% 0.0%0 0 0 0 0 0 0 0 0 0
0.0% 0.0% 0.0% 0.0% 0.0% 0.0% 0.0% 0.0% 0.0% 0.0% 0.0%0 0 0 0 0 0 0 0 0 0 0
0.0% 0.0% 0.0% 0.0% 0.0% 0.0% 0.0% 0.0% 0.0% 0.0% 0.0%0 0 0 0 0 0 0 0 0 0 0
1.9% 0.0% 0.0% 0.0% 1.6% 0.0% 1.0% 1.7% 0.0% 4.0% 2.4% 2.2%2 0 0 0 1 0 1 1 0 4 2 2
4.8%1
3.6%2
0.0% 0.0%0 0
0.0% 0.0% 0.0% 0.0% 0.0% 0.0%0 0 0 0 0 0
0.0%0
0.0%0
0.0% 0.0% 0.0% 0.0% 0.0% 0.0% 0.0% 0.0% 0.0% 1.5% 0.0% 0.0% 5. At Least ACSSuT
3 Resistant 0 0 0 0 0 0 0 0 0 1 0 00.0% 0.0% 0.0% 0.0% 0.0% 0.0% 0.0% 0.0% 0.0% 0.0%
0 0 0 0 0 0 0 0 0 03.3% 0.0% 0.0% 1.6% 0.0% 0.0% 0.0% 0.0% 0.0% 0.0% 0.0% 0.0%
1 0 0 1 0 0 0 0 0 0 0 0
0.0% 0.0% 0.0% 0.0% 0.0% 0.0% 0.0% 0.0% 0.0% 0.0%0 0 0 0 0 0 0 0 0 0
0.0% 0.0% 0.0% 0.0% 0.0% 0.0% 0.0% 0.0% 0.0% 0.0% 0.0%0 0 0 0 0 0 0 0 0 0 0
0.0% 0.0% 0.0% 0.0% 0.0% 0.0% 0.0% 0.0% 0.0% 0.0% 0.0%0 0 0 0 0 0 0 0 0 0 0
0.9% 0.0% 0.0% 0.0% 0.0% 0.0% 1.0% 1.7% 0.0% 4.0% 2.4% 2.2%1 0 0 0 0 0 1 1 0 4 2 2
4.8%1
3.6%2
0.0% 0.0%0 0
0.0% 0.0% 0.0% 0.0% 0.0% 0.0%0 0 0 0 0 0
0.0%0
0.0%0
0.0% 0.0% 0.0% 0.0% 0.0% 0.0% 0.0% 0.0% 0.0% 0.0% 0.0% 0.0% 6. At Least ACT/S
4 Resistant 0 0 0 0 0 0 0 0 0 0 0 00.0% 0.0% 0.0% 0.0% 0.0% 0.0% 0.0% 0.0% 0.0% 0.0%
0 0 0 0 0 0 0 0 0 00.0% 0.0% 0.0% 0.0% 0.0% 0.0% 0.0% 0.0% 0.0% 0.0% 0.0% 0.0%
0 0 0 0 0 0 0 0 0 0 0 0
0.0% 0.0% 0.0% 0.0% 0.0% 0.0% 0.0% 0.0% 0.0% 0.0%0 0 0 0 0 0 0 0 0 0
0.0% 0.0% 0.0% 0.0% 0.0% 0.0% 0.0% 0.0% 0.0% 0.0% 0.0%0 0 0 0 0 0 0 0 0 0 0
0.0% 0.0% 0.0% 0.0% 0.0% 0.0% 0.0% 0.0% 0.0% 0.0% 0.0%0 0 0 0 0 0 0 0 0 0 0
0.0% 0.0% 0.0% 0.0% 0.0% 0.0% 0.0% 0.0% 0.0% 0.0% 0.0% 0.0%0 0 0 0 0 0 0 0 0 0 0 0
0.0%0
0.0%0
0.0% 0.0%0 0
0.0% 0.0% 0.0% 0.0% 0.0% 0.0%0 0 0 0 0 0
0.0%0
0.0%0
2 In 2012 and 2013, FSIS did not sample products for Salmonella because in prior years the percent of pork carcass samples positive for Salmonella was consistently low3 ACSSuT = ampicillin, chloramphenicol, streptomycin, sulfamethoxazole/sulfisoxazole, and tetracycline4 ACT/S = ampicillin, chloramphenicol, and trimethoprim-sulfamethoxazole
1 Starting in 2011, testing included nine antimicrobial classes with the addition of the macrolide azithromycin. Because resistance to azithromycin is low (in this case, <1%), antimicrobial class resistance data from 2011 and beyond are comparable to the data from previous years.
HACCP
Cecal
Humans
Chi
cken
sTu
rkey
sS
win
e
Retail Pork Chops
HACCP
Cecal (Market Hogs)
Cecal (Sows)
Cat
tleS
win
e
Humans
Chi
cken
s
Retail Chickens
HACCP
Cecal
Turk
eys
Retail Ground Turkey
HACCP
Cecal
Cat
tle
Retail Ground Beef
HACCP
Cecal (Beef)
Cecal (Dairy)
Humans
Chi
cken
s
Retail Chickens
Turk
eys
Retail Ground Turkey
HACCP
Cecal
Cat
tle
Retail Ground Beef
HACCP
Cecal (Beef)
Cecal (Dairy)
Chi
cken
s
Retail Chickens
HACCP
Cecal
Turk
eys
Retail Ground Turkey
HACCP
Cecal
Sw
ine
Retail Pork Chops
HACCP
Cecal (Market Hogs)
Cecal (Sows)
Humans
Cat
tle
Retail Ground Beef
HACCP
Cecal (Beef)
Cecal (Dairy)
Sw
ine
Retail Pork Chops
HACCP
Cecal (Market Hogs)
Cecal (Sows)
115
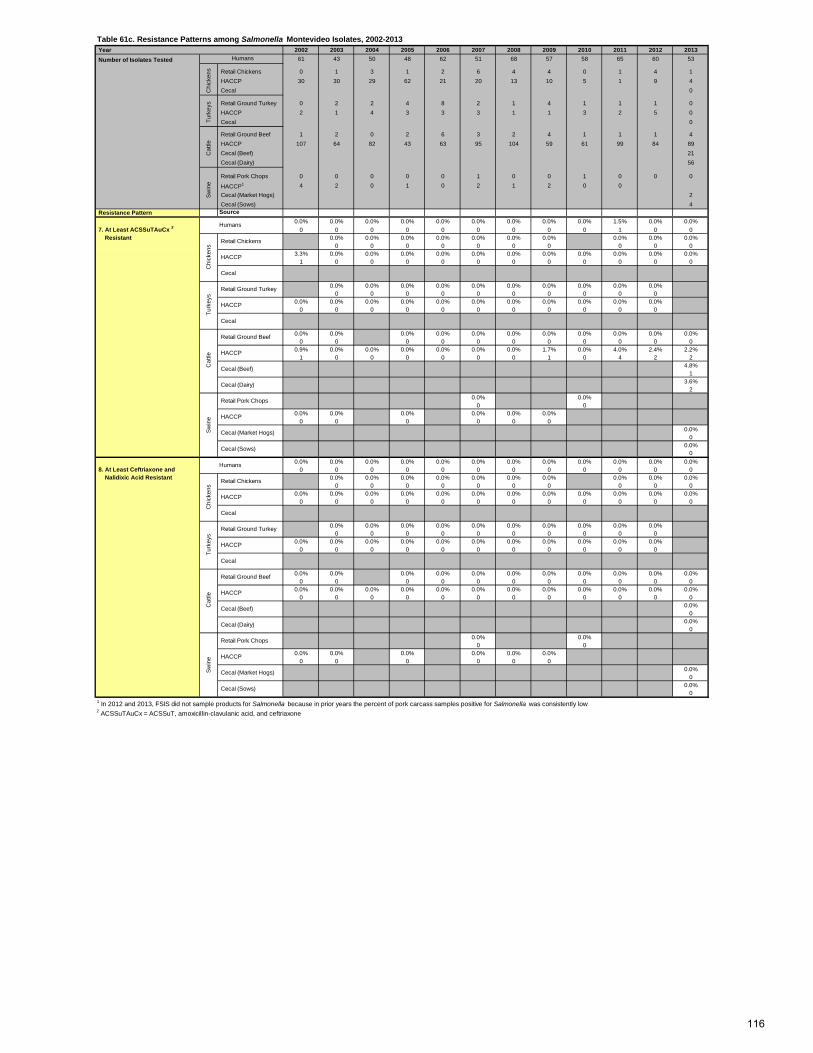
Table 61c. Resistance Patterns among Salmonella Montevideo Isolates, 2002-2013 Year 2002 2003 2004 2005 2006 2007 2008 2009 2010 2011 2012 2013 Number of Isolates Tested 61 43 50 48 62 51 68 57 58 65 60 53
Retail Chickens 0 1 3 1 2 6 4 4 0 1 4 1 HACCP 30 30 29 62 21 20 13 10 5 1 9 4 Cecal 0
Retail Ground Turkey 0 2 2 4 8 2 1 4 1 1 1 0 HACCP 2 1 4 3 3 3 1 1 3 2 5 0 Cecal 0
Retail Ground Beef 1 2 0 2 6 3 2 4 1 1 1 4 HACCP 107 64 82 43 63 95 104 59 61 99 84 89 Cecal (Beef) 21 Cecal (Dairy) 56
Retail Pork Chops 0 0 0 0 0 1 0 0 1 0 0 0
HACCP1 4 2 0 1 0 2 1 2 0 0 Cecal (Market Hogs) 2 Cecal (Sows) 4
Resistance Pattern Source0.0% 0.0% 0.0% 0.0% 0.0% 0.0% 0.0% 0.0% 0.0% 1.5% 0.0% 0.0%
7. At Least ACSSuTAuCx 2 0 0 0 0 0 0 0 0 0 1 0 0 Resistant 0.0% 0.0% 0.0% 0.0% 0.0% 0.0% 0.0% 0.0% 0.0% 0.0%
0 0 0 0 0 0 0 0 0 03.3% 0.0% 0.0% 0.0% 0.0% 0.0% 0.0% 0.0% 0.0% 0.0% 0.0% 0.0%
1 0 0 0 0 0 0 0 0 0 0 0
0.0% 0.0% 0.0% 0.0% 0.0% 0.0% 0.0% 0.0% 0.0% 0.0%0 0 0 0 0 0 0 0 0 0
0.0% 0.0% 0.0% 0.0% 0.0% 0.0% 0.0% 0.0% 0.0% 0.0% 0.0%0 0 0 0 0 0 0 0 0 0 0
0.0% 0.0% 0.0% 0.0% 0.0% 0.0% 0.0% 0.0% 0.0% 0.0% 0.0%0 0 0 0 0 0 0 0 0 0 0
0.9% 0.0% 0.0% 0.0% 0.0% 0.0% 0.0% 1.7% 0.0% 4.0% 2.4% 2.2%1 0 0 0 0 0 0 1 0 4 2 2
4.8%1
3.6%2
0.0% 0.0%0 0
0.0% 0.0% 0.0% 0.0% 0.0% 0.0%0 0 0 0 0 0
0.0%0
0.0%0
0.0% 0.0% 0.0% 0.0% 0.0% 0.0% 0.0% 0.0% 0.0% 0.0% 0.0% 0.0% 8. At Least Ceftriaxone and 0 0 0 0 0 0 0 0 0 0 0 0 Nalidixic Acid Resistant 0.0% 0.0% 0.0% 0.0% 0.0% 0.0% 0.0% 0.0% 0.0% 0.0%
0 0 0 0 0 0 0 0 0 00.0% 0.0% 0.0% 0.0% 0.0% 0.0% 0.0% 0.0% 0.0% 0.0% 0.0% 0.0%
0 0 0 0 0 0 0 0 0 0 0 0
0.0% 0.0% 0.0% 0.0% 0.0% 0.0% 0.0% 0.0% 0.0% 0.0%0 0 0 0 0 0 0 0 0 0
0.0% 0.0% 0.0% 0.0% 0.0% 0.0% 0.0% 0.0% 0.0% 0.0% 0.0%0 0 0 0 0 0 0 0 0 0 0
0.0% 0.0% 0.0% 0.0% 0.0% 0.0% 0.0% 0.0% 0.0% 0.0% 0.0%0 0 0 0 0 0 0 0 0 0 0
0.0% 0.0% 0.0% 0.0% 0.0% 0.0% 0.0% 0.0% 0.0% 0.0% 0.0% 0.0%0 0 0 0 0 0 0 0 0 0 0 0
0.0%0
0.0%0
0.0% 0.0%0 0
0.0% 0.0% 0.0% 0.0% 0.0% 0.0%0 0 0 0 0 0
0.0%0
0.0%0
1 In 2012 and 2013, FSIS did not sample products for Salmonella because in prior years the percent of pork carcass samples positive for Salmonella was consistently low2 ACSSuTAuCx = ACSSuT, amoxicillin-clavulanic acid, and ceftriaxone
Humans
Chi
cken
sTu
rkey
sC
attle
Sw
ine
Humans
Chi
cken
s
Retail Chickens
HACCP
Cecal
Turk
eys
Retail Ground Turkey
HACCP
Cecal
Cat
tle
Retail Ground Beef
HACCP
Cecal (Beef)
Cecal (Dairy)
Sw
ine
Retail Pork Chops
HACCP
Cecal (Market Hogs)
Cecal (Sows)
Humans
Chi
cken
s
Retail Chickens
HACCP
Cecal
Turk
eys
Retail Ground Turkey
HACCP
Cecal
Cat
tle
Retail Ground Beef
HACCP
Cecal (Beef)
Cecal (Dairy)
Sw
ine
Retail Pork Chops
HACCP
Cecal (Market Hogs)
Cecal (Sows)
116

Table 62a. Antimicrobial Resistance among Salmonella Anatum Isolates, 2002-2013 Year 2002 2003 2004 2005 2006 2007 2008 2009 2010 2011 2012 2013
Humans 22 18 16 12 10 18 14 13 19 16 16 20
Retail Chickens 0 0 0 1 1 0 2 0 1 1 1 0 HACCP 4 2 4 1 6 0 1 1 1 1 0 0 Cecal 0
Retail 0 1 0 1 0 1 7 1 0 0 2 2 HACCP 0 0 1 1 9 1 1 2 6 0 3 2 Cecal 0
Retail 2 0 0 0 2 1 0 0 1 0 1 1 HACCP 94 61 68 22 26 23 34 7 14 18 18 16 Cecal (Beef) 18 Cecal (Dairy) 18
Retail 0 0 0 2 0 0 0 0 1 0 0 0 HACCP1 21 10 32 19 61 13 5 10 5 8 Cecal (Market Hogs) 33 Cecal (Sows) 43
Antimicrobial Class
Antimicrobial (Resistance Breakpoint)
Isolate Source
Aminoglycosides Gentamicin 0.0% 0.0% 0.0% 0.0% 0.0% 0.0% 7.1% 0.0% 0.0% 0.0% 12.5% 0.0% (MIC ≥ 16 µg/ml) 0 0 0 0 0 0 1 0 0 0 2 0
0.0% 0.0% 0.0% 0.0% 0.0% 100.0%0 0 0 0 0 1
0.0% 0.0% 0.0% 0.0% 0.0% 0.0% 100.0% 0.0% 0.0%0 0 0 0 0 0 1 0 0
0.0% 0.0% 100.0% 14.3% 0.0% 100.0% 0.0%0 0 1 1 0 2 0
0.0% 0.0% 22.2% 0.0% 0.0% 0.0% 66.7% 0.0% 0.0%0 0 2 0 0 0 4 0 0
0.0% 0.0% 0.0% 0.0% 0.0% 0.0%0 0 0 0 0 0
0.0% 0.0% 0.0% 0.0% 0.0% 0.0% 0.0% 0.0% 0.0% 0.0% 0.0% 0.0%0 0 0 0 0 0 0 0 0 0 0 0
0.0%0
0.0%0
0.0% 100.0%0 1
0.0% 0.0% 0.0% 0.0% 0.0% 0.0% 0.0% 0.0% 0.0% 0.0%0 0 0 0 0 0 0 0 0 0
0.0%0
0.0%0
Kanamycin 0.0% 0.0% 6.3% 0.0% 0.0% 0.0% 7.1% 0.0% 5.3% 0.0% 12.5% 0.0% (MIC ≥ 64 µg/ml) 0 0 1 0 0 0 1 0 1 0 2 0
0.0% 0.0% 0.0% 0.0% 0.0% 0.0%0 0 0 0 0 0
0.0% 0.0% 0.0% 0.0% 0.0% 0.0% 0.0% 0.0% 0.0%0 0 0 0 0 0 0 0 0
0.0% 0.0% 0.0% 0.0% 0.0% 0.0% 0.0%0 0 0 0 0 0 0
0.0% 0.0% 22.2% 0.0% 0.0% 0.0% 66.7% 0.0% 0.0%0 0 2 0 0 0 4 0 0
0.0% 0.0% 0.0% 0.0% 0.0% 0.0%0 0 0 0 0 0
0.0% 0.0% 0.0% 0.0% 0.0% 0.0% 0.0% 0.0% 0.0% 0.0% 0.0% 0.0%0 0 0 0 0 0 0 0 0 0 0 0
0.0%0
0.0%0
0.0% 0.0%0 0
0.0% 0.0% 0.0% 0.0% 0.0% 0.0% 0.0% 0.0% 0.0% 0.0%0 0 0 0 0 0 0 0 0 0
3.0%1
0.0%0
Streptomycin 0.0% 0.0% 6.3% 0.0% 0.0% 0.0% 7.1% 0.0% 10.5% 6.3% 12.5% 0.0% (MIC ≥ 64 µg/ml) 0 0 1 0 0 0 1 0 2 1 2 0
100.0% 0.0% 0.0% 0.0% 100.0% 100.0%1 0 0 0 1 1
0.0% 0.0% 0.0% 0.0% 0.0% 0.0% 100.0% 0.0% 0.0%0 0 0 0 0 0 1 0 0
0.0% 0.0% 0.0% 14.3% 0.0% 100.0% 0.0%0 0 0 1 0 2 0
0.0% 0.0% 44.4% 0.0% 100.0% 0.0% 0.0% 0.0% 0.0%0 0 4 0 1 0 0 0 0
0.0% 0.0% 0.0% 0.0% 0.0% 0.0%0 0 0 0 0 0
2.1% 3.3% 1.5% 0.0% 7.7% 4.3% 0.0% 0.0% 0.0% 0.0% 0.0% 0.0%2 2 1 0 2 1 0 0 0 0 0 0
0.0%0
0.0%0
0.0% 100.0%0 1
4.8% 10.0% 3.1% 10.5% 0.0% 0.0% 0.0% 0.0% 0.0% 0.0%1 1 1 2 0 0 0 0 0 0
0.0%0
0.0%0
1 In 2012 and 2013, FSIS did not sample products for Salmonella because in prior years the percent of pork carcass samples positive for Salmonella was consistently low
Resistance by Year
Swin
e
Retail
HACCP
Cecal (Market Hogs)
Cecal (Sows)
Cat
tle
Retail
Cecal (Dairy)
HACCP
Cecal (Beef)
Turk
eys
Retail
HACCP
Cecal
HACCP
Humans
Chi
cken
s Retail Chickens
Cecal
Cecal (Dairy)
Swin
e
Retail
HACCP
Cecal (Market Hogs)
Cecal (Sows)
Cat
tle HACCP
Cecal (Beef)
Turk
eys
Retail Ground Turkey
HACCP
Cecal
Retail
HACCP
Cecal
Chi
cken
s Retail Chickens
Swin
e
Retail
HACCP
Cecal (Market Hogs)
Cecal (Sows)
Cat
tle
Retail
Cecal (Dairy)
Humans
HACCP
Cecal (Beef)
Turk
eys
Retail Ground Turkey
HACCP
Cecal
Number of Isolates Tested
Chi
cken
sTu
rkey
sC
attle
HACCP
Swin
e Humans
Chi
cken
s Retail Chickens
Cecal
117

Table 62b. Antimicrobial Resistance among Salmonella Anatum Isolates, 2002-2013 Year 2002 2003 2004 2005 2006 2007 2008 2009 2010 2011 2012 2013
Number of Isolates Tested Humans 22 18 16 12 10 18 14 13 19 16 16 20
Retail Chickens 0 0 0 1 1 0 2 0 1 1 1 0 HACCP 4 2 4 1 6 0 1 1 1 1 0 0 Cecal 0
Retail 0 1 0 1 0 1 7 1 0 0 2 2 HACCP 0 0 1 1 9 1 1 2 6 0 3 2 Cecal 0
Retail 2 0 0 0 2 1 0 0 1 0 1 1 HACCP 94 61 68 22 26 23 34 7 14 18 18 16 Cecal (Beef) 18 Cecal (Dairy) 18
Retail 0 0 0 2 0 0 0 0 1 0 0 0 HACCP1 21 10 32 19 61 13 5 10 5 8 Cecal (Market Hogs) 33 Cecal (Sows) 43
Antimicrobial Class
Antimicrobial (Resistance Breakpoint)
Isolate Source
β-Lactam/β-Lactamase Amoxicillin- 0.0% 0.0% 6.3% 0.0% 0.0% 0.0% 7.1% 0.0% 0.0% 0.0% 0.0% 0.0% Inhibitor Combinations Clavulanic Acid 0 0 1 0 0 0 1 0 0 0 0 0
(MIC ≥ 32 / 16 µg/ml) 100.0% 0.0% 0.0% 0.0% 0.0% 0.0%1 0 0 0 0 0
0.0% 0.0% 0.0% 0.0% 0.0% 0.0% 0.0% 0.0% 0.0%0 0 0 0 0 0 0 0 0
0.0% 0.0% 0.0% 42.9% 0.0% 0.0% 0.0%0 0 0 3 0 0 0
0.0% 0.0% 0.0% 0.0% 0.0% 50.0% 0.0% 33.3% 0.0%0 0 0 0 0 1 0 1 0
0.0% 0.0% 0.0% 0.0% 0.0% 0.0%0 0 0 0 0 0
1.1% 3.3% 1.5% 0.0% 3.8% 4.3% 0.0% 0.0% 0.0% 0.0% 0.0% 0.0%1 2 1 0 1 1 0 0 0 0 0 0
0.0%0
5.6%1
0.0% 0.0%0 0
0.0% 10.0% 0.0% 0.0% 0.0% 0.0% 20.0% 0.0% 20.0% 0.0%0 1 0 0 0 0 1 0 1 0
0.0%0
0.0%0
Cefoxitin 0.0% 0.0% 6.3% 0.0% 0.0% 0.0% 0.0% 0.0% 0.0% 0.0% 0.0% 0.0% (MIC ≥ 32 µg/ml) 0 0 1 0 0 0 0 0 0 0 0 0
100.0% 0.0% 0.0% 0.0% 0.0% 0.0%1 0 0 0 0 0
0.0% 0.0% 0.0% 0.0% 0.0% 0.0% 0.0% 0.0% 0.0%0 0 0 0 0 0 0 0 0
0.0% 0.0% 0.0% 42.9% 0.0% 0.0% 0.0%0 0 0 3 0 0 0
0.0% 0.0% 0.0% 0.0% 0.0% 50.0% 0.0% 33.3% 0.0%0 0 0 0 0 1 0 1 0
0.0% 0.0% 0.0% 0.0% 0.0% 0.0%0 0 0 0 0 0
1.1% 3.3% 1.5% 0.0% 3.8% 4.3% 0.0% 0.0% 0.0% 0.0% 0.0% 0.0%1 2 1 0 1 1 0 0 0 0 0 0
0.0%0
5.6%1
0.0% 0.0%0 0
0.0% 0.0% 0.0% 5.3% 0.0% 7.7% 0.0% 0.0% 0.0% 0.0%0 0 0 1 0 1 0 0 0 0
0.0%0
0.0%0
Ceftiofur 0.0% 0.0% 6.3% 0.0% 0.0% 0.0% 0.0% 0.0% 0.0% 0.0% 0.0% 0.0% (MIC ≥ 8 µg/ml) 0 0 1 0 0 0 0 0 0 0 0 0
100.0% 0.0% 0.0% 0.0% 0.0% 0.0%1 0 0 0 0 0
0.0% 0.0% 0.0% 0.0% 0.0% 0.0% 0.0% 0.0% 0.0%0 0 0 0 0 0 0 0 0
0.0% 0.0% 0.0% 42.9% 0.0% 0.0% 0.0%0 0 0 3 0 0 0
0.0% 0.0% 0.0% 0.0% 0.0% 50.0% 0.0% 33.3% 0.0%0 0 0 0 0 1 0 1 0
0.0% 0.0% 0.0% 0.0% 0.0% 0.0%0 0 0 0 0 0
1.1% 3.3% 1.5% 0.0% 3.8% 4.3% 0.0% 0.0% 0.0% 0.0% 0.0% 0.0%1 2 1 0 1 1 0 0 0 0 0 0
0.0%0
5.6%1
0.0% 0.0%0 0
0.0% 10.0% 0.0% 0.0% 0.0% 0.0% 20.0% 0.0% 20.0% 0.0%0 1 0 0 0 0 1 0 1 0
0.0%0
0.0%0
1 In 2012 and 2013, FSIS did not sample products for Salmonella because in prior years the percent of pork carcass samples positive for Salmonella was consistently low
Cecal (Dairy)
Swin
e
Retail
HACCP
Cecal (Market Hogs)
Cecal (Sows)
Cat
tle HACCP
Cecal (Beef)
Retail
Cecal
Turk
eys
Retail
HACCP
Cecal
Humans
Chi
cken
s Retail Chickens
Swin
e
Retail
HACCP
Cecal (Market Hogs)
Cecal (Sows)
HACCP
Cat
tle
Retail
HACCP
Cecal (Beef)
Cecal (Dairy)
HACCP
Cecal (Beef)
Cecal (Dairy)
Turk
eys
Retail
HACCP
Cecal
Chi
cken
s
HACCP
Cecal
Retail Chickens
Chi
cken
s
Cephems Humans
Swin
e
Retail
HACCP
Cecal (Market Hogs)
Cecal (Sows)
Cat
tle
Retail
Turk
eys
Retail
HACCP
Cecal
HACCP
Cecal
Retail ChickensTu
rkey
sC
attle
Swin
e Humans
Chi
cken
s
118
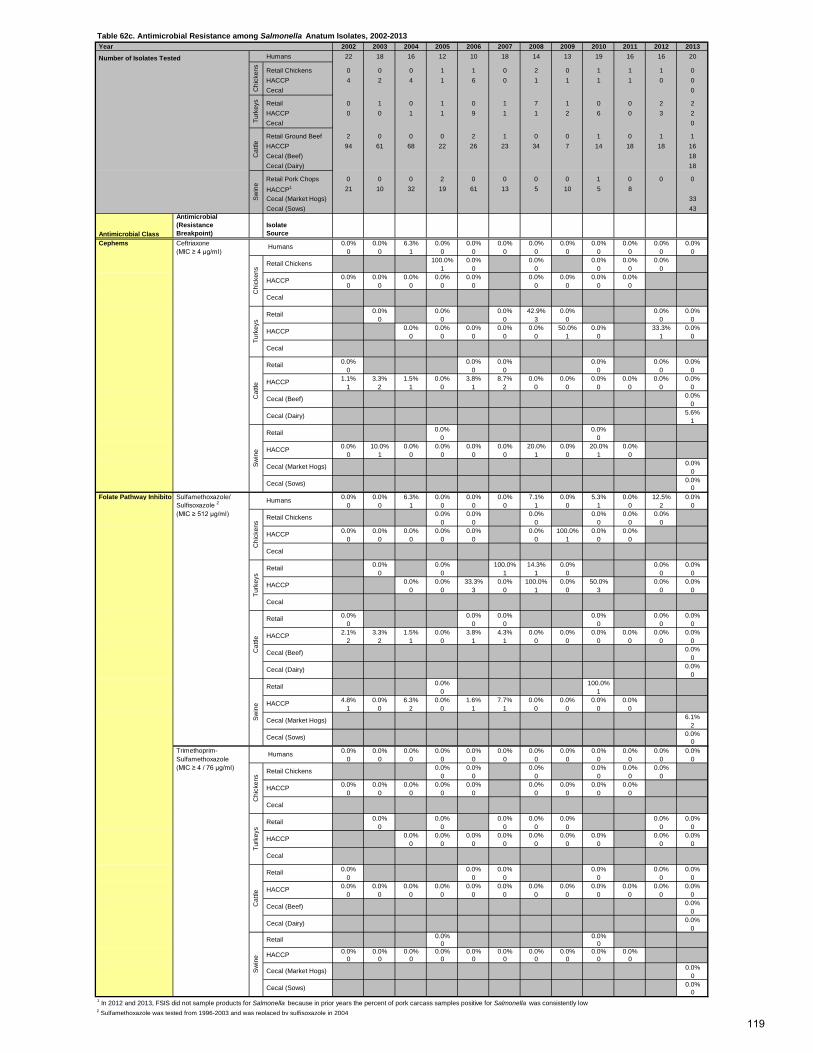
Table 62c. Antimicrobial Resistance among Salmonella Anatum Isolates, 2002-2013 Year 2002 2003 2004 2005 2006 2007 2008 2009 2010 2011 2012 2013
Number of Isolates Tested Humans 22 18 16 12 10 18 14 13 19 16 16 20
Retail Chickens 0 0 0 1 1 0 2 0 1 1 1 0 HACCP 4 2 4 1 6 0 1 1 1 1 0 0 Cecal 0
Retail 0 1 0 1 0 1 7 1 0 0 2 2 HACCP 0 0 1 1 9 1 1 2 6 0 3 2 Cecal 0
Retail Ground Beef 2 0 0 0 2 1 0 0 1 0 1 1 HACCP 94 61 68 22 26 23 34 7 14 18 18 16 Cecal (Beef) 18 Cecal (Dairy) 18
Retail Pork Chops 0 0 0 2 0 0 0 0 1 0 0 0 HACCP1 21 10 32 19 61 13 5 10 5 8 Cecal (Market Hogs) 33 Cecal (Sows) 43
Antimicrobial Class
Antimicrobial (Resistance Breakpoint)
Isolate Source
Ceftriaxone 0.0% 0.0% 6.3% 0.0% 0.0% 0.0% 0.0% 0.0% 0.0% 0.0% 0.0% 0.0% (MIC ≥ 4 µg/ml) 0 0 1 0 0 0 0 0 0 0 0 0
100.0% 0.0% 0.0% 0.0% 0.0% 0.0%1 0 0 0 0 0
0.0% 0.0% 0.0% 0.0% 0.0% 0.0% 0.0% 0.0% 0.0%0 0 0 0 0 0 0 0 0
0.0% 0.0% 0.0% 42.9% 0.0% 0.0% 0.0%0 0 0 3 0 0 0
0.0% 0.0% 0.0% 0.0% 0.0% 50.0% 0.0% 33.3% 0.0%0 0 0 0 0 1 0 1 0
0.0% 0.0% 0.0% 0.0% 0.0% 0.0%0 0 0 0 0 0
1.1% 3.3% 1.5% 0.0% 3.8% 8.7% 0.0% 0.0% 0.0% 0.0% 0.0% 0.0%1 2 1 0 1 2 0 0 0 0 0 0
0.0%0
5.6%1
0.0% 0.0%0 0
0.0% 10.0% 0.0% 0.0% 0.0% 0.0% 20.0% 0.0% 20.0% 0.0%0 1 0 0 0 0 1 0 1 0
0.0%0
0.0%0
Folate Pathway Inhibitor Sulfamethoxazole/ 0.0% 0.0% 6.3% 0.0% 0.0% 0.0% 7.1% 0.0% 5.3% 0.0% 12.5% 0.0% Sulfisoxazole 2 0 0 1 0 0 0 1 0 1 0 2 0 (MIC ≥ 512 µg/ml) 0.0% 0.0% 0.0% 0.0% 0.0% 0.0%
0 0 0 0 0 00.0% 0.0% 0.0% 0.0% 0.0% 0.0% 100.0% 0.0% 0.0%
0 0 0 0 0 0 1 0 0
0.0% 0.0% 100.0% 14.3% 0.0% 0.0% 0.0%0 0 1 1 0 0 0
0.0% 0.0% 33.3% 0.0% 100.0% 0.0% 50.0% 0.0% 0.0%0 0 3 0 1 0 3 0 0
0.0% 0.0% 0.0% 0.0% 0.0% 0.0%0 0 0 0 0 0
2.1% 3.3% 1.5% 0.0% 3.8% 4.3% 0.0% 0.0% 0.0% 0.0% 0.0% 0.0%2 2 1 0 1 1 0 0 0 0 0 0
0.0%0
0.0%0
0.0% 100.0%0 1
4.8% 0.0% 6.3% 0.0% 1.6% 7.7% 0.0% 0.0% 0.0% 0.0%1 0 2 0 1 1 0 0 0 0
6.1%2
0.0%0
Trimethoprim- 0.0% 0.0% 0.0% 0.0% 0.0% 0.0% 0.0% 0.0% 0.0% 0.0% 0.0% 0.0% Sulfamethoxazole 0 0 0 0 0 0 0 0 0 0 0 0 (MIC ≥ 4 / 76 µg/ml) 0.0% 0.0% 0.0% 0.0% 0.0% 0.0%
0 0 0 0 0 00.0% 0.0% 0.0% 0.0% 0.0% 0.0% 0.0% 0.0% 0.0%
0 0 0 0 0 0 0 0 0
0.0% 0.0% 0.0% 0.0% 0.0% 0.0% 0.0%0 0 0 0 0 0 0
0.0% 0.0% 0.0% 0.0% 0.0% 0.0% 0.0% 0.0% 0.0%0 0 0 0 0 0 0 0 0
0.0% 0.0% 0.0% 0.0% 0.0% 0.0%0 0 0 0 0 0
0.0% 0.0% 0.0% 0.0% 0.0% 0.0% 0.0% 0.0% 0.0% 0.0% 0.0% 0.0%0 0 0 0 0 0 0 0 0 0 0 0
0.0%0
0.0%0
0.0% 0.0%0 0
0.0% 0.0% 0.0% 0.0% 0.0% 0.0% 0.0% 0.0% 0.0% 0.0%0 0 0 0 0 0 0 0 0 0
0.0%0
0.0%0
1 In 2012 and 2013, FSIS did not sample products for Salmonella because in prior years the percent of pork carcass samples positive for Salmonella was consistently low2 Sulfamethoxazole was tested from 1996-2003 and was replaced by sulfisoxazole in 2004
Swin
e
Retail
HACCP
Cecal (Market Hogs)
Cecal (Sows)
Cat
tle
Retail
Cecal (Dairy)
HACCP
Cecal (Beef)
Turk
eys
Retail
HACCP
Cecal
HACCP
Humans
Chi
cken
s
Retail Chickens
Cecal
Cecal (Dairy)
Swin
e
Retail
HACCP
Cecal (Market Hogs)
Cecal (Sows)
Cat
tle
HACCP
Cecal (Beef)
Turk
eys
Retail
HACCP
Cecal
Retail
HACCP
Cecal
Chi
cken
s
Retail Chickens
Swin
e
Retail
HACCP
Cecal (Market Hogs)
Cecal (Sows)
Cat
tle
Retail
Cecal (Dairy)
Humans
HACCP
Cecal (Beef)
Turk
eys
Retail
HACCP
Cecal
HACCP
Cephems HumansC
hick
ens
Retail Chickens
Cecal
Cat
tleSw
ine
Chi
cken
sTu
rkey
s
119
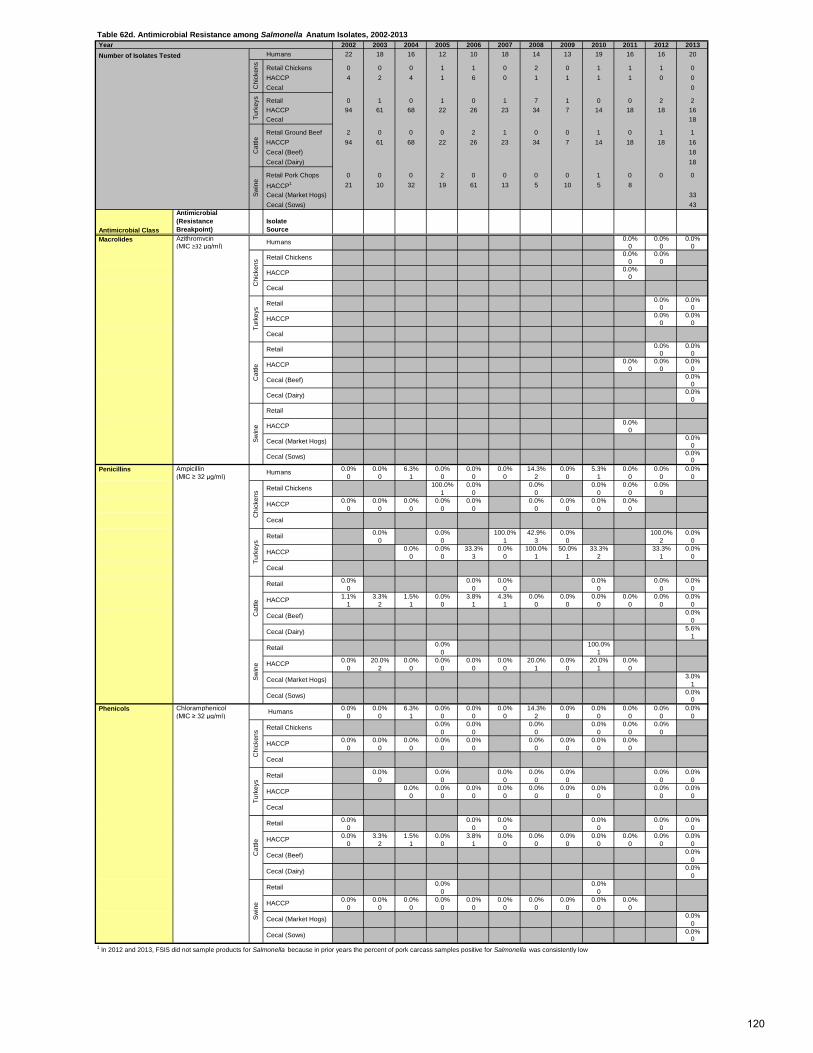
Table 62d. Antimicrobial Resistance among Salmonella Anatum Isolates, 2002-2013 Year 2002 2003 2004 2005 2006 2007 2008 2009 2010 2011 2012 2013 Number of Isolates Tested Humans 22 18 16 12 10 18 14 13 19 16 16 20
Retail Chickens 0 0 0 1 1 0 2 0 1 1 1 0 HACCP 4 2 4 1 6 0 1 1 1 1 0 0 Cecal 0
Retail 0 1 0 1 0 1 7 1 0 0 2 2 HACCP 94 61 68 22 26 23 34 7 14 18 18 16 Cecal 18
Retail Ground Beef 2 0 0 0 2 1 0 0 1 0 1 1 HACCP 94 61 68 22 26 23 34 7 14 18 18 16 Cecal (Beef) 18 Cecal (Dairy) 18
Retail Pork Chops 0 0 0 2 0 0 0 0 1 0 0 0 HACCP1 21 10 32 19 61 13 5 10 5 8 Cecal (Market Hogs) 33 Cecal (Sows) 43
Antimicrobial Class
Antimicrobial (Resistance Breakpoint)
Isolate Source
Azithromycin 0.0% 0.0% 0.0% (MIC ≥32 µg/ml) 0 0 0
0.0% 0.0%0 0
0.0%0
0.0% 0.0%0 0
0.0% 0.0%0 0
0.0% 0.0%0 0
0.0% 0.0% 0.0%0 0 0
0.0%0
0.0%0
0.0%0
0.0%0
0.0%0
Ampicillin 0.0% 0.0% 6.3% 0.0% 0.0% 0.0% 14.3% 0.0% 5.3% 0.0% 0.0% 0.0% (MIC ≥ 32 µg/ml) 0 0 1 0 0 0 2 0 1 0 0 0
100.0% 0.0% 0.0% 0.0% 0.0% 0.0%1 0 0 0 0 0
0.0% 0.0% 0.0% 0.0% 0.0% 0.0% 0.0% 0.0% 0.0%0 0 0 0 0 0 0 0 0
0.0% 0.0% 100.0% 42.9% 0.0% 100.0% 0.0%0 0 1 3 0 2 0
0.0% 0.0% 33.3% 0.0% 100.0% 50.0% 33.3% 33.3% 0.0%0 0 3 0 1 1 2 1 0
0.0% 0.0% 0.0% 0.0% 0.0% 0.0%0 0 0 0 0 0
1.1% 3.3% 1.5% 0.0% 3.8% 4.3% 0.0% 0.0% 0.0% 0.0% 0.0% 0.0%1 2 1 0 1 1 0 0 0 0 0 0
0.0%0
5.6%1
0.0% 100.0%0 1
0.0% 20.0% 0.0% 0.0% 0.0% 0.0% 20.0% 0.0% 20.0% 0.0%0 2 0 0 0 0 1 0 1 0
3.0%1
0.0%0
Chloramphenicol 0.0% 0.0% 6.3% 0.0% 0.0% 0.0% 14.3% 0.0% 0.0% 0.0% 0.0% 0.0% (MIC ≥ 32 µg/ml) 0 0 1 0 0 0 2 0 0 0 0 0
0.0% 0.0% 0.0% 0.0% 0.0% 0.0%0 0 0 0 0 0
0.0% 0.0% 0.0% 0.0% 0.0% 0.0% 0.0% 0.0% 0.0%0 0 0 0 0 0 0 0 0
0.0% 0.0% 0.0% 0.0% 0.0% 0.0% 0.0%0 0 0 0 0 0 0
0.0% 0.0% 0.0% 0.0% 0.0% 0.0% 0.0% 0.0% 0.0%0 0 0 0 0 0 0 0 0
0.0% 0.0% 0.0% 0.0% 0.0% 0.0%0 0 0 0 0 0
0.0% 3.3% 1.5% 0.0% 3.8% 0.0% 0.0% 0.0% 0.0% 0.0% 0.0% 0.0%0 2 1 0 1 0 0 0 0 0 0 0
0.0%0
0.0%0
0.0% 0.0%0 0
0.0% 0.0% 0.0% 0.0% 0.0% 0.0% 0.0% 0.0% 0.0% 0.0%0 0 0 0 0 0 0 0 0 0
0.0%0
0.0%0
1 In 2012 and 2013, FSIS did not sample products for Salmonella because in prior years the percent of pork carcass samples positive for Salmonella was consistently low
Swin
e
Retail
HACCP
Cecal (Market Hogs)
Cecal (Sows)
Cat
tle
Retail
Cecal (Dairy)
HACCP
Cecal (Beef)
Turk
eys
Retail
HACCP
Cecal
HACCP
Phenicols Humans
Chi
cken
s Retail Chickens
Cecal
Cat
tle
Retail
Cecal (Dairy)
Swin
e
Retail
HACCP
Cecal (Market Hogs)
Cecal (Sows)
HACCP
Cecal (Beef)
Turk
eys
Retail
HACCP
Cecal
HACCP
Penicillins Humans
Chi
cken
s Retail Chickens
Cecal
Chi
cken
sSw
ine
Retail
HACCP
Cecal (Market Hogs)
Cecal (Sows)
Cat
tle
Retail
HACCP
Turk
eys
Retail
HACCP
Cecal
Cecal (Dairy)
HACCP
Cecal
Retail Chickens
Cecal (Beef)
Turk
eys
Cat
tleSw
ine
Macrolides Humans
Chi
cken
s
120
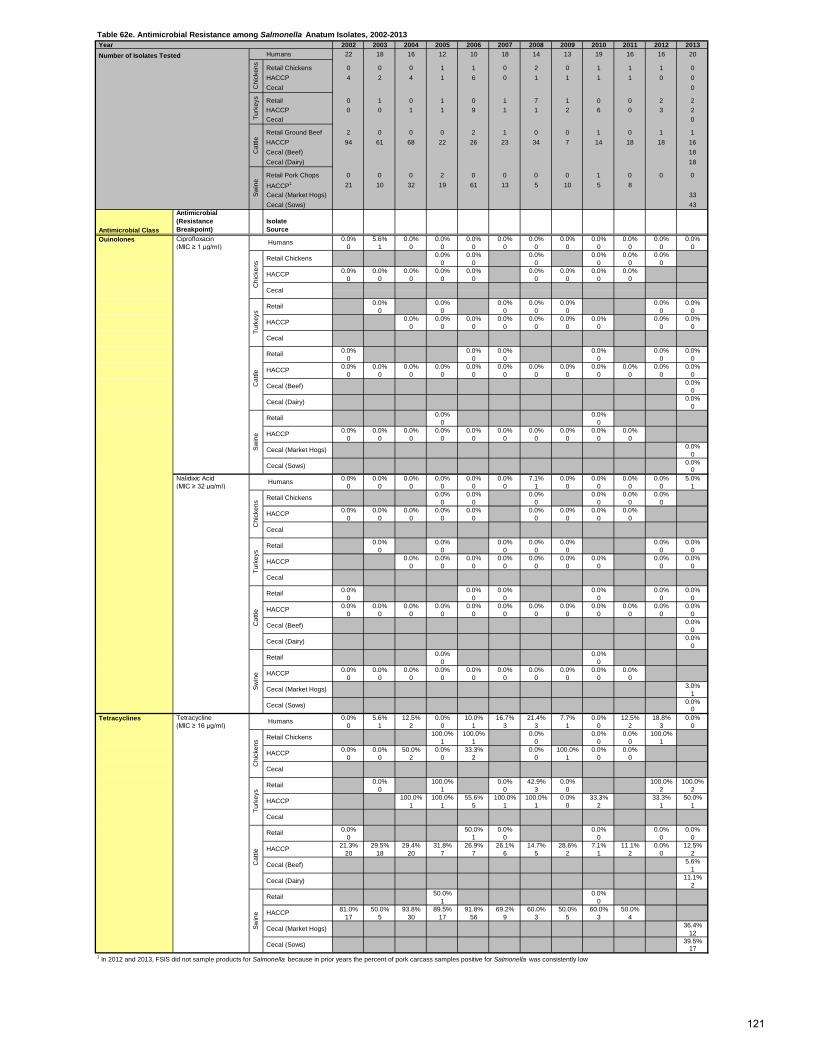
Table 62e. Antimicrobial Resistance among Salmonella Anatum Isolates, 2002-2013 Year 2002 2003 2004 2005 2006 2007 2008 2009 2010 2011 2012 2013 Number of Isolates Tested Humans 22 18 16 12 10 18 14 13 19 16 16 20
Retail Chickens 0 0 0 1 1 0 2 0 1 1 1 0 HACCP 4 2 4 1 6 0 1 1 1 1 0 0 Cecal 0
Retail 0 1 0 1 0 1 7 1 0 0 2 2 HACCP 0 0 1 1 9 1 1 2 6 0 3 2 Cecal 0
Retail Ground Beef 2 0 0 0 2 1 0 0 1 0 1 1 HACCP 94 61 68 22 26 23 34 7 14 18 18 16 Cecal (Beef) 18 Cecal (Dairy) 18
Retail Pork Chops 0 0 0 2 0 0 0 0 1 0 0 0 HACCP1 21 10 32 19 61 13 5 10 5 8 Cecal (Market Hogs) 33 Cecal (Sows) 43
Antimicrobial Class
Antimicrobial (Resistance Breakpoint)
Isolate Source
Quinolones Ciprofloxacin 0.0% 5.6% 0.0% 0.0% 0.0% 0.0% 0.0% 0.0% 0.0% 0.0% 0.0% 0.0% (MIC ≥ 1 µg/ml) 0 1 0 0 0 0 0 0 0 0 0 0
0.0% 0.0% 0.0% 0.0% 0.0% 0.0%0 0 0 0 0 0
0.0% 0.0% 0.0% 0.0% 0.0% 0.0% 0.0% 0.0% 0.0%0 0 0 0 0 0 0 0 0
0.0% 0.0% 0.0% 0.0% 0.0% 0.0% 0.0%0 0 0 0 0 0 0
0.0% 0.0% 0.0% 0.0% 0.0% 0.0% 0.0% 0.0% 0.0%0 0 0 0 0 0 0 0 0
0.0% 0.0% 0.0% 0.0% 0.0% 0.0%0 0 0 0 0 0
0.0% 0.0% 0.0% 0.0% 0.0% 0.0% 0.0% 0.0% 0.0% 0.0% 0.0% 0.0%0 0 0 0 0 0 0 0 0 0 0 0
0.0%0
0.0%0
0.0% 0.0%0 0
0.0% 0.0% 0.0% 0.0% 0.0% 0.0% 0.0% 0.0% 0.0% 0.0%0 0 0 0 0 0 0 0 0 0
0.0%0
0.0%0
Nalidixic Acid 0.0% 0.0% 0.0% 0.0% 0.0% 0.0% 7.1% 0.0% 0.0% 0.0% 0.0% 5.0% (MIC ≥ 32 µg/ml) 0 0 0 0 0 0 1 0 0 0 0 1
0.0% 0.0% 0.0% 0.0% 0.0% 0.0%0 0 0 0 0 0
0.0% 0.0% 0.0% 0.0% 0.0% 0.0% 0.0% 0.0% 0.0%0 0 0 0 0 0 0 0 0
0.0% 0.0% 0.0% 0.0% 0.0% 0.0% 0.0%0 0 0 0 0 0 0
0.0% 0.0% 0.0% 0.0% 0.0% 0.0% 0.0% 0.0% 0.0%0 0 0 0 0 0 0 0 0
0.0% 0.0% 0.0% 0.0% 0.0% 0.0%0 0 0 0 0 0
0.0% 0.0% 0.0% 0.0% 0.0% 0.0% 0.0% 0.0% 0.0% 0.0% 0.0% 0.0%0 0 0 0 0 0 0 0 0 0 0 0
0.0%0
0.0%0
0.0% 0.0%0 0
0.0% 0.0% 0.0% 0.0% 0.0% 0.0% 0.0% 0.0% 0.0% 0.0%0 0 0 0 0 0 0 0 0 0
3.0%1
0.0%0
Tetracycline 0.0% 5.6% 12.5% 0.0% 10.0% 16.7% 21.4% 7.7% 0.0% 12.5% 18.8% 0.0% (MIC ≥ 16 µg/ml) 0 1 2 0 1 3 3 1 0 2 3 0
100.0% 100.0% 0.0% 0.0% 0.0% 100.0%1 1 0 0 0 1
0.0% 0.0% 50.0% 0.0% 33.3% 0.0% 100.0% 0.0% 0.0%0 0 2 0 2 0 1 0 0
0.0% 100.0% 0.0% 42.9% 0.0% 100.0% 100.0%0 1 0 3 0 2 2
100.0% 100.0% 55.6% 100.0% 100.0% 0.0% 33.3% 33.3% 50.0%1 1 5 1 1 0 2 1 1
0.0% 50.0% 0.0% 0.0% 0.0% 0.0%0 1 0 0 0 0
21.3% 29.5% 29.4% 31.8% 26.9% 26.1% 14.7% 28.6% 7.1% 11.1% 0.0% 12.5%20 18 20 7 7 6 5 2 1 2 0 2
5.6%1
11.1%2
50.0% 0.0%1 0
81.0% 50.0% 93.8% 89.5% 91.8% 69.2% 60.0% 50.0% 60.0% 50.0%17 5 30 17 56 9 3 5 3 4
36.4%12
39.5%17
1 In 2012 and 2013, FSIS did not sample products for Salmonella because in prior years the percent of pork carcass samples positive for Salmonella was consistently low
Cecal (Market Hogs)
Cecal (Sows)
Cecal (Beef)
Cecal (Dairy)
Swin
e
Retail
HACCP
Cat
tle
Retail
HACCP
Cecal
Turk
eys
Retail
HACCP
HACCP
Tetracyclines Humans
Chi
cken
s Retail Chickens
Cecal
Cecal (Dairy)
Swin
e
Retail
HACCP
Cecal (Market Hogs)
Cecal (Sows)
Cat
tle HACCP
Cecal (Beef)
Retail
Turk
eys
Retail
HACCP
Cecal
Humans
Chi
cken
s Retail Chickens
Swin
e
Retail
HACCP
Cecal (Market Hogs)
Cecal (Sows)
HACCP
Cecal
Cat
tle
Retail
Turk
eys
Retail
HACCP
Cecal
Chi
cken
s
HACCP
Cecal (Beef)
Cecal (Dairy)
HACCP
Cecal
Retail ChickensTu
rkey
sC
attle
Swin
e
Humans
Chi
cken
s
121
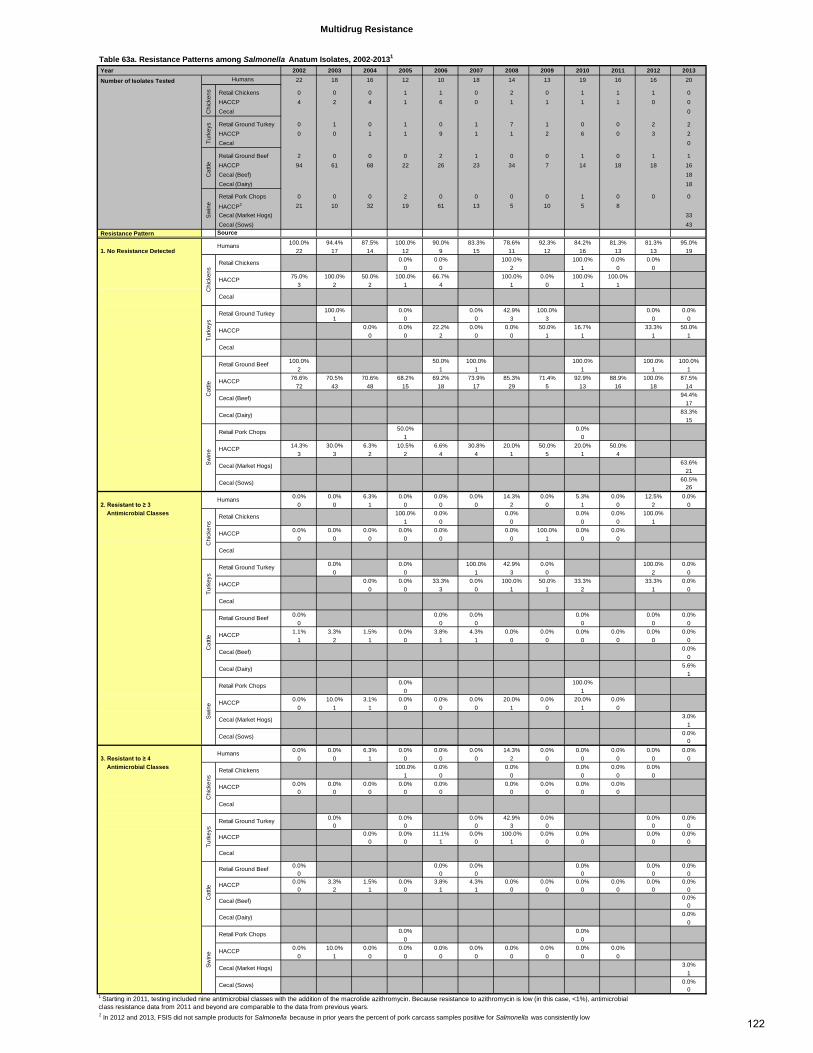
Table 63a. Resistance Patterns among Salmonella Anatum Isolates, 2002-20131
Year 2002 2003 2004 2005 2006 2007 2008 2009 2010 2011 2012 2013
Number of Isolates Tested 22 18 16 12 10 18 14 13 19 16 16 20
Retail Chickens 0 0 0 1 1 0 2 0 1 1 1 0 HACCP 4 2 4 1 6 0 1 1 1 1 0 0 Cecal 0
Retail Ground Turkey 0 1 0 1 0 1 7 1 0 0 2 2 HACCP 0 0 1 1 9 1 1 2 6 0 3 2 Cecal 0
Retail Ground Beef 2 0 0 0 2 1 0 0 1 0 1 1 HACCP 94 61 68 22 26 23 34 7 14 18 18 16 Cecal (Beef) 18 Cecal (Dairy) 18
Retail Pork Chops 0 0 0 2 0 0 0 0 1 0 0 0
HACCP2 21 10 32 19 61 13 5 10 5 8 Cecal (Market Hogs) 33 Cecal (Sows) 43
Resistance Pattern Source100.0% 94.4% 87.5% 100.0% 90.0% 83.3% 78.6% 92.3% 84.2% 81.3% 81.3% 95.0%
1. No Resistance Detected 22 17 14 12 9 15 11 12 16 13 13 190.0% 0.0% 100.0% 100.0% 0.0% 0.0%
0 0 2 1 0 075.0% 100.0% 50.0% 100.0% 66.7% 100.0% 0.0% 100.0% 100.0%
3 2 2 1 4 1 0 1 1
100.0% 0.0% 0.0% 42.9% 100.0% 0.0% 0.0%1 0 0 3 3 0 0
0.0% 0.0% 22.2% 0.0% 0.0% 50.0% 16.7% 33.3% 50.0%0 0 2 0 0 1 1 1 1
100.0% 50.0% 100.0% 100.0% 100.0% 100.0%2 1 1 1 1 1
76.6% 70.5% 70.6% 68.2% 69.2% 73.9% 85.3% 71.4% 92.9% 88.9% 100.0% 87.5%72 43 48 15 18 17 29 5 13 16 18 14
94.4%17
83.3%15
50.0% 0.0%1 0
14.3% 30.0% 6.3% 10.5% 6.6% 30.8% 20.0% 50.0% 20.0% 50.0%3 3 2 2 4 4 1 5 1 4
63.6%21
60.5%26
0.0% 0.0% 6.3% 0.0% 0.0% 0.0% 14.3% 0.0% 5.3% 0.0% 12.5% 0.0% 2. Resistant to ≥ 3 0 0 1 0 0 0 2 0 1 0 2 0 Antimicrobial Classes 100.0% 0.0% 0.0% 0.0% 0.0% 100.0%
1 0 0 0 0 10.0% 0.0% 0.0% 0.0% 0.0% 0.0% 100.0% 0.0% 0.0%
0 0 0 0 0 0 1 0 0
0.0% 0.0% 100.0% 42.9% 0.0% 100.0% 0.0%0 0 1 3 0 2 0
0.0% 0.0% 33.3% 0.0% 100.0% 50.0% 33.3% 33.3% 0.0%0 0 3 0 1 1 2 1 0
0.0% 0.0% 0.0% 0.0% 0.0% 0.0%0 0 0 0 0 0
1.1% 3.3% 1.5% 0.0% 3.8% 4.3% 0.0% 0.0% 0.0% 0.0% 0.0% 0.0%1 2 1 0 1 1 0 0 0 0 0 0
0.0%0
5.6%1
0.0% 100.0%0 1
0.0% 10.0% 3.1% 0.0% 0.0% 0.0% 20.0% 0.0% 20.0% 0.0%0 1 1 0 0 0 1 0 1 0
3.0%1
0.0%0
0.0% 0.0% 6.3% 0.0% 0.0% 0.0% 14.3% 0.0% 0.0% 0.0% 0.0% 0.0% 3. Resistant to ≥ 4 0 0 1 0 0 0 2 0 0 0 0 0 Antimicrobial Classes 100.0% 0.0% 0.0% 0.0% 0.0% 0.0%
1 0 0 0 0 00.0% 0.0% 0.0% 0.0% 0.0% 0.0% 0.0% 0.0% 0.0%
0 0 0 0 0 0 0 0 0
0.0% 0.0% 0.0% 42.9% 0.0% 0.0% 0.0%0 0 0 3 0 0 0
0.0% 0.0% 11.1% 0.0% 100.0% 0.0% 0.0% 0.0% 0.0%0 0 1 0 1 0 0 0 0
0.0% 0.0% 0.0% 0.0% 0.0% 0.0%0 0 0 0 0 0
0.0% 3.3% 1.5% 0.0% 3.8% 4.3% 0.0% 0.0% 0.0% 0.0% 0.0% 0.0%0 2 1 0 1 1 0 0 0 0 0 0
0.0%0
0.0%0
0.0% 0.0%0 0
0.0% 10.0% 0.0% 0.0% 0.0% 0.0% 0.0% 0.0% 0.0% 0.0%0 1 0 0 0 0 0 0 0 0
3.0%1
0.0%0
2 In 2012 and 2013, FSIS did not sample products for Salmonella because in prior years the percent of pork carcass samples positive for Salmonella was consistently low
Sw
ine
Humans
Chi
cken
s
Retail Chickens
HACCP
Cecal
Multidrug Resistance
Humans
Chi
cken
sTu
rkey
sC
attle
Turk
eys
Retail Ground Turkey
HACCP
Cecal
Cat
tle
Retail Ground Beef
HACCP
Cecal (Beef)
Cecal (Dairy)
Chi
cken
s
Retail Chickens
HACCP
Cecal
Turk
eys
Retail Ground Turkey
HACCP
Cecal
Sw
ine
Retail Pork Chops
HACCP
Cecal (Market Hogs)
Cecal (Sows)
Humans
Cat
tle
Retail Ground Beef
HACCP
Cecal (Beef)
Cecal (Dairy)
Sw
ine
Retail Pork Chops
HACCP
Cecal (Market Hogs)
Cecal (Sows)
Humans
Chi
cken
s
Retail Chickens
HACCP
Cecal
Turk
eys
Retail Ground Turkey
HACCP
Cecal
Cat
tle
Retail Ground Beef
HACCP
Cecal (Beef)
Cecal (Dairy)
Sw
ine
Retail Pork Chops
HACCP
Cecal (Market Hogs)
Cecal (Sows)
1 Starting in 2011, testing included nine antimicrobial classes with the addition of the macrolide azithromycin. Because resistance to azithromycin is low (in this case, <1%), antimicrobial class resistance data from 2011 and beyond are comparable to the data from previous years.
122
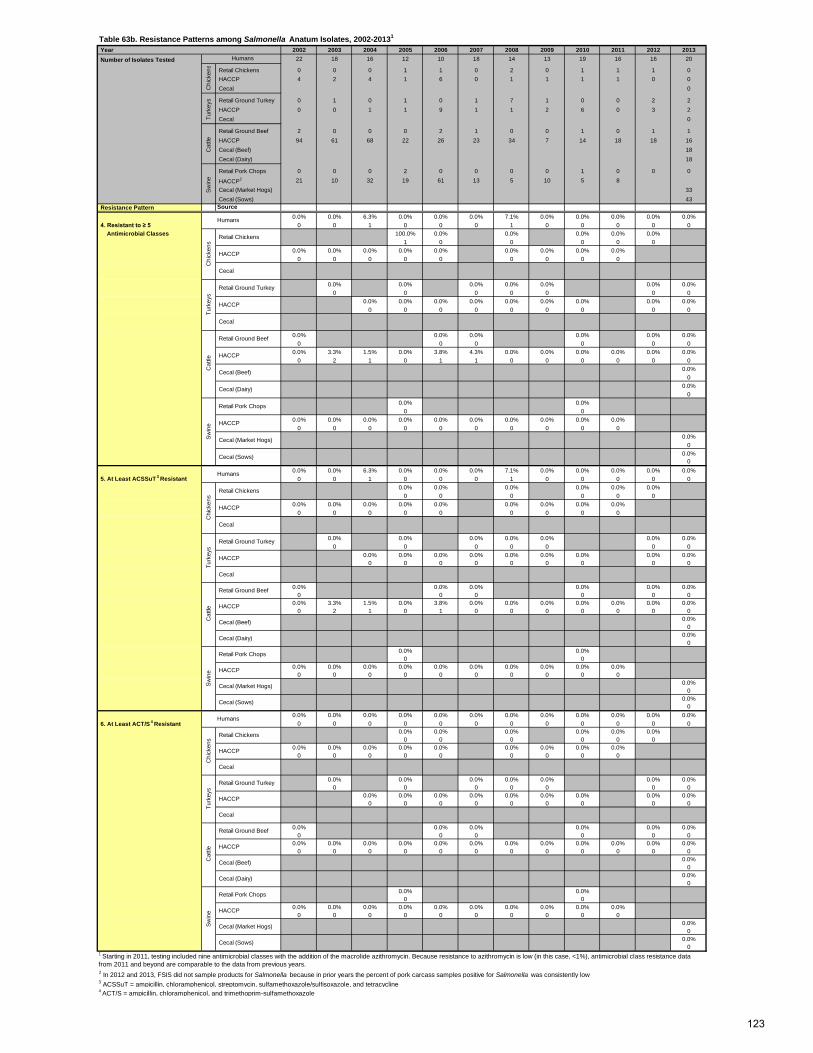
Table 63b. Resistance Patterns among Salmonella Anatum Isolates, 2002-20131
Year 2002 2003 2004 2005 2006 2007 2008 2009 2010 2011 2012 2013 Number of Isolates Tested 22 18 16 12 10 18 14 13 19 16 16 20
Retail Chickens 0 0 0 1 1 0 2 0 1 1 1 0 HACCP 4 2 4 1 6 0 1 1 1 1 0 0 Cecal 0
Retail Ground Turkey 0 1 0 1 0 1 7 1 0 0 2 2 HACCP 0 0 1 1 9 1 1 2 6 0 3 2 Cecal 0
Retail Ground Beef 2 0 0 0 2 1 0 0 1 0 1 1 HACCP 94 61 68 22 26 23 34 7 14 18 18 16 Cecal (Beef) 18 Cecal (Dairy) 18
Retail Pork Chops 0 0 0 2 0 0 0 0 1 0 0 0
HACCP2 21 10 32 19 61 13 5 10 5 8 Cecal (Market Hogs) 33 Cecal (Sows) 43
Resistance Pattern Source0.0% 0.0% 6.3% 0.0% 0.0% 0.0% 7.1% 0.0% 0.0% 0.0% 0.0% 0.0%
4. Resistant to ≥ 5 0 0 1 0 0 0 1 0 0 0 0 0 Antimicrobial Classes 100.0% 0.0% 0.0% 0.0% 0.0% 0.0%
1 0 0 0 0 00.0% 0.0% 0.0% 0.0% 0.0% 0.0% 0.0% 0.0% 0.0%
0 0 0 0 0 0 0 0 0
0.0% 0.0% 0.0% 0.0% 0.0% 0.0% 0.0%0 0 0 0 0 0 0
0.0% 0.0% 0.0% 0.0% 0.0% 0.0% 0.0% 0.0% 0.0%0 0 0 0 0 0 0 0 0
0.0% 0.0% 0.0% 0.0% 0.0% 0.0%0 0 0 0 0 0
0.0% 3.3% 1.5% 0.0% 3.8% 4.3% 0.0% 0.0% 0.0% 0.0% 0.0% 0.0%0 2 1 0 1 1 0 0 0 0 0 0
0.0%0
0.0%0
0.0% 0.0%0 0
0.0% 0.0% 0.0% 0.0% 0.0% 0.0% 0.0% 0.0% 0.0% 0.0%0 0 0 0 0 0 0 0 0 0
0.0%0
0.0%0
0.0% 0.0% 6.3% 0.0% 0.0% 0.0% 7.1% 0.0% 0.0% 0.0% 0.0% 0.0% 5. At Least ACSSuT
3 Resistant 0 0 1 0 0 0 1 0 0 0 0 00.0% 0.0% 0.0% 0.0% 0.0% 0.0%
0 0 0 0 0 00.0% 0.0% 0.0% 0.0% 0.0% 0.0% 0.0% 0.0% 0.0%
0 0 0 0 0 0 0 0 0
0.0% 0.0% 0.0% 0.0% 0.0% 0.0% 0.0%0 0 0 0 0 0 0
0.0% 0.0% 0.0% 0.0% 0.0% 0.0% 0.0% 0.0% 0.0%0 0 0 0 0 0 0 0 0
0.0% 0.0% 0.0% 0.0% 0.0% 0.0%0 0 0 0 0 0
0.0% 3.3% 1.5% 0.0% 3.8% 0.0% 0.0% 0.0% 0.0% 0.0% 0.0% 0.0%0 2 1 0 1 0 0 0 0 0 0 0
0.0%0
0.0%0
0.0% 0.0%0 0
0.0% 0.0% 0.0% 0.0% 0.0% 0.0% 0.0% 0.0% 0.0% 0.0%0 0 0 0 0 0 0 0 0 0
0.0%0
0.0%0
0.0% 0.0% 0.0% 0.0% 0.0% 0.0% 0.0% 0.0% 0.0% 0.0% 0.0% 0.0% 6. At Least ACT/S
4 Resistant 0 0 0 0 0 0 0 0 0 0 0 00.0% 0.0% 0.0% 0.0% 0.0% 0.0%
0 0 0 0 0 00.0% 0.0% 0.0% 0.0% 0.0% 0.0% 0.0% 0.0% 0.0%
0 0 0 0 0 0 0 0 0
0.0% 0.0% 0.0% 0.0% 0.0% 0.0% 0.0%0 0 0 0 0 0 0
0.0% 0.0% 0.0% 0.0% 0.0% 0.0% 0.0% 0.0% 0.0%0 0 0 0 0 0 0 0 0
0.0% 0.0% 0.0% 0.0% 0.0% 0.0%0 0 0 0 0 0
0.0% 0.0% 0.0% 0.0% 0.0% 0.0% 0.0% 0.0% 0.0% 0.0% 0.0% 0.0%0 0 0 0 0 0 0 0 0 0 0 0
0.0%0
0.0%0
0.0% 0.0%0 0
0.0% 0.0% 0.0% 0.0% 0.0% 0.0% 0.0% 0.0% 0.0% 0.0%0 0 0 0 0 0 0 0 0 0
0.0%0
0.0%0
2 In 2012 and 2013, FSIS did not sample products for Salmonella because in prior years the percent of pork carcass samples positive for Salmonella was consistently low3 ACSSuT = ampicillin, chloramphenicol, streptomycin, sulfamethoxazole/sulfisoxazole, and tetracycline4 ACT/S = ampicillin, chloramphenicol, and trimethoprim-sulfamethoxazole
Cat
tle
Retail Ground Beef
HACCP
Cecal (Beef)
Cecal (Dairy)
Sw
ine
Retail Pork Chops
HACCP
Cecal (Market Hogs)
Cecal (Sows)
Humans
Chi
cken
s
Retail Chickens
HACCP
Cecal
Turk
eys
Retail Ground Turkey
HACCP
Cecal
Cat
tleS
win
e
Humans
Chi
cken
s
Retail Chickens
HACCP
Cecal
Humans
Chi
cken
sTu
rkey
sTu
rkey
s
Retail Ground Turkey
HACCP
Cecal
Cat
tle
Retail Ground Beef
HACCP
Cecal (Beef)
Cecal (Dairy)
Sw
ine
Retail Pork Chops
HACCP
Cecal (Market Hogs)
Sw
ine
Retail Pork Chops
HACCP
Cecal (Market Hogs)
Cecal (Sows)
Humans
Chi
cken
s
Retail Chickens
HACCP
Cecal
Turk
eys
Retail Ground Turkey
HACCP
Cecal
Cat
tle
Retail Ground Beef
HACCP
Cecal (Beef)
Cecal (Dairy)
Cecal (Sows)
1 Starting in 2011, testing included nine antimicrobial classes with the addition of the macrolide azithromycin. Because resistance to azithromycin is low (in this case, <1%), antimicrobial class resistance data from 2011 and beyond are comparable to the data from previous years.
123

Table 63c. Resistance Patterns among Salmonella Anatum Isolates, 2002-2013 Year 2002 2003 2004 2005 2006 2007 2008 2009 2010 2011 2012 2013 Number of Isolates Tested 22 18 16 12 10 18 14 13 19 16 16 20
Retail Chickens 0 0 0 1 1 0 2 0 1 1 1 0 HACCP 4 2 4 1 6 0 1 1 1 1 0 0 Cecal 0
Retail Ground Turkey 0 1 0 1 0 1 7 1 0 0 2 2 HACCP 0 0 1 1 9 1 1 2 6 0 3 2 Cecal 0
Retail Ground Beef 2 0 0 0 2 1 0 0 1 0 1 1 HACCP 94 61 68 22 26 23 34 7 14 18 18 16 Cecal (Beef) 18 Cecal (Dairy) 18
Retail Pork Chops 0 0 0 2 0 0 0 0 1 0 0 0
HACCP1 21 10 32 19 61 13 5 10 5 8 Cecal (Market Hogs) 33 Cecal (Sows) 43
Resistance Pattern Source0.0% 0.0% 6.3% 0.0% 0.0% 0.0% 0.0% 0.0% 0.0% 0.0% 0.0% 0.0%
7. At Least ACSSuTAuCx 2 0 0 1 0 0 0 0 0 0 0 0 0 Resistant 0.0% 0.0% 0.0% 0.0% 0.0% 0.0%
0 0 0 0 0 00.0% 0.0% 0.0% 0.0% 0.0% 0.0% 0.0% 0.0% 0.0%
0 0 0 0 0 0 0 0 0
0.0% 0.0% 0.0% 0.0% 0.0% 0.0% 0.0%0 0 0 0 0 0 0
0.0% 0.0% 0.0% 0.0% 0.0% 0.0% 0.0% 0.0% 0.0%0 0 0 0 0 0 0 0 0
0.0% 0.0% 0.0% 0.0% 0.0% 0.0%0 0 0 0 0 0
0.0% 3.3% 1.5% 0.0% 3.8% 0.0% 0.0% 0.0% 0.0% 0.0% 0.0% 0.0%0 2 1 0 1 0 0 0 0 0 0 0
0.0%0
0.0%0
0.0% 0.0%0 0
0.0% 0.0% 0.0% 0.0% 0.0% 0.0% 0.0% 0.0% 0.0% 0.0%0 0 0 0 0 0 0 0 0 0
0.0%0
0.0%0
0.0% 0.0% 0.0% 0.0% 0.0% 0.0% 0.0% 0.0% 0.0% 0.0% 0.0% 0.0% 8. At Least Ceftriaxone and 0 0 0 0 0 0 0 0 0 0 0 0 Nalidixic Acid Resistant 0.0% 0.0% 0.0% 0.0% 0.0% 0.0%
0 0 0 0 0 00.0% 0.0% 0.0% 0.0% 0.0% 0.0% 0.0% 0.0% 0.0%
0 0 0 0 0 0 0 0 0
0.0% 0.0% 0.0% 0.0% 0.0% 0.0% 0.0%0 0 0 0 0 0 0
0.0% 0.0% 0.0% 0.0% 0.0% 0.0% 0.0% 0.0% 0.0%0 0 0 0 0 0 0 0 0
0.0% 0.0% 0.0% 0.0% 0.0% 0.0%0 0 0 0 0 0
0.0% 0.0% 0.0% 0.0% 0.0% 0.0% 0.0% 0.0% 0.0% 0.0% 0.0% 0.0%0 0 0 0 0 0 0 0 0 0 0 0
0.0%0
0.0%0
0.0% 0.0%0 0
0.0% 0.0% 0.0% 0.0% 0.0% 0.0% 0.0% 0.0% 0.0% 0.0%0 0 0 0 0 0 0 0 0 0
0.0%0
0.0%0
1 In 2012 and 2013, FSIS did not sample products for Salmonella because in prior years the percent of pork carcass samples positive for Salmonella was consistently low2 ACSSuTAuCx = ACSSuT, amoxicillin-clavulanic acid, and ceftriaxone
Sw
ine
Retail Pork Chops
HACCP
Cecal (Market Hogs)
Cecal (Sows)
Humans
Chi
cken
s
Retail Chickens
HACCP
Cecal
Turk
eys
Retail Ground Turkey
HACCP
Cecal
Cat
tle
Retail Ground Beef
HACCP
Cecal (Beef)
Cecal (Dairy)
Sw
ine
Retail Pork Chops
HACCP
Cecal (Market Hogs)
Cecal (Sows)
Retail Chickens
HACCP
Cecal
Turk
eys
Retail Ground Turkey
HACCP
Cecal
Cat
tleS
win
e
Humans
Chi
cken
s C
attle
Retail Ground Beef
HACCP
Cecal (Beef)
Cecal (Dairy)
Humans
Chi
cken
sTu
rkey
s
124
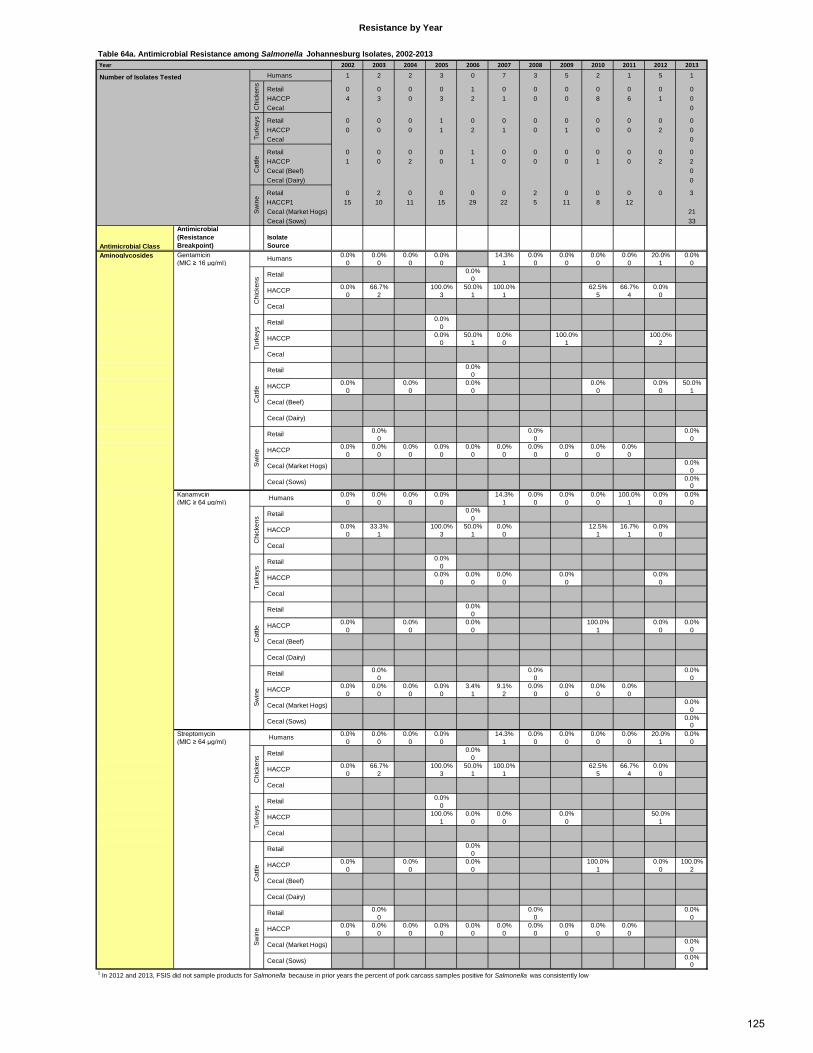
Table 64a. Antimicrobial Resistance among Salmonella Johannesburg Isolates, 2002-2013 Year 2002 2003 2004 2005 2006 2007 2008 2009 2010 2011 2012 2013
Humans 1 2 2 3 0 7 3 5 2 1 5 1
Retail 0 0 0 0 1 0 0 0 0 0 0 0 HACCP 4 3 0 3 2 1 0 0 8 6 1 0 Cecal 0
Retail 0 0 0 1 0 0 0 0 0 0 0 0 HACCP 0 0 0 1 2 1 0 1 0 0 2 0 Cecal 0
Retail 0 0 0 0 1 0 0 0 0 0 0 0 HACCP 1 0 2 0 1 0 0 0 1 0 2 2 Cecal (Beef) 0 Cecal (Dairy) 0
Retail 0 2 0 0 0 0 2 0 0 0 0 3 HACCP1 15 10 11 15 29 22 5 11 8 12 Cecal (Market Hogs) 21 Cecal (Sows) 33
Antimicrobial Class
Antimicrobial (Resistance Breakpoint)
Isolate Source
Aminoglycosides Gentamicin 0.0% 0.0% 0.0% 0.0% 14.3% 0.0% 0.0% 0.0% 0.0% 20.0% 0.0% (MIC ≥ 16 µg/ml) 0 0 0 0 1 0 0 0 0 1 0
0.0%0
0.0% 66.7% 100.0% 50.0% 100.0% 62.5% 66.7% 0.0%0 2 3 1 1 5 4 0
0.0%0
0.0% 50.0% 0.0% 100.0% 100.0%0 1 0 1 2
0.0%0
0.0% 0.0% 0.0% 0.0% 0.0% 50.0%0 0 0 0 0 1
0.0% 0.0% 0.0%0 0 0
0.0% 0.0% 0.0% 0.0% 0.0% 0.0% 0.0% 0.0% 0.0% 0.0%0 0 0 0 0 0 0 0 0 0
0.0%0
0.0%0
Kanamycin 0.0% 0.0% 0.0% 0.0% 14.3% 0.0% 0.0% 0.0% 100.0% 0.0% 0.0% (MIC ≥ 64 µg/ml) 0 0 0 0 1 0 0 0 1 0 0
0.0%0
0.0% 33.3% 100.0% 50.0% 0.0% 12.5% 16.7% 0.0%0 1 3 1 0 1 1 0
0.0%0
0.0% 0.0% 0.0% 0.0% 0.0%0 0 0 0 0
0.0%0
0.0% 0.0% 0.0% 100.0% 0.0% 0.0%0 0 0 1 0 0
0.0% 0.0% 0.0%0 0 0
0.0% 0.0% 0.0% 0.0% 3.4% 9.1% 0.0% 0.0% 0.0% 0.0%0 0 0 0 1 2 0 0 0 0
0.0%0
0.0%0
Streptomycin 0.0% 0.0% 0.0% 0.0% 14.3% 0.0% 0.0% 0.0% 0.0% 20.0% 0.0% (MIC ≥ 64 µg/ml) 0 0 0 0 1 0 0 0 0 1 0
0.0%0
0.0% 66.7% 100.0% 50.0% 100.0% 62.5% 66.7% 0.0%0 2 3 1 1 5 4 0
0.0%0
100.0% 0.0% 0.0% 0.0% 50.0%1 0 0 0 1
0.0%0
0.0% 0.0% 0.0% 100.0% 0.0% 100.0%0 0 0 1 0 2
0.0% 0.0% 0.0%0 0 0
0.0% 0.0% 0.0% 0.0% 0.0% 0.0% 0.0% 0.0% 0.0% 0.0%0 0 0 0 0 0 0 0 0 0
0.0%0
0.0%0
1 In 2012 and 2013, FSIS did not sample products for Salmonella because in prior years the percent of pork carcass samples positive for Salmonella was consistently low
Resistance by Year
Swin
e
Retail
HACCP
Cecal (Market Hogs)
Cecal (Sows)
Cat
tle
Retail
Cecal (Dairy)
HACCP
Cecal (Beef)
Turk
eys
Retail
HACCP
Cecal
HACCP
Humans
Chi
cken
s Retail
Cecal
Cecal (Dairy)
Swin
e
Retail
HACCP
Cecal (Market Hogs)
Cecal (Sows)
Cat
tle HACCP
Cecal (Beef)
Turk
eys
Retail
HACCP
Cecal
Retail
HACCP
Cecal
Chi
cken
s Retail
Swin
e
Retail
HACCP
Cecal (Market Hogs)
Cecal (Sows)
Cat
tle
Retail
Cecal (Dairy)
Humans
HACCP
Cecal (Beef)
Turk
eys
Retail
HACCP
Cecal
Number of Isolates Tested
Chi
cken
sTu
rkey
sC
attle
HACCP
Swin
e Humans
Chi
cken
s Retail
Cecal
125
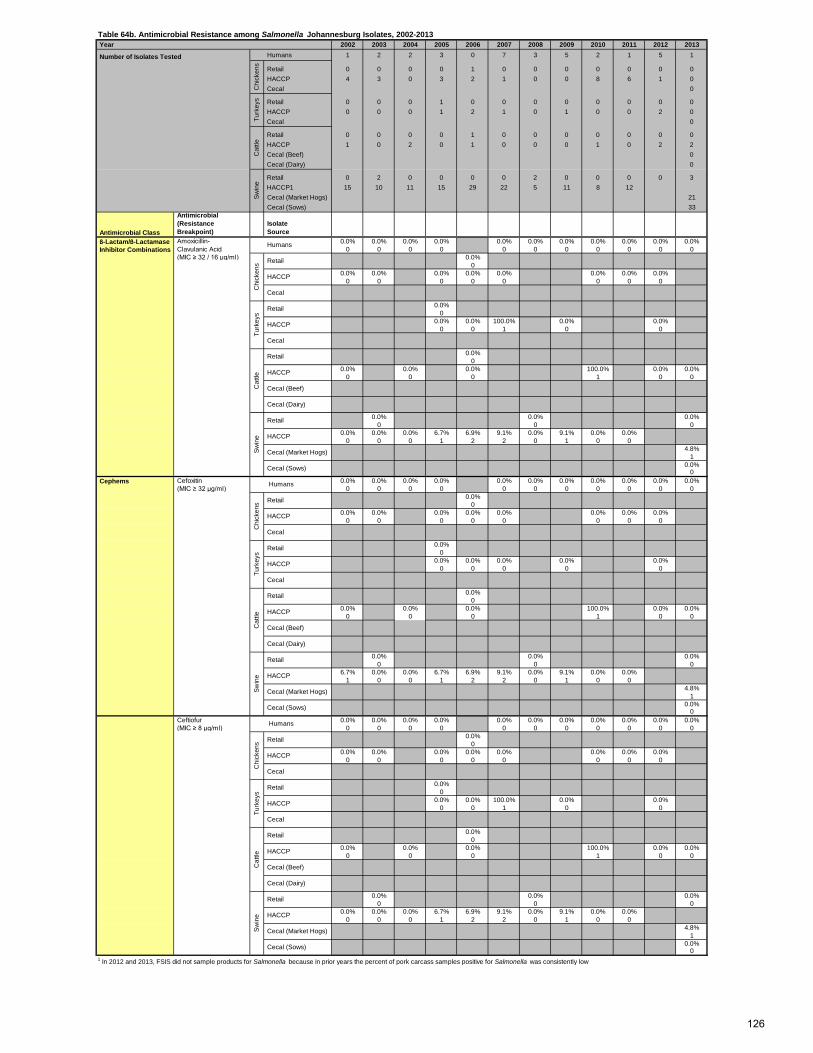
Year 2002 2003 2004 2005 2006 2007 2008 2009 2010 2011 2012 2013
Number of Isolates Tested Humans 1 2 2 3 0 7 3 5 2 1 5 1
Retail 0 0 0 0 1 0 0 0 0 0 0 0 HACCP 4 3 0 3 2 1 0 0 8 6 1 0 Cecal 0
Retail 0 0 0 1 0 0 0 0 0 0 0 0 HACCP 0 0 0 1 2 1 0 1 0 0 2 0 Cecal 0
Retail 0 0 0 0 1 0 0 0 0 0 0 0 HACCP 1 0 2 0 1 0 0 0 1 0 2 2 Cecal (Beef) 0 Cecal (Dairy) 0
Retail 0 2 0 0 0 0 2 0 0 0 0 3 HACCP1 15 10 11 15 29 22 5 11 8 12 Cecal (Market Hogs) 21 Cecal (Sows) 33
Antimicrobial Class
Antimicrobial (Resistance Breakpoint)
Isolate Source
β-Lactam/β-Lactamase Amoxicillin- 0.0% 0.0% 0.0% 0.0% 0.0% 0.0% 0.0% 0.0% 0.0% 0.0% 0.0% Inhibitor Combinations Clavulanic Acid 0 0 0 0 0 0 0 0 0 0 0
(MIC ≥ 32 / 16 µg/ml) 0.0%0
0.0% 0.0% 0.0% 0.0% 0.0% 0.0% 0.0% 0.0%0 0 0 0 0 0 0 0
0.0%0
0.0% 0.0% 100.0% 0.0% 0.0%0 0 1 0 0
0.0%0
0.0% 0.0% 0.0% 100.0% 0.0% 0.0%0 0 0 1 0 0
0.0% 0.0% 0.0%0 0 0
0.0% 0.0% 0.0% 6.7% 6.9% 9.1% 0.0% 9.1% 0.0% 0.0%0 0 0 1 2 2 0 1 0 0
4.8%1
0.0%0
Cefoxitin 0.0% 0.0% 0.0% 0.0% 0.0% 0.0% 0.0% 0.0% 0.0% 0.0% 0.0% (MIC ≥ 32 µg/ml) 0 0 0 0 0 0 0 0 0 0 0
0.0%0
0.0% 0.0% 0.0% 0.0% 0.0% 0.0% 0.0% 0.0%0 0 0 0 0 0 0 0
0.0%0
0.0% 0.0% 0.0% 0.0% 0.0%0 0 0 0 0
0.0%0
0.0% 0.0% 0.0% 100.0% 0.0% 0.0%0 0 0 1 0 0
0.0% 0.0% 0.0%0 0 0
6.7% 0.0% 0.0% 6.7% 6.9% 9.1% 0.0% 9.1% 0.0% 0.0%1 0 0 1 2 2 0 1 0 0
4.8%1
0.0%0
Ceftiofur 0.0% 0.0% 0.0% 0.0% 0.0% 0.0% 0.0% 0.0% 0.0% 0.0% 0.0% (MIC ≥ 8 µg/ml) 0 0 0 0 0 0 0 0 0 0 0
0.0%0
0.0% 0.0% 0.0% 0.0% 0.0% 0.0% 0.0% 0.0%0 0 0 0 0 0 0 0
0.0%0
0.0% 0.0% 100.0% 0.0% 0.0%0 0 1 0 0
0.0%0
0.0% 0.0% 0.0% 100.0% 0.0% 0.0%0 0 0 1 0 0
0.0% 0.0% 0.0%0 0 0
0.0% 0.0% 0.0% 6.7% 6.9% 9.1% 0.0% 9.1% 0.0% 0.0%0 0 0 1 2 2 0 1 0 0
4.8%1
0.0%0
1 In 2012 and 2013, FSIS did not sample products for Salmonella because in prior years the percent of pork carcass samples positive for Salmonella was consistently low
Cecal (Dairy)
Swin
e
Retail
HACCP
Cecal (Market Hogs)
Cecal (Sows)
Cat
tle HACCP
Cecal (Beef)
Retail
Turk
eys
Retail
HACCP
Cecal
HACCP
Cecal
Humans
Chi
cken
s Retail
Swin
e
Retail
HACCP
Cecal (Market Hogs)
Cecal (Sows)
HACCP
Cecal (Beef)
Cecal (Dairy)
Cat
tle
Retail
Turk
eys
Retail
HACCP
Cecal
Chi
cken
s
HACCP
Cecal
Retail
Cephems Humans
Swin
e
Retail
HACCP
Cecal (Market Hogs)
Cecal (Sows)
Cat
tle
Retail
HACCP
Cecal (Beef)
Cecal (Dairy)
Turk
eys
Retail
HACCP
Cecal
Chi
cken
s
HACCP
Cecal
RetailC
hick
ens
Turk
eys
Cat
tleSw
ine
Humans
Table 64b. Antimicrobial Resistance among Salmonella Johannesburg Isolates, 2002-2013
126
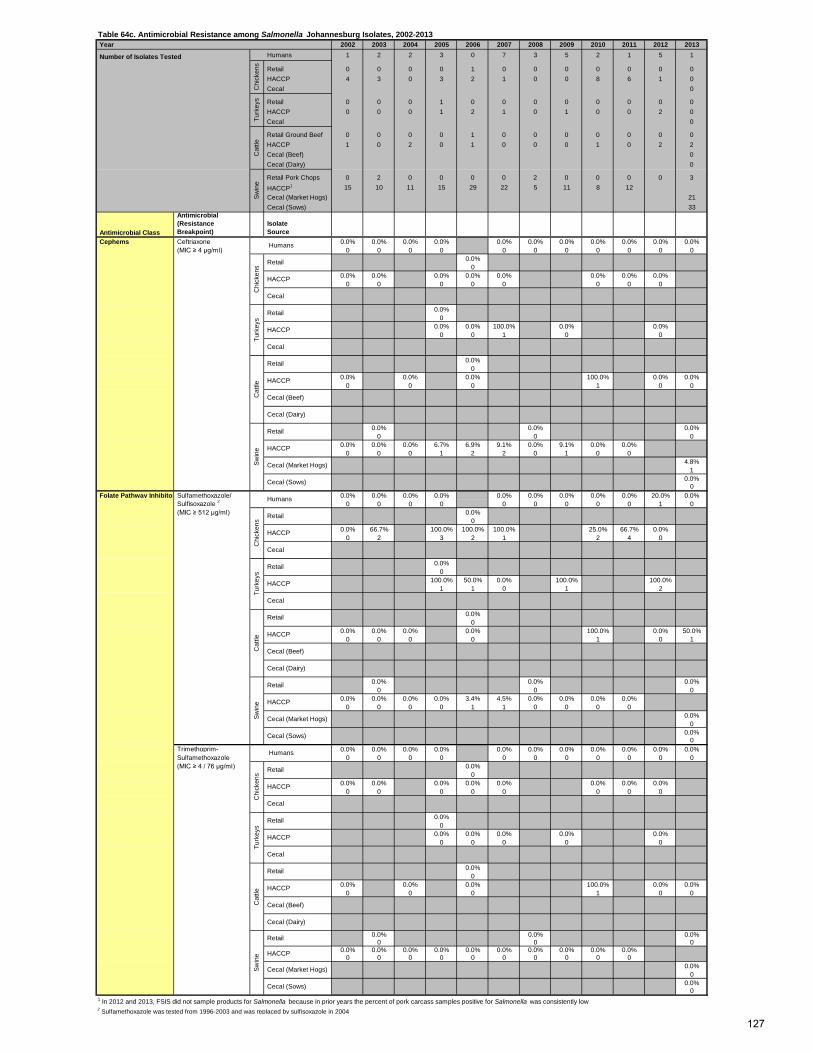
Year 2002 2003 2004 2005 2006 2007 2008 2009 2010 2011 2012 2013
Number of Isolates Tested Humans 1 2 2 3 0 7 3 5 2 1 5 1
Retail 0 0 0 0 1 0 0 0 0 0 0 0 HACCP 4 3 0 3 2 1 0 0 8 6 1 0 Cecal 0
Retail 0 0 0 1 0 0 0 0 0 0 0 0 HACCP 0 0 0 1 2 1 0 1 0 0 2 0 Cecal 0
Retail Ground Beef 0 0 0 0 1 0 0 0 0 0 0 0 HACCP 1 0 2 0 1 0 0 0 1 0 2 2 Cecal (Beef) 0 Cecal (Dairy) 0
Retail Pork Chops 0 2 0 0 0 0 2 0 0 0 0 3 HACCP1 15 10 11 15 29 22 5 11 8 12 Cecal (Market Hogs) 21 Cecal (Sows) 33
Antimicrobial Class
Antimicrobial (Resistance Breakpoint)
Isolate Source
Ceftriaxone 0.0% 0.0% 0.0% 0.0% 0.0% 0.0% 0.0% 0.0% 0.0% 0.0% 0.0% (MIC ≥ 4 µg/ml) 0 0 0 0 0 0 0 0 0 0 0
0.0%0
0.0% 0.0% 0.0% 0.0% 0.0% 0.0% 0.0% 0.0%0 0 0 0 0 0 0 0
0.0%0
0.0% 0.0% 100.0% 0.0% 0.0%0 0 1 0 0
0.0%0
0.0% 0.0% 0.0% 100.0% 0.0% 0.0%0 0 0 1 0 0
0.0% 0.0% 0.0%0 0 0
0.0% 0.0% 0.0% 6.7% 6.9% 9.1% 0.0% 9.1% 0.0% 0.0%0 0 0 1 2 2 0 1 0 0
4.8%1
0.0%0
Folate Pathway Inhibitor Sulfamethoxazole/ 0.0% 0.0% 0.0% 0.0% 0.0% 0.0% 0.0% 0.0% 0.0% 20.0% 0.0% Sulfisoxazole 2 0 0 0 0 0 0 0 0 0 1 0 (MIC ≥ 512 µg/ml) 0.0%
00.0% 66.7% 100.0% 100.0% 100.0% 25.0% 66.7% 0.0%
0 2 3 2 1 2 4 0
0.0%0
100.0% 50.0% 0.0% 100.0% 100.0%1 1 0 1 2
0.0%0
0.0% 0.0% 0.0% 0.0% 100.0% 0.0% 50.0%0 0 0 0 1 0 1
0.0% 0.0% 0.0%0 0 0
0.0% 0.0% 0.0% 0.0% 3.4% 4.5% 0.0% 0.0% 0.0% 0.0%0 0 0 0 1 1 0 0 0 0
0.0%0
0.0%0
Trimethoprim- 0.0% 0.0% 0.0% 0.0% 0.0% 0.0% 0.0% 0.0% 0.0% 0.0% 0.0% Sulfamethoxazole 0 0 0 0 0 0 0 0 0 0 0 (MIC ≥ 4 / 76 µg/ml) 0.0%
00.0% 0.0% 0.0% 0.0% 0.0% 0.0% 0.0% 0.0%
0 0 0 0 0 0 0 0
0.0%0
0.0% 0.0% 0.0% 0.0% 0.0%0 0 0 0 0
0.0%0
0.0% 0.0% 0.0% 100.0% 0.0% 0.0%0 0 0 1 0 0
0.0% 0.0% 0.0%0 0 0
0.0% 0.0% 0.0% 0.0% 0.0% 0.0% 0.0% 0.0% 0.0% 0.0%0 0 0 0 0 0 0 0 0 0
0.0%0
0.0%0
1 In 2012 and 2013, FSIS did not sample products for Salmonella because in prior years the percent of pork carcass samples positive for Salmonella was consistently low2 Sulfamethoxazole was tested from 1996-2003 and was replaced by sulfisoxazole in 2004
Swin
e
Retail
HACCP
Cecal (Market Hogs)
Cecal (Sows)
Cat
tle
Retail
Cecal (Dairy)
HACCP
Cecal (Beef)
Turk
eys
Retail
HACCP
Cecal
HACCP
Humans
Chi
cken
s
Retail
Cecal
Cecal (Dairy)
Swin
e
Retail
HACCP
Cecal (Market Hogs)
Cecal (Sows)
Cat
tle
HACCP
Cecal (Beef)
Turk
eys
Retail
HACCP
Cecal
Retail
HACCP
Cecal
Chi
cken
s
Retail
Swin
e
Retail
HACCP
Cecal (Market Hogs)
Cecal (Sows)
Cat
tle
Retail
Cecal (Dairy)
Humans
HACCP
Cecal (Beef)
Turk
eys
Retail
HACCP
Cecal
HACCP
Cephems HumansC
hick
ens
Retail
Cecal
Turk
eys
Cat
tleSw
ine
Table 64c. Antimicrobial Resistance among Salmonella Johannesburg Isolates, 2002-2013
Chi
cken
s
127
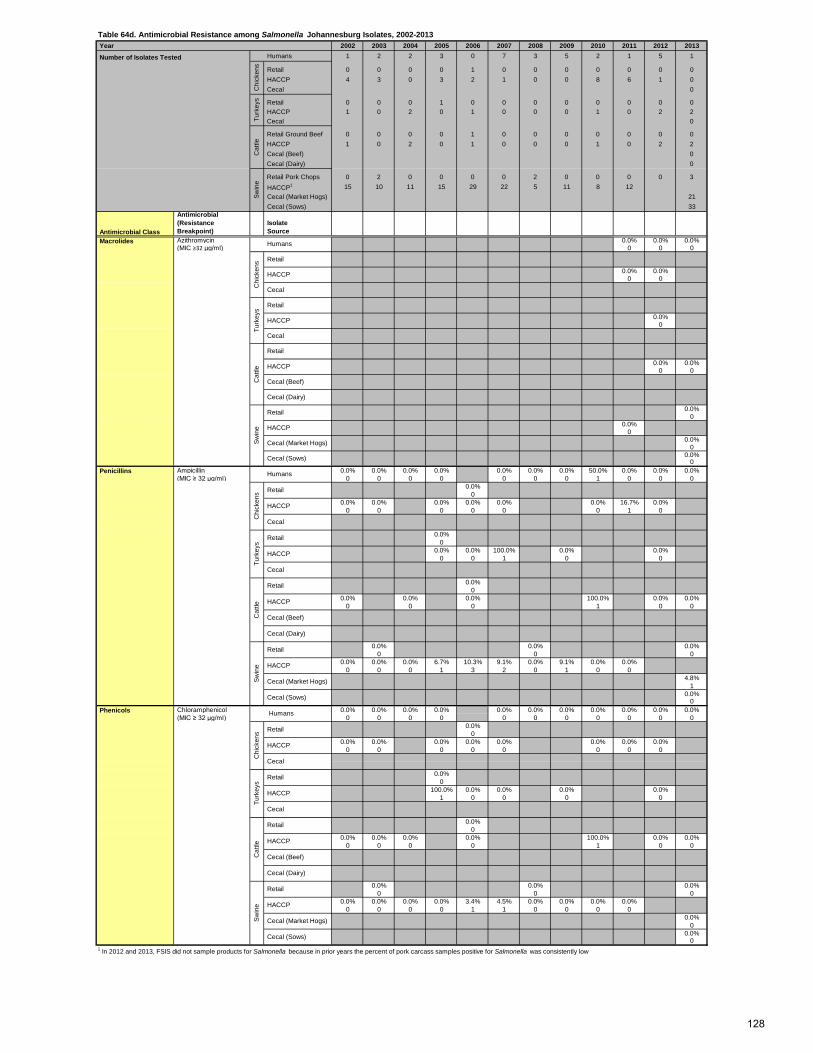
Table 64d. Antimicrobial Resistance among Salmonella Johannesburg Isolates, 2002-2013 Year 2002 2003 2004 2005 2006 2007 2008 2009 2010 2011 2012 2013
Number of Isolates Tested Humans 1 2 2 3 0 7 3 5 2 1 5 1
Retail 0 0 0 0 1 0 0 0 0 0 0 0 HACCP 4 3 0 3 2 1 0 0 8 6 1 0 Cecal 0
Retail 0 0 0 1 0 0 0 0 0 0 0 0 HACCP 1 0 2 0 1 0 0 0 1 0 2 2 Cecal 0
Retail Ground Beef 0 0 0 0 1 0 0 0 0 0 0 0 HACCP 1 0 2 0 1 0 0 0 1 0 2 2 Cecal (Beef) 0 Cecal (Dairy) 0
Retail Pork Chops 0 2 0 0 0 0 2 0 0 0 0 3 HACCP1 15 10 11 15 29 22 5 11 8 12 Cecal (Market Hogs) 21 Cecal (Sows) 33
Antimicrobial Class
Antimicrobial (Resistance Breakpoint)
Isolate Source
Azithromycin 0.0% 0.0% 0.0% (MIC ≥32 µg/ml) 0 0 0
0.0% 0.0%0 0
0.0%0
0.0% 0.0%0 0
0.0%0
0.0%0
0.0%0
0.0%0
Ampicillin 0.0% 0.0% 0.0% 0.0% 0.0% 0.0% 0.0% 50.0% 0.0% 0.0% 0.0% (MIC ≥ 32 µg/ml) 0 0 0 0 0 0 0 1 0 0 0
0.0%0
0.0% 0.0% 0.0% 0.0% 0.0% 0.0% 16.7% 0.0%0 0 0 0 0 0 1 0
0.0%0
0.0% 0.0% 100.0% 0.0% 0.0%0 0 1 0 0
0.0%0
0.0% 0.0% 0.0% 100.0% 0.0% 0.0%0 0 0 1 0 0
0.0% 0.0% 0.0%0 0 0
0.0% 0.0% 0.0% 6.7% 10.3% 9.1% 0.0% 9.1% 0.0% 0.0%0 0 0 1 3 2 0 1 0 0
4.8%1
0.0%0
Chloramphenicol 0.0% 0.0% 0.0% 0.0% 0.0% 0.0% 0.0% 0.0% 0.0% 0.0% 0.0% (MIC ≥ 32 µg/ml) 0 0 0 0 0 0 0 0 0 0 0
0.0%0
0.0% 0.0% 0.0% 0.0% 0.0% 0.0% 0.0% 0.0%0 0 0 0 0 0 0 0
0.0%0
100.0% 0.0% 0.0% 0.0% 0.0%1 0 0 0 0
0.0%0
0.0% 0.0% 0.0% 0.0% 100.0% 0.0% 0.0%0 0 0 0 1 0 0
0.0% 0.0% 0.0%0 0 0
0.0% 0.0% 0.0% 0.0% 3.4% 4.5% 0.0% 0.0% 0.0% 0.0%0 0 0 0 1 1 0 0 0 0
0.0%0
0.0%0
1 In 2012 and 2013, FSIS did not sample products for Salmonella because in prior years the percent of pork carcass samples positive for Salmonella was consistently low
Swin
e
Retail
HACCP
Cecal (Market Hogs)
Cecal (Sows)
Cat
tle
Retail
Cecal (Dairy)
HACCP
Cecal (Beef)
Turk
eys
Retail
HACCP
Cecal
HACCP
Phenicols Humans
Chi
cken
s Retail
Cecal
Cat
tle
Retail
Cecal (Dairy)
Swin
e
Retail
HACCP
Cecal (Market Hogs)
Cecal (Sows)
HACCP
Cecal (Beef)
Turk
eys
Retail
HACCP
Cecal
HACCP
Penicillins Humans
Chi
cken
s Retail
Cecal
Chi
cken
sSw
ine
Retail
HACCP
Cecal (Market Hogs)
Cecal (Sows)
Cat
tle
Retail
HACCP
Turk
eys
Retail
HACCP
Cecal
Cecal (Dairy)
HACCP
Cecal
Retail
Cecal (Beef)
Turk
eys
Cat
tleSw
ine
Macrolides Humans
Chi
cken
s
128

Year 2002 2003 2004 2005 2006 2007 2008 2009 2010 2011 2012 2013
Number of Isolates Tested Humans 1 2 2 3 0 7 3 5 2 1 5 1
Retail 0 0 0 0 1 0 0 0 0 0 0 0 HACCP 4 3 0 3 2 1 0 0 8 6 1 0 Cecal 0
Retail 0 0 0 1 0 0 0 0 0 0 0 0 HACCP 0 0 0 1 2 1 0 1 0 0 2 0 Cecal 0
Retail Ground Beef 0 0 0 0 1 0 0 0 0 0 0 0 HACCP 1 0 2 0 1 0 0 0 1 0 2 2 Cecal (Beef) 0 Cecal (Dairy) 0
Retail Pork Chops 0 2 0 0 0 0 2 0 0 0 0 3 HACCP1 15 10 11 15 29 22 5 11 8 12 Cecal (Market Hogs) 21 Cecal (Sows) 33
Antimicrobial Class
Antimicrobial (Resistance Breakpoint)
Isolate Source
Quinolones Ciprofloxacin 0.0% 0.0% 0.0% 0.0% 0.0% 0.0% 0.0% 0.0% 0.0% 0.0% 0.0% (MIC ≥ 1 µg/ml) 0 0 0 0 0 0 0 0 0 0 0
0.0%0
0.0% 0.0% 0.0% 0.0% 0.0% 0.0% 0.0% 0.0%0 0 0 0 0 0 0 0
0.0%0
0.0% 0.0% 0.0% 0.0% 0.0%0 0 0 0 0
0.0%0
0.0% 0.0% 0.0% 0.0% 0.0% 0.0%0 0 0 0 0 0
0.0% 0.0% 0.0%0 0 0
0.0% 0.0% 0.0% 0.0% 0.0% 0.0% 0.0% 0.0% 0.0% 0.0%0 0 0 0 0 0 0 0 0 0
0.0%0
0.0%0
Nalidixic Acid 0.0% 0.0% 0.0% 0.0% 0.0% 0.0% 0.0% 0.0% 0.0% 0.0% 0.0% (MIC ≥ 32 µg/ml) 0 0 0 0 0 0 0 0 0 0 0
0.0%0
0.0% 0.0% 0.0% 0.0% 0.0% 0.0% 0.0% 0.0%0 0 0 0 0 0 0 0
0.0%0
0.0% 0.0% 0.0% 0.0% 0.0%0 0 0 0 0
0.0%0
0.0% 0.0% 0.0% 0.0% 0.0% 0.0%0 0 0 0 0 0
0.0% 0.0% 0.0%0 0 0
0.0% 0.0% 0.0% 0.0% 0.0% 0.0% 0.0% 0.0% 0.0% 0.0%0 0 0 0 0 0 0 0 0 0
0.0%0
0.0%0
Tetracycline 100.0% 50.0% 0.0% 33.3% 28.6% 66.7% 60.0% 50.0% 100.0% 20.0% 0.0% (MIC ≥ 16 µg/ml) 1 1 0 1 2 2 3 1 1 1 0
0.0%0
0.0% 33.3% 100.0% 50.0% 0.0% 0.0% 16.7% 0.0%0 1 3 1 0 0 1 0
0.0%0
100.0% 50.0% 100.0% 0.0% 100.0%1 1 1 0 2
100.0%1
0.0% 0.0% 0.0% 100.0% 0.0% 100.0%0 0 0 1 0 2
100.0% 50.0% 0.0%2 1 0
13.3% 10.0% 27.3% 66.7% 37.9% 54.5% 40.0% 54.5% 25.0% 58.3%2 1 3 10 11 12 2 6 2 7
0.0%0
9.1%3
1 In 2012 and 2013, FSIS did not sample products for Salmonella because in prior years the percent of pork carcass samples positive for Salmonella was consistently low
Cecal (Market Hogs)
Cecal (Sows)
Cecal (Beef)
Cecal (Dairy)
Swin
e
Retail
HACCP
Cat
tle
Retail
HACCP
Cecal
Turk
eys
Retail
HACCP
HACCP
Tetracyclines Humans
Chi
cken
s Retail
Cecal
Cecal (Dairy)
Swin
e
Retail
HACCP
Cecal (Market Hogs)
Cecal (Sows)
Cat
tle HACCP
Cecal (Beef)
Retail
Turk
eys
Retail
HACCP
Cecal
Humans
Chi
cken
s Retail
Swin
e
Retail
HACCP
Cecal (Market Hogs)
Cecal (Sows)
HACCP
Cecal
Cat
tle
Retail
Turk
eys
Retail
HACCP
Cecal
Chi
cken
s
HACCP
Cecal (Beef)
Cecal (Dairy)
HACCP
Cecal
RetailC
hick
ens
Turk
eys
Cat
tleSw
ine
Humans
Table 64e. Antimicrobial Resistance among Salmonella Johannesburg Isolates, 1996-2013
129
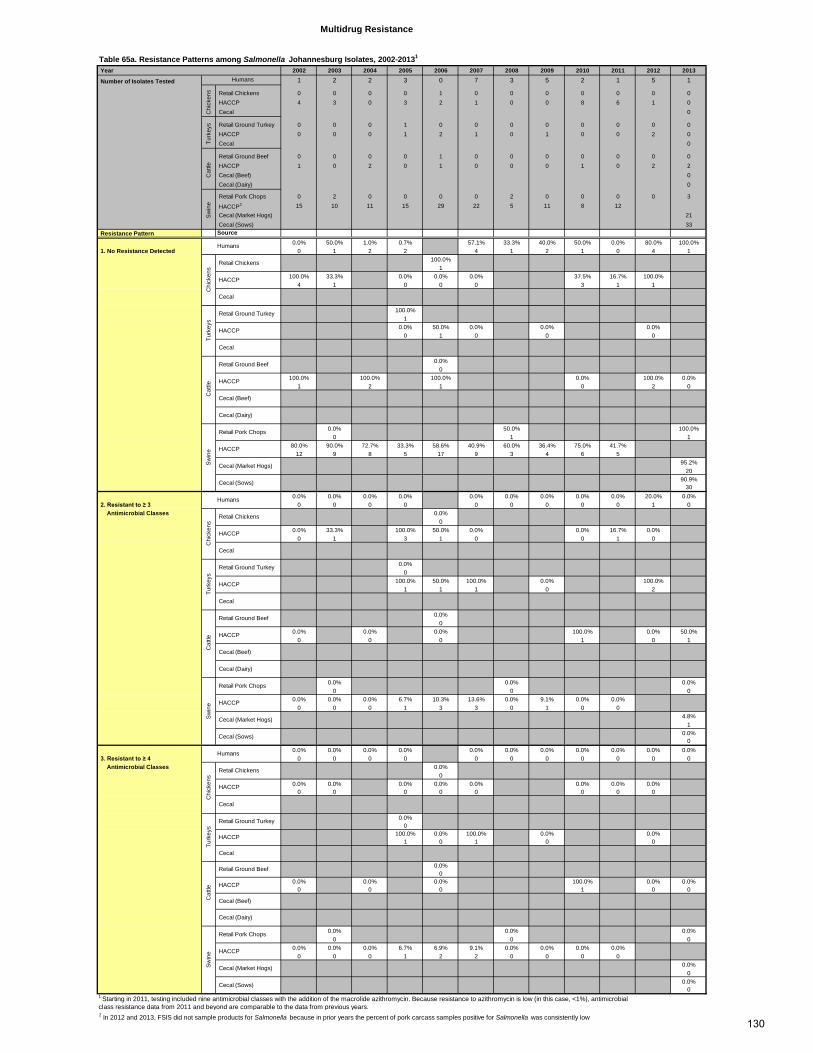
Table 65a. Resistance Patterns among Salmonella Johannesburg Isolates, 2002-20131
Year 2002 2003 2004 2005 2006 2007 2008 2009 2010 2011 2012 2013
Number of Isolates Tested 1 2 2 3 0 7 3 5 2 1 5 1
Retail Chickens 0 0 0 0 1 0 0 0 0 0 0 0 HACCP 4 3 0 3 2 1 0 0 8 6 1 0 Cecal 0
Retail Ground Turkey 0 0 0 1 0 0 0 0 0 0 0 0 HACCP 0 0 0 1 2 1 0 1 0 0 2 0 Cecal 0
Retail Ground Beef 0 0 0 0 1 0 0 0 0 0 0 0 HACCP 1 0 2 0 1 0 0 0 1 0 2 2 Cecal (Beef) 0 Cecal (Dairy) 0
Retail Pork Chops 0 2 0 0 0 0 2 0 0 0 0 3
HACCP2 15 10 11 15 29 22 5 11 8 12 Cecal (Market Hogs) 21 Cecal (Sows) 33
Resistance Pattern Source0.0% 50.0% 1.0% 0.7% 57.1% 33.3% 40.0% 50.0% 0.0% 80.0% 100.0%
1. No Resistance Detected 0 1 2 2 4 1 2 1 0 4 1100.0%
1100.0% 33.3% 0.0% 0.0% 0.0% 37.5% 16.7% 100.0%
4 1 0 0 0 3 1 1
100.0%1
0.0% 50.0% 0.0% 0.0% 0.0%0 1 0 0 0
0.0%0
100.0% 100.0% 100.0% 0.0% 100.0% 0.0%1 2 1 0 2 0
0.0% 50.0% 100.0%0 1 1
80.0% 90.0% 72.7% 33.3% 58.6% 40.9% 60.0% 36.4% 75.0% 41.7%12 9 8 5 17 9 3 4 6 5
95.2%20
90.9%30
0.0% 0.0% 0.0% 0.0% 0.0% 0.0% 0.0% 0.0% 0.0% 20.0% 0.0% 2. Resistant to ≥ 3 0 0 0 0 0 0 0 0 0 1 0 Antimicrobial Classes 0.0%
00.0% 33.3% 100.0% 50.0% 0.0% 0.0% 16.7% 0.0%
0 1 3 1 0 0 1 0
0.0%0
100.0% 50.0% 100.0% 0.0% 100.0%1 1 1 0 2
0.0%0
0.0% 0.0% 0.0% 100.0% 0.0% 50.0%0 0 0 1 0 1
0.0% 0.0% 0.0%0 0 0
0.0% 0.0% 0.0% 6.7% 10.3% 13.6% 0.0% 9.1% 0.0% 0.0%0 0 0 1 3 3 0 1 0 0
4.8%1
0.0%0
0.0% 0.0% 0.0% 0.0% 0.0% 0.0% 0.0% 0.0% 0.0% 0.0% 0.0% 3. Resistant to ≥ 4 0 0 0 0 0 0 0 0 0 0 0 Antimicrobial Classes 0.0%
00.0% 0.0% 0.0% 0.0% 0.0% 0.0% 0.0% 0.0%
0 0 0 0 0 0 0 0
0.0%0
100.0% 0.0% 100.0% 0.0% 0.0%1 0 1 0 0
0.0%0
0.0% 0.0% 0.0% 100.0% 0.0% 0.0%0 0 0 1 0 0
0.0% 0.0% 0.0%0 0 0
0.0% 0.0% 0.0% 6.7% 6.9% 9.1% 0.0% 0.0% 0.0% 0.0%0 0 0 1 2 2 0 0 0 0
0.0%0
0.0%0
2 In 2012 and 2013, FSIS did not sample products for Salmonella because in prior years the percent of pork carcass samples positive for Salmonella was consistently low
Sw
ine
Humans
Chi
cken
s
Retail Chickens
HACCP
Cecal
Multidrug Resistance
Humans
Chi
cken
sTu
rkey
sC
attle
Turk
eys
Retail Ground Turkey
HACCP
Cecal
Cat
tle
Retail Ground Beef
HACCP
Cecal (Beef)
Cecal (Dairy)
Chi
cken
s
Retail Chickens
HACCP
Cecal
Turk
eys
Retail Ground Turkey
HACCP
Cecal
Sw
ine
Retail Pork Chops
HACCP
Cecal (Market Hogs)
Cecal (Sows)
Humans
Cat
tle
Retail Ground Beef
HACCP
Cecal (Beef)
Cecal (Dairy)
Sw
ine
Retail Pork Chops
HACCP
Cecal (Market Hogs)
Cecal (Sows)
Humans
Chi
cken
s
Retail Chickens
HACCP
Cecal
Turk
eys
Retail Ground Turkey
HACCP
Cecal
Cat
tle
Retail Ground Beef
HACCP
Cecal (Beef)
Cecal (Dairy)
Sw
ine
Retail Pork Chops
HACCP
Cecal (Market Hogs)
Cecal (Sows)
1 Starting in 2011, testing included nine antimicrobial classes with the addition of the macrolide azithromycin. Because resistance to azithromycin is low (in this case, <1%), antimicrobial class resistance data from 2011 and beyond are comparable to the data from previous years.
130

Table 65b. Resistance Patterns among Salmonella Johannesburg Isolates, 2002-20131
Year 2002 2003 2004 2005 2006 2007 2008 2009 2010 2011 2012 2013 Number of Isolates Tested 1 2 2 3 0 7 3 5 2 1 5 1
Retail Chickens 0 0 0 0 1 0 0 0 0 0 0 0 HACCP 4 3 0 3 2 1 0 0 8 6 1 0 Cecal 0
Retail Ground Turkey 0 0 0 1 0 0 0 0 0 0 0 0 HACCP 0 0 0 1 2 1 0 1 0 0 2 0 Cecal 0
Retail Ground Beef 0 0 0 0 1 0 0 0 0 0 0 0 HACCP 1 0 2 0 1 0 0 0 1 0 2 2 Cecal (Beef) 0 Cecal (Dairy) 0
Retail Pork Chops 0 2 0 0 0 0 2 0 0 0 0 3
HACCP2 15 10 11 15 29 22 5 11 8 12 Cecal (Market Hogs) 21 Cecal (Sows) 33
Resistance Pattern Source0.0% 0.0% 0.0% 0.0% 0.0% 0.0% 0.0% 0.0% 0.0% 0.0% 0.0%
4. Resistant to ≥ 5 0 0 0 0 0 0 0 0 0 0 0 Antimicrobial Classes 0.0%
00.0% 0.0% 0.0% 0.0% 0.0% 0.0% 0.0% 0.0%
0 0 0 0 0 0 0 0
0.0%0
0.0% 0.0% 0.0% 0.0% 0.0%0 0 0 0 0
0.0%0
0.0% 0.0% 0.0% 0.0% 100.0% 0.0% 0.0%0 0 0 0 1 0 0
0.0% 0.0% 0.0%0 0 0
0.0% 0.0% 0.0% 0.0% 3.4% 4.5% 0.0% 0.0% 0.0% 0.0%0 0 0 0 1 1 0 0 0 0
0.0%0
0.0%0
0.0% 0.0% 0.0% 0.0% 0.0% 0.0% 0.0% 0.0% 0.0% 0.0% 0.0% 5. At Least ACSSuT
3 Resistant 0 0 0 0 0 0 0 0 0 0 00.0%
00.0% 0.0% 0.0% 0.0% 0.0% 0.0% 0.0% 0.0% 0.0%
0 0 0 0 0 0 0 0 0
0.0%0
0.0% 0.0% 0.0% 0.0% 0.0%0 0 0 0 0
0.0%0
0.0% 0.0% 0.0% 100.0% 0.0% 0.0%0 0 0 1 0 0
0.0% 0.0% 0.0%0 0 0
0.0% 0.0% 0.0% 0.0% 0.0% 0.0% 0.0% 0.0% 0.0% 0.0%0 0 0 0 0 0 0 0 0 0
0.0%0
0.0%0
0.0% 0.0% 0.0% 0.0% 0.0% 0.0% 0.0% 0.0% 0.0% 0.0% 0.0% 6. At Least ACT/S
4 Resistant 0 0 0 0 0 0 0 0 0 0 00.0%
00.0% 0.0% 0.0% 0.0% 0.0% 0.0% 0.0% 0.0%
0 0 0 0 0 0 0 0
0.0%0
0.0% 0.0% 0.0% 0.0% 0.0%0 0 0 0 0
0.0%0
0.0% 0.0% 0.0% 100.0% 0.0% 0.0%0 0 0 1 0 0
0.0% 0.0% 0.0%0 0 0
0.0% 0.0% 0.0% 0.0% 0.0% 0.0% 0.0% 0.0% 0.0% 0.0%0 0 0 0 0 0 0 0 0 0
0.0%0
0.0%0
2 In 2012 and 2013, FSIS did not sample products for Salmonella because in prior years the percent of pork carcass samples positive for Salmonella was consistently low3 ACSSuT = ampicillin, chloramphenicol, streptomycin, sulfamethoxazole/sulfisoxazole, and tetracycline4 ACT/S = ampicillin, chloramphenicol, and trimethoprim-sulfamethoxazole
Cat
tle
Retail Ground Beef
HACCP
Cecal (Beef)
Cecal (Dairy)
Sw
ine
Retail Pork Chops
HACCP
Cecal (Market Hogs)
Cecal (Sows)
Humans
Chi
cken
s
Retail Chickens
HACCP
Cecal
Turk
eys
Retail Ground Turkey
HACCP
Cecal
Cat
tleS
win
e
Humans
Chi
cken
s
Retail Chickens
HACCP
Cecal
Humans
Chi
cken
sTu
rkey
sS
win
e
Retail Pork Chops
HACCP
Cecal (Market Hogs)
Cecal (Sows)
Humans
Turk
eys
Retail Ground Turkey
HACCP
Cecal
Cat
tle
Retail Ground Beef
HACCP
Cecal (Beef)
Cecal (Dairy)
1 Starting in 2011, testing included nine antimicrobial classes with the addition of the macrolide azithromycin. Because resistance to azithromycin is low (in this case, <1%), antimicrobial class resistance data from 2011 and beyond are comparable to the data from previous years.
Chi
cken
s
Retail Chickens
HACCP
Cecal
Turk
eys
Retail Ground Turkey
HACCP
Cecal
Cat
tle
Retail Ground Beef
HACCP
Cecal (Beef)
Cecal (Dairy)
Sw
ine
Retail Pork Chops
HACCP
Cecal (Market Hogs)
Cecal (Sows)
131
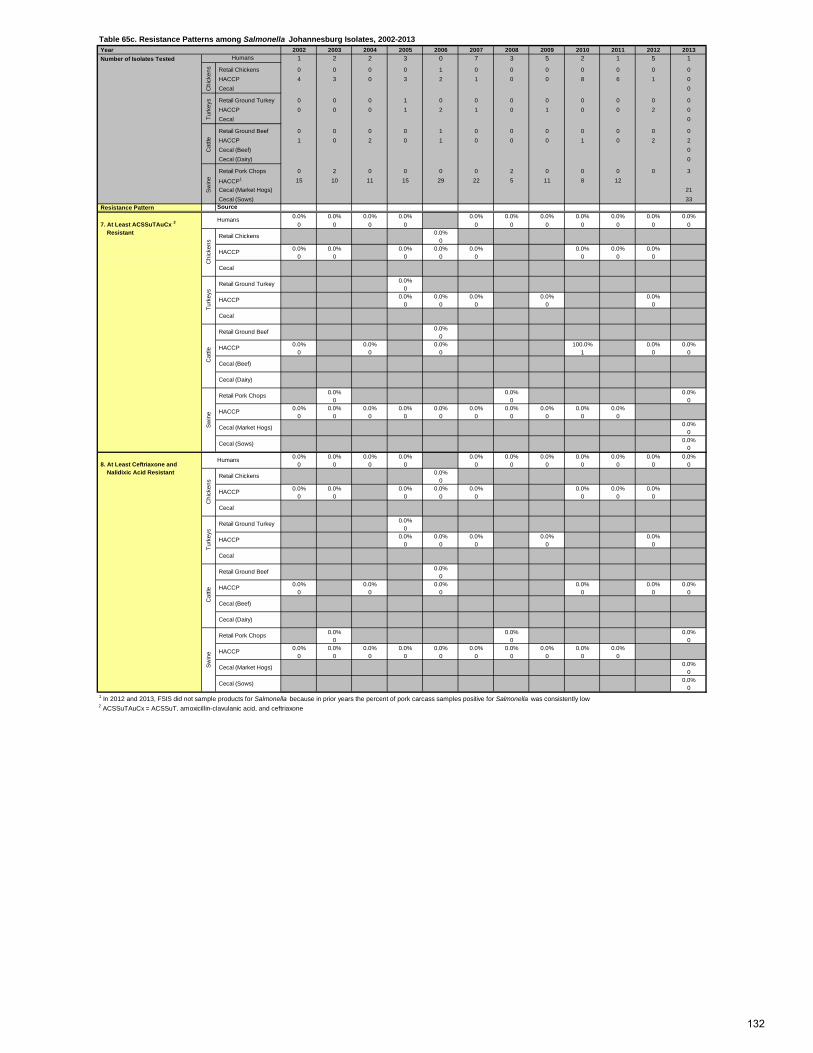
Table 65c. Resistance Patterns among Salmonella Johannesburg Isolates, 2002-2013 Year 2002 2003 2004 2005 2006 2007 2008 2009 2010 2011 2012 2013 Number of Isolates Tested 1 2 2 3 0 7 3 5 2 1 5 1
Retail Chickens 0 0 0 0 1 0 0 0 0 0 0 0 HACCP 4 3 0 3 2 1 0 0 8 6 1 0 Cecal 0
Retail Ground Turkey 0 0 0 1 0 0 0 0 0 0 0 0 HACCP 0 0 0 1 2 1 0 1 0 0 2 0 Cecal 0
Retail Ground Beef 0 0 0 0 1 0 0 0 0 0 0 0 HACCP 1 0 2 0 1 0 0 0 1 0 2 2 Cecal (Beef) 0 Cecal (Dairy) 0
Retail Pork Chops 0 2 0 0 0 0 2 0 0 0 0 3
HACCP1 15 10 11 15 29 22 5 11 8 12 Cecal (Market Hogs) 21 Cecal (Sows) 33
Resistance Pattern Source0.0% 0.0% 0.0% 0.0% 0.0% 0.0% 0.0% 0.0% 0.0% 0.0% 0.0%
7. At Least ACSSuTAuCx 2 0 0 0 0 0 0 0 0 0 0 0 Resistant 0.0%
00.0% 0.0% 0.0% 0.0% 0.0% 0.0% 0.0% 0.0%
0 0 0 0 0 0 0 0
0.0%0
0.0% 0.0% 0.0% 0.0% 0.0%0 0 0 0 0
0.0%0
0.0% 0.0% 0.0% 100.0% 0.0% 0.0%0 0 0 1 0 0
0.0% 0.0% 0.0%0 0 0
0.0% 0.0% 0.0% 0.0% 0.0% 0.0% 0.0% 0.0% 0.0% 0.0%0 0 0 0 0 0 0 0 0 0
0.0%0
0.0%0
0.0% 0.0% 0.0% 0.0% 0.0% 0.0% 0.0% 0.0% 0.0% 0.0% 0.0% 8. At Least Ceftriaxone and 0 0 0 0 0 0 0 0 0 0 0 Nalidixic Acid Resistant 0.0%
00.0% 0.0% 0.0% 0.0% 0.0% 0.0% 0.0% 0.0%
0 0 0 0 0 0 0 0
0.0%0
0.0% 0.0% 0.0% 0.0% 0.0%0 0 0 0 0
0.0%0
0.0% 0.0% 0.0% 0.0% 0.0% 0.0%0 0 0 0 0 0
0.0% 0.0% 0.0%0 0 0
0.0% 0.0% 0.0% 0.0% 0.0% 0.0% 0.0% 0.0% 0.0% 0.0%0 0 0 0 0 0 0 0 0 0
0.0%0
0.0%0
1 In 2012 and 2013, FSIS did not sample products for Salmonella because in prior years the percent of pork carcass samples positive for Salmonella was consistently low2 ACSSuTAuCx = ACSSuT, amoxicillin-clavulanic acid, and ceftriaxone
Humans
Chi
cken
sTu
rkey
sC
attle
Sw
ine
Sw
ine
Retail Pork Chops
HACCP
Cecal (Market Hogs)
Cecal (Sows)
Humans
Chi
cken
s
Retail Chickens
HACCP
Cecal
Turk
eys
Retail Ground Turkey
HACCP
Cecal
Cat
tle
Retail Ground Beef
HACCP
Cecal (Beef)
Cecal (Dairy)
Humans
Chi
cken
s C
attle
Retail Ground Beef
HACCP
Cecal (Beef)
Cecal (Dairy)
Sw
ine
Retail Pork Chops
HACCP
Cecal (Market Hogs)
Cecal (Sows)
Retail Chickens
HACCP
Cecal
Turk
eys
Retail Ground Turkey
HACCP
Cecal
132
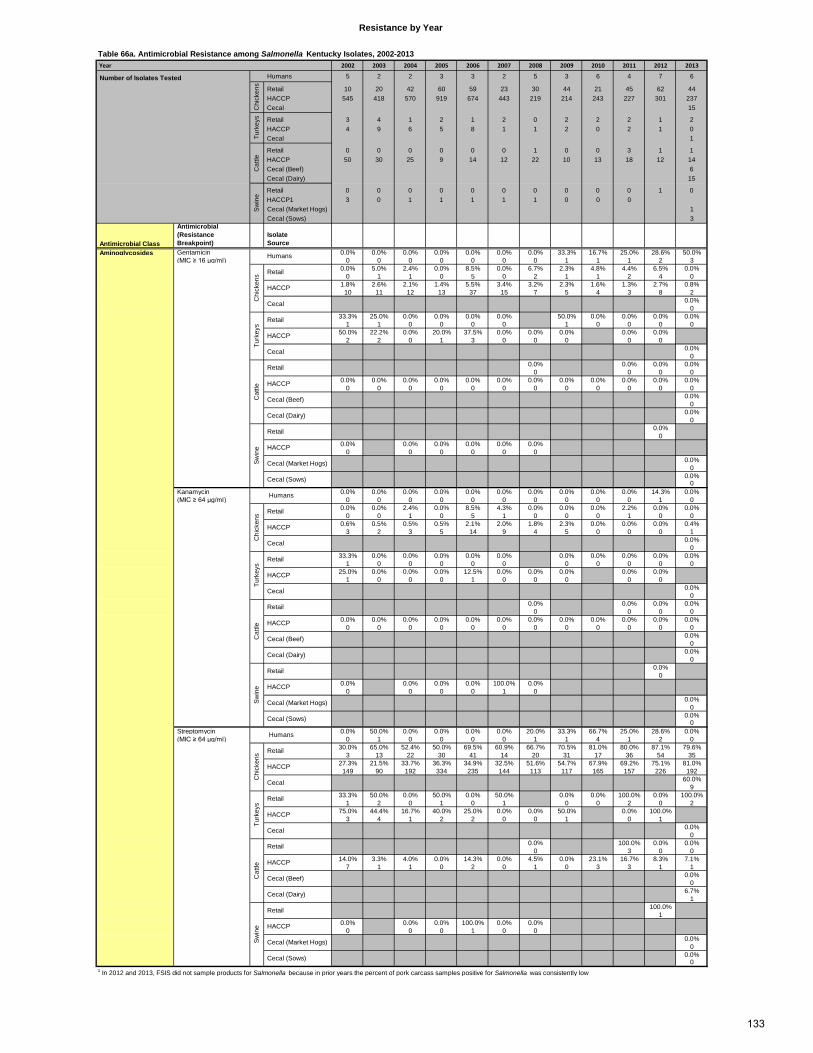
Table 66a. Antimicrobial Resistance among Salmonella Kentucky Isolates, 2002-2013 Year 2002 2003 2004 2005 2006 2007 2008 2009 2010 2011 2012 2013
Humans 5 2 2 3 3 2 5 3 6 4 7 6
Retail 10 20 42 60 59 23 30 44 21 45 62 44 HACCP 545 418 570 919 674 443 219 214 243 227 301 237 Cecal 15
Retail 3 4 1 2 1 2 0 2 2 2 1 2 HACCP 4 9 6 5 8 1 1 2 0 2 1 0 Cecal 1
Retail 0 0 0 0 0 0 1 0 0 3 1 1 HACCP 50 30 25 9 14 12 22 10 13 18 12 14 Cecal (Beef) 6 Cecal (Dairy) 15
Retail 0 0 0 0 0 0 0 0 0 0 1 0 HACCP1 3 0 1 1 1 1 1 0 0 0 Cecal (Market Hogs) 1 Cecal (Sows) 3
Antimicrobial Class
Antimicrobial (Resistance Breakpoint)
Isolate Source
Aminoglycosides Gentamicin 0.0% 0.0% 0.0% 0.0% 0.0% 0.0% 0.0% 33.3% 16.7% 25.0% 28.6% 50.0% (MIC ≥ 16 µg/ml) 0 0 0 0 0 0 0 1 1 1 2 3
0.0% 5.0% 2.4% 0.0% 8.5% 0.0% 6.7% 2.3% 4.8% 4.4% 6.5% 0.0%0 1 1 0 5 0 2 1 1 2 4 0
1.8% 2.6% 2.1% 1.4% 5.5% 3.4% 3.2% 2.3% 1.6% 1.3% 2.7% 0.8%10 11 12 13 37 15 7 5 4 3 8 2
0.0%0
33.3% 25.0% 0.0% 0.0% 0.0% 0.0% 50.0% 0.0% 0.0% 0.0% 0.0%1 1 0 0 0 0 1 0 0 0 0
50.0% 22.2% 0.0% 20.0% 37.5% 0.0% 0.0% 0.0% 0.0% 0.0%2 2 0 1 3 0 0 0 0 0
0.0%0
0.0% 0.0% 0.0% 0.0%0 0 0 0
0.0% 0.0% 0.0% 0.0% 0.0% 0.0% 0.0% 0.0% 0.0% 0.0% 0.0% 0.0%0 0 0 0 0 0 0 0 0 0 0 0
0.0%0
0.0%0
0.0%0
0.0% 0.0% 0.0% 0.0% 0.0% 0.0%0 0 0 0 0 0
0.0%0
0.0%0
Kanamycin 0.0% 0.0% 0.0% 0.0% 0.0% 0.0% 0.0% 0.0% 0.0% 0.0% 14.3% 0.0% (MIC ≥ 64 µg/ml) 0 0 0 0 0 0 0 0 0 0 1 0
0.0% 0.0% 2.4% 0.0% 8.5% 4.3% 0.0% 0.0% 0.0% 2.2% 0.0% 0.0%0 0 1 0 5 1 0 0 0 1 0 0
0.6% 0.5% 0.5% 0.5% 2.1% 2.0% 1.8% 2.3% 0.0% 0.0% 0.0% 0.4%3 2 3 5 14 9 4 5 0 0 0 1
0.0%0
33.3% 0.0% 0.0% 0.0% 0.0% 0.0% 0.0% 0.0% 0.0% 0.0% 0.0%1 0 0 0 0 0 0 0 0 0 0
25.0% 0.0% 0.0% 0.0% 12.5% 0.0% 0.0% 0.0% 0.0% 0.0%1 0 0 0 1 0 0 0 0 0
0.0%0
0.0% 0.0% 0.0% 0.0%0 0 0 0
0.0% 0.0% 0.0% 0.0% 0.0% 0.0% 0.0% 0.0% 0.0% 0.0% 0.0% 0.0%0 0 0 0 0 0 0 0 0 0 0 0
0.0%0
0.0%0
0.0%0
0.0% 0.0% 0.0% 0.0% 100.0% 0.0%0 0 0 0 1 0
0.0%0
0.0%0
Streptomycin 0.0% 50.0% 0.0% 0.0% 0.0% 0.0% 20.0% 33.3% 66.7% 25.0% 28.6% 0.0% (MIC ≥ 64 µg/ml) 0 1 0 0 0 0 1 1 4 1 2 0
30.0% 65.0% 52.4% 50.0% 69.5% 60.9% 66.7% 70.5% 81.0% 80.0% 87.1% 79.6%3 13 22 30 41 14 20 31 17 36 54 35
27.3% 21.5% 33.7% 36.3% 34.9% 32.5% 51.6% 54.7% 67.9% 69.2% 75.1% 81.0%149 90 192 334 235 144 113 117 165 157 226 192
60.0%9
33.3% 50.0% 0.0% 50.0% 0.0% 50.0% 0.0% 0.0% 100.0% 0.0% 100.0%1 2 0 1 0 1 0 0 2 0 2
75.0% 44.4% 16.7% 40.0% 25.0% 0.0% 0.0% 50.0% 0.0% 100.0%3 4 1 2 2 0 0 1 0 1
0.0%0
0.0% 100.0% 0.0% 0.0%0 3 0 0
14.0% 3.3% 4.0% 0.0% 14.3% 0.0% 4.5% 0.0% 23.1% 16.7% 8.3% 7.1%7 1 1 0 2 0 1 0 3 3 1 1
0.0%0
6.7%1
100.0%1
0.0% 0.0% 0.0% 100.0% 0.0% 0.0%0 0 0 1 0 0
0.0%0
0.0%0
1 In 2012 and 2013, FSIS did not sample products for Salmonella because in prior years the percent of pork carcass samples positive for Salmonella was consistently low
Resistance by Year
Swin
e
Retail
HACCP
Cecal (Market Hogs)
Cecal (Sows)
Cat
tle
Retail
Cecal (Dairy)
HACCP
Cecal (Beef)
Turk
eys
Retail
HACCP
Cecal
HACCP
Humans
Chi
cken
s Retail
Cecal
Cecal (Dairy)
Swin
e
Retail
HACCP
Cecal (Market Hogs)
Cecal (Sows)
Cat
tle HACCP
Cecal (Beef)
Turk
eys
Retail
HACCP
Cecal
Retail
HACCP
Cecal
Chi
cken
s Retail
Swin
e
Retail
HACCP
Cecal (Market Hogs)
Cecal (Sows)
Cat
tle
Retail
Cecal (Dairy)
Humans
HACCP
Cecal (Beef)
Turk
eys
Retail
HACCP
Cecal
Number of Isolates Tested
Chi
cken
sTu
rkey
sC
attle
HACCP
Swin
e Humans
Chi
cken
s Retail
Cecal
133
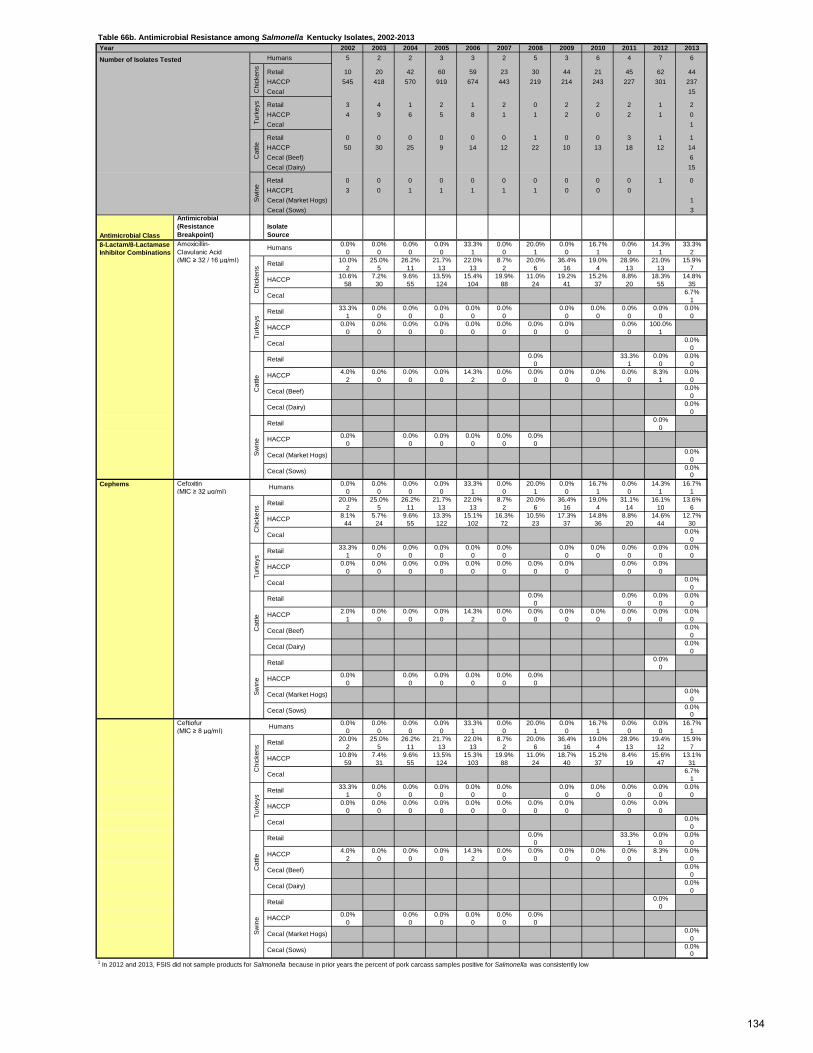
Table 66b. Antimicrobial Resistance among Salmonella Kentucky Isolates, 2002-2013 Year 2002 2003 2004 2005 2006 2007 2008 2009 2010 2011 2012 2013
Number of Isolates Tested Humans 5 2 2 3 3 2 5 3 6 4 7 6
Retail 10 20 42 60 59 23 30 44 21 45 62 44 HACCP 545 418 570 919 674 443 219 214 243 227 301 237 Cecal 15
Retail 3 4 1 2 1 2 0 2 2 2 1 2 HACCP 4 9 6 5 8 1 1 2 0 2 1 0 Cecal 1
Retail 0 0 0 0 0 0 1 0 0 3 1 1 HACCP 50 30 25 9 14 12 22 10 13 18 12 14 Cecal (Beef) 6 Cecal (Dairy) 15
Retail 0 0 0 0 0 0 0 0 0 0 1 0 HACCP1 3 0 1 1 1 1 1 0 0 0 Cecal (Market Hogs) 1 Cecal (Sows) 3
Antimicrobial Class
Antimicrobial (Resistance Breakpoint)
Isolate Source
β-Lactam/β-Lactamase Amoxicillin- 0.0% 0.0% 0.0% 0.0% 33.3% 0.0% 20.0% 0.0% 16.7% 0.0% 14.3% 33.3% Inhibitor Combinations Clavulanic Acid 0 0 0 0 1 0 1 0 1 0 1 2
(MIC ≥ 32 / 16 µg/ml) 10.0% 25.0% 26.2% 21.7% 22.0% 8.7% 20.0% 36.4% 19.0% 28.9% 21.0% 15.9%2 5 11 13 13 2 6 16 4 13 13 7
10.6% 7.2% 9.6% 13.5% 15.4% 19.9% 11.0% 19.2% 15.2% 8.8% 18.3% 14.8%58 30 55 124 104 88 24 41 37 20 55 35
6.7%1
33.3% 0.0% 0.0% 0.0% 0.0% 0.0% 0.0% 0.0% 0.0% 0.0% 0.0%1 0 0 0 0 0 0 0 0 0 0
0.0% 0.0% 0.0% 0.0% 0.0% 0.0% 0.0% 0.0% 0.0% 100.0%0 0 0 0 0 0 0 0 0 1
0.0%0
0.0% 33.3% 0.0% 0.0%0 1 0 0
4.0% 0.0% 0.0% 0.0% 14.3% 0.0% 0.0% 0.0% 0.0% 0.0% 8.3% 0.0%2 0 0 0 2 0 0 0 0 0 1 0
0.0%0
0.0%0
0.0%0
0.0% 0.0% 0.0% 0.0% 0.0% 0.0%0 0 0 0 0 0
0.0%0
0.0%0
Cefoxitin 0.0% 0.0% 0.0% 0.0% 33.3% 0.0% 20.0% 0.0% 16.7% 0.0% 14.3% 16.7% (MIC ≥ 32 µg/ml) 0 0 0 0 1 0 1 0 1 0 1 1
20.0% 25.0% 26.2% 21.7% 22.0% 8.7% 20.0% 36.4% 19.0% 31.1% 16.1% 13.6%2 5 11 13 13 2 6 16 4 14 10 6
8.1% 5.7% 9.6% 13.3% 15.1% 16.3% 10.5% 17.3% 14.8% 8.8% 14.6% 12.7%44 24 55 122 102 72 23 37 36 20 44 30
0.0%0
33.3% 0.0% 0.0% 0.0% 0.0% 0.0% 0.0% 0.0% 0.0% 0.0% 0.0%1 0 0 0 0 0 0 0 0 0 0
0.0% 0.0% 0.0% 0.0% 0.0% 0.0% 0.0% 0.0% 0.0% 0.0%0 0 0 0 0 0 0 0 0 0
0.0%0
0.0% 0.0% 0.0% 0.0%0 0 0 0
2.0% 0.0% 0.0% 0.0% 14.3% 0.0% 0.0% 0.0% 0.0% 0.0% 0.0% 0.0%1 0 0 0 2 0 0 0 0 0 0 0
0.0%0
0.0%0
0.0%0
0.0% 0.0% 0.0% 0.0% 0.0% 0.0%0 0 0 0 0 0
0.0%0
0.0%0
Ceftiofur 0.0% 0.0% 0.0% 0.0% 33.3% 0.0% 20.0% 0.0% 16.7% 0.0% 0.0% 16.7% (MIC ≥ 8 µg/ml) 0 0 0 0 1 0 1 0 1 0 0 1
20.0% 25.0% 26.2% 21.7% 22.0% 8.7% 20.0% 36.4% 19.0% 28.9% 19.4% 15.9%2 5 11 13 13 2 6 16 4 13 12 7
10.8% 7.4% 9.6% 13.5% 15.3% 19.9% 11.0% 18.7% 15.2% 8.4% 15.6% 13.1%59 31 55 124 103 88 24 40 37 19 47 31
6.7%1
33.3% 0.0% 0.0% 0.0% 0.0% 0.0% 0.0% 0.0% 0.0% 0.0% 0.0%1 0 0 0 0 0 0 0 0 0 0
0.0% 0.0% 0.0% 0.0% 0.0% 0.0% 0.0% 0.0% 0.0% 0.0%0 0 0 0 0 0 0 0 0 0
0.0%0
0.0% 33.3% 0.0% 0.0%0 1 0 0
4.0% 0.0% 0.0% 0.0% 14.3% 0.0% 0.0% 0.0% 0.0% 0.0% 8.3% 0.0%2 0 0 0 2 0 0 0 0 0 1 0
0.0%0
0.0%0
0.0%0
0.0% 0.0% 0.0% 0.0% 0.0% 0.0%0 0 0 0 0 0
0.0%0
0.0%0
1 In 2012 and 2013, FSIS did not sample products for Salmonella because in prior years the percent of pork carcass samples positive for Salmonella was consistently low
Cecal (Dairy)
Swin
e
Retail
HACCP
Cecal (Market Hogs)
Cecal (Sows)
Cat
tle HACCP
Cecal (Beef)
Retail
Turk
eys
Retail
HACCP
Cecal
HACCP
Cecal
Humans
Chi
cken
s Retail
Swin
e
Retail
HACCP
Cecal (Market Hogs)
Cecal (Sows)
HACCP
Cecal (Beef)
Cecal (Dairy)
Cat
tle
Retail
Turk
eys
Retail
HACCP
Cecal
Chi
cken
s
HACCP
Cecal
Retail
Cephems Humans
Swin
e
Retail
HACCP
Cecal (Market Hogs)
Cecal (Sows)
Cat
tle
Retail
HACCP
Cecal (Beef)
Cecal (Dairy)
Turk
eys
Retail
HACCP
Cecal
Chi
cken
s
HACCP
Cecal
RetailTu
rkey
sC
attle
Swin
e Humans
Chi
cken
s
134
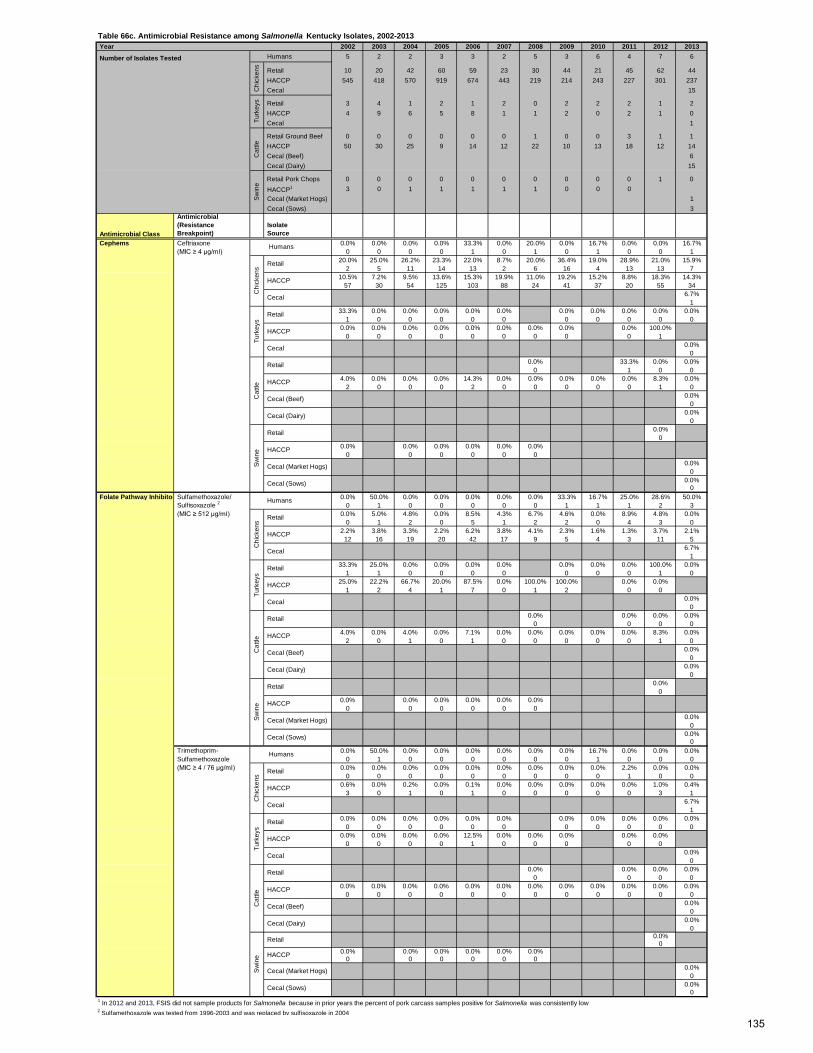
Table 66c. Antimicrobial Resistance among Salmonella Kentucky Isolates, 2002-2013 Year 2002 2003 2004 2005 2006 2007 2008 2009 2010 2011 2012 2013
Number of Isolates Tested Humans 5 2 2 3 3 2 5 3 6 4 7 6
Retail 10 20 42 60 59 23 30 44 21 45 62 44 HACCP 545 418 570 919 674 443 219 214 243 227 301 237 Cecal 15
Retail 3 4 1 2 1 2 0 2 2 2 1 2 HACCP 4 9 6 5 8 1 1 2 0 2 1 0 Cecal 1
Retail Ground Beef 0 0 0 0 0 0 1 0 0 3 1 1 HACCP 50 30 25 9 14 12 22 10 13 18 12 14 Cecal (Beef) 6 Cecal (Dairy) 15
Retail Pork Chops 0 0 0 0 0 0 0 0 0 0 1 0 HACCP1 3 0 1 1 1 1 1 0 0 0 Cecal (Market Hogs) 1 Cecal (Sows) 3
Antimicrobial Class
Antimicrobial (Resistance Breakpoint)
Isolate Source
Ceftriaxone 0.0% 0.0% 0.0% 0.0% 33.3% 0.0% 20.0% 0.0% 16.7% 0.0% 0.0% 16.7% (MIC ≥ 4 µg/ml) 0 0 0 0 1 0 1 0 1 0 0 1
20.0% 25.0% 26.2% 23.3% 22.0% 8.7% 20.0% 36.4% 19.0% 28.9% 21.0% 15.9%2 5 11 14 13 2 6 16 4 13 13 7
10.5% 7.2% 9.5% 13.6% 15.3% 19.9% 11.0% 19.2% 15.2% 8.8% 18.3% 14.3%57 30 54 125 103 88 24 41 37 20 55 34
6.7%1
33.3% 0.0% 0.0% 0.0% 0.0% 0.0% 0.0% 0.0% 0.0% 0.0% 0.0%1 0 0 0 0 0 0 0 0 0 0
0.0% 0.0% 0.0% 0.0% 0.0% 0.0% 0.0% 0.0% 0.0% 100.0%0 0 0 0 0 0 0 0 0 1
0.0%0
0.0% 33.3% 0.0% 0.0%0 1 0 0
4.0% 0.0% 0.0% 0.0% 14.3% 0.0% 0.0% 0.0% 0.0% 0.0% 8.3% 0.0%2 0 0 0 2 0 0 0 0 0 1 0
0.0%0
0.0%0
0.0%0
0.0% 0.0% 0.0% 0.0% 0.0% 0.0%0 0 0 0 0 0
0.0%0
0.0%0
Folate Pathway Inhibitor Sulfamethoxazole/ 0.0% 50.0% 0.0% 0.0% 0.0% 0.0% 0.0% 33.3% 16.7% 25.0% 28.6% 50.0% Sulfisoxazole 2 0 1 0 0 0 0 0 1 1 1 2 3 (MIC ≥ 512 µg/ml) 0.0% 5.0% 4.8% 0.0% 8.5% 4.3% 6.7% 4.6% 0.0% 8.9% 4.8% 0.0%
0 1 2 0 5 1 2 2 0 4 3 02.2% 3.8% 3.3% 2.2% 6.2% 3.8% 4.1% 2.3% 1.6% 1.3% 3.7% 2.1%
12 16 19 20 42 17 9 5 4 3 11 56.7%
133.3% 25.0% 0.0% 0.0% 0.0% 0.0% 0.0% 0.0% 0.0% 100.0% 0.0%
1 1 0 0 0 0 0 0 0 1 025.0% 22.2% 66.7% 20.0% 87.5% 0.0% 100.0% 100.0% 0.0% 0.0%
1 2 4 1 7 0 1 2 0 00.0%
00.0% 0.0% 0.0% 0.0%
0 0 0 04.0% 0.0% 4.0% 0.0% 7.1% 0.0% 0.0% 0.0% 0.0% 0.0% 8.3% 0.0%
2 0 1 0 1 0 0 0 0 0 1 00.0%
00.0%
00.0%
00.0% 0.0% 0.0% 0.0% 0.0% 0.0%
0 0 0 0 0 00.0%
00.0%
0 Trimethoprim- 0.0% 50.0% 0.0% 0.0% 0.0% 0.0% 0.0% 0.0% 16.7% 0.0% 0.0% 0.0% Sulfamethoxazole 0 1 0 0 0 0 0 0 1 0 0 0 (MIC ≥ 4 / 76 µg/ml) 0.0% 0.0% 0.0% 0.0% 0.0% 0.0% 0.0% 0.0% 0.0% 2.2% 0.0% 0.0%
0 0 0 0 0 0 0 0 0 1 0 00.6% 0.0% 0.2% 0.0% 0.1% 0.0% 0.0% 0.0% 0.0% 0.0% 1.0% 0.4%
3 0 1 0 1 0 0 0 0 0 3 16.7%
10.0% 0.0% 0.0% 0.0% 0.0% 0.0% 0.0% 0.0% 0.0% 0.0% 0.0%
0 0 0 0 0 0 0 0 0 0 00.0% 0.0% 0.0% 0.0% 12.5% 0.0% 0.0% 0.0% 0.0% 0.0%
0 0 0 0 1 0 0 0 0 00.0%
00.0% 0.0% 0.0% 0.0%
0 0 0 00.0% 0.0% 0.0% 0.0% 0.0% 0.0% 0.0% 0.0% 0.0% 0.0% 0.0% 0.0%
0 0 0 0 0 0 0 0 0 0 0 00.0%
00.0%
00.0%
00.0% 0.0% 0.0% 0.0% 0.0% 0.0%
0 0 0 0 0 00.0%
00.0%
01 In 2012 and 2013, FSIS did not sample products for Salmonella because in prior years the percent of pork carcass samples positive for Salmonella was consistently low2 Sulfamethoxazole was tested from 1996-2003 and was replaced by sulfisoxazole in 2004
Swin
e
Retail
HACCP
Cecal (Market Hogs)
Cecal (Sows)
Cat
tle
Retail
Cecal (Dairy)
HACCP
Cecal (Beef)
Turk
eys
Retail
HACCP
Cecal
HACCP
Humans
Chi
cken
s
Retail
Cecal
Cecal (Dairy)
Swin
e
Retail
HACCP
Cecal (Market Hogs)
Cecal (Sows)
Cat
tle
HACCP
Cecal (Beef)
Turk
eys
Retail
HACCP
Cecal
Retail
HACCP
Cecal
Chi
cken
s
Retail
Swin
e
Retail
HACCP
Cecal (Market Hogs)
Cecal (Sows)
Cat
tle
Retail
Cecal (Dairy)
Humans
HACCP
Cecal (Beef)
Turk
eys
Retail
HACCP
Cecal
HACCP
Cephems HumansC
hick
ens
Retail
Cecal
Cat
tleSw
ine
Chi
cken
sTu
rkey
s
135
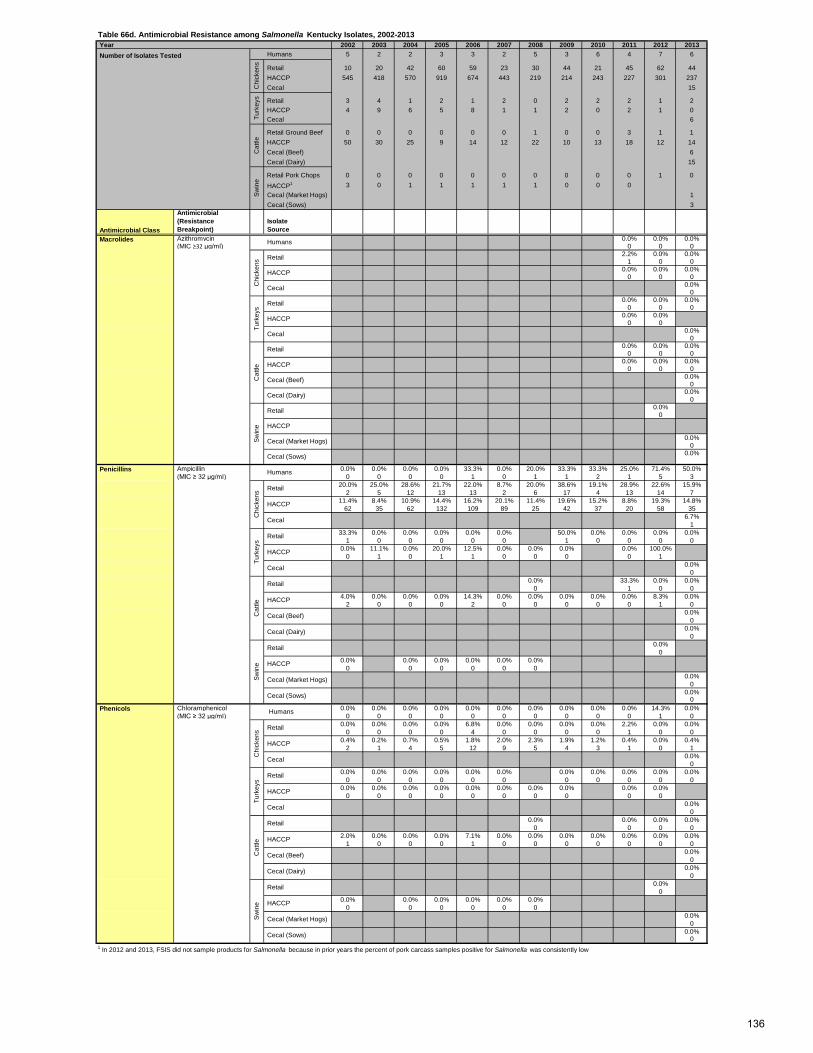
Table 66d. Antimicrobial Resistance among Salmonella Kentucky Isolates, 2002-2013 Year 2002 2003 2004 2005 2006 2007 2008 2009 2010 2011 2012 2013 Number of Isolates Tested Humans 5 2 2 3 3 2 5 3 6 4 7 6
Retail 10 20 42 60 59 23 30 44 21 45 62 44 HACCP 545 418 570 919 674 443 219 214 243 227 301 237 Cecal 15
Retail 3 4 1 2 1 2 0 2 2 2 1 2 HACCP 4 9 6 5 8 1 1 2 0 2 1 0 Cecal 6
Retail Ground Beef 0 0 0 0 0 0 1 0 0 3 1 1 HACCP 50 30 25 9 14 12 22 10 13 18 12 14 Cecal (Beef) 6 Cecal (Dairy) 15
Retail Pork Chops 0 0 0 0 0 0 0 0 0 0 1 0 HACCP1 3 0 1 1 1 1 1 0 0 0 Cecal (Market Hogs) 1 Cecal (Sows) 3
Antimicrobial Class
Antimicrobial (Resistance Breakpoint)
Isolate Source
Azithromycin 0.0% 0.0% 0.0% (MIC ≥32 µg/ml) 0 0 0
2.2% 0.0% 0.0%1 0 0
0.0% 0.0% 0.0%0 0 0
0.0%0
0.0% 0.0% 0.0%0 0 0
0.0% 0.0%0 0
0.0%0
0.0% 0.0% 0.0%0 0 0
0.0% 0.0% 0.0%0 0 0
0.0%0
0.0%0
0.0%0
0.0%0
0.0%
Ampicillin 0.0% 0.0% 0.0% 0.0% 33.3% 0.0% 20.0% 33.3% 33.3% 25.0% 71.4% 50.0% (MIC ≥ 32 µg/ml) 0 0 0 0 1 0 1 1 2 1 5 3
20.0% 25.0% 28.6% 21.7% 22.0% 8.7% 20.0% 38.6% 19.1% 28.9% 22.6% 15.9%2 5 12 13 13 2 6 17 4 13 14 7
11.4% 8.4% 10.9% 14.4% 16.2% 20.1% 11.4% 19.6% 15.2% 8.8% 19.3% 14.8%62 35 62 132 109 89 25 42 37 20 58 35
6.7%1
33.3% 0.0% 0.0% 0.0% 0.0% 0.0% 50.0% 0.0% 0.0% 0.0% 0.0%1 0 0 0 0 0 1 0 0 0 0
0.0% 11.1% 0.0% 20.0% 12.5% 0.0% 0.0% 0.0% 0.0% 100.0%0 1 0 1 1 0 0 0 0 1
0.0%0
0.0% 33.3% 0.0% 0.0%0 1 0 0
4.0% 0.0% 0.0% 0.0% 14.3% 0.0% 0.0% 0.0% 0.0% 0.0% 8.3% 0.0%2 0 0 0 2 0 0 0 0 0 1 0
0.0%0
0.0%0
0.0%0
0.0% 0.0% 0.0% 0.0% 0.0% 0.0%0 0 0 0 0 0
0.0%0
0.0%0
Chloramphenicol 0.0% 0.0% 0.0% 0.0% 0.0% 0.0% 0.0% 0.0% 0.0% 0.0% 14.3% 0.0% (MIC ≥ 32 µg/ml) 0 0 0 0 0 0 0 0 0 0 1 0
0.0% 0.0% 0.0% 0.0% 6.8% 0.0% 0.0% 0.0% 0.0% 2.2% 0.0% 0.0%0 0 0 0 4 0 0 0 0 1 0 0
0.4% 0.2% 0.7% 0.5% 1.8% 2.0% 2.3% 1.9% 1.2% 0.4% 0.0% 0.4%2 1 4 5 12 9 5 4 3 1 0 1
0.0%0
0.0% 0.0% 0.0% 0.0% 0.0% 0.0% 0.0% 0.0% 0.0% 0.0% 0.0%0 0 0 0 0 0 0 0 0 0 0
0.0% 0.0% 0.0% 0.0% 0.0% 0.0% 0.0% 0.0% 0.0% 0.0%0 0 0 0 0 0 0 0 0 0
0.0%0
0.0% 0.0% 0.0% 0.0%0 0 0 0
2.0% 0.0% 0.0% 0.0% 7.1% 0.0% 0.0% 0.0% 0.0% 0.0% 0.0% 0.0%1 0 0 0 1 0 0 0 0 0 0 0
0.0%0
0.0%0
0.0%0
0.0% 0.0% 0.0% 0.0% 0.0% 0.0%0 0 0 0 0 0
0.0%0
0.0%0
1 In 2012 and 2013, FSIS did not sample products for Salmonella because in prior years the percent of pork carcass samples positive for Salmonella was consistently low
Swin
e
Retail
HACCP
Cecal (Market Hogs)
Cecal (Sows)
Cat
tle
Retail
Cecal (Dairy)
HACCP
Cecal (Beef)
Turk
eys
Retail
HACCP
Cecal
HACCP
Phenicols Humans
Chi
cken
s Retail
Cecal
Cat
tle
Retail
Cecal (Dairy)
Swin
e
Retail
HACCP
Cecal (Market Hogs)
Cecal (Sows)
HACCP
Cecal (Beef)
Turk
eys
Retail
HACCP
Cecal
HACCP
Penicillins Humans
Chi
cken
s Retail
Cecal
Chi
cken
sSw
ine
Retail
HACCP
Cecal (Market Hogs)
Cecal (Sows)
Cat
tle
Retail
HACCP
Turk
eys
Retail
HACCP
Cecal
Cecal (Dairy)
HACCP
Cecal
Retail
Cecal (Beef)
Turk
eys
Cat
tleSw
ine
Macrolides Humans
Chi
cken
s
136
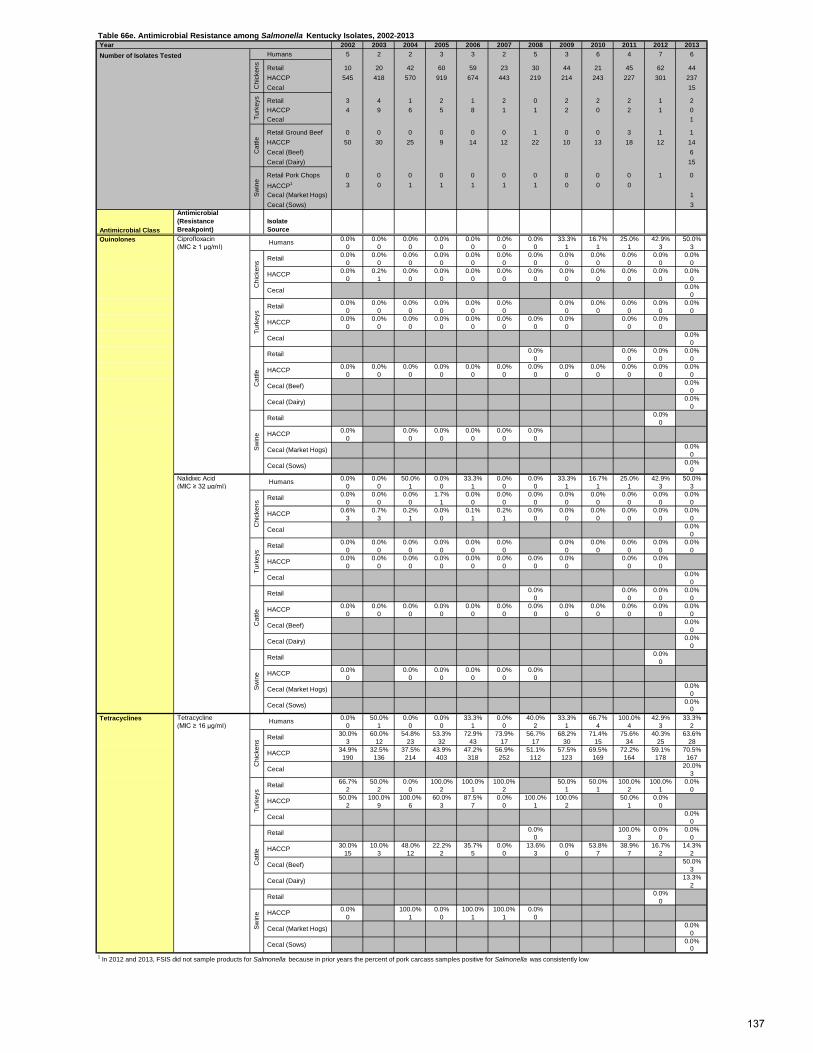
Year 2002 2003 2004 2005 2006 2007 2008 2009 2010 2011 2012 2013 Number of Isolates Tested Humans 5 2 2 3 3 2 5 3 6 4 7 6
Retail 10 20 42 60 59 23 30 44 21 45 62 44 HACCP 545 418 570 919 674 443 219 214 243 227 301 237 Cecal 15
Retail 3 4 1 2 1 2 0 2 2 2 1 2 HACCP 4 9 6 5 8 1 1 2 0 2 1 0 Cecal 1
Retail Ground Beef 0 0 0 0 0 0 1 0 0 3 1 1 HACCP 50 30 25 9 14 12 22 10 13 18 12 14 Cecal (Beef) 6 Cecal (Dairy) 15
Retail Pork Chops 0 0 0 0 0 0 0 0 0 0 1 0 HACCP1 3 0 1 1 1 1 1 0 0 0 Cecal (Market Hogs) 1 Cecal (Sows) 3
Antimicrobial Class
Antimicrobial (Resistance Breakpoint)
Isolate Source
Quinolones Ciprofloxacin 0.0% 0.0% 0.0% 0.0% 0.0% 0.0% 0.0% 33.3% 16.7% 25.0% 42.9% 50.0% (MIC ≥ 1 µg/ml) 0 0 0 0 0 0 0 1 1 1 3 3
0.0% 0.0% 0.0% 0.0% 0.0% 0.0% 0.0% 0.0% 0.0% 0.0% 0.0% 0.0%0 0 0 0 0 0 0 0 0 0 0 0
0.0% 0.2% 0.0% 0.0% 0.0% 0.0% 0.0% 0.0% 0.0% 0.0% 0.0% 0.0%0 1 0 0 0 0 0 0 0 0 0 0
0.0%0
0.0% 0.0% 0.0% 0.0% 0.0% 0.0% 0.0% 0.0% 0.0% 0.0% 0.0%0 0 0 0 0 0 0 0 0 0 0
0.0% 0.0% 0.0% 0.0% 0.0% 0.0% 0.0% 0.0% 0.0% 0.0%0 0 0 0 0 0 0 0 0 0
0.0%0
0.0% 0.0% 0.0% 0.0%0 0 0 0
0.0% 0.0% 0.0% 0.0% 0.0% 0.0% 0.0% 0.0% 0.0% 0.0% 0.0% 0.0%0 0 0 0 0 0 0 0 0 0 0 0
0.0%0
0.0%0
0.0%0
0.0% 0.0% 0.0% 0.0% 0.0% 0.0%0 0 0 0 0 0
0.0%0
0.0%0
Nalidixic Acid 0.0% 0.0% 50.0% 0.0% 33.3% 0.0% 0.0% 33.3% 16.7% 25.0% 42.9% 50.0% (MIC ≥ 32 µg/ml) 0 0 1 0 1 0 0 1 1 1 3 3
0.0% 0.0% 0.0% 1.7% 0.0% 0.0% 0.0% 0.0% 0.0% 0.0% 0.0% 0.0%0 0 0 1 0 0 0 0 0 0 0 0
0.6% 0.7% 0.2% 0.0% 0.1% 0.2% 0.0% 0.0% 0.0% 0.0% 0.0% 0.0%3 3 1 0 1 1 0 0 0 0 0 0
0.0%0
0.0% 0.0% 0.0% 0.0% 0.0% 0.0% 0.0% 0.0% 0.0% 0.0% 0.0%0 0 0 0 0 0 0 0 0 0 0
0.0% 0.0% 0.0% 0.0% 0.0% 0.0% 0.0% 0.0% 0.0% 0.0%0 0 0 0 0 0 0 0 0 0
0.0%0
0.0% 0.0% 0.0% 0.0%0 0 0 0
0.0% 0.0% 0.0% 0.0% 0.0% 0.0% 0.0% 0.0% 0.0% 0.0% 0.0% 0.0%0 0 0 0 0 0 0 0 0 0 0 0
0.0%0
0.0%0
0.0%0
0.0% 0.0% 0.0% 0.0% 0.0% 0.0%0 0 0 0 0 0
0.0%0
0.0%0
Tetracycline 0.0% 50.0% 0.0% 0.0% 33.3% 0.0% 40.0% 33.3% 66.7% 100.0% 42.9% 33.3% (MIC ≥ 16 µg/ml) 0 1 0 0 1 0 2 1 4 4 3 2
30.0% 60.0% 54.8% 53.3% 72.9% 73.9% 56.7% 68.2% 71.4% 75.6% 40.3% 63.6%3 12 23 32 43 17 17 30 15 34 25 28
34.9% 32.5% 37.5% 43.9% 47.2% 56.9% 51.1% 57.5% 69.5% 72.2% 59.1% 70.5%190 136 214 403 318 252 112 123 169 164 178 167
20.0%3
66.7% 50.0% 0.0% 100.0% 100.0% 100.0% 50.0% 50.0% 100.0% 100.0% 0.0%2 2 0 2 1 2 1 1 2 1 0
50.0% 100.0% 100.0% 60.0% 87.5% 0.0% 100.0% 100.0% 50.0% 0.0%2 9 6 3 7 0 1 2 1 0
0.0%0
0.0% 100.0% 0.0% 0.0%0 3 0 0
30.0% 10.0% 48.0% 22.2% 35.7% 0.0% 13.6% 0.0% 53.8% 38.9% 16.7% 14.3%15 3 12 2 5 0 3 0 7 7 2 2
50.0%3
13.3%2
0.0%0
0.0% 100.0% 0.0% 100.0% 100.0% 0.0%0 1 0 1 1 0
0.0%0
0.0%0
1 In 2012 and 2013, FSIS did not sample products for Salmonella because in prior years the percent of pork carcass samples positive for Salmonella was consistently low
Cecal (Market Hogs)
Cecal (Sows)
Cecal (Beef)
Cecal (Dairy)
Swin
e
Retail
HACCP
Cat
tle
Retail
HACCP
Cecal
Turk
eys
Retail
HACCP
HACCP
Tetracyclines Humans
Chi
cken
s Retail
Cecal
Cecal (Dairy)
Swin
e
Retail
HACCP
Cecal (Market Hogs)
Cecal (Sows)
Cat
tle HACCP
Cecal (Beef)
Retail
Turk
eys
Retail
HACCP
Cecal
Humans
Chi
cken
s Retail
Swin
e
Retail
HACCP
Cecal (Market Hogs)
Cecal (Sows)
HACCP
Cecal
Cat
tle
Retail
Turk
eys
Retail
HACCP
Cecal
Chi
cken
s
HACCP
Cecal (Beef)
Cecal (Dairy)
HACCP
Cecal
RetailC
hick
ens
Turk
eys
Cat
tleSw
ine
Humans
Table 66e. Antimicrobial Resistance among Salmonella Kentucky Isolates, 2002-2013
137
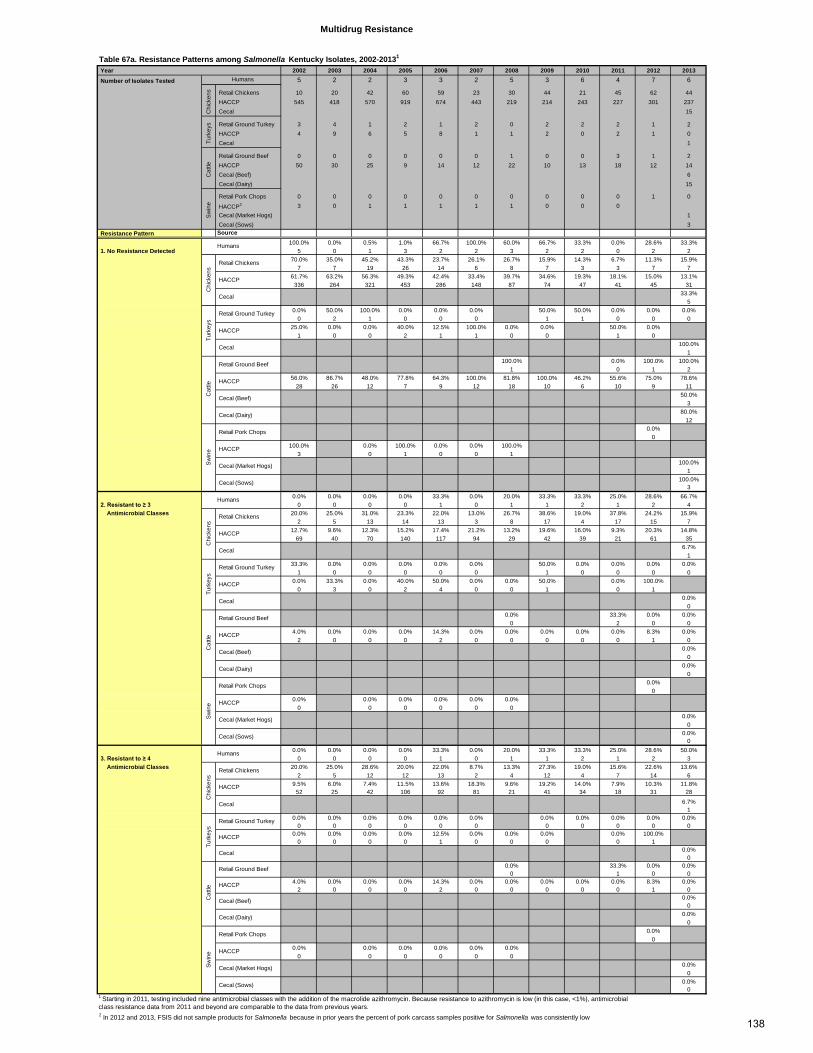
Table 67a. Resistance Patterns among Salmonella Kentucky Isolates, 2002-20131
Year 2002 2003 2004 2005 2006 2007 2008 2009 2010 2011 2012 2013
Number of Isolates Tested 5 2 2 3 3 2 5 3 6 4 7 6
Retail Chickens 10 20 42 60 59 23 30 44 21 45 62 44 HACCP 545 418 570 919 674 443 219 214 243 227 301 237 Cecal 15
Retail Ground Turkey 3 4 1 2 1 2 0 2 2 2 1 2 HACCP 4 9 6 5 8 1 1 2 0 2 1 0 Cecal 1
Retail Ground Beef 0 0 0 0 0 0 1 0 0 3 1 2 HACCP 50 30 25 9 14 12 22 10 13 18 12 14 Cecal (Beef) 6 Cecal (Dairy) 15
Retail Pork Chops 0 0 0 0 0 0 0 0 0 0 1 0
HACCP2 3 0 1 1 1 1 1 0 0 0 Cecal (Market Hogs) 1 Cecal (Sows) 3
Resistance Pattern Source100.0% 0.0% 0.5% 1.0% 66.7% 100.0% 60.0% 66.7% 33.3% 0.0% 28.6% 33.3%
1. No Resistance Detected 5 0 1 3 2 2 3 2 2 0 2 270.0% 35.0% 45.2% 43.3% 23.7% 26.1% 26.7% 15.9% 14.3% 6.7% 11.3% 15.9%
7 7 19 26 14 6 8 7 3 3 7 761.7% 63.2% 56.3% 49.3% 42.4% 33.4% 39.7% 34.6% 19.3% 18.1% 15.0% 13.1%
336 264 321 453 286 148 87 74 47 41 45 3133.3%
50.0% 50.0% 100.0% 0.0% 0.0% 0.0% 50.0% 50.0% 0.0% 0.0% 0.0%
0 2 1 0 0 0 1 1 0 0 025.0% 0.0% 0.0% 40.0% 12.5% 100.0% 0.0% 0.0% 50.0% 0.0%
1 0 0 2 1 1 0 0 1 0100.0%
1100.0% 0.0% 100.0% 100.0%
1 0 1 256.0% 86.7% 48.0% 77.8% 64.3% 100.0% 81.8% 100.0% 46.2% 55.6% 75.0% 78.6%
28 26 12 7 9 12 18 10 6 10 9 1150.0%
380.0%
120.0%
0100.0% 0.0% 100.0% 0.0% 0.0% 100.0%
3 0 1 0 0 1100.0%
1100.0%
30.0% 0.0% 0.0% 0.0% 33.3% 0.0% 20.0% 33.3% 33.3% 25.0% 28.6% 66.7%
2. Resistant to ≥ 3 0 0 0 0 1 0 1 1 2 1 2 4 Antimicrobial Classes 20.0% 25.0% 31.0% 23.3% 22.0% 13.0% 26.7% 38.6% 19.0% 37.8% 24.2% 15.9%
2 5 13 14 13 3 8 17 4 17 15 712.7% 9.6% 12.3% 15.2% 17.4% 21.2% 13.2% 19.6% 16.0% 9.3% 20.3% 14.8%
69 40 70 140 117 94 29 42 39 21 61 356.7%
133.3% 0.0% 0.0% 0.0% 0.0% 0.0% 50.0% 0.0% 0.0% 0.0% 0.0%
1 0 0 0 0 0 1 0 0 0 00.0% 33.3% 0.0% 40.0% 50.0% 0.0% 0.0% 50.0% 0.0% 100.0%
0 3 0 2 4 0 0 1 0 10.0%
00.0% 33.3% 0.0% 0.0%
0 2 0 04.0% 0.0% 0.0% 0.0% 14.3% 0.0% 0.0% 0.0% 0.0% 0.0% 8.3% 0.0%
2 0 0 0 2 0 0 0 0 0 1 00.0%
00.0%
00.0%
00.0% 0.0% 0.0% 0.0% 0.0% 0.0%
0 0 0 0 0 00.0%
00.0%
00.0% 0.0% 0.0% 0.0% 33.3% 0.0% 20.0% 33.3% 33.3% 25.0% 28.6% 50.0%
3. Resistant to ≥ 4 0 0 0 0 1 0 1 1 2 1 2 3 Antimicrobial Classes 20.0% 25.0% 28.6% 20.0% 22.0% 8.7% 13.3% 27.3% 19.0% 15.6% 22.6% 13.6%
2 5 12 12 13 2 4 12 4 7 14 69.5% 6.0% 7.4% 11.5% 13.6% 18.3% 9.6% 19.2% 14.0% 7.9% 10.3% 11.8%
52 25 42 106 92 81 21 41 34 18 31 28
6.7%1
0.0% 0.0% 0.0% 0.0% 0.0% 0.0% 0.0% 0.0% 0.0% 0.0% 0.0%0 0 0 0 0 0 0 0 0 0 0
0.0% 0.0% 0.0% 0.0% 12.5% 0.0% 0.0% 0.0% 0.0% 100.0%0 0 0 0 1 0 0 0 0 1
0.0%0
0.0% 33.3% 0.0% 0.0%0 1 0 0
4.0% 0.0% 0.0% 0.0% 14.3% 0.0% 0.0% 0.0% 0.0% 0.0% 8.3% 0.0%2 0 0 0 2 0 0 0 0 0 1 0
0.0%0
0.0%0
0.0%0
0.0% 0.0% 0.0% 0.0% 0.0% 0.0%0 0 0 0 0 0
0.0%0
0.0%0
2 In 2012 and 2013, FSIS did not sample products for Salmonella because in prior years the percent of pork carcass samples positive for Salmonella was consistently low
Sw
ine
Humans
Chi
cken
s
Retail Chickens
HACCP
Cecal
Multidrug Resistance
Humans
Chi
cken
sTu
rkey
sC
attle
Turk
eys
Retail Ground Turkey
HACCP
Cecal
Cat
tle
Retail Ground Beef
HACCP
Cecal (Beef)
Cecal (Dairy)
Chi
cken
s
Retail Chickens
HACCP
Cecal
Turk
eys
Retail Ground Turkey
HACCP
Cecal
Sw
ine
Retail Pork Chops
HACCP
Cecal (Market Hogs)
Cecal (Sows)
Humans
Cat
tle
Retail Ground Beef
HACCP
Cecal (Beef)
Cecal (Dairy)
Sw
ine
Retail Pork Chops
HACCP
Cecal (Market Hogs)
Cecal (Sows)
Humans
Chi
cken
s
Retail Chickens
HACCP
Cecal
Turk
eys
Retail Ground Turkey
HACCP
Cecal
Cat
tle
Retail Ground Beef
HACCP
Cecal (Beef)
Cecal (Dairy)
Sw
ine
Retail Pork Chops
HACCP
Cecal (Market Hogs)
Cecal (Sows)
1 Starting in 2011, testing included nine antimicrobial classes with the addition of the macrolide azithromycin. Because resistance to azithromycin is low (in this case, <1%), antimicrobial class resistance data from 2011 and beyond are comparable to the data from previous years.
138
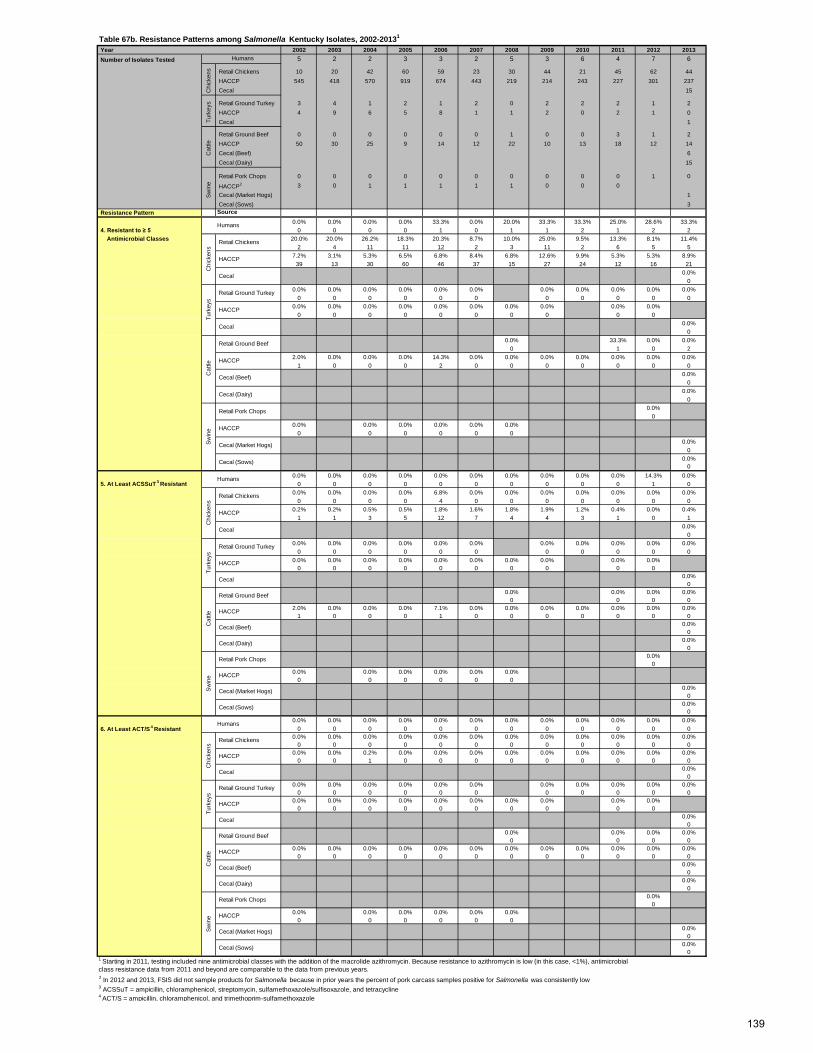
Table 67b. Resistance Patterns among Salmonella Kentucky Isolates, 2002-20131
Year 2002 2003 2004 2005 2006 2007 2008 2009 2010 2011 2012 2013 Number of Isolates Tested 5 2 2 3 3 2 5 3 6 4 7 6
Retail Chickens 10 20 42 60 59 23 30 44 21 45 62 44 HACCP 545 418 570 919 674 443 219 214 243 227 301 237 Cecal 15
Retail Ground Turkey 3 4 1 2 1 2 0 2 2 2 1 2 HACCP 4 9 6 5 8 1 1 2 0 2 1 0 Cecal 1
Retail Ground Beef 0 0 0 0 0 0 1 0 0 3 1 2 HACCP 50 30 25 9 14 12 22 10 13 18 12 14 Cecal (Beef) 6 Cecal (Dairy) 15
Retail Pork Chops 0 0 0 0 0 0 0 0 0 0 1 0
HACCP2 3 0 1 1 1 1 1 0 0 0 Cecal (Market Hogs) 1 Cecal (Sows) 3
Resistance Pattern Source0.0% 0.0% 0.0% 0.0% 33.3% 0.0% 20.0% 33.3% 33.3% 25.0% 28.6% 33.3%
4. Resistant to ≥ 5 0 0 0 0 1 0 1 1 2 1 2 2 Antimicrobial Classes 20.0% 20.0% 26.2% 18.3% 20.3% 8.7% 10.0% 25.0% 9.5% 13.3% 8.1% 11.4%
2 4 11 11 12 2 3 11 2 6 5 57.2% 3.1% 5.3% 6.5% 6.8% 8.4% 6.8% 12.6% 9.9% 5.3% 5.3% 8.9%
39 13 30 60 46 37 15 27 24 12 16 210.0%
00.0% 0.0% 0.0% 0.0% 0.0% 0.0% 0.0% 0.0% 0.0% 0.0% 0.0%
0 0 0 0 0 0 0 0 0 0 00.0% 0.0% 0.0% 0.0% 0.0% 0.0% 0.0% 0.0% 0.0% 0.0%
0 0 0 0 0 0 0 0 0 00.0%
00.0% 33.3% 0.0% 0.0%
0 1 0 22.0% 0.0% 0.0% 0.0% 14.3% 0.0% 0.0% 0.0% 0.0% 0.0% 0.0% 0.0%
1 0 0 0 2 0 0 0 0 0 0 00.0%
00.0%
00.0%
00.0% 0.0% 0.0% 0.0% 0.0% 0.0%
0 0 0 0 0 00.0%
00.0%
00.0% 0.0% 0.0% 0.0% 0.0% 0.0% 0.0% 0.0% 0.0% 0.0% 14.3% 0.0%
5. At Least ACSSuT 3 Resistant 0 0 0 0 0 0 0 0 0 0 1 0
0.0% 0.0% 0.0% 0.0% 6.8% 0.0% 0.0% 0.0% 0.0% 0.0% 0.0% 0.0%0 0 0 0 4 0 0 0 0 0 0 0
0.2% 0.2% 0.5% 0.5% 1.8% 1.6% 1.8% 1.9% 1.2% 0.4% 0.0% 0.4%1 1 3 5 12 7 4 4 3 1 0 1
0.0%0
0.0% 0.0% 0.0% 0.0% 0.0% 0.0% 0.0% 0.0% 0.0% 0.0% 0.0%0 0 0 0 0 0 0 0 0 0 0
0.0% 0.0% 0.0% 0.0% 0.0% 0.0% 0.0% 0.0% 0.0% 0.0%0 0 0 0 0 0 0 0 0 0
0.0%0
0.0% 0.0% 0.0% 0.0%0 0 0 0
2.0% 0.0% 0.0% 0.0% 7.1% 0.0% 0.0% 0.0% 0.0% 0.0% 0.0% 0.0%1 0 0 0 1 0 0 0 0 0 0 0
0.0%0
0.0%0
0.0%0
0.0% 0.0% 0.0% 0.0% 0.0% 0.0%0 0 0 0 0 0
0.0%0
0.0%0
0.0% 0.0% 0.0% 0.0% 0.0% 0.0% 0.0% 0.0% 0.0% 0.0% 0.0% 0.0% 6. At Least ACT/S
4 Resistant 0 0 0 0 0 0 0 0 0 0 0 00.0% 0.0% 0.0% 0.0% 0.0% 0.0% 0.0% 0.0% 0.0% 0.0% 0.0% 0.0%
0 0 0 0 0 0 0 0 0 0 0 00.0% 0.0% 0.2% 0.0% 0.0% 0.0% 0.0% 0.0% 0.0% 0.0% 0.0% 0.0%
0 0 1 0 0 0 0 0 0 0 0 00.0%
00.0% 0.0% 0.0% 0.0% 0.0% 0.0% 0.0% 0.0% 0.0% 0.0% 0.0%
0 0 0 0 0 0 0 0 0 0 00.0% 0.0% 0.0% 0.0% 0.0% 0.0% 0.0% 0.0% 0.0% 0.0%
0 0 0 0 0 0 0 0 0 00.0%
00.0% 0.0% 0.0% 0.0%
0 0 0 00.0% 0.0% 0.0% 0.0% 0.0% 0.0% 0.0% 0.0% 0.0% 0.0% 0.0% 0.0%
0 0 0 0 0 0 0 0 0 0 0 00.0%
00.0%
00.0%
00.0% 0.0% 0.0% 0.0% 0.0% 0.0%
0 0 0 0 0 00.0%
00.0%
0
2 In 2012 and 2013, FSIS did not sample products for Salmonella because in prior years the percent of pork carcass samples positive for Salmonella was consistently low3 ACSSuT = ampicillin, chloramphenicol, streptomycin, sulfamethoxazole/sulfisoxazole, and tetracycline4 ACT/S = ampicillin, chloramphenicol, and trimethoprim-sulfamethoxazole
Humans
Chi
cken
s
Retail Chickens
HACCP
Cecal
Retail Chickens
HACCP
Cecal
Humans
Cat
tle
Retail Ground Beef
HACCP
Cecal (Beef)
Cecal (Dairy)
Sw
ine
Retail Pork Chops
HACCP
Cecal (Market Hogs)
Cecal (Sows)
Humans
Chi
cken
s
Retail Chickens
HACCP
Cecal
Chi
cken
sTu
rkey
sTu
rkey
s
Retail Ground Turkey
HACCP
Cecal
Sw
ine
Retail Pork Chops
HACCP
Cecal (Market Hogs)
Cecal (Sows)
Cat
tle
Retail Ground Beef
HACCP
Cecal (Beef)
Cecal (Dairy)
Humans
Chi
cken
sTu
rkey
s
Retail Ground Turkey
HACCP
Cecal
Cat
tleS
win
e
1 Starting in 2011, testing included nine antimicrobial classes with the addition of the macrolide azithromycin. Because resistance to azithromycin is low (in this case, <1%), antimicrobial class resistance data from 2011 and beyond are comparable to the data from previous years.
Turk
eys
Retail Ground Turkey
HACCP
Cecal
Cat
tle
Retail Ground Beef
HACCP
Cecal (Beef)
Cecal (Dairy)
Sw
ine
Retail Pork Chops
HACCP
Cecal (Market Hogs)
Cecal (Sows)
139

Table 67c. Resistance Patterns among Salmonella Kentucky Isolates, 2002-2013 Year 2002 2003 2004 2005 2006 2007 2008 2009 2010 2011 2012 2013 Number of Isolates Tested 5 2 2 3 3 2 5 3 6 4 7 6
Retail Chickens 10 20 42 60 59 23 30 44 21 45 62 44 HACCP 545 418 570 919 674 443 219 214 243 227 301 237 Cecal 15
Retail Ground Turkey 3 4 1 2 1 2 0 2 2 2 1 2 HACCP 4 9 6 5 8 1 1 2 0 2 1 0 Cecal 1
Retail Ground Beef 0 0 0 0 0 0 1 0 0 3 1 2 HACCP 50 30 25 9 14 12 22 10 13 18 12 14 Cecal (Beef) 6 Cecal (Dairy) 15
Retail Pork Chops 0 0 0 0 0 0 0 0 0 0 1 0
HACCP1 3 0 1 1 1 1 1 0 0 0 Cecal (Market Hogs) 1 Cecal (Sows) 3
Resistance Pattern Source0.0% 0.0% 0.0% 0.0% 0.0% 0.0% 0.0% 0.0% 0.0% 0.0% 0.0% 0.0%
7. At Least ACSSuTAuCx 1 0 0 0 0 0 0 0 0 0 0 0 0 Resistant 0.0% 0.0% 0.0% 0.0% 6.8% 0.0% 0.0% 0.0% 0.0% 0.0% 0.0% 0.0%
0 0 0 0 4 0 0 0 0 0 0 00.0% 0.0% 0.0% 0.0% 0.0% 0.0% 0.0% 0.0% 0.0% 0.0% 0.0% 0.4%
0 0 0 0 0 0 0 0 0 0 0 10.0%
00.0% 0.0% 0.0% 0.0% 0.0% 0.0% 0.0% 0.0% 0.0% 0.0% 0.0%
0 0 0 0 0 0 0 0 0 0 00.0% 0.0% 0.0% 0.0% 0.0% 0.0% 0.0% 0.0% 0.0% 0.0%
0 0 0 0 0 0 0 0 0 00.0%
00.0% 0.0% 0.0% 0.0%
0 0 0 02.0% 0.0% 0.0% 0.0% 7.1% 0.0% 0.0% 0.0% 0.0% 0.0% 0.0% 0.0%
1 0 0 0 1 0 0 0 0 0 0 00.0%
00.0%
00.0%
00.0% 0.0% 0.0% 0.0% 0.0% 0.0%
0 0 0 0 0 00.0%
00.0%
00.0% 0.0% 0.0% 0.0% 33.3% 0.0% 0.0% 0.0% 0.0% 0.0% 0.0% 0.0%
8. At Least Ceftriaxone and 0 0 0 0 1 0 0 0 0 0 0 0 Nalidixic Acid Resistant 0.0% 0.0% 0.0% 1.7% 0.0% 0.0% 0.0% 0.0% 0.0% 0.0% 0.0% 0.0%
0 0 0 1 0 0 0 0 0 0 0 00.2% 0.2% 0.0% 0.4% 1.8% 1.6% 1.8% 1.9% 1.2% 0.4% 0.0% 0.0%
1 1 0 4 12 7 4 4 3 1 0 00.0%
00.0% 0.0% 0.0% 0.0% 0.0% 0.0% 0.0% 0.0% 0.0% 0.0% 0.0%
0 0 0 0 0 0 0 0 0 0 00.0% 0.0% 0.0% 0.0% 0.0% 0.0% 0.0% 0.0% 0.0% 0.0%
0 0 0 0 0 0 0 0 0 00.0%
00.0% 0.0% 0.0% 0.0%
0 0 0 00.0% 0.0% 0.0% 0.0% 0.0% 0.0% 0.0% 0.0% 0.0% 0.0% 0.0% 0.0%
0 0 0 0 0 0 0 0 0 0 0 00.0%
00.0%
00.0%
00.0% 0.0% 0.0% 0.0% 0.0% 0.0%
0 0 0 0 0 00.0%
00.0%
01 In 2012 and 2013, FSIS did not sample products for Salmonella because in prior years the percent of pork carcass samples positive for Salmonella was consistently low2 ACSSuTAuCx = ACSSuT, amoxicillin-clavulanic acid, and ceftriaxone
Humans
Chi
cken
sTu
rkey
sC
attle
Sw
ine
Sw
ine
Retail Pork Chops
HACCP
Cecal (Market Hogs)
Cecal (Sows)
Humans
Chi
cken
s
Retail Chickens
HACCP
Cecal
Turk
eys
Retail Ground Turkey
HACCP
Cecal
Cat
tle
Retail Ground Beef
HACCP
Cecal (Beef)
Cecal (Dairy)
Humans
Chi
cken
s C
attle
Retail Ground Beef
HACCP
Cecal (Beef)
Cecal (Dairy)
Sw
ine
Retail Pork Chops
HACCP
Cecal (Market Hogs)
Cecal (Sows)
Retail Chickens
HACCP
Cecal
Turk
eys
Retail Ground Turkey
HACCP
Cecal
140
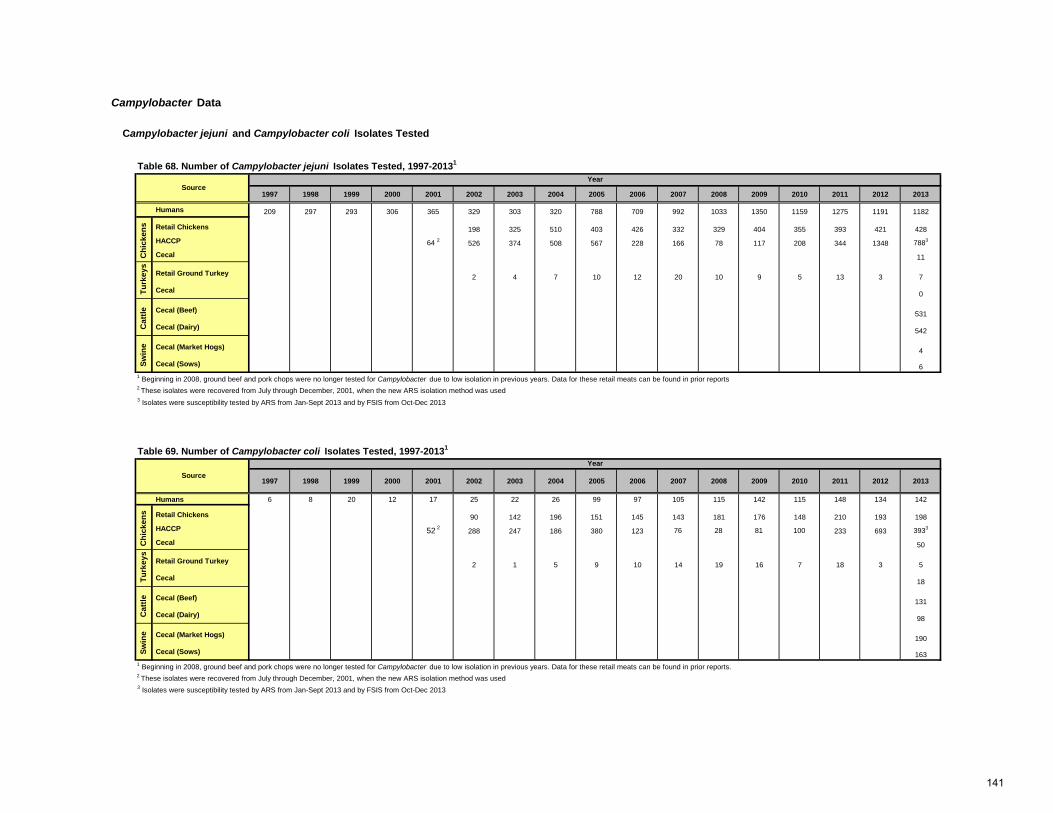
Campylobacter Data
Table 68. Number of Campylobacter jejuni Isolates Tested, 1997-20131
1997 1998 1999 2000 2001 2002 2003 2004 2005 2006 2007 2008 2009 2010 2011 2012 2013
Humans 209 297 293 306 365 329 303 320 788 709 992 1033 1350 1159 1275 1191 1182
Retail Chickens 198 325 510 403 426 332 329 404 355 393 421 428 HACCP 64 2 526 374 508 567 228 166 78 117 208 344 1348 7883
Cecal 11
Retail Ground Turkey 2 4 7 10 12 20 10 9 5 13 3 7
Cecal 0
Cecal (Beef) 531
Cecal (Dairy) 542
Cecal (Market Hogs) 4
Cecal (Sows) 61 Beginning in 2008, ground beef and pork chops were no longer tested for Campylobacter due to low isolation in previous years. Data for these retail meats can be found in prior reports2 These isolates were recovered from July through December, 2001, when the new ARS isolation method was used 3 Isolates were susceptibility tested by ARS from Jan-Sept 2013 and by FSIS from Oct-Dec 2013
Table 69. Number of Campylobacter coli Isolates Tested, 1997-20131
1997 1998 1999 2000 2001 2002 2003 2004 2005 2006 2007 2008 2009 2010 2011 2012 2013
Humans 6 8 20 12 17 25 22 26 99 97 105 115 142 115 148 134 142
Retail Chickens 90 142 196 151 145 143 181 176 148 210 193 198 HACCP 52 2 288 247 186 380 123 76 28 81 100 233 693 3933
Cecal 50
Retail Ground Turkey 2 1 5 9 10 14 19 16 7 18 3 5
Cecal 18
Cecal (Beef) 131
Cecal (Dairy) 98
Cecal (Market Hogs) 190
Cecal (Sows) 1631 Beginning in 2008, ground beef and pork chops were no longer tested for Campylobacter due to low isolation in previous years. Data for these retail meats can be found in prior reports.2 These isolates were recovered from July through December, 2001, when the new ARS isolation method was used 3 Isolates were susceptibility tested by ARS from Jan-Sept 2013 and by FSIS from Oct-Dec 2013
Turk
eys
Cat
tleSw
ine
Cat
tleSw
ine
SourceYear
Chi
cken
sTu
rkey
s Campylobacter jejuni and Campylobacter coli Isolates Tested
SourceYear
Chi
cken
s
141
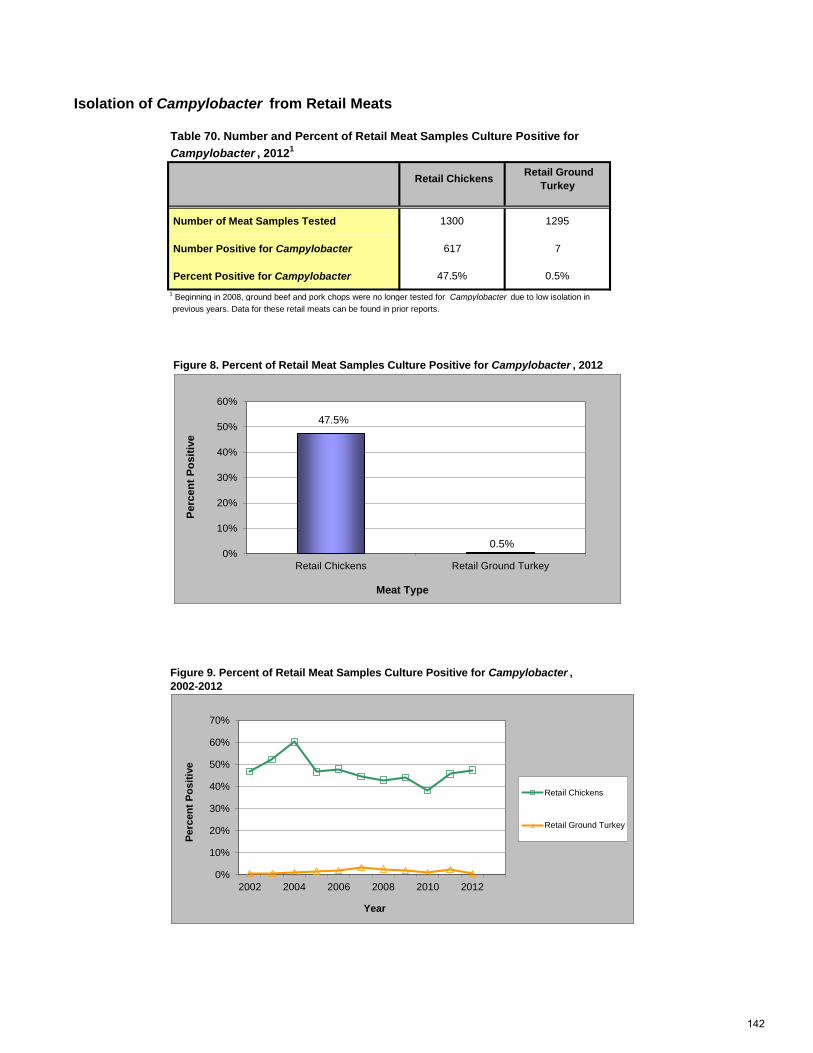
Isolation of Campylobacter from Retail Meats
Retail Chickens Retail Ground Turkey
Number of Meat Samples Tested 1300 1295
Number Positive for Campylobacter 617 7
Percent Positive for Campylobacter 47.5% 0.5%1 Beginning in 2008, ground beef and pork chops were no longer tested for Campylobacter due to low isolation in previous years. Data for these retail meats can be found in prior reports.
Figure 8. Percent of Retail Meat Samples Culture Positive for Campylobacter , 2012
2002-2012
Table 70. Number and Percent of Retail Meat Samples Culture Positive for Campylobacter , 20121
Figure 9. Percent of Retail Meat Samples Culture Positive for Campylobacter ,
47.5%
0.5%
-10%
0%
10%
20%
30%
40%
50%
60%
Retail Chickens Retail Ground Turkey
Perc
ent P
ositi
ve
Meat Type
0%
10%
20%
30%
40%
50%
60%
70%
2002 2003 2004 2005 2006 2007 2008 2009 2010
Perc
ent P
ositi
ve
Year
Retail Chickens
Retail Ground Turkey
47.5%
0.5% 0%
10%
20%
30%
40%
50%
60%
Retail Chickens Retail Ground Turkey
Perc
ent P
ositi
ve
Meat Type
0%
10%
20%
30%
40%
50%
60%
70%
2002 2004 2006 2008 2010 2012
Perc
ent P
ositi
ve
Year
Retail Chickens
Retail Ground Turkey
142
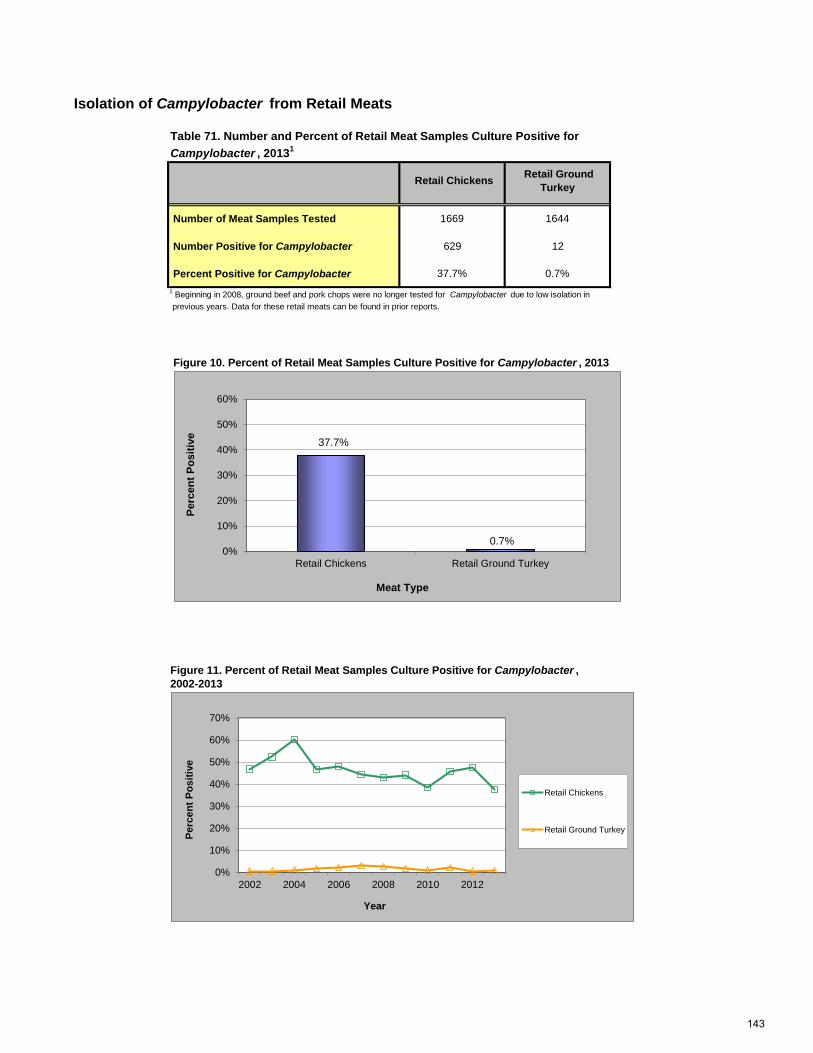
Isolation of Campylobacter from Retail Meats
Retail Chickens Retail Ground Turkey
Number of Meat Samples Tested 1669 1644
Number Positive for Campylobacter 629 12
Percent Positive for Campylobacter 37.7% 0.7%1 Beginning in 2008, ground beef and pork chops were no longer tested for Campylobacter due to low isolation in previous years. Data for these retail meats can be found in prior reports.
Figure 10. Percent of Retail Meat Samples Culture Positive for Campylobacter , 2013
2002-2013
Table 71. Number and Percent of Retail Meat Samples Culture Positive for Campylobacter , 20131
Figure 11. Percent of Retail Meat Samples Culture Positive for Campylobacter ,
37.7%
0.7%
-10%
0%
10%
20%
30%
40%
50%
60%
Retail Chickens Retail Ground Turkey
Perc
ent P
ositi
ve
Meat Type
0%
10%
20%
30%
40%
50%
60%
70%
2002 2003 2004 2005 2006 2007 2008 2009 2010
Perc
ent P
ositi
ve
Year
Retail Chickens
Retail Ground Turkey
37.7%
0.7% 0%
10%
20%
30%
40%
50%
60%
Retail Chickens Retail Ground Turkey
Perc
ent P
ositi
ve
Meat Type
0%
10%
20%
30%
40%
50%
60%
70%
2002 2004 2006 2008 2010 2012
Perc
ent P
ositi
ve
Year
Retail Chickens
Retail Ground Turkey
143
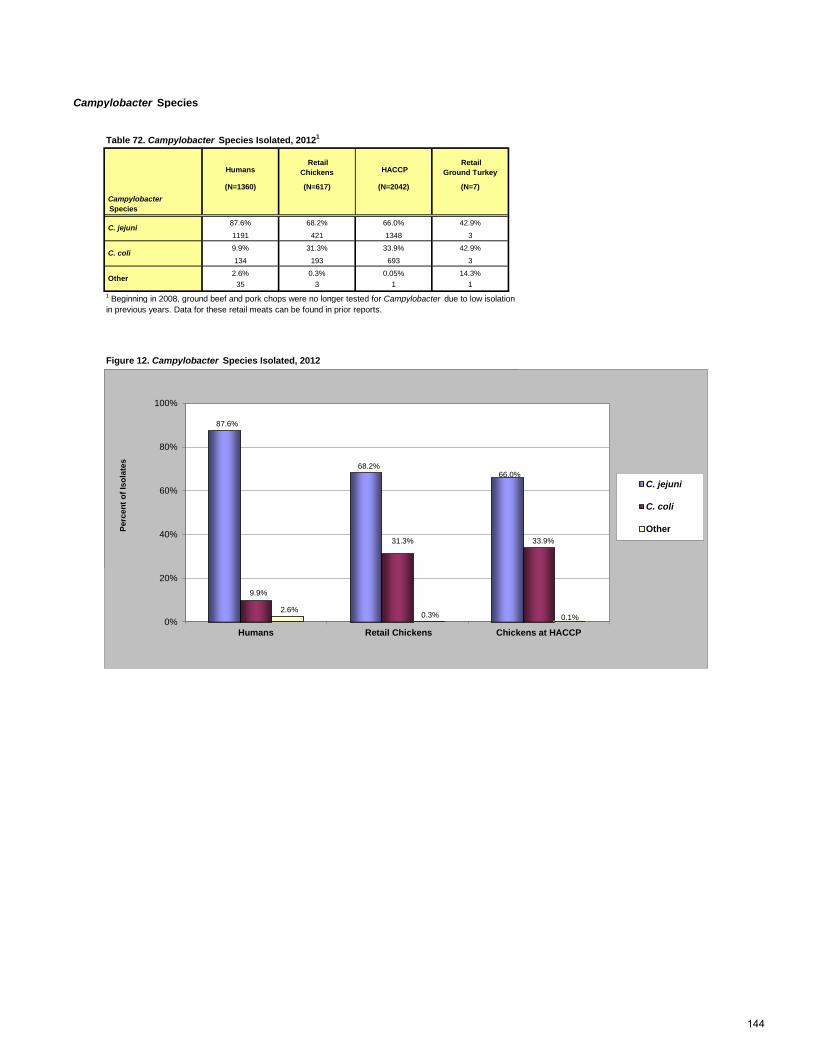
Campylobacter Species
Table 72. Campylobacter Species Isolated, 20121
Humans Retail
Chickens HACCP Retail
Ground Turkey
(N=1360) (N=617) (N=2042) (N=7) Campylobacter Species
87.6% 68.2% 66.0% 42.9%
1191 421 1348 3
9.9% 31.3% 33.9% 42.9%
134 193 693 3
2.6% 0.3% 0.05% 14.3%35 3 1 1
1 Beginning in 2008, ground beef and pork chops were no longer tested for Campylobacter due to low isolationin previous years. Data for these retail meats can be found in prior reports.
Figure 12. Campylobacter Species Isolated, 2012
C. jejuni
C. coli
Other
87.6%
68.2% 66.0%
9.9%
31.3% 33.9%
2.6% 0.3% 0.1% 0%
20%
40%
60%
80%
100%
Humans Retail Chickens Chickens at HACCP
Perc
ent o
f Iso
late
s
C. jejuniC. coliOther
87.6%
68.2% 66.0%
9.9%
31.3% 33.9%
2.6% 0.3% 0.1% 0%
20%
40%
60%
80%
100%
Humans Retail Chickens Chickens at HACCP
Perc
ent o
f Iso
late
s
C. jejuni
C. coli
Other
144
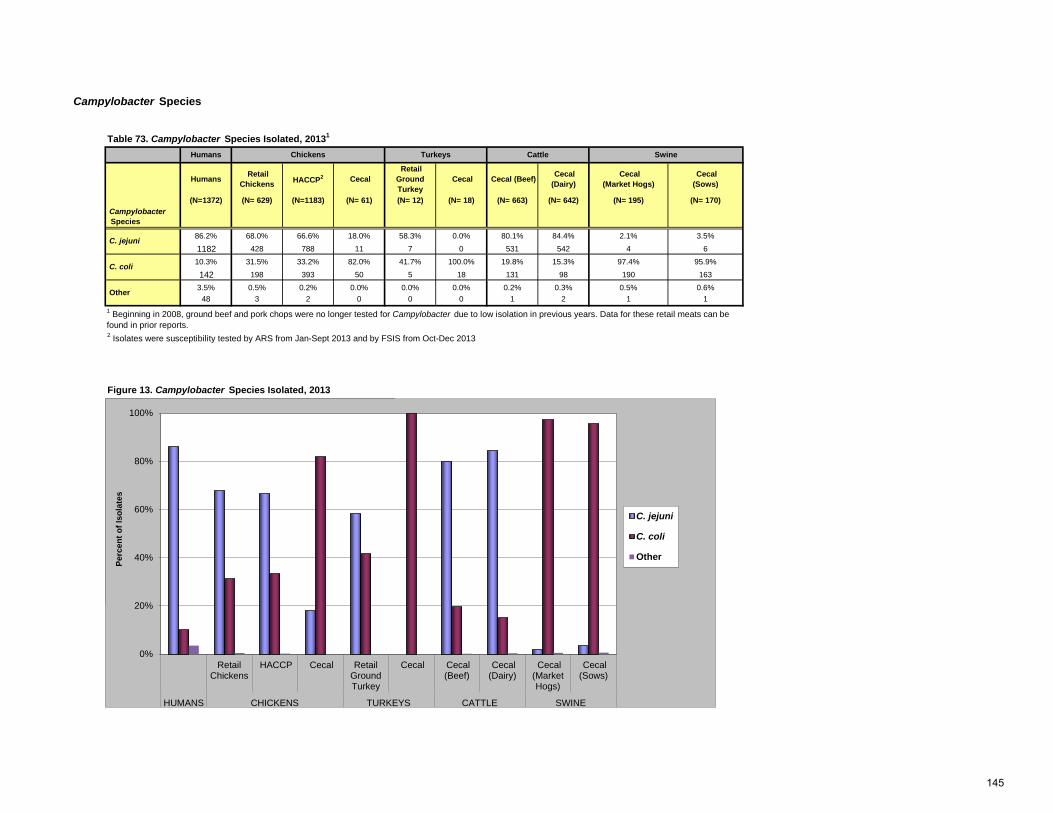
Campylobacter Species
Table 73. Campylobacter Species Isolated, 20131
Humans Retail Chickens HACCP2 Cecal
Retail Ground Turkey
Cecal Cecal (Beef) Cecal (Dairy)
Cecal (Market Hogs)
Cecal (Sows)
(N=1372) (N= 629) (N=1183) (N= 61) (N= 12) (N= 18) (N= 663) (N= 642) (N= 195) (N= 170) Campylobacter Species
86.2% 68.0% 66.6% 18.0% 58.3% 0.0% 80.1% 84.4% 2.1% 3.5%
1182 428 788 11 7 0 531 542 4 610.3% 31.5% 33.2% 82.0% 41.7% 100.0% 19.8% 15.3% 97.4% 95.9%
142 198 393 50 5 18 131 98 190 1633.5% 0.5% 0.2% 0.0% 0.0% 0.0% 0.2% 0.3% 0.5% 0.6%
48 3 2 0 0 0 1 2 1 1
2 Isolates were susceptibility tested by ARS from Jan-Sept 2013 and by FSIS from Oct-Dec 2013
Figure 13. Campylobacter Species Isolated, 2013
C. jejuni
C. coli
Other
1 Beginning in 2008, ground beef and pork chops were no longer tested for Campylobacter due to low isolation in previous years. Data for these retail meats can be found in prior reports.
SwineHumans Chickens Turkeys Cattle
86.2%
68.0% 66.6%
10.3%
31.5% 33.2%
3.5% 0.5% 0.2% 0%
20%
40%
60%
80%
100%
RetailChickens
HACCP
Perc
ent o
f Iso
late
s
C.jejuniC. coli
0%
20%
40%
60%
80%
100%
RetailChickens
HACCP Cecal RetailGroundTurkey
Cecal Cecal(Beef)
Cecal(Dairy)
Cecal(MarketHogs)
Cecal(Sows)
HUMANS CHICKENS TURKEYS CATTLE SWINE
Perc
ent o
f Iso
late
s
C. jejuni
C. coli
Other
145
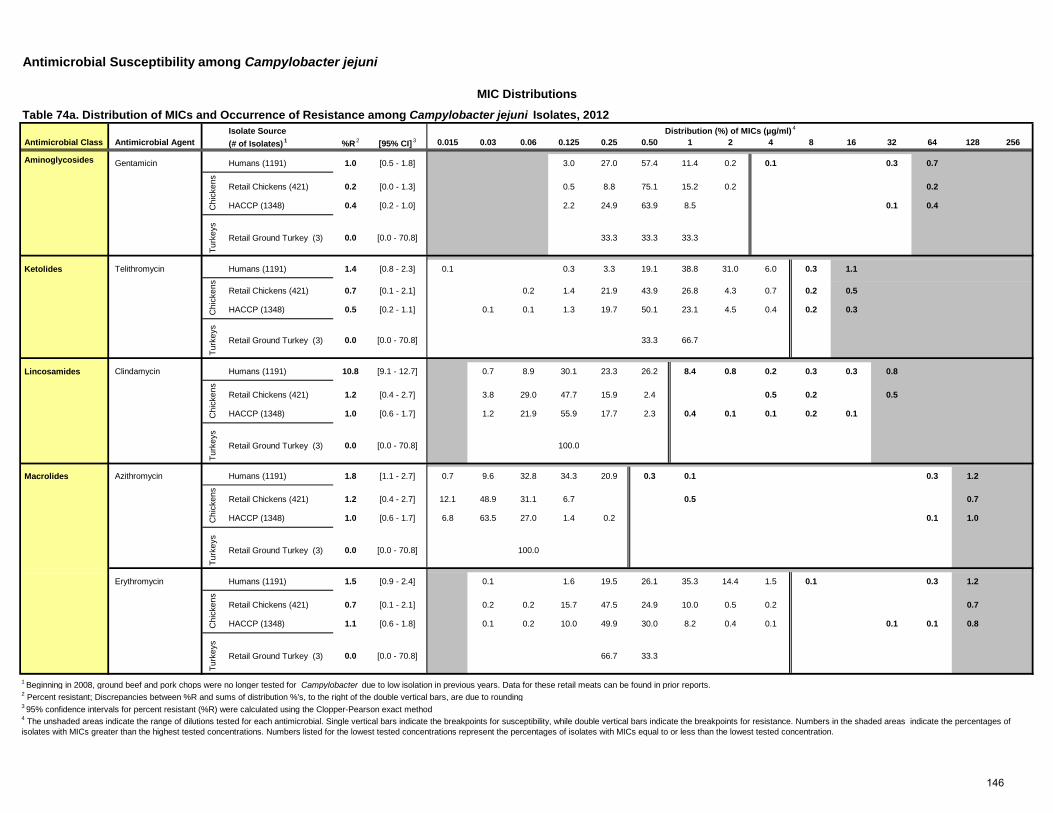
Isolate Source Antimicrobial Class Antimicrobial Agent (# of Isolates)
1 %R 2 [95% CI]
3 0.015 0.03 0.06 0.125 0.25 0.50 1 2 4 8 16 32 64 128 256
Aminoglycosides Gentamicin Humans (1191) 1.0 [0.5 - 1.8] 3.0 27.0 57.4 11.4 0.2 0.1 0.3 0.7
Retail Chickens (421) 0.2 [0.0 - 1.3] 0.5 8.8 75.1 15.2 0.2 0.2
HACCP (1348) 0.4 [0.2 - 1.0] 2.2 24.9 63.9 8.5 0.1 0.4Tu
rkey
s
Retail Ground Turkey (3) 0.0 [0.0 - 70.8] 33.3 33.3 33.3
Ketolides Telithromycin Humans (1191) 1.4 [0.8 - 2.3] 0.1 0.3 3.3 19.1 38.8 31.0 6.0 0.3 1.1
Retail Chickens (421) 0.7 [0.1 - 2.1] 0.2 1.4 21.9 43.9 26.8 4.3 0.7 0.2 0.5
HACCP (1348) 0.5 [0.2 - 1.1] 0.1 0.1 1.3 19.7 50.1 23.1 4.5 0.4 0.2 0.3
Turk
eys
Retail Ground Turkey (3) 0.0 [0.0 - 70.8] 33.3 66.7
Lincosamides Clindamycin Humans (1191) 10.8 [9.1 - 12.7] 0.7 8.9 30.1 23.3 26.2 8.4 0.8 0.2 0.3 0.3 0.8
Retail Chickens (421) 1.2 [0.4 - 2.7] 3.8 29.0 47.7 15.9 2.4 0.5 0.2 0.5
HACCP (1348) 1.0 [0.6 - 1.7] 1.2 21.9 55.9 17.7 2.3 0.4 0.1 0.1 0.2 0.1
Turk
eys
Retail Ground Turkey (3) 0.0 [0.0 - 70.8] 100.0
Macrolides Azithromycin Humans (1191) 1.8 [1.1 - 2.7] 0.7 9.6 32.8 34.3 20.9 0.3 0.1 0.3 1.2
Retail Chickens (421) 1.2 [0.4 - 2.7] 12.1 48.9 31.1 6.7 0.5 0.7
HACCP (1348) 1.0 [0.6 - 1.7] 6.8 63.5 27.0 1.4 0.2 0.1 1.0
Turk
eys
Retail Ground Turkey (3) 0.0 [0.0 - 70.8] 100.0
Erythromycin Humans (1191) 1.5 [0.9 - 2.4] 0.1 1.6 19.5 26.1 35.3 14.4 1.5 0.1 0.3 1.2
Retail Chickens (421) 0.7 [0.1 - 2.1] 0.2 0.2 15.7 47.5 24.9 10.0 0.5 0.2 0.7
HACCP (1348) 1.1 [0.6 - 1.8] 0.1 0.2 10.0 49.9 30.0 8.2 0.4 0.1 0.1 0.1 0.8
Turk
eys
Retail Ground Turkey (3) 0.0 [0.0 - 70.8] 66.7 33.3
1 Beginning in 2008, ground beef and pork chops were no longer tested for Campylobacter due to low isolation in previous years. Data for these retail meats can be found in prior reports.2 Percent resistant; Discrepancies between %R and sums of distribution %'s, to the right of the double vertical bars, are due to rounding3 95% confidence intervals for percent resistant (%R) were calculated using the Clopper-Pearson exact method
Chi
cken
sC
hick
ens
Chi
cken
sC
hick
ens
Chi
cken
s
4 The unshaded areas indicate the range of dilutions tested for each antimicrobial. Single vertical bars indicate the breakpoints for susceptibility, while double vertical bars indicate the breakpoints for resistance. Numbers in the shaded areas indicate the percentages of isolates with MICs greater than the highest tested concentrations. Numbers listed for the lowest tested concentrations represent the percentages of isolates with MICs equal to or less than the lowest tested concentration.
Antimicrobial Susceptibility among Campylobacter jejuni
MIC DistributionsTable 74a. Distribution of MICs and Occurrence of Resistance among Campylobacter jejuni Isolates, 2012
Distribution (%) of MICs (µg/ml) 4
146
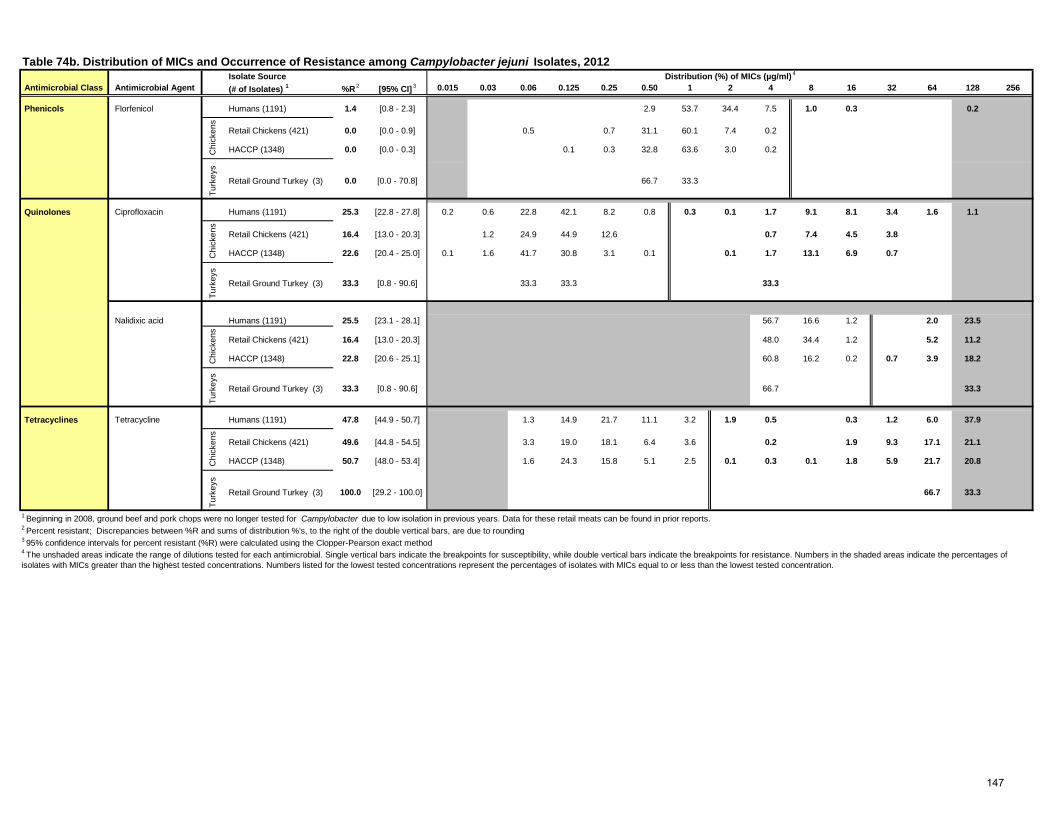
Isolate Source Antimicrobial Class Antimicrobial Agent (# of Isolates) 1 %R
2 [95% CI] 3 0.015 0.03 0.06 0.125 0.25 0.50 1 2 4 8 16 32 64 128 256
Phenicols Florfenicol Humans (1191) 1.4 [0.8 - 2.3] 2.9 53.7 34.4 7.5 1.0 0.3 0.2
Retail Chickens (421) 0.0 [0.0 - 0.9] 0.5 0.7 31.1 60.1 7.4 0.2
HACCP (1348) 0.0 [0.0 - 0.3] 0.1 0.3 32.8 63.6 3.0 0.2
Turk
eys
Retail Ground Turkey (3) 0.0 [0.0 - 70.8] 66.7 33.3
Quinolones Ciprofloxacin Humans (1191) 25.3 [22.8 - 27.8] 0.2 0.6 22.8 42.1 8.2 0.8 0.3 0.1 1.7 9.1 8.1 3.4 1.6 1.1
Retail Chickens (421) 16.4 [13.0 - 20.3] 1.2 24.9 44.9 12.6 0.7 7.4 4.5 3.8
HACCP (1348) 22.6 [20.4 - 25.0] 0.1 1.6 41.7 30.8 3.1 0.1 0.1 1.7 13.1 6.9 0.7
Turk
eys
Retail Ground Turkey (3) 33.3 [0.8 - 90.6] 33.3 33.3 33.3
Nalidixic acid Humans (1191) 25.5 [23.1 - 28.1] 56.7 16.6 1.2 2.0 23.5
Retail Chickens (421) 16.4 [13.0 - 20.3] 48.0 34.4 1.2 5.2 11.2
HACCP (1348) 22.8 [20.6 - 25.1] 60.8 16.2 0.2 0.7 3.9 18.2
Turk
eys
Retail Ground Turkey (3) 33.3 [0.8 - 90.6] 66.7 33.3
Tetracyclines Tetracycline Humans (1191) 47.8 [44.9 - 50.7] 1.3 14.9 21.7 11.1 3.2 1.9 0.5 0.3 1.2 6.0 37.9
Retail Chickens (421) 49.6 [44.8 - 54.5] 3.3 19.0 18.1 6.4 3.6 0.2 1.9 9.3 17.1 21.1
HACCP (1348) 50.7 [48.0 - 53.4] 1.6 24.3 15.8 5.1 2.5 0.1 0.3 0.1 1.8 5.9 21.7 20.8
Turk
eys
Retail Ground Turkey (3) 100.0 [29.2 - 100.0] 66.7 33.3
1 Beginning in 2008, ground beef and pork chops were no longer tested for Campylobacter due to low isolation in previous years. Data for these retail meats can be found in prior reports.2 Percent resistant; Discrepancies between %R and sums of distribution %'s, to the right of the double vertical bars, are due to rounding 3 95% confidence intervals for percent resistant (%R) were calculated using the Clopper-Pearson exact method4 The unshaded areas indicate the range of dilutions tested for each antimicrobial. Single vertical bars indicate the breakpoints for susceptibility, while double vertical bars indicate the breakpoints for resistance. Numbers in the shaded areas indicate the percentages of isolates with MICs greater than the highest tested concentrations. Numbers listed for the lowest tested concentrations represent the percentages of isolates with MICs equal to or less than the lowest tested concentration.
Table 74b. Distribution of MICs and Occurrence of Resistance among Campylobacter jejuni Isolates, 2012 Distribution (%) of MICs (µg/ml)
4
Chi
cken
sC
hick
ens
Chi
cken
sC
hick
ens
147
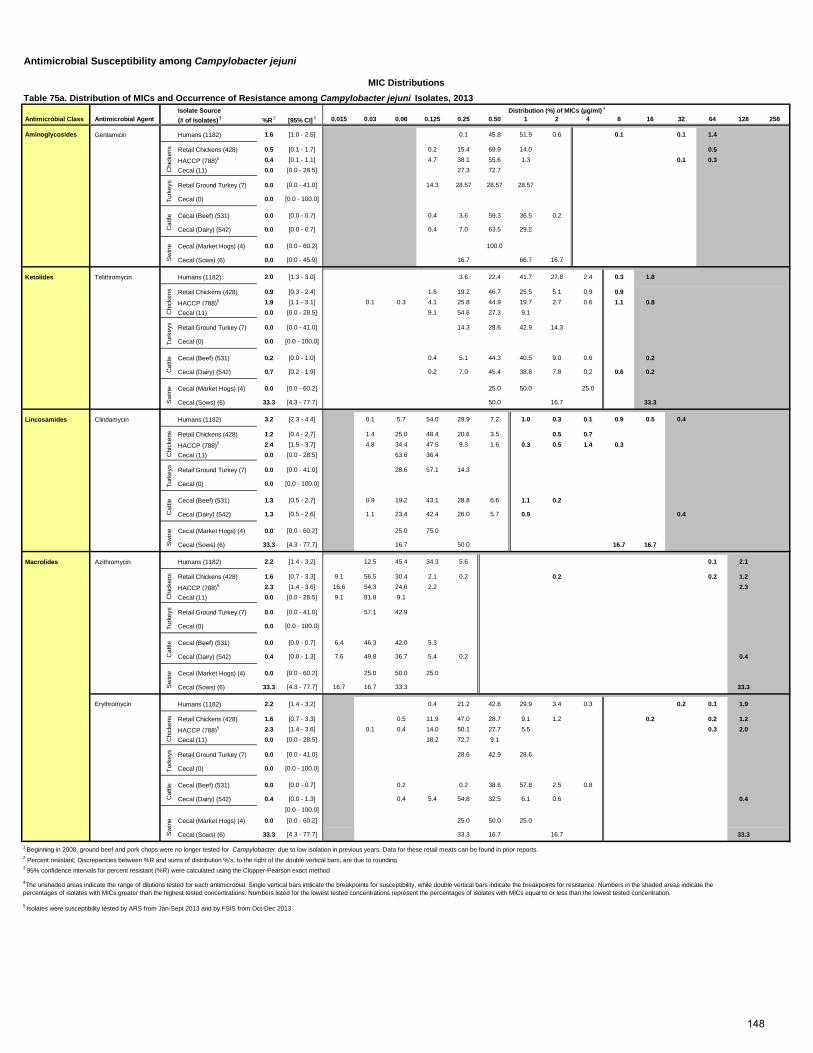
Isolate Source Antimicrobial Class Antimicrobial Agent (# of Isolates)
1 %R 2 [95% CI]
3 0.015 0.03 0.06 0.125 0.25 0.50 1 2 4 8 16 32 64 128 256
Aminoglycosides Gentamicin Humans (1182) 1.6 [1.0 - 2.5] 0.1 45.8 51.9 0.6 0.1 0.1 1.4
Retail Chickens (428) 0.5 [0.1 - 1.7] 0.2 15.4 69.9 14.0 0.5
HACCP (788)5 0.4 [0.1 - 1.1] 4.7 38.1 55.6 1.3 0.1 0.3 Cecal (11) 0.0 [0.0 - 28.5] 27.3 72.7
Retail Ground Turkey (7) 0.0 [0.0 - 41.0] 14.3 28.57 28.57 28.57
Cecal (0) 0.0 [0.0 - 100.0]
Cecal (Beef) (531) 0.0 [0.0 - 0.7] 0.4 3.6 59.3 36.5 0.2
Cecal (Dairy) (542) 0.0 [0.0 - 0.7] 0.4 7.0 63.5 29.2
Cecal (Market Hogs) (4) 0.0 [0.0 - 60.2] 100.0
Cecal (Sows) (6) 0.0 [0.0 - 45.9] 16.7 66.7 16.7
Ketolides Telithromycin Humans (1182) 2.0 [1.3 - 3.0] 3.6 22.4 41.7 27.8 2.4 0.3 1.8
Retail Chickens (428) 0.9 [0.3 - 2.4] 1.6 19.2 46.7 25.5 5.1 0.9 0.9
HACCP (788)5 1.9 [1.1 - 3.1] 0.1 0.3 4.1 25.8 44.9 19.7 2.7 0.6 1.1 0.8 Cecal (11) 0.0 [0.0 - 28.5] 9.1 54.6 27.3 9.1
Retail Ground Turkey (7) 0.0 [0.0 - 41.0] 14.3 28.6 42.9 14.3
Cecal (0) 0.0 [0.0 - 100.0]
Cecal (Beef) (531) 0.2 [0.0 - 1.0] 0.4 5.1 44.3 40.5 9.0 0.6 0.2
Cecal (Dairy) (542) 0.7 [0.2 - 1.9] 0.2 7.0 45.4 38.8 7.8 0.2 0.6 0.2
Cecal (Market Hogs) (4) 0.0 [0.0 - 60.2] 25.0 50.0 25.0
Cecal (Sows) (6) 33.3 [4.3 - 77.7] 50.0 16.7 33.3
Lincosamides Clindamycin Humans (1182) 3.2 [2.3 - 4.4] 0.1 5.7 54.0 29.9 7.2 1.0 0.3 0.1 0.9 0.5 0.4
Retail Chickens (428) 1.2 [0.4 - 2.7] 1.4 25.0 48.4 20.6 3.5 0.5 0.7
HACCP (788)5 2.4 [1.5 - 3.7] 4.8 34.4 47.5 9.3 1.6 0.3 0.5 1.4 0.3 Cecal (11) 0.0 [0.0 - 28.5] 63.6 36.4
Retail Ground Turkey (7) 0.0 [0.0 - 41.0] 28.6 57.1 14.3
Cecal (0) 0.0 [0.0 - 100.0]
Cecal (Beef) (531) 1.3 [0.5 - 2.7] 0.9 19.2 43.1 28.8 6.6 1.1 0.2
Cecal (Dairy) (542) 1.3 [0.5 - 2.6] 1.1 23.4 42.4 26.0 5.7 0.9 0.4
Cecal (Market Hogs) (4) 0.0 [0.0 - 60.2] 25.0 75.0
Cecal (Sows) (6) 33.3 [4.3 - 77.7] 16.7 50.0 16.7 16.7
Macrolides Azithromycin Humans (1182) 2.2 [1.4 - 3.2] 12.5 45.4 34.3 5.6 0.1 2.1
Retail Chickens (428) 1.6 [0.7 - 3.3] 9.1 56.5 30.4 2.1 0.2 0.2 0.2 1.2
HACCP (788)5 2.3 [1.4 - 3.6] 16.6 54.3 24.6 2.2 2.3 Cecal (11) 0.0 [0.0 - 28.5] 9.1 81.8 9.1
Retail Ground Turkey (7) 0.0 [0.0 - 41.0] 57.1 42.9
Cecal (0) 0.0 [0.0 - 100.0]
Cecal (Beef) (531) 0.0 [0.0 - 0.7] 6.4 46.3 42.0 5.3
Cecal (Dairy) (542) 0.4 [0.0 - 1.3] 7.6 49.8 36.7 5.4 0.2 0.4
Cecal (Market Hogs) (4) 0.0 [0.0 - 60.2] 25.0 50.0 25.0
Cecal (Sows) (6) 33.3 [4.3 - 77.7] 16.7 16.7 33.3 33.3
Erythromycin Humans (1182) 2.2 [1.4 - 3.2] 0.4 21.2 42.6 29.9 3.4 0.3 0.2 0.1 1.9
Retail Chickens (428) 1.6 [0.7 - 3.3] 0.5 11.9 47.0 28.7 9.1 1.2 0.2 0.2 1.2
HACCP (788)5 2.3 [1.4 - 3.6] 0.1 0.4 14.0 50.1 27.7 5.5 0.3 2.0 Cecal (11) 0.0 [0.0 - 28.5] 18.2 72.7 9.1
Retail Ground Turkey (7) 0.0 [0.0 - 41.0] 28.6 42.9 28.6
Cecal (0) 0.0 [0.0 - 100.0]
Cecal (Beef) (531) 0.0 [0.0 - 0.7] 0.2 0.2 38.6 57.8 2.5 0.8
Cecal (Dairy) (542) 0.4 [0.0 - 1.3] 0.4 5.4 54.8 32.5 6.1 0.6 0.4[0.0 - 100.0]
Cecal (Market Hogs) (4) 0.0 [0.0 - 60.2] 25.0 50.0 25.0
Cecal (Sows) (6) 33.3 [4.3 - 77.7] 33.3 16.7 16.7 33.3
1 Beginning in 2008, ground beef and pork chops were no longer tested for Campylobacter due to low isolation in previous years. Data for these retail meats can be found in prior reports.2 Percent resistant; Discrepancies between %R and sums of distribution %'s, to the right of the double vertical bars, are due to rounding3 95% confidence intervals for percent resistant (%R) were calculated using the Clopper-Pearson exact method
5 Isolates were susceptibility tested by ARS from Jan-Sept 2013 and by FSIS from Oct-Dec 2013
Sw
ine
4The unshaded areas indicate the range of dilutions tested for each antimicrobial. Single vertical bars indicate the breakpoints for susceptibility, while double vertical bars indicate the breakpoints for resistance. Numbers in the shaded areas indicate the percentages of isolates with MICs greater than the highest tested concentrations. Numbers listed for the lowest tested concentrations represent the percentages of isolates with MICs equal to or less than the lowest tested concentration.
Cat
tleS
win
eC
hick
ens
Turk
eys
Cat
tleS
win
eC
hick
ens
Turk
eys
Cat
tleS
win
eC
hick
ens
Turk
eys
Cat
tle
Antimicrobial Susceptibility among Campylobacter jejuni
MIC DistributionsTable 75a. Distribution of MICs and Occurrence of Resistance among Campylobacter jejuni Isolates, 2013
Distribution (%) of MICs (µg/ml) 4
Chi
cken
sTu
rkey
sC
attle
Sw
ine
Chi
cken
sTu
rkey
s
148
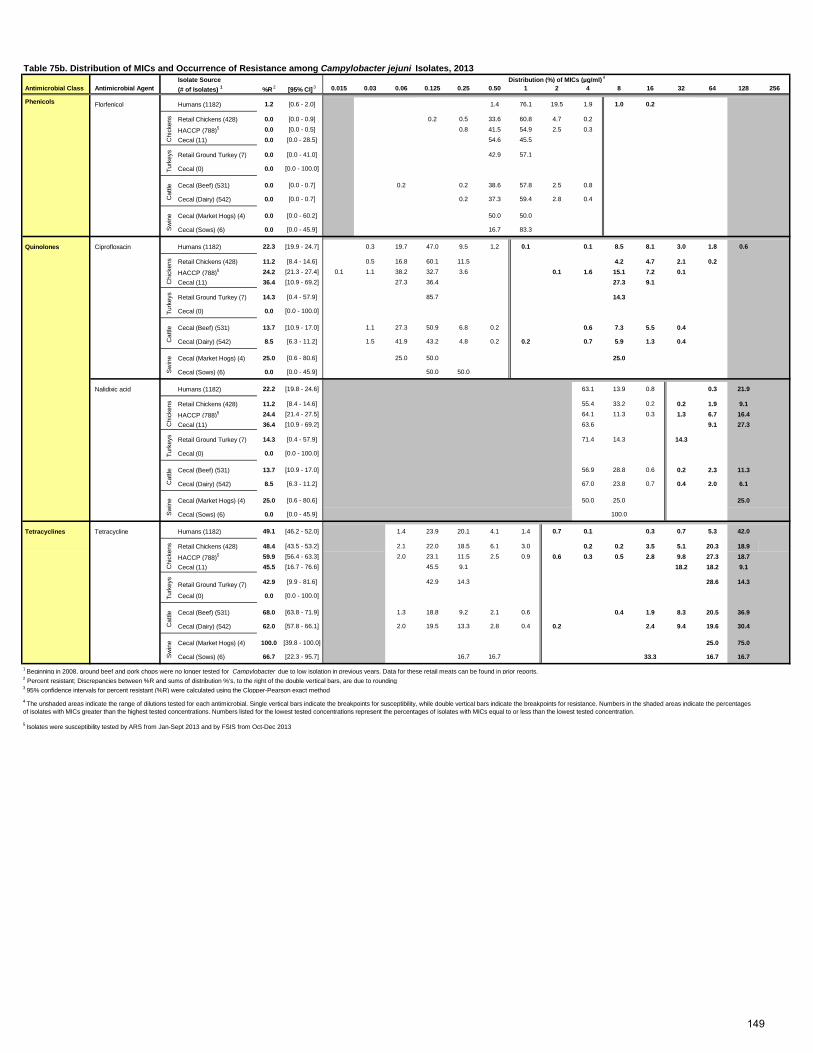
Isolate Source Antimicrobial Class Antimicrobial Agent (# of Isolates) 1 %R
2 [95% CI] 3 0.015 0.03 0.06 0.125 0.25 0.50 1 2 4 8 16 32 64 128 256
Phenicols Florfenicol Humans (1182) 1.2 [0.6 - 2.0] 1.4 76.1 19.5 1.9 1.0 0.2
Retail Chickens (428) 0.0 [0.0 - 0.9] 0.2 0.5 33.6 60.8 4.7 0.2
HACCP (788)5 0.0 [0.0 - 0.5] 0.8 41.5 54.9 2.5 0.3
Cecal (11) 0.0 [0.0 - 28.5] 54.6 45.5
Retail Ground Turkey (7) 0.0 [0.0 - 41.0] 42.9 57.1
Cecal (0) 0.0 [0.0 - 100.0]
Cecal (Beef) (531) 0.0 [0.0 - 0.7] 0.2 0.2 38.6 57.8 2.5 0.8
Cecal (Dairy) (542) 0.0 [0.0 - 0.7] 0.2 37.3 59.4 2.8 0.4
Cecal (Market Hogs) (4) 0.0 [0.0 - 60.2] 50.0 50.0
Cecal (Sows) (6) 0.0 [0.0 - 45.9] 16.7 83.3
Quinolones Ciprofloxacin Humans (1182) 22.3 [19.9 - 24.7] 0.3 19.7 47.0 9.5 1.2 0.1 0.1 8.5 8.1 3.0 1.8 0.6
Retail Chickens (428) 11.2 [8.4 - 14.6] 0.5 16.8 60.1 11.5 4.2 4.7 2.1 0.2
HACCP (788)5 24.2 [21.3 - 27.4] 0.1 1.1 38.2 32.7 3.6 0.1 1.6 15.1 7.2 0.1 Cecal (11) 36.4 [10.9 - 69.2] 27.3 36.4 27.3 9.1
Retail Ground Turkey (7) 14.3 [0.4 - 57.9] 85.7 14.3
Cecal (0) 0.0 [0.0 - 100.0]
Cecal (Beef) (531) 13.7 [10.9 - 17.0] 1.1 27.3 50.9 6.8 0.2 0.6 7.3 5.5 0.4
Cecal (Dairy) (542) 8.5 [6.3 - 11.2] 1.5 41.9 43.2 4.8 0.2 0.2 0.7 5.9 1.3 0.4
Cecal (Market Hogs) (4) 25.0 [0.6 - 80.6] 25.0 50.0 25.0
Cecal (Sows) (6) 0.0 [0.0 - 45.9] 50.0 50.0
Nalidixic acid Humans (1182) 22.2 [19.8 - 24.6] 63.1 13.9 0.8 0.3 21.9
Retail Chickens (428) 11.2 [8.4 - 14.6] 55.4 33.2 0.2 0.2 1.9 9.1
HACCP (788)5 24.4 [21.4 - 27.5] 64.1 11.3 0.3 1.3 6.7 16.4 Cecal (11) 36.4 [10.9 - 69.2] 63.6 9.1 27.3
Retail Ground Turkey (7) 14.3 [0.4 - 57.9] 71.4 14.3 14.3
Cecal (0) 0.0 [0.0 - 100.0]
Cecal (Beef) (531) 13.7 [10.9 - 17.0] 56.9 28.8 0.6 0.2 2.3 11.3
Cecal (Dairy) (542) 8.5 [6.3 - 11.2] 67.0 23.8 0.7 0.4 2.0 6.1
Cecal (Market Hogs) (4) 25.0 [0.6 - 80.6] 50.0 25.0 25.0
Cecal (Sows) (6) 0.0 [0.0 - 45.9] 100.0
Tetracyclines Tetracycline Humans (1182) 49.1 [46.2 - 52.0] 1.4 23.9 20.1 4.1 1.4 0.7 0.1 0.3 0.7 5.3 42.0
Retail Chickens (428) 48.4 [43.5 - 53.2] 2.1 22.0 18.5 6.1 3.0 0.2 0.2 3.5 5.1 20.3 18.9
HACCP (788)5 59.9 [56.4 - 63.3] 2.0 23.1 11.5 2.5 0.9 0.6 0.3 0.5 2.8 9.8 27.3 18.7 Cecal (11) 45.5 [16.7 - 76.6] 45.5 9.1 18.2 18.2 9.1
Retail Ground Turkey (7) 42.9 [9.9 - 81.6] 42.9 14.3 28.6 14.3
Cecal (0) 0.0 [0.0 - 100.0]
Cecal (Beef) (531) 68.0 [63.8 - 71.9] 1.3 18.8 9.2 2.1 0.6 0.4 1.9 8.3 20.5 36.9
Cecal (Dairy) (542) 62.0 [57.8 - 66.1] 2.0 19.5 13.3 2.8 0.4 0.2 2.4 9.4 19.6 30.4
Cecal (Market Hogs) (4) 100.0 [39.8 - 100.0] 25.0 75.0
Cecal (Sows) (6) 66.7 [22.3 - 95.7] 16.7 16.7 33.3 16.7 16.7
1 Beginning in 2008, ground beef and pork chops were no longer tested for Campylobacter due to low isolation in previous years. Data for these retail meats can be found in prior reports.2 Percent resistant; Discrepancies between %R and sums of distribution %'s, to the right of the double vertical bars, are due to rounding 3 95% confidence intervals for percent resistant (%R) were calculated using the Clopper-Pearson exact method
5 Isolates were susceptibility tested by ARS from Jan-Sept 2013 and by FSIS from Oct-Dec 2013
Turk
eys
Cat
tleS
win
e
4 The unshaded areas indicate the range of dilutions tested for each antimicrobial. Single vertical bars indicate the breakpoints for susceptibility, while double vertical bars indicate the breakpoints for resistance. Numbers in the shaded areas indicate the percentages of isolates with MICs greater than the highest tested concentrations. Numbers listed for the lowest tested concentrations represent the percentages of isolates with MICs equal to or less than the lowest tested concentration.
Sw
ine
Chi
cken
sTu
rkey
sC
attle
Sw
ine
Chi
cken
sC
attle
Table 75b. Distribution of MICs and Occurrence of Resistance among Campylobacter jejuni Isolates, 2013 Distribution (%) of MICs (µg/ml)
4
Chi
cken
sTu
rkey
sC
attle
Sw
ine
Chi
cken
sTu
rkey
s
149
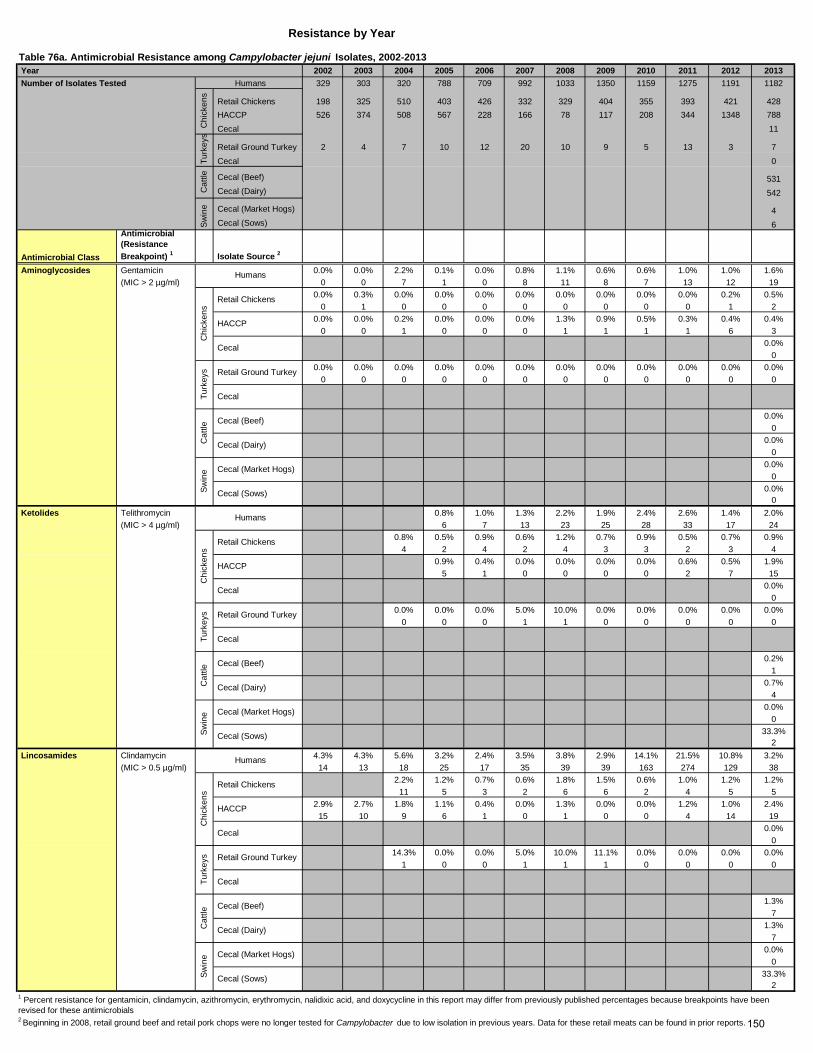
Year 2002 2003 2004 2005 2006 2007 2008 2009 2010 2011 2012 2013 Number of Isolates Tested 329 303 320 788 709 992 1033 1350 1159 1275 1191 1182
Retail Chickens 198 325 510 403 426 332 329 404 355 393 421 428 HACCP 526 374 508 567 228 166 78 117 208 344 1348 788 Cecal 11
Retail Ground Turkey 2 4 7 10 12 20 10 9 5 13 3 7 Cecal 0
Cecal (Beef) 531 Cecal (Dairy) 542
Cecal (Market Hogs) 4 Cecal (Sows) 6
Antimicrobial Class
Antimicrobial (Resistance Breakpoint) 1 Isolate Source 2
Aminoglycosides Gentamicin 0.0% 0.0% 2.2% 0.1% 0.0% 0.8% 1.1% 0.6% 0.6% 1.0% 1.0% 1.6% (MIC > 2 µg/ml) 0 0 7 1 0 8 11 8 7 13 12 19
0.0% 0.3% 0.0% 0.0% 0.0% 0.0% 0.0% 0.0% 0.0% 0.0% 0.2% 0.5%0 1 0 0 0 0 0 0 0 0 1 2
0.0% 0.0% 0.2% 0.0% 0.0% 0.0% 1.3% 0.9% 0.5% 0.3% 0.4% 0.4%0 0 1 0 0 0 1 1 1 1 6 3
0.0%0
0.0% 0.0% 0.0% 0.0% 0.0% 0.0% 0.0% 0.0% 0.0% 0.0% 0.0% 0.0%0 0 0 0 0 0 0 0 0 0 0 0
0.0%0
0.0%0
0.0%0
0.0%0
Ketolides Telithromycin 0.8% 1.0% 1.3% 2.2% 1.9% 2.4% 2.6% 1.4% 2.0% (MIC > 4 µg/ml) 6 7 13 23 25 28 33 17 24
0.8% 0.5% 0.9% 0.6% 1.2% 0.7% 0.9% 0.5% 0.7% 0.9%4 2 4 2 4 3 3 2 3 4
0.9% 0.4% 0.0% 0.0% 0.0% 0.0% 0.6% 0.5% 1.9%5 1 0 0 0 0 2 7 15
0.0%0
0.0% 0.0% 0.0% 5.0% 10.0% 0.0% 0.0% 0.0% 0.0% 0.0%0 0 0 1 1 0 0 0 0 0
0.2%1
0.7%4
0.0%0
33.3%2
Lincosamides Clindamycin 4.3% 4.3% 5.6% 3.2% 2.4% 3.5% 3.8% 2.9% 14.1% 21.5% 10.8% 3.2% (MIC > 0.5 µg/ml) 14 13 18 25 17 35 39 39 163 274 129 38
2.2% 1.2% 0.7% 0.6% 1.8% 1.5% 0.6% 1.0% 1.2% 1.2%11 5 3 2 6 6 2 4 5 5
2.9% 2.7% 1.8% 1.1% 0.4% 0.0% 1.3% 0.0% 0.0% 1.2% 1.0% 2.4%15 10 9 6 1 0 1 0 0 4 14 19
0.0%0
14.3% 0.0% 0.0% 5.0% 10.0% 11.1% 0.0% 0.0% 0.0% 0.0%1 0 0 1 1 1 0 0 0 0
1.3%7
1.3%7
0.0%0
33.3%2
2 Beginning in 2008, retail ground beef and retail pork chops were no longer tested for Campylobacter due to low isolation in previous years. Data for these retail meats can be found in prior reports.
Swin
e Cecal (Market Hogs)
Cecal (Sows)
Cat
tle
Cecal (Beef)
Cecal (Dairy)
1 Percent resistance for gentamicin, clindamycin, azithromycin, erythromycin, nalidixic acid, and doxycycline in this report may differ from previously published percentages because breakpoints have been revised for these antimicrobials
Turk
eys Retail Ground Turkey
Cecal
Chi
cken
s
Retail Chickens
HACCP
Cecal
Swin
e Cecal (Market Hogs)
Cecal (Sows)
Humans
Cat
tle
Cecal (Beef)
Cecal (Dairy)
Turk
eys Retail Ground Turkey
Cecal
Chi
cken
s
Retail Chickens
HACCP
Cecal
Swin
e Cecal (Market Hogs)
Cecal (Sows)
Humans
Cat
tle
Cecal (Beef)
Cecal (Dairy)
Turk
eys Retail Ground Turkey
Cecal
Swin
e
Humans
Chi
cken
s
Retail Chickens
Cecal
Resistance by Year
Table 76a. Antimicrobial Resistance among Campylobacter jejuni Isolates, 2002-2013
Humans
Chi
cken
sTu
rkey
sC
attle
HACCP
150
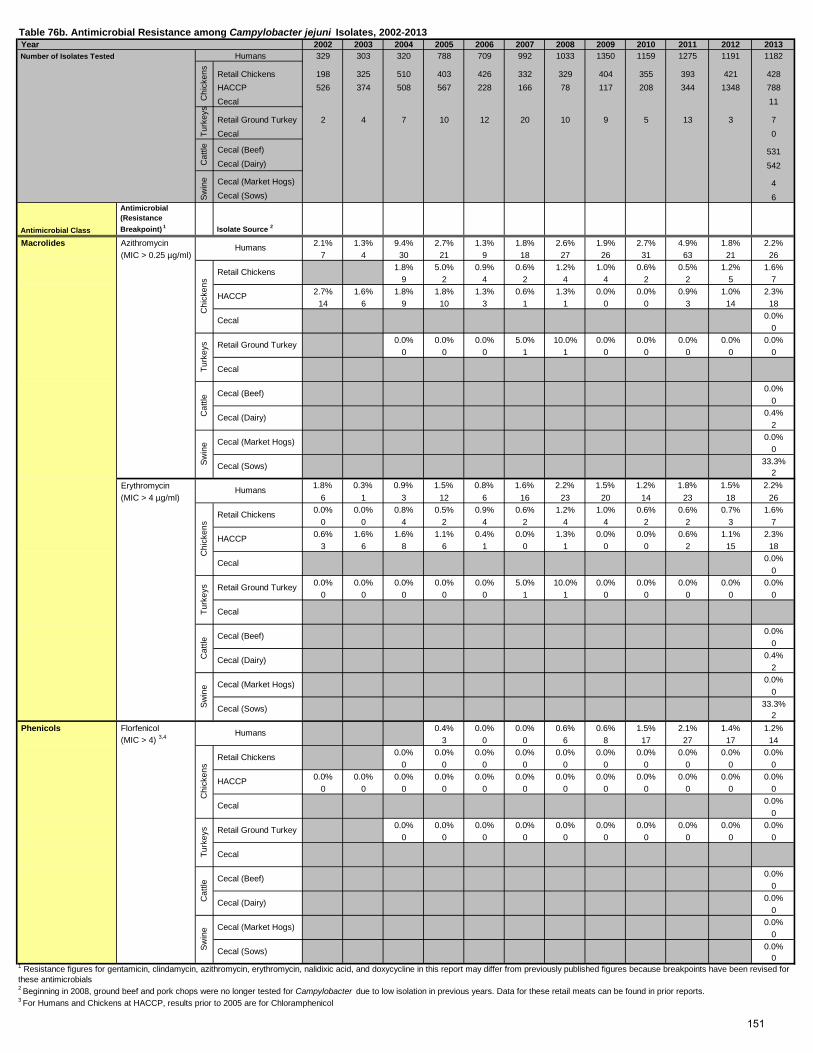
Year 2002 2003 2004 2005 2006 2007 2008 2009 2010 2011 2012 2013 Number of Isolates Tested 329 303 320 788 709 992 1033 1350 1159 1275 1191 1182
Retail Chickens 198 325 510 403 426 332 329 404 355 393 421 428 HACCP 526 374 508 567 228 166 78 117 208 344 1348 788 Cecal 11
Retail Ground Turkey 2 4 7 10 12 20 10 9 5 13 3 7 Cecal 0
Cecal (Beef) 531 Cecal (Dairy) 542
Cecal (Market Hogs) 4 Cecal (Sows) 6
Antimicrobial Class
Antimicrobial (Resistance Breakpoint)
1 Isolate Source 2
Macrolides Azithromycin 2.1% 1.3% 9.4% 2.7% 1.3% 1.8% 2.6% 1.9% 2.7% 4.9% 1.8% 2.2% (MIC > 0.25 µg/ml) 7 4 30 21 9 18 27 26 31 63 21 26
1.8% 5.0% 0.9% 0.6% 1.2% 1.0% 0.6% 0.5% 1.2% 1.6%9 2 4 2 4 4 2 2 5 7
2.7% 1.6% 1.8% 1.8% 1.3% 0.6% 1.3% 0.0% 0.0% 0.9% 1.0% 2.3%14 6 9 10 3 1 1 0 0 3 14 18
0.0%0
0.0% 0.0% 0.0% 5.0% 10.0% 0.0% 0.0% 0.0% 0.0% 0.0%0 0 0 1 1 0 0 0 0 0
0.0%0
0.4%2
0.0%0
33.3%2
Erythromycin 1.8% 0.3% 0.9% 1.5% 0.8% 1.6% 2.2% 1.5% 1.2% 1.8% 1.5% 2.2% (MIC > 4 µg/ml) 6 1 3 12 6 16 23 20 14 23 18 26
0.0% 0.0% 0.8% 0.5% 0.9% 0.6% 1.2% 1.0% 0.6% 0.6% 0.7% 1.6%0 0 4 2 4 2 4 4 2 2 3 7
0.6% 1.6% 1.6% 1.1% 0.4% 0.0% 1.3% 0.0% 0.0% 0.6% 1.1% 2.3%3 6 8 6 1 0 1 0 0 2 15 18
0.0%0
0.0% 0.0% 0.0% 0.0% 0.0% 5.0% 10.0% 0.0% 0.0% 0.0% 0.0% 0.0%0 0 0 0 0 1 1 0 0 0 0 0
0.0%0
0.4%2
0.0%0
33.3%2
Phenicols Florfenicol 0.4% 0.0% 0.0% 0.6% 0.6% 1.5% 2.1% 1.4% 1.2% (MIC > 4) 3,4 3 0 0 6 8 17 27 17 14
0.0% 0.0% 0.0% 0.0% 0.0% 0.0% 0.0% 0.0% 0.0% 0.0%0 0 0 0 0 0 0 0 0 0
0.0% 0.0% 0.0% 0.0% 0.0% 0.0% 0.0% 0.0% 0.0% 0.0% 0.0% 0.0%0 0 0 0 0 0 0 0 0 0 0 0
0.0%0
0.0% 0.0% 0.0% 0.0% 0.0% 0.0% 0.0% 0.0% 0.0% 0.0%0 0 0 0 0 0 0 0 0 0
0.0%0
0.0%0
0.0%0
0.0%0
1 Resistance figures for gentamicin, clindamycin, azithromycin, erythromycin, nalidixic acid, and doxycycline in this report may differ from previously published figures because breakpoints have been revised for these antimicrobials2 Beginning in 2008, ground beef and pork chops were no longer tested for Campylobacter due to low isolation in previous years. Data for these retail meats can be found in prior reports.3 For Humans and Chickens at HACCP, results prior to 2005 are for Chloramphenicol
Swin
e Cecal (Market Hogs)
Cecal (Sows)
Cat
tle
Cecal (Beef)
Cecal (Dairy)
Turk
eys Retail Ground Turkey
Cecal
Chi
cken
s
Retail Chickens
HACCP
Cecal
Swin
e Cecal (Market Hogs)
Cecal (Sows)
Humans
Cat
tle
Cecal (Beef)
Cecal (Dairy)
Turk
eys Retail Ground Turkey
Cecal
Chi
cken
s
HACCP
Cecal
Retail Chickens
Swin
e Cecal (Market Hogs)
Cecal (Sows)
Humans
Cat
tle
Cecal (Beef)
Cecal (Dairy)
Turk
eys Retail Ground Turkey
Cecal
Humans
Chi
cken
s
Retail Chickens
HACCP
Cecal
Turk
eys
Cat
tleSw
ine
Table 76b. Antimicrobial Resistance among Campylobacter jejuni Isolates, 2002-2013
Humans
Chi
cken
s
151
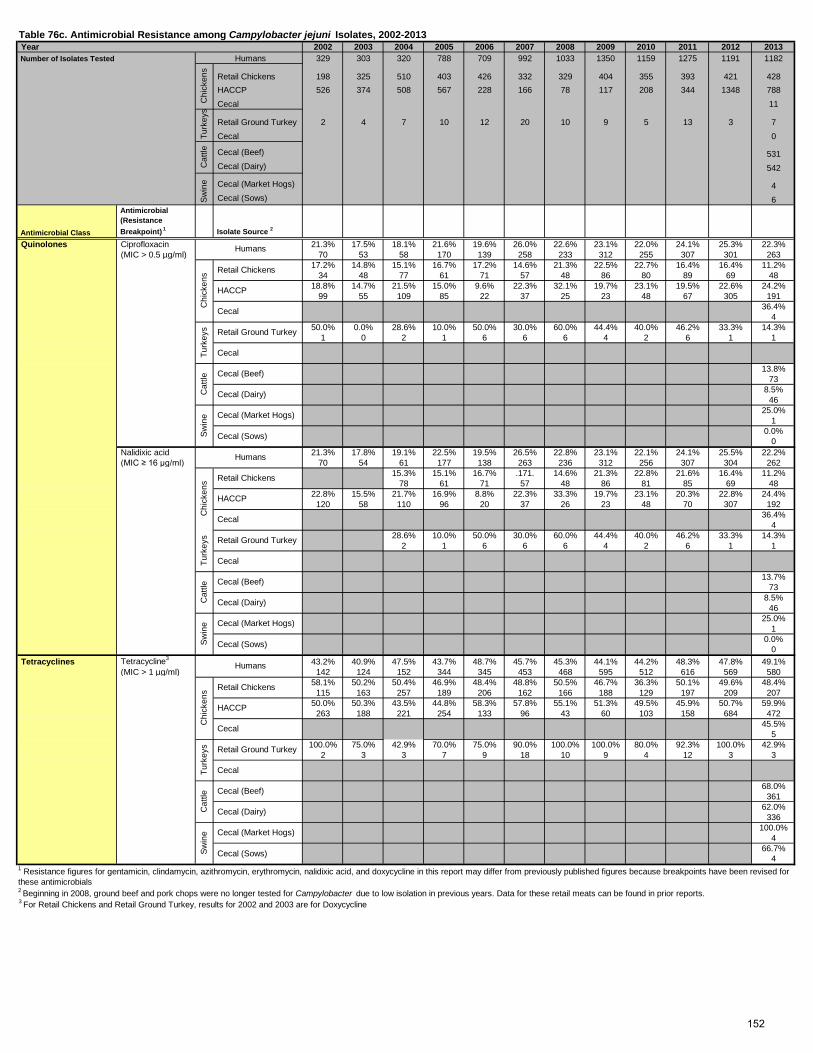
Year 2002 2003 2004 2005 2006 2007 2008 2009 2010 2011 2012 2013 Number of Isolates Tested 329 303 320 788 709 992 1033 1350 1159 1275 1191 1182
Retail Chickens 198 325 510 403 426 332 329 404 355 393 421 428 HACCP 526 374 508 567 228 166 78 117 208 344 1348 788 Cecal 11
Retail Ground Turkey 2 4 7 10 12 20 10 9 5 13 3 7 Cecal 0
Cecal (Beef) 531 Cecal (Dairy) 542
Cecal (Market Hogs) 4 Cecal (Sows) 6
Antimicrobial Class
Antimicrobial (Resistance Breakpoint)
1 Isolate Source 2
Quinolones Ciprofloxacin 21.3% 17.5% 18.1% 21.6% 19.6% 26.0% 22.6% 23.1% 22.0% 24.1% 25.3% 22.3% (MIC > 0.5 µg/ml) 70 53 58 170 139 258 233 312 255 307 301 263
17.2% 14.8% 15.1% 16.7% 17.2% 14.6% 21.3% 22.5% 22.7% 16.4% 16.4% 11.2%34 48 77 61 71 57 48 86 80 89 69 48
18.8% 14.7% 21.5% 15.0% 9.6% 22.3% 32.1% 19.7% 23.1% 19.5% 22.6% 24.2%99 55 109 85 22 37 25 23 48 67 305 191
36.4%4
50.0% 0.0% 28.6% 10.0% 50.0% 30.0% 60.0% 44.4% 40.0% 46.2% 33.3% 14.3%1 0 2 1 6 6 6 4 2 6 1 1
13.8%73
8.5%46
25.0%1
0.0%0
Nalidixic acid 21.3% 17.8% 19.1% 22.5% 19.5% 26.5% 22.8% 23.1% 22.1% 24.1% 25.5% 22.2% (MIC ≥ 16 µg/ml) 70 54 61 177 138 263 236 312 256 307 304 262
15.3% 15.1% 16.7% .171. 14.6% 21.3% 22.8% 21.6% 16.4% 11.2%78 61 71 57 48 86 81 85 69 48
22.8% 15.5% 21.7% 16.9% 8.8% 22.3% 33.3% 19.7% 23.1% 20.3% 22.8% 24.4%120 58 110 96 20 37 26 23 48 70 307 192
36.4%4
28.6% 10.0% 50.0% 30.0% 60.0% 44.4% 40.0% 46.2% 33.3% 14.3%2 1 6 6 6 4 2 6 1 1
13.7%73
8.5%46
25.0%1
0.0%0
Tetracyclines Tetracycline3 43.2% 40.9% 47.5% 43.7% 48.7% 45.7% 45.3% 44.1% 44.2% 48.3% 47.8% 49.1% (MIC > 1 µg/ml) 142 124 152 344 345 453 468 595 512 616 569 580
58.1% 50.2% 50.4% 46.9% 48.4% 48.8% 50.5% 46.7% 36.3% 50.1% 49.6% 48.4%115 163 257 189 206 162 166 188 129 197 209 207
50.0% 50.3% 43.5% 44.8% 58.3% 57.8% 55.1% 51.3% 49.5% 45.9% 50.7% 59.9%263 188 221 254 133 96 43 60 103 158 684 472
45.5%5
100.0% 75.0% 42.9% 70.0% 75.0% 90.0% 100.0% 100.0% 80.0% 92.3% 100.0% 42.9%2 3 3 7 9 18 10 9 4 12 3 3
68.0%361
62.0%336
100.0%4
66.7%4
3 For Retail Chickens and Retail Ground Turkey, results for 2002 and 2003 are for Doxycycline
1 Resistance figures for gentamicin, clindamycin, azithromycin, erythromycin, nalidixic acid, and doxycycline in this report may differ from previously published figures because breakpoints have been revised for these antimicrobials2 Beginning in 2008, ground beef and pork chops were no longer tested for Campylobacter due to low isolation in previous years. Data for these retail meats can be found in prior reports.
Swin
e Cecal (Market Hogs)
Cecal (Sows)
Cat
tle Cecal (Beef)
Cecal (Dairy)
Turk
eys Retail Ground Turkey
Cecal
Chi
cken
s Retail Chickens
HACCP
Cecal
Swin
e Cecal (Market Hogs)
Cecal (Sows)
Humans
Cat
tle Cecal (Beef)
Cecal (Dairy)
Turk
eys Retail Ground Turkey
Cecal
Chi
cken
s Retail Chickens
HACCP
Cecal
Swin
e Cecal (Market Hogs)
Cecal (Sows)
Humans
Cat
tle Cecal (Beef)
Cecal (Dairy)
CecalTurk
eys Retail Ground Turkey
HACCP
Turk
eys
Cat
tleSw
ine
Humans
Chi
cken
s Retail Chickens
Cecal
Table 76c. Antimicrobial Resistance among Campylobacter jejuni Isolates, 2002-2013
Humans
Chi
cken
s
152
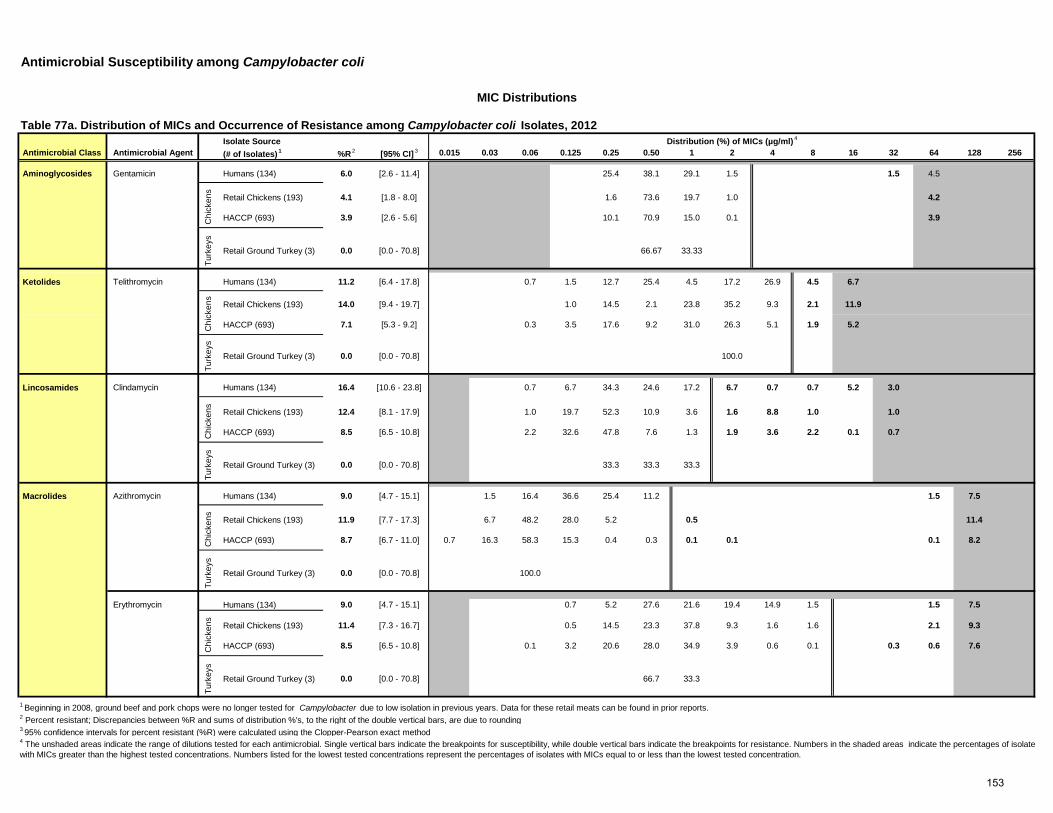
Isolate Source Antimicrobial Class Antimicrobial Agent (# of Isolates)
1 %R 2 [95% CI]
3 0.015 0.03 0.06 0.125 0.25 0.50 1 2 4 8 16 32 64 128 256
Aminoglycosides Gentamicin Humans (134) 6.0 [2.6 - 11.4] 25.4 38.1 29.1 1.5 1.5 4.5
Retail Chickens (193) 4.1 [1.8 - 8.0] 1.6 73.6 19.7 1.0 4.2
HACCP (693) 3.9 [2.6 - 5.6] 10.1 70.9 15.0 0.1 3.9Tu
rkey
s
Retail Ground Turkey (3) 0.0 [0.0 - 70.8] 66.67 33.33
Ketolides Telithromycin Humans (134) 11.2 [6.4 - 17.8] 0.7 1.5 12.7 25.4 4.5 17.2 26.9 4.5 6.7
Retail Chickens (193) 14.0 [9.4 - 19.7] 1.0 14.5 2.1 23.8 35.2 9.3 2.1 11.9
HACCP (693) 7.1 [5.3 - 9.2] 0.3 3.5 17.6 9.2 31.0 26.3 5.1 1.9 5.2
Turk
eys
Retail Ground Turkey (3) 0.0 [0.0 - 70.8] 100.0
Lincosamides Clindamycin Humans (134) 16.4 [10.6 - 23.8] 0.7 6.7 34.3 24.6 17.2 6.7 0.7 0.7 5.2 3.0
Retail Chickens (193) 12.4 [8.1 - 17.9] 1.0 19.7 52.3 10.9 3.6 1.6 8.8 1.0 1.0
HACCP (693) 8.5 [6.5 - 10.8] 2.2 32.6 47.8 7.6 1.3 1.9 3.6 2.2 0.1 0.7
Turk
eys
Retail Ground Turkey (3) 0.0 [0.0 - 70.8] 33.3 33.3 33.3
Macrolides Azithromycin Humans (134) 9.0 [4.7 - 15.1] 1.5 16.4 36.6 25.4 11.2 1.5 7.5
Retail Chickens (193) 11.9 [7.7 - 17.3] 6.7 48.2 28.0 5.2 0.5 11.4
HACCP (693) 8.7 [6.7 - 11.0] 0.7 16.3 58.3 15.3 0.4 0.3 0.1 0.1 0.1 8.2
Turk
eys
Retail Ground Turkey (3) 0.0 [0.0 - 70.8] 100.0
Erythromycin Humans (134) 9.0 [4.7 - 15.1] 0.7 5.2 27.6 21.6 19.4 14.9 1.5 1.5 7.5
Retail Chickens (193) 11.4 [7.3 - 16.7] 0.5 14.5 23.3 37.8 9.3 1.6 1.6 2.1 9.3
HACCP (693) 8.5 [6.5 - 10.8] 0.1 3.2 20.6 28.0 34.9 3.9 0.6 0.1 0.3 0.6 7.6
Turk
eys
Retail Ground Turkey (3) 0.0 [0.0 - 70.8] 66.7 33.3
1 Beginning in 2008, ground beef and pork chops were no longer tested for Campylobacter due to low isolation in previous years. Data for these retail meats can be found in prior reports.2 Percent resistant; Discrepancies between %R and sums of distribution %'s, to the right of the double vertical bars, are due to rounding3 95% confidence intervals for percent resistant (%R) were calculated using the Clopper-Pearson exact method
Antimicrobial Susceptibility among Campylobacter coli
MIC Distributions
Table 77a. Distribution of MICs and Occurrence of Resistance among Campylobacter coli Isolates, 2012 Distribution (%) of MICs (µg/ml)
4
Chi
cken
sC
hick
ens
Chi
cken
sC
hick
ens
Chi
cken
s
4 The unshaded areas indicate the range of dilutions tested for each antimicrobial. Single vertical bars indicate the breakpoints for susceptibility, while double vertical bars indicate the breakpoints for resistance. Numbers in the shaded areas indicate the percentages of isolate with MICs greater than the highest tested concentrations. Numbers listed for the lowest tested concentrations represent the percentages of isolates with MICs equal to or less than the lowest tested concentration.
153
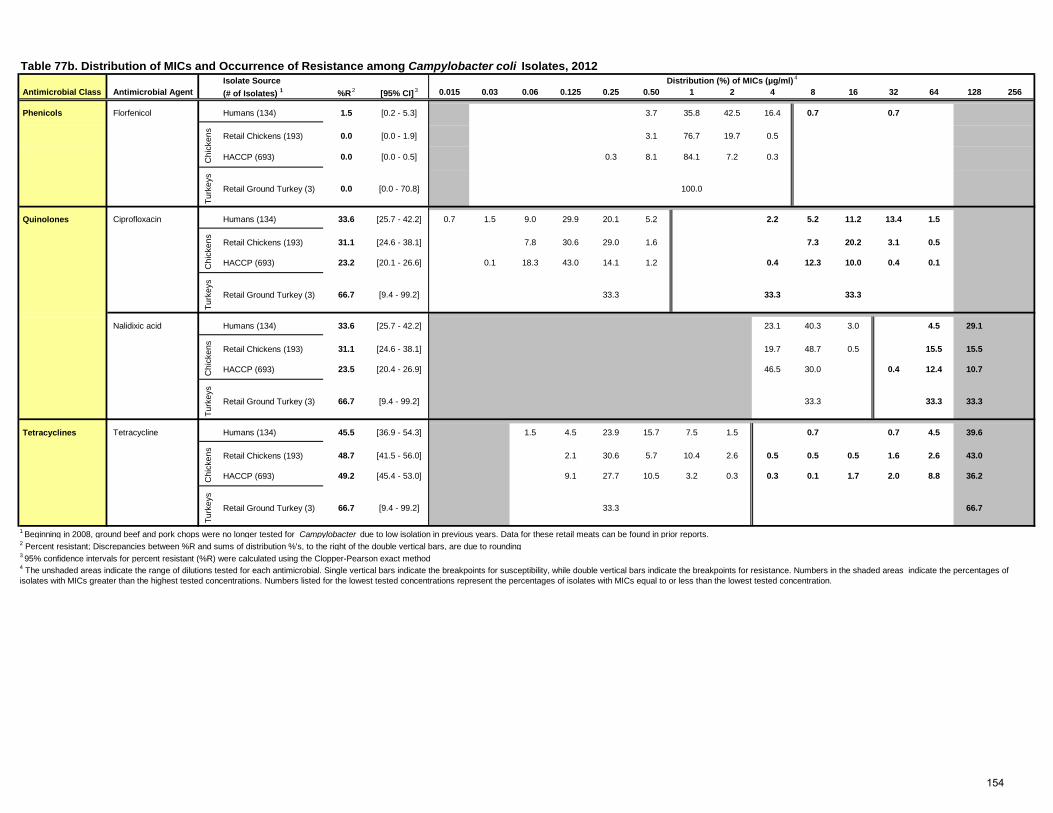
Isolate Source Antimicrobial Class Antimicrobial Agent (# of Isolates) 1 %R
2 [95% CI] 3 0.015 0.03 0.06 0.125 0.25 0.50 1 2 4 8 16 32 64 128 256
Phenicols Florfenicol Humans (134) 1.5 [0.2 - 5.3] 3.7 35.8 42.5 16.4 0.7 0.7
Retail Chickens (193) 0.0 [0.0 - 1.9] 3.1 76.7 19.7 0.5
HACCP (693) 0.0 [0.0 - 0.5] 0.3 8.1 84.1 7.2 0.3
Turk
eys
Retail Ground Turkey (3) 0.0 [0.0 - 70.8] 100.0
Quinolones Ciprofloxacin Humans (134) 33.6 [25.7 - 42.2] 0.7 1.5 9.0 29.9 20.1 5.2 2.2 5.2 11.2 13.4 1.5
Retail Chickens (193) 31.1 [24.6 - 38.1] 7.8 30.6 29.0 1.6 7.3 20.2 3.1 0.5
HACCP (693) 23.2 [20.1 - 26.6] 0.1 18.3 43.0 14.1 1.2 0.4 12.3 10.0 0.4 0.1
Turk
eys
Retail Ground Turkey (3) 66.7 [9.4 - 99.2] 33.3 33.3 33.3
Nalidixic acid Humans (134) 33.6 [25.7 - 42.2] 23.1 40.3 3.0 4.5 29.1
Retail Chickens (193) 31.1 [24.6 - 38.1] 19.7 48.7 0.5 15.5 15.5
HACCP (693) 23.5 [20.4 - 26.9] 46.5 30.0 0.4 12.4 10.7
Turk
eys
Retail Ground Turkey (3) 66.7 [9.4 - 99.2] 33.3 33.3 33.3
Tetracyclines Tetracycline Humans (134) 45.5 [36.9 - 54.3] 1.5 4.5 23.9 15.7 7.5 1.5 0.7 0.7 4.5 39.6
Retail Chickens (193) 48.7 [41.5 - 56.0] 2.1 30.6 5.7 10.4 2.6 0.5 0.5 0.5 1.6 2.6 43.0
HACCP (693) 49.2 [45.4 - 53.0] 9.1 27.7 10.5 3.2 0.3 0.3 0.1 1.7 2.0 8.8 36.2
Turk
eys
Retail Ground Turkey (3) 66.7 [9.4 - 99.2] 33.3 66.7
1 Beginning in 2008, ground beef and pork chops were no longer tested for Campylobacter due to low isolation in previous years. Data for these retail meats can be found in prior reports.2 Percent resistant; Discrepancies between %R and sums of distribution %'s, to the right of the double vertical bars, are due to rounding3 95% confidence intervals for percent resistant (%R) were calculated using the Clopper-Pearson exact method
Chi
cken
sC
hick
ens
Chi
cken
sC
hick
ens
4 The unshaded areas indicate the range of dilutions tested for each antimicrobial. Single vertical bars indicate the breakpoints for susceptibility, while double vertical bars indicate the breakpoints for resistance. Numbers in the shaded areas indicate the percentages of isolates with MICs greater than the highest tested concentrations. Numbers listed for the lowest tested concentrations represent the percentages of isolates with MICs equal to or less than the lowest tested concentration.
Distribution (%) of MICs (µg/ml) 4
Table 77b. Distribution of MICs and Occurrence of Resistance among Campylobacter coli Isolates, 2012
154
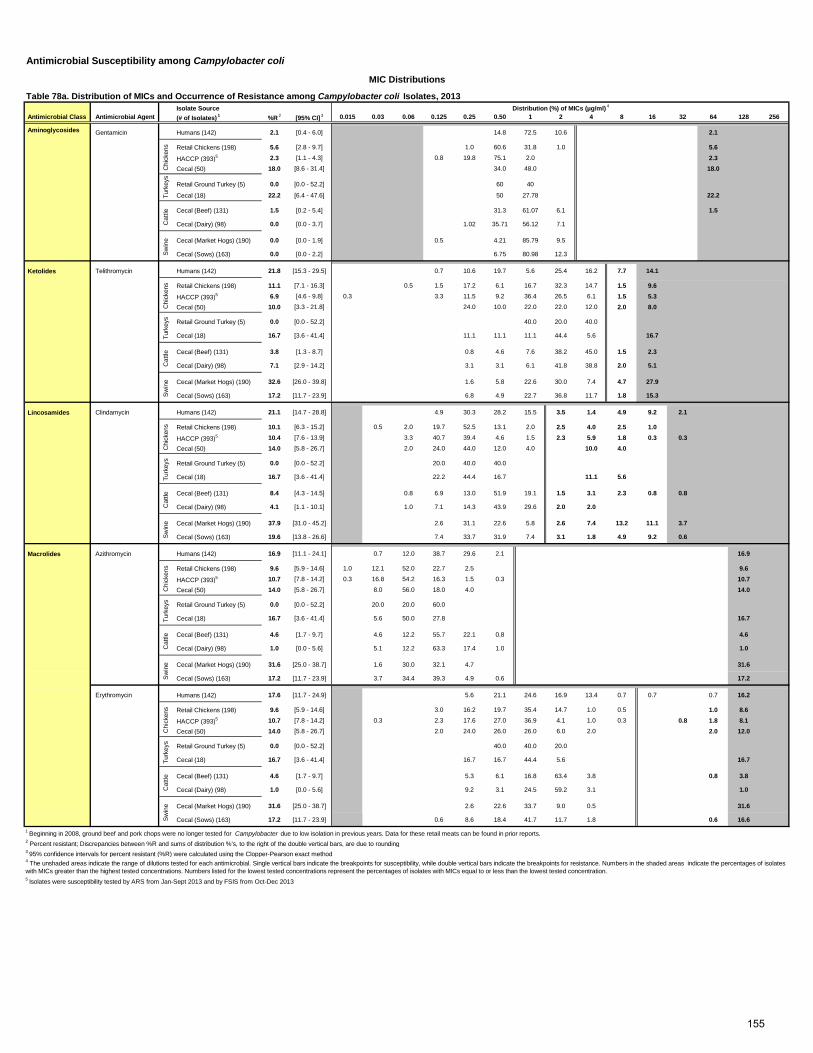
Isolate Source Antimicrobial Class Antimicrobial Agent (# of Isolates)
1 %R 2 [95% CI]
3 0.015 0.03 0.06 0.125 0.25 0.50 1 2 4 8 16 32 64 128 256
Aminoglycosides Gentamicin Humans (142) 2.1 [0.4 - 6.0] 14.8 72.5 10.6 2.1
Retail Chickens (198) 5.6 [2.8 - 9.7] 1.0 60.6 31.8 1.0 5.6
HACCP (393)5 2.3 [1.1 - 4.3] 0.8 19.8 75.1 2.0 2.3 Cecal (50) 18.0 [8.6 - 31.4] 34.0 48.0 18.0
Retail Ground Turkey (5) 0.0 [0.0 - 52.2] 60 40
Cecal (18) 22.2 [6.4 - 47.6] 50 27.78 22.2
Cecal (Beef) (131) 1.5 [0.2 - 5.4] 31.3 61.07 6.1 1.5
Cecal (Dairy) (98) 0.0 [0.0 - 3.7] 1.02 35.71 56.12 7.1
Cecal (Market Hogs) (190) 0.0 [0.0 - 1.9] 0.5 4.21 85.79 9.5
Cecal (Sows) (163) 0.0 [0.0 - 2.2] 6.75 80.98 12.3
Ketolides Telithromycin Humans (142) 21.8 [15.3 - 29.5] 0.7 10.6 19.7 5.6 25.4 16.2 7.7 14.1
Retail Chickens (198) 11.1 [7.1 - 16.3] 0.5 1.5 17.2 6.1 16.7 32.3 14.7 1.5 9.6
HACCP (393)5 6.9 [4.6 - 9.8] 0.3 3.3 11.5 9.2 36.4 26.5 6.1 1.5 5.3 Cecal (50) 10.0 [3.3 - 21.8] 24.0 10.0 22.0 22.0 12.0 2.0 8.0
Retail Ground Turkey (5) 0.0 [0.0 - 52.2] 40.0 20.0 40.0
Cecal (18) 16.7 [3.6 - 41.4] 11.1 11.1 11.1 44.4 5.6 16.7
Cecal (Beef) (131) 3.8 [1.3 - 8.7] 0.8 4.6 7.6 38.2 45.0 1.5 2.3
Cecal (Dairy) (98) 7.1 [2.9 - 14.2] 3.1 3.1 6.1 41.8 38.8 2.0 5.1
Cecal (Market Hogs) (190) 32.6 [26.0 - 39.8] 1.6 5.8 22.6 30.0 7.4 4.7 27.9
Cecal (Sows) (163) 17.2 [11.7 - 23.9] 6.8 4.9 22.7 36.8 11.7 1.8 15.3
Lincosamides Clindamycin Humans (142) 21.1 [14.7 - 28.8] 4.9 30.3 28.2 15.5 3.5 1.4 4.9 9.2 2.1
Retail Chickens (198) 10.1 [6.3 - 15.2] 0.5 2.0 19.7 52.5 13.1 2.0 2.5 4.0 2.5 1.0
HACCP (393)5 10.4 [7.6 - 13.9] 3.3 40.7 39.4 4.6 1.5 2.3 5.9 1.8 0.3 0.3 Cecal (50) 14.0 [5.8 - 26.7] 2.0 24.0 44.0 12.0 4.0 10.0 4.0
Retail Ground Turkey (5) 0.0 [0.0 - 52.2] 20.0 40.0 40.0
Cecal (18) 16.7 [3.6 - 41.4] 22.2 44.4 16.7 11.1 5.6
Cecal (Beef) (131) 8.4 [4.3 - 14.5] 0.8 6.9 13.0 51.9 19.1 1.5 3.1 2.3 0.8 0.8
Cecal (Dairy) (98) 4.1 [1.1 - 10.1] 1.0 7.1 14.3 43.9 29.6 2.0 2.0
Cecal (Market Hogs) (190) 37.9 [31.0 - 45.2] 2.6 31.1 22.6 5.8 2.6 7.4 13.2 11.1 3.7
Cecal (Sows) (163) 19.6 [13.8 - 26.6] 7.4 33.7 31.9 7.4 3.1 1.8 4.9 9.2 0.6
Macrolides Azithromycin Humans (142) 16.9 [11.1 - 24.1] 0.7 12.0 38.7 29.6 2.1 16.9
Retail Chickens (198) 9.6 [5.9 - 14.6] 1.0 12.1 52.0 22.7 2.5 9.6
HACCP (393)5 10.7 [7.8 - 14.2] 0.3 16.8 54.2 16.3 1.5 0.3 10.7 Cecal (50) 14.0 [5.8 - 26.7] 8.0 56.0 18.0 4.0 14.0
Retail Ground Turkey (5) 0.0 [0.0 - 52.2] 20.0 20.0 60.0
Cecal (18) 16.7 [3.6 - 41.4] 5.6 50.0 27.8 16.7
Cecal (Beef) (131) 4.6 [1.7 - 9.7] 4.6 12.2 55.7 22.1 0.8 4.6
Cecal (Dairy) (98) 1.0 [0.0 - 5.6] 5.1 12.2 63.3 17.4 1.0 1.0
Cecal (Market Hogs) (190) 31.6 [25.0 - 38.7] 1.6 30.0 32.1 4.7 31.6
Cecal (Sows) (163) 17.2 [11.7 - 23.9] 3.7 34.4 39.3 4.9 0.6 17.2
Erythromycin Humans (142) 17.6 [11.7 - 24.9] 5.6 21.1 24.6 16.9 13.4 0.7 0.7 0.7 16.2
Retail Chickens (198) 9.6 [5.9 - 14.6] 3.0 16.2 19.7 35.4 14.7 1.0 0.5 1.0 8.6
HACCP (393)5 10.7 [7.8 - 14.2] 0.3 2.3 17.6 27.0 36.9 4.1 1.0 0.3 0.8 1.8 8.1 Cecal (50) 14.0 [5.8 - 26.7] 2.0 24.0 26.0 26.0 6.0 2.0 2.0 12.0
Retail Ground Turkey (5) 0.0 [0.0 - 52.2] 40.0 40.0 20.0
Cecal (18) 16.7 [3.6 - 41.4] 16.7 16.7 44.4 5.6 16.7
Cecal (Beef) (131) 4.6 [1.7 - 9.7] 5.3 6.1 16.8 63.4 3.8 0.8 3.8
Cecal (Dairy) (98) 1.0 [0.0 - 5.6] 9.2 3.1 24.5 59.2 3.1 1.0
Cecal (Market Hogs) (190) 31.6 [25.0 - 38.7] 2.6 22.6 33.7 9.0 0.5 31.6
Cecal (Sows) (163) 17.2 [11.7 - 23.9] 0.6 8.6 18.4 41.7 11.7 1.8 0.6 16.61 Beginning in 2008, ground beef and pork chops were no longer tested for Campylobacter due to low isolation in previous years. Data for these retail meats can be found in prior reports.2 Percent resistant; Discrepancies between %R and sums of distribution %'s, to the right of the double vertical bars, are due to rounding3 95% confidence intervals for percent resistant (%R) were calculated using the Clopper-Pearson exact method
5 Isolates were susceptibility tested by ARS from Jan-Sept 2013 and by FSIS from Oct-Dec 2013
Sw
ine
4 The unshaded areas indicate the range of dilutions tested for each antimicrobial. Single vertical bars indicate the breakpoints for susceptibility, while double vertical bars indicate the breakpoints for resistance. Numbers in the shaded areas indicate the percentages of isolates with MICs greater than the highest tested concentrations. Numbers listed for the lowest tested concentrations represent the percentages of isolates with MICs equal to or less than the lowest tested concentration.
Cat
tleS
win
eC
hick
ens
Turk
eys
Cat
tleS
win
eC
hick
ens
Turk
eys
Cat
tleS
win
eC
hick
ens
Turk
eys
Cat
tle
Antimicrobial Susceptibility among Campylobacter coli
MIC Distributions
Table 78a. Distribution of MICs and Occurrence of Resistance among Campylobacter coli Isolates, 2013 Distribution (%) of MICs (µg/ml)
4
Chi
cken
sC
attle
Sw
ine
Chi
cken
sTu
rkey
sTu
rkey
s
155

Isolate Source Antimicrobial Class Antimicrobial Agent (# of Isolates) 1 %R
2 [95% CI] 3 0.015 0.03 0.06 0.125 0.25 0.50 1 2 4 8 16 32 64 128 256
Phenicols Florfenicol Humans (142) 0.7 [0.0 - 3.9] 1.4 35.9 49.3 12.7 0.7
Retail Chickens (198) 0.0 [0.0 - 1.8] 5.1 82.3 12.6
HACCP (393)5 0.0 [0.0 - 0.9] 0.3 0.5 6.4 84.7 7.6 0.5
Cecal (50) 0.0 [0.0 - 7.1] 2.0 80.0 16.0 2.0
Retail Ground Turkey (5) 0.0 [0.0 - 52.2] 40.0 60.0
Cecal (18) 0.0 [0.0 - 18.5] 88.9 5.6 5.6
Cecal (Beef) (131) 1.5 [0.2 - 5.4] 6.9 51.2 40.5 0.8 0.8
Cecal (Dairy) (98) 0.0 [0.0 - 3.7] 1.0 52.0 45.9 1.0
Cecal (Market Hogs) (190) 0.0 [0.0 - 1.9] 19.5 70.0 10.5
Cecal (Sows) (163) 0.0 [0.0 - 2.2] 11.0 78.5 10.4
Quinolones Ciprofloxacin Humans (142) 34.5 [26.7 - 42.9] 4.2 26.1 28.2 7.0 0.7 7.0 13.4 10.6 2.1 0.7
Retail Chickens (198) 20.2 [14.8 - 26.5] 0.5 7.6 33.8 36.4 1.5 6.1 10.6 3.0 0.5
HACCP (393)5 21.9 [17.9 - 26.3] 0.5 14.2 43.0 19.6 0.8 1.0 12.5 7.9 0.3 0.3 Cecal (50) 24.0 [13.1 - 38.2] 6.0 34.0 34.0 2.0 6.0 16.0 2.0
Retail Ground Turkey (5) 0.0 [0.0 - 52.2] 40.0 60.0
Cecal (18) 66.7 [41.0 - 86.7] 11.1 22.2 5.6 38.9 22.2
Cecal (Beef) (131) 52.7 [43.8 - 61.5] 0.8 3.1 30.5 12.2 0.8 6.9 33.6 9.2 3.1
Cecal (Dairy) (98) 30.6 [21.7 - 40.7] 1.0 7.1 48.0 13.3 1.0 1.0 19.4 9.2
Cecal (Market Hogs) (190) 7.4 [4.1 - 12.1] 9.0 53.2 28.4 2.1 1.6 4.7 0.5 0.5
Cecal (Sows) (163) 3.7 [1.4 - 7.8] 6.8 60.7 27.0 1.8 0.6 1.8 1.2
Nalidixic acid Humans (142) 35.2 [27.4 - 43.7] 19.0 38.7 7.0 0.7 3.5 31.0
Retail Chickens (198) 20.2 [14.8 - 26.5] 37.9 41.4 0.5 1.0 13.1 6.1
HACCP (393)5 22.1 [18.1 - 26.6] 53.7 23.4 0.8 0.8 11.2 10.2 Cecal (50) 24.0 [13.1 - 38.2] 40.0 34.0 2.0 12.0 12.0
Retail Ground Turkey (5) 0.0 [0.0 - 52.2] 100.0
Cecal (18) 66.7 [41.0 - 86.7] 5.6 27.8 55.6 11.1
Cecal (Beef) (131) 52.7 [43.8 - 61.5] 6.9 24.4 16.0 0.8 3.8 48.1
Cecal (Dairy) (98) 29.6 [20.8 - 39.7] 10.2 39.8 20.4 4.1 25.5
Cecal (Market Hogs) (190) 7.4 [4.1 - 12.1] 17.9 70.5 4.2 1.1 6.3
Cecal (Sows) (163) 3.7 [1.4 - 7.8] 21.5 72.4 2.5 0.6 3.1
Tetracyclines Tetracycline Humans (142) 51.4 [42.9 - 59.9] 4.2 21.8 16.9 5.6 0.7 50.7
Retail Chickens (198) 47.0 [39.9 - 54.2] 2.5 30.3 17.2 3.0 0.5 2.5 2.0 5.1 36.9
HACCP (393)5 58.5 [53.5 - 63.4] 0.3 5.6 23.2 10.2 1.5 0.8 0.5 0.3 1.5 6.4 17.0 32.8 Cecal (50) 52.0 [37.4 - 66.3] 4.0 26.0 12.0 6.0 2.0 10.0 40.0
Retail Ground Turkey (5) 40.0 [5.3 - 85.3] 40.0 20.0 40.0
Cecal (18) 77.8 [52.4 - 93.6] 5.6 16.7 5.6 16.7 55.6
Cecal (Beef) (131) 74.0 [65.7 - 81.3] 1.5 3.1 11.5 9.9 2.3 1.5 3.8 66.4
Cecal (Dairy) (98) 65.3 [55.0 - 74.6] 4.1 21.4 9.2 1.0 1.0 5.1 58.2
Cecal (Market Hogs) (190) 84.2 [78.2 - 89.1] 1.1 7.9 4.2 2.1 0.5 1.6 4.7 12.1 12.6 14.7 38.4
Cecal (Sows) (163) 76.7 [69.4 - 82.9] 0.6 9.8 9.8 1.8 1.2 2.5 6.1 11.7 11.7 16.6 28.21 Beginning in 2008, ground beef and pork chops were no longer tested for Campylobacter due to low isolation in previous years. Data for these retail meats can be found in prior reports.2 Percent resistant; Discrepancies between %R and sums of distribution %'s, to the right of the double vertical bars, are due to rounding3 95% confidence intervals for percent resistant (%R) were calculated using the Clopper-Pearson exact method
5 Isolates were susceptibility tested by ARS from Jan-Sept 2013 and by FSIS from Oct-Dec 2013
4 The unshaded areas indicate the range of dilutions tested for each antimicrobial. Single vertical bars indicate the breakpoints for susceptibility, while double vertical bars indicate the breakpoints for resistance. Numbers in the shaded areas indicate the percentages of isolates with MICs greater than the highest tested concentrations. Numbers listed for the lowest tested concentrations represent the percentages of isolates with MICs equal to or less than the lowest tested concentration.
Turk
eys
Cat
tleS
win
eS
win
eC
hick
ens
Turk
eys
Cat
tleS
win
eC
hick
ens
Cat
tle
Table 78b. Distribution of MICs and Occurrence of Resistance among Campylobacter coli Isolates, 2013 Distribution (%) of MICs (µg/ml)
4
Chi
cken
sTu
rkey
sC
attle
Sw
ine
Chi
cken
sTu
rkey
s
156
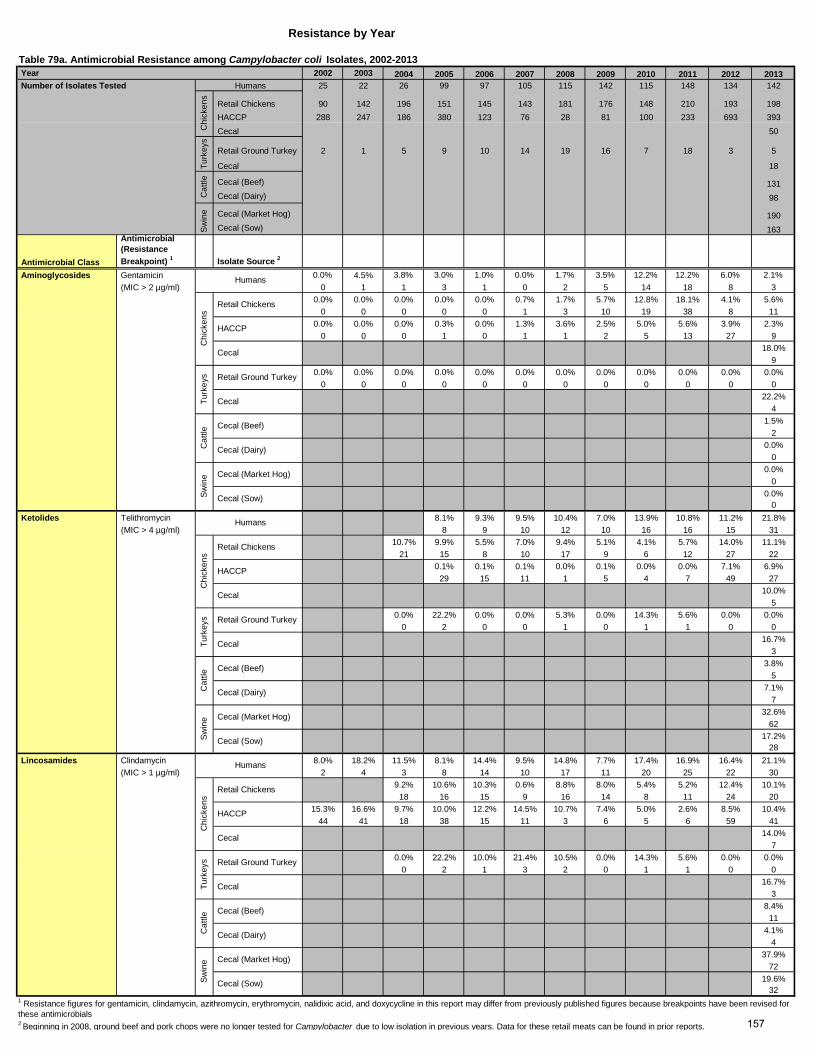
Year 2002 2003 2004 2005 2006 2007 2008 2009 2010 2011 2012 2013 Number of Isolates Tested 25 22 26 99 97 105 115 142 115 148 134 142
Retail Chickens 90 142 196 151 145 143 181 176 148 210 193 198 HACCP 288 247 186 380 123 76 28 81 100 233 693 393 Cecal 50
Retail Ground Turkey 2 1 5 9 10 14 19 16 7 18 3 5
Cecal 18
Cecal (Beef) 131 Cecal (Dairy) 98
Cecal (Market Hog) 190 Cecal (Sow) 163
Antimicrobial Class
Antimicrobial (Resistance Breakpoint) 1 Isolate Source 2
Aminoglycosides Gentamicin 0.0% 4.5% 3.8% 3.0% 1.0% 0.0% 1.7% 3.5% 12.2% 12.2% 6.0% 2.1% (MIC > 2 µg/ml) 0 1 1 3 1 0 2 5 14 18 8 3
0.0% 0.0% 0.0% 0.0% 0.0% 0.7% 1.7% 5.7% 12.8% 18.1% 4.1% 5.6%0 0 0 0 0 1 3 10 19 38 8 11
0.0% 0.0% 0.0% 0.3% 0.0% 1.3% 3.6% 2.5% 5.0% 5.6% 3.9% 2.3%0 0 0 1 0 1 1 2 5 13 27 9
18.0%9
0.0% 0.0% 0.0% 0.0% 0.0% 0.0% 0.0% 0.0% 0.0% 0.0% 0.0% 0.0%0 0 0 0 0 0 0 0 0 0 0 0
22.2%4
1.5%2
0.0%0
0.0%0
0.0%0
Ketolides Telithromycin 8.1% 9.3% 9.5% 10.4% 7.0% 13.9% 10.8% 11.2% 21.8% (MIC > 4 µg/ml) 8 9 10 12 10 16 16 15 31
10.7% 9.9% 5.5% 7.0% 9.4% 5.1% 4.1% 5.7% 14.0% 11.1%21 15 8 10 17 9 6 12 27 22
0.1% 0.1% 0.1% 0.0% 0.1% 0.0% 0.0% 7.1% 6.9%29 15 11 1 5 4 7 49 27
10.0%5
0.0% 22.2% 0.0% 0.0% 5.3% 0.0% 14.3% 5.6% 0.0% 0.0%0 2 0 0 1 0 1 1 0 0
16.7%3
3.8%5
7.1%7
32.6%62
17.2%28
Lincosamides Clindamycin 8.0% 18.2% 11.5% 8.1% 14.4% 9.5% 14.8% 7.7% 17.4% 16.9% 16.4% 21.1% (MIC > 1 µg/ml) 2 4 3 8 14 10 17 11 20 25 22 30
9.2% 10.6% 10.3% 0.6% 8.8% 8.0% 5.4% 5.2% 12.4% 10.1%18 16 15 9 16 14 8 11 24 20
15.3% 16.6% 9.7% 10.0% 12.2% 14.5% 10.7% 7.4% 5.0% 2.6% 8.5% 10.4%44 41 18 38 15 11 3 6 5 6 59 41
14.0%7
0.0% 22.2% 10.0% 21.4% 10.5% 0.0% 14.3% 5.6% 0.0% 0.0%0 2 1 3 2 0 1 1 0 0
16.7%3
8.4%11
4.1%4
37.9%72
19.6%32
2 Beginning in 2008, ground beef and pork chops were no longer tested for Campylobacter due to low isolation in previous years. Data for these retail meats can be found in prior reports.
Swin
e Cecal (Market Hog)
Cecal (Sow)
Cat
tle
Cecal (Beef)
Cecal (Dairy)
1 Resistance figures for gentamicin, clindamycin, azithromycin, erythromycin, nalidixic acid, and doxycycline in this report may differ from previously published figures because breakpoints have been revised for these antimicrobials
Turk
eys Retail Ground Turkey
Cecal
Chi
cken
s
Retail Chickens
HACCP
Cecal
Swin
e Cecal (Market Hog)
Cecal (Sow)
Humans
Cat
tle
Cecal (Beef)
Cecal (Dairy)
Turk
eys Retail Ground Turkey
Cecal
Chi
cken
s
Retail Chickens
HACCP
Cecal
Swin
e Cecal (Market Hog)
Cecal (Sow)
Humans
Cat
tle
Cecal (Beef)
Cecal (Dairy)
Turk
eys Retail Ground Turkey
Cecal
Swin
e
Humans
Chi
cken
s
Retail Chickens
Cecal
Resistance by Year
Table 79a. Antimicrobial Resistance among Campylobacter coli Isolates, 2002-2013
Humans
Chi
cken
sTu
rkey
sC
attle
HACCP
157
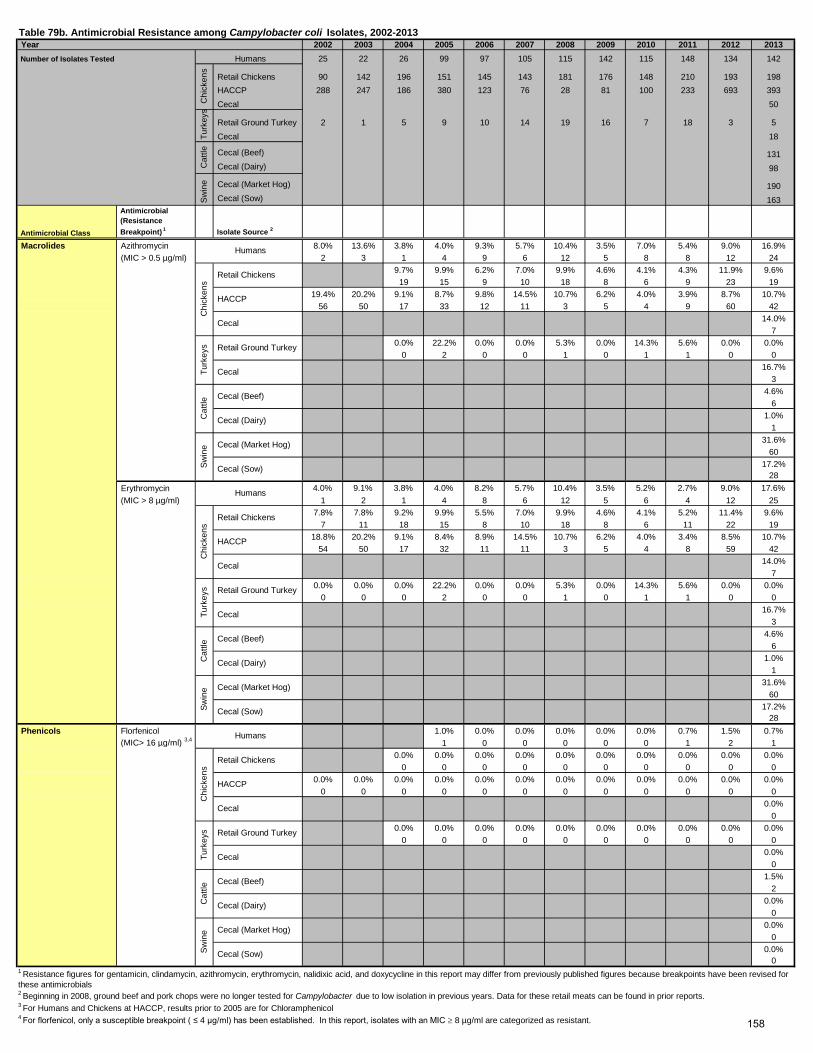
Year 2002 2003 2004 2005 2006 2007 2008 2009 2010 2011 2012 2013 Number of Isolates Tested 25 22 26 99 97 105 115 142 115 148 134 142
Retail Chickens 90 142 196 151 145 143 181 176 148 210 193 198 HACCP 288 247 186 380 123 76 28 81 100 233 693 393 Cecal 50
Retail Ground Turkey 2 1 5 9 10 14 19 16 7 18 3 5 Cecal 18
Cecal (Beef) 131 Cecal (Dairy) 98
Cecal (Market Hog) 190 Cecal (Sow) 163
Antimicrobial Class
Antimicrobial (Resistance Breakpoint)
1 Isolate Source 2
Macrolides Azithromycin 8.0% 13.6% 3.8% 4.0% 9.3% 5.7% 10.4% 3.5% 7.0% 5.4% 9.0% 16.9% (MIC > 0.5 µg/ml) 2 3 1 4 9 6 12 5 8 8 12 24
9.7% 9.9% 6.2% 7.0% 9.9% 4.6% 4.1% 4.3% 11.9% 9.6%19 15 9 10 18 8 6 9 23 19
19.4% 20.2% 9.1% 8.7% 9.8% 14.5% 10.7% 6.2% 4.0% 3.9% 8.7% 10.7%56 50 17 33 12 11 3 5 4 9 60 42
14.0%7
0.0% 22.2% 0.0% 0.0% 5.3% 0.0% 14.3% 5.6% 0.0% 0.0%0 2 0 0 1 0 1 1 0 0
16.7%3
4.6%6
1.0%1
31.6%60
17.2%28
Erythromycin 4.0% 9.1% 3.8% 4.0% 8.2% 5.7% 10.4% 3.5% 5.2% 2.7% 9.0% 17.6% (MIC > 8 µg/ml) 1 2 1 4 8 6 12 5 6 4 12 25
7.8% 7.8% 9.2% 9.9% 5.5% 7.0% 9.9% 4.6% 4.1% 5.2% 11.4% 9.6%7 11 18 15 8 10 18 8 6 11 22 19
18.8% 20.2% 9.1% 8.4% 8.9% 14.5% 10.7% 6.2% 4.0% 3.4% 8.5% 10.7%54 50 17 32 11 11 3 5 4 8 59 42
14.0%7
0.0% 0.0% 0.0% 22.2% 0.0% 0.0% 5.3% 0.0% 14.3% 5.6% 0.0% 0.0%0 0 0 2 0 0 1 0 1 1 0 0
16.7%3
4.6%6
1.0%1
31.6%60
17.2%28
Phenicols Florfenicol 1.0% 0.0% 0.0% 0.0% 0.0% 0.0% 0.7% 1.5% 0.7% (MIC> 16 µg/ml) 3,4 1 0 0 0 0 0 1 2 1
0.0% 0.0% 0.0% 0.0% 0.0% 0.0% 0.0% 0.0% 0.0% 0.0%0 0 0 0 0 0 0 0 0 0
0.0% 0.0% 0.0% 0.0% 0.0% 0.0% 0.0% 0.0% 0.0% 0.0% 0.0% 0.0%0 0 0 0 0 0 0 0 0 0 0 0
0.0%0
0.0% 0.0% 0.0% 0.0% 0.0% 0.0% 0.0% 0.0% 0.0% 0.0%0 0 0 0 0 0 0 0 0 0
0.0%0
1.5%2
0.0%0
0.0%0
0.0%0
1 Resistance figures for gentamicin, clindamycin, azithromycin, erythromycin, nalidixic acid, and doxycycline in this report may differ from previously published figures because breakpoints have been revised for these antimicrobials2 Beginning in 2008, ground beef and pork chops were no longer tested for Campylobacter due to low isolation in previous years. Data for these retail meats can be found in prior reports.3 For Humans and Chickens at HACCP, results prior to 2005 are for Chloramphenicol4 For florfenicol, only a susceptible breakpoint ( ≤ 4 µg/ml) has been established. In this report, isolates with an MIC ≥ 8 µg/ml are categorized as resistant.
Swin
e Cecal (Market Hog)
Cecal (Sow)
Cat
tle
Cecal (Beef)
Cecal (Dairy)
Turk
eys Retail Ground Turkey
Cecal
Chi
cken
s
Retail Chickens
HACCP
Cecal
Swin
e Cecal (Market Hog)
Cecal (Sow)
Humans
Cat
tle
Cecal (Beef)
Cecal (Dairy)
Turk
eys Retail Ground Turkey
Cecal
Chi
cken
s
HACCP
Cecal
Retail Chickens
Swin
e Cecal (Market Hog)
Cecal (Sow)
Humans
Cat
tle
Cecal (Beef)
Cecal (Dairy)
Turk
eys Retail Ground Turkey
Cecal
Humans
Chi
cken
s
Retail Chickens
HACCP
Cecal
Turk
eys
Cat
tleSw
ine
Table 79b. Antimicrobial Resistance among Campylobacter coli Isolates, 2002-2013
Humans
Chi
cken
s
158
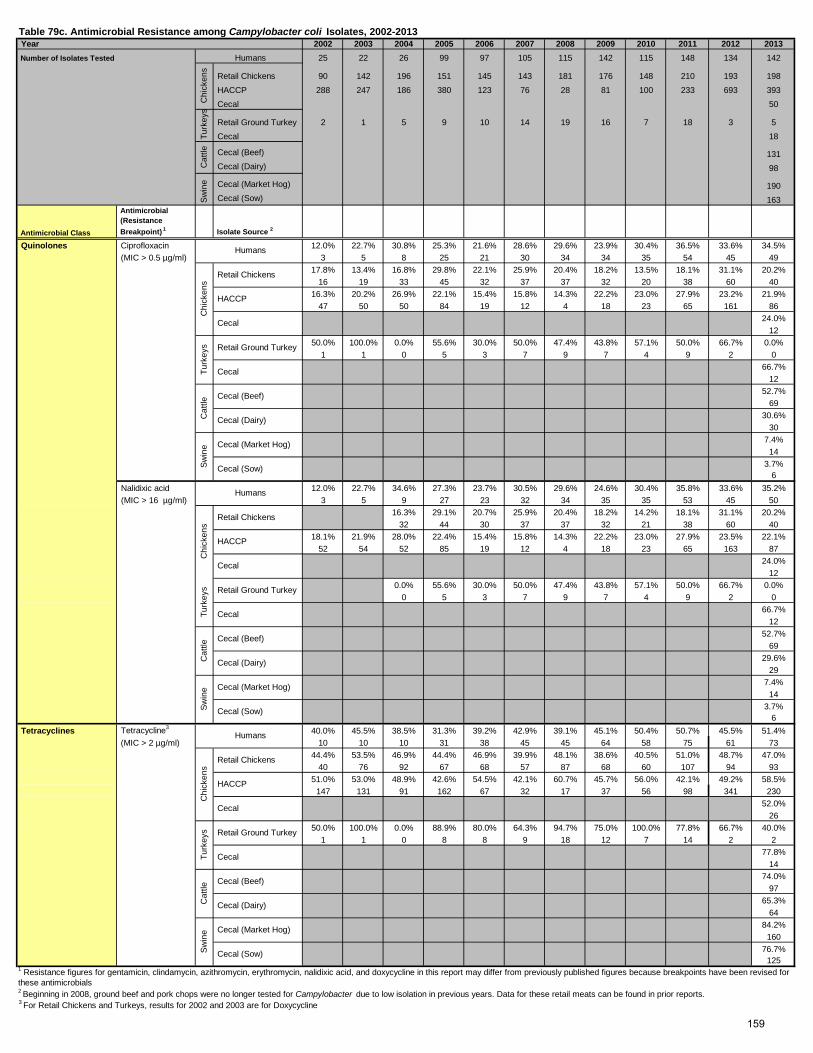
Year 2002 2003 2004 2005 2006 2007 2008 2009 2010 2011 2012 2013 Number of Isolates Tested 25 22 26 99 97 105 115 142 115 148 134 142
Retail Chickens 90 142 196 151 145 143 181 176 148 210 193 198 HACCP 288 247 186 380 123 76 28 81 100 233 693 393 Cecal 50
Retail Ground Turkey 2 1 5 9 10 14 19 16 7 18 3 5 Cecal 18
Cecal (Beef) 131 Cecal (Dairy) 98
Cecal (Market Hog) 190 Cecal (Sow) 163
Antimicrobial Class
Antimicrobial (Resistance Breakpoint)
1 Isolate Source 2
Quinolones Ciprofloxacin 12.0% 22.7% 30.8% 25.3% 21.6% 28.6% 29.6% 23.9% 30.4% 36.5% 33.6% 34.5% (MIC > 0.5 µg/ml) 3 5 8 25 21 30 34 34 35 54 45 49
17.8% 13.4% 16.8% 29.8% 22.1% 25.9% 20.4% 18.2% 13.5% 18.1% 31.1% 20.2%16 19 33 45 32 37 37 32 20 38 60 40
16.3% 20.2% 26.9% 22.1% 15.4% 15.8% 14.3% 22.2% 23.0% 27.9% 23.2% 21.9%47 50 50 84 19 12 4 18 23 65 161 86
24.0%12
50.0% 100.0% 0.0% 55.6% 30.0% 50.0% 47.4% 43.8% 57.1% 50.0% 66.7% 0.0%1 1 0 5 3 7 9 7 4 9 2 0
66.7%12
52.7%69
30.6%30
7.4%14
3.7%6
Nalidixic acid 12.0% 22.7% 34.6% 27.3% 23.7% 30.5% 29.6% 24.6% 30.4% 35.8% 33.6% 35.2% (MIC > 16 µg/ml) 3 5 9 27 23 32 34 35 35 53 45 50
16.3% 29.1% 20.7% 25.9% 20.4% 18.2% 14.2% 18.1% 31.1% 20.2%32 44 30 37 37 32 21 38 60 40
18.1% 21.9% 28.0% 22.4% 15.4% 15.8% 14.3% 22.2% 23.0% 27.9% 23.5% 22.1%52 54 52 85 19 12 4 18 23 65 163 87
24.0%12
0.0% 55.6% 30.0% 50.0% 47.4% 43.8% 57.1% 50.0% 66.7% 0.0%0 5 3 7 9 7 4 9 2 0
66.7%12
52.7%69
29.6%29
7.4%14
3.7%6
Tetracyclines Tetracycline3 40.0% 45.5% 38.5% 31.3% 39.2% 42.9% 39.1% 45.1% 50.4% 50.7% 45.5% 51.4% (MIC > 2 µg/ml) 10 10 10 31 38 45 45 64 58 75 61 73
44.4% 53.5% 46.9% 44.4% 46.9% 39.9% 48.1% 38.6% 40.5% 51.0% 48.7% 47.0%40 76 92 67 68 57 87 68 60 107 94 93
51.0% 53.0% 48.9% 42.6% 54.5% 42.1% 60.7% 45.7% 56.0% 42.1% 49.2% 58.5%147 131 91 162 67 32 17 37 56 98 341 230
52.0%26
50.0% 100.0% 0.0% 88.9% 80.0% 64.3% 94.7% 75.0% 100.0% 77.8% 66.7% 40.0%1 1 0 8 8 9 18 12 7 14 2 2
77.8%14
74.0%97
65.3%64
84.2%160
76.7%125
3 For Retail Chickens and Turkeys, results for 2002 and 2003 are for Doxycycline
1 Resistance figures for gentamicin, clindamycin, azithromycin, erythromycin, nalidixic acid, and doxycycline in this report may differ from previously published figures because breakpoints have been revised for these antimicrobials2 Beginning in 2008, ground beef and pork chops were no longer tested for Campylobacter due to low isolation in previous years. Data for these retail meats can be found in prior reports.
Swin
e Cecal (Market Hog)
Cecal (Sow)
Cat
tle
Cecal (Beef)
Cecal (Dairy)
Turk
eys Retail Ground Turkey
Cecal
Chi
cken
s
Retail Chickens
HACCP
Cecal
Swin
e Cecal (Market Hog)
Cecal (Sow)
Humans
Cat
tle
Cecal (Beef)
Cecal (Dairy)
Turk
eys Retail Ground Turkey
Cecal
Chi
cken
s
Retail Chickens
HACCP
Cecal
Swin
e Cecal (Market Hog)
Cecal (Sow)
Humans
Cat
tle
Cecal (Beef)
Cecal (Dairy)
CecalTurk
eys Retail Ground Turkey
HACCP
Chi
cken
sTu
rkey
sC
attle
Swin
e
Humans
Chi
cken
s
Retail Chickens
Cecal
Table 79c. Antimicrobial Resistance among Campylobacter coli Isolates, 2002-2013
Humans
159
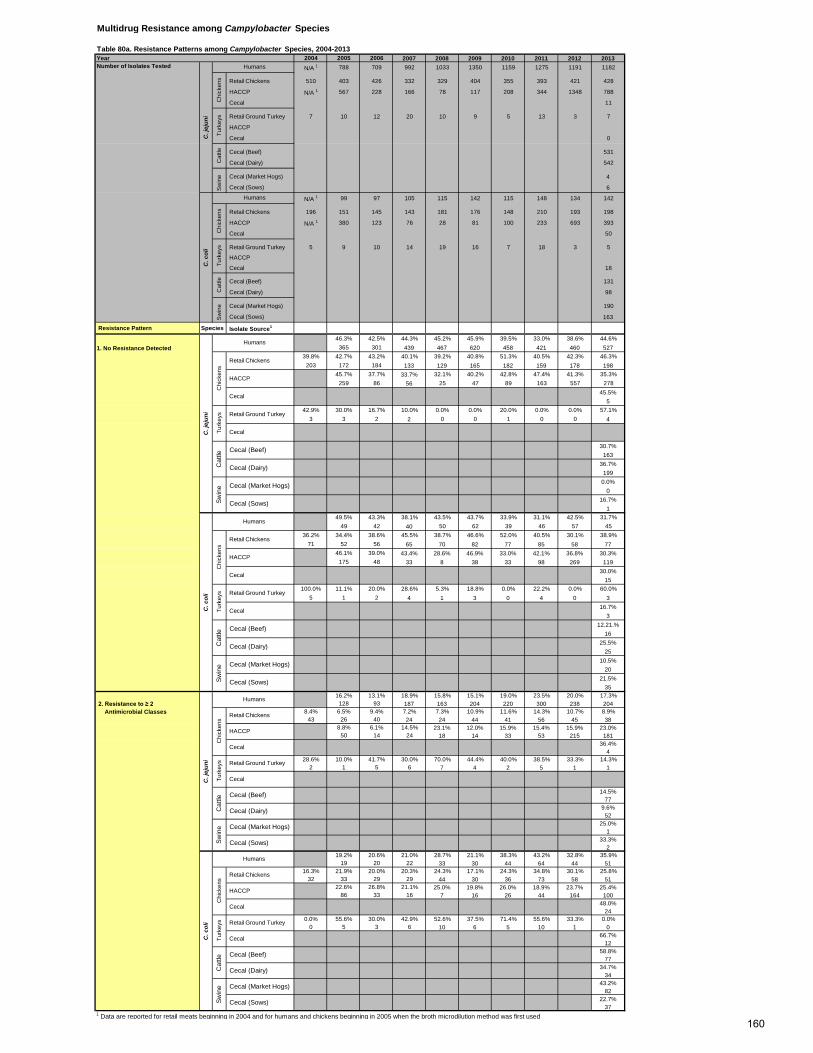
Multidrug Resistance among Campylobacter Species
Year 2004 2005 2006 2007 2008 2009 2010 2011 2012 2013Number of Isolates Tested N/A 1 788 709 992 1033 1350 1159 1275 1191 1182
Retail Chickens 510 403 426 332 329 404 355 393 421 428
HACCP N/A 1 567 228 166 78 117 208 344 1348 788
Cecal 11
Retail Ground Turkey 7 10 12 20 10 9 5 13 3 7
HACCP
Cecal 0
Cecal (Beef) 531
Cecal (Dairy) 542
Cecal (Market Hogs) 4
Cecal (Sows) 6
N/A 1 99 97 105 115 142 115 148 134 142 Retail Chickens 196 151 145 143 181 176 148 210 193 198
HACCP N/A 1 380 123 76 28 81 100 233 693 393
Cecal 50
Retail Ground Turkey 5 9 10 14 19 16 7 18 3 5
HACCP
Cecal 18
Cecal (Beef) 131
Cecal (Dairy) 98
Cecal (Market Hogs) 190
Cecal (Sows) 163
Resistance Pattern Species Isolate Source1
46.3% 42.5% 44.3% 45.2% 45.9% 39.5% 33.0% 38.6% 44.6%1. No Resistance Detected 365 301 439 467 620 458 421 460 527
39.8% 42.7% 43.2% 40.1% 39.2% 40.8% 51.3% 40.5% 42.3% 46.3%203 172 184 133 129 165 182 159 178 198
45.7% 37.7% 33.7% 32.1% 40.2% 42.8% 47.4% 41.3% 35.3%259 86 56 25 47 89 163 557 278
45.5%5
42.9% 30.0% 16.7% 10.0% 0.0% 0.0% 20.0% 0.0% 0.0% 57.1%3 3 2 2 0 0 1 0 0 4
30.7%163
36.7%199
0.0%0
16.7%1
49.5% 43.3% 38.1% 43.5% 43.7% 33.9% 31.1% 42.5% 31.7%49 42 40 50 62 39 46 57 45
36.2% 34.4% 38.6% 45.5% 38.7% 46.6% 52.0% 40.5% 30.1% 38.9%71 52 56 65 70 82 77 85 58 77
46.1% 39.0% 43.4% 28.6% 46.9% 33.0% 42.1% 36.8% 30.3%175 48 33 8 38 33 98 269 119
30.0%15
100.0% 11.1% 20.0% 28.6% 5.3% 18.8% 0.0% 22.2% 0.0% 60.0%5 1 2 4 1 3 0 4 0 3
16.7%3
12.21.%16
25.5%25
10.5%20
21.5%35
16.2% 13.1% 18.9% 15.8% 15.1% 19.0% 23.5% 20.0% 17.3% 2. Resistance to ≥ 2 128 93 187 163 204 220 300 238 204 Antimicrobial Classes 8.4% 6.5% 9.4% 7.2% 7.3% 10.9% 11.6% 14.3% 10.7% 8.9%
43 26 40 24 24 44 41 56 45 388.8% 6.1% 14.5% 23.1% 12.0% 15.9% 15.4% 15.9% 23.0%
50 14 24 18 14 33 53 215 18136.4%
428.6% 10.0% 41.7% 30.0% 70.0% 44.4% 40.0% 38.5% 33.3% 14.3%
2 1 5 6 7 4 2 5 1 1
14.5%77
9.6%52
25.0%1
33.3%2
19.2% 20.6% 21.0% 28.7% 21.1% 38.3% 43.2% 32.8% 35.9%19 20 22 33 30 44 64 44 51
16.3% 21.9% 20.0% 20.3% 24.3% 17.1% 24.3% 34.8% 30.1% 25.8%32 33 29 29 44 30 36 73 58 51
22.6% 26.8% 21.1% 25.0% 19.8% 26.0% 18.9% 23.7% 25.4%86 33 16 7 16 26 44 164 100
48.0%24
0.0% 55.6% 30.0% 42.9% 52.6% 37.5% 71.4% 55.6% 33.3% 0.0%0 5 3 6 10 6 5 10 1 0
66.7%12
58.8%77
34.7%34
43.2%82
22.7%37
1 Data are reported for retail meats beginning in 2004 and for humans and chickens beginning in 2005 when the broth microdilution method was first used
Cat
tle Cecal (Beef)
Cecal (Dairy)
Swin
e Cecal (Market Hogs)
Cecal (Sows)
C. c
oli
Humans
Chi
cken
s
Retail Chickens
HACCP
Cecal
Turk
eys Retail Ground Turkey
Cecal
C. j
ejun
i
Humans
Chi
cken
s
Retail Chickens
HACCP
Cecal
Turk
eys
Cecal
Turk
eys Retail Ground Turkey
Cecal
Cat
tle
Cecal (Beef)
Cecal (Dairy)
Retail Ground Turkey
Cecal
Cat
tle Cecal (Beef)
Cecal (Dairy)
Swin
e Cecal (Market Hogs)
Cecal (Sows)
Swin
e Cecal (Market Hogs)
Cecal (Beef)
Cecal (Dairy)
Swin
e Cecal (Market Hogs)
Cecal (Sows)
C. c
oli
Humans
Chi
cken
s
Retail Chickens
HACCP
C. j
ejun
i
Humans
Chi
cken
s
Retail Chickens
HACCP
Cecal
Turk
eys Retail Ground Turkey
Cecal
Cat
tle
Cecal (Sows)
C. c
oli
Humans
Chi
cken
sTu
rkey
sC
attle
Sw
ine
Table 80a. Resistance Patterns among Campylobacter Species, 2004-2013
C. j
ejun
i
Humans
Chi
cken
sTu
rkey
sC
attle
Sw
ine
160
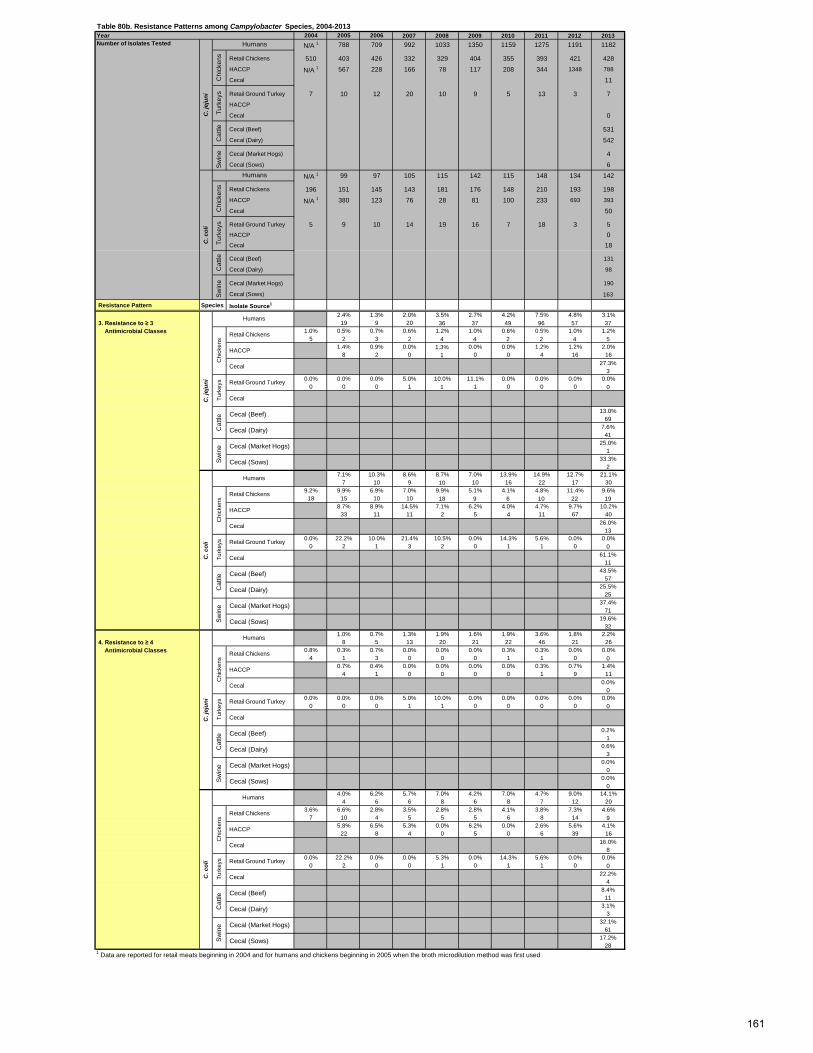
Year 2004 2005 2006 2007 2008 2009 2010 2011 2012 2013Number of Isolates Tested N/A 1 788 709 992 1033 1350 1159 1275 1191 1182
Retail Chickens 510 403 426 332 329 404 355 393 421 428 HACCP N/A 1 567 228 166 78 117 208 344 1348 788
Cecal 11
Retail Ground Turkey 7 10 12 20 10 9 5 13 3 7 HACCP
Cecal 0
Cecal (Beef) 531 Cecal (Dairy) 542
Cecal (Market Hogs) 4 Cecal (Sows) 6
N/A 1 99 97 105 115 142 115 148 134 142 Retail Chickens 196 151 145 143 181 176 148 210 193 198 HACCP N/A 1 380 123 76 28 81 100 233 693 393
Cecal 50
Retail Ground Turkey 5 9 10 14 19 16 7 18 3 5 HACCP 0 Cecal 18
Cecal (Beef) 131
Cecal (Dairy) 98
Cecal (Market Hogs) 190
Cecal (Sows) 163
Resistance Pattern Species Isolate Source1
2.4% 1.3% 2.0% 3.5% 2.7% 4.2% 7.5% 4.8% 3.1% 3. Resistance to ≥ 3 19 9 20 36 37 49 96 57 37 Antimicrobial Classes 1.0% 0.5% 0.7% 0.6% 1.2% 1.0% 0.6% 0.5% 1.0% 1.2%
5 2 3 2 4 4 2 2 4 51.4% 0.9% 0.0% 1.3% 0.0% 0.0% 1.2% 1.2% 2.0%
8 2 0 1 0 0 4 16 1627.3%
30.0% 0.0% 0.0% 5.0% 10.0% 11.1% 0.0% 0.0% 0.0% 0.0%
0 0 0 1 1 1 0 0 0 0
13.0%69
7.6%41
25.0%1
33.3%2
7.1% 10.3% 8.6% 8.7% 7.0% 13.9% 14.9% 12.7% 21.1%7 10 9 10 10 16 22 17 30
9.2% 9.9% 6.9% 7.0% 9.9% 5.1% 4.1% 4.8% 11.4% 9.6%18 15 10 10 18 9 6 10 22 19
8.7% 8.9% 14.5% 7.1% 6.2% 4.0% 4.7% 9.7% 10.2%33 11 11 2 5 4 11 67 40
26.0%13
0.0% 22.2% 10.0% 21.4% 10.5% 0.0% 14.3% 5.6% 0.0% 0.0%0 2 1 3 2 0 1 1 0 0
61.1%11
43.5%57
25.5%25
37.4%71
19.6%32
1.0% 0.7% 1.3% 1.9% 1.6% 1.9% 3.6% 1.8% 2.2% 4. Resistance to ≥ 4 8 5 13 20 21 22 46 21 26 Antimicrobial Classes 0.8% 0.3% 0.7% 0.0% 0.0% 0.0% 0.3% 0.3% 0.0% 0.0%
4 1 3 0 0 0 1 1 0 00.7% 0.4% 0.0% 0.0% 0.0% 0.0% 0.3% 0.7% 1.4%
4 1 0 0 0 0 1 9 110.0%
00.0% 0.0% 0.0% 5.0% 10.0% 0.0% 0.0% 0.0% 0.0% 0.0%
0 0 0 1 1 0 0 0 0 0
0.2%1
0.6%3
0.0%0
0.0%0
4.0% 6.2% 5.7% 7.0% 4.2% 7.0% 4.7% 9.0% 14.1%4 6 6 8 6 8 7 12 20
3.6% 6.6% 2.8% 3.5% 2.8% 2.8% 4.1% 3.8% 7.3% 4.6%7 10 4 5 5 5 6 8 14 9
5.8% 6.5% 5.3% 0.0% 6.2% 0.0% 2.6% 5.6% 4.1%22 8 4 0 5 0 6 39 16
16.0%8
0.0% 22.2% 0.0% 0.0% 5.3% 0.0% 14.3% 5.6% 0.0% 0.0%0 2 0 0 1 0 1 1 0 0
22.2%4
8.4%11
3.1%3
32.1%61
17.2%28
Cecal (Beef)
Cecal (Dairy)
Swin
e Cecal (Market Hogs)
Cecal (Sows)1 Data are reported for retail meats beginning in 2004 and for humans and chickens beginning in 2005 when the broth microdilution method was first used
C. c
oli
Humans
Chi
cken
s
Retail Chickens
HACCP
Cecal
Turk
eys Retail Ground Turkey
Cecal
Cat
tle
C. j
ejun
i
Humans
Chi
cken
s
Retail Chickens
HACCP
Cecal
Turk
eys
Cecal
Turk
eys Retail Ground Turkey
Cecal
Cat
tle Cecal (Beef)
Cecal (Dairy)
Retail Ground Turkey
Cecal
Cat
tle Cecal (Beef)
Cecal (Dairy)
Swin
e Cecal (Market Hogs)
Cecal (Sows)
Swin
e Cecal (Market Hogs)
Cecal (Beef)
Cecal (Dairy)
Swin
e Cecal (Market Hogs)
Cecal (Sows)
C. c
oli
Humans
Chi
cken
s
Retail Chickens
HACCP
C. j
ejun
i
Humans
Chi
cken
s
Retail Chickens
HACCP
Cecal
Turk
eys Retail Ground Turkey
Cecal
Cat
tle
Cecal (Sows)
C. c
oli
Humans
Chi
cken
sTu
rkey
sC
attle
Swin
e
Table 80b. Resistance Patterns among Campylobacter Species, 2004-2013
C. j
ejun
i
Humans
Chi
cken
sTu
rkey
sC
attle
Swin
e
161
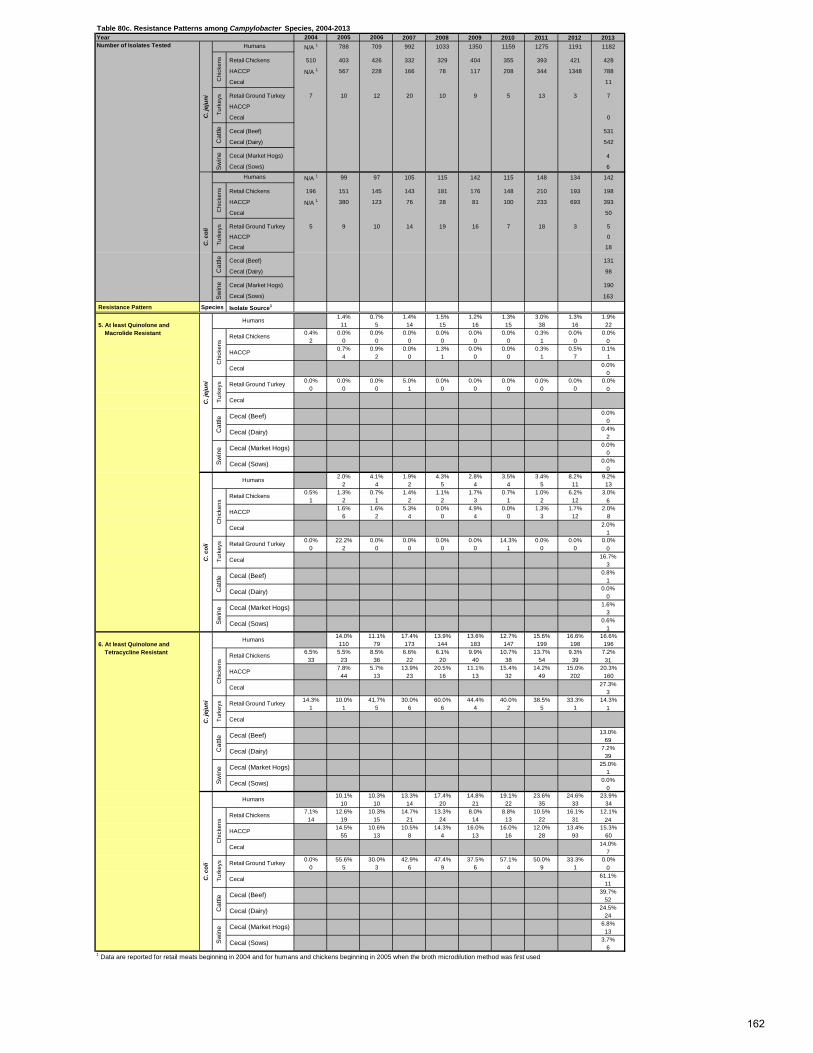
Year 2004 2005 2006 2007 2008 2009 2010 2011 2012 2013Number of Isolates Tested N/A 1 788 709 992 1033 1350 1159 1275 1191 1182
Retail Chickens 510 403 426 332 329 404 355 393 421 428
HACCP N/A 1 567 228 166 78 117 208 344 1348 788
Cecal 11
Retail Ground Turkey 7 10 12 20 10 9 5 13 3 7
HACCP
Cecal 0
Cecal (Beef) 531
Cecal (Dairy) 542
Cecal (Market Hogs) 4
Cecal (Sows) 6
N/A 1 99 97 105 115 142 115 148 134 142 Retail Chickens 196 151 145 143 181 176 148 210 193 198
HACCP N/A 1 380 123 76 28 81 100 233 693 393
Cecal 50
Retail Ground Turkey 5 9 10 14 19 16 7 18 3 5
HACCP 0
Cecal 18
Cecal (Beef) 131
Cecal (Dairy) 98
Cecal (Market Hogs) 190
Cecal (Sows) 163
Resistance Pattern Species Isolate Source1
1.4% 0.7% 1.4% 1.5% 1.2% 1.3% 3.0% 1.3% 1.9% 5. At least Quinolone and 11 5 14 15 16 15 38 16 22 Macrolide Resistant 0.4% 0.0% 0.0% 0.0% 0.0% 0.0% 0.0% 0.3% 0.0% 0.0%
2 0 0 0 0 0 0 1 0 00.7% 0.9% 0.0% 1.3% 0.0% 0.0% 0.3% 0.5% 0.1%
4 2 0 1 0 0 1 7 10.0%
00.0% 0.0% 0.0% 5.0% 0.0% 0.0% 0.0% 0.0% 0.0% 0.0%
0 0 0 1 0 0 0 0 0 0
0.0%0
0.4%2
0.0%0
0.0%0
2.0% 4.1% 1.9% 4.3% 2.8% 3.5% 3.4% 8.2% 9.2%2 4 2 5 4 4 5 11 13
0.5% 1.3% 0.7% 1.4% 1.1% 1.7% 0.7% 1.0% 6.2% 3.0%1 2 1 2 2 3 1 2 12 6
1.6% 1.6% 5.3% 0.0% 4.9% 0.0% 1.3% 1.7% 2.0%6 2 4 0 4 0 3 12 8
2.0%1
0.0% 22.2% 0.0% 0.0% 0.0% 0.0% 14.3% 0.0% 0.0% 0.0%0 2 0 0 0 0 1 0 0 0
16.7%3
0.8%1
0.0%0
1.6%3
0.6%1
14.0% 11.1% 17.4% 13.9% 13.6% 12.7% 15.6% 16.6% 16.6% 6. At least Quinolone and 110 79 173 144 183 147 199 198 196 Tetracycline Resistant 6.5% 5.5% 8.5% 6.6% 6.1% 9.9% 10.7% 13.7% 9.3% 7.2%
33 23 36 22 20 40 38 54 39 317.8% 5.7% 13.9% 20.5% 11.1% 15.4% 14.2% 15.0% 20.3%
44 13 23 16 13 32 49 202 16027.3%
314.3% 10.0% 41.7% 30.0% 60.0% 44.4% 40.0% 38.5% 33.3% 14.3%
1 1 5 6 6 4 2 5 1 1
13.0%69
7.2%39
25.0%1
0.0%0
10.1% 10.3% 13.3% 17.4% 14.8% 19.1% 23.6% 24.6% 23.9%10 10 14 20 21 22 35 33 34
7.1% 12.6% 10.3% 14.7% 13.3% 8.0% 8.8% 10.5% 16.1% 12.1%14 19 15 21 24 14 13 22 31 24
14.5% 10.6% 10.5% 14.3% 16.0% 16.0% 12.0% 13.4% 15.3%55 13 8 4 13 16 28 93 60
14.0%7
0.0% 55.6% 30.0% 42.9% 47.4% 37.5% 57.1% 50.0% 33.3% 0.0%0 5 3 6 9 6 4 9 1 0
61.1%11
39.7%52
24.5%24
6.8%13
3.7%6
1 Data are reported for retail meats beginning in 2004 and for humans and chickens beginning in 2005 when the broth microdilution method was first used
Cecal (Beef)
Cecal (Dairy)
Swin
e Cecal (Market Hogs)
Cecal (Sows)
C. c
oli
Humans
Chi
cken
s
Retail Chickens
HACCP
Cecal
Turk
eys Retail Ground Turkey
Cecal
Cat
tle
C. j
ejun
i
Humans
Chi
cken
s
Retail Chickens
HACCP
Cecal
Turk
eys
Cecal
Turk
eys Retail Ground Turkey
Cecal
Cat
tle Cecal (Beef)
Cecal (Dairy)
Retail Ground Turkey
Cecal
Cat
tle Cecal (Beef)
Cecal (Dairy)
Swin
e Cecal (Market Hogs)
Cecal (Sows)
Swin
e Cecal (Market Hogs)
Cecal (Beef)
Cecal (Dairy)
Swin
e Cecal (Market Hogs)
Cecal (Sows)
C. c
oli
Humans
Chi
cken
s
Retail Chickens
HACCP
C. j
ejun
i
Humans
Chi
cken
s
Retail Chickens
HACCP
Cecal
Turk
eys Retail Ground Turkey
Cecal
Cat
tle
Cecal (Sows)
C. c
oli
Humans
Chi
cken
sTu
rkey
sC
attle
Swin
e
Table 80c. Resistance Patterns among Campylobacter Species, 2004-2013
C. j
ejun
i
Humans
Chi
cken
sTu
rkey
sC
attle
Swin
e
162
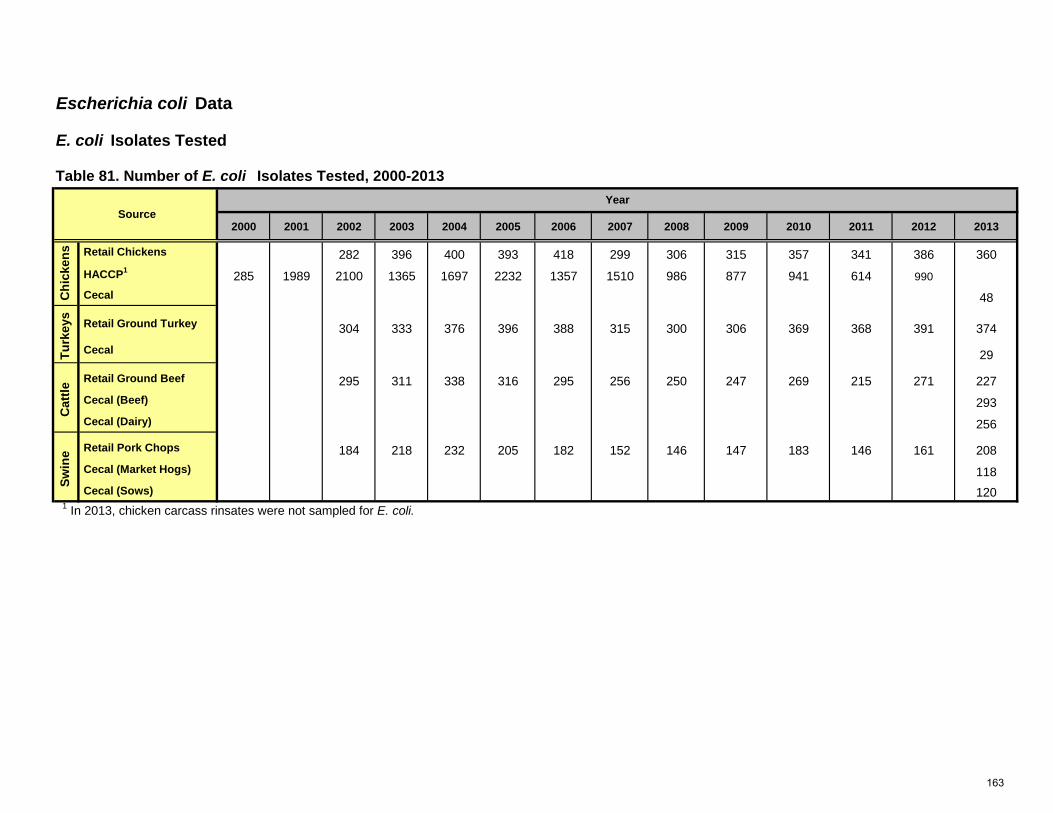
Escherichia coli Data
E. coli Isolates Tested
Table 81. Number of E. coli Isolates Tested, 2000-2013
2000 2001 2002 2003 2004 2005 2006 2007 2008 2009 2010 2011 2012 2013
Retail Chickens 282 396 400 393 418 299 306 315 357 341 386 360 HACCP1 285 1989 2100 1365 1697 2232 1357 1510 986 877 941 614 990 Cecal 48
Retail Ground Turkey 304 333 376 396 388 315 300 306 369 368 391 374
Cecal 29
Retail Ground Beef 295 311 338 316 295 256 250 247 269 215 271 227 Cecal (Beef) 293 Cecal (Dairy) 256
Retail Pork Chops 184 218 232 205 182 152 146 147 183 146 161 208 Cecal (Market Hogs) 118 Cecal (Sows) 120
1 In 2013, chicken carcass rinsates were not sampled for E. coli.
Swin
e
SourceYear
Chi
cken
sTu
rkey
sC
attle
163
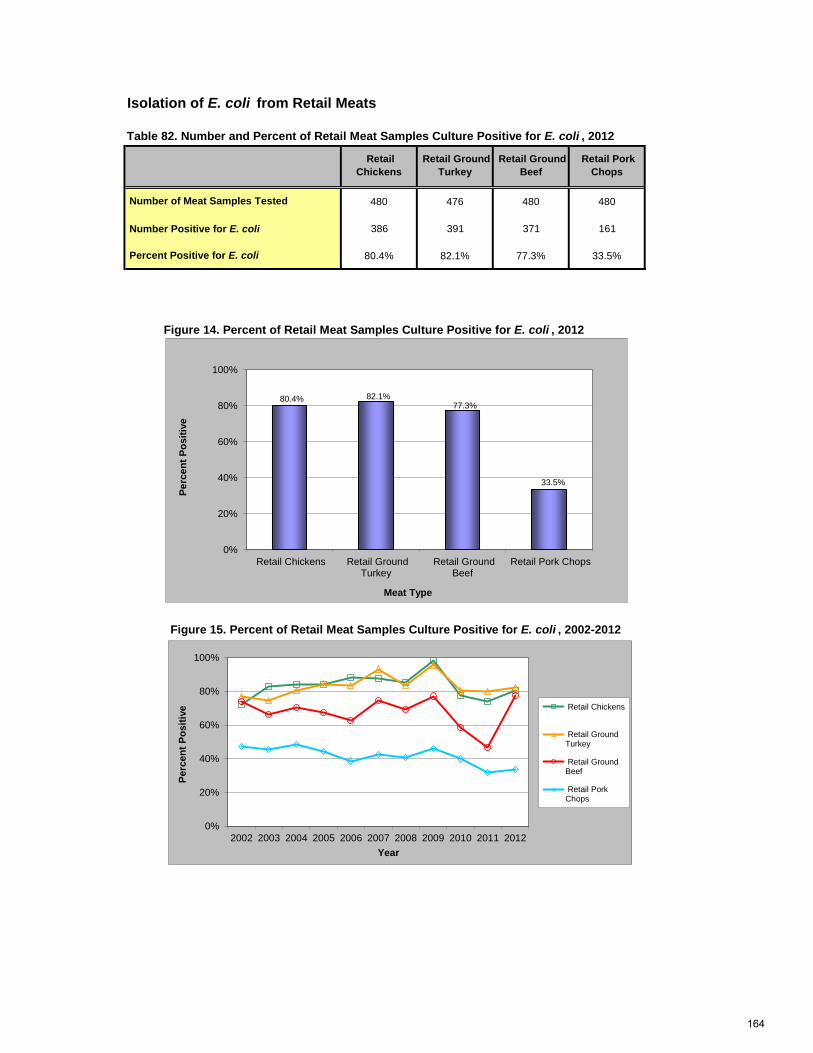
Isolation of E. coli from Retail Meats
Table 82. Number and Percent of Retail Meat Samples Culture Positive for E. coli , 2012
Retail Chickens
Retail Ground Turkey
Retail Ground Beef
Retail Pork Chops
480 476 480 480
Number Positive for E. coli 386 391 371 161
80.4% 82.1% 77.3% 33.5%
Figure 15. Percent of Retail Meat Samples Culture Positive for E. coli , 2002-2012
Number of Meat Samples Tested
Percent Positive for E. coli
Figure 14. Percent of Retail Meat Samples Culture Positive for E. coli , 2012
80.4% 82.1% 77.3%
33.5%
0%
20%
40%
60%
80%
100%
Retail Chickens Retail GroundTurkey
Retail GroundBeef
Retail Pork Chops
Perc
ent P
ositi
ve
Meat Type
0%
20%
40%
60%
80%
100%
2002 2003 2004 2005 2006 2007 2008 2009 2010 2011 2012
Perc
ent P
ositi
ve
Year
Retail Chickens
Retail GroundTurkey
Retail GroundBeef
Retail PorkChops
164
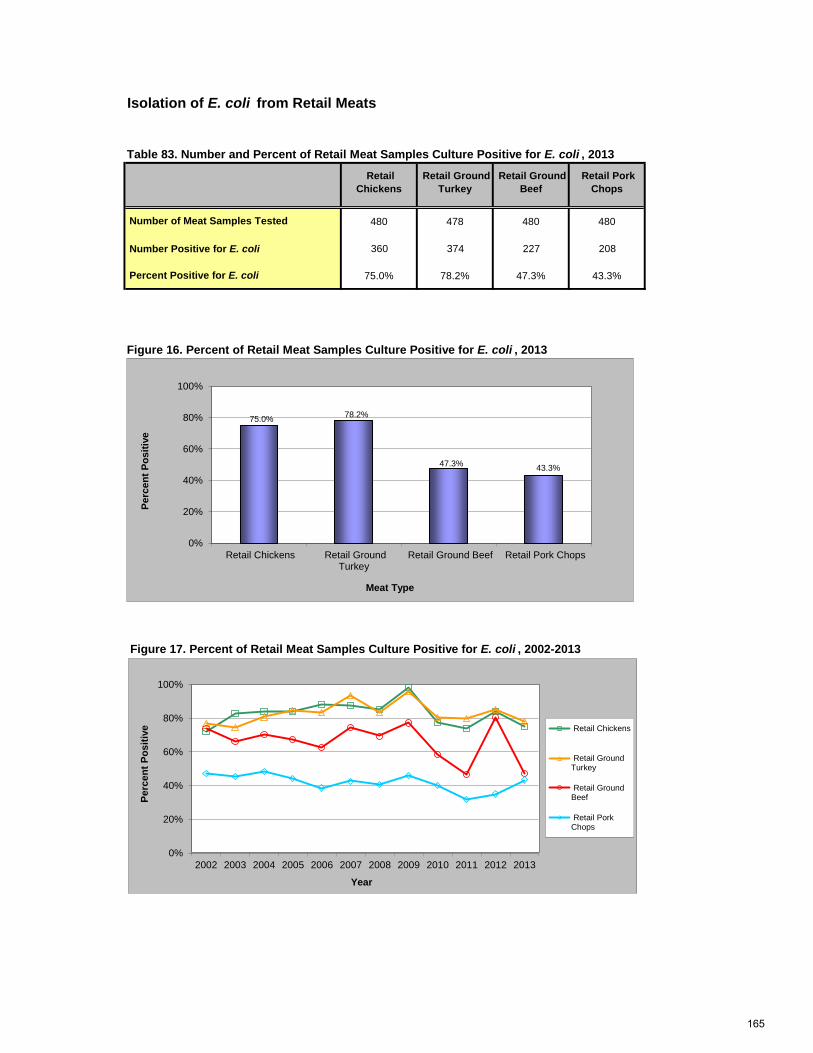
Isolation of E. coli from Retail Meats
Retail Chickens
Retail Ground Turkey
Retail Ground Beef
Retail Pork Chops
480 478 480 480
Number Positive for E. coli 360 374 227 208
75.0% 78.2% 47.3% 43.3%
Figure 17. Percent of Retail Meat Samples Culture Positive for E. coli , 2002-2013
Table 83. Number and Percent of Retail Meat Samples Culture Positive for E. coli , 2013
Number of Meat Samples Tested
Percent Positive for E. coli
Figure 16. Percent of Retail Meat Samples Culture Positive for E. coli , 2013
75.0% 78.2%
47.3% 43.3%
0%
20%
40%
60%
80%
100%
Retail Chickens Retail GroundTurkey
Retail Ground Beef Retail Pork Chops
Perc
ent P
ositi
ve
Meat Type
0%
20%
40%
60%
80%
100%
2002 2003 2004 2005 2006 2007 2008 2009 2010 2011 2012 2013
Perc
ent P
ositi
ve
Year
Retail Chickens
Retail GroundTurkey
Retail GroundBeef
Retail PorkChops
165
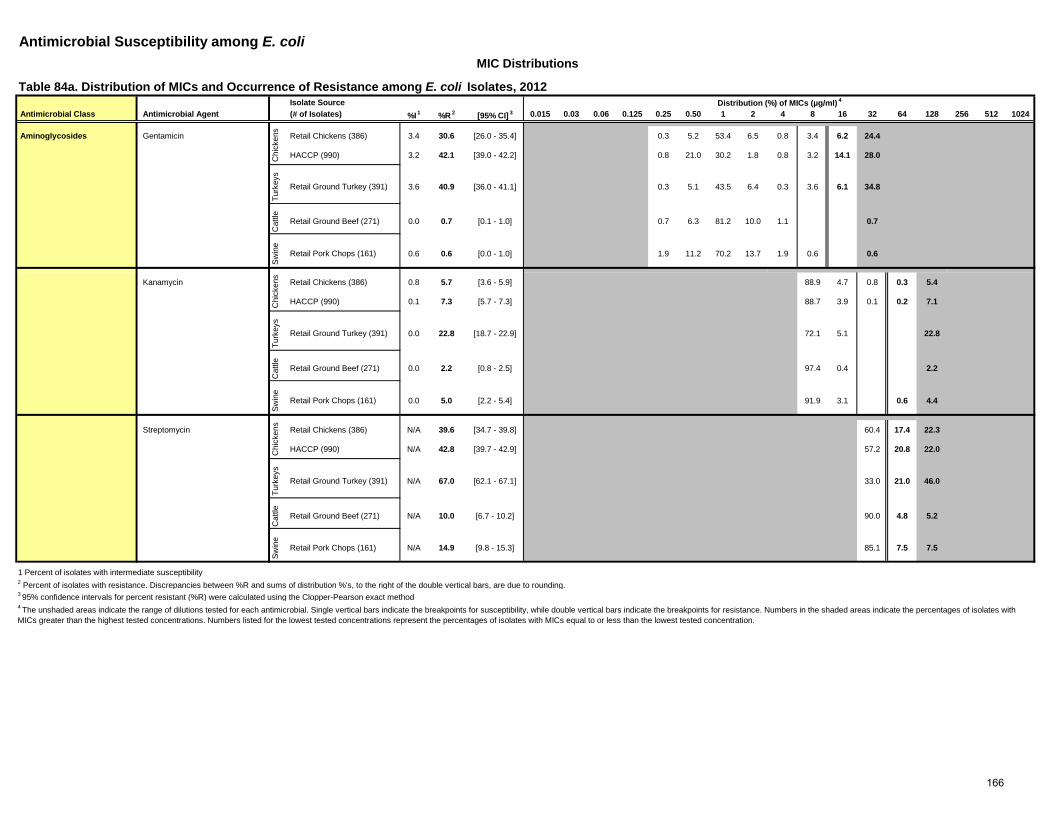
Antimicrobial Susceptibility among E. coli
Isolate Source Antimicrobial Class Antimicrobial Agent (# of Isolates) %I
1 %R 2 [95% CI]
3 0.015 0.03 0.06 0.125 0.25 0.50 1 2 4 8 16 32 64 128 256 512 1024
Aminoglycosides Gentamicin Retail Chickens (386) 3.4 30.6 [26.0 - 35.4] 0.3 5.2 53.4 6.5 0.8 3.4 6.2 24.4
HACCP (990) 3.2 42.1 [39.0 - 42.2] 0.8 21.0 30.2 1.8 0.8 3.2 14.1 28.0
Turk
eys
Retail Ground Turkey (391) 3.6 40.9 [36.0 - 41.1] 0.3 5.1 43.5 6.4 0.3 3.6 6.1 34.8
Cat
tle Retail Ground Beef (271) 0.0 0.7 [0.1 - 1.0] 0.7 6.3 81.2 10.0 1.1 0.7
Sw
ine
Retail Pork Chops (161) 0.6 0.6 [0.0 - 1.0] 1.9 11.2 70.2 13.7 1.9 0.6 0.6
Kanamycin Retail Chickens (386) 0.8 5.7 [3.6 - 5.9] 88.9 4.7 0.8 0.3 5.4
HACCP (990) 0.1 7.3 [5.7 - 7.3] 88.7 3.9 0.1 0.2 7.1
Turk
eys
Retail Ground Turkey (391) 0.0 22.8 [18.7 - 22.9] 72.1 5.1 22.8
Cat
tle Retail Ground Beef (271) 0.0 2.2 [0.8 - 2.5] 97.4 0.4 2.2
Sw
ine
Retail Pork Chops (161) 0.0 5.0 [2.2 - 5.4] 91.9 3.1 0.6 4.4
Streptomycin Retail Chickens (386) N/A 39.6 [34.7 - 39.8] 60.4 17.4 22.3
HACCP (990) N/A 42.8 [39.7 - 42.9] 57.2 20.8 22.0
Turk
eys
Retail Ground Turkey (391) N/A 67.0 [62.1 - 67.1] 33.0 21.0 46.0
Cat
tle Retail Ground Beef (271) N/A 10.0 [6.7 - 10.2] 90.0 4.8 5.2
Sw
ine
Retail Pork Chops (161) N/A 14.9 [9.8 - 15.3] 85.1 7.5 7.5
1 Percent of isolates with intermediate susceptibility 2 Percent of isolates with resistance. Discrepancies between %R and sums of distribution %'s, to the right of the double vertical bars, are due to rounding.3 95% confidence intervals for percent resistant (%R) were calculated using the Clopper-Pearson exact method
MIC Distributions
Table 84a. Distribution of MICs and Occurrence of Resistance among E. coli Isolates, 2012 Distribution (%) of MICs (µg/ml)
4
Chi
cken
sC
hick
ens
Chi
cken
s
4 The unshaded areas indicate the range of dilutions tested for each antimicrobial. Single vertical bars indicate the breakpoints for susceptibility, while double vertical bars indicate the breakpoints for resistance. Numbers in the shaded areas indicate the percentages of isolates with MICs greater than the highest tested concentrations. Numbers listed for the lowest tested concentrations represent the percentages of isolates with MICs equal to or less than the lowest tested concentration.
166
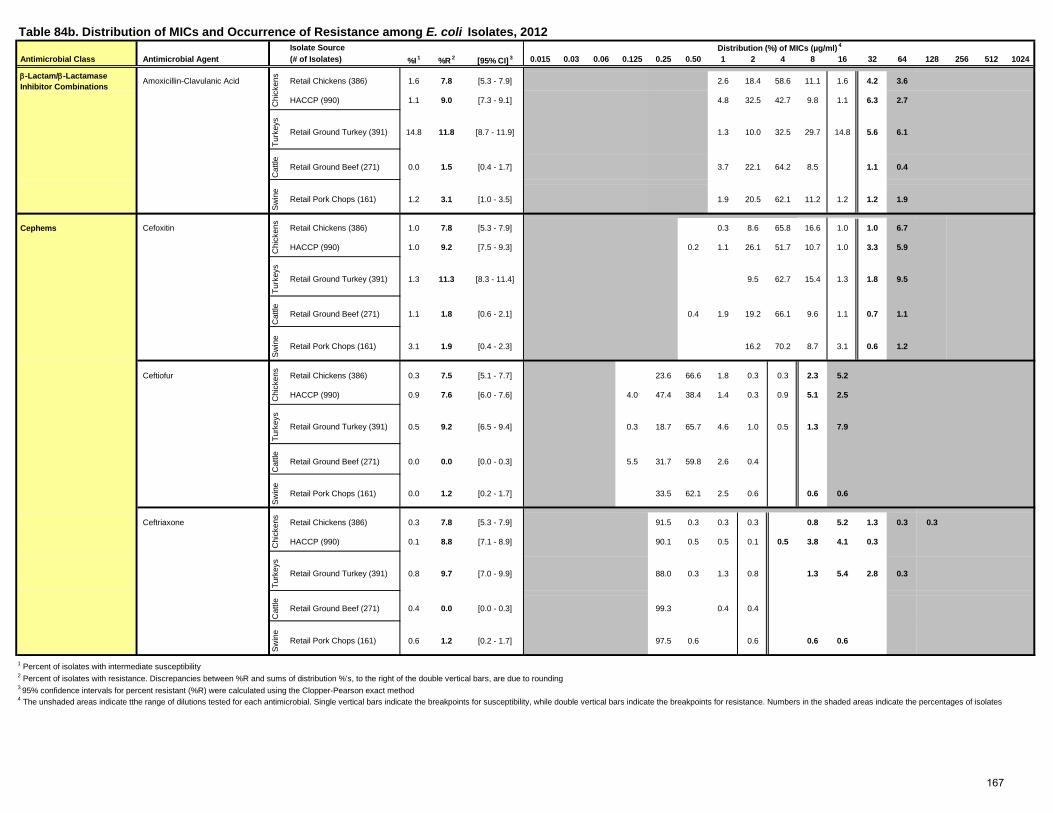
Isolate Source Antimicrobial Class Antimicrobial Agent (# of Isolates) %I
1 %R 2 [95% CI]
3 0.015 0.03 0.06 0.125 0.25 0.50 1 2 4 8 16 32 64 128 256 512 1024
β-Lactam/β-Lactamase Inhibitor Combinations
Amoxicillin-Clavulanic Acid Retail Chickens (386) 1.6 7.8 [5.3 - 7.9] 2.6 18.4 58.6 11.1 1.6 4.2 3.6
HACCP (990) 1.1 9.0 [7.3 - 9.1] 4.8 32.5 42.7 9.8 1.1 6.3 2.7
Turk
eys
Retail Ground Turkey (391) 14.8 11.8 [8.7 - 11.9] 1.3 10.0 32.5 29.7 14.8 5.6 6.1
Cat
tle Retail Ground Beef (271) 0.0 1.5 [0.4 - 1.7] 3.7 22.1 64.2 8.5 1.1 0.4
Sw
ine
Retail Pork Chops (161) 1.2 3.1 [1.0 - 3.5] 1.9 20.5 62.1 11.2 1.2 1.2 1.9
Cephems Cefoxitin Retail Chickens (386) 1.0 7.8 [5.3 - 7.9] 0.3 8.6 65.8 16.6 1.0 1.0 6.7
HACCP (990) 1.0 9.2 [7.5 - 9.3] 0.2 1.1 26.1 51.7 10.7 1.0 3.3 5.9
Turk
eys
Retail Ground Turkey (391) 1.3 11.3 [8.3 - 11.4] 9.5 62.7 15.4 1.3 1.8 9.5C
attle Retail Ground Beef (271) 1.1 1.8 [0.6 - 2.1] 0.4 1.9 19.2 66.1 9.6 1.1 0.7 1.1
Sw
ine
Retail Pork Chops (161) 3.1 1.9 [0.4 - 2.3] 16.2 70.2 8.7 3.1 0.6 1.2
Ceftiofur Retail Chickens (386) 0.3 7.5 [5.1 - 7.7] 23.6 66.6 1.8 0.3 0.3 2.3 5.2
HACCP (990) 0.9 7.6 [6.0 - 7.6] 4.0 47.4 38.4 1.4 0.3 0.9 5.1 2.5
Turk
eys
Retail Ground Turkey (391) 0.5 9.2 [6.5 - 9.4] 0.3 18.7 65.7 4.6 1.0 0.5 1.3 7.9
Cat
tle Retail Ground Beef (271) 0.0 0.0 [0.0 - 0.3] 5.5 31.7 59.8 2.6 0.4
Sw
ine
Retail Pork Chops (161) 0.0 1.2 [0.2 - 1.7] 33.5 62.1 2.5 0.6 0.6 0.6
Ceftriaxone Retail Chickens (386) 0.3 7.8 [5.3 - 7.9] 91.5 0.3 0.3 0.3 0.8 5.2 1.3 0.3 0.3
HACCP (990) 0.1 8.8 [7.1 - 8.9] 90.1 0.5 0.5 0.1 0.5 3.8 4.1 0.3
Turk
eys
Retail Ground Turkey (391) 0.8 9.7 [7.0 - 9.9] 88.0 0.3 1.3 0.8 1.3 5.4 2.8 0.3
Cat
tle Retail Ground Beef (271) 0.4 0.0 [0.0 - 0.3] 99.3 0.4 0.4
Sw
ine
Retail Pork Chops (161) 0.6 1.2 [0.2 - 1.7] 97.5 0.6 0.6 0.6 0.6
1 Percent of isolates with intermediate susceptibility 2 Percent of isolates with resistance. Discrepancies between %R and sums of distribution %'s, to the right of the double vertical bars, are due to rounding3 95% confidence intervals for percent resistant (%R) were calculated using the Clopper-Pearson exact method
Chi
cken
sC
hick
ens
Chi
cken
s
4 The unshaded areas indicate tthe range of dilutions tested for each antimicrobial. Single vertical bars indicate the breakpoints for susceptibility, while double vertical bars indicate the breakpoints for resistance. Numbers in the shaded areas indicate the percentages of isolates
Chi
cken
s
Table 84b. Distribution of MICs and Occurrence of Resistance among E. coli Isolates, 2012 Distribution (%) of MICs (µg/ml)
4
167
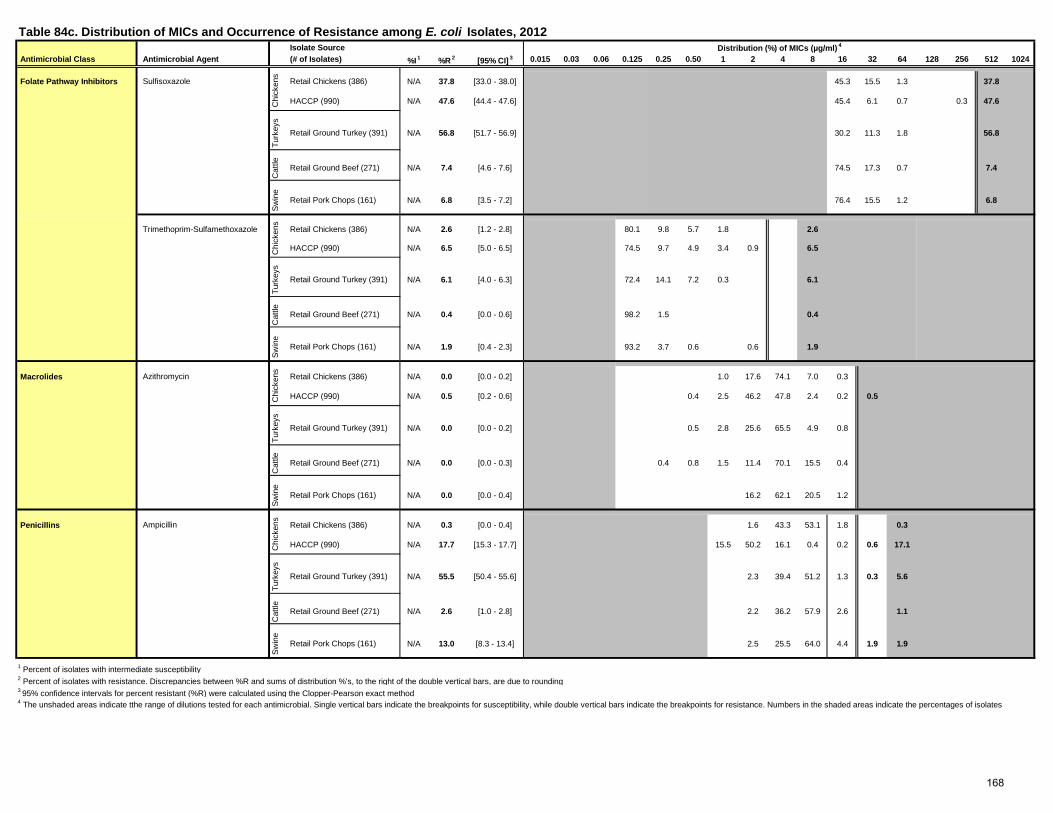
Isolate Source Antimicrobial Class Antimicrobial Agent (# of Isolates) %I
1 %R 2 [95% CI]
3 0.015 0.03 0.06 0.125 0.25 0.50 1 2 4 8 16 32 64 128 256 512 1024
Folate Pathway Inhibitors Sulfisoxazole Retail Chickens (386) N/A 37.8 [33.0 - 38.0] 45.3 15.5 1.3 37.8
HACCP (990) N/A 47.6 [44.4 - 47.6] 45.4 6.1 0.7 0.3 47.6
Turk
eys
Retail Ground Turkey (391) N/A 56.8 [51.7 - 56.9] 30.2 11.3 1.8 56.8
Cat
tle Retail Ground Beef (271) N/A 7.4 [4.6 - 7.6] 74.5 17.3 0.7 7.4
Sw
ine
Retail Pork Chops (161) N/A 6.8 [3.5 - 7.2] 76.4 15.5 1.2 6.8
Trimethoprim-Sulfamethoxazole Retail Chickens (386) N/A 2.6 [1.2 - 2.8] 80.1 9.8 5.7 1.8 2.6
HACCP (990) N/A 6.5 [5.0 - 6.5] 74.5 9.7 4.9 3.4 0.9 6.5
Turk
eys
Retail Ground Turkey (391) N/A 6.1 [4.0 - 6.3] 72.4 14.1 7.2 0.3 6.1C
attle Retail Ground Beef (271) N/A 0.4 [0.0 - 0.6] 98.2 1.5 0.4
Sw
ine
Retail Pork Chops (161) N/A 1.9 [0.4 - 2.3] 93.2 3.7 0.6 0.6 1.9
Macrolides Azithromycin Retail Chickens (386) N/A 0.0 [0.0 - 0.2] 1.0 17.6 74.1 7.0 0.3
HACCP (990) N/A 0.5 [0.2 - 0.6] 0.4 2.5 46.2 47.8 2.4 0.2 0.5
Turk
eys
Retail Ground Turkey (391) N/A 0.0 [0.0 - 0.2] 0.5 2.8 25.6 65.5 4.9 0.8
Cat
tle Retail Ground Beef (271) N/A 0.0 [0.0 - 0.3] 0.4 0.8 1.5 11.4 70.1 15.5 0.4
Sw
ine
Retail Pork Chops (161) N/A 0.0 [0.0 - 0.4] 16.2 62.1 20.5 1.2
Penicillins Ampicillin Retail Chickens (386) N/A 0.3 [0.0 - 0.4] 1.6 43.3 53.1 1.8 0.3
HACCP (990) N/A 17.7 [15.3 - 17.7] 15.5 50.2 16.1 0.4 0.2 0.6 17.1
Turk
eys
Retail Ground Turkey (391) N/A 55.5 [50.4 - 55.6] 2.3 39.4 51.2 1.3 0.3 5.6
Cat
tle Retail Ground Beef (271) N/A 2.6 [1.0 - 2.8] 2.2 36.2 57.9 2.6 1.1
Sw
ine
Retail Pork Chops (161) N/A 13.0 [8.3 - 13.4] 2.5 25.5 64.0 4.4 1.9 1.9
1 Percent of isolates with intermediate susceptibility 2 Percent of isolates with resistance. Discrepancies between %R and sums of distribution %'s, to the right of the double vertical bars, are due to rounding3 95% confidence intervals for percent resistant (%R) were calculated using the Clopper-Pearson exact method
Table 84c. Distribution of MICs and Occurrence of Resistance among E. coli Isolates, 2012 Distribution (%) of MICs (µg/ml)
4
Chi
cken
sC
hick
ens
Chi
cken
sC
hick
ens
4 The unshaded areas indicate tthe range of dilutions tested for each antimicrobial. Single vertical bars indicate the breakpoints for susceptibility, while double vertical bars indicate the breakpoints for resistance. Numbers in the shaded areas indicate the percentages of isolates
168
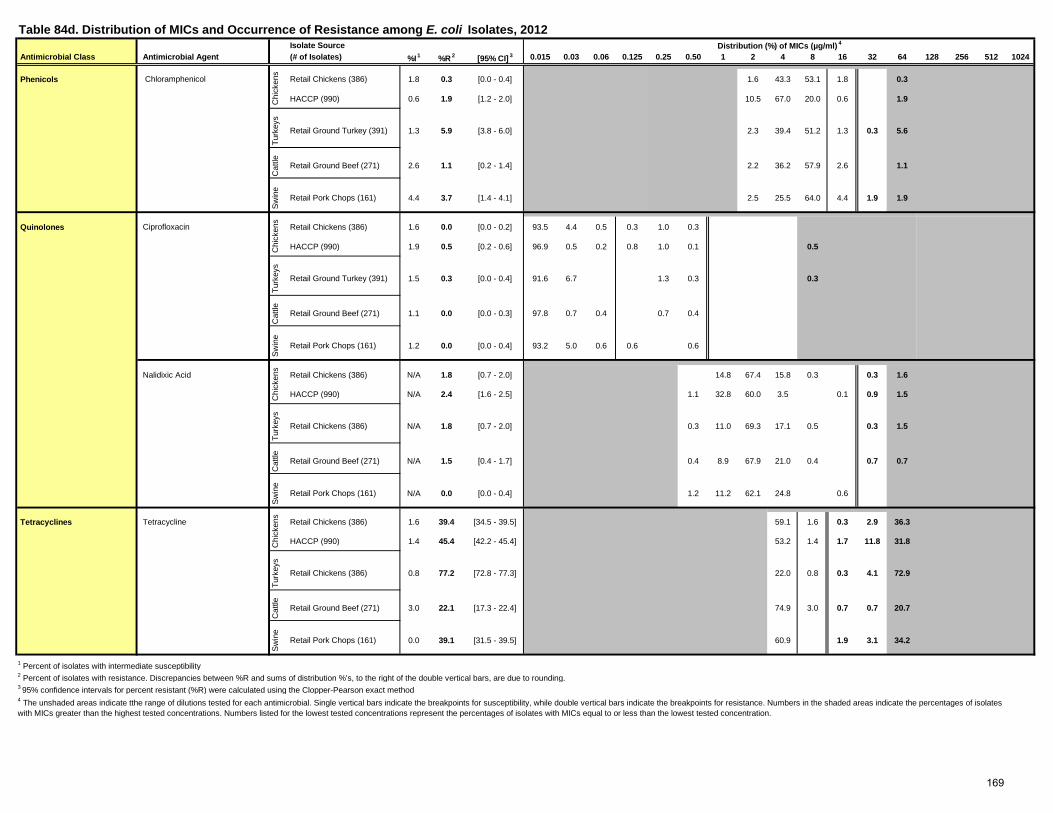
Isolate Source Antimicrobial Class Antimicrobial Agent (# of Isolates) %I
1 %R 2 [95% CI]
3 0.015 0.03 0.06 0.125 0.25 0.50 1 2 4 8 16 32 64 128 256 512 1024
Phenicols Chloramphenicol Retail Chickens (386) 1.8 0.3 [0.0 - 0.4] 1.6 43.3 53.1 1.8 0.3
HACCP (990) 0.6 1.9 [1.2 - 2.0] 10.5 67.0 20.0 0.6 1.9
Turk
eys
Retail Ground Turkey (391) 1.3 5.9 [3.8 - 6.0] 2.3 39.4 51.2 1.3 0.3 5.6
Cat
tle Retail Ground Beef (271) 2.6 1.1 [0.2 - 1.4] 2.2 36.2 57.9 2.6 1.1
Sw
ine
Retail Pork Chops (161) 4.4 3.7 [1.4 - 4.1] 2.5 25.5 64.0 4.4 1.9 1.9
Quinolones Ciprofloxacin Retail Chickens (386) 1.6 0.0 [0.0 - 0.2] 93.5 4.4 0.5 0.3 1.0 0.3
HACCP (990) 1.9 0.5 [0.2 - 0.6] 96.9 0.5 0.2 0.8 1.0 0.1 0.5
Turk
eys
Retail Ground Turkey (391) 1.5 0.3 [0.0 - 0.4] 91.6 6.7 1.3 0.3 0.3C
attle Retail Ground Beef (271) 1.1 0.0 [0.0 - 0.3] 97.8 0.7 0.4 0.7 0.4
Sw
ine
Retail Pork Chops (161) 1.2 0.0 [0.0 - 0.4] 93.2 5.0 0.6 0.6 0.6
Nalidixic Acid Retail Chickens (386) N/A 1.8 [0.7 - 2.0] 14.8 67.4 15.8 0.3 0.3 1.6
HACCP (990) N/A 2.4 [1.6 - 2.5] 1.1 32.8 60.0 3.5 0.1 0.9 1.5
Turk
eys
Retail Chickens (386) N/A 1.8 [0.7 - 2.0] 0.3 11.0 69.3 17.1 0.5 0.3 1.5
Cat
tle Retail Ground Beef (271) N/A 1.5 [0.4 - 1.7] 0.4 8.9 67.9 21.0 0.4 0.7 0.7
Sw
ine
Retail Pork Chops (161) N/A 0.0 [0.0 - 0.4] 1.2 11.2 62.1 24.8 0.6
Tetracyclines Tetracycline Retail Chickens (386) 1.6 39.4 [34.5 - 39.5] 59.1 1.6 0.3 2.9 36.3
HACCP (990) 1.4 45.4 [42.2 - 45.4] 53.2 1.4 1.7 11.8 31.8
Turk
eys
Retail Chickens (386) 0.8 77.2 [72.8 - 77.3] 22.0 0.8 0.3 4.1 72.9
Cat
tle Retail Ground Beef (271) 3.0 22.1 [17.3 - 22.4] 74.9 3.0 0.7 0.7 20.7
Sw
ine
Retail Pork Chops (161) 0.0 39.1 [31.5 - 39.5] 60.9 1.9 3.1 34.2
1 Percent of isolates with intermediate susceptibility 2 Percent of isolates with resistance. Discrepancies between %R and sums of distribution %'s, to the right of the double vertical bars, are due to rounding.3 95% confidence intervals for percent resistant (%R) were calculated using the Clopper-Pearson exact method4 The unshaded areas indicate tthe range of dilutions tested for each antimicrobial. Single vertical bars indicate the breakpoints for susceptibility, while double vertical bars indicate the breakpoints for resistance. Numbers in the shaded areas indicate the percentages of isolates with MICs greater than the highest tested concentrations. Numbers listed for the lowest tested concentrations represent the percentages of isolates with MICs equal to or less than the lowest tested concentration.
Distribution (%) of MICs (µg/ml) 4
Chi
cken
sC
hick
ens
Chi
cken
sC
hick
ens
Table 84d. Distribution of MICs and Occurrence of Resistance among E. coli Isolates, 2012
169
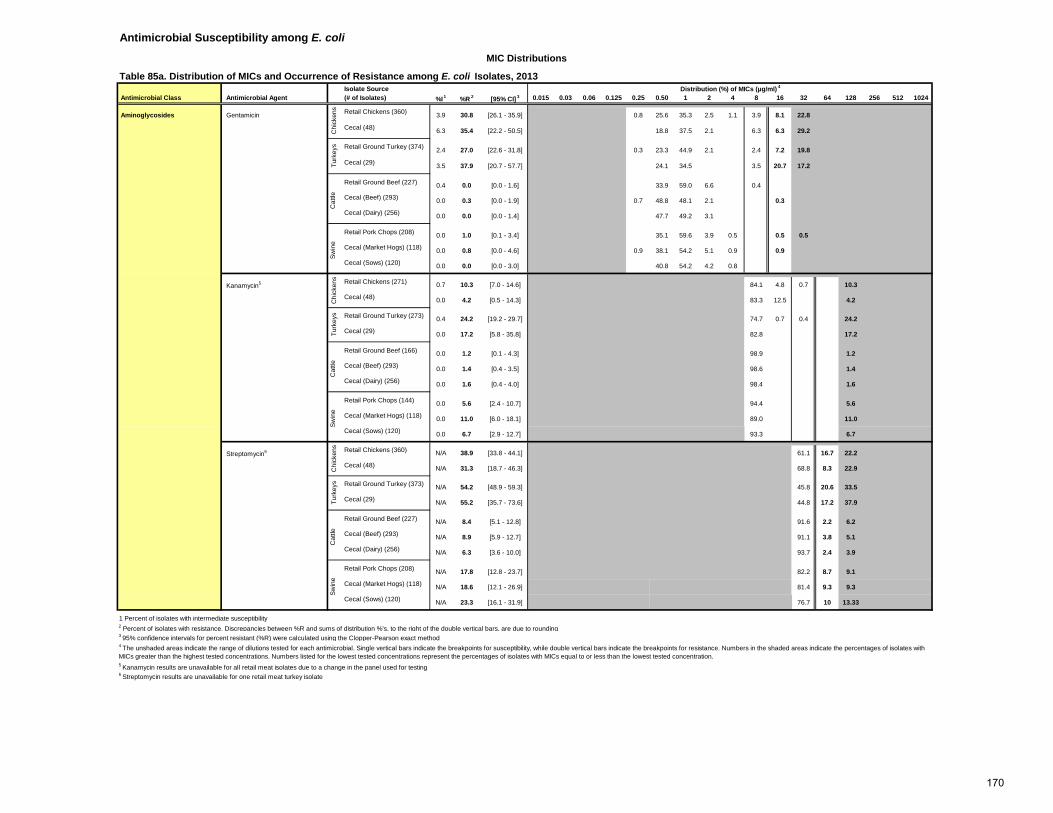
Antimicrobial Susceptibility among E. coli
Isolate Source Antimicrobial Class Antimicrobial Agent (# of Isolates) %I
1 %R 2 [95% CI]
3 0.015 0.03 0.06 0.125 0.25 0.50 1 2 4 8 16 32 64 128 256 512 1024
Aminoglycosides Gentamicin Retail Chickens (360) 3.9 30.8 [26.1 - 35.9] 0.8 25.6 35.3 2.5 1.1 3.9 8.1 22.8
Cecal (48) 6.3 35.4 [22.2 - 50.5] 18.8 37.5 2.1 6.3 6.3 29.2
Retail Ground Turkey (374) 2.4 27.0 [22.6 - 31.8] 0.3 23.3 44.9 2.1 2.4 7.2 19.8
Cecal (29) 3.5 37.9 [20.7 - 57.7] 24.1 34.5 3.5 20.7 17.2
Retail Ground Beef (227) 0.4 0.0 [0.0 - 1.6] 33.9 59.0 6.6 0.4
Cecal (Beef) (293) 0.0 0.3 [0.0 - 1.9] 0.7 48.8 48.1 2.1 0.3
Cecal (Dairy) (256) 0.0 0.0 [0.0 - 1.4] 47.7 49.2 3.1
Retail Pork Chops (208) 0.0 1.0 [0.1 - 3.4] 35.1 59.6 3.9 0.5 0.5 0.5
Cecal (Market Hogs) (118) 0.0 0.8 [0.0 - 4.6] 0.9 38.1 54.2 5.1 0.9 0.9
Cecal (Sows) (120) 0.0 0.0 [0.0 - 3.0] 40.8 54.2 4.2 0.8
Kanamycin5 Retail Chickens (271) 0.7 10.3 [7.0 - 14.6] 84.1 4.8 0.7 10.3
Cecal (48) 0.0 4.2 [0.5 - 14.3] 83.3 12.5 4.2
Retail Ground Turkey (273) 0.4 24.2 [19.2 - 29.7] 74.7 0.7 0.4 24.2
Cecal (29) 0.0 17.2 [5.8 - 35.8] 82.8 17.2
Retail Ground Beef (166) 0.0 1.2 [0.1 - 4.3] 98.9 1.2
Cecal (Beef) (293) 0.0 1.4 [0.4 - 3.5] 98.6 1.4
Cecal (Dairy) (256) 0.0 1.6 [0.4 - 4.0] 98.4 1.6
Retail Pork Chops (144) 0.0 5.6 [2.4 - 10.7] 94.4 5.6
Cecal (Market Hogs) (118) 0.0 11.0 [6.0 - 18.1] 89.0 11.0
Cecal (Sows) (120) 0.0 6.7 [2.9 - 12.7] 93.3 6.7
Streptomycin6 Retail Chickens (360) N/A 38.9 [33.8 - 44.1] 61.1 16.7 22.2
Cecal (48) N/A 31.3 [18.7 - 46.3] 68.8 8.3 22.9
Retail Ground Turkey (373) N/A 54.2 [48.9 - 59.3] 45.8 20.6 33.5
Cecal (29) N/A 55.2 [35.7 - 73.6] 44.8 17.2 37.9
Retail Ground Beef (227) N/A 8.4 [5.1 - 12.8] 91.6 2.2 6.2
Cecal (Beef) (293) N/A 8.9 [5.9 - 12.7] 91.1 3.8 5.1
Cecal (Dairy) (256) N/A 6.3 [3.6 - 10.0] 93.7 2.4 3.9
Retail Pork Chops (208) N/A 17.8 [12.8 - 23.7] 82.2 8.7 9.1
Cecal (Market Hogs) (118) N/A 18.6 [12.1 - 26.9] 81.4 9.3 9.3
Cecal (Sows) (120) N/A 23.3 [16.1 - 31.9] 76.7 10 13.33
1 Percent of isolates with intermediate susceptibility 2 Percent of isolates with resistance. Discrepancies between %R and sums of distribution %'s, to the right of the double vertical bars, are due to rounding3 95% confidence intervals for percent resistant (%R) were calculated using the Clopper-Pearson exact method
Swin
e
MIC Distributions
Table 85a. Distribution of MICs and Occurrence of Resistance among E. coli Isolates, 2013 Distribution (%) of MICs (µg/ml)
4
Cat
tleSw
ine
Cat
tleC
hick
ens
Turk
eys
Chi
cken
sTu
rkey
sC
hick
ens
Turk
eys
Cat
tleSw
ine
4 The unshaded areas indicate the range of dilutions tested for each antimicrobial. Single vertical bars indicate the breakpoints for susceptibility, while double vertical bars indicate the breakpoints for resistance. Numbers in the shaded areas indicate the percentages of isolates with MICs greater than the highest tested concentrations. Numbers listed for the lowest tested concentrations represent the percentages of isolates with MICs equal to or less than the lowest tested concentration.5 Kanamycin results are unavailable for all retail meat isolates due to a change in the panel used for testing6 Streptomycin results are unavailable for one retail meat turkey isolate
170
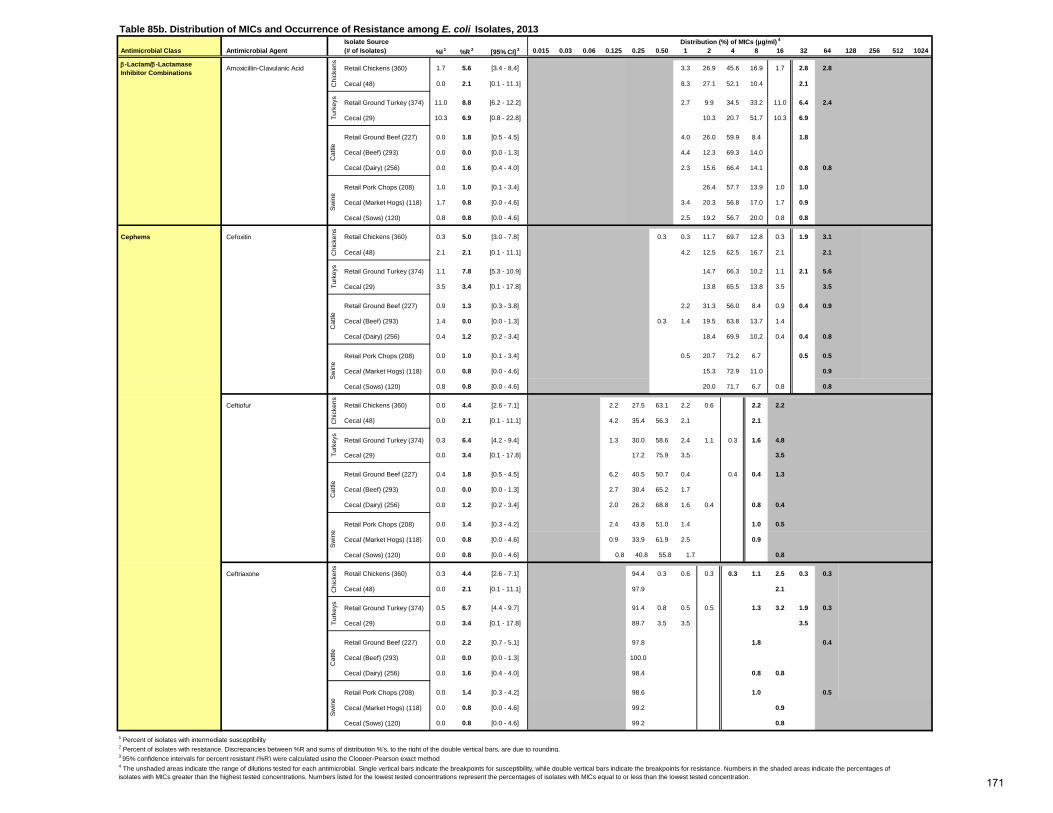
Isolate Source Antimicrobial Class Antimicrobial Agent (# of Isolates) %I
1 %R 2 [95% CI]
3 0.015 0.03 0.06 0.125 0.25 0.50 1 2 4 8 16 32 64 128 256 512 1024
β-Lactam/β-Lactamase Inhibitor Combinations
Amoxicillin-Clavulanic Acid Retail Chickens (360) 1.7 5.6 [3.4 - 8.4] 3.3 26.9 45.6 16.9 1.7 2.8 2.8
Cecal (48) 0.0 2.1 [0.1 - 11.1] 8.3 27.1 52.1 10.4 2.1
Retail Ground Turkey (374) 11.0 8.8 [6.2 - 12.2] 2.7 9.9 34.5 33.2 11.0 6.4 2.4
Cecal (29) 10.3 6.9 [0.8 - 22.8] 10.3 20.7 51.7 10.3 6.9
Retail Ground Beef (227) 0.0 1.8 [0.5 - 4.5] 4.0 26.0 59.9 8.4 1.8
Cecal (Beef) (293) 0.0 0.0 [0.0 - 1.3] 4.4 12.3 69.3 14.0
Cecal (Dairy) (256) 0.0 1.6 [0.4 - 4.0] 2.3 15.6 66.4 14.1 0.8 0.8
Retail Pork Chops (208) 1.0 1.0 [0.1 - 3.4] 26.4 57.7 13.9 1.0 1.0
Cecal (Market Hogs) (118) 1.7 0.8 [0.0 - 4.6] 3.4 20.3 56.8 17.0 1.7 0.9
Cecal (Sows) (120) 0.8 0.8 [0.0 - 4.6] 2.5 19.2 56.7 20.0 0.8 0.8
Cephems Cefoxitin Retail Chickens (360) 0.3 5.0 [3.0 - 7.8] 0.3 0.3 11.7 69.7 12.8 0.3 1.9 3.1
Cecal (48) 2.1 2.1 [0.1 - 11.1] 4.2 12.5 62.5 16.7 2.1 2.1
Retail Ground Turkey (374) 1.1 7.8 [5.3 - 10.9] 14.7 66.3 10.2 1.1 2.1 5.6
Cecal (29) 3.5 3.4 [0.1 - 17.8] 13.8 65.5 13.8 3.5 3.5
Retail Ground Beef (227) 0.9 1.3 [0.3 - 3.8] 2.2 31.3 56.0 8.4 0.9 0.4 0.9
Cecal (Beef) (293) 1.4 0.0 [0.0 - 1.3] 0.3 1.4 19.5 63.8 13.7 1.4
Cecal (Dairy) (256) 0.4 1.2 [0.2 - 3.4] 18.4 69.9 10.2 0.4 0.4 0.8
Retail Pork Chops (208) 0.0 1.0 [0.1 - 3.4] 0.5 20.7 71.2 6.7 0.5 0.5
Cecal (Market Hogs) (118) 0.0 0.8 [0.0 - 4.6] 15.3 72.9 11.0 0.9
Cecal (Sows) (120) 0.8 0.8 [0.0 - 4.6] 20.0 71.7 6.7 0.8 0.8
Ceftiofur Retail Chickens (360) 0.0 4.4 [2.6 - 7.1] 2.2 27.5 63.1 2.2 0.6 2.2 2.2
Cecal (48) 0.0 2.1 [0.1 - 11.1] 4.2 35.4 56.3 2.1 2.1
Retail Ground Turkey (374) 0.3 6.4 [4.2 - 9.4] 1.3 30.0 58.6 2.4 1.1 0.3 1.6 4.8
Cecal (29) 0.0 3.4 [0.1 - 17.8] 17.2 75.9 3.5 3.5
Retail Ground Beef (227) 0.4 1.8 [0.5 - 4.5] 6.2 40.5 50.7 0.4 0.4 0.4 1.3
Cecal (Beef) (293) 0.0 0.0 [0.0 - 1.3] 2.7 30.4 65.2 1.7
Cecal (Dairy) (256) 0.0 1.2 [0.2 - 3.4] 2.0 26.2 68.8 1.6 0.4 0.8 0.4
Retail Pork Chops (208) 0.0 1.4 [0.3 - 4.2] 2.4 43.8 51.0 1.4 1.0 0.5
Cecal (Market Hogs) (118) 0.0 0.8 [0.0 - 4.6] 0.9 33.9 61.9 2.5 0.9
Cecal (Sows) (120) 0.0 0.8 [0.0 - 4.6] 0.8 40.8 55.8 1.7 0.8
Ceftriaxone Retail Chickens (360) 0.3 4.4 [2.6 - 7.1] 94.4 0.3 0.6 0.3 0.3 1.1 2.5 0.3 0.3
Cecal (48) 0.0 2.1 [0.1 - 11.1] 97.9 2.1
Retail Ground Turkey (374) 0.5 6.7 [4.4 - 9.7] 91.4 0.8 0.5 0.5 1.3 3.2 1.9 0.3
Cecal (29) 0.0 3.4 [0.1 - 17.8] 89.7 3.5 3.5 3.5
Retail Ground Beef (227) 0.0 2.2 [0.7 - 5.1] 97.8 1.8 0.4
Cecal (Beef) (293) 0.0 0.0 [0.0 - 1.3] 100.0
Cecal (Dairy) (256) 0.0 1.6 [0.4 - 4.0] 98.4 0.8 0.8
Retail Pork Chops (208) 0.0 1.4 [0.3 - 4.2] 98.6 1.0 0.5
Cecal (Market Hogs) (118) 0.0 0.8 [0.0 - 4.6] 99.2 0.9
Cecal (Sows) (120) 0.0 0.8 [0.0 - 4.6] 99.2 0.8
1 Percent of isolates with intermediate susceptibility 2 Percent of isolates with resistance. Discrepancies between %R and sums of distribution %'s, to the right of the double vertical bars, are due to rounding.3 95% confidence intervals for percent resistant (%R) were calculated using the Clopper-Pearson exact method
Chi
cken
sC
attle
Swin
e
4 The unshaded areas indicate tthe range of dilutions tested for each antimicrobial. Single vertical bars indicate the breakpoints for susceptibility, while double vertical bars indicate the breakpoints for resistance. Numbers in the shaded areas indicate the percentages of isolates with MICs greater than the highest tested concentrations. Numbers listed for the lowest tested concentrations represent the percentages of isolates with MICs equal to or less than the lowest tested concentration.
Cat
tleSw
ine
Cat
tleSw
ine
Turk
eys
Chi
cken
sTu
rkey
sC
hick
ens
Turk
eys
Chi
cken
s
Table 85b. Distribution of MICs and Occurrence of Resistance among E. coli Isolates, 2013 Distribution (%) of MICs (µg/ml)
4
Cat
tleSw
ine
Turk
eys
171
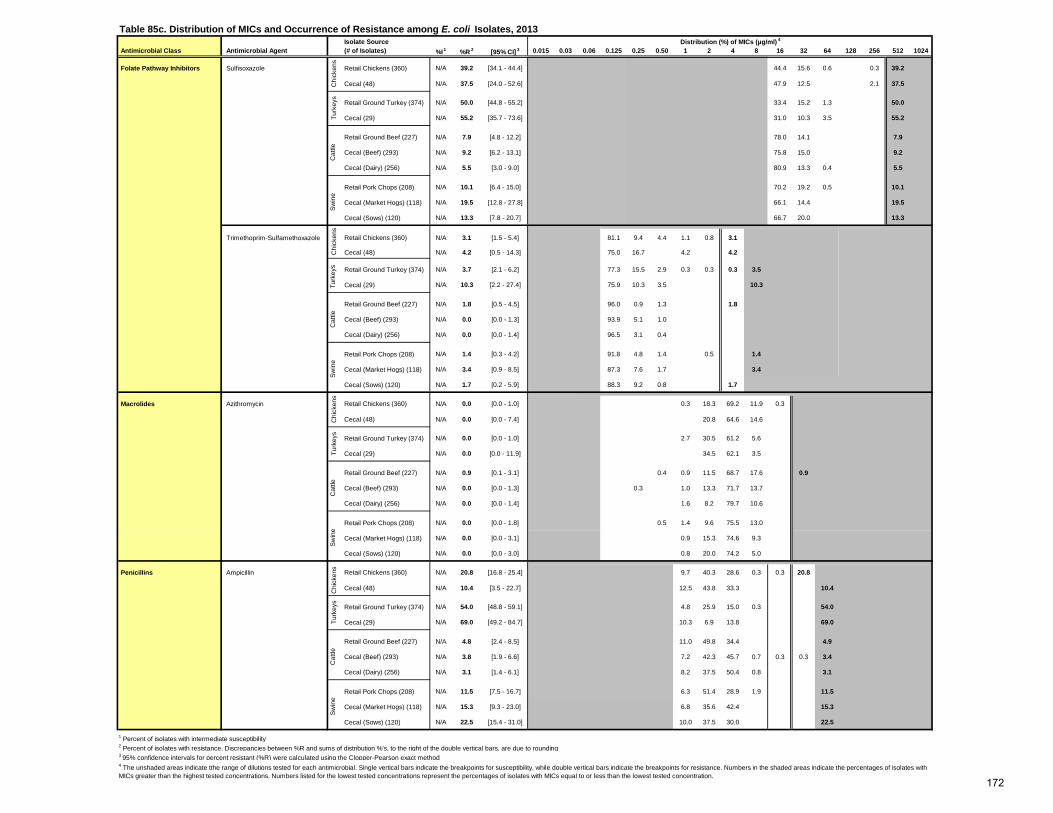
Isolate Source Antimicrobial Class Antimicrobial Agent (# of Isolates) %I
1 %R 2 [95% CI]
3 0.015 0.03 0.06 0.125 0.25 0.50 1 2 4 8 16 32 64 128 256 512 1024
Folate Pathway Inhibitors Sulfisoxazole Retail Chickens (360) N/A 39.2 [34.1 - 44.4] 44.4 15.6 0.6 0.3 39.2
Cecal (48) N/A 37.5 [24.0 - 52.6] 47.9 12.5 2.1 37.5
Retail Ground Turkey (374) N/A 50.0 [44.8 - 55.2] 33.4 15.2 1.3 50.0
Cecal (29) N/A 55.2 [35.7 - 73.6] 31.0 10.3 3.5 55.2
Retail Ground Beef (227) N/A 7.9 [4.8 - 12.2] 78.0 14.1 7.9
Cecal (Beef) (293) N/A 9.2 [6.2 - 13.1] 75.8 15.0 9.2
Cecal (Dairy) (256) N/A 5.5 [3.0 - 9.0] 80.9 13.3 0.4 5.5
Retail Pork Chops (208) N/A 10.1 [6.4 - 15.0] 70.2 19.2 0.5 10.1
Cecal (Market Hogs) (118) N/A 19.5 [12.8 - 27.8] 66.1 14.4 19.5
Cecal (Sows) (120) N/A 13.3 [7.8 - 20.7] 66.7 20.0 13.3
Trimethoprim-Sulfamethoxazole Retail Chickens (360) N/A 3.1 [1.5 - 5.4] 81.1 9.4 4.4 1.1 0.8 3.1
Cecal (48) N/A 4.2 [0.5 - 14.3] 75.0 16.7 4.2 4.2
Retail Ground Turkey (374) N/A 3.7 [2.1 - 6.2] 77.3 15.5 2.9 0.3 0.3 0.3 3.5
Cecal (29) N/A 10.3 [2.2 - 27.4] 75.9 10.3 3.5 10.3
Retail Ground Beef (227) N/A 1.8 [0.5 - 4.5] 96.0 0.9 1.3 1.8
Cecal (Beef) (293) N/A 0.0 [0.0 - 1.3] 93.9 5.1 1.0
Cecal (Dairy) (256) N/A 0.0 [0.0 - 1.4] 96.5 3.1 0.4
Retail Pork Chops (208) N/A 1.4 [0.3 - 4.2] 91.8 4.8 1.4 0.5 1.4
Cecal (Market Hogs) (118) N/A 3.4 [0.9 - 8.5] 87.3 7.6 1.7 3.4
Cecal (Sows) (120) N/A 1.7 [0.2 - 5.9] 88.3 9.2 0.8 1.7
Macrolides Azithromycin Retail Chickens (360) N/A 0.0 [0.0 - 1.0] 0.3 18.3 69.2 11.9 0.3
Cecal (48) N/A 0.0 [0.0 - 7.4] 20.8 64.6 14.6
Retail Ground Turkey (374) N/A 0.0 [0.0 - 1.0] 2.7 30.5 61.2 5.6
Cecal (29) N/A 0.0 [0.0 - 11.9] 34.5 62.1 3.5
Retail Ground Beef (227) N/A 0.9 [0.1 - 3.1] 0.4 0.9 11.5 68.7 17.6 0.9
Cecal (Beef) (293) N/A 0.0 [0.0 - 1.3] 0.3 1.0 13.3 71.7 13.7
Cecal (Dairy) (256) N/A 0.0 [0.0 - 1.4] 1.6 8.2 79.7 10.6
Retail Pork Chops (208) N/A 0.0 [0.0 - 1.8] 0.5 1.4 9.6 75.5 13.0
Cecal (Market Hogs) (118) N/A 0.0 [0.0 - 3.1] 0.9 15.3 74.6 9.3
Cecal (Sows) (120) N/A 0.0 [0.0 - 3.0] 0.8 20.0 74.2 5.0
Penicillins Ampicillin Retail Chickens (360) N/A 20.8 [16.8 - 25.4] 9.7 40.3 28.6 0.3 0.3 20.8
Cecal (48) N/A 10.4 [3.5 - 22.7] 12.5 43.8 33.3 10.4
Retail Ground Turkey (374) N/A 54.0 [48.8 - 59.1] 4.8 25.9 15.0 0.3 54.0
Cecal (29) N/A 69.0 [49.2 - 84.7] 10.3 6.9 13.8 69.0
Retail Ground Beef (227) N/A 4.8 [2.4 - 8.5] 11.0 49.8 34.4 4.9
Cecal (Beef) (293) N/A 3.8 [1.9 - 6.6] 7.2 42.3 45.7 0.7 0.3 0.3 3.4
Cecal (Dairy) (256) N/A 3.1 [1.4 - 6.1] 8.2 37.5 50.4 0.8 3.1
Retail Pork Chops (208) N/A 11.5 [7.5 - 16.7] 6.3 51.4 28.9 1.9 11.5
Cecal (Market Hogs) (118) N/A 15.3 [9.3 - 23.0] 6.8 35.6 42.4 15.3
Cecal (Sows) (120) N/A 22.5 [15.4 - 31.0] 10.0 37.5 30.0 22.5
1 Percent of isolates with intermediate susceptibility 2 Percent of isolates with resistance. Discrepancies between %R and sums of distribution %'s, to the right of the double vertical bars, are due to rounding3 95% confidence intervals for percent resistant (%R) were calculated using the Clopper-Pearson exact method4 The unshaded areas indicate tthe range of dilutions tested for each antimicrobial. Single vertical bars indicate the breakpoints for susceptibility, while double vertical bars indicate the breakpoints for resistance. Numbers in the shaded areas indicate the percentages of isolates with MICs greater than the highest tested concentrations. Numbers listed for the lowest tested concentrations represent the percentages of isolates with MICs equal to or less than the lowest tested concentration.
Turk
eys
Table 85c. Distribution of MICs and Occurrence of Resistance among E. coli Isolates, 2013 Distribution (%) of MICs (µg/ml)
4
Cat
tleSw
ine
Swin
eTu
rkey
sC
hick
ens
Turk
eys
Chi
cken
sTu
rkey
sC
hick
ens
Chi
cken
sC
attle
Swin
eC
attle
Swin
eC
attle
172
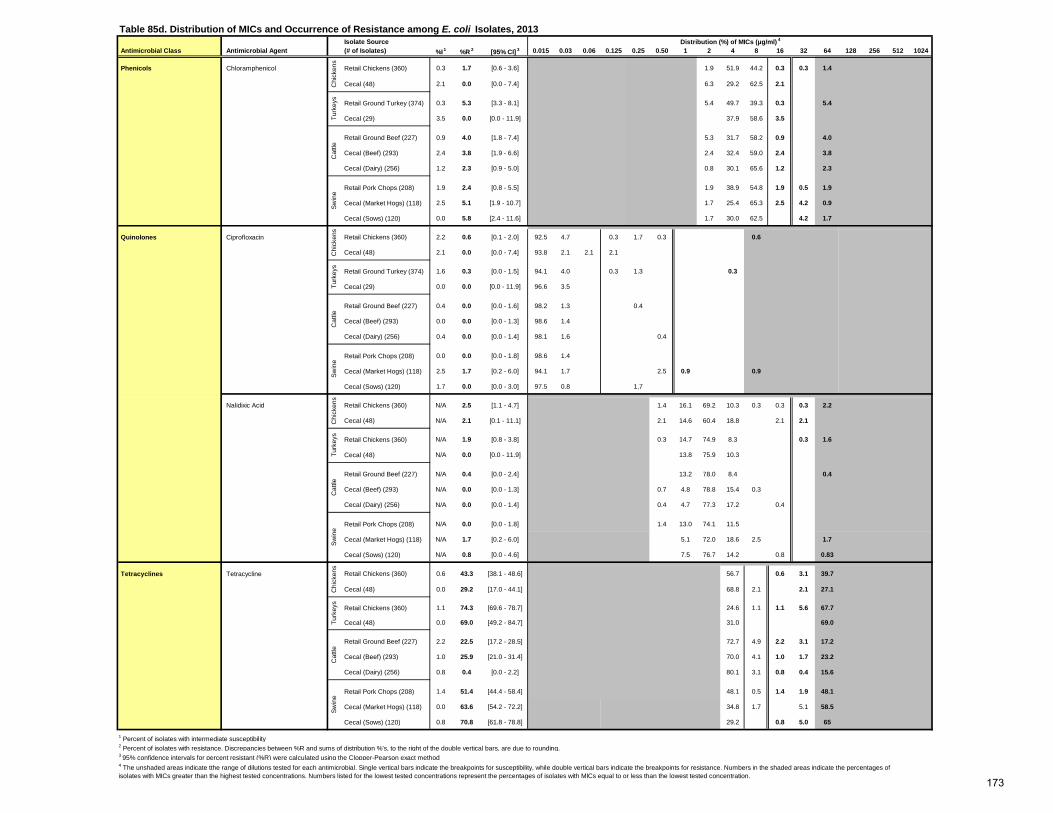
Isolate Source Antimicrobial Class Antimicrobial Agent (# of Isolates) %I
1 %R 2 [95% CI]
3 0.015 0.03 0.06 0.125 0.25 0.50 1 2 4 8 16 32 64 128 256 512 1024
Phenicols Chloramphenicol Retail Chickens (360) 0.3 1.7 [0.6 - 3.6] 1.9 51.9 44.2 0.3 0.3 1.4
Cecal (48) 2.1 0.0 [0.0 - 7.4] 6.3 29.2 62.5 2.1
Retail Ground Turkey (374) 0.3 5.3 [3.3 - 8.1] 5.4 49.7 39.3 0.3 5.4
Cecal (29) 3.5 0.0 [0.0 - 11.9] 37.9 58.6 3.5
Retail Ground Beef (227) 0.9 4.0 [1.8 - 7.4] 5.3 31.7 58.2 0.9 4.0
Cecal (Beef) (293) 2.4 3.8 [1.9 - 6.6] 2.4 32.4 59.0 2.4 3.8
Cecal (Dairy) (256) 1.2 2.3 [0.9 - 5.0] 0.8 30.1 65.6 1.2 2.3
Retail Pork Chops (208) 1.9 2.4 [0.8 - 5.5] 1.9 38.9 54.8 1.9 0.5 1.9
Cecal (Market Hogs) (118) 2.5 5.1 [1.9 - 10.7] 1.7 25.4 65.3 2.5 4.2 0.9
Cecal (Sows) (120) 0.0 5.8 [2.4 - 11.6] 1.7 30.0 62.5 4.2 1.7
Quinolones Ciprofloxacin Retail Chickens (360) 2.2 0.6 [0.1 - 2.0] 92.5 4.7 0.3 1.7 0.3 0.6
Cecal (48) 2.1 0.0 [0.0 - 7.4] 93.8 2.1 2.1 2.1
Retail Ground Turkey (374) 1.6 0.3 [0.0 - 1.5] 94.1 4.0 0.3 1.3 0.3
Cecal (29) 0.0 0.0 [0.0 - 11.9] 96.6 3.5
Retail Ground Beef (227) 0.4 0.0 [0.0 - 1.6] 98.2 1.3 0.4
Cecal (Beef) (293) 0.0 0.0 [0.0 - 1.3] 98.6 1.4
Cecal (Dairy) (256) 0.4 0.0 [0.0 - 1.4] 98.1 1.6 0.4
Retail Pork Chops (208) 0.0 0.0 [0.0 - 1.8] 98.6 1.4
Cecal (Market Hogs) (118) 2.5 1.7 [0.2 - 6.0] 94.1 1.7 2.5 0.9 0.9
Cecal (Sows) (120) 1.7 0.0 [0.0 - 3.0] 97.5 0.8 1.7
Nalidixic Acid Retail Chickens (360) N/A 2.5 [1.1 - 4.7] 1.4 16.1 69.2 10.3 0.3 0.3 0.3 2.2
Cecal (48) N/A 2.1 [0.1 - 11.1] 2.1 14.6 60.4 18.8 2.1 2.1
Retail Chickens (360) N/A 1.9 [0.8 - 3.8] 0.3 14.7 74.9 8.3 0.3 1.6
Cecal (48) N/A 0.0 [0.0 - 11.9] 13.8 75.9 10.3
Retail Ground Beef (227) N/A 0.4 [0.0 - 2.4] 13.2 78.0 8.4 0.4
Cecal (Beef) (293) N/A 0.0 [0.0 - 1.3] 0.7 4.8 78.8 15.4 0.3
Cecal (Dairy) (256) N/A 0.0 [0.0 - 1.4] 0.4 4.7 77.3 17.2 0.4
Retail Pork Chops (208) N/A 0.0 [0.0 - 1.8] 1.4 13.0 74.1 11.5
Cecal (Market Hogs) (118) N/A 1.7 [0.2 - 6.0] 5.1 72.0 18.6 2.5 1.7
Cecal (Sows) (120) N/A 0.8 [0.0 - 4.6] 7.5 76.7 14.2 0.8 0.83
Tetracyclines Tetracycline Retail Chickens (360) 0.6 43.3 [38.1 - 48.6] 56.7 0.6 3.1 39.7
Cecal (48) 0.0 29.2 [17.0 - 44.1] 68.8 2.1 2.1 27.1
Retail Chickens (360) 1.1 74.3 [69.6 - 78.7] 24.6 1.1 1.1 5.6 67.7
Cecal (48) 0.0 69.0 [49.2 - 84.7] 31.0 69.0
Retail Ground Beef (227) 2.2 22.5 [17.2 - 28.5] 72.7 4.9 2.2 3.1 17.2
Cecal (Beef) (293) 1.0 25.9 [21.0 - 31.4] 70.0 4.1 1.0 1.7 23.2
Cecal (Dairy) (256) 0.8 0.4 [0.0 - 2.2] 80.1 3.1 0.8 0.4 15.6
Retail Pork Chops (208) 1.4 51.4 [44.4 - 58.4] 48.1 0.5 1.4 1.9 48.1
Cecal (Market Hogs) (118) 0.0 63.6 [54.2 - 72.2] 34.8 1.7 5.1 58.5
Cecal (Sows) (120) 0.8 70.8 [61.8 - 78.8] 29.2 0.8 5.0 65
1 Percent of isolates with intermediate susceptibility 2 Percent of isolates with resistance. Discrepancies between %R and sums of distribution %'s, to the right of the double vertical bars, are due to rounding.3 95% confidence intervals for percent resistant (%R) were calculated using the Clopper-Pearson exact method
Swin
e
4 The unshaded areas indicate tthe range of dilutions tested for each antimicrobial. Single vertical bars indicate the breakpoints for susceptibility, while double vertical bars indicate the breakpoints for resistance. Numbers in the shaded areas indicate the percentages of isolates with MICs greater than the highest tested concentrations. Numbers listed for the lowest tested concentrations represent the percentages of isolates with MICs equal to or less than the lowest tested concentration.
Chi
cken
sTu
rkey
sC
attle
Swin
eC
attle
Cat
tleSw
ine
Cat
tleSw
ine
Chi
cken
sTu
rkey
sC
hick
ens
Turk
eys
Distribution (%) of MICs (µg/ml) 4
Chi
cken
sTu
rkey
s
Table 85d. Distribution of MICs and Occurrence of Resistance among E. coli Isolates, 2013
173
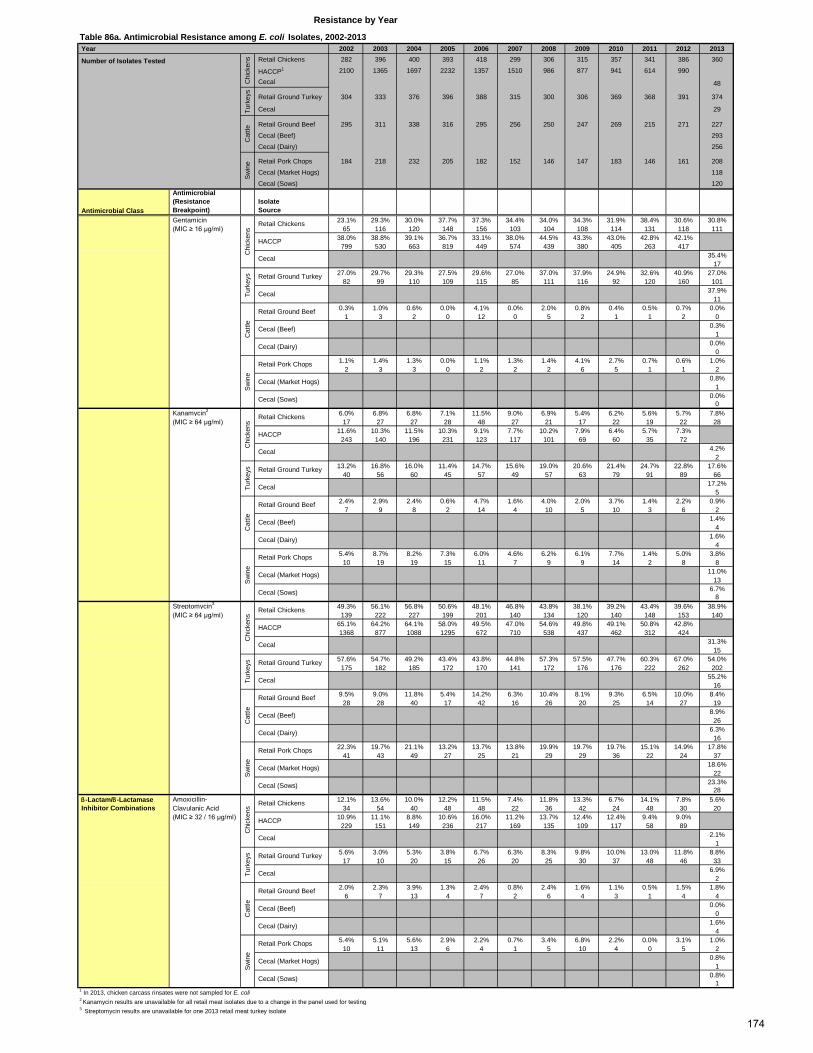
Table 86a. Antimicrobial Resistance among E. coli Isolates, 2002-2013 Year 2002 2003 2004 2005 2006 2007 2008 2009 2010 2011 2012 2013
Retail Chickens 282 396 400 393 418 299 306 315 357 341 386 360
HACCP1 2100 1365 1697 2232 1357 1510 986 877 941 614 990
Cecal 48
Retail Ground Turkey 304 333 376 396 388 315 300 306 369 368 391 374
Cecal 29
Retail Ground Beef 295 311 338 316 295 256 250 247 269 215 271 227
Cecal (Beef) 293
Cecal (Dairy) 256
Retail Pork Chops 184 218 232 205 182 152 146 147 183 146 161 208
Cecal (Market Hogs) 118
Cecal (Sows) 120
Antimicrobial Class
Antimicrobial (Resistance Breakpoint)
Isolate Source
Gentamicin 23.1% 29.3% 30.0% 37.7% 37.3% 34.4% 34.0% 34.3% 31.9% 38.4% 30.6% 30.8% (MIC ≥ 16 µg/ml) 65 116 120 148 156 103 104 108 114 131 118 111
38.0% 38.8% 39.1% 36.7% 33.1% 38.0% 44.5% 43.3% 43.0% 42.8% 42.1%799 530 663 819 449 574 439 380 405 263 417
35.4%17
27.0% 29.7% 29.3% 27.5% 29.6% 27.0% 37.0% 37.9% 24.9% 32.6% 40.9% 27.0%82 99 110 109 115 85 111 116 92 120 160 101
37.9%11
0.3% 1.0% 0.6% 0.0% 4.1% 0.0% 2.0% 0.8% 0.4% 0.5% 0.7% 0.0%1 3 2 0 12 0 5 2 1 1 2 0
0.3%1
0.0%0
1.1% 1.4% 1.3% 0.0% 1.1% 1.3% 1.4% 4.1% 2.7% 0.7% 0.6% 1.0%2 3 3 0 2 2 2 6 5 1 1 2
0.8%1
0.0%0
Kanamycin2 6.0% 6.8% 6.8% 7.1% 11.5% 9.0% 6.9% 5.4% 6.2% 5.6% 5.7% 7.8% (MIC ≥ 64 µg/ml) 17 27 27 28 48 27 21 17 22 19 22 28
11.6% 10.3% 11.5% 10.3% 9.1% 7.7% 10.2% 7.9% 6.4% 5.7% 7.3%243 140 196 231 123 117 101 69 60 35 72
4.2%2
13.2% 16.8% 16.0% 11.4% 14.7% 15.6% 19.0% 20.6% 21.4% 24.7% 22.8% 17.6%40 56 60 45 57 49 57 63 79 91 89 66
17.2%5
2.4% 2.9% 2.4% 0.6% 4.7% 1.6% 4.0% 2.0% 3.7% 1.4% 2.2% 0.9%7 9 8 2 14 4 10 5 10 3 6 2
1.4%4
1.6%4
5.4% 8.7% 8.2% 7.3% 6.0% 4.6% 6.2% 6.1% 7.7% 1.4% 5.0% 3.8%10 19 19 15 11 7 9 9 14 2 8 8
11.0%13
6.7%8
Streptomycin3 49.3% 56.1% 56.8% 50.6% 48.1% 46.8% 43.8% 38.1% 39.2% 43.4% 39.6% 38.9% (MIC ≥ 64 µg/ml) 139 222 227 199 201 140 134 120 140 148 153 140
65.1% 64.2% 64.1% 58.0% 49.5% 47.0% 54.6% 49.8% 49.1% 50.8% 42.8%1368 877 1088 1295 672 710 538 437 462 312 424
31.3%15
57.6% 54.7% 49.2% 43.4% 43.8% 44.8% 57.3% 57.5% 47.7% 60.3% 67.0% 54.0%175 182 185 172 170 141 172 176 176 222 262 202
55.2%16
9.5% 9.0% 11.8% 5.4% 14.2% 6.3% 10.4% 8.1% 9.3% 6.5% 10.0% 8.4%28 28 40 17 42 16 26 20 25 14 27 19
8.9%26
6.3%16
22.3% 19.7% 21.1% 13.2% 13.7% 13.8% 19.9% 19.7% 19.7% 15.1% 14.9% 17.8%41 43 49 27 25 21 29 29 36 22 24 37
18.6%22
23.3%28
β-Lactam/β-Lactamase Amoxicillin- 12.1% 13.6% 10.0% 12.2% 11.5% 7.4% 11.8% 13.3% 6.7% 14.1% 7.8% 5.6% Inhibitor Combinations Clavulanic Acid 34 54 40 48 48 22 36 42 24 48 30 20
(MIC ≥ 32 / 16 µg/ml) 10.9% 11.1% 8.8% 10.6% 16.0% 11.2% 13.7% 12.4% 12.4% 9.4% 9.0%229 151 149 236 217 169 135 109 117 58 89
2.1%1
5.6% 3.0% 5.3% 3.8% 6.7% 6.3% 8.3% 9.8% 10.0% 13.0% 11.8% 8.8%17 10 20 15 26 20 25 30 37 48 46 33
6.9%2
2.0% 2.3% 3.9% 1.3% 2.4% 0.8% 2.4% 1.6% 1.1% 0.5% 1.5% 1.8%6 7 13 4 7 2 6 4 3 1 4 4
0.0%0
1.6%4
5.4% 5.1% 5.6% 2.9% 2.2% 0.7% 3.4% 6.8% 2.2% 0.0% 3.1% 1.0%10 11 13 6 4 1 5 10 4 0 5 2
0.8%1
0.8%1
1 In 2013, chicken carcass rinsates were not sampled for E. coli2 Kanamycin results are unavailable for all retail meat isolates due to a change in the panel used for testing
Sw
ine
Retail Pork Chops
Cecal (Market Hogs)
Cecal (Sows)
Cat
tle
Retail Ground Beef
Cecal (Beef)
Cecal (Dairy)
3 Streptomycin results are unavailable for one 2013 retail meat turkey isolate
Turk
eys Retail Ground Turkey
Cecal
Chi
cken
s Retail Chickens
HACCP
Cecal
Cecal (Dairy)
Sw
ine
Retail Pork Chops
Cecal (Market Hogs)
Cecal (Sows)
Cat
tle
Retail Ground Beef
Cecal (Beef)
Turk
eys Retail Ground Turkey
Cecal
Chi
cken
s
Retail Chickens
HACCP
Cecal
Cat
tle
Retail Ground Beef
Cecal (Beef)
Cecal (Dairy)
Sw
ine
Retail Pork Chops
Cecal (Market Hogs)
Cecal (Sows)
Chi
cken
s
Retail Chickens
HACCP
Turk
eys Retail Ground Turkey
Cecal
Cecal
Sw
ine
Retail Pork Chops
Cecal (Market Hogs)
Cecal (Sows)
Cat
tle
Retail Ground Beef
Cecal (Beef)
Cecal (Dairy)
Resistance by Year
Number of Isolates Tested
Chi
cken
sTu
rkey
sC
attle
Sw
ine
Turk
eys Retail Ground Turkey
Cecal
Chi
cken
s
Retail Chickens
HACCP
Cecal
174
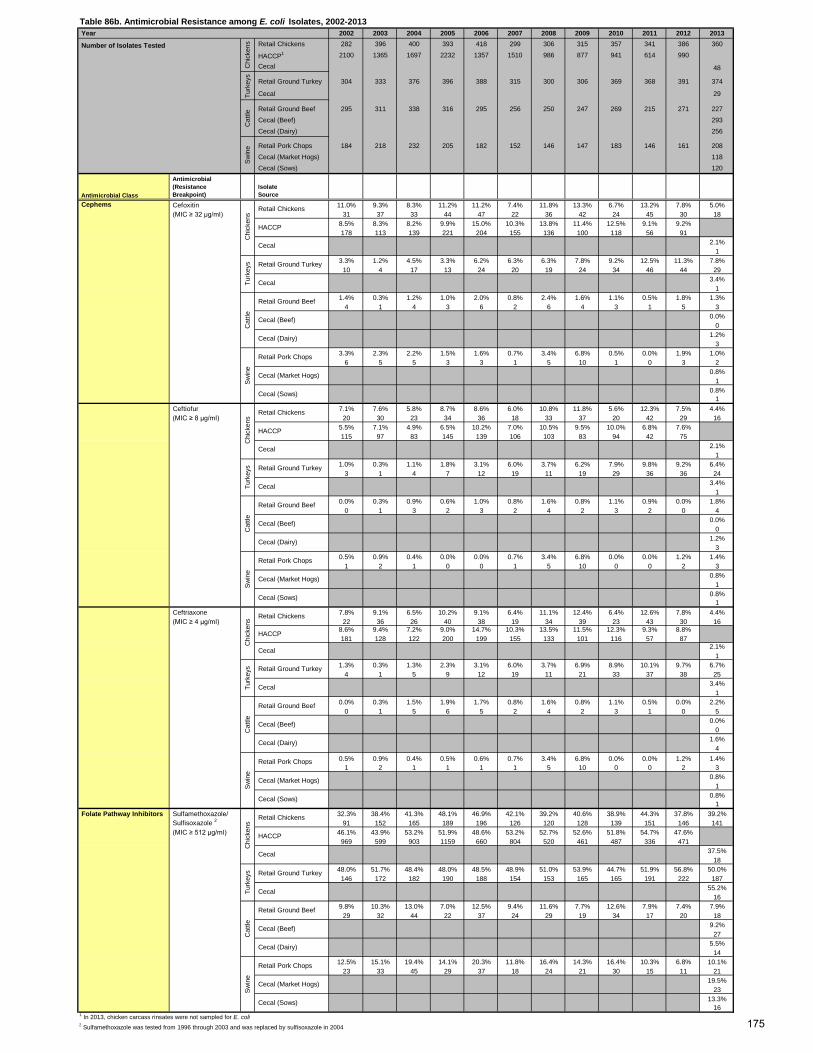
Table 86b. Antimicrobial Resistance among E. coli Isolates, 2002-2013 Year 2002 2003 2004 2005 2006 2007 2008 2009 2010 2011 2012 2013
Retail Chickens 282 396 400 393 418 299 306 315 357 341 386 360
HACCP1 2100 1365 1697 2232 1357 1510 986 877 941 614 990
Cecal 48
Retail Ground Turkey 304 333 376 396 388 315 300 306 369 368 391 374
Cecal 29
Retail Ground Beef 295 311 338 316 295 256 250 247 269 215 271 227
Cecal (Beef) 293
Cecal (Dairy) 256
Retail Pork Chops 184 218 232 205 182 152 146 147 183 146 161 208
Cecal (Market Hogs) 118
Cecal (Sows) 120
Antimicrobial Class
Antimicrobial (Resistance Breakpoint)
Isolate Source
Cefoxitin 11.0% 9.3% 8.3% 11.2% 11.2% 7.4% 11.8% 13.3% 6.7% 13.2% 7.8% 5.0% (MIC ≥ 32 µg/ml) 31 37 33 44 47 22 36 42 24 45 30 18
8.5% 8.3% 8.2% 9.9% 15.0% 10.3% 13.8% 11.4% 12.5% 9.1% 9.2%178 113 139 221 204 155 136 100 118 56 91
2.1%1
3.3% 1.2% 4.5% 3.3% 6.2% 6.3% 6.3% 7.8% 9.2% 12.5% 11.3% 7.8%10 4 17 13 24 20 19 24 34 46 44 29
3.4%1
1.4% 0.3% 1.2% 1.0% 2.0% 0.8% 2.4% 1.6% 1.1% 0.5% 1.8% 1.3%4 1 4 3 6 2 6 4 3 1 5 3
0.0%0
1.2%3
3.3% 2.3% 2.2% 1.5% 1.6% 0.7% 3.4% 6.8% 0.5% 0.0% 1.9% 1.0%6 5 5 3 3 1 5 10 1 0 3 2
0.8%1
0.8%1
Ceftiofur 7.1% 7.6% 5.8% 8.7% 8.6% 6.0% 10.8% 11.8% 5.6% 12.3% 7.5% 4.4% (MIC ≥ 8 µg/ml) 20 30 23 34 36 18 33 37 20 42 29 16
5.5% 7.1% 4.9% 6.5% 10.2% 7.0% 10.5% 9.5% 10.0% 6.8% 7.6%115 97 83 145 139 106 103 83 94 42 75
2.1%1
1.0% 0.3% 1.1% 1.8% 3.1% 6.0% 3.7% 6.2% 7.9% 9.8% 9.2% 6.4%3 1 4 7 12 19 11 19 29 36 36 24
3.4%1
0.0% 0.3% 0.9% 0.6% 1.0% 0.8% 1.6% 0.8% 1.1% 0.9% 0.0% 1.8%0 1 3 2 3 2 4 2 3 2 0 4
0.0%0
1.2%3
0.5% 0.9% 0.4% 0.0% 0.0% 0.7% 3.4% 6.8% 0.0% 0.0% 1.2% 1.4%1 2 1 0 0 1 5 10 0 0 2 3
0.8%1
0.8%1
Ceftriaxone 7.8% 9.1% 6.5% 10.2% 9.1% 6.4% 11.1% 12.4% 6.4% 12.6% 7.8% 4.4% (MIC ≥ 4 µg/ml) 22 36 26 40 38 19 34 39 23 43 30 16
8.6% 9.4% 7.2% 9.0% 14.7% 10.3% 13.5% 11.5% 12.3% 9.3% 8.8%181 128 122 200 199 155 133 101 116 57 87
2.1%1
1.3% 0.3% 1.3% 2.3% 3.1% 6.0% 3.7% 6.9% 8.9% 10.1% 9.7% 6.7%4 1 5 9 12 19 11 21 33 37 38 25
3.4%1
0.0% 0.3% 1.5% 1.9% 1.7% 0.8% 1.6% 0.8% 1.1% 0.5% 0.0% 2.2%0 1 5 6 5 2 4 2 3 1 0 5
0.0%0
1.6%4
0.5% 0.9% 0.4% 0.5% 0.6% 0.7% 3.4% 6.8% 0.0% 0.0% 1.2% 1.4%1 2 1 1 1 1 5 10 0 0 2 3
0.8%1
0.8%1
Folate Pathway Inhibitors Sulfamethoxazole/ 32.3% 38.4% 41.3% 48.1% 46.9% 42.1% 39.2% 40.6% 38.9% 44.3% 37.8% 39.2% Sulfisoxazole 2 91 152 165 189 196 126 120 128 139 151 146 141 (MIC ≥ 512 µg/ml) 46.1% 43.9% 53.2% 51.9% 48.6% 53.2% 52.7% 52.6% 51.8% 54.7% 47.6%
969 599 903 1159 660 804 520 461 487 336 47137.5%
1848.0% 51.7% 48.4% 48.0% 48.5% 48.9% 51.0% 53.9% 44.7% 51.9% 56.8% 50.0%
146 172 182 190 188 154 153 165 165 191 222 18755.2%
169.8% 10.3% 13.0% 7.0% 12.5% 9.4% 11.6% 7.7% 12.6% 7.9% 7.4% 7.9%
29 32 44 22 37 24 29 19 34 17 20 189.2%
275.5%
1412.5% 15.1% 19.4% 14.1% 20.3% 11.8% 16.4% 14.3% 16.4% 10.3% 6.8% 10.1%
23 33 45 29 37 18 24 21 30 15 11 2119.5%
2313.3%
161 In 2013, chicken carcass rinsates were not sampled for E. coli2 Sulfamethoxazole was tested from 1996 through 2003 and was replaced by sulfisoxazole in 2004
Sw
ine
Retail Pork Chops
Cecal (Market Hogs)
Cecal (Sows)
Cat
tle
Retail Ground Beef
Cecal (Beef)
Cecal (Dairy)
Turk
eys Retail Ground Turkey
Cecal
Cecal (Market Hogs)
Cecal (Sows)
Chi
cken
s
Retail Chickens
HACCP
Cecal
Cat
tle
Retail Ground Beef
Cecal (Beef)
Cecal (Dairy)
Sw
ine
Retail Pork Chops
Chi
cken
s Retail Chickens
HACCP
Cecal
Turk
eys Retail Ground Turkey
Cecal
Sw
ine
Retail Pork Chops
Cecal (Market Hogs)
Cecal (Sows)
Cat
tle
Retail Ground Beef
Cecal (Beef)
Cecal (Dairy)
Turk
eys Retail Ground Turkey
Cecal
Chi
cken
s
Retail Chickens
HACCP
Cecal
Sw
ine
Retail Pork Chops
Cecal (Market Hogs)
Cecal (Sows)
Cat
tle
Retail Ground Beef
Cecal (Beef)
Cecal (Dairy)
Turk
eys Retail Ground Turkey
Cecal
Sw
ine
Cephems
Chi
cken
s
Retail Chickens
HACCP
CecalTu
rkey
sC
attle
Number of Isolates Tested
Chi
cken
s
175
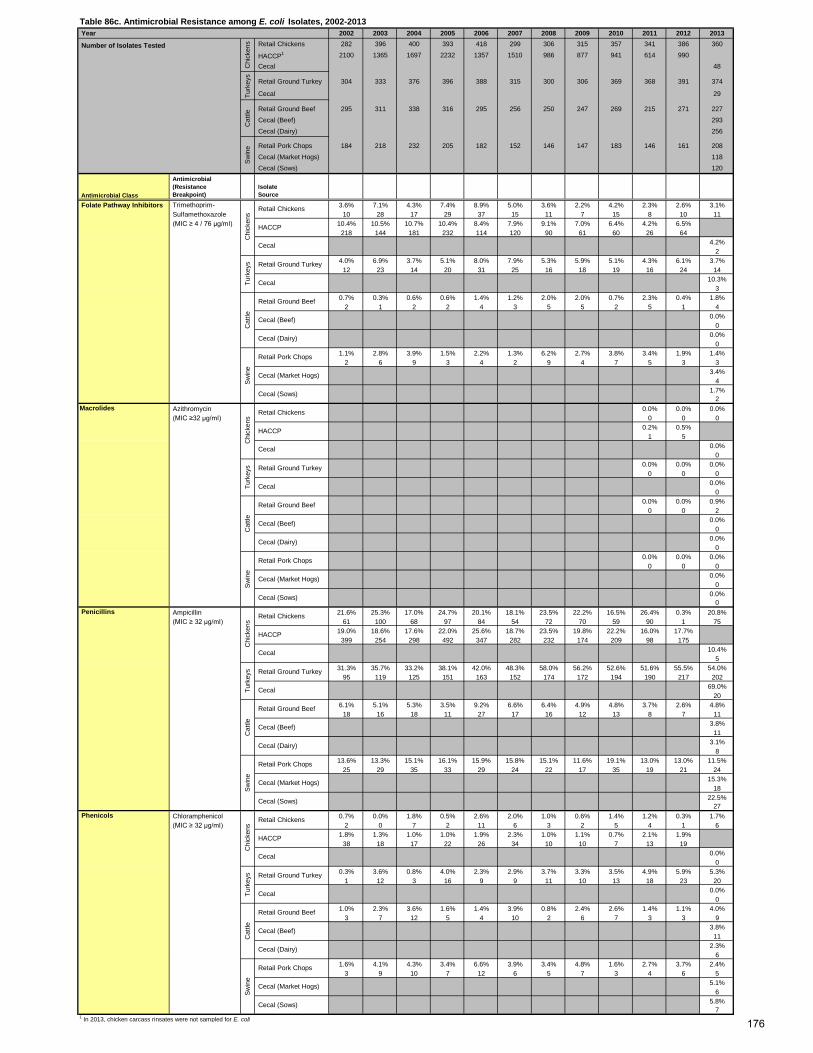
Table 86c. Antimicrobial Resistance among E. coli Isolates, 2002-2013 Year 2002 2003 2004 2005 2006 2007 2008 2009 2010 2011 2012 2013
Retail Chickens 282 396 400 393 418 299 306 315 357 341 386 360
HACCP1 2100 1365 1697 2232 1357 1510 986 877 941 614 990
Cecal 48
Retail Ground Turkey 304 333 376 396 388 315 300 306 369 368 391 374
Cecal 29
Retail Ground Beef 295 311 338 316 295 256 250 247 269 215 271 227
Cecal (Beef) 293
Cecal (Dairy) 256
Retail Pork Chops 184 218 232 205 182 152 146 147 183 146 161 208
Cecal (Market Hogs) 118
Cecal (Sows) 120
Antimicrobial Class
Antimicrobial (Resistance Breakpoint)
Isolate Source
Folate Pathway Inhibitors Trimethoprim- 3.6% 7.1% 4.3% 7.4% 8.9% 5.0% 3.6% 2.2% 4.2% 2.3% 2.6% 3.1% Sulfamethoxazole 10 28 17 29 37 15 11 7 15 8 10 11 (MIC ≥ 4 / 76 µg/ml) 10.4% 10.5% 10.7% 10.4% 8.4% 7.9% 9.1% 7.0% 6.4% 4.2% 6.5%
218 144 181 232 114 120 90 61 60 26 644.2%
24.0% 6.9% 3.7% 5.1% 8.0% 7.9% 5.3% 5.9% 5.1% 4.3% 6.1% 3.7%
12 23 14 20 31 25 16 18 19 16 24 1410.3%
30.7% 0.3% 0.6% 0.6% 1.4% 1.2% 2.0% 2.0% 0.7% 2.3% 0.4% 1.8%
2 1 2 2 4 3 5 5 2 5 1 40.0%
00.0%
01.1% 2.8% 3.9% 1.5% 2.2% 1.3% 6.2% 2.7% 3.8% 3.4% 1.9% 1.4%
2 6 9 3 4 2 9 4 7 5 3 33.4%
41.7%
2Macrolides Azithromycin 0.0% 0.0% 0.0%
(MIC ≥32 µg/ml) 0 0 00.2% 0.5%
1 50.0%
00.0% 0.0% 0.0%
0 0 00.0%
00.0% 0.0% 0.9%
0 0 20.0%
00.0%
00.0% 0.0% 0.0%
0 0 00.0%
00.0%
0 Ampicillin 21.6% 25.3% 17.0% 24.7% 20.1% 18.1% 23.5% 22.2% 16.5% 26.4% 0.3% 20.8% (MIC ≥ 32 µg/ml) 61 100 68 97 84 54 72 70 59 90 1 75
19.0% 18.6% 17.6% 22.0% 25.6% 18.7% 23.5% 19.8% 22.2% 16.0% 17.7%399 254 298 492 347 282 232 174 209 98 175
10.4%5
31.3% 35.7% 33.2% 38.1% 42.0% 48.3% 58.0% 56.2% 52.6% 51.6% 55.5% 54.0%95 119 125 151 163 152 174 172 194 190 217 202
69.0%20
6.1% 5.1% 5.3% 3.5% 9.2% 6.6% 6.4% 4.9% 4.8% 3.7% 2.6% 4.8%18 16 18 11 27 17 16 12 13 8 7 11
3.8%11
3.1%8
13.6% 13.3% 15.1% 16.1% 15.9% 15.8% 15.1% 11.6% 19.1% 13.0% 13.0% 11.5%25 29 35 33 29 24 22 17 35 19 21 24
15.3%18
22.5%27
Chloramphenicol 0.7% 0.0% 1.8% 0.5% 2.6% 2.0% 1.0% 0.6% 1.4% 1.2% 0.3% 1.7% (MIC ≥ 32 µg/ml) 2 0 7 2 11 6 3 2 5 4 1 6
1.8% 1.3% 1.0% 1.0% 1.9% 2.3% 1.0% 1.1% 0.7% 2.1% 1.9%38 18 17 22 26 34 10 10 7 13 19
0.0%0
0.3% 3.6% 0.8% 4.0% 2.3% 2.9% 3.7% 3.3% 3.5% 4.9% 5.9% 5.3%1 12 3 16 9 9 11 10 13 18 23 20
0.0%0
1.0% 2.3% 3.6% 1.6% 1.4% 3.9% 0.8% 2.4% 2.6% 1.4% 1.1% 4.0%3 7 12 5 4 10 2 6 7 3 3 9
3.8%11
2.3%6
1.6% 4.1% 4.3% 3.4% 6.6% 3.9% 3.4% 4.8% 1.6% 2.7% 3.7% 2.4%3 9 10 7 12 6 5 7 3 4 6 5
5.1%6
5.8%7
1 In 2013, chicken carcass rinsates were not sampled for E. coli
Sw
ine
Retail Pork Chops
Cecal (Market Hogs)
Cecal (Sows)
Cat
tle
Retail Ground Beef
Cecal (Beef)
Cecal (Dairy)
Turk
eys Retail Ground Turkey
Cecal
Cat
tle
Retail Ground Beef
Cecal (Beef)
Cecal (Dairy)
Phenicols
Chi
cken
s
Retail Chickens
HACCP
Cecal
Sw
ine
Retail Pork Chops
Cecal (Market Hogs)
Cecal (Sows)
Turk
eys Retail Ground Turkey
Cecal
Cat
tle
Retail Ground Beef
Cecal (Beef)
Cecal (Dairy)
Penicillins
Chi
cken
s
Retail Chickens
HACCP
Cecal
Sw
ine
Retail Pork Chops
Cecal (Market Hogs)
Cecal (Sows)
Turk
eys Retail Ground Turkey
Cecal
Chi
cken
s
Retail Chickens
HACCP
Cecal
Sw
ine
Retail Pork Chops
Cecal (Market Hogs)
Cecal (Sows)
Cat
tle
Retail Ground Beef
Cecal (Beef)
Cecal (Dairy)
Turk
eys Retail Ground Turkey
Cecal
Retail Chickens
HACCP
Cecal
Number of Isolates Tested
Chi
cken
sTu
rkey
sC
attle
Sw
ine
Chi
cken
s
176

Table 86d. Antimicrobial Resistance among E. col i Isolates, 2002-2013 Year 2002 2003 2004 2005 2006 2007 2008 2009 2010 2011 2012 2013
Retail Chickens 282 396 400 393 418 299 306 315 357 341 386 360
HACCP1 2100 1365 1697 2232 1357 1510 986 877 941 614 990
Cecal 48
Retail Ground Turkey 304 333 376 396 388 315 300 306 369 368 391 374
Cecal 29
Retail Ground Beef 295 311 338 316 295 256 250 247 269 215 271 227
Cecal (Beef) 293
Cecal (Dairy) 256
Retail Pork Chops 184 218 232 205 182 152 146 147 183 146 161 208
Cecal (Market Hogs) 118
Cecal (Sows) 120
Antimicrobial Class
Antimicrobial (Resistance Breakpoint)
Isolate Source
Quinolones Ciprofloxacin 0.0% 0.0% 0.0% 0.0% 0.0% 0.0% 0.0% 0.3% 0.3% 0.0% 0.0% 0.6% (MIC ≥ 1 µg/ml) 0 0 0 0 0 0 0 1 1 0 0 2
0.3% 0.2% 0.2% 0.5% 0.1% 0.1% 0.6% 0.5% 0.2% 0.3% 0.5%6 3 3 11 1 1 6 4 2 2 5
0.0%0
0.0% 0.3% 0.8% 0.0% 0.5% 0.3% 0.0% 0.7% 0.5% 0.0% 0.3% 0.3%0 1 3 0 2 1 0 2 2 0 1 1
0.0%0
0.0% 0.0% 0.0% 0.0% 0.0% 0.0% 0.0% 0.0% 0.0% 0.0% 0.0% 0.0%0 0 0 0 0 0 0 0 0 0 0 0
0.0%0
0.0%0
0.0% 0.0% 0.0% 0.0% 0.0% 0.0% 0.0% 0.0% 0.0% 0.0% 0.0% 0.0%0 0 0 0 0 0 0 0 0 0 0 0
1.7%2
0.0%0
Nalidixic Acid 2.8% 4.0% 7.0% 6.6% 5.0% 3.0% 2.9% 2.9% 3.6% 2.3% 1.8% 2.5% (MIC ≥ 32 µg/ml) 8 16 28 26 21 9 9 9 13 8 7 9
6.8% 6.2% 6.8% 7.5% 5.4% 4.2% 6.0% 3.2% 3.4% 2.3% 2.4%142 84 115 168 73 64 59 28 32 14 24
2.1%1
4.3% 11.7% 10.6% 10.4% 5.2% 2.2% 3.7% 2.6% 2.7% 1.6% 0.3% 1.9%13 39 40 41 20 7 11 8 10 6 1 7
0.0%0
0.0% 1.0% 1.5% 1.3% 0.7% 0.4% 0.4% 0.4% 0.0% 0.0% 0.0% 0.4%0 3 5 4 2 1 1 1 0 0 0 1
0.0%0
0.0%0
0.5% 0.5% 0.0% 1.5% 0.5% 0.0% 0.0% 0.0% 0.5% 0.0% 0.0% 0.0%1 1 0 3 1 0 0 0 1 0 0 0
1.7%2
0.8%1
Tetracycline 46.1% 42.9% 48.0% 46.6% 50.5% 40.5% 43.8% 41.6% 38.9% 40.8% 39.4% 43.3% (MIC ≥ 16 µg/ml) 130 170 192 183 211 121 134 131 139 139 152 156
58.6% 52.2% 50.3% 48.9% 49.0% 40.2% 47.4% 49.1% 42.9% 46.6% 45.4%1231 713 853 1092 665 607 467 431 404 286 449
29.2%14
77.0% 77.8% 74.2% 78.0% 76.5% 80.0% 85.7% 82.0% 69.4% 79.9% 77.2% 74.3%234 259 279 309 297 252 257 251 256 294 302 278
69.0%20
30.9% 25.1% 22.8% 16.5% 25.4% 21.9% 24.0% 18.6% 22.7% 17.7% 22.1% 22.5%91 78 77 52 75 56 60 62 61 38 60 51
25.9%76
0.4%1
52.7% 46.3% 56.0% 45.9% 52.7% 50.0% 54.8% 46.9% 44.3% 46.6% 39.1% 51.4%97 101 130 94 96 76 80 69 81 68 63 107
63.6%75
70.8%85
1 In 2013, chicken carcass rinsates were not sampled for E. coli
Sw
ine
Retail Pork Chops
Cecal (Market Hogs)
Cecal (Sows)
Cat
tle
Retail Ground Beef
Cecal (Beef)
Cecal (Dairy)
Turk
eys Retail Ground Turkey
Cecal
Cat
tle
Retail Ground Beef
Cecal (Beef)
Cecal (Dairy)
Tetracyclines
Chi
cken
s
Retail Chickens
HACCP
Cecal
Sw
ine
Retail Pork Chops
Cecal (Market Hogs)
Cecal (Sows)
Turk
eys Retail Ground Turkey
Cecal
Chi
cken
s
Retail Chickens
HACCP
Cecal
Sw
ine
Retail Pork Chops
Cecal (Market Hogs)
Cecal (Sows)
Cat
tle
Retail Ground Beef
Cecal (Beef)
Cecal (Dairy)
Turk
eys Retail Ground Turkey
Cecal
Retail Chickens
HACCP
Cecal
Number of Isolates Tested
Chi
cken
sTu
rkey
sC
attle
Sw
ine
Chi
cken
s
177
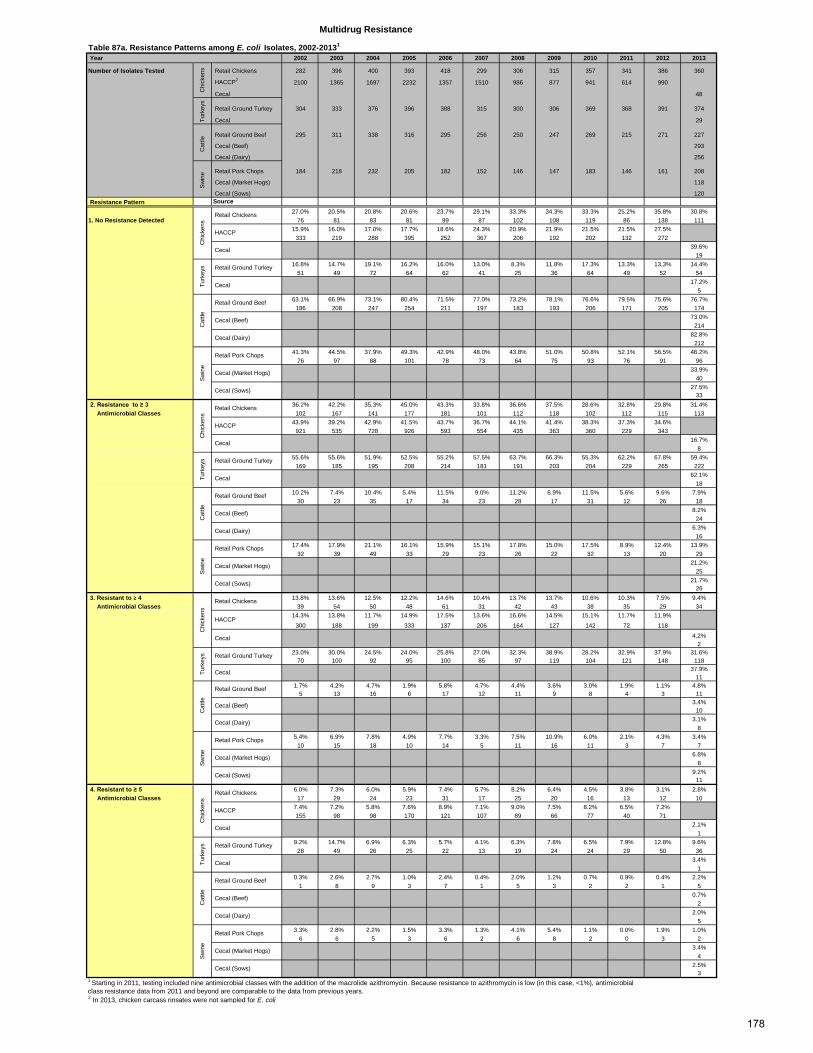
Year 2002 2003 2004 2005 2006 2007 2008 2009 2010 2011 2012 2013
Number of Isolates Tested Retail Chickens 282 396 400 393 418 299 306 315 357 341 386 360
HACCP2 2100 1365 1697 2232 1357 1510 986 877 941 614 990
Cecal 48
Retail Ground Turkey 304 333 376 396 388 315 300 306 369 368 391 374
Cecal 29
Retail Ground Beef 295 311 338 316 295 256 250 247 269 215 271 227
Cecal (Beef) 293
Cecal (Dairy) 256
Retail Pork Chops 184 218 232 205 182 152 146 147 183 146 161 208
Cecal (Market Hogs) 118
Cecal (Sows) 120 Resistance Pattern Source
27.0% 20.5% 20.8% 20.6% 23.7% 29.1% 33.3% 34.3% 33.3% 25.2% 35.8% 30.8%1. No Resistance Detected 76 81 83 81 99 87 102 108 119 86 138 111
15.9% 16.0% 17.0% 17.7% 18.6% 24.3% 20.9% 21.9% 21.5% 21.5% 27.5%333 219 288 395 252 367 206 192 202 132 272
39.6%19
16.8% 14.7% 19.1% 16.2% 16.0% 13.0% 8.3% 11.8% 17.3% 13.3% 13.3% 14.4%51 49 72 64 62 41 25 36 64 49 52 54
17.2%5
63.1% 66.9% 73.1% 80.4% 71.5% 77.0% 73.2% 78.1% 76.6% 79.5% 75.6% 76.7%186 208 247 254 211 197 183 193 206 171 205 174
73.0%214
82.8%212
41.3% 44.5% 37.9% 49.3% 42.9% 48.0% 43.8% 51.0% 50.8% 52.1% 56.5% 46.2%76 97 88 101 78 73 64 75 93 76 91 96
33.9%40
27.5%33
2. Resistance to ≥ 3 36.2% 42.2% 35.3% 45.0% 43.3% 33.8% 36.6% 37.5% 28.6% 32.8% 29.8% 31.4% Antimicrobial Classes 102 167 141 177 181 101 112 118 102 112 115 113
43.9% 39.2% 42.9% 41.5% 43.7% 36.7% 44.1% 41.4% 38.3% 37.3% 34.6%921 535 728 926 593 554 435 363 360 229 343
16.7%8
55.6% 55.6% 51.9% 52.5% 55.2% 57.5% 63.7% 66.3% 55.3% 62.2% 67.8% 59.4%169 185 195 208 214 181 191 203 204 229 265 222
62.1%18
10.2% 7.4% 10.4% 5.4% 11.5% 9.0% 11.2% 6.9% 11.5% 5.6% 9.6% 7.9%30 23 35 17 34 23 28 17 31 12 26 18
8.2%24
6.3%16
17.4% 17.9% 21.1% 16.1% 15.9% 15.1% 17.8% 15.0% 17.5% 8.9% 12.4% 13.9%32 39 49 33 29 23 26 22 32 13 20 29
21.2%25
21.7%26
3. Resistant to ≥ 4 13.8% 13.6% 12.5% 12.2% 14.6% 10.4% 13.7% 13.7% 10.6% 10.3% 7.5% 9.4% Antimicrobial Classes 39 54 50 48 61 31 42 43 38 35 29 34
14.3% 13.8% 11.7% 14.9% 17.5% 13.6% 16.6% 14.5% 15.1% 11.7% 11.9%
300 188 199 333 137 206 164 127 142 72 118
4.2%2
23.0% 30.0% 24.5% 24.0% 25.8% 27.0% 32.3% 38.9% 28.2% 32.9% 37.9% 31.6%70 100 92 95 100 85 97 119 104 121 148 118
37.9%11
1.7% 4.2% 4.7% 1.9% 5.8% 4.7% 4.4% 3.6% 3.0% 1.9% 1.1% 4.8%5 13 16 6 17 12 11 9 8 4 3 11
3.4%10
3.1%8
5.4% 6.9% 7.8% 4.9% 7.7% 3.3% 7.5% 10.9% 6.0% 2.1% 4.3% 3.4%10 15 18 10 14 5 11 16 11 3 7 7
6.8%8
9.2%11
4. Resistant to ≥ 5 6.0% 7.3% 6.0% 5.9% 7.4% 5.7% 8.2% 6.4% 4.5% 3.8% 3.1% 2.8% Antimicrobial Classes 17 29 24 23 31 17 25 20 16 13 12 10
7.4% 7.2% 5.8% 7.6% 8.9% 7.1% 9.0% 7.5% 8.2% 6.5% 7.2%155 98 98 170 121 107 89 66 77 40 71
2.1%1
9.2% 14.7% 6.9% 6.3% 5.7% 4.1% 6.3% 7.8% 6.5% 7.9% 12.8% 9.6%28 49 26 25 22 13 19 24 24 29 50 36
3.4%1
0.3% 2.6% 2.7% 1.0% 2.4% 0.4% 2.0% 1.2% 0.7% 0.9% 0.4% 2.2%1 8 9 3 7 1 5 3 2 2 1 5
0.7%2
2.0%5
3.3% 2.8% 2.2% 1.5% 3.3% 1.3% 4.1% 5.4% 1.1% 0.0% 1.9% 1.0%6 6 5 3 6 2 6 8 2 0 3 2
3.4%4
2.5%3
2 In 2013, chicken carcass rinsates were not sampled for E. coli
1 Starting in 2011, testing included nine antimicrobial classes with the addition of the macrolide azithromycin. Because resistance to azithromycin is low (in this case, <1%), antimicrobial class resistance data from 2011 and beyond are comparable to the data from previous years.
Cat
tle
Retail Ground Beef
Cecal (Beef)
Cecal (Dairy)
Swin
e
Retail Pork Chops
Cecal (Market Hogs)
Cecal (Sows)
Chi
cken
s
Retail Chickens
HACCP
Cecal
Turk
eys Retail Ground Turkey
Cecal
Cat
tle
Retail Ground Beef
Cecal (Beef)
Cecal (Dairy)
Swin
e
Retail Pork Chops
Cecal (Market Hogs)
Cecal (Sows)
Chi
cken
s
Retail Chickens
HACCP
Cecal
Turk
eys Retail Ground Turkey
Cecal
Cat
tle
Retail Ground Beef
Cecal (Beef)
Cecal (Dairy)
Swin
e
Retail Pork Chops
Cecal (Market Hogs)
Cecal (Sows)
Chi
cken
s
Retail Chickens
HACCP
Cecal
Turk
eys Retail Ground Turkey
Cecal
Cat
tle
Retail Ground Beef
Cecal (Beef)
Cecal (Dairy)
Swin
e
Retail Pork Chops
Cecal (Market Hogs)
Cecal (Sows)
Chi
cken
s
Retail Chickens
HACCP
Cecal
Turk
eys Retail Ground Turkey
Cecal
Multidrug Resistance
Table 87a. Resistance Patterns among E. coli Isolates, 2002-20131
Chi
cken
sTu
rkey
sC
attle
Swin
e
178
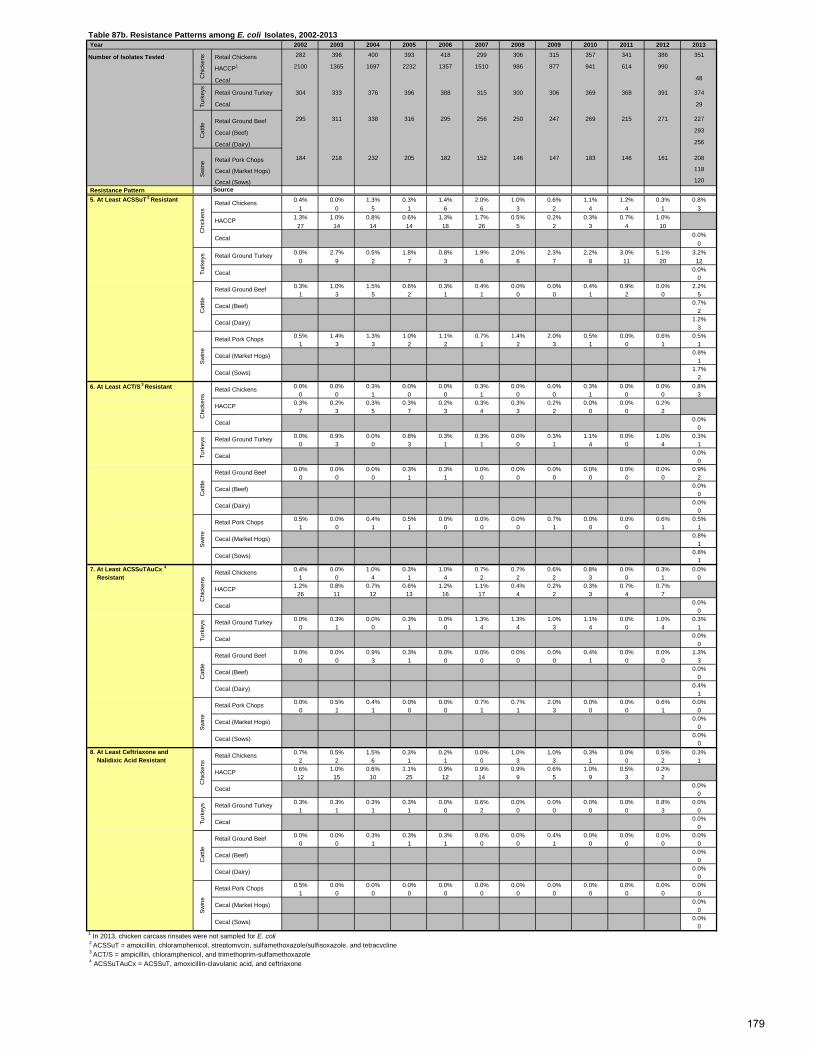
Year 2002 2003 2004 2005 2006 2007 2008 2009 2010 2011 2012 2013
Number of Isolates Tested Retail Chickens 282 396 400 393 418 299 306 315 357 341 386 351
HACCP1 2100 1365 1697 2232 1357 1510 986 877 941 614 990
Cecal 48
Retail Ground Turkey 304 333 376 396 388 315 300 306 369 368 391 374
Cecal 29
Retail Ground Beef 295 311 338 316 295 256 250 247 269 215 271 227
Cecal (Beef) 293
Cecal (Dairy) 256
Retail Pork Chops 184 218 232 205 182 152 146 147 183 146 161 208
Cecal (Market Hogs) 118
Cecal (Sows) 120 Resistance Pattern Source 5. At Least ACSSuT
2 Resistant 0.4% 0.0% 1.3% 0.3% 1.4% 2.0% 1.0% 0.6% 1.1% 1.2% 0.3% 0.8%1 0 5 1 6 6 3 2 4 4 1 3
1.3% 1.0% 0.8% 0.6% 1.3% 1.7% 0.5% 0.2% 0.3% 0.7% 1.0%27 14 14 14 18 26 5 2 3 4 10
0.0%0
0.0% 2.7% 0.5% 1.8% 0.8% 1.9% 2.0% 2.3% 2.2% 3.0% 5.1% 3.2%0 9 2 7 3 6 6 7 8 11 20 12
0.0%0
0.3% 1.0% 1.5% 0.6% 0.3% 0.4% 0.0% 0.0% 0.4% 0.9% 0.0% 2.2%1 3 5 2 1 1 0 0 1 2 0 5
0.7%2
1.2%3
0.5% 1.4% 1.3% 1.0% 1.1% 0.7% 1.4% 2.0% 0.5% 0.0% 0.6% 0.5%1 3 3 2 2 1 2 3 1 0 1 1
0.8%1
1.7%2
6. At Least ACT/S 3 Resistant 0.0% 0.0% 0.3% 0.0% 0.0% 0.3% 0.0% 0.0% 0.3% 0.0% 0.0% 0.8%
0 0 1 0 0 1 0 0 1 0 0 30.3% 0.2% 0.3% 0.3% 0.2% 0.3% 0.3% 0.2% 0.0% 0.0% 0.2%
7 3 5 7 3 4 3 2 0 0 20.0%
00.0% 0.9% 0.0% 0.8% 0.3% 0.3% 0.0% 0.3% 1.1% 0.0% 1.0% 0.3%
0 3 0 3 1 1 0 1 4 0 4 10.0%
00.0% 0.0% 0.0% 0.3% 0.3% 0.0% 0.0% 0.0% 0.0% 0.0% 0.0% 0.9%
0 0 0 1 1 0 0 0 0 0 0 20.0%
00.0%
00.5% 0.0% 0.4% 0.5% 0.0% 0.0% 0.0% 0.7% 0.0% 0.0% 0.6% 0.5%
1 0 1 1 0 0 0 1 0 0 1 10.8%
10.8%
1 7. At Least ACSSuTAuCx 4 0.4% 0.0% 1.0% 0.3% 1.0% 0.7% 0.7% 0.6% 0.8% 0.0% 0.3% 0.0% Resistant 1 0 4 1 4 2 2 2 3 0 1 0
1.2% 0.8% 0.7% 0.6% 1.2% 1.1% 0.4% 0.2% 0.3% 0.7% 0.7%26 11 12 13 16 17 4 2 3 4 7
0.0%0
0.0% 0.3% 0.0% 0.3% 0.0% 1.3% 1.3% 1.0% 1.1% 0.0% 1.0% 0.3%0 1 0 1 0 4 4 3 4 0 4 1
0.0%0
0.0% 0.0% 0.9% 0.3% 0.0% 0.0% 0.0% 0.0% 0.4% 0.0% 0.0% 1.3%0 0 3 1 0 0 0 0 1 0 0 3
0.0%0
0.4%1
0.0% 0.5% 0.4% 0.0% 0.0% 0.7% 0.7% 2.0% 0.0% 0.0% 0.6% 0.0%0 1 1 0 0 1 1 3 0 0 1 0
0.0%0
0.0%0
8. At Least Ceftriaxone and 0.7% 0.5% 1.5% 0.3% 0.2% 0.0% 1.0% 1.0% 0.3% 0.0% 0.5% 0.3% Nalidixic Acid Resistant 2 2 6 1 1 0 3 3 1 0 2 1
0.6% 1.0% 0.6% 1.1% 0.9% 0.9% 0.9% 0.6% 1.0% 0.5% 0.2%12 15 10 25 12 14 9 5 9 3 2
0.0%0
0.3% 0.3% 0.3% 0.3% 0.0% 0.6% 0.0% 0.0% 0.0% 0.0% 0.8% 0.0%1 1 1 1 0 2 0 0 0 0 3 0
0.0%0
0.0% 0.0% 0.3% 0.3% 0.3% 0.0% 0.0% 0.4% 0.0% 0.0% 0.0% 0.0%0 0 1 1 1 0 0 1 0 0 0 0
0.0%0
0.0%0
0.5% 0.0% 0.0% 0.0% 0.0% 0.0% 0.0% 0.0% 0.0% 0.0% 0.0% 0.0%1 0 0 0 0 0 0 0 0 0 0 0
0.0%0
0.0%0
1 In 2013, chicken carcass rinsates were not sampled for E. coli 2 ACSSuT = ampicillin, chloramphenicol, streptomycin, sulfamethoxazole/sulfisoxazole, and tetracycline 3 ACT/S = ampicillin, chloramphenicol, and trimethoprim-sulfamethoxazole 4 ACSSuTAuCx = ACSSuT, amoxicillin-clavulanic acid, and ceftriaxone
Cat
tle
Retail Ground Beef
Cecal (Beef)
Cecal (Dairy)
Swin
e
Retail Pork Chops
Cecal (Market Hogs)
Cecal (Sows)
Chi
cken
s
Retail Chickens
HACCP
Cecal
Turk
eys Retail Ground Turkey
Cecal
Cat
tle
Retail Ground Beef
Cecal (Beef)
Cecal (Dairy)
Swin
e
Retail Pork Chops
Cecal (Market Hogs)
Cecal (Sows)
Chi
cken
s
Retail Chickens
HACCP
Cecal
Turk
eys Retail Ground Turkey
Cecal
Cat
tle
Retail Ground Beef
Cecal (Beef)
Cecal (Dairy)
Swin
e
Retail Pork Chops
Cecal (Market Hogs)
Cecal (Sows)
Chi
cken
s
Retail Chickens
HACCP
Cecal
Turk
eys Retail Ground Turkey
Cecal
Cat
tle
Retail Ground Beef
Cecal (Beef)
Cecal (Dairy)
Swin
e
Retail Pork Chops
Cecal (Market Hogs)
Cecal (Sows)
Swin
eC
hick
ens
Retail Chickens
HACCP
Cecal
Turk
eys Retail Ground Turkey
Cecal
Table 87b. Resistance Patterns among E. coli Isolates, 2002-2013
Chi
cken
sC
attle
Turk
eys
179
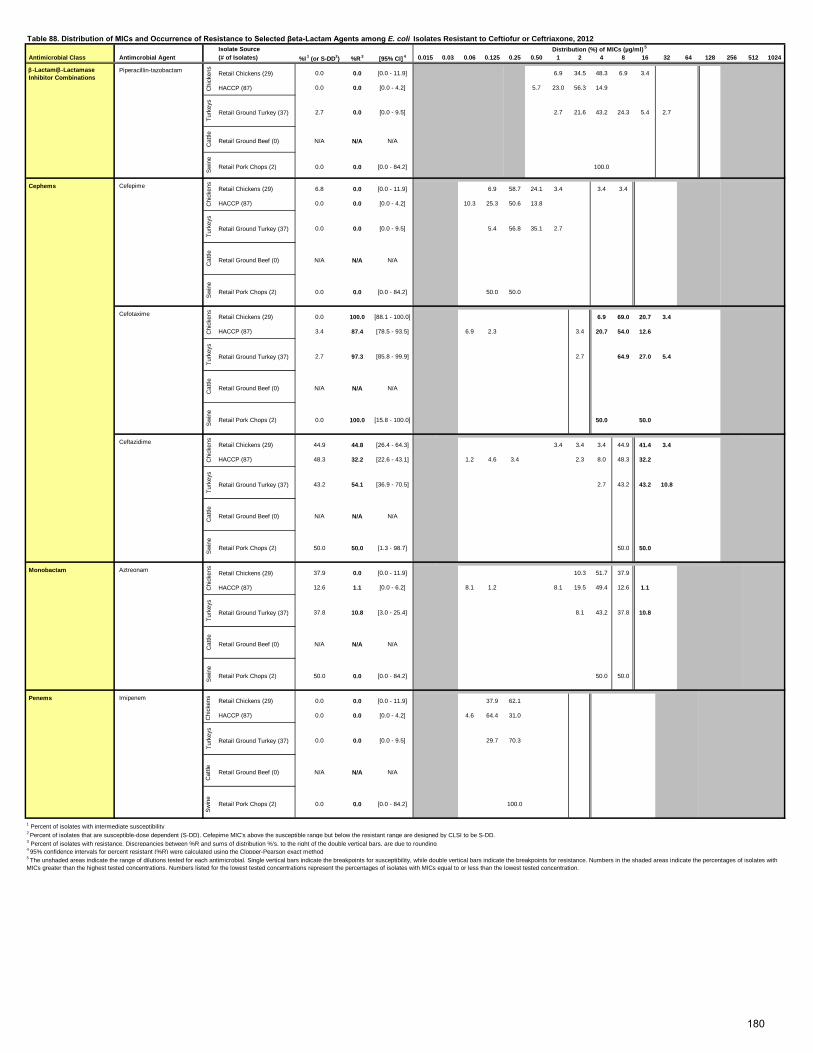
Isolate Source Antimicrobial Class Antimcrobial Agent (# of Isolates) %I
1 (or S-DD2) %R 3 [95% CI]
4 0.015 0.03 0.06 0.125 0.25 0.50 1 2 4 8 16 32 64 128 256 512 1024
β-Lactam/β-Lactamase Inhibitor Combinations
Piperacillin-tazobactam Retail Chickens (29) 0.0 0.0 [0.0 - 11.9] 6.9 34.5 48.3 6.9 3.4
HACCP (87) 0.0 0.0 [0.0 - 4.2] 5.7 23.0 56.3 14.9
Retail Ground Turkey (37) 2.7 0.0 [0.0 - 9.5] 2.7 21.6 43.2 24.3 5.4 2.7
Retail Ground Beef (0) N/A N/A N/A
Retail Pork Chops (2) 0.0 0.0 [0.0 - 84.2] 100.0
Cephems Cefepime Retail Chickens (29) 6.8 0.0 [0.0 - 11.9] 6.9 58.7 24.1 3.4 3.4 3.4
HACCP (87) 0.0 0.0 [0.0 - 4.2] 10.3 25.3 50.6 13.8
Retail Ground Turkey (37) 0.0 0.0 [0.0 - 9.5] 5.4 56.8 35.1 2.7
Retail Ground Beef (0) N/A N/A N/A
Retail Pork Chops (2) 0.0 0.0 [0.0 - 84.2] 50.0 50.0
Cefotaxime Retail Chickens (29) 0.0 100.0 [88.1 - 100.0] 6.9 69.0 20.7 3.4
HACCP (87) 3.4 87.4 [78.5 - 93.5] 6.9 2.3 3.4 20.7 54.0 12.6
Retail Ground Turkey (37) 2.7 97.3 [85.8 - 99.9] 2.7 64.9 27.0 5.4
Retail Ground Beef (0) N/A N/A N/A
Retail Pork Chops (2) 0.0 100.0 [15.8 - 100.0] 50.0 50.0
Ceftazidime Retail Chickens (29) 44.9 44.8 [26.4 - 64.3] 3.4 3.4 3.4 44.9 41.4 3.4
HACCP (87) 48.3 32.2 [22.6 - 43.1] 1.2 4.6 3.4 2.3 8.0 48.3 32.2
Retail Ground Turkey (37) 43.2 54.1 [36.9 - 70.5] 2.7 43.2 43.2 10.8
Retail Ground Beef (0) N/A N/A N/A
Retail Pork Chops (2) 50.0 50.0 [1.3 - 98.7] 50.0 50.0
Monobactam Aztreonam Retail Chickens (29) 37.9 0.0 [0.0 - 11.9] 10.3 51.7 37.9
HACCP (87) 12.6 1.1 [0.0 - 6.2] 8.1 1.2 8.1 19.5 49.4 12.6 1.1
Retail Ground Turkey (37) 37.8 10.8 [3.0 - 25.4] 8.1 43.2 37.8 10.8
Retail Ground Beef (0) N/A N/A N/A
Retail Pork Chops (2) 50.0 0.0 [0.0 - 84.2] 50.0 50.0
Penems Imipenem Retail Chickens (29) 0.0 0.0 [0.0 - 11.9] 37.9 62.1
HACCP (87) 0.0 0.0 [0.0 - 4.2] 4.6 64.4 31.0
Retail Ground Turkey (37) 0.0 0.0 [0.0 - 9.5] 29.7 70.3
Cat
tle Retail Ground Beef (0) N/A N/A N/A
Swin
e
Retail Pork Chops (2) 0.0 0.0 [0.0 - 84.2] 100.0
1 Percent of isolates with intermediate susceptibility2 Percent of isolates that are susceptible-dose dependent (S-DD). Cefepime MIC's above the susceptible range but below the resistant range are designed by CLSI to be S-DD.3 Percent of isolates with resistance. Discrepancies between %R and sums of distribution %'s, to the right of the double vertical bars, are due to rounding4 95% confidence intervals for percent resistant (%R) were calculated using the Clopper-Pearson exact method
Cat
tleSw
ine
Chi
cken
sC
attle
Turk
eys
5 The unshaded areas indicate the range of dilutions tested for each antimicrobial. Single vertical bars indicate the breakpoints for susceptibility, while double vertical bars indicate the breakpoints for resistance. Numbers in the shaded areas indicate the percentages of isolates with MICs greater than the highest tested concentrations. Numbers listed for the lowest tested concentrations represent the percentages of isolates with MICs equal to or less than the lowest tested concentration.
Turk
eys
Turk
eys
Cat
tleSw
ine
Chi
cken
sSw
ine
Chi
cken
s
Table 88. Distribution of MICs and Occurrence of Resistance to Selected βeta-Lactam Agents among E. coli Isolates Resistant to Ceftiofur or Ceftriaxone, 2012 Distribution (%) of MICs (µg/ml)
5
Turk
eys
Cat
tleSw
ine
Turk
eys
Turk
eys
Chi
cken
sC
hick
ens
Cat
tleSw
ine
Chi
cken
s
180
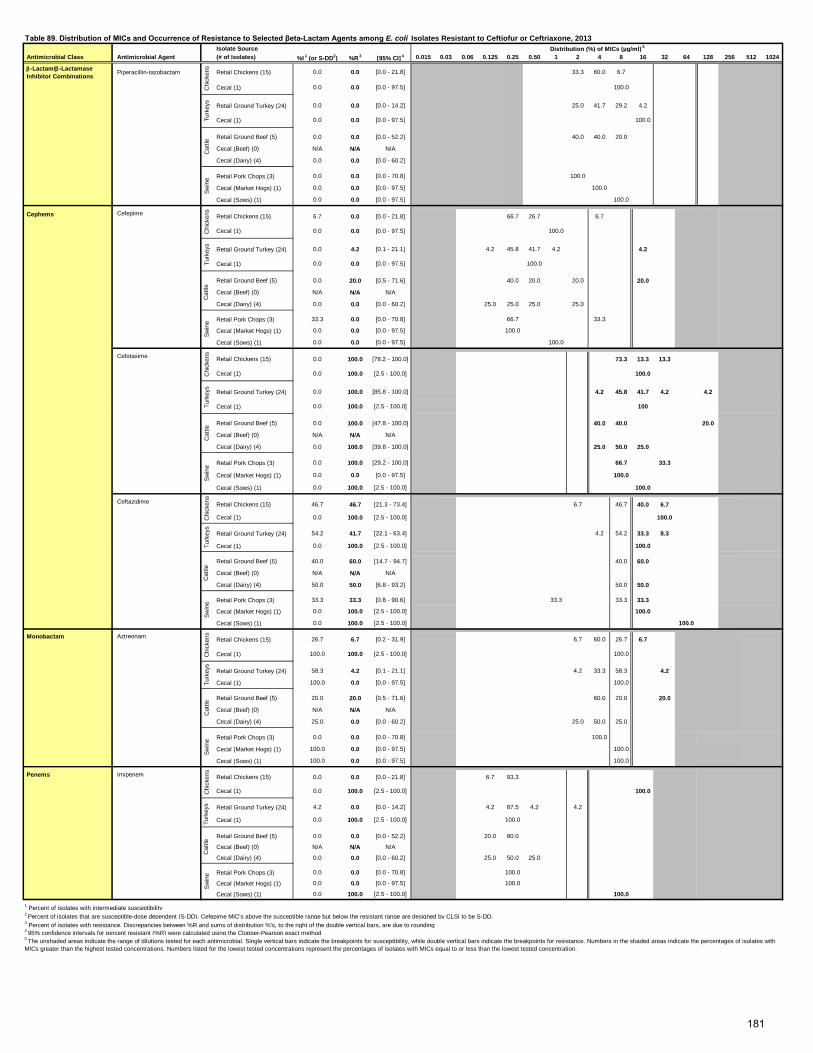
Isolate Source Antimicrobial Class Antimicrobial Agent (# of Isolates) %I
1 (or S-DD2) %R 3 [95% CI]
4 0.015 0.03 0.06 0.125 0.25 0.50 1 2 4 8 16 32 64 128 256 512 1024
β-Lactam/β-Lactamase Inhibitor Combinations Piperacillin-tazobactam Retail Chickens (15) 0.0 0.0 [0.0 - 21.8] 33.3 60.0 6.7
Cecal (1) 0.0 0.0 [0.0 - 97.5] 100.0
Retail Ground Turkey (24) 0.0 0.0 [0.0 - 14.2] 25.0 41.7 29.2 4.2
Cecal (1) 0.0 0.0 [0.0 - 97.5] 100.0
Retail Ground Beef (5) 0.0 0.0 [0.0 - 52.2] 40.0 40.0 20.0
Cecal (Beef) (0) N/A N/A N/A
Cecal (Dairy) (4) 0.0 0.0 [0.0 - 60.2]
Retail Pork Chops (3) 0.0 0.0 [0.0 - 70.8] 100.0
Cecal (Market Hogs) (1) 0.0 0.0 [0.0 - 97.5] 100.0
Cecal (Sows) (1) 0.0 0.0 [0.0 - 97.5] 100.0
Cefepime Retail Chickens (15) 6.7 0.0 [0.0 - 21.8] 66.7 26.7 6.7
Cecal (1) 0.0 0.0 [0.0 - 97.5] 100.0
Retail Ground Turkey (24) 0.0 4.2 [0.1 - 21.1] 4.2 45.8 41.7 4.2 4.2
Cecal (1) 0.0 0.0 [0.0 - 97.5] 100.0
Retail Ground Beef (5) 0.0 20.0 [0.5 - 71.6] 40.0 20.0 20.0 20.0
Cecal (Beef) (0) N/A N/A N/A
Cecal (Dairy) (4) 0.0 0.0 [0.0 - 60.2] 25.0 25.0 25.0 25.0
Retail Pork Chops (3) 33.3 0.0 [0.0 - 70.8] 66.7 33.3
Cecal (Market Hogs) (1) 0.0 0.0 [0.0 - 97.5] 100.0
Cecal (Sows) (1) 0.0 0.0 [0.0 - 97.5] 100.0
Cefotaxime Retail Chickens (15) 0.0 100.0 [78.2 - 100.0] 73.3 13.3 13.3
Cecal (1) 0.0 100.0 [2.5 - 100.0] 100.0
Retail Ground Turkey (24) 0.0 100.0 [85.8 - 100.0] 4.2 45.8 41.7 4.2 4.2
Cecal (1) 0.0 100.0 [2.5 - 100.0] 100
Retail Ground Beef (5) 0.0 100.0 [47.8 - 100.0] 40.0 40.0 20.0
Cecal (Beef) (0) N/A N/A N/A
Cecal (Dairy) (4) 0.0 100.0 [39.8 - 100.0] 25.0 50.0 25.0
Retail Pork Chops (3) 0.0 100.0 [29.2 - 100.0] 66.7 33.3
Cecal (Market Hogs) (1) 0.0 0.0 [0.0 - 97.5] 100.0
Cecal (Sows) (1) 0.0 100.0 [2.5 - 100.0] 100.0
Retail Chickens (15) 46.7 46.7 [21.3 - 73.4] 6.7 46.7 40.0 6.7
Cecal (1) 0.0 100.0 [2.5 - 100.0] 100.0
Retail Ground Turkey (24) 54.2 41.7 [22.1 - 63.4] 4.2 54.2 33.3 8.3
Cecal (1) 0.0 100.0 [2.5 - 100.0] 100.0
Retail Ground Beef (5) 40.0 60.0 [14.7 - 94.7] 40.0 60.0
Cecal (Beef) (0) N/A N/A N/A
Cecal (Dairy) (4) 50.0 50.0 [6.8 - 93.2] 50.0 50.0
Retail Pork Chops (3) 33.3 33.3 [0.8 - 90.6] 33.3 33.3 33.3
Cecal (Market Hogs) (1) 0.0 100.0 [2.5 - 100.0] 100.0
Cecal (Sows) (1) 0.0 100.0 [2.5 - 100.0] 100.0
Monobactam Aztreonam Retail Chickens (15) 26.7 6.7 [0.2 - 31.9] 6.7 60.0 26.7 6.7
Cecal (1) 100.0 100.0 [2.5 - 100.0] 100.0
Retail Ground Turkey (24) 58.3 4.2 [0.1 - 21.1] 4.2 33.3 58.3 4.2
Cecal (1) 100.0 0.0 [0.0 - 97.5] 100.0
Retail Ground Beef (5) 20.0 20.0 [0.5 - 71.6] 60.0 20.0 20.0
Cecal (Beef) (0) N/A N/A N/A
Cecal (Dairy) (4) 25.0 0.0 [0.0 - 60.2] 25.0 50.0 25.0
Retail Pork Chops (3) 0.0 0.0 [0.0 - 70.8] 100.0
Cecal (Market Hogs) (1) 100.0 0.0 [0.0 - 97.5] 100.0
Cecal (Sows) (1) 100.0 0.0 [0.0 - 97.5] 100.0
Penems Imipenem Retail Chickens (15) 0.0 0.0 [0.0 - 21.8] 6.7 93.3
Cecal (1) 0.0 100.0 [2.5 - 100.0] 100.0
Retail Ground Turkey (24) 4.2 0.0 [0.0 - 14.2] 4.2 87.5 4.2 4.2
Cecal (1) 0.0 100.0 [2.5 - 100.0] 100.0
Retail Ground Beef (5) 0.0 0.0 [0.0 - 52.2] 20.0 80.0
Cecal (Beef) (0) N/A N/A N/A
Cecal (Dairy) (4) 0.0 0.0 [0.0 - 60.2] 25.0 50.0 25.0
Retail Pork Chops (3) 0.0 0.0 [0.0 - 70.8] 100.0
Cecal (Market Hogs) (1) 0.0 0.0 [0.0 - 97.5] 100.0
Cecal (Sows) (1) 0.0 100.0 [2.5 - 100.0] 100.0
1 Percent of isolates with intermediate susceptibility2 Percent of isolates that are susceptible-dose dependent (S-DD). Cefepime MIC's above the susceptible range but below the resistant range are designed by CLSI to be S-DD.3 Percent of isolates with resistance. Discrepancies between %R and sums of distribution %'s, to the right of the double vertical bars, are due to rounding4 95% confidence intervals for percent resistant (%R) were calculated using the Clopper-Pearson exact method
Cat
tleSw
ine
Chi
cken
s
Ceftazidime
Cat
tleC
hick
ens
Swin
e
5 The unshaded areas indicate the range of dilutions tested for each antimicrobial. Single vertical bars indicate the breakpoints for susceptibility, while double vertical bars indicate the breakpoints for resistance. Numbers in the shaded areas indicate the percentages of isolates with MICs greater than the highest tested concentrations. Numbers listed for the lowest tested concentrations represent the percentages of isolates with MICs equal to or less than the lowest tested concentration.
Swin
eC
hick
ens
Turk
eys
Cat
tleTu
rkey
sSw
ine
CephemsC
hick
ens
Turk
eys
Cat
tleSw
ine
Chi
cken
sTu
rkey
sSw
ine
Turk
eys
Cat
tleC
attle
Table 89. Distribution of MICs and Occurrence of Resistance to Selected βeta-Lactam Agents among E. coli Isolates Resistant to Ceftiofur or Ceftriaxone, 2013 Distribution (%) of MICs (µg/ml)
5
Turk
eys
Chi
cken
s
181
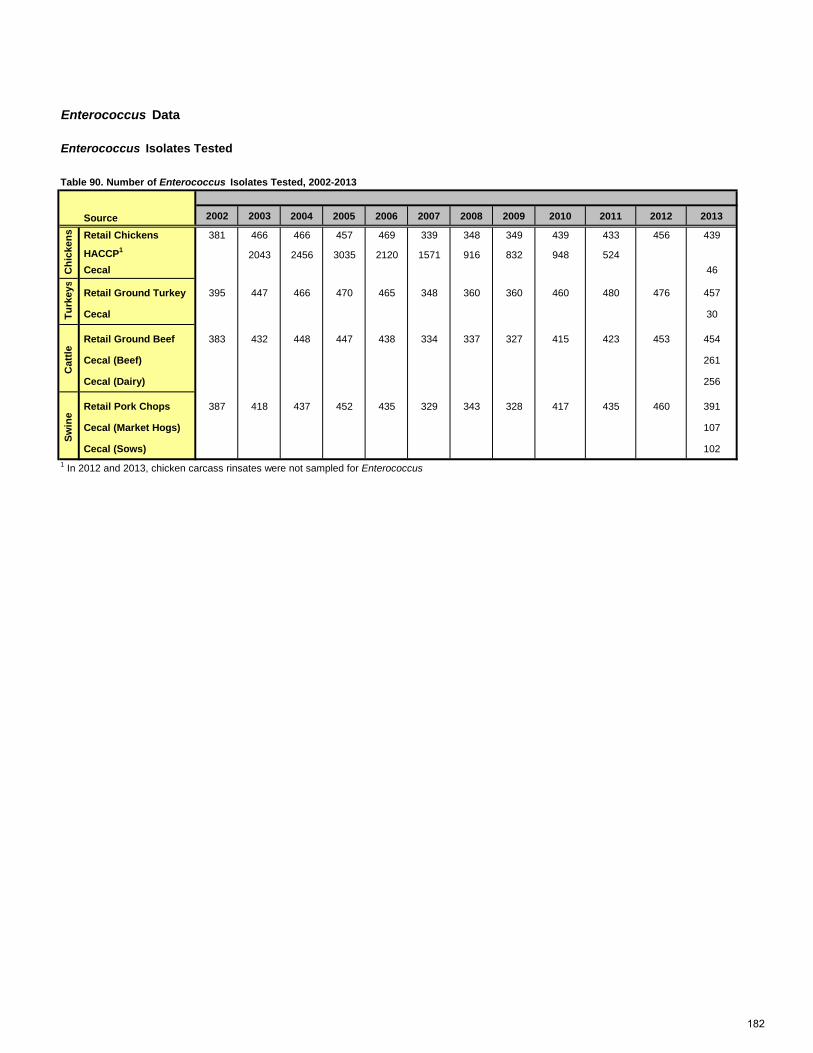
Enterococcus Data
Enterococcus Isolates Tested
Table 90. Number of Enterococcus Isolates Tested, 2002-2013
Source 2002 2003 2004 2005 2006 2007 2008 2009 2010 2011 2012 2013
Retail Chickens 381 466 466 457 469 339 348 349 439 433 456 439
HACCP1 2043 2456 3035 2120 1571 916 832 948 524 Cecal 46
Retail Ground Turkey 395 447 466 470 465 348 360 360 460 480 476 457
Cecal 30
Retail Ground Beef 383 432 448 447 438 334 337 327 415 423 453 454
Cecal (Beef) 261
Cecal (Dairy) 256
Retail Pork Chops 387 418 437 452 435 329 343 328 417 435 460 391
Cecal (Market Hogs) 107
Cecal (Sows) 1021 In 2012 and 2013, chicken carcass rinsates were not sampled for Enterococcus
Chi
cken
sTu
rkey
sC
attle
Swin
e
182

Isolation of Enterococcus from Retail Meats
Retail Chickens
Retail Ground Turkeys
Retail Ground Beef
Retail Pork Chops
480 476 480 480
Number Positive for Enterococcus 456 460 453 416
95.0% 96.6% 94.4% 86.7%
Figure 19. Percent of Retail Meat Samples Culture Positive for Enterococcus , 2002-2012
Table 91. Number and Percent of Retail Meat Samples Culture Positive for Enterococcus , 2012
Number of Meat Samples Tested
Percent Positive for Enterococcus
Figure 18. Percent of Retail Meat Samples Culture Positive for Enterococcus , 2012
95.0% 96.6% 94.4% 86.7%
0%
20%
40%
60%
80%
100%
Retail Chicken Retail GroundTurkey
Retail GroundBeef
Retail PorkChops
Perc
ent P
ositi
ve
Retail Meat
95.0% 96.6% 94.4% 86.7%
0%
20%
40%
60%
80%
100%
Retail Chicken Retail GroundTurkey
Retail Ground Beef Retail Pork Chops
Perc
ent P
ositi
ve
Meat Type
70%
75%
80%
85%
90%
95%
100%
2002 2004 2006 2008 2010 2012
Perc
ent P
ositi
ve
Year
Retail Chickens
Retail GroundTurkey
Retail Ground Beef
Retail Pork Chops
183
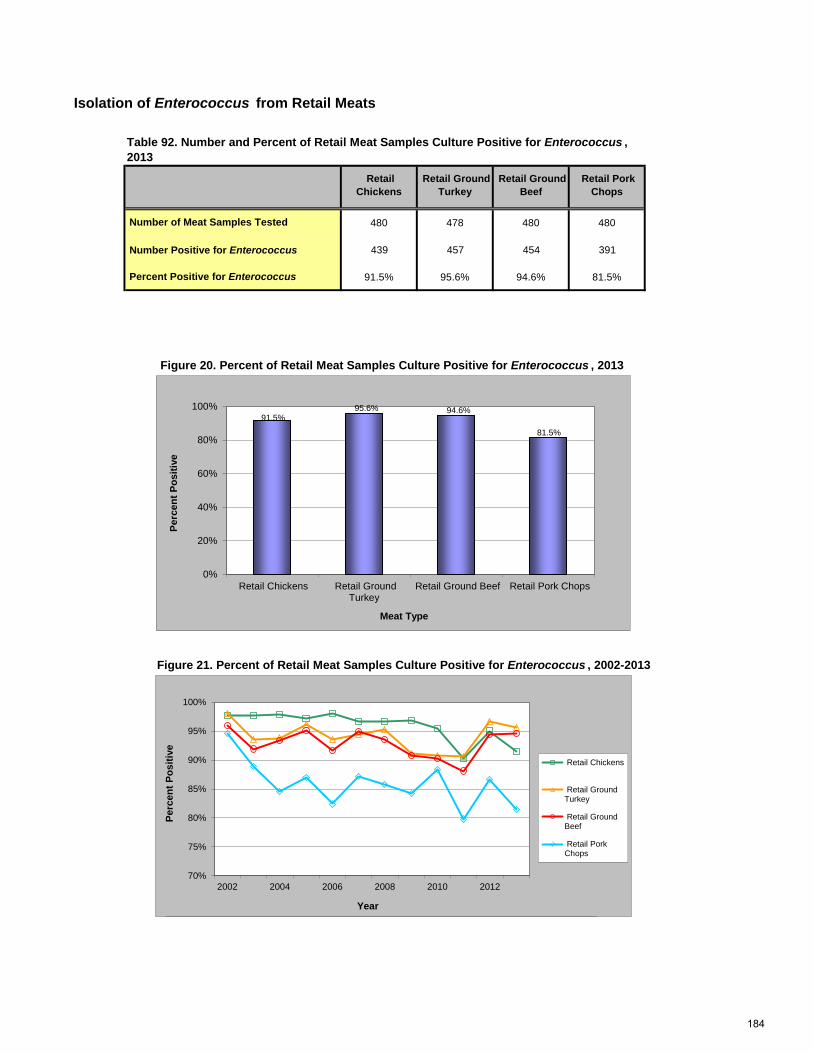
Isolation of Enterococcus from Retail Meats
Retail Chickens
Retail Ground Turkey
Retail Ground Beef
Retail Pork Chops
480 478 480 480
Number Positive for Enterococcus 439 457 454 391
91.5% 95.6% 94.6% 81.5%
Table 92. Number and Percent of Retail Meat Samples Culture Positive for Enterococcus , 2013
Number of Meat Samples Tested
Percent Positive for Enterococcus
Figure 20. Percent of Retail Meat Samples Culture Positive for Enterococcus , 2013
Figure 21. Percent of Retail Meat Samples Culture Positive for Enterococcus , 2002-2013
70%
75%
80%
85%
90%
95%
100%
2002 2004 2006 2008 2010 2012
Perc
ent P
ositi
ve
Year
Retail Chickens
Retail GroundTurkey Retail GroundBeef
91.5% 95.6% 94.6%
81.5%
0%
20%
40%
60%
80%
100%
Retail Chickens Retail GroundTurkey
Retail Ground Beef Retail Pork Chops
Perc
ent P
ositi
ve
Meat Type
70%
75%
80%
85%
90%
95%
100%
2002 2004 2006 2008 2010 2012
Perc
ent P
ositi
ve
Year
Retail Chickens
Retail GroundTurkey
Retail GroundBeef
Retail PorkChops
184
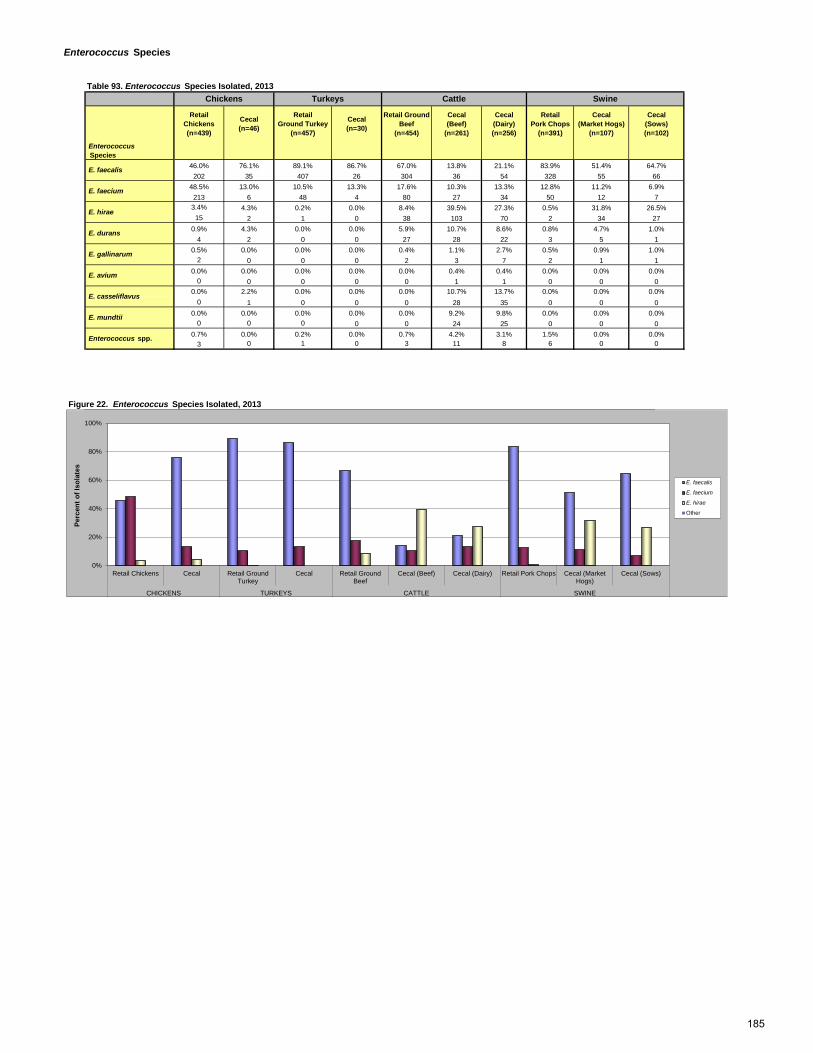
Enterococcus Species
Enterococcus Species
46.0% 76.1% 89.1% 86.7% 67.0% 13.8% 21.1% 83.9% 51.4% 64.7%202 35 407 26 304 36 54 328 55 66
48.5% 13.0% 10.5% 13.3% 17.6% 10.3% 13.3% 12.8% 11.2% 6.9%213 6 48 4 80 27 34 50 12 7
3.4% 4.3% 0.2% 0.0% 8.4% 39.5% 27.3% 0.5% 31.8% 26.5%15 2 1 0 38 103 70 2 34 27
0.9% 4.3% 0.0% 0.0% 5.9% 10.7% 8.6% 0.8% 4.7% 1.0%4 2 0 0 27 28 22 3 5 1
0.5% 0.0% 0.0% 0.0% 0.4% 1.1% 2.7% 0.5% 0.9% 1.0%2 0 0 0 2 3 7 2 1 1
0.0% 0.0% 0.0% 0.0% 0.0% 0.4% 0.4% 0.0% 0.0% 0.0%0 0 0 0 0 1 1 0 0 0
0.0% 2.2% 0.0% 0.0% 0.0% 10.7% 13.7% 0.0% 0.0% 0.0%0 1 0 0 0 28 35 0 0 0
0.0% 0.0% 0.0% 0.0% 0.0% 9.2% 9.8% 0.0% 0.0% 0.0%0 0 0 0 0 24 25 0 0 0
0.7% 0.0% 0.2% 0.0% 0.7% 4.2% 3.1% 1.5% 0.0% 0.0%3 0 1 0 3 11 8 6 0 0
Figure 22. Enterococcus Species Isolated, 2013
E. hirae
E. durans
E. gallinarum
E. avium
E. casseliflavus
E. mundtii
Enterococcus spp.
E. faecalis
E. faecium
Cecal(Dairy)(n=256)
Retail Pork Chops
(n=391)
Cecal (Market Hogs)
(n=107)
Cecal (Sows)(n=102)
Retail Chickens(n=439)
Cecal(n=46)
Retail Ground Turkey
(n=457)
Cecal(n=30)
Retail Ground Beef
(n=454)
Cecal (Beef)
(n=261)
SwineTable 93. Enterococcus Species Isolated, 2013
Chickens Turkeys Cattle
0%
20%
40%
60%
80%
100%
RetailChickens
Cecal RetailGroundTurkey
Cecal RetailGround
Beef
Cecal (Beef) Cecal(Dairy)
Retail PorkChops
Cecal(MarketHogs)
Cecal(Sows)
Perc
ent o
f Iso
late
s
E. faecalis
E. faecium
E. hirae
Other
0%
20%
40%
60%
80%
100%
Retail Chickens Cecal Retail GroundTurkey
Cecal Retail GroundBeef
Cecal (Beef) Cecal (Dairy) Retail Pork Chops Cecal (MarketHogs)
Cecal (Sows)
CHICKENS TURKEYS CATTLE SWINE
Perc
ent o
f Iso
late
s
E. faecalis
E. faecium
E. hirae
Other
185
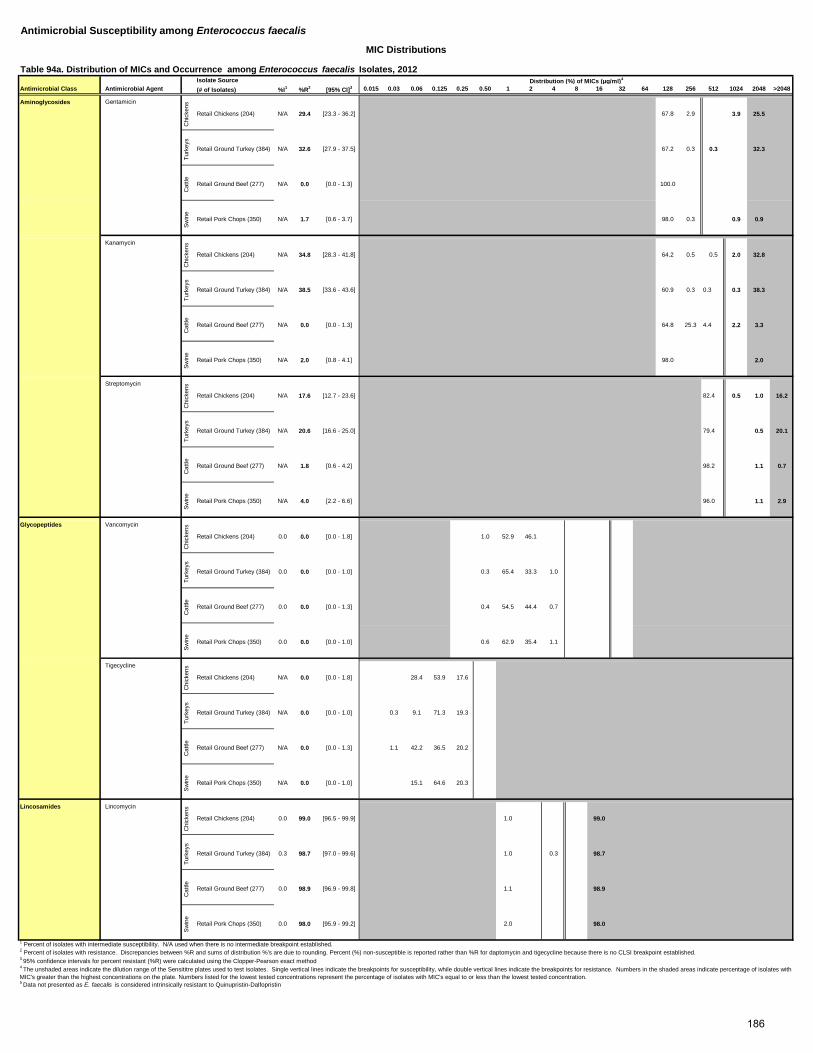
Antimicrobial Susceptibility among Enterococcus faecalis
Isolate SourceAntimicrobial Class Antimicrobial Agent (# of Isolates) %I1 %R2 [95% CI]3 0.015 0.03 0.06 0.125 0.25 0.50 1 2 4 8 16 32 64 128 256 512 1024 2048 >2048
Aminoglycosides Gentamicin
Chi
cken
s
Retail Chickens (204) N/A 29.4 [23.3 - 36.2] 67.8 2.9 3.9 25.5
Turk
eys
Retail Ground Turkey (384) N/A 32.6 [27.9 - 37.5] 67.2 0.3 0.3 32.3
Cat
tle Retail Ground Beef (277) N/A 0.0 [0.0 - 1.3] 100.0Sw
ine
Retail Pork Chops (350) N/A 1.7 [0.6 - 3.7] 98.0 0.3 0.9 0.9
Kanamycin
Chi
cken
s
Retail Chickens (204) N/A 34.8 [28.3 - 41.8] 64.2 0.5 0.5 2.0 32.8
Turk
eys
Retail Ground Turkey (384) N/A 38.5 [33.6 - 43.6] 60.9 0.3 0.3 0.3 38.3
Cat
tle Retail Ground Beef (277) N/A 0.0 [0.0 - 1.3] 64.8 25.3 4.4 2.2 3.3
Swin
e
Retail Pork Chops (350) N/A 2.0 [0.8 - 4.1] 98.0 2.0
Streptomycin
Chi
cken
s
Retail Chickens (204) N/A 17.6 [12.7 - 23.6] 82.4 0.5 1.0 16.2
Turk
eys
Retail Ground Turkey (384) N/A 20.6 [16.6 - 25.0] 79.4 0.5 20.1
Cat
tle Retail Ground Beef (277) N/A 1.8 [0.6 - 4.2] 98.2 1.1 0.7
Swin
e
Retail Pork Chops (350) N/A 4.0 [2.2 - 6.6] 96.0 1.1 2.9
Glycopeptides Vancomycin
Chi
cken
s
Retail Chickens (204) 0.0 0.0 [0.0 - 1.8] 1.0 52.9 46.1
Turk
eys
Retail Ground Turkey (384) 0.0 0.0 [0.0 - 1.0] 0.3 65.4 33.3 1.0
Cat
tle Retail Ground Beef (277) 0.0 0.0 [0.0 - 1.3] 0.4 54.5 44.4 0.7
Swin
e
Retail Pork Chops (350) 0.0 0.0 [0.0 - 1.0] 0.6 62.9 35.4 1.1
Tigecycline
Chi
cken
s
Retail Chickens (204) N/A 0.0 [0.0 - 1.8] 28.4 53.9 17.6
Turk
eys
Retail Ground Turkey (384) N/A 0.0 [0.0 - 1.0] 0.3 9.1 71.3 19.3
Cat
tle Retail Ground Beef (277) N/A 0.0 [0.0 - 1.3] 1.1 42.2 36.5 20.2
Swin
e
Retail Pork Chops (350) N/A 0.0 [0.0 - 1.0] 15.1 64.6 20.3
Lincosamides Lincomycin
Chi
cken
s
Retail Chickens (204) 0.0 99.0 [96.5 - 99.9] 1.0 99.0
Turk
eys
Retail Ground Turkey (384) 0.3 98.7 [97.0 - 99.6] 1.0 0.3 98.7
Cat
tle Retail Ground Beef (277) 0.0 98.9 [96.9 - 99.8] 1.1 98.9
Swin
e
Retail Pork Chops (350) 0.0 98.0 [95.9 - 99.2] 2.0 98.0
5 Data not presented as E. faecalis is considered intrinsically resistant to Quinupristin-Dalfopristin
3 95% confidence intervals for percent resistant (%R) were calculated using the Clopper-Pearson exact method4 The unshaded areas indicate the dilution range of the Sensititre plates used to test isolates. Single vertical lines indicate the breakpoints for susceptibility, while double vertical lines indicate the breakpoints for resistance. Numbers in the shaded areas indicate percentage of isolates with MIC's greater than the highest concentrations on the plate. Numbers listed for the lowest tested concentrations represent the percentage of isolates with MIC's equal to or less than the lowest tested concentration.
1 Percent of isolates with intermediate susceptibility. N/A used when there is no intermediate breakpoint established. 2 Percent of isolates with resistance. Discrepancies between %R and sums of distribution %'s are due to rounding. Percent (%) non-susceptible is reported rather than %R for daptomycin and tigecycline because there is no CLSI breakpoint established.
MIC Distributions
Table 94a. Distribution of MICs and Occurrence among Enterococcus faecalis Isolates, 2012Distribution (%) of MICs (µg/ml)4
186
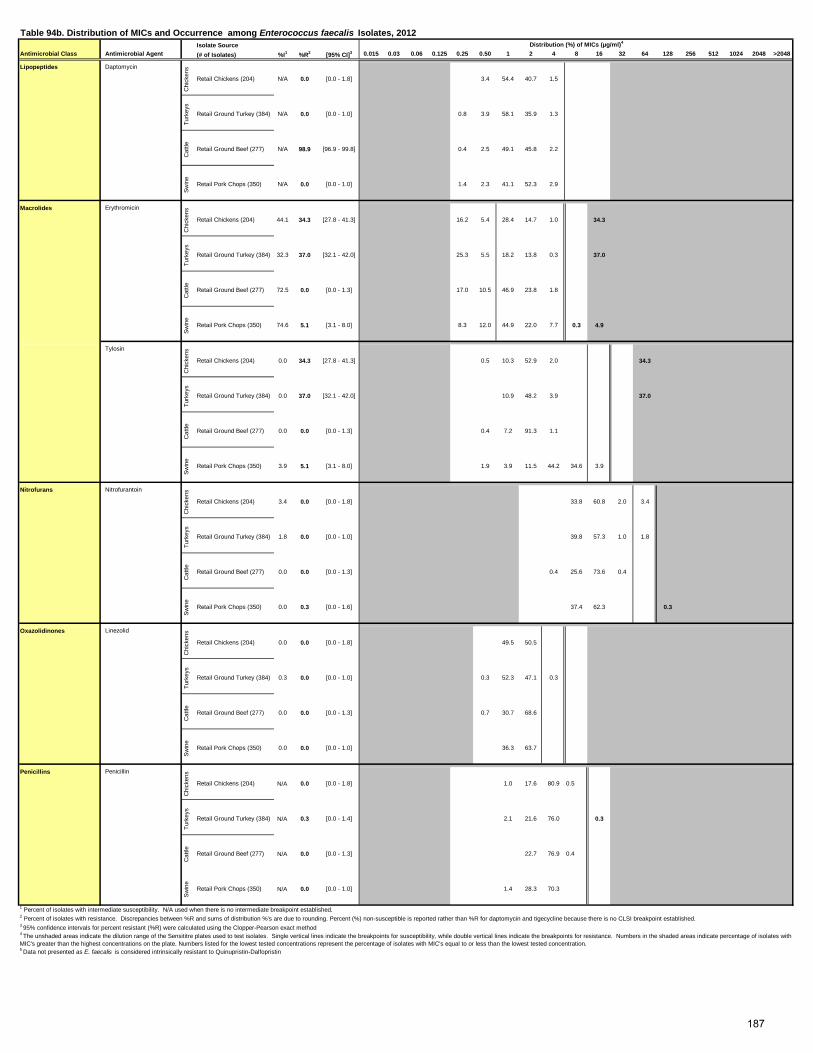
Isolate SourceAntimicrobial Class Antimicrobial Agent (# of Isolates) %I1 %R2 [95% CI]3 0.015 0.03 0.06 0.125 0.25 0.50 1 2 4 8 16 32 64 128 256 512 1024 2048 >2048
Lipopeptides Daptomycin
Chi
cken
s
Retail Chickens (204) N/A 0.0 [0.0 - 1.8] 3.4 54.4 40.7 1.5
Turk
eys
Retail Ground Turkey (384) N/A 0.0 [0.0 - 1.0] 0.8 3.9 58.1 35.9 1.3
Cat
tle Retail Ground Beef (277) N/A 98.9 [96.9 - 99.8] 0.4 2.5 49.1 45.8 2.2
Swin
eRetail Pork Chops (350) N/A 0.0 [0.0 - 1.0] 1.4 2.3 41.1 52.3 2.9
Macrolides Erythromicin
Chi
cken
s
Retail Chickens (204) 44.1 34.3 [27.8 - 41.3] 16.2 5.4 28.4 14.7 1.0 34.3
Turk
eys
Retail Ground Turkey (384) 32.3 37.0 [32.1 - 42.0] 25.3 5.5 18.2 13.8 0.3 37.0
Cat
tle Retail Ground Beef (277) 72.5 0.0 [0.0 - 1.3] 17.0 10.5 46.9 23.8 1.8
Swin
e
Retail Pork Chops (350) 74.6 5.1 [3.1 - 8.0] 8.3 12.0 44.9 22.0 7.7 0.3 4.9
Tylosin
Chi
cken
s
Retail Chickens (204) 0.0 34.3 [27.8 - 41.3] 0.5 10.3 52.9 2.0 34.3
Turk
eys
Retail Ground Turkey (384) 0.0 37.0 [32.1 - 42.0] 10.9 48.2 3.9 37.0
Cat
tle Retail Ground Beef (277) 0.0 0.0 [0.0 - 1.3] 0.4 7.2 91.3 1.1
Swin
e
Retail Pork Chops (350) 3.9 5.1 [3.1 - 8.0] 1.9 3.9 11.5 44.2 34.6 3.9
Nitrofurans Nitrofurantoin
Chi
cken
s
Retail Chickens (204) 3.4 0.0 [0.0 - 1.8] 33.8 60.8 2.0 3.4
Turk
eys
Retail Ground Turkey (384) 1.8 0.0 [0.0 - 1.0] 39.8 57.3 1.0 1.8
Cat
tle Retail Ground Beef (277) 0.0 0.0 [0.0 - 1.3] 0.4 25.6 73.6 0.4
Swin
e
Retail Pork Chops (350) 0.0 0.3 [0.0 - 1.6] 37.4 62.3 0.3
Oxazolidinones Linezolid
Chi
cken
s
Retail Chickens (204) 0.0 0.0 [0.0 - 1.8] 49.5 50.5
Turk
eys
Retail Ground Turkey (384) 0.3 0.0 [0.0 - 1.0] 0.3 52.3 47.1 0.3
Cat
tle Retail Ground Beef (277) 0.0 0.0 [0.0 - 1.3] 0.7 30.7 68.6
Swin
e
Retail Pork Chops (350) 0.0 0.0 [0.0 - 1.0] 36.3 63.7
Penicillins Penicillin
Chi
cken
s
Retail Chickens (204) N/A 0.0 [0.0 - 1.8] 1.0 17.6 80.9 0.5
Turk
eys
Retail Ground Turkey (384) N/A 0.3 [0.0 - 1.4] 2.1 21.6 76.0 0.3
Cat
tle Retail Ground Beef (277) N/A 0.0 [0.0 - 1.3] 22.7 76.9 0.4
Swin
e
Retail Pork Chops (350) N/A 0.0 [0.0 - 1.0] 1.4 28.3 70.3
5 Data not presented as E. faecalis is considered intrinsically resistant to Quinupristin-Dalfopristin
2 Percent of isolates with resistance. Discrepancies between %R and sums of distribution %'s are due to rounding. Percent (%) non-susceptible is reported rather than %R for daptomycin and tigecycline because there is no CLSI breakpoint established.3 95% confidence intervals for percent resistant (%R) were calculated using the Clopper-Pearson exact method4 The unshaded areas indicate the dilution range of the Sensititre plates used to test isolates. Single vertical lines indicate the breakpoints for susceptibility, while double vertical lines indicate the breakpoints for resistance. Numbers in the shaded areas indicate percentage of isolates with MIC's greater than the highest concentrations on the plate. Numbers listed for the lowest tested concentrations represent the percentage of isolates with MIC's equal to or less than the lowest tested concentration.
1 Percent of isolates with intermediate susceptibility. N/A used when there is no intermediate breakpoint established.
Table 94b. Distribution of MICs and Occurrence among Enterococcus faecalis Isolates, 2012Distribution (%) of MICs (µg/ml)4
187
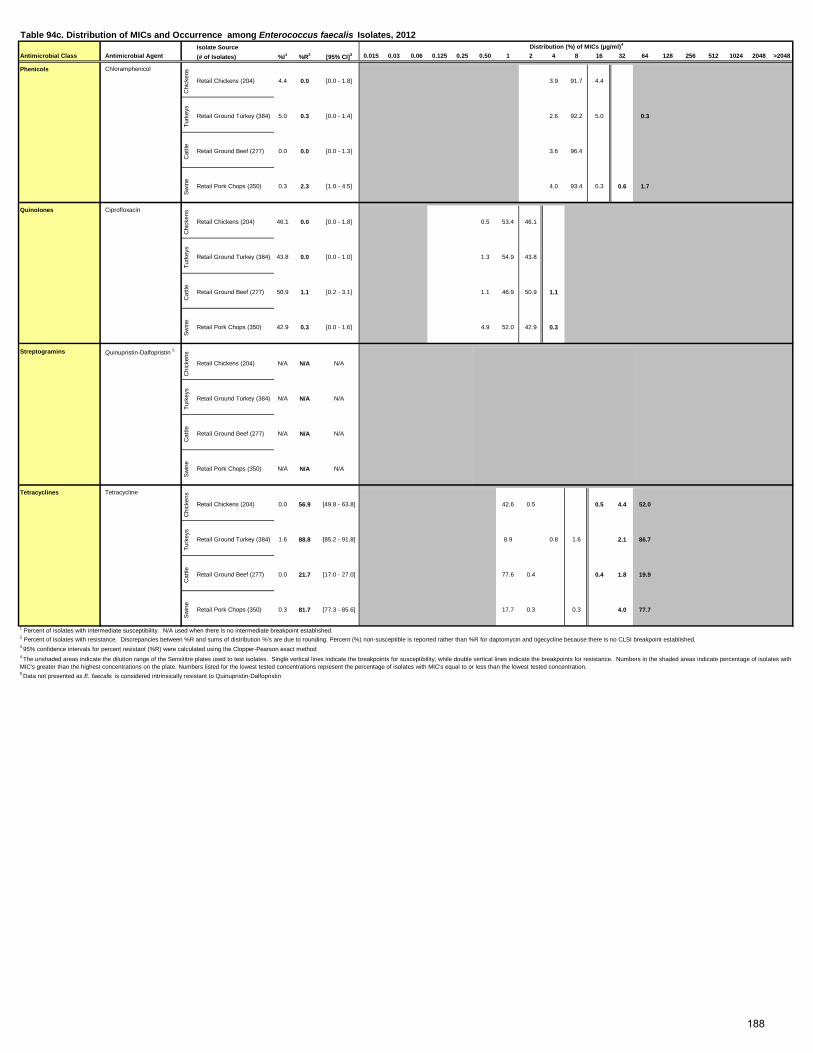
Isolate SourceAntimicrobial Class Antimicrobial Agent (# of Isolates) %I1 %R2 [95% CI]3 0.015 0.03 0.06 0.125 0.25 0.50 1 2 4 8 16 32 64 128 256 512 1024 2048 >2048
Phenicols Chloramphenicol
Chi
cken
s
Retail Chickens (204) 4.4 0.0 [0.0 - 1.8] 3.9 91.7 4.4
Turk
eys
Retail Ground Turkey (384) 5.0 0.3 [0.0 - 1.4] 2.6 92.2 5.0 0.3
Cat
tle Retail Ground Beef (277) 0.0 0.0 [0.0 - 1.3] 3.6 96.4
Swin
eRetail Pork Chops (350) 0.3 2.3 [1.0 - 4.5] 4.0 93.4 0.3 0.6 1.7
Quinolones Ciprofloxacin
Chi
cken
s
Retail Chickens (204) 46.1 0.0 [0.0 - 1.8] 0.5 53.4 46.1
Turk
eys
Retail Ground Turkey (384) 43.8 0.0 [0.0 - 1.0] 1.3 54.9 43.8
Cat
tle Retail Ground Beef (277) 50.9 1.1 [0.2 - 3.1] 1.1 46.9 50.9 1.1
Swin
e
Retail Pork Chops (350) 42.9 0.3 [0.0 - 1.6] 4.9 52.0 42.9 0.3
Streptogramins Quinupristin-Dalfopristin 5
Chi
cken
s
Retail Chickens (204) N/A N/A N/A
Turk
eys
Retail Ground Turkey (384) N/A N/A N/A
Cat
tle Retail Ground Beef (277) N/A N/A N/A
Swin
e
Retail Pork Chops (350) N/A N/A N/A
Tetracyclines Tetracycline
Chi
cken
s
Retail Chickens (204) 0.0 56.9 [49.8 - 63.8] 42.6 0.5 0.5 4.4 52.0
Turk
eys
Retail Ground Turkey (384) 1.6 88.8 [85.2 - 91.8] 8.9 0.8 1.6 2.1 86.7
Cat
tle Retail Ground Beef (277) 0.0 21.7 [17.0 - 27.0] 77.6 0.4 0.4 1.8 19.9
Swin
e
Retail Pork Chops (350) 0.3 81.7 [77.3 - 85.6] 17.7 0.3 0.3 4.0 77.7
5 Data not presented as E. faecalis is considered intrinsically resistant to Quinupristin-Dalfopristin
3 95% confidence intervals for percent resistant (%R) were calculated using the Clopper-Pearson exact method4 The unshaded areas indicate the dilution range of the Sensititre plates used to test isolates. Single vertical lines indicate the breakpoints for susceptibility, while double vertical lines indicate the breakpoints for resistance. Numbers in the shaded areas indicate percentage of isolates with MIC's greater than the highest concentrations on the plate. Numbers listed for the lowest tested concentrations represent the percentage of isolates with MIC's equal to or less than the lowest tested concentration.
1 Percent of isolates with intermediate susceptibility. N/A used when there is no intermediate breakpoint established. 2 Percent of isolates with resistance. Discrepancies between %R and sums of distribution %'s are due to rounding. Percent (%) non-susceptible is reported rather than %R for daptomycin and tigecycline because there is no CLSI breakpoint established.
Table 94c. Distribution of MICs and Occurrence among Enterococcus faecalis Isolates, 2012Distribution (%) of MICs (µg/ml)4
188
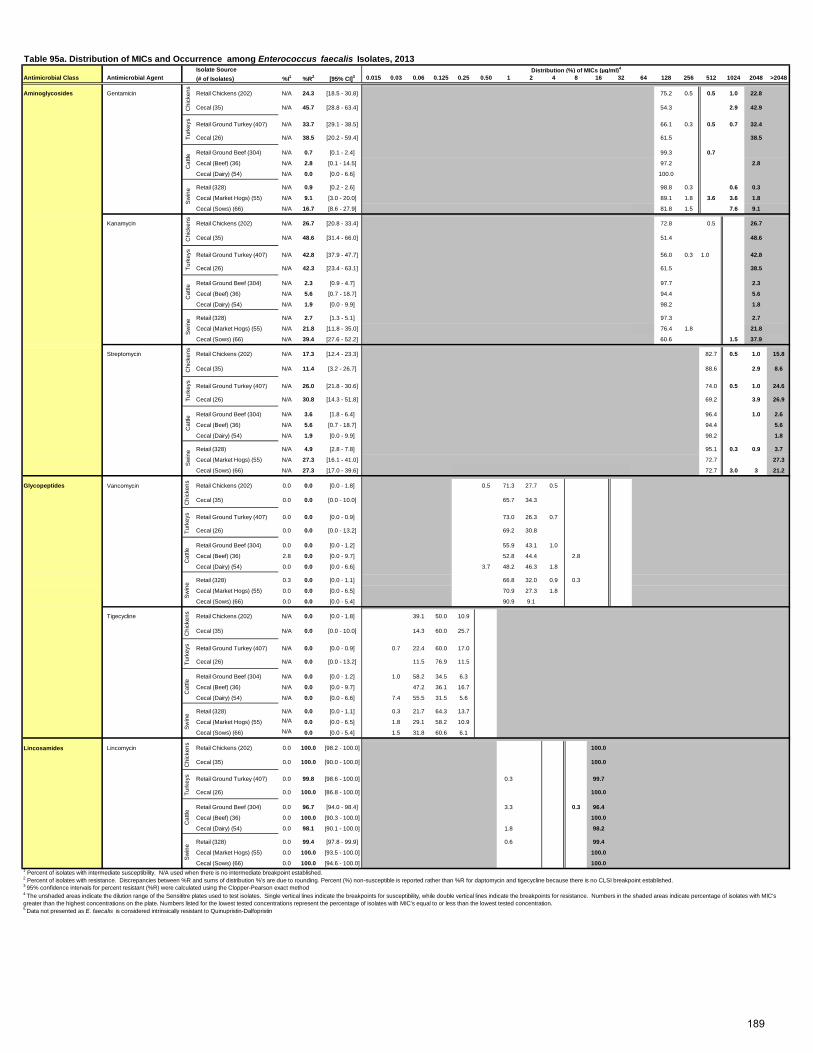
Isolate SourceAntimicrobial Class Antimicrobial Agent (# of Isolates) %I1 %R2 [95% CI]3 0.015 0.03 0.06 0.125 0.25 0.50 1 2 4 8 16 32 64 128 256 512 1024 2048 >2048
Aminoglycosides Gentamicin Retail Chickens (202) N/A 24.3 [18.5 - 30.8] 75.2 0.5 0.5 1.0 22.8
Cecal (35) N/A 45.7 [28.8 - 63.4] 54.3 2.9 42.9
Retail Ground Turkey (407) N/A 33.7 [29.1 - 38.5] 66.1 0.3 0.5 0.7 32.4
Cecal (26) N/A 38.5 [20.2 - 59.4] 61.5 38.5
Retail Ground Beef (304) N/A 0.7 [0.1 - 2.4] 99.3 0.7
Cecal (Beef) (36) N/A 2.8 [0.1 - 14.5] 97.2 2.8
Cecal (Dairy) (54) N/A 0.0 [0.0 - 6.6] 100.0
Retail (328) N/A 0.9 [0.2 - 2.6] 98.8 0.3 0.6 0.3
Cecal (Market Hogs) (55) N/A 9.1 [3.0 - 20.0] 89.1 1.8 3.6 3.6 1.8
Cecal (Sows) (66) N/A 16.7 [8.6 - 27.9] 81.8 1.5 7.6 9.1
Kanamycin Retail Chickens (202) N/A 26.7 [20.8 - 33.4] 72.8 0.5 26.7
Cecal (35) N/A 48.6 [31.4 - 66.0] 51.4 48.6
Retail Ground Turkey (407) N/A 42.8 [37.9 - 47.7] 56.0 0.3 1.0 42.8
Cecal (26) N/A 42.3 [23.4 - 63.1] 61.5 38.5
Retail Ground Beef (304) N/A 2.3 [0.9 - 4.7] 97.7 2.3
Cecal (Beef) (36) N/A 5.6 [0.7 - 18.7] 94.4 5.6
Cecal (Dairy) (54) N/A 1.9 [0.0 - 9.9] 98.2 1.8
Retail (328) N/A 2.7 [1.3 - 5.1] 97.3 2.7
Cecal (Market Hogs) (55) N/A 21.8 [11.8 - 35.0] 76.4 1.8 21.8
Cecal (Sows) (66) N/A 39.4 [27.6 - 52.2] 60.6 1.5 37.9
Streptomycin Retail Chickens (202) N/A 17.3 [12.4 - 23.3] 82.7 0.5 1.0 15.8
Cecal (35) N/A 11.4 [3.2 - 26.7] 88.6 2.9 8.6
Retail Ground Turkey (407) N/A 26.0 [21.8 - 30.6] 74.0 0.5 1.0 24.6
Cecal (26) N/A 30.8 [14.3 - 51.8] 69.2 3.9 26.9
Retail Ground Beef (304) N/A 3.6 [1.8 - 6.4] 96.4 1.0 2.6
Cecal (Beef) (36) N/A 5.6 [0.7 - 18.7] 94.4 5.6
Cecal (Dairy) (54) N/A 1.9 [0.0 - 9.9] 98.2 1.8
Retail (328) N/A 4.9 [2.8 - 7.8] 95.1 0.3 0.9 3.7
Cecal (Market Hogs) (55) N/A 27.3 [16.1 - 41.0] 72.7 27.3
Cecal (Sows) (66) N/A 27.3 [17.0 - 39.6] 72.7 3.0 3 21.2
Glycopeptides Vancomycin Retail Chickens (202) 0.0 0.0 [0.0 - 1.8] 0.5 71.3 27.7 0.5
Cecal (35) 0.0 0.0 [0.0 - 10.0] 65.7 34.3
Retail Ground Turkey (407) 0.0 0.0 [0.0 - 0.9] 73.0 26.3 0.7
Cecal (26) 0.0 0.0 [0.0 - 13.2] 69.2 30.8
Retail Ground Beef (304) 0.0 0.0 [0.0 - 1.2] 55.9 43.1 1.0
Cecal (Beef) (36) 2.8 0.0 [0.0 - 9.7] 52.8 44.4 2.8
Cecal (Dairy) (54) 0.0 0.0 [0.0 - 6.6] 3.7 48.2 46.3 1.8
Retail (328) 0.3 0.0 [0.0 - 1.1] 66.8 32.0 0.9 0.3
Cecal (Market Hogs) (55) 0.0 0.0 [0.0 - 6.5] 70.9 27.3 1.8
Cecal (Sows) (66) 0.0 0.0 [0.0 - 5.4] 90.9 9.1
Tigecycline Retail Chickens (202) N/A 0.0 [0.0 - 1.8] 39.1 50.0 10.9
Cecal (35) N/A 0.0 [0.0 - 10.0] 14.3 60.0 25.7
Retail Ground Turkey (407) N/A 0.0 [0.0 - 0.9] 0.7 22.4 60.0 17.0
Cecal (26) N/A 0.0 [0.0 - 13.2] 11.5 76.9 11.5
Retail Ground Beef (304) N/A 0.0 [0.0 - 1.2] 1.0 58.2 34.5 6.3
Cecal (Beef) (36) N/A 0.0 [0.0 - 9.7] 47.2 36.1 16.7
Cecal (Dairy) (54) N/A 0.0 [0.0 - 6.6] 7.4 55.5 31.5 5.6
Retail (328) N/A 0.0 [0.0 - 1.1] 0.3 21.7 64.3 13.7
Cecal (Market Hogs) (55) N/A 0.0 [0.0 - 6.5] 1.8 29.1 58.2 10.9
Cecal (Sows) (66) N/A 0.0 [0.0 - 5.4] 1.5 31.8 60.6 6.1
Lincosamides Lincomycin Retail Chickens (202) 0.0 100.0 [98.2 - 100.0] 100.0
Cecal (35) 0.0 100.0 [90.0 - 100.0] 100.0
Retail Ground Turkey (407) 0.0 99.8 [98.6 - 100.0] 0.3 99.7
Cecal (26) 0.0 100.0 [86.8 - 100.0] 100.0
Retail Ground Beef (304) 0.0 96.7 [94.0 - 98.4] 3.3 0.3 96.4
Cecal (Beef) (36) 0.0 100.0 [90.3 - 100.0] 100.0
Cecal (Dairy) (54) 0.0 98.1 [90.1 - 100.0] 1.8 98.2
Retail (328) 0.0 99.4 [97.8 - 99.9] 0.6 99.4
Cecal (Market Hogs) (55) 0.0 100.0 [93.5 - 100.0] 100.0
Cecal (Sows) (66) 0.0 100.0 [94.6 - 100.0] 100.0
5 Data not presented as E. faecalis is considered intrinsically resistant to Quinupristin-Dalfopristin
Turk
eys
Cat
tleS
win
eS
win
eC
hick
ens
Turk
eys
Cat
tleS
win
eC
hick
ens
Turk
eys
Cat
tleC
hick
ens
Turk
eys
Cat
tleS
win
eC
hick
ens
Chi
cken
sTu
rkey
sC
attle
Sw
ine
1 Percent of isolates with intermediate susceptibility. N/A used when there is no intermediate breakpoint established. 2 Percent of isolates with resistance. Discrepancies between %R and sums of distribution %'s are due to rounding. Percent (%) non-susceptible is reported rather than %R for daptomycin and tigecycline because there is no CLSI breakpoint established.3 95% confidence intervals for percent resistant (%R) were calculated using the Clopper-Pearson exact method4 The unshaded areas indicate the dilution range of the Sensititre plates used to test isolates. Single vertical lines indicate the breakpoints for susceptibility, while double vertical lines indicate the breakpoints for resistance. Numbers in the shaded areas indicate percentage of isolates with MIC's greater than the highest concentrations on the plate. Numbers listed for the lowest tested concentrations represent the percentage of isolates with MIC's equal to or less than the lowest tested concentration.
Turk
eys
Sw
ine
Cat
tle
Table 95a. Distribution of MICs and Occurrence among Enterococcus faecalis Isolates, 2013Distribution (%) of MICs (µg/ml)4
Chi
cken
s
189
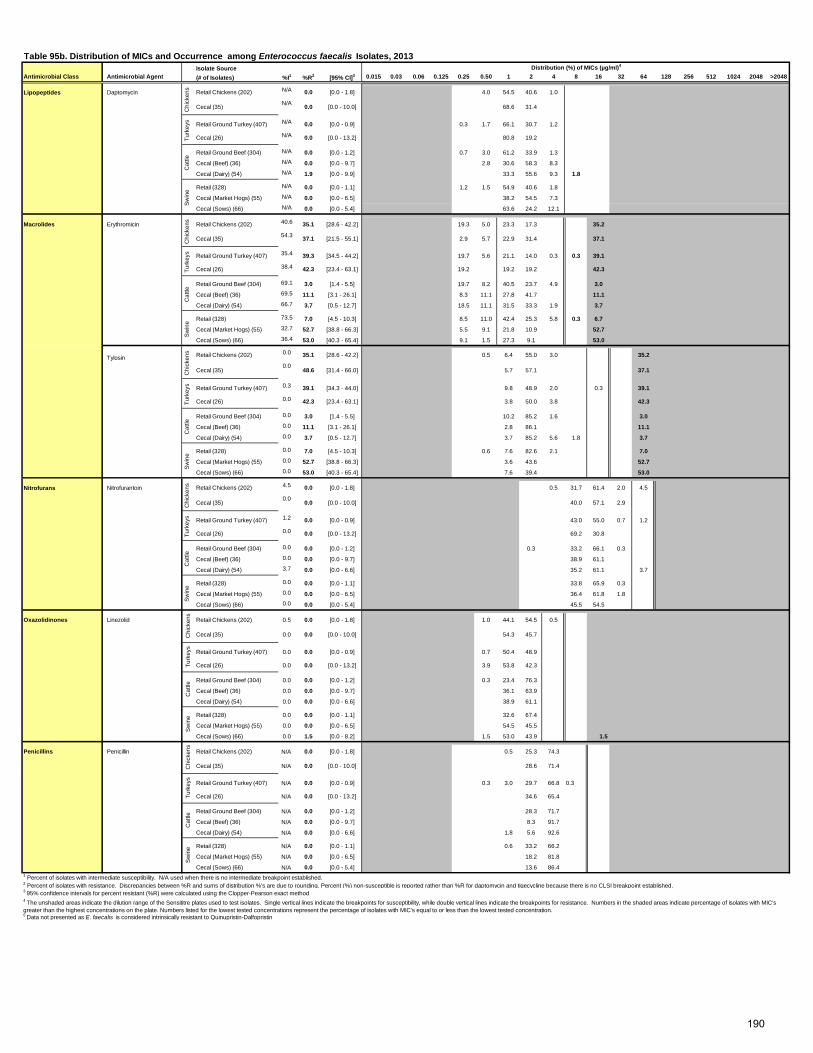
Isolate SourceAntimicrobial Class Antimicrobial Agent (# of Isolates) %I1 %R2 [95% CI]3 0.015 0.03 0.06 0.125 0.25 0.50 1 2 4 8 16 32 64 128 256 512 1024 2048 >2048
Lipopeptides Daptomycin Retail Chickens (202) N/A 0.0 [0.0 - 1.8] 4.0 54.5 40.6 1.0
Cecal (35) N/A 0.0 [0.0 - 10.0] 68.6 31.4
Retail Ground Turkey (407) N/A 0.0 [0.0 - 0.9] 0.3 1.7 66.1 30.7 1.2
Cecal (26) N/A 0.0 [0.0 - 13.2] 80.8 19.2
Retail Ground Beef (304) N/A 0.0 [0.0 - 1.2] 0.7 3.0 61.2 33.9 1.3
Cecal (Beef) (36) N/A 0.0 [0.0 - 9.7] 2.8 30.6 58.3 8.3
Cecal (Dairy) (54) N/A 1.9 [0.0 - 9.9] 33.3 55.6 9.3 1.8
Retail (328) N/A 0.0 [0.0 - 1.1] 1.2 1.5 54.9 40.6 1.8
Cecal (Market Hogs) (55) N/A 0.0 [0.0 - 6.5] 38.2 54.5 7.3
Cecal (Sows) (66) N/A 0.0 [0.0 - 5.4] 63.6 24.2 12.1
Macrolides Erythromicin Retail Chickens (202) 40.6 35.1 [28.6 - 42.2] 19.3 5.0 23.3 17.3 35.2
Cecal (35) 54.3 37.1 [21.5 - 55.1] 2.9 5.7 22.9 31.4 37.1
Retail Ground Turkey (407) 35.4 39.3 [34.5 - 44.2] 19.7 5.6 21.1 14.0 0.3 0.3 39.1
Cecal (26) 38.4 42.3 [23.4 - 63.1] 19.2 19.2 19.2 42.3
Retail Ground Beef (304) 69.1 3.0 [1.4 - 5.5] 19.7 8.2 40.5 23.7 4.9 3.0
Cecal (Beef) (36) 69.5 11.1 [3.1 - 26.1] 8.3 11.1 27.8 41.7 11.1
Cecal (Dairy) (54) 66.7 3.7 [0.5 - 12.7] 18.5 11.1 31.5 33.3 1.9 3.7
Retail (328) 73.5 7.0 [4.5 - 10.3] 8.5 11.0 42.4 25.3 5.8 0.3 6.7
Cecal (Market Hogs) (55) 32.7 52.7 [38.8 - 66.3] 5.5 9.1 21.8 10.9 52.7
Cecal (Sows) (66) 36.4 53.0 [40.3 - 65.4] 9.1 1.5 27.3 9.1 53.0
Tylosin Retail Chickens (202) 0.0 35.1 [28.6 - 42.2] 0.5 6.4 55.0 3.0 35.2
Cecal (35)0.0
48.6 [31.4 - 66.0] 5.7 57.1 37.1
Retail Ground Turkey (407) 0.3 39.1 [34.3 - 44.0] 9.8 48.9 2.0 0.3 39.1
Cecal (26) 0.0 42.3 [23.4 - 63.1] 3.8 50.0 3.8 42.3
Retail Ground Beef (304) 0.0 3.0 [1.4 - 5.5] 10.2 85.2 1.6 3.0
Cecal (Beef) (36) 0.0 11.1 [3.1 - 26.1] 2.8 86.1 11.1
Cecal (Dairy) (54) 0.0 3.7 [0.5 - 12.7] 3.7 85.2 5.6 1.8 3.7
Retail (328) 0.0 7.0 [4.5 - 10.3] 0.6 7.6 82.6 2.1 7.0
Cecal (Market Hogs) (55) 0.0 52.7 [38.8 - 66.3] 3.6 43.6 52.7
Cecal (Sows) (66) 0.0 53.0 [40.3 - 65.4] 7.6 39.4 53.0
Nitrofurans Nitrofurantoin Retail Chickens (202) 4.5 0.0 [0.0 - 1.8] 0.5 31.7 61.4 2.0 4.5
Cecal (35)0.0
0.0 [0.0 - 10.0] 40.0 57.1 2.9
Retail Ground Turkey (407) 1.2 0.0 [0.0 - 0.9] 43.0 55.0 0.7 1.2
Cecal (26) 0.0 0.0 [0.0 - 13.2] 69.2 30.8
Retail Ground Beef (304) 0.0 0.0 [0.0 - 1.2] 0.3 33.2 66.1 0.3
Cecal (Beef) (36) 0.0 0.0 [0.0 - 9.7] 38.9 61.1
Cecal (Dairy) (54) 3.7 0.0 [0.0 - 6.6] 35.2 61.1 3.7
Retail (328) 0.0 0.0 [0.0 - 1.1] 33.8 65.9 0.3
Cecal (Market Hogs) (55) 0.0 0.0 [0.0 - 6.5] 36.4 61.8 1.8
Cecal (Sows) (66) 0.0 0.0 [0.0 - 5.4] 45.5 54.5
Oxazolidinones Linezolid Retail Chickens (202) 0.5 0.0 [0.0 - 1.8] 1.0 44.1 54.5 0.5
Cecal (35) 0.0 0.0 [0.0 - 10.0] 54.3 45.7
Retail Ground Turkey (407) 0.0 0.0 [0.0 - 0.9] 0.7 50.4 48.9
Cecal (26) 0.0 0.0 [0.0 - 13.2] 3.9 53.8 42.3
Retail Ground Beef (304) 0.0 0.0 [0.0 - 1.2] 0.3 23.4 76.3
Cecal (Beef) (36) 0.0 0.0 [0.0 - 9.7] 36.1 63.9
Cecal (Dairy) (54) 0.0 0.0 [0.0 - 6.6] 38.9 61.1
Retail (328) 0.0 0.0 [0.0 - 1.1] 32.6 67.4
Cecal (Market Hogs) (55) 0.0 0.0 [0.0 - 6.5] 54.5 45.5
Cecal (Sows) (66) 0.0 1.5 [0.0 - 8.2] 1.5 53.0 43.9 1.5
Penicillins Penicillin Retail Chickens (202) N/A 0.0 [0.0 - 1.8] 0.5 25.3 74.3
Cecal (35) N/A 0.0 [0.0 - 10.0] 28.6 71.4
Retail Ground Turkey (407) N/A 0.0 [0.0 - 0.9] 0.3 3.0 29.7 66.8 0.3
Cecal (26) N/A 0.0 [0.0 - 13.2] 34.6 65.4
Retail Ground Beef (304) N/A 0.0 [0.0 - 1.2] 28.3 71.7
Cecal (Beef) (36) N/A 0.0 [0.0 - 9.7] 8.3 91.7
Cecal (Dairy) (54) N/A 0.0 [0.0 - 6.6] 1.8 5.6 92.6
Retail (328) N/A 0.0 [0.0 - 1.1] 0.6 33.2 66.2
Cecal (Market Hogs) (55) N/A 0.0 [0.0 - 6.5] 18.2 81.8
Cecal (Sows) (66) N/A 0.0 [0.0 - 5.4] 13.6 86.4
5 Data not presented as E. faecalis is considered intrinsically resistant to Quinupristin-Dalfopristin
Chi
cken
sTu
rkey
sC
hick
ens
Turk
eys
Cat
tleS
win
eC
hick
ens
Turk
eys
Cat
tleS
win
e
2 Percent of isolates with resistance. Discrepancies between %R and sums of distribution %'s are due to rounding. Percent (%) non-susceptible is reported rather than %R for daptomycin and tigecycline because there is no CLSI breakpoint established.3 95% confidence intervals for percent resistant (%R) were calculated using the Clopper-Pearson exact method4 The unshaded areas indicate the dilution range of the Sensititre plates used to test isolates. Single vertical lines indicate the breakpoints for susceptibility, while double vertical lines indicate the breakpoints for resistance. Numbers in the shaded areas indicate percentage of isolates with MIC's greater than the highest concentrations on the plate. Numbers listed for the lowest tested concentrations represent the percentage of isolates with MIC's equal to or less than the lowest tested concentration.
1 Percent of isolates with intermediate susceptibility. N/A used when there is no intermediate breakpoint established.
Turk
eys
Cat
tleS
win
eC
attle
Sw
ine
Chi
cken
sTu
rkey
sC
attle
Sw
ine
Sw
ine
Chi
cken
s
Table 95b. Distribution of MICs and Occurrence among Enterococcus faecalis Isolates, 2013Distribution (%) of MICs (µg/ml)4
Chi
cken
sTu
rkey
sC
attle
190
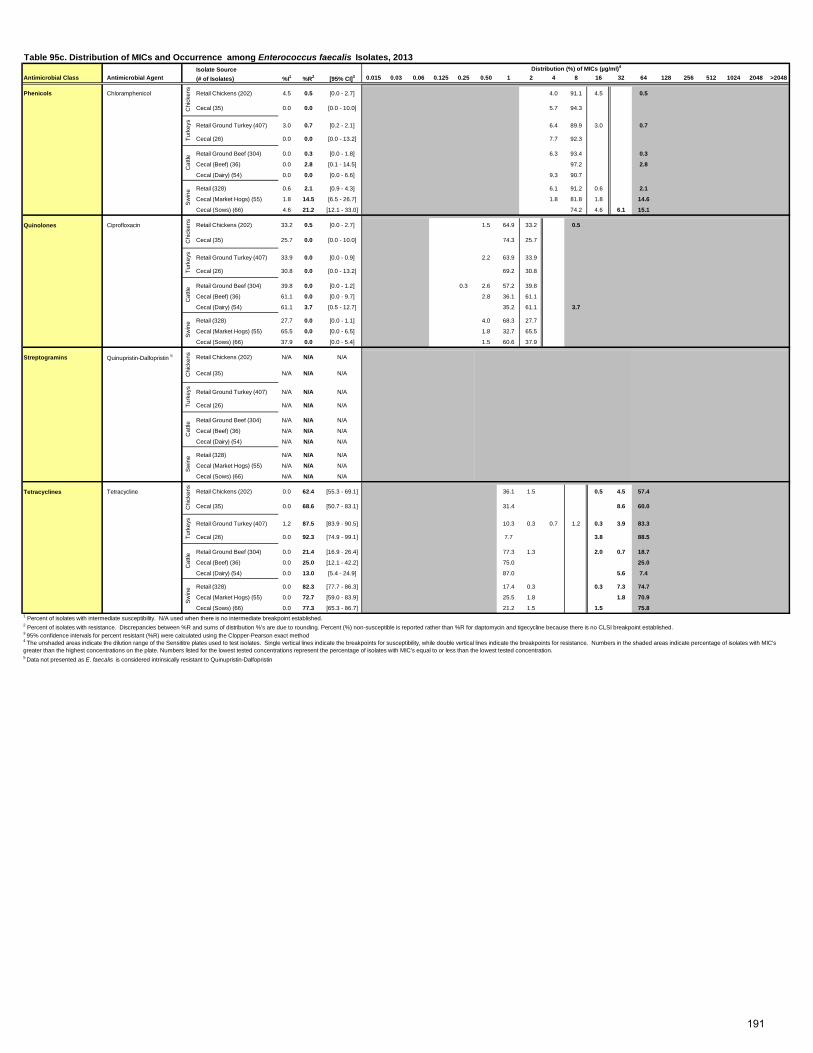
Isolate SourceAntimicrobial Class Antimicrobial Agent (# of Isolates) %I1 %R2 [95% CI]3 0.015 0.03 0.06 0.125 0.25 0.50 1 2 4 8 16 32 64 128 256 512 1024 2048 >2048
Phenicols Chloramphenicol Retail Chickens (202) 4.5 0.5 [0.0 - 2.7] 4.0 91.1 4.5 0.5
Cecal (35) 0.0 0.0 [0.0 - 10.0] 5.7 94.3
Retail Ground Turkey (407) 3.0 0.7 [0.2 - 2.1] 6.4 89.9 3.0 0.7
Cecal (26) 0.0 0.0 [0.0 - 13.2] 7.7 92.3
Retail Ground Beef (304) 0.0 0.3 [0.0 - 1.8] 6.3 93.4 0.3
Cecal (Beef) (36) 0.0 2.8 [0.1 - 14.5] 97.2 2.8
Cecal (Dairy) (54) 0.0 0.0 [0.0 - 6.6] 9.3 90.7
Retail (328) 0.6 2.1 [0.9 - 4.3] 6.1 91.2 0.6 2.1
Cecal (Market Hogs) (55) 1.8 14.5 [6.5 - 26.7] 1.8 81.8 1.8 14.6
Cecal (Sows) (66) 4.6 21.2 [12.1 - 33.0] 74.2 4.6 6.1 15.1
Quinolones Ciprofloxacin Retail Chickens (202) 33.2 0.5 [0.0 - 2.7] 1.5 64.9 33.2 0.5
Cecal (35) 25.7 0.0 [0.0 - 10.0] 74.3 25.7
Retail Ground Turkey (407) 33.9 0.0 [0.0 - 0.9] 2.2 63.9 33.9
Cecal (26) 30.8 0.0 [0.0 - 13.2] 69.2 30.8
Retail Ground Beef (304) 39.8 0.0 [0.0 - 1.2] 0.3 2.6 57.2 39.8
Cecal (Beef) (36) 61.1 0.0 [0.0 - 9.7] 2.8 36.1 61.1
Cecal (Dairy) (54) 61.1 3.7 [0.5 - 12.7] 35.2 61.1 3.7
Retail (328) 27.7 0.0 [0.0 - 1.1] 4.0 68.3 27.7
Cecal (Market Hogs) (55) 65.5 0.0 [0.0 - 6.5] 1.8 32.7 65.5
Cecal (Sows) (66) 37.9 0.0 [0.0 - 5.4] 1.5 60.6 37.9
Streptogramins Quinupristin-Dalfopristin 5 Retail Chickens (202) N/A N/A N/A
Cecal (35) N/A N/A N/A
Retail Ground Turkey (407) N/A N/A N/A
Cecal (26) N/A N/A N/A
Retail Ground Beef (304) N/A N/A N/A
Cecal (Beef) (36) N/A N/A N/A
Cecal (Dairy) (54) N/A N/A N/A
Retail (328) N/A N/A N/A
Cecal (Market Hogs) (55) N/A N/A N/A
Cecal (Sows) (66) N/A N/A N/A
Tetracyclines Tetracycline Retail Chickens (202) 0.0 62.4 [55.3 - 69.1] 36.1 1.5 0.5 4.5 57.4
Cecal (35) 0.0 68.6 [50.7 - 83.1] 31.4 8.6 60.0
Retail Ground Turkey (407) 1.2 87.5 [83.9 - 90.5] 10.3 0.3 0.7 1.2 0.3 3.9 83.3
Cecal (26) 0.0 92.3 [74.9 - 99.1] 7.7 3.8 88.5
Retail Ground Beef (304) 0.0 21.4 [16.9 - 26.4] 77.3 1.3 2.0 0.7 18.7
Cecal (Beef) (36) 0.0 25.0 [12.1 - 42.2] 75.0 25.0
Cecal (Dairy) (54) 0.0 13.0 [5.4 - 24.9] 87.0 5.6 7.4
Retail (328) 0.0 82.3 [77.7 - 86.3] 17.4 0.3 0.3 7.3 74.7
Cecal (Market Hogs) (55) 0.0 72.7 [59.0 - 83.9] 25.5 1.8 1.8 70.9
Cecal (Sows) (66) 0.0 77.3 [65.3 - 86.7] 21.2 1.5 1.5 75.8
5 Data not presented as E. faecalis is considered intrinsically resistant to Quinupristin-Dalfopristin
Chi
cken
sS
win
eC
attle
3 95% confidence intervals for percent resistant (%R) were calculated using the Clopper-Pearson exact method4 The unshaded areas indicate the dilution range of the Sensititre plates used to test isolates. Single vertical lines indicate the breakpoints for susceptibility, while double vertical lines indicate the breakpoints for resistance. Numbers in the shaded areas indicate percentage of isolates with MIC's greater than the highest concentrations on the plate. Numbers listed for the lowest tested concentrations represent the percentage of isolates with MIC's equal to or less than the lowest tested concentration.
1 Percent of isolates with intermediate susceptibility. N/A used when there is no intermediate breakpoint established. 2 Percent of isolates with resistance. Discrepancies between %R and sums of distribution %'s are due to rounding. Percent (%) non-susceptible is reported rather than %R for daptomycin and tigecycline because there is no CLSI breakpoint established.
Turk
eys
Sw
ine
Cat
tleTu
rkey
sC
hick
ens
Sw
ine
Cat
tleTu
rkey
sC
hick
ens
Sw
ine
Cat
tleTu
rkey
sC
hick
ens
Table 95c. Distribution of MICs and Occurrence among Enterococcus faecalis Isolates, 2013Distribution (%) of MICs (µg/ml)4
191

Year 2002 2003 2004 2005 2006 2007 2008 2009 2010 2011 2012 2013 Retail Chickens 134 188 88 116 126 123 165 138 214 186 204 202
HACCP1 1285 1440 1839 1150 776 501 418 420 275 Cecal 35
Retail Ground Turkey 294 289 260 339 291 261 271 260 369 392 384 407
Cecal 26
Retail Ground Beef 210 224 194 226 227 206 202 227 285 269 277 304 Cecal (Beef) 36 Cecal (Dairy) 54
Retail Pork Chops 255 313 313 320 301 263 263 259 353 334 350 328 Cecal (Market Hogs) 55
Cecal (Sows) 66
Antimicrobial Class
Antimicrobial (Resistance Breakpoint)
Isolate Source
Aminoglycosides Gentamicin 22.4% 20.2% 19.3% 18.1% 23.0% 19.5% 19.4% 25.4% 31.8% 26.9% 29.4% 24.3% (MIC >500 µg/ml) 30 38 17 21 29 24 32 35 68 50 60 49
25.1% 28.1% 25.8% 27.6% 31.4% 35.9% 32.8% 34.8% 36.7%322 404 475 317 244 180 137 146 101
45.7%16
22.1% 27.7% 24.6% 20.1% 22.0% 42.1% 41.3% 30.0% 37.4% 33.7% 32.6% 33.7%65 80 64 68 64 110 112 78 138 132 125 137
38.5%10
2.4% 1.8% 1.0% 1.8% 0.9% 0.5% 2.0% 0.9% 0.4% 0.0% 0.0% 0.7%5 4 2 4 2 1 4 2 1 0 0 2
2.8%1
0.0%0
2.7% 0.3% 1.9% 1.6% 0.7% 0.8% 0.4% 1.9% 1.4% 0.9% 1.7% 0.9%7 1 6 5 2 2 1 5 5 3 6 3
9.1%5
16.7%11
Kanamycin 32.1% 27.1% 22.7% 26.7% 30.2% 28.5% 29.7% 30.4% 36.0% 33.3% 34.8% 26.7% (MIC ≥ 1024 µg/ml) 43 51 20 31 38 35 49 42 77 62 71 54
35.6% 36.4% 36.5% 37.9% 39.7% 44.1% 35.6% 39.8% 43.3%458 524 671 436 308 221 149 167 119
48.6%17
26.2% 36.0% 29.6% 27.4% 32.0% 50.2% 55.4% 35.9% 44.7% 42.9% 38.5% 42.8%77 104 77 93 93 131 150 101 165 168 148 174
42.3%11
1.9% 3.1% 3.1% 4.0% 2.6% 2.0% 4.0% 1.8% 0.7% 1.5% 0.0% 2.3%4 7 6 9 6 4 8 4 2 4 0 7
5.6%2
1.9%1
4.7% 4.8% 2.6% 3.1% 2.3% 2.3% 3.0% 2.7% 1.7% 2.4% 2.0% 2.7%12 15 8 10 7 6 8 7 6 8 7 9
21.8%12
39.4%26
Streptomycin 29.1% 22.9% 18.2% 18.1% 10.3% 17.9% 10.9% 13.0% 15.4% 19.4% 17.7% 17.3% (MIC ≥ 1000 µg/ml) 39 43 16 21 13 22 18 18 33 36 36 35
20.7% 17.8% 21.2% 18.6% 14.4% 17.0% 16.7% 19.5% 21.8%266 256 390 214 112 85 70 82 60
11.4%4
24.1% 30.4% 26.9% 21.5% 20.3% 36.4% 39.1% 27.7% 27.9% 19.4% 17.7% 26.0%71 88 70 73 59 95 106 72 103 108 79 106
30.8%8
4.8% 5.4% 7.7% 8.4% 5.7% 4.9% 1.5% 5.3% 1.4% 1.9% 1.8% 3.6%10 12 15 19 13 10 3 12 4 5 5 11
5.6%2
1.9%1
10.6% 7.3% 9.3% 7.8% 7.6% 8.7% 10.3% 8.9% 6.8% 5.7% 4.0% 4.9%27 23 29 25 23 23 27 23 24 19 14 16
27.3%15
27.3%18
Glycopeptides Vancomycin 0.0% 0.0% 0.0% 0.0% 0.0% 0.0% 0.0% 0.0% 0.0% 0.0% 0.0% 0.0% (MIC ≥ 32 µg/ml) 0 0 0 0 0 0 0 0 0 0 0 0
0.0% 0.0% 0.0% 0.0% 0.0% 0.0% 0.0% 0.0% 0.0%0 0 0 0 0 0 0 0 0
0.0%0
0.0% 0.0% 0.0% 0.0% 0.0% 0.0% 0.0% 0.0% 0.0% 0.0% 0.0% 0.0%0 0 0 0 0 0 0 0 0 0 0 0
0.0%0
0.0% 0.0% 0.0% 0.0% 0.0% 0.0% 0.0% 0.0% 0.0% 0.0% 0.0% 0.0%0 0 0 0 0 0 0 0 0 0 0 0
0.0%0
0.0%0
0.0% 0.0% 0.0% 0.0% 0.0% 0.0% 0.0% 0.0% 0.0% 0.0% 0.0% 0.0%0 0 0 0 0 0 0 0 0 0 0 0
0.0%0
0.0%0
1 In 2012 and 2013, chicken carcass rinsates were not sampled for Enterococcus
Cat
tle
Retail Ground Beef
Cecal (Beef)
Cecal (Dairy)
Swin
e
Retail Pork Chops
Cecal (Market Hogs)
Cecal (Sows)
Chi
cken
s
Retail Chickens
HACCP
Cecal
Turk
eys Retail Ground Turkey
Cecal
Cat
tle
Retail Ground Beef
Cecal (Beef)
Cecal (Dairy)
Swin
e
Retail Pork Chops
Cecal (Market Hogs)
Cecal (Sows)
Chi
cken
s
Retail Chickens
HACCP
Cecal
Turk
eys Retail Ground Turkey
Cecal
Cat
tle
Retail Ground Beef
Cecal (Beef)
Cecal (Dairy)
Swin
e
Retail Pork Chops
Cecal (Market Hogs)
Cecal (Sows)
Chi
cken
s
Retail Chickens
HACCP
Cecal
Turk
eys Retail Ground Turkey
Cecal
Swin
e
Retail Pork Chops
Cecal (Market Hogs)
Cecal (Sows)
Swin
eC
hick
ens
Retail Chickens
HACCP
CecalTu
rkey
s Retail Ground Turkey
Cecal
Resistance by Year
Table 96a. Antimicrobial Resistance among Enterococcus faecalis Isolates, 2002-2013
Number of Isolates Tested
Chi
cken
sTu
rkey
sC
attle
Cat
tle
Retail Ground Beef
Cecal (Beef)
Cecal (Dairy)
192
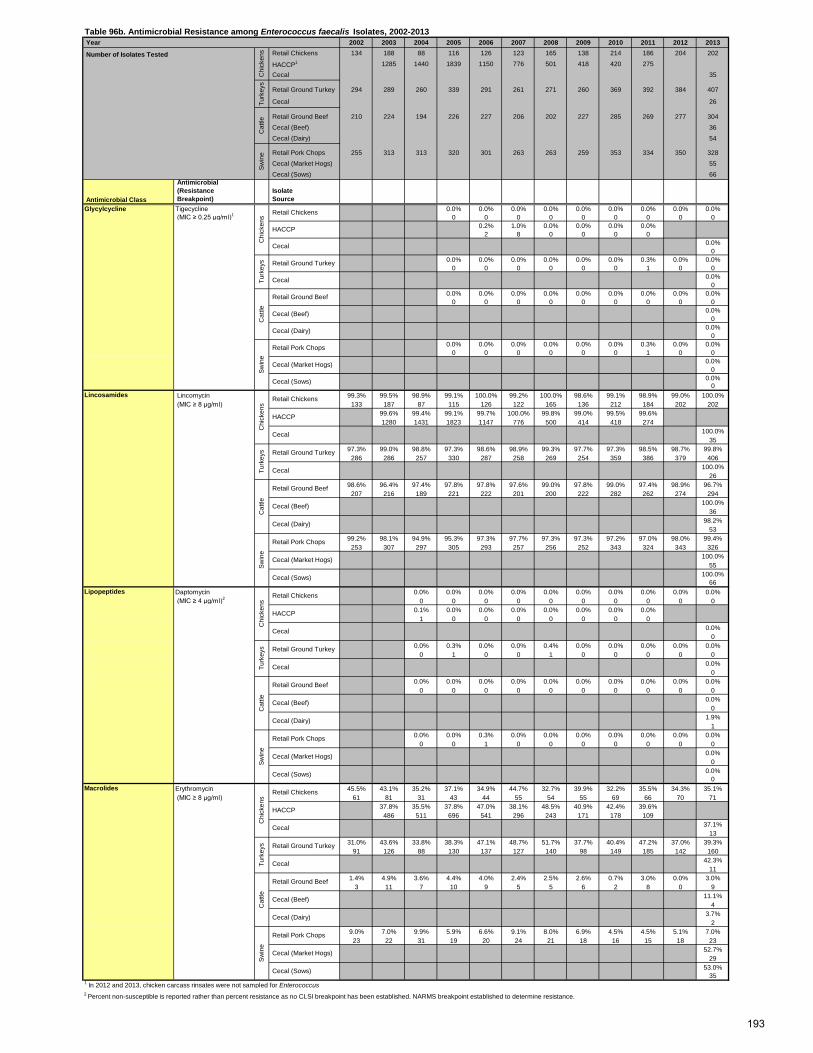
Year 2002 2003 2004 2005 2006 2007 2008 2009 2010 2011 2012 2013 Retail Chickens 134 188 88 116 126 123 165 138 214 186 204 202
HACCP1 1285 1440 1839 1150 776 501 418 420 275 Cecal 35
Retail Ground Turkey 294 289 260 339 291 261 271 260 369 392 384 407
Cecal 26
Retail Ground Beef 210 224 194 226 227 206 202 227 285 269 277 304 Cecal (Beef) 36 Cecal (Dairy) 54
Retail Pork Chops 255 313 313 320 301 263 263 259 353 334 350 328 Cecal (Market Hogs) 55
Cecal (Sows) 66
Antimicrobial Class
Antimicrobial (Resistance Breakpoint)
Isolate Source
Glycylcycline Tigecycline 0.0% 0.0% 0.0% 0.0% 0.0% 0.0% 0.0% 0.0% 0.0% (MIC ≥ 0.25 µg/ml)1 0 0 0 0 0 0 0 0 0
0.2% 1.0% 0.0% 0.0% 0.0% 0.0%2 8 0 0 0 0
0.0%0
0.0% 0.0% 0.0% 0.0% 0.0% 0.0% 0.3% 0.0% 0.0%0 0 0 0 0 0 1 0 0
0.0%0
0.0% 0.0% 0.0% 0.0% 0.0% 0.0% 0.0% 0.0% 0.0%0 0 0 0 0 0 0 0 0
0.0%0
0.0%0
0.0% 0.0% 0.0% 0.0% 0.0% 0.0% 0.3% 0.0% 0.0%0 0 0 0 0 0 1 0 0
0.0%0
0.0%0
Lincosamides Lincomycin 99.3% 99.5% 98.9% 99.1% 100.0% 99.2% 100.0% 98.6% 99.1% 98.9% 99.0% 100.0% (MIC ≥ 8 µg/ml) 133 187 87 115 126 122 165 136 212 184 202 202
99.6% 99.4% 99.1% 99.7% 100.0% 99.8% 99.0% 99.5% 99.6%1280 1431 1823 1147 776 500 414 418 274
100.0%35
97.3% 99.0% 98.8% 97.3% 98.6% 98.9% 99.3% 97.7% 97.3% 98.5% 98.7% 99.8%286 286 257 330 287 258 269 254 359 386 379 406
100.0%26
98.6% 96.4% 97.4% 97.8% 97.8% 97.6% 99.0% 97.8% 99.0% 97.4% 98.9% 96.7%207 216 189 221 222 201 200 222 282 262 274 294
100.0%36
98.2%53
99.2% 98.1% 94.9% 95.3% 97.3% 97.7% 97.3% 97.3% 97.2% 97.0% 98.0% 99.4%253 307 297 305 293 257 256 252 343 324 343 326
100.0%55
100.0%66
Lipopeptides Daptomycin 0.0% 0.0% 0.0% 0.0% 0.0% 0.0% 0.0% 0.0% 0.0% 0.0% (MIC ≥ 4 µg/ml)2 0 0 0 0 0 0 0 0 0 0
0.1% 0.0% 0.0% 0.0% 0.0% 0.0% 0.0% 0.0%1 0 0 0 0 0 0 0
0.0%0
0.0% 0.3% 0.0% 0.0% 0.4% 0.0% 0.0% 0.0% 0.0% 0.0%0 1 0 0 1 0 0 0 0 0
0.0%0
0.0% 0.0% 0.0% 0.0% 0.0% 0.0% 0.0% 0.0% 0.0% 0.0%0 0 0 0 0 0 0 0 0 0
0.0%0
1.9%1
0.0% 0.0% 0.3% 0.0% 0.0% 0.0% 0.0% 0.0% 0.0% 0.0%0 0 1 0 0 0 0 0 0 0
0.0%0
0.0%0
Macrolides Erythromycin 45.5% 43.1% 35.2% 37.1% 34.9% 44.7% 32.7% 39.9% 32.2% 35.5% 34.3% 35.1% (MIC ≥ 8 µg/ml) 61 81 31 43 44 55 54 55 69 66 70 71
37.8% 35.5% 37.8% 47.0% 38.1% 48.5% 40.9% 42.4% 39.6%486 511 696 541 296 243 171 178 109
37.1%13
31.0% 43.6% 33.8% 38.3% 47.1% 48.7% 51.7% 37.7% 40.4% 47.2% 37.0% 39.3%91 126 88 130 137 127 140 98 149 185 142 160
42.3%11
1.4% 4.9% 3.6% 4.4% 4.0% 2.4% 2.5% 2.6% 0.7% 3.0% 0.0% 3.0%3 11 7 10 9 5 5 6 2 8 0 9
11.1%4
3.7%2
9.0% 7.0% 9.9% 5.9% 6.6% 9.1% 8.0% 6.9% 4.5% 4.5% 5.1% 7.0%23 22 31 19 20 24 21 18 16 15 18 23
52.7%29
53.0%35
1 In 2012 and 2013, chicken carcass rinsates were not sampled for Enterococcus2 Percent non-susceptible is reported rather than percent resistance as no CLSI breakpoint has been established. NARMS breakpoint established to determine resistance.
Cat
tle
Retail Ground Beef
Cecal (Beef)
Cecal (Dairy)
Swin
e
Retail Pork Chops
Cecal (Market Hogs)
Cecal (Sows)
Chi
cken
s
Retail Chickens
HACCP
Cecal
Turk
eys Retail Ground Turkey
Cecal
Cat
tle
Retail Ground Beef
Cecal (Beef)
Cecal (Dairy)
Swin
e
Retail Pork Chops
Cecal (Market Hogs)
Cecal (Sows)
Chi
cken
s
Retail Chickens
HACCP
Cecal
Turk
eys Retail Ground Turkey
Cecal
Cat
tle
Retail Ground Beef
Cecal (Beef)
Cecal (Dairy)
Swin
e
Retail Pork Chops
Cecal (Market Hogs)
Cecal (Sows)
Chi
cken
s
Retail Chickens
HACCP
Cecal
Turk
eys Retail Ground Turkey
Cecal
Cat
tle
Retail Ground Beef
Cecal (Beef)
Cecal (Dairy)
Swin
e
Retail Pork Chops
Cecal (Market Hogs)
Cecal (Sows)
Chi
cken
s
Retail Chickens
HACCP
Cecal
Turk
eys Retail Ground Turkey
Cecal
Table 96b. Antimicrobial Resistance among Enterococcus faecalis Isolates, 2002-2013
Number of Isolates Tested
Chi
cken
sTu
rkey
sC
attle
Swin
e
193

Year 2002 2003 2004 2005 2006 2007 2008 2009 2010 2011 2012 2013 Retail Chickens 134 188 88 116 126 123 165 138 214 186 204 202
HACCP1 1285 1440 1839 1150 776 501 418 420 275 Cecal 35
Retail Ground Turkey 294 289 260 339 291 261 271 260 369 392 384 407 Cecal 26
Retail Ground Beef 210 224 194 226 227 206 202 227 285 269 277 304 Cecal (Beef) 36 Cecal (Dairy) 54
Retail Pork Chops 255 313 313 320 301 263 263 259 353 334 350 328 Cecal (Market Hogs) 55
Cecal (Sows) 66
Antimicrobial Class
Antimicrobial (Resistance Breakpoint)
Isolate Source
Macrolides Tylosin 48.5% 42.6% 34.1% 37.1% 36.5% 44.7% 32.7% 39.9% 32.4% 35.5% 34.3% 35.1% (MIC ≥ 32 µg/ml) 65 80 30 43 46 55 54 55 69 66 70 71
38.8% 37.6% 38.5% 48.2% 38.3% 48.7% 41.6% 43.3% 39.6%499 541 708 554 297 244 174 182 109
48.6%17
32.0% 43.9% 34.6% 38.3% 47.1% 49.4% 51.3% 37.7% 40.4% 47.2% 37.0% 39.1%94 127 90 130 137 129 139 98 149 185 142 159
42.3%11
1.9% 4.9% 3.6% 5.8% 4.0% 2.4% 3.0% 2.2% 0.7% 3.0% 0.0% 3.0%4 11 7 13 9 5 6 5 2 8 0 9
11.1%4
3.7%2
9.0% 7.0% 9.9% 6.3% 7.3% 9.1% 7.6% 6.6% 4.5% 4.8% 5.1% 7.0%23 22 31 20 22 24 20 17 16 16 18 23
52.7%29
53.0%35
Nitrofurans Nitrofurantoin 0.7% 1.1% 1.1% 4.3% 0.0% 0.0% 1.2% 0.0% 0.0% 0.5% 0.0% 0.0% (MIC ≥ 128 µg/ml) 1 2 1 5 0 0 2 0 0 1 0 0
0.2% 1.0% 1.0% 1.0% 1.0% 0.2% 0.5% 1.0% 3.3%3 14 19 12 8 1 2 4 9
0.0%0
2.0% 1.4% 1.2% 2.4% 0.0% 0.0% 0.0% 0.4% 0.0% 0.0% 0.0% 0.0%6 4 3 8 0 0 0 1 0 0 0 0
0.0%0
0.0% 0.0% 0.0% 0.9% 0.0% 0.0% 0.5% 0.0% 0.0% 0.0% 0.0% 0.0%0 0 0 2 0 0 1 0 0 0 0 0
0.0%0
0.0%0
0.0% 0.0% 0.3% 0.3% 0.0% 0.0% 0.0% 0.0% 0.0% 0.0% 0.3% 0.0%0 0 1 1 0 0 0 0 0 0 1 0
0.0%0
0.0%0
Oxazolidinones Linezolid 0.0% 0.0% 0.0% 0.0% 0.0% 0.0% 0.0% 0.0% 0.0% 0.0% 0.0% 0.0% (MIC ≥ 8 µg/ml) 0 0 0 0 0 0 0 0 0 0 0 0
0.0% 0.0% 0.0% 0.0% 0.0% 0.0% 0.0% 0.0% 0.0%0 0 0 0 0 0 0 0 0
0.0%0
0.0% 0.0% 0.0% 0.0% 0.0% 0.0% 0.0% 0.0% 0.0% 0.0% 0.0% 0.0%0 0 0 0 0 0 0 0 0 0 0 0
0.0%0
0.0% 0.0% 0.0% 0.0% 0.0% 0.0% 0.0% 0.0% 0.0% 0.0% 0.0% 0.0%0 0 0 0 0 0 0 0 0 0 0 0
0.0%0
0.0%0
0.0% 0.0% 0.0% 0.0% 0.0% 0.0% 0.0% 0.0% 0.0% 0.0% 0.0% 0.0%0 0 0 0 0 0 0 0 0 0 0 0
0.0%0
1.5%1
Penicillins Penicillin 0.0% 0.0% 0.0% 0.0% 0.0% 0.0% 0.0% 0.0% 0.5% 0.0% 0.0% 0.0% (MIC ≥ 16 µg/ml) 0 0 0 0 0 0 0 0 1 0 0 0
0.2% 0.9% 0.4% 0.1% 0.6% 0.2% 0.2% 0.5% 1.5%2 13 7 1 5 1 1 2 4
0.0%0
0.0% 0.0% 0.0% 1.5% 0.3% 0.0% 0.0% 0.0% 0.3% 0.0% 0.3% 0.0%0 0 0 5 1 0 0 0 1 0 1 0
0.0%0
0.0% 0.0% 0.0% 0.0% 0.0% 0.0% 0.0% 0.4% 0.0% 0.0% 0.0% 0.0%0 0 0 0 0 0 0 1 0 0 0 0
0.0%0
0.0%0
0.0% 0.0% 0.0% 1.3% 0.0% 0.0% 0.4% 0.4% 0.3% 0.0% 0.0% 0.0%0 0 0 4 0 0 1 1 1 0 0 0
0.0%0
0.0%0
1 In 2012 and 2013, chicken carcass rinsates were not sampled for Enterococcus
Cat
tle
Retail Ground Beef
Cecal (Beef)
Cecal (Dairy)
Swin
e
Retail Pork Chops
Cecal (Market Hogs)
Cecal (Sows)
Chi
cken
s
Retail Chickens
HACCP
Cecal
Turk
eys Retail Ground Turkey
Cecal
Cat
tle
Retail Ground Beef
Cecal (Beef)
Cecal (Dairy)
Swin
e
Retail Pork Chops
Cecal (Market Hogs)
Cecal (Sows)
Chi
cken
s
Retail Chickens
HACCP
Cecal
Turk
eys Retail Ground Turkey
Cecal
Cat
tle
Retail Ground Beef
Cecal (Beef)
Cecal (Dairy)
Swin
e
Retail Pork Chops
Cecal (Market Hogs)
Cecal (Sows)
Chi
cken
s
Retail Chickens
HACCP
Cecal
Turk
eys Retail Ground Turkey
Cecal
Cat
tle
Retail Ground Beef
Cecal (Beef)
Cecal (Dairy)
Swin
e
Retail Pork Chops
Cecal (Market Hogs)
Cecal (Sows)
Chi
cken
s
Retail Chickens
HACCP
Cecal
Turk
eys Retail Ground Turkey
Cecal
Table 96c. Antimicrobial Resistance among Enterococcus faecalis Isolates, 2002-2013
Number of Isolates Tested
Chi
cken
sTu
rkey
sC
attle
Swin
e
194
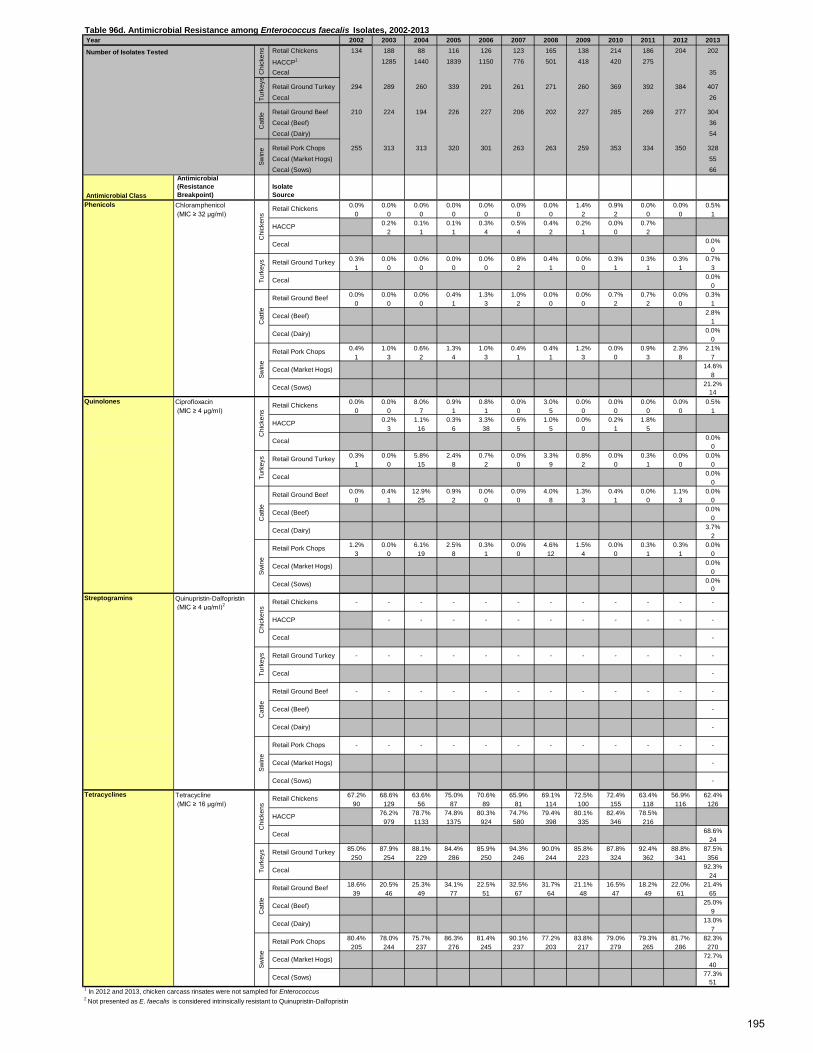
Year 2002 2003 2004 2005 2006 2007 2008 2009 2010 2011 2012 2013 Retail Chickens 134 188 88 116 126 123 165 138 214 186 204 202
HACCP1 1285 1440 1839 1150 776 501 418 420 275 Cecal 35
Retail Ground Turkey 294 289 260 339 291 261 271 260 369 392 384 407 Cecal 26
Retail Ground Beef 210 224 194 226 227 206 202 227 285 269 277 304 Cecal (Beef) 36 Cecal (Dairy) 54
Retail Pork Chops 255 313 313 320 301 263 263 259 353 334 350 328 Cecal (Market Hogs) 55
Cecal (Sows) 66
Antimicrobial Class
Antimicrobial (Resistance Breakpoint)
Isolate Source
Phenicols Chloramphenicol 0.0% 0.0% 0.0% 0.0% 0.0% 0.0% 0.0% 1.4% 0.9% 0.0% 0.0% 0.5% (MIC ≥ 32 µg/ml) 0 0 0 0 0 0 0 2 2 0 0 1
0.2% 0.1% 0.1% 0.3% 0.5% 0.4% 0.2% 0.0% 0.7%2 1 1 4 4 2 1 0 2
0.0%0
0.3% 0.0% 0.0% 0.0% 0.0% 0.8% 0.4% 0.0% 0.3% 0.3% 0.3% 0.7%1 0 0 0 0 2 1 0 1 1 1 3
0.0%0
0.0% 0.0% 0.0% 0.4% 1.3% 1.0% 0.0% 0.0% 0.7% 0.7% 0.0% 0.3%0 0 0 1 3 2 0 0 2 2 0 1
2.8%1
0.0%0
0.4% 1.0% 0.6% 1.3% 1.0% 0.4% 0.4% 1.2% 0.0% 0.9% 2.3% 2.1%1 3 2 4 3 1 1 3 0 3 8 7
14.6%8
21.2%14
Quinolones Ciprofloxacin 0.0% 0.0% 8.0% 0.9% 0.8% 0.0% 3.0% 0.0% 0.0% 0.0% 0.0% 0.5% (MIC ≥ 4 µg/ml) 0 0 7 1 1 0 5 0 0 0 0 1
0.2% 1.1% 0.3% 3.3% 0.6% 1.0% 0.0% 0.2% 1.8%3 16 6 38 5 5 0 1 5
0.0%0
0.3% 0.0% 5.8% 2.4% 0.7% 0.0% 3.3% 0.8% 0.0% 0.3% 0.0% 0.0%1 0 15 8 2 0 9 2 0 1 0 0
0.0%0
0.0% 0.4% 12.9% 0.9% 0.0% 0.0% 4.0% 1.3% 0.4% 0.0% 1.1% 0.0%0 1 25 2 0 0 8 3 1 0 3 0
0.0%0
3.7%2
1.2% 0.0% 6.1% 2.5% 0.3% 0.0% 4.6% 1.5% 0.0% 0.3% 0.3% 0.0%3 0 19 8 1 0 12 4 0 1 1 0
0.0%0
0.0%0
Streptogramins Quinupristin-Dalfopristin (MIC ≥ 4 µg/ml)2
Tetracyclines Tetracycline 67.2% 68.6% 63.6% 75.0% 70.6% 65.9% 69.1% 72.5% 72.4% 63.4% 56.9% 62.4% (MIC ≥ 16 µg/ml) 90 129 56 87 89 81 114 100 155 118 116 126
76.2% 78.7% 74.8% 80.3% 74.7% 79.4% 80.1% 82.4% 78.5%979 1133 1375 924 580 398 335 346 216
68.6%24
85.0% 87.9% 88.1% 84.4% 85.9% 94.3% 90.0% 85.8% 87.8% 92.4% 88.8% 87.5%250 254 229 286 250 246 244 223 324 362 341 356
92.3%24
18.6% 20.5% 25.3% 34.1% 22.5% 32.5% 31.7% 21.1% 16.5% 18.2% 22.0% 21.4%39 46 49 77 51 67 64 48 47 49 61 65
25.0%9
13.0%7
80.4% 78.0% 75.7% 86.3% 81.4% 90.1% 77.2% 83.8% 79.0% 79.3% 81.7% 82.3%205 244 237 276 245 237 203 217 279 265 286 270
72.7%40
77.3%51
1 In 2012 and 2013, chicken carcass rinsates were not sampled for Enterococcus2 Not presented as E. faecalis is considered intrinsically resistant to Quinupristin-Dalfopristin
Swin
e
Retail Pork Chops
Cecal (Market Hogs)
Cecal (Sows)
Chi
cken
s
Retail Chickens
HACCP
Cecal
Turk
eys Retail Ground Turkey
Cecal
-
- - - - - -
Cat
tle
Retail Ground Beef
Cecal (Beef)
Cecal (Dairy)
Swin
e
Retail Pork Chops - - - -
Cat
tle
Retail Ground Beef - - - -
- -
Cecal (Market Hogs) -
Cecal (Sows) -
- -
Cecal -
- - -
- -
Cecal (Beef) -
Cecal (Dairy) -
- - - - -
- - -
Turk
eys Retail Ground Turkey - - - -
- - - -
Cecal -
- -
HACCP - - - - - - -
- - - - - -
Chi
cken
s
Retail Chickens - - - -
Cat
tle
Retail Ground Beef
Cecal (Beef)
Cecal (Dairy)
Swin
e
Retail Pork Chops
Cecal (Market Hogs)
Cecal (Sows)
Chi
cken
s
Retail Chickens
HACCP
Cecal
Turk
eys Retail Ground Turkey
Cecal
Cat
tle
Retail Ground Beef
Cecal (Beef)
Cecal (Dairy)
Swin
e
Retail Pork Chops
Cecal (Market Hogs)
Cecal (Sows)
Chi
cken
s
Retail Chickens
HACCP
Cecal
Turk
eys Retail Ground Turkey
Cecal
Table 96d. Antimicrobial Resistance among Enterococcus faecalis Isolates, 2002-2013
Number of Isolates Tested
Chi
cken
sTu
rkey
sC
attle
Swin
e
195

Year 2002 2003 2004 2005 2006 2007 2008 2009 2010 2011 2012 2013
Number of Isolates Tested Retail Chickens 134 188 88 116 126 123 165 138 214 186 204 202 HACCP1 1285 1440 1839 1150 776 501 418 420 275 Cecal 35
Retail Ground Turkey 294 289 260 339 291 261 271 260 369 392 384 407 Cecal 26
Retail Ground Beef 210 224 194 226 227 206 202 227 285 269 277 304 Cecal (Beef) 36 Cecal (Dairy) 54
Retail Pork Chops 255 313 313 320 301 263 263 259 353 334 350 328 Cecal (Market Hogs) 55 Cecal (Sows) 66
Resistance Pattern2 Source0.8% 0.5% 0.0% 0.9% 0.0% 0.0% 0.0% 0.7% 0.5% 0.5% 1.0% 0.0%
1. No Resistance Detected 1 1 0 1 0 0 0 1 1 1 2 00.1% 0.3% 0.1% 0.0% 0.0% 0.2% 1.0% 0.5% 0.0%
1 5 2 0 0 1 4 2 00.0%
01.4% 1.0% 0.4% 0.6% 0.3% 0.0% 0.0% 1.5% 2.2% 0.8% 0.5% 0.3%
4 3 1 2 1 0 0 4 8 3 2 10.0%
00.0% 2.7% 1.5% 1.3% 1.8% 2.0% 0.5% 1.8% 0.7% 2.2% 1.1% 3.3%
0 6 3 3 4 4 1 4 2 6 3 100.0%
01.9%
10.4% 0.0% 0.6% 1.3% 0.0% 0.4% 0.4% 0.4% 0.3% 0.6% 0.9% 0.0%
1 0 2 4 0 1 1 1 1 2 3 00.0%
00.0%
0 2. Resistance to ≥ 3 52.2% 47.9% 42.1% 50.0% 43.7% 45.5% 40.6% 43.5% 39.7% 41.4% 37.3% 38.1% Antimicrobial Classes 70 90 37 58 55 56 67 60 85 77 76 77
50.8% 52.3% 51.2% 58.7% 51.4% 57.9% 52.9% 54.8% 59.3%653 753 941 675 399 290 221 230 163
45.7%16
49.3% 54.3% 52.7% 43.4% 56.7% 67.0% 69.7% 50.0% 58.5% 60.2% 53.7% 58.0%145 157 137 147 165 175 189 130 216 236 206 236
57.7%15
4.8% 6.7% 10.8% 10.2% 7.5% 6.8% 5.5% 6.6% 2.5% 3.7% 1.8% 3.6%10 15 21 23 17 14 11 15 7 10 5 11
13.9%5
5.6%3
15.7% 9.9% 18.8% 14.4% 12.3% 16.3% 17.5% 14.7% 9.3% 8.4% 8.6% 8.2%40 31 59 46 37 43 46 38 33 28 30 27
56.4%31
59.1%39
3. Resistant to ≥ 4 32.1% 19.1% 18.2% 20.7% 19.8% 22.8% 21.2% 21.7% 23.8% 23.1% 21.1% 19.3% Antimicrobial Classes 43 36 16 24 25 28 35 30 51 43 43 39
22.5% 22.9% 23.1% 28.4% 22.9% 29.5% 23.4% 27.1% 27.6%
289 330 424 327 178 148 98 114 76
28.6%10
17.7% 31.1% 22.3% 25.7% 22.7% 36.4% 42.8% 28.1% 29.5% 30.9% 23.7% 26.5%52 90 58 87 66 95 116 73 109 121 91 108
26.9%7
1.9% 3.1% 3.1% 4.4% 2.2% 1.5% 2.0% 1.3% 0.7% 1.5% 0.0% 2.6%4 7 6 10 5 3 4 3 2 4 0 8
5.6%2
1.9%1
4.7% 5.1% 5.8% 4.4% 3.3% 2.3% 4.9% 3.9% 2.5% 3.3% 3.1% 4.3%12 16 18 14 10 6 13 10 9 11 11 14
30.9%17
43.9%29
4. Resistant to ≥ 5 0.0% 0.5% 1.1% 0.9% 0.0% 0.0% 1.2% 1.4% 0.9% 0.0% 0.0% 0.5% Antimicrobial Classes 0 1 1 1 0 0 2 2 2 0 0 1
0.0% 0.8% 0.5% 1.0% 0.9% 0.6% 0.2% 0.2% 3.3%0 11 9 12 7 3 1 1 9
0.0%0
0.7% 0.7% 0.0% 1.5% 0.3% 0.0% 0.7% 0.0% 0.0% 0.8% 0.0% 0.3%2 2 0 5 1 0 2 0 0 3 0 1
0.0%0
0.0% 0.0% 0.0% 0.4% 0.4% 0.5% 0.0% 0.0% 0.0% 0.7% 0.0% 0.3%0 0 0 1 1 1 0 0 0 2 0 1
2.8%1
0.0%0
0.4% 0.6% 1.0% 1.3% 0.7% 0.4% 0.8% 0.8% 0.0% 0.6% 0.9% 1.2%1 2 3 4 2 1 2 2 0 2 3 4
12.7%7
18.2%12
1 In 2012 and 2013, chicken carcass rinsates were not sampled for Enterococcus2 Resistance patterns do not include Quinupristin-Dalfoprisitn as E. faecalis is considered intrinsically resistant
Cat
tle
Retail Ground Beef
Cecal (Beef)
Cecal (Dairy)
Swin
e
Retail Pork Chops
Cecal (Market Hogs)
Cecal (Sows)
Chi
cken
s
Retail Chickens
HACCP
Cecal
Turk
eys Retail Ground Turkey
Cecal
Cat
tle
Retail Ground Beef
Cecal (Beef)
Cecal (Dairy)
Swin
e
Retail Pork Chops
Cecal (Market Hogs)
Cecal (Sows)
Chi
cken
s
Retail Chickens
HACCP
Cecal
Turk
eys Retail Ground Turkey
Cecal
Cat
tle
Retail Ground Beef
Cecal (Beef)
Cecal (Dairy)
Swin
e
Retail Pork Chops
Cecal (Market Hogs)
Cecal (Sows)
Chi
cken
s
Retail Chickens
HACCP
Cecal
Turk
eys Retail Ground Turkey
Cecal
Cat
tle
Retail Ground Beef
Cecal (Beef)
Cecal (Dairy)
Swin
e
Retail Pork Chops
Cecal (Market Hogs)
Cecal (Sows)
Chi
cken
s
Retail Chickens
HACCP
Cecal
Turk
eys Retail Ground Turkey
Cecal
Multidrug Resistance
Table 97a. Resistance Patterns among Enterococcus faecalis Isolates, 2002-2013
Chi
cken
sTu
rkey
sC
attle
Swin
e
196
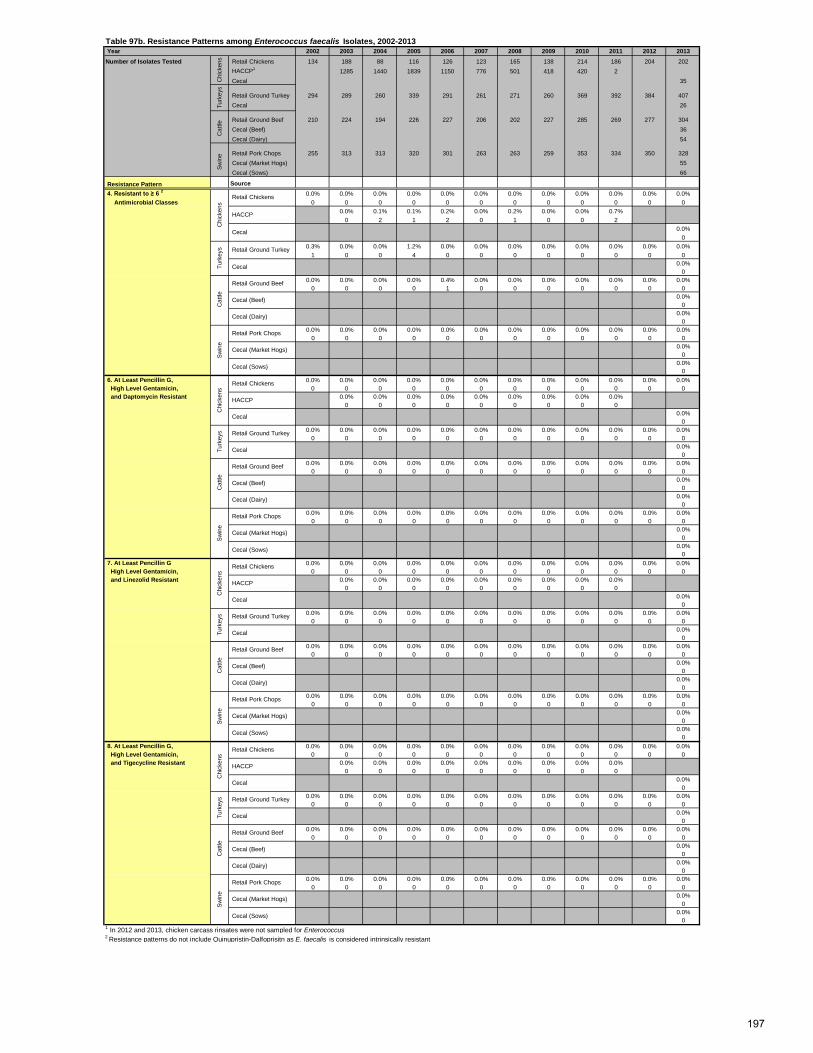
Year 2002 2003 2004 2005 2006 2007 2008 2009 2010 2011 2012 2013Number of Isolates Tested Retail Chickens 134 188 88 116 126 123 165 138 214 186 204 202
HACCP1 1285 1440 1839 1150 776 501 418 420 2 Cecal 35
Retail Ground Turkey 294 289 260 339 291 261 271 260 369 392 384 407 Cecal 26
Retail Ground Beef 210 224 194 226 227 206 202 227 285 269 277 304 Cecal (Beef) 36 Cecal (Dairy) 54
Retail Pork Chops 255 313 313 320 301 263 263 259 353 334 350 328 Cecal (Market Hogs) 55 Cecal (Sows) 66
Resistance Pattern Source 4. Resistant to ≥ 6 2 0.0% 0.0% 0.0% 0.0% 0.0% 0.0% 0.0% 0.0% 0.0% 0.0% 0.0% 0.0% Antimicrobial Classes 0 0 0 0 0 0 0 0 0 0 0 0
0.0% 0.1% 0.1% 0.2% 0.0% 0.2% 0.0% 0.0% 0.7%0 2 1 2 0 1 0 0 2
0.0%0
0.3% 0.0% 0.0% 1.2% 0.0% 0.0% 0.0% 0.0% 0.0% 0.0% 0.0% 0.0%1 0 0 4 0 0 0 0 0 0 0 0
0.0%0
0.0% 0.0% 0.0% 0.0% 0.4% 0.0% 0.0% 0.0% 0.0% 0.0% 0.0% 0.0%0 0 0 0 1 0 0 0 0 0 0 0
0.0%0
0.0%0
0.0% 0.0% 0.0% 0.0% 0.0% 0.0% 0.0% 0.0% 0.0% 0.0% 0.0% 0.0%0 0 0 0 0 0 0 0 0 0 0 0
0.0%0
0.0%0
6. At Least Pencillin G, 0.0% 0.0% 0.0% 0.0% 0.0% 0.0% 0.0% 0.0% 0.0% 0.0% 0.0% 0.0% High Level Gentamicin, 0 0 0 0 0 0 0 0 0 0 0 0 and Daptomycin Resistant 0.0% 0.0% 0.0% 0.0% 0.0% 0.0% 0.0% 0.0% 0.0%
0 0 0 0 0 0 0 0 00.0%
00.0% 0.0% 0.0% 0.0% 0.0% 0.0% 0.0% 0.0% 0.0% 0.0% 0.0% 0.0%
0 0 0 0 0 0 0 0 0 0 0 00.0%
00.0% 0.0% 0.0% 0.0% 0.0% 0.0% 0.0% 0.0% 0.0% 0.0% 0.0% 0.0%
0 0 0 0 0 0 0 0 0 0 0 00.0%
00.0%
00.0% 0.0% 0.0% 0.0% 0.0% 0.0% 0.0% 0.0% 0.0% 0.0% 0.0% 0.0%
0 0 0 0 0 0 0 0 0 0 0 00.0%
00.0%
0 7. At Least Pencillin G 0.0% 0.0% 0.0% 0.0% 0.0% 0.0% 0.0% 0.0% 0.0% 0.0% 0.0% 0.0% High Level Gentamicin, 0 0 0 0 0 0 0 0 0 0 0 0 and Linezolid Resistant 0.0% 0.0% 0.0% 0.0% 0.0% 0.0% 0.0% 0.0% 0.0%
0 0 0 0 0 0 0 0 00.0%
00.0% 0.0% 0.0% 0.0% 0.0% 0.0% 0.0% 0.0% 0.0% 0.0% 0.0% 0.0%
0 0 0 0 0 0 0 0 0 0 0 00.0%
00.0% 0.0% 0.0% 0.0% 0.0% 0.0% 0.0% 0.0% 0.0% 0.0% 0.0% 0.0%
0 0 0 0 0 0 0 0 0 0 0 00.0%
00.0%
00.0% 0.0% 0.0% 0.0% 0.0% 0.0% 0.0% 0.0% 0.0% 0.0% 0.0% 0.0%
0 0 0 0 0 0 0 0 0 0 0 00.0%
00.0%
0 8. At Least Pencillin G, 0.0% 0.0% 0.0% 0.0% 0.0% 0.0% 0.0% 0.0% 0.0% 0.0% 0.0% 0.0% High Level Gentamicin, 0 0 0 0 0 0 0 0 0 0 0 0 and Tigecycline Resistant 0.0% 0.0% 0.0% 0.0% 0.0% 0.0% 0.0% 0.0% 0.0%
0 0 0 0 0 0 0 0 00.0%
00.0% 0.0% 0.0% 0.0% 0.0% 0.0% 0.0% 0.0% 0.0% 0.0% 0.0% 0.0%
0 0 0 0 0 0 0 0 0 0 0 00.0%
00.0% 0.0% 0.0% 0.0% 0.0% 0.0% 0.0% 0.0% 0.0% 0.0% 0.0% 0.0%
0 0 0 0 0 0 0 0 0 0 0 00.0%
00.0%
00.0% 0.0% 0.0% 0.0% 0.0% 0.0% 0.0% 0.0% 0.0% 0.0% 0.0% 0.0%
0 0 0 0 0 0 0 0 0 0 0 00.0%
00.0%
01 In 2012 and 2013, chicken carcass rinsates were not sampled for Enterococcus2 Resistance patterns do not include Quinupristin-Dalfoprisitn as E. faecalis is considered intrinsically resistant
Cat
tle
Retail Ground Beef
Cecal (Beef)
Cecal (Dairy)
Swin
e
Retail Pork Chops
Cecal (Market Hogs)
Cecal (Sows)
Chi
cken
s
Retail Chickens
HACCP
Cecal
Turk
eys Retail Ground Turkey
Cecal
Cat
tle
Retail Ground Beef
Cecal (Beef)
Cecal (Dairy)
Swin
e
Retail Pork Chops
Cecal (Market Hogs)
Cecal (Sows)
Chi
cken
s
Retail Chickens
HACCP
Cecal
Turk
eys Retail Ground Turkey
Cecal
Cat
tle
Retail Ground Beef
Cecal (Beef)
Cecal (Dairy)
Swin
e
Retail Pork Chops
Cecal (Market Hogs)
Cecal (Sows)
Chi
cken
s
Retail Chickens
HACCP
Cecal
Turk
eys Retail Ground Turkey
Cecal
Cat
tle
Retail Ground Beef
Cecal (Beef)
Cecal (Dairy)
Swin
e
Retail Pork Chops
Cecal (Market Hogs)
Cecal (Sows)
Chi
cken
s
Retail Chickens
HACCP
Cecal
Turk
eys Retail Ground Turkey
Cecal
Table 97b. Resistance Patterns among Enterococcus faecalis Isolates, 2002-2013
Chi
cken
sC
attle
Swin
eTu
rkey
s
197
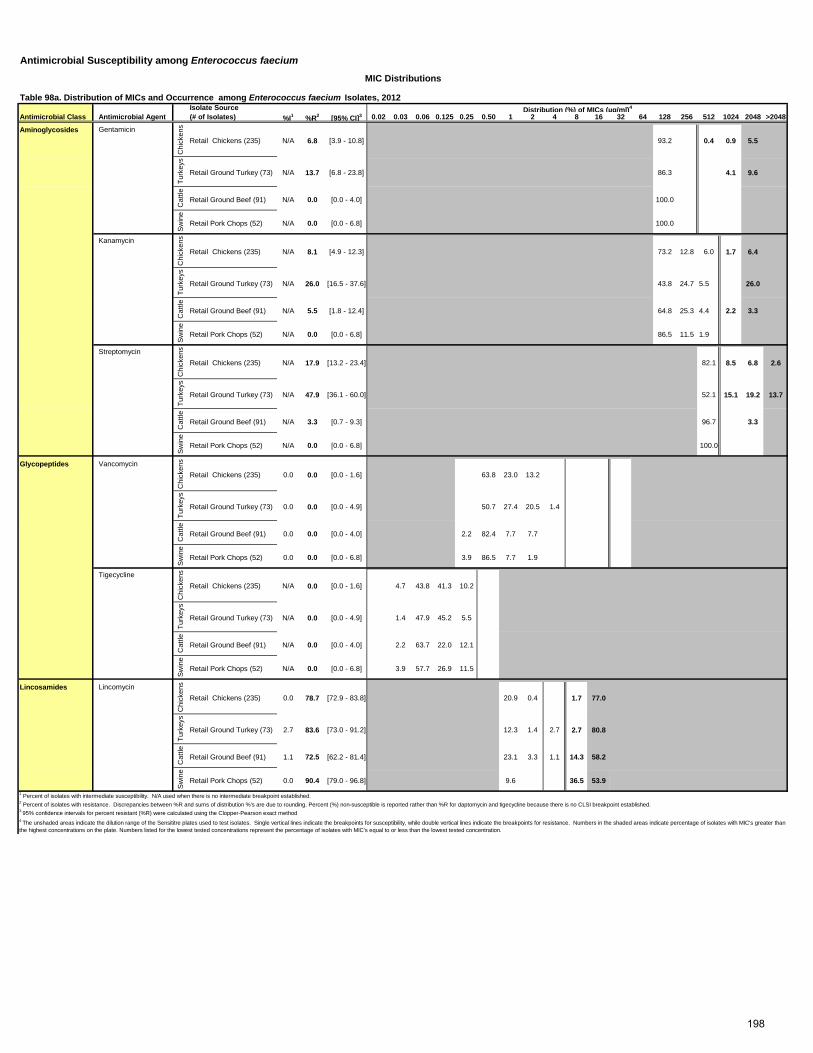
Antimicrobial Susceptibility among Enterococcus faecium
Isolate SourceAntimicrobial Class Antimicrobial Agent (# of Isolates) %I1 %R2 [95% CI]3 0.02 0.03 0.06 0.125 0.25 0.50 1 2 4 8 16 32 64 128 256 512 1024 2048 >2048
Aminoglycosides GentamicinRetail Chickens (235) N/A 6.8 [3.9 - 10.8] 93.2 0.4 0.9 5.5
Retail Ground Turkey (73) N/A 13.7 [6.8 - 23.8] 86.3 4.1 9.6
Retail Ground Beef (91) N/A 0.0 [0.0 - 4.0] 100.0
Retail Pork Chops (52) N/A 0.0 [0.0 - 6.8] 100.0
KanamycinRetail Chickens (235) N/A 8.1 [4.9 - 12.3] 73.2 12.8 6.0 1.7 6.4
Retail Ground Turkey (73) N/A 26.0 [16.5 - 37.6] 43.8 24.7 5.5 26.0
Retail Ground Beef (91) N/A 5.5 [1.8 - 12.4] 64.8 25.3 4.4 2.2 3.3
Retail Pork Chops (52) N/A 0.0 [0.0 - 6.8] 86.5 11.5 1.9
StreptomycinRetail Chickens (235) N/A 17.9 [13.2 - 23.4] 82.1 8.5 6.8 2.6
Retail Ground Turkey (73) N/A 47.9 [36.1 - 60.0] 52.1 15.1 19.2 13.7
Retail Ground Beef (91) N/A 3.3 [0.7 - 9.3] 96.7 3.3
Retail Pork Chops (52) N/A 0.0 [0.0 - 6.8] 100.0
Glycopeptides VancomycinRetail Chickens (235) 0.0 0.0 [0.0 - 1.6] 63.8 23.0 13.2
Retail Ground Turkey (73) 0.0 0.0 [0.0 - 4.9] 50.7 27.4 20.5 1.4
Retail Ground Beef (91) 0.0 0.0 [0.0 - 4.0] 2.2 82.4 7.7 7.7
Retail Pork Chops (52) 0.0 0.0 [0.0 - 6.8] 3.9 86.5 7.7 1.9
TigecyclineRetail Chickens (235) N/A 0.0 [0.0 - 1.6] 4.7 43.8 41.3 10.2
Retail Ground Turkey (73) N/A 0.0 [0.0 - 4.9] 1.4 47.9 45.2 5.5
Retail Ground Beef (91) N/A 0.0 [0.0 - 4.0] 2.2 63.7 22.0 12.1
Retail Pork Chops (52) N/A 0.0 [0.0 - 6.8] 3.9 57.7 26.9 11.5
Lincosamides LincomycinRetail Chickens (235) 0.0 78.7 [72.9 - 83.8] 20.9 0.4 1.7 77.0
Retail Ground Turkey (73) 2.7 83.6 [73.0 - 91.2] 12.3 1.4 2.7 2.7 80.8
Retail Ground Beef (91) 1.1 72.5 [62.2 - 81.4] 23.1 3.3 1.1 14.3 58.2
Retail Pork Chops (52) 0.0 90.4 [79.0 - 96.8] 9.6 36.5 53.9
MIC Distributions
Table 98a. Distribution of MICs and Occurrence among Enterococcus faecium Isolates, 2012Distribution (%) of MICs (µg/ml)4
1 Percent of isolates with intermediate susceptibility. N/A used when there is no intermediate breakpoint established.
Chi
cken
sTu
rkey
sC
attle
Sw
ine
Chi
cken
sTu
rkey
sC
attle
Sw
ine
Chi
cken
sTu
rkey
sC
attle
Sw
ine
Chi
cken
sTu
rkey
sC
attle
Sw
ine
Chi
cken
sTu
rkey
sC
attle
Sw
ine
Chi
cken
sTu
rkey
sC
attle
Sw
ine
2 Percent of isolates with resistance. Discrepancies between %R and sums of distribution %'s are due to rounding. Percent (%) non-susceptible is reported rather than %R for daptomycin and tigecycline because there is no CLSI breakpoint established.3 95% confidence intervals for percent resistant (%R) were calculated using the Clopper-Pearson exact method4 The unshaded areas indicate the dilution range of the Sensititre plates used to test isolates. Single vertical lines indicate the breakpoints for susceptibility, while double vertical lines indicate the breakpoints for resistance. Numbers in the shaded areas indicate percentage of isolates with MIC's greater than the highest concentrations on the plate. Numbers listed for the lowest tested concentrations represent the percentage of isolates with MIC's equal to or less than the lowest tested concentration.
198
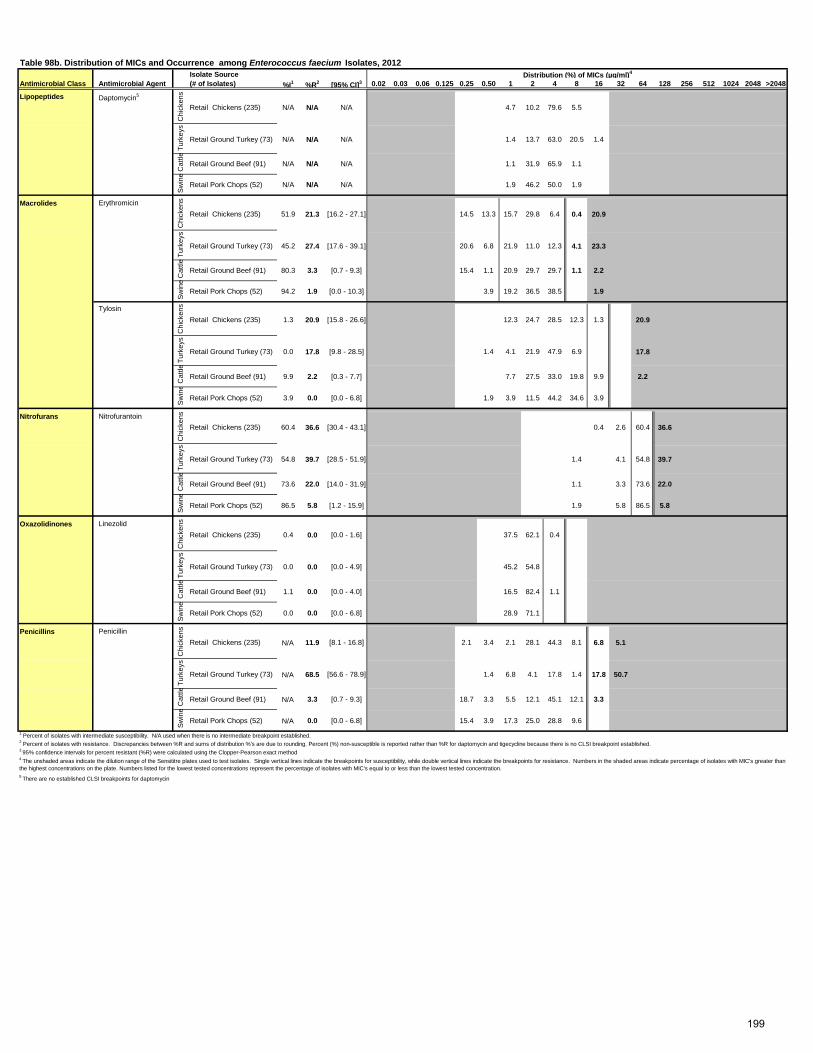
Isolate SourceAntimicrobial Class Antimicrobial Agent (# of Isolates) %I1 %R2 [95% CI]3 0.02 0.03 0.06 0.125 0.25 0.50 1 2 4 8 16 32 64 128 256 512 1024 2048 >2048
Lipopeptides Daptomycin5
Retail Chickens (235) N/A N/A N/A 4.7 10.2 79.6 5.5
Retail Ground Turkey (73) N/A N/A N/A 1.4 13.7 63.0 20.5 1.4
Cat
tle
Retail Ground Beef (91) N/A N/A N/A 1.1 31.9 65.9 1.1
Sw
ine
Retail Pork Chops (52) N/A N/A N/A 1.9 46.2 50.0 1.9
Macrolides ErythromicinRetail Chickens (235) 51.9 21.3 [16.2 - 27.1] 14.5 13.3 15.7 29.8 6.4 0.4 20.9
Retail Ground Turkey (73) 45.2 27.4 [17.6 - 39.1] 20.6 6.8 21.9 11.0 12.3 4.1 23.3
Cat
tle
Retail Ground Beef (91) 80.3 3.3 [0.7 - 9.3] 15.4 1.1 20.9 29.7 29.7 1.1 2.2
Sw
ine
Retail Pork Chops (52) 94.2 1.9 [0.0 - 10.3] 3.9 19.2 36.5 38.5 1.9
TylosinRetail Chickens (235) 1.3 20.9 [15.8 - 26.6] 12.3 24.7 28.5 12.3 1.3 20.9
Retail Ground Turkey (73) 0.0 17.8 [9.8 - 28.5] 1.4 4.1 21.9 47.9 6.9 17.8
Retail Ground Beef (91) 9.9 2.2 [0.3 - 7.7] 7.7 27.5 33.0 19.8 9.9 2.2
Retail Pork Chops (52) 3.9 0.0 [0.0 - 6.8] 1.9 3.9 11.5 44.2 34.6 3.9
Nitrofurans NitrofurantoinRetail Chickens (235) 60.4 36.6 [30.4 - 43.1] 0.4 2.6 60.4 36.6
Retail Ground Turkey (73) 54.8 39.7 [28.5 - 51.9] 1.4 4.1 54.8 39.7
Retail Ground Beef (91) 73.6 22.0 [14.0 - 31.9] 1.1 3.3 73.6 22.0
Retail Pork Chops (52) 86.5 5.8 [1.2 - 15.9] 1.9 5.8 86.5 5.8
Oxazolidinones LinezolidRetail Chickens (235) 0.4 0.0 [0.0 - 1.6] 37.5 62.1 0.4
Retail Ground Turkey (73) 0.0 0.0 [0.0 - 4.9] 45.2 54.8
Retail Ground Beef (91) 1.1 0.0 [0.0 - 4.0] 16.5 82.4 1.1
Sw
ine
Retail Pork Chops (52) 0.0 0.0 [0.0 - 6.8] 28.9 71.1
Penicillins PenicillinRetail Chickens (235) N/A 11.9 [8.1 - 16.8] 2.1 3.4 2.1 28.1 44.3 8.1 6.8 5.1
Retail Ground Turkey (73) N/A 68.5 [56.6 - 78.9] 1.4 6.8 4.1 17.8 1.4 17.8 50.7
Retail Ground Beef (91) N/A 3.3 [0.7 - 9.3] 18.7 3.3 5.5 12.1 45.1 12.1 3.3
Retail Pork Chops (52) N/A 0.0 [0.0 - 6.8] 15.4 3.9 17.3 25.0 28.8 9.6
5 There are no established CLSI breakpoints for daptomycin
Chi
cken
sTu
rkey
s
Table 98b. Distribution of MICs and Occurrence among Enterococcus faecium Isolates, 2012Distribution (%) of MICs (µg/ml)4
Chi
cken
sTu
rkey
sC
hick
ens
Turk
eys
Cat
tleS
win
eC
hick
ens
Turk
eys
Cat
tleS
win
eC
hick
ens
Turk
eys
Cat
tleC
hick
ens
Turk
eys
Cat
tleS
win
e
1 Percent of isolates with intermediate susceptibility. N/A used when there is no intermediate breakpoint established. 2 Percent of isolates with resistance. Discrepancies between %R and sums of distribution %'s are due to rounding. Percent (%) non-susceptible is reported rather than %R for daptomycin and tigecycline because there is no CLSI breakpoint established.3 95% confidence intervals for percent resistant (%R) were calculated using the Clopper-Pearson exact method4 The unshaded areas indicate the dilution range of the Sensititre plates used to test isolates. Single vertical lines indicate the breakpoints for susceptibility, while double vertical lines indicate the breakpoints for resistance. Numbers in the shaded areas indicate percentage of isolates with MIC's greater than the highest concentrations on the plate. Numbers listed for the lowest tested concentrations represent the percentage of isolates with MIC's equal to or less than the lowest tested concentration.
199
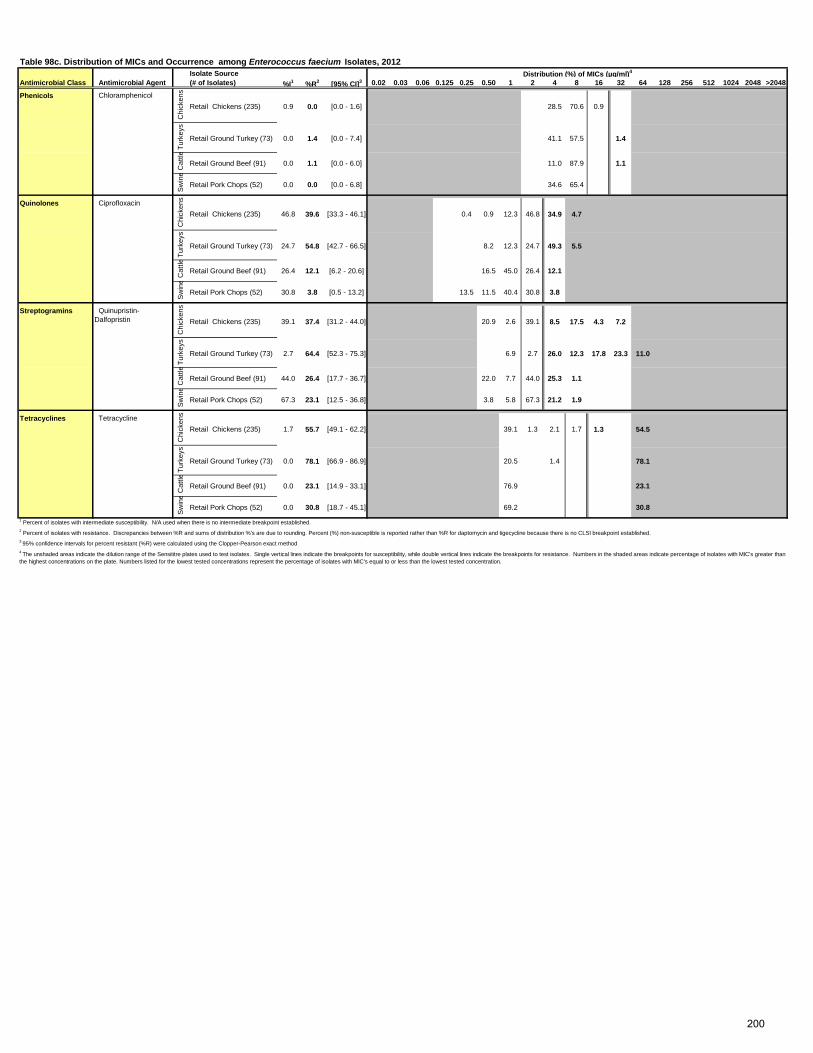
Isolate SourceAntimicrobial Class Antimicrobial Agent (# of Isolates) %I1 %R2 [95% CI]3 0.02 0.03 0.06 0.125 0.25 0.50 1 2 4 8 16 32 64 128 256 512 1024 2048 >2048
Phenicols ChloramphenicolRetail Chickens (235) 0.9 0.0 [0.0 - 1.6] 28.5 70.6 0.9
Retail Ground Turkey (73) 0.0 1.4 [0.0 - 7.4] 41.1 57.5 1.4
Retail Ground Beef (91) 0.0 1.1 [0.0 - 6.0] 11.0 87.9 1.1
Retail Pork Chops (52) 0.0 0.0 [0.0 - 6.8] 34.6 65.4
Quinolones CiprofloxacinRetail Chickens (235) 46.8 39.6 [33.3 - 46.1] 0.4 0.9 12.3 46.8 34.9 4.7
Retail Ground Turkey (73) 24.7 54.8 [42.7 - 66.5] 8.2 12.3 24.7 49.3 5.5
Retail Ground Beef (91) 26.4 12.1 [6.2 - 20.6] 16.5 45.0 26.4 12.1
Retail Pork Chops (52) 30.8 3.8 [0.5 - 13.2] 13.5 11.5 40.4 30.8 3.8
Streptogramins Quinupristin-Dalfopristin Retail Chickens (235) 39.1 37.4 [31.2 - 44.0] 20.9 2.6 39.1 8.5 17.5 4.3 7.2
Retail Ground Turkey (73) 2.7 64.4 [52.3 - 75.3] 6.9 2.7 26.0 12.3 17.8 23.3 11.0
Retail Ground Beef (91) 44.0 26.4 [17.7 - 36.7] 22.0 7.7 44.0 25.3 1.1
Retail Pork Chops (52) 67.3 23.1 [12.5 - 36.8] 3.8 5.8 67.3 21.2 1.9
Tetracyclines TetracyclineRetail Chickens (235) 1.7 55.7 [49.1 - 62.2] 39.1 1.3 2.1 1.7 1.3 54.5
Retail Ground Turkey (73) 0.0 78.1 [66.9 - 86.9] 20.5 1.4 78.1
Retail Ground Beef (91) 0.0 23.1 [14.9 - 33.1] 76.9 23.1
Retail Pork Chops (52) 0.0 30.8 [18.7 - 45.1] 69.2 30.8
3 95% confidence intervals for percent resistant (%R) were calculated using the Clopper-Pearson exact method4 The unshaded areas indicate the dilution range of the Sensititre plates used to test isolates. Single vertical lines indicate the breakpoints for susceptibility, while double vertical lines indicate the breakpoints for resistance. Numbers in the shaded areas indicate percentage of isolates with MIC's greater than the highest concentrations on the plate. Numbers listed for the lowest tested concentrations represent the percentage of isolates with MIC's equal to or less than the lowest tested concentration.
1 Percent of isolates with intermediate susceptibility. N/A used when there is no intermediate breakpoint established. 2 Percent of isolates with resistance. Discrepancies between %R and sums of distribution %'s are due to rounding. Percent (%) non-susceptible is reported rather than %R for daptomycin and tigecycline because there is no CLSI breakpoint established.
Sw
ine
Chi
cken
sTu
rkey
sC
attle
Sw
ine
Chi
cken
sTu
rkey
sC
attle
Sw
ine
Chi
cken
sTu
rkey
sC
attle
Sw
ine
Chi
cken
sTu
rkey
sC
attle
Table 98c. Distribution of MICs and Occurrence among Enterococcus faecium Isolates, 2012Distribution (%) of MICs (µg/ml)4
200
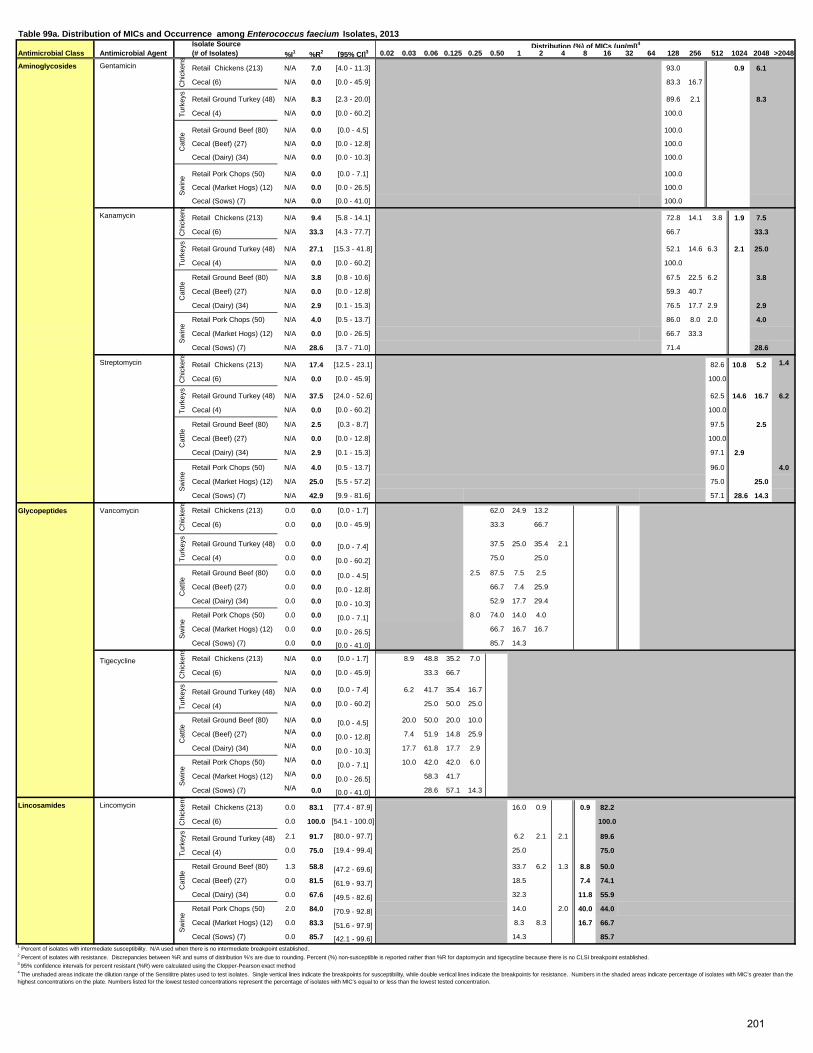
Isolate SourceAntimicrobial Class Antimicrobial Agent (# of Isolates) %I1 %R2 [95% CI]3 0.02 0.03 0.06 0.125 0.25 0.50 1 2 4 8 16 32 64 128 256 512 1024 2048 >2048
Aminoglycosides Gentamicin Retail Chickens (213) N/A 7.0 [4.0 - 11.3] 93.0 0.9 6.1
Cecal (6) N/A 0.0 [0.0 - 45.9] 83.3 16.7
Retail Ground Turkey (48) N/A 8.3 [2.3 - 20.0] 89.6 2.1 8.3
Cecal (4) N/A 0.0 [0.0 - 60.2] 100.0
Retail Ground Beef (80) N/A 0.0 [0.0 - 4.5] 100.0
Cecal (Beef) (27) N/A 0.0 [0.0 - 12.8] 100.0
Cecal (Dairy) (34) N/A 0.0 [0.0 - 10.3] 100.0
Retail Pork Chops (50) N/A 0.0 [0.0 - 7.1] 100.0
Cecal (Market Hogs) (12) N/A 0.0 [0.0 - 26.5] 100.0
Cecal (Sows) (7) N/A 0.0 [0.0 - 41.0] 100.0
Kanamycin Retail Chickens (213) N/A 9.4 [5.8 - 14.1] 72.8 14.1 3.8 1.9 7.5
Cecal (6) N/A 33.3 [4.3 - 77.7] 66.7 33.3
Retail Ground Turkey (48) N/A 27.1 [15.3 - 41.8] 52.1 14.6 6.3 2.1 25.0
Cecal (4) N/A 0.0 [0.0 - 60.2] 100.0
Retail Ground Beef (80) N/A 3.8 [0.8 - 10.6] 67.5 22.5 6.2 3.8
Cecal (Beef) (27) N/A 0.0 [0.0 - 12.8] 59.3 40.7
Cecal (Dairy) (34) N/A 2.9 [0.1 - 15.3] 76.5 17.7 2.9 2.9
Retail Pork Chops (50) N/A 4.0 [0.5 - 13.7] 86.0 8.0 2.0 4.0
Cecal (Market Hogs) (12) N/A 0.0 [0.0 - 26.5] 66.7 33.3
Cecal (Sows) (7) N/A 28.6 [3.7 - 71.0] 71.4 28.6
Streptomycin Retail Chickens (213) N/A 17.4 [12.5 - 23.1] 82.6 10.8 5.2 1.4
Cecal (6) N/A 0.0 [0.0 - 45.9] 100.0
Retail Ground Turkey (48) N/A 37.5 [24.0 - 52.6] 62.5 14.6 16.7 6.2
Cecal (4) N/A 0.0 [0.0 - 60.2] 100.0
Retail Ground Beef (80) N/A 2.5 [0.3 - 8.7] 97.5 2.5
Cecal (Beef) (27) N/A 0.0 [0.0 - 12.8] 100.0
Cecal (Dairy) (34) N/A 2.9 [0.1 - 15.3] 97.1 2.9
Retail Pork Chops (50) N/A 4.0 [0.5 - 13.7] 96.0 4.0
Cecal (Market Hogs) (12) N/A 25.0 [5.5 - 57.2] 75.0 25.0
Cecal (Sows) (7) N/A 42.9 [9.9 - 81.6] 57.1 28.6 14.3
Glycopeptides Vancomycin Retail Chickens (213) 0.0 0.0 [0.0 - 1.7] 62.0 24.9 13.2
Cecal (6) 0.0 0.0 [0.0 - 45.9] 33.3 66.7
Retail Ground Turkey (48) 0.0 0.0 [0.0 - 7.4] 37.5 25.0 35.4 2.1
Cecal (4) 0.0 0.0 [0.0 - 60.2] 75.0 25.0
Retail Ground Beef (80) 0.0 0.0 [0.0 - 4.5] 2.5 87.5 7.5 2.5
Cecal (Beef) (27) 0.0 0.0 [0.0 - 12.8] 66.7 7.4 25.9
Cecal (Dairy) (34) 0.0 0.0 [0.0 - 10.3] 52.9 17.7 29.4
Retail Pork Chops (50) 0.0 0.0 [0.0 - 7.1] 8.0 74.0 14.0 4.0
Cecal (Market Hogs) (12) 0.0 0.0 [0.0 - 26.5] 66.7 16.7 16.7
Cecal (Sows) (7) 0.0 0.0 [0.0 - 41.0] 85.7 14.3
Tigecycline Retail Chickens (213) N/A 0.0 [0.0 - 1.7] 8.9 48.8 35.2 7.0
Cecal (6) N/A 0.0 [0.0 - 45.9] 33.3 66.7
Retail Ground Turkey (48) N/A 0.0 [0.0 - 7.4] 6.2 41.7 35.4 16.7
Cecal (4) N/A 0.0 [0.0 - 60.2] 25.0 50.0 25.0
Retail Ground Beef (80) N/A 0.0 [0.0 - 4.5] 20.0 50.0 20.0 10.0
Cecal (Beef) (27) N/A 0.0 [0.0 - 12.8] 7.4 51.9 14.8 25.9
Cecal (Dairy) (34) N/A 0.0 [0.0 - 10.3] 17.7 61.8 17.7 2.9
Retail Pork Chops (50) N/A 0.0 [0.0 - 7.1] 10.0 42.0 42.0 6.0
Cecal (Market Hogs) (12) N/A 0.0 [0.0 - 26.5] 58.3 41.7
Cecal (Sows) (7) N/A 0.0 [0.0 - 41.0] 28.6 57.1 14.3
Lincosamides Lincomycin Retail Chickens (213) 0.0 83.1 [77.4 - 87.9] 16.0 0.9 0.9 82.2
Cecal (6) 0.0 100.0 [54.1 - 100.0] 100.0
Retail Ground Turkey (48) 2.1 91.7 [80.0 - 97.7] 6.2 2.1 2.1 89.6
Cecal (4) 0.0 75.0 [19.4 - 99.4] 25.0 75.0
Retail Ground Beef (80) 1.3 58.8 [47.2 - 69.6] 33.7 6.2 1.3 8.8 50.0
Cecal (Beef) (27) 0.0 81.5 [61.9 - 93.7] 18.5 7.4 74.1
Cecal (Dairy) (34) 0.0 67.6 [49.5 - 82.6] 32.3 11.8 55.9
Retail Pork Chops (50) 2.0 84.0 [70.9 - 92.8] 14.0 2.0 40.0 44.0
Cecal (Market Hogs) (12) 0.0 83.3 [51.6 - 97.9] 8.3 8.3 16.7 66.7
Cecal (Sows) (7) 0.0 85.7 [42.1 - 99.6] 14.3 85.7
Sw
ine
Cat
tleS
win
eC
attle
Sw
ine
Cat
tleTu
rkey
sS
win
e
Table 99a. Distribution of MICs and Occurrence among Enterococcus faecium Isolates, 2013Distribution (%) of MICs (µg/ml)4
Chi
cken
sTu
rkey
sC
hick
ens
Turk
eys
Sw
ine
Cat
tleC
attle
Chi
cken
sTu
rkey
sC
hick
ens
Turk
eys
Chi
cken
sC
hick
ens
Turk
eys
Cat
tleS
win
e
1 Percent of isolates with intermediate susceptibility. N/A used when there is no intermediate breakpoint established. 2 Percent of isolates with resistance. Discrepancies between %R and sums of distribution %'s are due to rounding. Percent (%) non-susceptible is reported rather than %R for daptomycin and tigecycline because there is no CLSI breakpoint established.3 95% confidence intervals for percent resistant (%R) were calculated using the Clopper-Pearson exact method4 The unshaded areas indicate the dilution range of the Sensititre plates used to test isolates. Single vertical lines indicate the breakpoints for susceptibility, while double vertical lines indicate the breakpoints for resistance. Numbers in the shaded areas indicate percentage of isolates with MIC's greater than the highest concentrations on the plate. Numbers listed for the lowest tested concentrations represent the percentage of isolates with MIC's equal to or less than the lowest tested concentration.
201
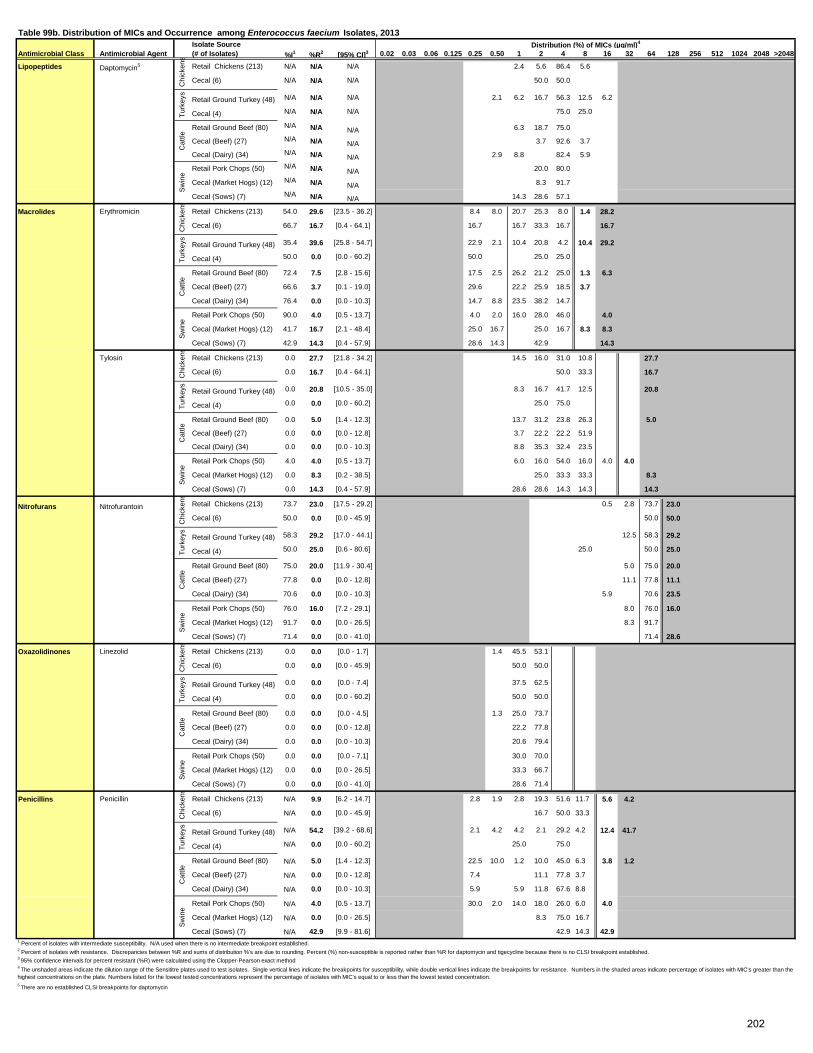
Isolate SourceAntimicrobial Class Antimicrobial Agent (# of Isolates) %I1 %R2 [95% CI]3 0.02 0.03 0.06 0.125 0.25 0.50 1 2 4 8 16 32 64 128 256 512 1024 2048 >2048
Lipopeptides Daptomycin5 Retail Chickens (213) N/A N/A N/A 2.4 5.6 86.4 5.6
Cecal (6) N/A N/A N/A 50.0 50.0
Retail Ground Turkey (48) N/A N/A N/A 2.1 6.2 16.7 56.3 12.5 6.2
Cecal (4) N/A N/A N/A 75.0 25.0
Retail Ground Beef (80) N/A N/A N/A 6.3 18.7 75.0
Cecal (Beef) (27) N/A N/A N/A 3.7 92.6 3.7
Cecal (Dairy) (34) N/A N/A N/A 2.9 8.8 82.4 5.9
Retail Pork Chops (50) N/A N/A N/A 20.0 80.0
Cecal (Market Hogs) (12) N/A N/A N/A 8.3 91.7
Cecal (Sows) (7) N/A N/A N/A 14.3 28.6 57.1
Macrolides Erythromicin Retail Chickens (213) 54.0 29.6 [23.5 - 36.2] 8.4 8.0 20.7 25.3 8.0 1.4 28.2
Cecal (6) 66.7 16.7 [0.4 - 64.1] 16.7 16.7 33.3 16.7 16.7
Retail Ground Turkey (48) 35.4 39.6 [25.8 - 54.7] 22.9 2.1 10.4 20.8 4.2 10.4 29.2
Cecal (4) 50.0 0.0 [0.0 - 60.2] 50.0 25.0 25.0
Retail Ground Beef (80) 72.4 7.5 [2.8 - 15.6] 17.5 2.5 26.2 21.2 25.0 1.3 6.3
Cecal (Beef) (27) 66.6 3.7 [0.1 - 19.0] 29.6 22.2 25.9 18.5 3.7
Cecal (Dairy) (34) 76.4 0.0 [0.0 - 10.3] 14.7 8.8 23.5 38.2 14.7
Retail Pork Chops (50) 90.0 4.0 [0.5 - 13.7] 4.0 2.0 16.0 28.0 46.0 4.0
Cecal (Market Hogs) (12) 41.7 16.7 [2.1 - 48.4] 25.0 16.7 25.0 16.7 8.3 8.3
Cecal (Sows) (7) 42.9 14.3 [0.4 - 57.9] 28.6 14.3 42.9 14.3
Tylosin Retail Chickens (213) 0.0 27.7 [21.8 - 34.2] 14.5 16.0 31.0 10.8 27.7
Cecal (6) 0.0 16.7 [0.4 - 64.1] 50.0 33.3 16.7
Retail Ground Turkey (48) 0.0 20.8 [10.5 - 35.0] 8.3 16.7 41.7 12.5 20.8
Cecal (4) 0.0 0.0 [0.0 - 60.2] 25.0 75.0
Retail Ground Beef (80) 0.0 5.0 [1.4 - 12.3] 13.7 31.2 23.8 26.3 5.0
Cecal (Beef) (27) 0.0 0.0 [0.0 - 12.8] 3.7 22.2 22.2 51.9
Cecal (Dairy) (34) 0.0 0.0 [0.0 - 10.3] 8.8 35.3 32.4 23.5
Retail Pork Chops (50) 4.0 4.0 [0.5 - 13.7] 6.0 16.0 54.0 16.0 4.0 4.0
Cecal (Market Hogs) (12) 0.0 8.3 [0.2 - 38.5] 25.0 33.3 33.3 8.3
Cecal (Sows) (7) 0.0 14.3 [0.4 - 57.9] 28.6 28.6 14.3 14.3 14.3
Nitrofurans Nitrofurantoin Retail Chickens (213) 73.7 23.0 [17.5 - 29.2] 0.5 2.8 73.7 23.0
Cecal (6) 50.0 0.0 [0.0 - 45.9] 50.0 50.0
Retail Ground Turkey (48) 58.3 29.2 [17.0 - 44.1] 12.5 58.3 29.2
Cecal (4) 50.0 25.0 [0.6 - 80.6] 25.0 50.0 25.0
Retail Ground Beef (80) 75.0 20.0 [11.9 - 30.4] 5.0 75.0 20.0
Cecal (Beef) (27) 77.8 0.0 [0.0 - 12.8] 11.1 77.8 11.1
Cecal (Dairy) (34) 70.6 0.0 [0.0 - 10.3] 5.9 70.6 23.5
Retail Pork Chops (50) 76.0 16.0 [7.2 - 29.1] 8.0 76.0 16.0
Cecal (Market Hogs) (12) 91.7 0.0 [0.0 - 26.5] 8.3 91.7
Cecal (Sows) (7) 71.4 0.0 [0.0 - 41.0] 71.4 28.6
Oxazolidinones Linezolid Retail Chickens (213) 0.0 0.0 [0.0 - 1.7] 1.4 45.5 53.1
Cecal (6) 0.0 0.0 [0.0 - 45.9] 50.0 50.0
Retail Ground Turkey (48) 0.0 0.0 [0.0 - 7.4] 37.5 62.5
Cecal (4) 0.0 0.0 [0.0 - 60.2] 50.0 50.0
Retail Ground Beef (80) 0.0 0.0 [0.0 - 4.5] 1.3 25.0 73.7
Cecal (Beef) (27) 0.0 0.0 [0.0 - 12.8] 22.2 77.8
Cecal (Dairy) (34) 0.0 0.0 [0.0 - 10.3] 20.6 79.4
Retail Pork Chops (50) 0.0 0.0 [0.0 - 7.1] 30.0 70.0
Cecal (Market Hogs) (12) 0.0 0.0 [0.0 - 26.5] 33.3 66.7
Cecal (Sows) (7) 0.0 0.0 [0.0 - 41.0] 28.6 71.4
Penicillins Penicillin Retail Chickens (213) N/A 9.9 [6.2 - 14.7] 2.8 1.9 2.8 19.3 51.6 11.7 5.6 4.2
Cecal (6) N/A 0.0 [0.0 - 45.9] 16.7 50.0 33.3
Retail Ground Turkey (48) N/A 54.2 [39.2 - 68.6] 2.1 4.2 4.2 2.1 29.2 4.2 12.4 41.7
Cecal (4) N/A 0.0 [0.0 - 60.2] 25.0 75.0
Retail Ground Beef (80) N/A 5.0 [1.4 - 12.3] 22.5 10.0 1.2 10.0 45.0 6.3 3.8 1.2
Cecal (Beef) (27) N/A 0.0 [0.0 - 12.8] 7.4 11.1 77.8 3.7
Cecal (Dairy) (34) N/A 0.0 [0.0 - 10.3] 5.9 5.9 11.8 67.6 8.8
Retail Pork Chops (50) N/A 4.0 [0.5 - 13.7] 30.0 2.0 14.0 18.0 26.0 6.0 4.0
Cecal (Market Hogs) (12) N/A 0.0 [0.0 - 26.5] 8.3 75.0 16.7
Cecal (Sows) (7) N/A 42.9 [9.9 - 81.6] 42.9 14.3 42.9
5 There are no established CLSI breakpoints for daptomycin
2 Percent of isolates with resistance. Discrepancies between %R and sums of distribution %'s are due to rounding. Percent (%) non-susceptible is reported rather than %R for daptomycin and tigecycline because there is no CLSI breakpoint established.3 95% confidence intervals for percent resistant (%R) were calculated using the Clopper-Pearson exact method4 The unshaded areas indicate the dilution range of the Sensititre plates used to test isolates. Single vertical lines indicate the breakpoints for susceptibility, while double vertical lines indicate the breakpoints for resistance. Numbers in the shaded areas indicate percentage of isolates with MIC's greater than the highest concentrations on the plate. Numbers listed for the lowest tested concentrations represent the percentage of isolates with MIC's equal to or less than the lowest tested concentration.
Chi
cken
s
1 Percent of isolates with intermediate susceptibility. N/A used when there is no intermediate breakpoint established.
Cat
tleS
win
eC
attle
Sw
ine
Cat
tleS
win
eTu
rkey
sC
hick
ens
Turk
eys
Chi
cken
sTu
rkey
sC
attle
Sw
ine
Cat
tleS
win
eTu
rkey
sC
hick
ens
Turk
eys
Chi
cken
sTu
rkey
sC
hick
ens
Table 99b. Distribution of MICs and Occurrence among Enterococcus faecium Isolates, 2013Distribution (%) of MICs (µg/ml)4
Cat
tleS
win
e
202
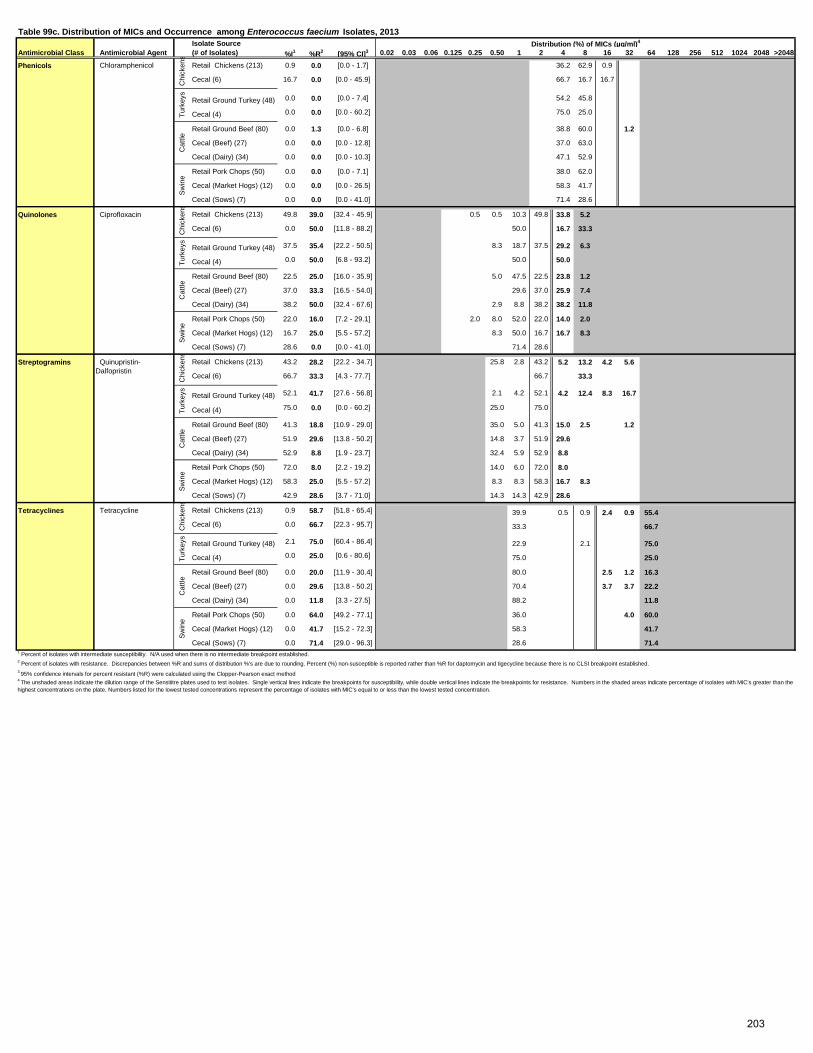
Isolate SourceAntimicrobial Class Antimicrobial Agent (# of Isolates) %I1 %R2 [95% CI]3 0.02 0.03 0.06 0.125 0.25 0.50 1 2 4 8 16 32 64 128 256 512 1024 2048 >2048
Phenicols Chloramphenicol Retail Chickens (213) 0.9 0.0 [0.0 - 1.7] 36.2 62.9 0.9
Cecal (6) 16.7 0.0 [0.0 - 45.9] 66.7 16.7 16.7
Retail Ground Turkey (48) 0.0 0.0 [0.0 - 7.4] 54.2 45.8
Cecal (4) 0.0 0.0 [0.0 - 60.2] 75.0 25.0
Retail Ground Beef (80) 0.0 1.3 [0.0 - 6.8] 38.8 60.0 1.2
Cecal (Beef) (27) 0.0 0.0 [0.0 - 12.8] 37.0 63.0
Cecal (Dairy) (34) 0.0 0.0 [0.0 - 10.3] 47.1 52.9
Retail Pork Chops (50) 0.0 0.0 [0.0 - 7.1] 38.0 62.0
Cecal (Market Hogs) (12) 0.0 0.0 [0.0 - 26.5] 58.3 41.7
Cecal (Sows) (7) 0.0 0.0 [0.0 - 41.0] 71.4 28.6
Quinolones Ciprofloxacin Retail Chickens (213) 49.8 39.0 [32.4 - 45.9] 0.5 0.5 10.3 49.8 33.8 5.2
Cecal (6) 0.0 50.0 [11.8 - 88.2] 50.0 16.7 33.3
Retail Ground Turkey (48) 37.5 35.4 [22.2 - 50.5] 8.3 18.7 37.5 29.2 6.3
Cecal (4) 0.0 50.0 [6.8 - 93.2] 50.0 50.0
Retail Ground Beef (80) 22.5 25.0 [16.0 - 35.9] 5.0 47.5 22.5 23.8 1.2
Cecal (Beef) (27) 37.0 33.3 [16.5 - 54.0] 29.6 37.0 25.9 7.4
Cecal (Dairy) (34) 38.2 50.0 [32.4 - 67.6] 2.9 8.8 38.2 38.2 11.8
Retail Pork Chops (50) 22.0 16.0 [7.2 - 29.1] 2.0 8.0 52.0 22.0 14.0 2.0
Cecal (Market Hogs) (12) 16.7 25.0 [5.5 - 57.2] 8.3 50.0 16.7 16.7 8.3
Cecal (Sows) (7) 28.6 0.0 [0.0 - 41.0] 71.4 28.6
Streptogramins Retail Chickens (213) 43.2 28.2 [22.2 - 34.7] 25.8 2.8 43.2 5.2 13.2 4.2 5.6
Cecal (6) 66.7 33.3 [4.3 - 77.7] 66.7 33.3
Retail Ground Turkey (48) 52.1 41.7 [27.6 - 56.8] 2.1 4.2 52.1 4.2 12.4 8.3 16.7
Cecal (4) 75.0 0.0 [0.0 - 60.2] 25.0 75.0
Retail Ground Beef (80) 41.3 18.8 [10.9 - 29.0] 35.0 5.0 41.3 15.0 2.5 1.2
Cecal (Beef) (27) 51.9 29.6 [13.8 - 50.2] 14.8 3.7 51.9 29.6
Cecal (Dairy) (34) 52.9 8.8 [1.9 - 23.7] 32.4 5.9 52.9 8.8
Retail Pork Chops (50) 72.0 8.0 [2.2 - 19.2] 14.0 6.0 72.0 8.0
Cecal (Market Hogs) (12) 58.3 25.0 [5.5 - 57.2] 8.3 8.3 58.3 16.7 8.3
Cecal (Sows) (7) 42.9 28.6 [3.7 - 71.0] 14.3 14.3 42.9 28.6
Tetracyclines Tetracycline Retail Chickens (213) 0.9 58.7 [51.8 - 65.4] 39.9 0.5 0.9 2.4 0.9 55.4Cecal (6) 0.0 66.7 [22.3 - 95.7] 33.3 66.7
Retail Ground Turkey (48) 2.1 75.0 [60.4 - 86.4] 22.9 2.1 75.0
Cecal (4) 0.0 25.0 [0.6 - 80.6] 75.0 25.0
Retail Ground Beef (80) 0.0 20.0 [11.9 - 30.4] 80.0 2.5 1.2 16.3
Cecal (Beef) (27) 0.0 29.6 [13.8 - 50.2] 70.4 3.7 3.7 22.2
Cecal (Dairy) (34) 0.0 11.8 [3.3 - 27.5] 88.2 11.8
Retail Pork Chops (50) 0.0 64.0 [49.2 - 77.1] 36.0 4.0 60.0
Cecal (Market Hogs) (12) 0.0 41.7 [15.2 - 72.3] 58.3 41.7
Cecal (Sows) (7) 0.0 71.4 [29.0 - 96.3] 28.6 71.4
Quinupristin-Dalfopristin
3 95% confidence intervals for percent resistant (%R) were calculated using the Clopper-Pearson exact method4 The unshaded areas indicate the dilution range of the Sensititre plates used to test isolates. Single vertical lines indicate the breakpoints for susceptibility, while double vertical lines indicate the breakpoints for resistance. Numbers in the shaded areas indicate percentage of isolates with MIC's greater than the highest concentrations on the plate. Numbers listed for the lowest tested concentrations represent the percentage of isolates with MIC's equal to or less than the lowest tested concentration.
Cat
tleS
win
e
1 Percent of isolates with intermediate susceptibility. N/A used when there is no intermediate breakpoint established. 2 Percent of isolates with resistance. Discrepancies between %R and sums of distribution %'s are due to rounding. Percent (%) non-susceptible is reported rather than %R for daptomycin and tigecycline because there is no CLSI breakpoint established.
Chi
cken
sTu
rkey
sS
win
eC
attle
Turk
eys
Table 99c. Distribution of MICs and Occurrence among Enterococcus faecium Isolates, 2013Distribution (%) of MICs (µg/ml)4
Chi
cken
sTu
rkey
sC
hick
ens
Turk
eys
Chi
cken
sC
attle
Sw
ine
Cat
tleS
win
e
203

Year 2002 2003 2004 2005 2006 2007 2008 2009 2010 2011 2012 2013
Retail Chickens 231 248 348 307 315 189 163 202 197 221 235 213
HACCP1 377 564 670 477 349 191 185 285 128 Cecal 6
Retail Ground Turkey 89 118 172 107 139 65 70 66 45 40 73 48 Cecal 4
Retail Ground Beef 93 112 162 129 125 69 73 59 61 82 91 80 Cecal (Beef) 27 Cecal (Dairy) 34
Retail Pork Chops 93 97 75 75 70 33 35 26 32 37 52 50 Cecal (Market Hogs) 12 Cecal (Sows) 7
Antimicrobial Class
Antimicrobial (Resistance Breakpoint)
Isolate Source
Aminoglycosides Gentamicin 3.0% 5.6% 4.3% 6.2% 6.0% 9.5% 11.7% 6.9% 6.1% 9.5% 6.8% 7.0% (MIC >500 µg/ml) 7 14 15 19 19 18 19 14 12 21 16 15
14.9% 12.1% 13.4% 11.9% 13.5% 15.7% 16.8% 14.7% 14.1%56 68 90 57 47 30 31 42 18
0.0%0
15.7% 12.7% 13.4% 12.1% 15.1% 1.5% 10.0% 18.2% 6.7% 10.0% 13.7% 8.3%14 15 23 12 21 1 7 12 3 4 10 4
0.0%0
1.1% 0.0% 0.0% 0.8% 0.0% 0.0% 0.0% 1.7% 0.0% 0.0% 0.0% 0.0%1 0 0 1 0 0 0 1 0 0 0 0
0.0%0
0.0%0
1.1% 0.0% 0.0% 0.0% 1.4% 0.0% 0.0% 0.0% 0.0% 0.0% 0.0% 0.0%1 0 0 0 1 0 0 0 0 0 0 0
0.0%0
0.0%0
Kanamycin 6.5% 10.5% 9.5% 10.7% 6.3% 12.2% 11.7% 9.9% 5.6% 9.5% 8.0% 9.4% (MIC ≥ 1024 µg/ml) 15 26 33 33 20 23 19 20 11 21 19 20
19.1% 15.1% 18.5% 15.7% 15.2% 26.7% 15.7% 15.8% 21.1%72 85 124 75 53 51 29 45 27
33.3%2
39.3% 28.0% 35.5% 29.9% 33.8% 7.7% 12.9% 33.3% 15.6% 25.0% 26.0% 27.1%35 33 61 32 47 5 9 22 7 10 19 13
0.0%0
4.3% 8.0% 8.6% 3.9% 1.6% 0.0% 5.5% 6.8% 8.2% 6.1% 5.5% 3.8%4 9 14 5 2 0 4 4 5 5 5 3
0.0%0
2.9%1
3.2% 2.1% 2.7% 8.0% 2.9% 3.0% 5.7% 0.0% 3.1% 5.4% 0.0% 4.0%3 2 2 6 2 1 2 0 1 2 0 2
0.0%0
28.6%2
Streptomycin 16.9% 16.9% 8.3% 14.0% 3.8% 3.7% 6.7% 30.2% 26.4% 27.2% 17.9% 17.4% (MIC ≥ 1000 µg/ml) 39 42 29 43 12 7 11 61 52 60 42 37
14.6% 17.6% 23.3% 11.5% 9.2% 15.2% 21.6% 26.0% 23.4%55 99 156 55 32 29 40 74 30
0.0%0
39.3% 32.2% 34.3% 34.6% 22.3% 16.9% 17.1% 51.5% 29.9% 55.0% 48.0% 37.5%35 38 59 37 31 11 12 34 13 22 35 18
0.0%0
3.2% 2.7% 5.6% 1.6% 0.8% 0.0% 2.7% 8.5% 3.3% 6.1% 3.3% 2.5%3 3 9 2 1 0 2 5 2 5 3 2
0.0%0
2.9%1
5.4% 3.1% 6.7% 6.7% 2.9% 0.0% 0.0% 3.8% 3.1% 5.4% 0.0% 4.0%5 3 5 5 2 0 0 1 1 2 0 2
25.0%3
42.9%3
Glycopeptides Vancomycin 0.0% 0.0% 0.0% 0.0% 0.0% 0.0% 0.0% 0.0% 0.0% 0.0% 0.0% 0.0% (MIC ≥ 32 µg/ml) 0 0 0 0 0 0 0 0 0 0 0 0
0.0% 0.0% 0.0% 0.0% 0.0% 0.0% 0.0% 0.0% 0.0%0 0 0 0 0 0 0 0 0
0.0%0
0.0% 0.0% 0.0% 0.0% 0.0% 0.0% 0.0% 0.0% 0.0% 0.0% 0.0% 0.0%0 0 0 0 0 0 0 0 0 0 0 0
0.0%0
0.0% 0.0% 0.0% 0.0% 0.0% 0.0% 0.0% 0.0% 0.0% 0.0% 0.0% 0.0%0 0 0 0 0 0 0 0 0 0 0 0
0.0%0
0.0%0
0.0% 0.0% 0.0% 0.0% 0.0% 0.0% 0.0% 0.0% 0.0% 0.0% 0.0% 0.0%0 0 0 0 0 0 0 0 0 0 0 0
0.0%0
0.0%0
1 In 2012 and 2013, chicken carcass rinsates were not sampled for Enterococcus
Cat
tle
Retail Ground Beef
Cecal (Beef)
Cecal (Dairy)
Swin
e
Retail Pork Chops
Cecal (Market Hogs)
Cecal (Sows)
Chi
cken
s
Retail Chickens
HACCP
Cecal
Turk
eys Retail Ground Turkey
Cecal
Cat
tle
Retail Ground Beef
Cecal (Beef)
Cecal (Dairy)
Swin
e
Retail Pork Chops
Cecal (Market Hogs)
Cecal (Sows)
Chi
cken
s
Retail Chickens
HACCP
Cecal
Turk
eys Retail Ground Turkey
Cecal
Cat
tle
Retail Ground Beef
Cecal (Beef)
Cecal (Dairy)
Swin
e
Retail Pork Chops
Cecal (Market Hogs)
Cecal (Sows)
Chi
cken
s
Retail Chickens
HACCP
Cecal
Turk
eys Retail Ground Turkey
Cecal
Cat
tle
Retail Ground Beef
Cecal (Beef)
Cecal (Dairy)
Swin
e
Retail Pork Chops
Cecal (Market Hogs)
Cecal (Sows)
Swin
eC
hick
ens
Retail Chickens
HACCP
CecalTu
rkey
s Retail Ground Turkey
Cecal
Resistance by Year
Table 100a. Antimicrobial Resistance among Enterococcus faecium Isolates, 2002-2013
Number of Isolates Tested
Chi
cken
sTu
rkey
sC
attle
204

Year 2002 2003 2004 2005 2006 2007 2008 2009 2010 2011 2012 2013
Retail Chickens 231 248 348 307 315 189 163 202 197 221 235 213
HACCP1 0 377 564 670 477 349 191 185 285 128 Cecal 6
Retail Ground Turkey 89 118 172 107 139 65 70 66 45 40 73 48 Cecal 4
Retail Ground Beef 93 112 162 129 125 69 73 59 61 82 91 80 Cecal (Beef) 27 Cecal (Dairy) 34
Retail Pork Chops 93 97 75 75 70 33 35 26 32 37 52 50 Cecal (Market Hogs) 12 Cecal (Sows) 7
Antimicrobial Class
Antimicrobial (Resistance Breakpoint)
Isolate Source
Glycylcycline Tigecycline 0.0% 0.0% 0.0% 1.8% 0.0% 0.0% 0.0% 0.0% 0.0% (MIC ≥ 0.25 µg/ml)2 0 0 0 3 0 0 0 0 0
0.0% 0.9% 0.0% 0.0% 0.0% 0.0%0 3 0 0 0 0
0.0%0
0.0% 0.0% 0.0% 2.9% 0.0% 0.0% 0.0% 0.0% 0.0%0 0 0 2 0 0 0 0 0
0.0%0
0.0% 0.0% 0.0% 0.0% 0.0% 0.0% 0.0% 0.0% 0.0%0 0 0 0 0 0 0 0 0
0.0%0
0.0%0
0.0% 0.0% 0.0% 2.9% 0.0% 0.0% 0.0% 0.0% 0.0%0 0 0 1 0 0 0 0 0
0.0%0
0.0%0
Lincosamides Lincomycin 87.0% 86.7% 83.3% 78.2% 74.9% 84.1% 81.0% 83.2% 82.2% 81.9% 78.7% 83.1% (MIC ≥ 8 µg/ml) 201 215 290 240 236 159 132 168 162 181 185 177
93.6% 84.9% 87.2% 84.9% 86.0% 89.5% 89.2% 87.7% 93.0%353 479 584 405 300 171 165 250 119
100.0%6
94.4% 89.0% 88.4% 92.5% 97.8% 92.3% 91.4% 93.9% 86.7% 87.5% 83.6% 91.7%84 105 152 99 136 60 64 62 39 35 61 44
75.0%3
76.3% 58.9% 67.9% 74.4% 41.6% 56.5% 75.3% 79.7% 73.8% 79.3% 72.5% 58.8%71 66 110 96 52 39 55 47 45 65 66 47
81.5%22
67.6%23
90.3% 89.7% 84.0% 88.0% 64.3% 66.7% 54.3% 84.6% 78.1% 73.0% 90.4% 84.0%84 87 63 66 45 22 19 22 25 27 47 42
83.3%10
85.7%6
Lipopeptides Daptomycin3
Macrolides Erythromycin 25.5% 17.3% 12.6% 13.7% 9.5% 19.6% 22.1% 19.8% 13.7% 21.7% 21.3% 29.6% (MIC ≥ 8 µg/ml) 59 43 44 42 30 37 36 40 27 48 50 63
28.6% 23.6% 27.8% 29.4% 28.9% 28.8% 29.7% 21.4% 24.2%108 133 186 140 101 55 55 61 31
16.7%1
50.6% 44.1% 43.0% 41.1% 44.6% 23.1% 37.1% 56.1% 33.3% 32.5% 27.4% 39.6%45 52 74 44 62 15 26 37 15 13 20 19
0.0%0
11.8% 8.9% 9.3% 4.7% 7.2% 4.3% 13.7% 5.1% 6.6% 6.1% 3.3% 7.5%11 10 15 6 9 3 10 3 4 5 3 6
3.7%1
0.0%0
20.4% 6.2% 5.3% 9.3% 7.1% 3.0% 14.3% 3.8% 9.4% 1.8% 1.9% 4.0%19 6 4 7 5 1 5 1 3 4 1 2
16.7%2
14.3%1
1 In 2012 and 2013, chicken carcass rinsates were not sampled for Enterococcus2 Percent non-susceptible is reported rather than percent resistance as no CLSI breakpoint has been established. NARMS breakpoint established to determine resistance.3 Resistance data are not presented because there are no established CLSI breakpoints for daptomycin
- - - - - - - - -
- - - - - - - - -
- - - - - - - - -
-
-
-
-
-
-
-
-
-
-
- - - - - - - -
- - - - - - - - -
Cat
tle
Retail Ground Beef
Cecal (Beef)
Cecal (Dairy)
Swin
e
Retail Pork Chops
Cecal (Market Hogs)
Cecal (Sows)
Chi
cken
s
Retail Chickens
HACCP
Cecal
Turk
eys Retail Ground Turkey
Cecal
Cat
tle
Retail Ground Beef
Cecal (Beef)
Cecal (Dairy)
Swin
e
Retail Pork Chops
Cecal (Market Hogs)
Cecal (Sows)
Chi
cken
s
Retail Chickens
HACCP
Cecal
Turk
eys Retail Ground Turkey
Cecal
Cat
tle
Retail Ground Beef
Cecal (Beef)
Cecal (Dairy)
Swin
e
Retail Pork Chops
Cecal (Market Hogs)
Cecal (Sows)
Chi
cken
s
Retail Chickens
HACCP
Cecal
Turk
eys Retail Ground Turkey
Cecal
Cat
tle
Retail Ground Beef
Cecal (Beef)
Cecal (Dairy)
Swin
e
Retail Pork Chops
Cecal (Market Hogs)
Cecal (Sows)
Chi
cken
s
Retail Chickens
HACCP
Cecal
Turk
eys Retail Ground Turkey
Cecal
Table 100b. Antimicrobial Resistance among Enterococcus faecium Isolates, 2002-2013
Number of Isolates Tested
Chi
cken
sTu
rkey
sC
attle
Swin
e
205

Year 2002 2003 2004 2005 2006 2007 2008 2009 2010 2011 2012 2013
Retail Chickens 231 248 348 307 315 189 163 202 197 221 235 213
HACCP1 0 377 564 670 477 349 191 185 285 128 Cecal 6
Retail Ground Turkey 89 118 172 107 139 65 70 66 45 40 73 48 Cecal 4
Retail Ground Beef 93 112 162 129 125 69 73 59 61 82 91 80 Cecal (Beef) 27 Cecal (Dairy) 34
Retail Pork Chops 93 97 75 75 70 33 35 26 32 37 52 50 Cecal (Market Hogs) 12 Cecal (Sows) 7
Antimicrobial Class
Antimicrobial (Resistance Breakpoint)
Isolate Source
Macrolides Tylosin 21.2% 12.5% 10.3% 12.4% 7.9% 19.0% 20.2% 19.3% 12.2% 20.4% 20.9% 27.7% (MIC ≥ 32 µg/ml) 49 31 36 38 25 36 33 39 24 45 49 59
26.3% 17.7% 23.9% 26.6% 20.9% 28.3% 24.9% 17.5% 21.9%99 100 160 127 73 54 46 50 28
16.7%1
36.0% 27.1% 35.5% 29.9% 36.0% 13.8% 12.9% 24.2% 15.6% 22.5% 17.8% 20.8%32 32 61 32 50 9 9 16 7 9 13 10
0.0%0
6.5% 0.9% 5.6% 2.3% 4.8% 2.9% 4.1% 3.4% 3.3% 3.7% 2.2% 5.0%6 1 9 3 6 2 3 2 2 3 2 4
0.0%0
0.0%0
9.7% 2.1% 0.0% 5.3% 5.7% 3.0% 5.7% 0.0% 3.1% 5.4% 0.0% 4.0%9 2 0 4 4 1 2 0 1 2 0 2
8.3%1
14.3%1
Nitrofurans Nitrofurantoin 54.5% 64.5% 85.3% 54.7% 38.4% 32.8% 46.0% 51.5% 40.1% 41.6% 36.6% 23.0% (MIC ≥ 128 µg/ml) 126 160 297 168 121 62 75 104 79 92 86 49
52.0% 59.2% 54.6% 52.2% 50.4% 57.6% 51.9% 49.5% 44.5%196 334 366 249 176 110 96 141 57
0.0%0
50.6% 52.5% 66.9% 43.0% 22.3% 12.3% 27.1% 40.9% 22.2% 40.0% 39.7% 29.2%45 62 115 46 31 8 19 27 10 16 29 14
0.0%0
18.3% 36.6% 51.9% 18.6% 12.8% 4.3% 20.5% 16.9% 6.6% 28.1% 22.0% 20.0%17 41 84 24 16 3 15 10 4 23 20 16
0.0%0
0.0%0
5.4% 16.5% 37.3% 10.7% 4.3% 9.1% 8.6% 11.5% 6.3% 18.9% 5.8% 16.0%5 16 28 8 3 3 3 3 2 7 3 8
0.0%0
0.0%0
Oxazolidinones Linezolid 0.0% 0.0% 0.0% 0.3% 0.0% 0.0% 0.0% 0.0% 0.0% 0.0% 0.0% 0.0% (MIC ≥ 8 µg/ml) 0 0 0 1 0 0 0 0 0 0 0 0
0.0% 0.0% 0.0% 0.0% 0.0% 0.0% 0.0% 0.0% 0.0%0 0 0 0 0 0 0 0 0
0.0%0
0.0% 0.0% 0.0% 0.0% 0.0% 0.0% 0.0% 0.0% 0.0% 0.0% 0.0% 0.0%0 0 0 0 0 0 0 0 0 0 0 0
0.0%0
0.0% 0.0% 0.0% 0.0% 0.0% 0.0% 0.0% 0.0% 0.0% 0.0% 0.0% 0.0%0 0 0 0 0 0 0 0 0 0 0 0
0.0%0
0.0%0
0.0% 0.0% 0.0% 0.0% 0.0% 0.0% 0.0% 0.0% 0.0% 0.0% 0.0% 0.0%0 0 0 0 0 0 0 0 0 0 0 0
0.0%0
0.0%0
Penicillins Penicillin 44.2% 51.2% 39.1% 31.9% 22.2% 12.2% 27.6% 23.3% 24.4% 18.6% 11.9% 9.9% (MIC ≥ 16 µg/ml) 102 127 136 98 70 23 45 47 48 41 28 21
42.2% 31.9% 35.2% 29.4% 35.0% 37.2% 34.6% 25.6% 24.2%159 180 236 140 122 71 64 73 31
0.0%0
66.3% 65.3% 61.6% 59.8% 67.6% 60.0% 61.4% 69.7% 48.9% 75.0% 68.5% 54.2%59 77 106 64 94 39 43 46 22 30 50 26
0.0%0
0.0% 8.0% 3.1% 2.3% 4.8% 1.4% 9.6% 6.8% 3.3% 3.7% 3.3% 5.0%0 9 5 3 6 1 7 4 2 3 3 4
0.0%0
0.0%0
3.2% 1.0% 8.0% 1.3% 1.4% 0.0% 0.0% 7.7% 6.3% 2.7% 0.0% 4.0%3 1 6 1 1 0 0 2 2 1 0 2
0.0%0
42.9%3
1 In 2012 and 2013, chicken carcass rinsates were not sampled for Enterococcus
Cat
tle
Retail Ground Beef
Cecal (Beef)
Cecal (Dairy)
Swin
e
Retail Pork Chops
Cecal (Market Hogs)
Cecal (Sows)
Chi
cken
s
Retail Chickens
HACCP
Cecal
Turk
eys Retail Ground Turkey
Cecal
Cat
tle
Retail Ground Beef
Cecal (Beef)
Cecal (Dairy)
Swin
e
Retail Pork Chops
Cecal (Market Hogs)
Cecal (Sows)
Chi
cken
s
Retail Chickens
HACCP
Cecal
Turk
eys Retail Ground Turkey
Cecal
Cat
tle
Retail Ground Beef
Cecal (Beef)
Cecal (Dairy)
Swin
e
Retail Pork Chops
Cecal (Market Hogs)
Cecal (Sows)
Chi
cken
s
Retail Chickens
HACCP
Cecal
Turk
eys Retail Ground Turkey
Cecal
Cat
tle
Retail Ground Beef
Cecal (Beef)
Cecal (Dairy)
Swin
e
Retail Pork Chops
Cecal (Market Hogs)
Cecal (Sows)
Chi
cken
s
Retail Chickens
HACCP
Cecal
Turk
eys Retail Ground Turkey
Cecal
Table 100c. Antimicrobial Resistance among Enterococcus faecium Isolates, 2002-2013
Number of Isolates Tested
Chi
cken
sTu
rkey
sC
attle
Swin
e
206

Year 2002 2003 2004 2005 2006 2007 2008 2009 2010 2011 2012 2013
Retail Chickens 231 248 348 307 315 189 163 202 197 221 235 213
HACCP1 0 377 564 670 477 349 191 185 285 128 Cecal 6
Retail Ground Turkey 89 118 172 107 139 65 70 66 45 40 73 48 Cecal 4
Retail Ground Beef 93 112 162 129 125 69 73 59 61 82 91 80 Cecal (Beef) 27 Cecal (Dairy) 34
Retail Pork Chops 93 97 75 75 70 33 35 26 32 37 52 50 Cecal (Market Hogs) 12 Cecal (Sows) 7
Antimicrobial Class
Antimicrobial (Resistance Breakpoint)
Isolate Source
Phenicols Chloramphenicol 0.0% 0.0% 0.0% 0.0% 0.0% 0.0% 0.6% 0.0% 0.0% 0.0% 0.0% 0.0% (MIC ≥ 32 µg/ml) 0 0 0 0 0 0 1 0 0 0 0 0
0.0% 0.0% 0.0% 0.4% 0.3% 0.5% 0.0% 0.0% 0.0%0 0 0 2 1 1 0 0 0
0.0%0
0.0% 0.0% 0.0% 0.0% 0.0% 0.0% 0.0% 0.0% 0.0% 0.0% 1.4% 0.0%0 0 0 0 0 0 0 0 0 0 1 0
0.0%0
1.1% 0.0% 1.2% 0.0% 0.0% 0.0% 1.4% 0.0% 1.6% 0.0% 1.1% 1.3%1 0 2 0 0 0 1 0 1 0 1 1
0.0%0
0.0%0
0.0% 0.0% 0.0% 0.0% 0.0% 0.0% 0.0% 0.0% 0.0% 2.7% 0.0% 0.0%0 0 0 0 0 0 0 0 0 1 0 0
0.0%0
0.0%0
Quinolones Ciprofloxacin 13.0% 21.8% 52.3% 33.9% 37.5% 19.6% 43.6% 34.2% 32.5% 33.5% 39.6% 39.0% (MIC ≥ 4 µg/ml) 30 54 182 104 118 37 71 69 64 74 93 83
24.7% 38.1% 32.1% 29.6% 30.1% 44.5% 42.7% 36.8% 46.1%93 215 215 141 105 85 79 105 59
50.0%3
22.5% 39.0% 53.5% 43.9% 37.4% 35.4% 54.3% 40.9% 42.2% 57.5% 54.8% 35.4%20 46 92 47 52 23 38 27 19 23 40 17
50.0%2
12.9% 33.0% 27.2% 20.9% 21.6% 10.1% 26.0% 18.6% 14.8% 17.1% 12.1% 25.0%12 37 44 27 27 7 19 11 9 14 11 20
33.3%9
50.0%17
4.3% 6.2% 17.3% 9.3% 4.3% 9.1% 14.3% 7.7% 12.5% 10.8% 3.9% 16.0%4 6 13 7 3 3 5 2 4 4 2 8
25.0%3
0.0%0
Streptogramins Quinupristin-Dalfopristin 55.4% 59.7% 31.6% 39.1% 36.5% 57.1% 54.6% 50.0% 28.9% 32.1% 37.5% 28.2% (MIC ≥ 4 µg/ml) 128 148 110 120 115 108 89 101 57 71 88 60
49.3% 41.8% 43.9% 56.8% 40.4% 47.6% 59.5% 44.9% 64.1%186 236 294 271 141 91 110 128 82
33.3%2
82.0% 79.7% 64.5% 63.6% 75.5% 76.9% 68.6% 69.7% 57.8% 55.0% 64.4% 41.7%73 94 111 68 105 50 48 46 26 22 47 20
0.0%0
47.3% 50.0% 6.2% 7.8% 6.4% 5.8% 16.4% 18.6% 0.0% 11.0% 26.4% 18.8%44 56 10 10 8 4 12 11 0 9 24 15
29.6%8
8.8%3
24.7% 64.9% 6.7% 13.3% 10.0% 3.0% 5.7% 19.2% 3.1% 13.5% 23.1% 8.0%23 63 5 10 7 1 2 5 1 5 12 4
25.0%3
28.6%2
Tetracyclines Tetracycline 56.7% 51.6% 45.1% 54.4% 53.0% 66.1% 64.4% 56.9% 35.5% 43.4% 55.7% 58.7% (MIC ≥ 16 µg/ml) 131 128 157 167 167 125 105 115 70 96 131 125
51.2% 54.8% 57.8% 68.8% 63.0% 67.5% 69.2% 62.8% 73.4%193 309 387 328 220 129 128 179 94
66.7%4
88.8% 91.5% 86.6% 91.6% 92.8% 96.9% 81.4% 92.4% 71.1% 82.5% 78.1% 75.0%79 108 149 98 129 63 57 61 32 33 57 36
25.0%1
22.6% 28.6% 24.7% 28.7% 20.0% 18.8% 28.8% 39.0% 27.9% 22.0% 23.1% 20.0%21 32 40 37 25 13 21 23 17 18 21 16
29.6%8
11.8%4
68.8% 69.1% 72.0% 56.0% 54.3% 33.3% 45.7% 50.0% 50.0% 48.7% 30.8% 64.0%64 67 54 42 38 11 16 13 16 18 16 32
41.7%5
71.4%5
1 In 2012 and 2013, chicken carcass rinsates were not sampled for Enterococcus
Cat
tle
Retail Ground Beef
Cecal (Beef)
Cecal (Dairy)
Swin
e
Retail Pork Chops
Cecal (Market Hogs)
Cecal (Sows)
Chi
cken
s
Retail Chickens
HACCP
Cecal
Turk
eys Retail Ground Turkey
Cecal
Cat
tle
Retail Ground Beef
Cecal (Beef)
Cecal (Dairy)
Swin
e
Retail Pork Chops
Cecal (Market Hogs)
Cecal (Sows)
Chi
cken
s
Retail Chickens
HACCP
Cecal
Turk
eys Retail Ground Turkey
Cecal
Cat
tle
Retail Ground Beef
Cecal (Beef)
Cecal (Dairy)
Swin
e
Retail Pork Chops
Cecal (Market Hogs)
Cecal (Sows)
Chi
cken
s
Retail Chickens
HACCP
Cecal
Turk
eys Retail Ground Turkey
Cecal
Cat
tle
Retail Ground Beef
Cecal (Beef)
Cecal (Dairy)
Swin
e
Retail Pork Chops
Cecal (Market Hogs)
Cecal (Sows)
Chi
cken
s
Retail Chickens
HACCP
Cecal
Turk
eys Retail Ground Turkey
Cecal
Table 100d. Antimicrobial Resistance among Enterococcus faecium Isolates, 2002-2013
Number of Isolates Tested
Chi
cken
sTu
rkey
sC
attle
Swin
e
207
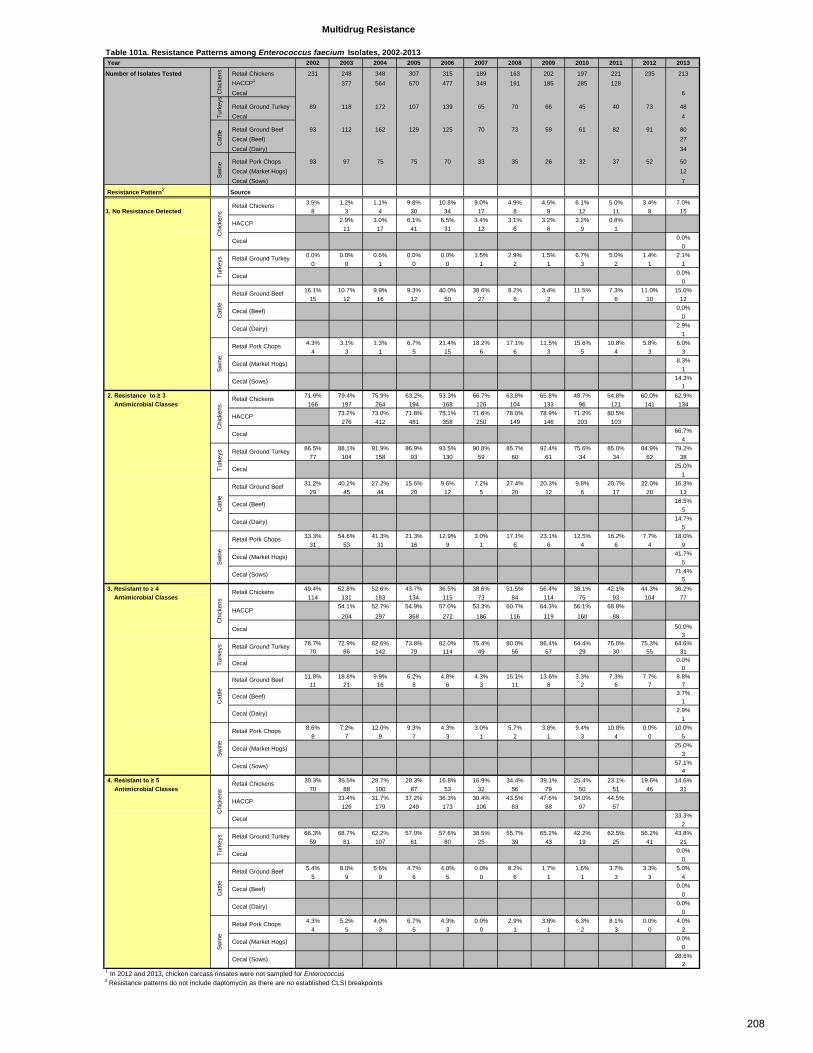
Year 2002 2003 2004 2005 2006 2007 2008 2009 2010 2011 2012 2013
Number of Isolates Tested Retail Chickens 231 248 348 307 315 189 163 202 197 221 235 213 HACCP1 377 564 670 477 349 191 185 285 128 Cecal 6
Retail Ground Turkey 89 118 172 107 139 65 70 66 45 40 73 48 Cecal 4
Retail Ground Beef 93 112 162 129 125 70 73 59 61 82 91 80 Cecal (Beef) 27 Cecal (Dairy) 34
Retail Pork Chops 93 97 75 75 70 33 35 26 32 37 52 50 Cecal (Market Hogs) 12 Cecal (Sows) 7
Resistance Pattern2 Source3.5% 1.2% 1.1% 9.8% 10.8% 9.0% 4.9% 4.5% 6.1% 5.0% 3.4% 7.0%
1. No Resistance Detected 8 3 4 30 34 17 8 9 12 11 8 152.9% 3.0% 6.1% 6.5% 3.4% 3.1% 3.2% 3.2% 0.8%
11 17 41 31 12 6 6 9 10.0%
00.0% 0.0% 0.6% 0.0% 0.0% 1.5% 2.9% 1.5% 6.7% 5.0% 1.4% 2.1%
0 0 1 0 0 1 2 1 3 2 1 10.0%
016.1% 10.7% 9.9% 9.3% 40.0% 38.6% 8.2% 3.4% 11.5% 7.3% 11.0% 15.0%
15 12 16 12 50 27 6 2 7 6 10 120.0%
02.9%
14.3% 3.1% 1.3% 6.7% 21.4% 18.2% 17.1% 11.5% 15.6% 10.8% 5.8% 6.0%
4 3 1 5 15 6 6 3 5 4 3 38.3%
114.3%
1 2. Resistance to ≥ 3 71.9% 79.4% 75.9% 63.2% 53.3% 66.7% 63.8% 65.8% 48.7% 54.8% 60.0% 62.9% Antimicrobial Classes 166 197 264 194 168 126 104 133 96 121 141 134
73.2% 73.0% 71.8% 75.1% 71.6% 78.0% 78.9% 71.2% 80.5%276 412 481 358 250 149 146 203 103
66.7%4
86.5% 88.1% 91.9% 86.9% 93.5% 90.8% 85.7% 92.4% 75.6% 85.0% 84.9% 79.2%77 104 158 93 130 59 60 61 34 34 62 38
25.0%1
31.2% 40.2% 27.2% 15.5% 9.6% 7.2% 27.4% 20.3% 9.8% 20.7% 22.0% 16.3%29 45 44 20 12 5 20 12 6 17 20 13
18.5%5
14.7%5
33.3% 54.6% 41.3% 21.3% 12.9% 3.0% 17.1% 23.1% 12.5% 16.2% 7.7% 18.0%31 53 31 16 9 1 6 6 4 6 4 9
41.7%5
71.4%5
3. Resistant to ≥ 4 49.4% 52.8% 52.6% 43.7% 36.5% 38.6% 51.5% 56.4% 38.1% 42.1% 44.3% 36.2% Antimicrobial Classes 114 131 183 134 115 73 84 114 75 93 104 77
54.1% 52.7% 54.9% 57.0% 53.3% 60.7% 64.3% 56.1% 68.8%
204 297 368 272 186 116 119 160 88
50.0%3
78.7% 72.9% 82.6% 73.8% 82.0% 75.4% 80.0% 86.4% 64.4% 75.0% 75.3% 64.6%70 86 142 79 114 49 56 57 29 30 55 31
0.0%0
11.8% 18.8% 9.9% 6.2% 4.8% 4.3% 15.1% 13.6% 3.3% 7.3% 7.7% 8.8%11 21 16 8 6 3 11 8 2 6 7 7
3.7%1
2.9%1
8.6% 7.2% 12.0% 9.3% 4.3% 3.0% 5.7% 3.8% 9.4% 10.8% 0.0% 10.0%8 7 9 7 3 1 2 1 3 4 0 5
25.0%3
57.1%4
4. Resistant to ≥ 5 30.3% 35.5% 28.7% 28.3% 16.8% 16.9% 34.4% 39.1% 25.4% 23.1% 19.6% 14.6% Antimicrobial Classes 70 88 100 87 53 32 56 79 50 51 46 31
33.4% 31.7% 37.2% 36.3% 30.4% 43.5% 47.6% 34.0% 44.5%126 179 249 173 106 83 88 97 57
33.3%2
66.3% 68.7% 62.2% 57.0% 57.6% 38.5% 55.7% 65.2% 42.2% 62.5% 56.2% 43.8%59 81 107 61 80 25 39 43 19 25 41 21
0.0%0
5.4% 8.0% 5.6% 4.7% 4.0% 0.0% 8.2% 1.7% 1.6% 3.7% 3.3% 5.0%5 9 9 6 5 0 6 1 1 3 3 4
0.0%0
0.0%0
4.3% 5.2% 4.0% 6.7% 4.3% 0.0% 2.9% 3.8% 6.3% 8.1% 0.0% 4.0%4 5 3 5 3 0 1 1 2 3 0 2
0.0%0
28.6%2
1 In 2012 and 2013, chicken carcass rinsates were not sampled for Enterococcus2 Resistance patterns do not include daptomycin as there are no established CLSI breakpoints
Cat
tle
Retail Ground Beef
Cecal (Beef)
Cecal (Dairy)
Swin
e
Retail Pork Chops
Cecal (Market Hogs)
Cecal (Sows)
Chi
cken
s
Retail Chickens
HACCP
Cecal
Turk
eys Retail Ground Turkey
Cecal
Cat
tle
Retail Ground Beef
Cecal (Beef)
Cecal (Dairy)
Swin
e
Retail Pork Chops
Cecal (Market Hogs)
Cecal (Sows)
Chi
cken
s
Retail Chickens
HACCP
Cecal
Turk
eys Retail Ground Turkey
Cecal
Cat
tle
Retail Ground Beef
Cecal (Beef)
Cecal (Dairy)
Swin
e
Retail Pork Chops
Cecal (Market Hogs)
Cecal (Sows)
Chi
cken
s
Retail Chickens
HACCP
Cecal
Turk
eys Retail Ground Turkey
Cecal
Cat
tle
Retail Ground Beef
Cecal (Beef)
Cecal (Dairy)
Swin
e
Retail Pork Chops
Cecal (Market Hogs)
Cecal (Sows)
Chi
cken
s
Retail Chickens
HACCP
Cecal
Turk
eys Retail Ground Turkey
Cecal
Multidrug Resistance
Table 101a. Resistance Patterns among Enterococcus faecium Isolates, 2002-2013
Chi
cken
sTu
rkey
sC
attle
Swin
e
208
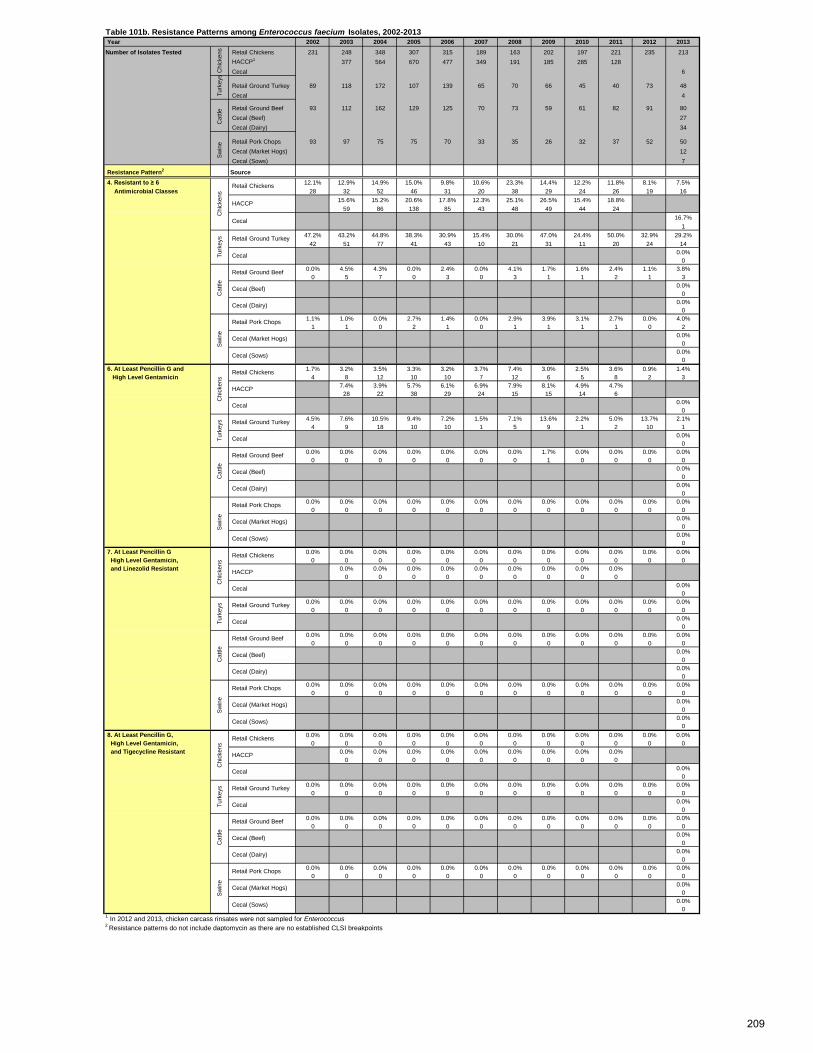
Year 2002 2003 2004 2005 2006 2007 2008 2009 2010 2011 2012 2013Number of Isolates Tested Retail Chickens 231 248 348 307 315 189 163 202 197 221 235 213
HACCP1 377 564 670 477 349 191 185 285 128 Cecal 6
Retail Ground Turkey 89 118 172 107 139 65 70 66 45 40 73 48 Cecal 4
Retail Ground Beef 93 112 162 129 125 70 73 59 61 82 91 80 Cecal (Beef) 27 Cecal (Dairy) 34
Retail Pork Chops 93 97 75 75 70 33 35 26 32 37 52 50 Cecal (Market Hogs) 12 Cecal (Sows) 7
Resistance Pattern2 Source 4. Resistant to ≥ 6 12.1% 12.9% 14.9% 15.0% 9.8% 10.6% 23.3% 14.4% 12.2% 11.8% 8.1% 7.5% Antimicrobial Classes 28 32 52 46 31 20 38 29 24 26 19 16
15.6% 15.2% 20.6% 17.8% 12.3% 25.1% 26.5% 15.4% 18.8%59 86 138 85 43 48 49 44 24
16.7%1
47.2% 43.2% 44.8% 38.3% 30.9% 15.4% 30.0% 47.0% 24.4% 50.0% 32.9% 29.2%42 51 77 41 43 10 21 31 11 20 24 14
0.0%0
0.0% 4.5% 4.3% 0.0% 2.4% 0.0% 4.1% 1.7% 1.6% 2.4% 1.1% 3.8%0 5 7 0 3 0 3 1 1 2 1 3
0.0%0
0.0%0
1.1% 1.0% 0.0% 2.7% 1.4% 0.0% 2.9% 3.9% 3.1% 2.7% 0.0% 4.0%1 1 0 2 1 0 1 1 1 1 0 2
0.0%0
0.0%0
6. At Least Pencillin G and 1.7% 3.2% 3.5% 3.3% 3.2% 3.7% 7.4% 3.0% 2.5% 3.6% 0.9% 1.4% High Level Gentamicin 4 8 12 10 10 7 12 6 5 8 2 3
7.4% 3.9% 5.7% 6.1% 6.9% 7.9% 8.1% 4.9% 4.7%28 22 38 29 24 15 15 14 6
0.0%0
4.5% 7.6% 10.5% 9.4% 7.2% 1.5% 7.1% 13.6% 2.2% 5.0% 13.7% 2.1%4 9 18 10 10 1 5 9 1 2 10 1
0.0%0
0.0% 0.0% 0.0% 0.0% 0.0% 0.0% 0.0% 1.7% 0.0% 0.0% 0.0% 0.0%0 0 0 0 0 0 0 1 0 0 0 0
0.0%0
0.0%0
0.0% 0.0% 0.0% 0.0% 0.0% 0.0% 0.0% 0.0% 0.0% 0.0% 0.0% 0.0%0 0 0 0 0 0 0 0 0 0 0 0
0.0%0
0.0%0
7. At Least Pencillin G 0.0% 0.0% 0.0% 0.0% 0.0% 0.0% 0.0% 0.0% 0.0% 0.0% 0.0% 0.0% High Level Gentamicin, 0 0 0 0 0 0 0 0 0 0 0 0 and Linezolid Resistant 0.0% 0.0% 0.0% 0.0% 0.0% 0.0% 0.0% 0.0% 0.0%
0 0 0 0 0 0 0 0 00.0%
00.0% 0.0% 0.0% 0.0% 0.0% 0.0% 0.0% 0.0% 0.0% 0.0% 0.0% 0.0%
0 0 0 0 0 0 0 0 0 0 0 00.0%
00.0% 0.0% 0.0% 0.0% 0.0% 0.0% 0.0% 0.0% 0.0% 0.0% 0.0% 0.0%
0 0 0 0 0 0 0 0 0 0 0 00.0%
00.0%
00.0% 0.0% 0.0% 0.0% 0.0% 0.0% 0.0% 0.0% 0.0% 0.0% 0.0% 0.0%
0 0 0 0 0 0 0 0 0 0 0 00.0%
00.0%
0 8. At Least Pencillin G, 0.0% 0.0% 0.0% 0.0% 0.0% 0.0% 0.0% 0.0% 0.0% 0.0% 0.0% 0.0% High Level Gentamicin, 0 0 0 0 0 0 0 0 0 0 0 0 and Tigecycline Resistant 0.0% 0.0% 0.0% 0.0% 0.0% 0.0% 0.0% 0.0% 0.0%
0 0 0 0 0 0 0 0 00.0%
00.0% 0.0% 0.0% 0.0% 0.0% 0.0% 0.0% 0.0% 0.0% 0.0% 0.0% 0.0%
0 0 0 0 0 0 0 0 0 0 0 00.0%
00.0% 0.0% 0.0% 0.0% 0.0% 0.0% 0.0% 0.0% 0.0% 0.0% 0.0% 0.0%
0 0 0 0 0 0 0 0 0 0 0 00.0%
00.0%
00.0% 0.0% 0.0% 0.0% 0.0% 0.0% 0.0% 0.0% 0.0% 0.0% 0.0% 0.0%
0 0 0 0 0 0 0 0 0 0 0 00.0%
00.0%
01 In 2012 and 2013, chicken carcass rinsates were not sampled for Enterococcus2 Resistance patterns do not include daptomycin as there are no established CLSI breakpoints
Cat
tle
Retail Ground Beef
Cecal (Beef)
Cecal (Dairy)
Swin
e
Retail Pork Chops
Cecal (Market Hogs)
Cecal (Sows)
Chi
cken
s
Retail Chickens
HACCP
Cecal
Turk
eys Retail Ground Turkey
Cecal
Cat
tle
Retail Ground Beef
Cecal (Beef)
Cecal (Dairy)
Swin
e
Retail Pork Chops
Cecal (Market Hogs)
Cecal (Sows)
Chi
cken
s
Retail Chickens
HACCP
Cecal
Turk
eys Retail Ground Turkey
Cecal
Cat
tle
Retail Ground Beef
Cecal (Beef)
Cecal (Dairy)
Swin
e
Retail Pork Chops
Cecal (Market Hogs)
Cecal (Sows)
Chi
cken
s
Retail Chickens
HACCP
Cecal
Turk
eys Retail Ground Turkey
Cecal
Cat
tle
Retail Ground Beef
Cecal (Beef)
Cecal (Dairy)
Swin
e
Retail Pork Chops
Cecal (Market Hogs)
Cecal (Sows)
Chi
cken
s
Retail Chickens
HACCP
CecalTu
rkey
s Retail Ground Turkey
Cecal
Table 101b. Resistance Patterns among Enterococcus faecium Isolates, 2002-2013
Chi
cken
sC
attle
Swin
eTu
rkey
s
209
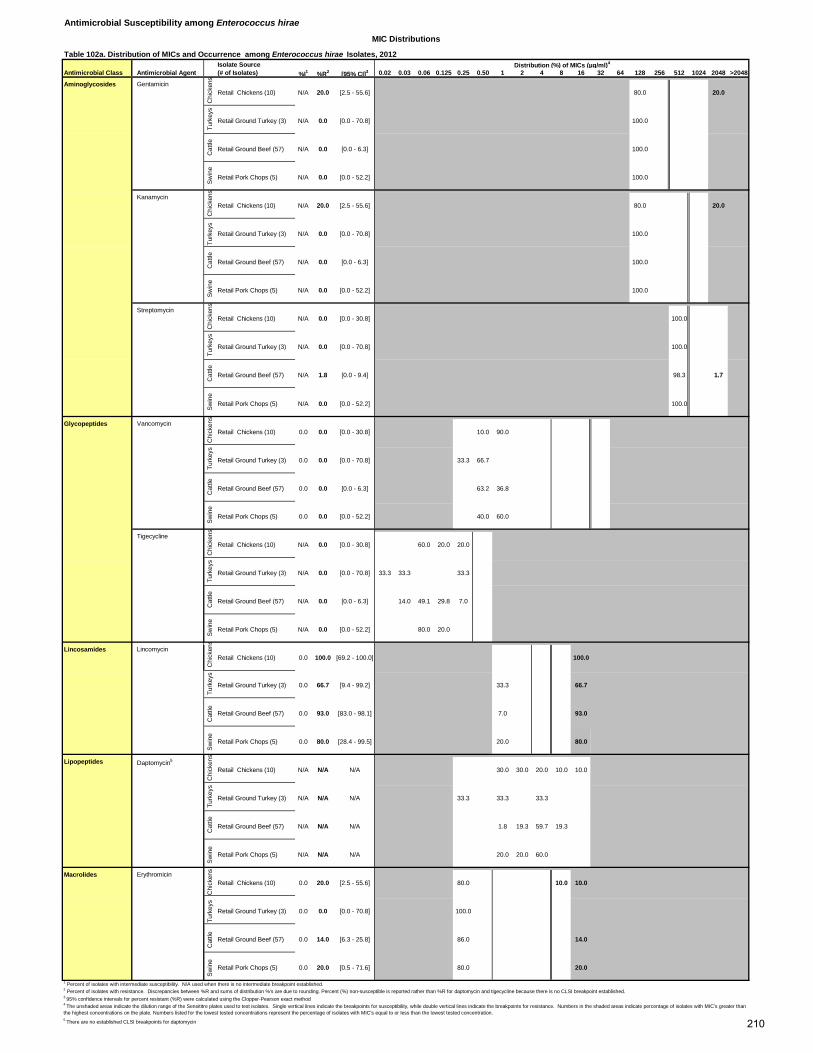
Antimicrobial Susceptibility among Enterococcus hirae
Isolate SourceAntimicrobial Class Antimicrobial Agent (# of Isolates) %I1 %R2 [95% CI]3 0.02 0.03 0.06 0.125 0.25 0.50 1 2 4 8 16 32 64 128 256 512 1024 2048 >2048
Aminoglycosides GentamicinRetail Chickens (10) N/A 20.0 [2.5 - 55.6] 80.0 20.0
Retail Ground Turkey (3) N/A 0.0 [0.0 - 70.8] 100.0
Retail Ground Beef (57) N/A 0.0 [0.0 - 6.3] 100.0
Retail Pork Chops (5) N/A 0.0 [0.0 - 52.2] 100.0
KanamycinRetail Chickens (10) N/A 20.0 [2.5 - 55.6] 80.0 20.0
Turk
eys
Retail Ground Turkey (3) N/A 0.0 [0.0 - 70.8] 100.0
Retail Ground Beef (57) N/A 0.0 [0.0 - 6.3] 100.0
Retail Pork Chops (5) N/A 0.0 [0.0 - 52.2] 100.0
StreptomycinRetail Chickens (10) N/A 0.0 [0.0 - 30.8] 100.0
Retail Ground Turkey (3) N/A 0.0 [0.0 - 70.8] 100.0
Retail Ground Beef (57) N/A 1.8 [0.0 - 9.4] 98.3 1.7
Retail Pork Chops (5) N/A 0.0 [0.0 - 52.2] 100.0
Glycopeptides VancomycinRetail Chickens (10) 0.0 0.0 [0.0 - 30.8] 10.0 90.0
Retail Ground Turkey (3) 0.0 0.0 [0.0 - 70.8] 33.3 66.7
Retail Ground Beef (57) 0.0 0.0 [0.0 - 6.3] 63.2 36.8
Retail Pork Chops (5) 0.0 0.0 [0.0 - 52.2] 40.0 60.0
TigecyclineRetail Chickens (10) N/A 0.0 [0.0 - 30.8] 60.0 20.0 20.0
Retail Ground Turkey (3) N/A 0.0 [0.0 - 70.8] 33.3 33.3 33.3
Retail Ground Beef (57) N/A 0.0 [0.0 - 6.3] 14.0 49.1 29.8 7.0
Retail Pork Chops (5) N/A 0.0 [0.0 - 52.2] 80.0 20.0
Lincosamides LincomycinRetail Chickens (10) 0.0 100.0 [69.2 - 100.0] 100.0
Retail Ground Turkey (3) 0.0 66.7 [9.4 - 99.2] 33.3 66.7
Cat
tle Retail Ground Beef (57) 0.0 93.0 [83.0 - 98.1] 7.0 93.0
Sw
ine
Retail Pork Chops (5) 0.0 80.0 [28.4 - 99.5] 20.0 80.0
Lipopeptides Daptomycin5
Retail Chickens (10) N/A N/A N/A 30.0 30.0 20.0 10.0 10.0
Retail Ground Turkey (3) N/A N/A N/A 33.3 33.3 33.3
Retail Ground Beef (57) N/A N/A N/A 1.8 19.3 59.7 19.3
Sw
ine
Retail Pork Chops (5) N/A N/A N/A 20.0 20.0 60.0
Macrolides Erythromicin
Chi
cken
s
Retail Chickens (10) 0.0 20.0 [2.5 - 55.6] 80.0 10.0 10.0
Turk
eys
Retail Ground Turkey (3) 0.0 0.0 [0.0 - 70.8] 100.0
Cat
tle Retail Ground Beef (57) 0.0 14.0 [6.3 - 25.8] 86.0 14.0
Sw
ine
Retail Pork Chops (5) 0.0 20.0 [0.5 - 71.6] 80.0 20.0
5 There are no established CLSI breakpoints for daptomycin
MIC Distributions
1 Percent of isolates with intermediate susceptibility. N/A used when there is no intermediate breakpoint established. 2 Percent of isolates with resistance. Discrepancies between %R and sums of distribution %'s are due to rounding. Percent (%) non-susceptible is reported rather than %R for daptomycin and tigecycline because there is no CLSI breakpoint established.
Table 102a. Distribution of MICs and Occurrence among Enterococcus hirae Isolates, 2012Distribution (%) of MICs (µg/ml)4
Chi
cken
sTu
rkey
sC
attle
Sw
ine
Chi
cken
sC
attle
Sw
ine
Sw
ine
Cat
tle
3 95% confidence intervals for percent resistant (%R) were calculated using the Clopper-Pearson exact method4 The unshaded areas indicate the dilution range of the Sensititre plates used to test isolates. Single vertical lines indicate the breakpoints for susceptibility, while double vertical lines indicate the breakpoints for resistance. Numbers in the shaded areas indicate percentage of isolates with MIC's greater than the highest concentrations on the plate. Numbers listed for the lowest tested concentrations represent the percentage of isolates with MIC's equal to or less than the lowest tested concentration.
Turk
eys
Chi
cken
sC
hick
ens
Turk
eys
Cat
tleS
win
eC
hick
ens
Turk
eys
Cat
tleS
win
eC
hick
ens
Turk
eys
Chi
cken
sTu
rkey
sC
attle
210
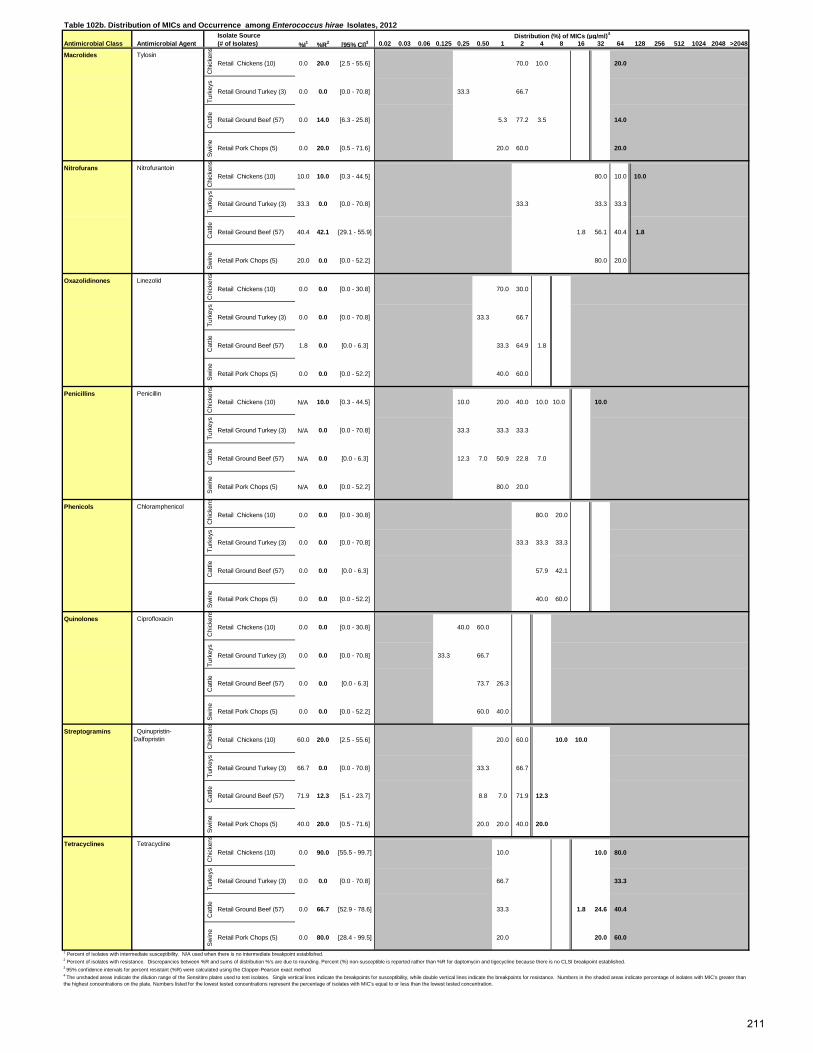
Isolate SourceAntimicrobial Class Antimicrobial Agent (# of Isolates) %I1 %R2 [95% CI]3 0.02 0.03 0.06 0.125 0.25 0.50 1 2 4 8 16 32 64 128 256 512 1024 2048 >2048
Macrolides TylosinRetail Chickens (10) 0.0 20.0 [2.5 - 55.6] 70.0 10.0 20.0
Turk
eys
Retail Ground Turkey (3) 0.0 0.0 [0.0 - 70.8] 33.3 66.7
Cat
tle Retail Ground Beef (57) 0.0 14.0 [6.3 - 25.8] 5.3 77.2 3.5 14.0
Sw
ine
Retail Pork Chops (5) 0.0 20.0 [0.5 - 71.6] 20.0 60.0 20.0
Nitrofurans NitrofurantoinRetail Chickens (10) 10.0 10.0 [0.3 - 44.5] 80.0 10.0 10.0
Retail Ground Turkey (3) 33.3 0.0 [0.0 - 70.8] 33.3 33.3 33.3
Retail Ground Beef (57) 40.4 42.1 [29.1 - 55.9] 1.8 56.1 40.4 1.8
Sw
ine
Retail Pork Chops (5) 20.0 0.0 [0.0 - 52.2] 80.0 20.0
Oxazolidinones LinezolidRetail Chickens (10) 0.0 0.0 [0.0 - 30.8] 70.0 30.0
Retail Ground Turkey (3) 0.0 0.0 [0.0 - 70.8] 33.3 66.7
Retail Ground Beef (57) 1.8 0.0 [0.0 - 6.3] 33.3 64.9 1.8
Retail Pork Chops (5) 0.0 0.0 [0.0 - 52.2] 40.0 60.0
Penicillins PenicillinRetail Chickens (10) N/A 10.0 [0.3 - 44.5] 10.0 20.0 40.0 10.0 10.0 10.0
Retail Ground Turkey (3) N/A 0.0 [0.0 - 70.8] 33.3 33.3 33.3
Retail Ground Beef (57) N/A 0.0 [0.0 - 6.3] 12.3 7.0 50.9 22.8 7.0
Retail Pork Chops (5) N/A 0.0 [0.0 - 52.2] 80.0 20.0
Phenicols ChloramphenicolRetail Chickens (10) 0.0 0.0 [0.0 - 30.8] 80.0 20.0
Retail Ground Turkey (3) 0.0 0.0 [0.0 - 70.8] 33.3 33.3 33.3
Retail Ground Beef (57) 0.0 0.0 [0.0 - 6.3] 57.9 42.1
Sw
ine
Retail Pork Chops (5) 0.0 0.0 [0.0 - 52.2] 40.0 60.0
Quinolones CiprofloxacinRetail Chickens (10) 0.0 0.0 [0.0 - 30.8] 40.0 60.0
Turk
eys
Retail Ground Turkey (3) 0.0 0.0 [0.0 - 70.8] 33.3 66.7
Cat
tle Retail Ground Beef (57) 0.0 0.0 [0.0 - 6.3] 73.7 26.3
Sw
ine
Retail Pork Chops (5) 0.0 0.0 [0.0 - 52.2] 60.0 40.0
Streptogramins Quinupristin-Dalfopristin Retail Chickens (10) 60.0 20.0 [2.5 - 55.6] 20.0 60.0 10.0 10.0
Retail Ground Turkey (3) 66.7 0.0 [0.0 - 70.8] 33.3 66.7
Retail Ground Beef (57) 71.9 12.3 [5.1 - 23.7] 8.8 7.0 71.9 12.3
Sw
ine
Retail Pork Chops (5) 40.0 20.0 [0.5 - 71.6] 20.0 20.0 40.0 20.0
Tetracyclines TetracyclineRetail Chickens (10) 0.0 90.0 [55.5 - 99.7] 10.0 10.0 80.0
Retail Ground Turkey (3) 0.0 0.0 [0.0 - 70.8] 66.7 33.3
Cat
tle Retail Ground Beef (57) 0.0 66.7 [52.9 - 78.6] 33.3 1.8 24.6 40.4
Sw
ine
Retail Pork Chops (5) 0.0 80.0 [28.4 - 99.5] 20.0 20.0 60.0
2 Percent of isolates with resistance. Discrepancies between %R and sums of distribution %'s are due to rounding. Percent (%) non-susceptible is reported rather than %R for daptomycin and tigecycline because there is no CLSI breakpoint established.3 95% confidence intervals for percent resistant (%R) were calculated using the Clopper-Pearson exact method4 The unshaded areas indicate the dilution range of the Sensititre plates used to test isolates. Single vertical lines indicate the breakpoints for susceptibility, while double vertical lines indicate the breakpoints for resistance. Numbers in the shaded areas indicate percentage of isolates with MIC's greater than the highest concentrations on the plate. Numbers listed for the lowest tested concentrations represent the percentage of isolates with MIC's equal to or less than the lowest tested concentration.
Table 102b. Distribution of MICs and Occurrence among Enterococcus hirae Isolates, 2012Distribution (%) of MICs (µg/ml)4
1 Percent of isolates with intermediate susceptibility. N/A used when there is no intermediate breakpoint established.
Chi
cken
sC
hick
ens
Turk
eys
Cat
tleC
hick
ens
Turk
eys
Cat
tleS
win
eTu
rkey
sC
hick
ens
Cat
tleS
win
eTu
rkey
sC
hick
ens
Turk
eys
Chi
cken
sC
attle
Chi
cken
sC
hick
ens
Turk
eys
Cat
tle
211
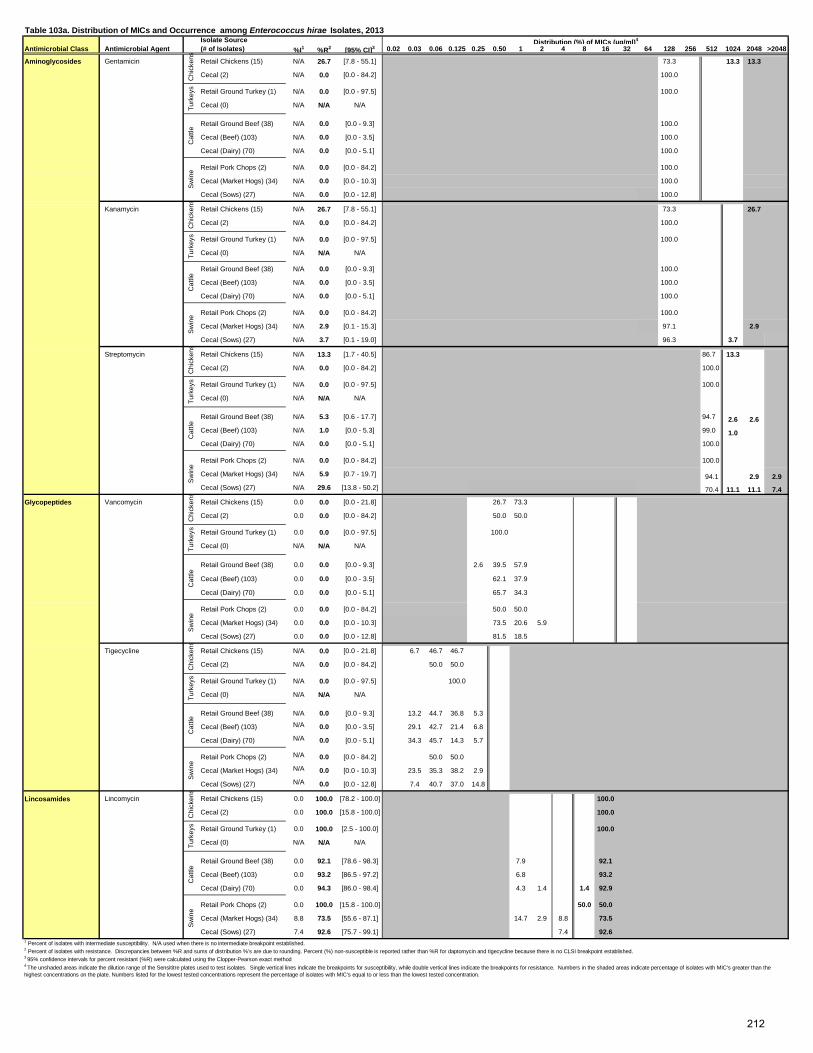
Isolate SourceAntimicrobial Class Antimicrobial Agent (# of Isolates) %I1 %R2 [95% CI]3 0.02 0.03 0.06 0.125 0.25 0.50 1 2 4 8 16 32 64 128 256 512 1024 2048 >2048
Aminoglycosides Gentamicin Retail Chickens (15) N/A 26.7 [7.8 - 55.1] 73.3 13.3 13.3
Cecal (2) N/A 0.0 [0.0 - 84.2] 100.0
Retail Ground Turkey (1) N/A 0.0 [0.0 - 97.5] 100.0
Cecal (0) N/A N/A N/A
Retail Ground Beef (38) N/A 0.0 [0.0 - 9.3] 100.0
Cecal (Beef) (103) N/A 0.0 [0.0 - 3.5] 100.0
Cecal (Dairy) (70) N/A 0.0 [0.0 - 5.1] 100.0
Retail Pork Chops (2) N/A 0.0 [0.0 - 84.2] 100.0
Cecal (Market Hogs) (34) N/A 0.0 [0.0 - 10.3] 100.0
Cecal (Sows) (27) N/A 0.0 [0.0 - 12.8] 100.0
Kanamycin Retail Chickens (15) N/A 26.7 [7.8 - 55.1] 73.3 26.7
Cecal (2) N/A 0.0 [0.0 - 84.2] 100.0
Retail Ground Turkey (1) N/A 0.0 [0.0 - 97.5] 100.0
Cecal (0) N/A N/A N/A
Retail Ground Beef (38) N/A 0.0 [0.0 - 9.3] 100.0
Cecal (Beef) (103) N/A 0.0 [0.0 - 3.5] 100.0
Cecal (Dairy) (70) N/A 0.0 [0.0 - 5.1] 100.0
Retail Pork Chops (2) N/A 0.0 [0.0 - 84.2] 100.0
Cecal (Market Hogs) (34) N/A 2.9 [0.1 - 15.3] 97.1 2.9
Cecal (Sows) (27) N/A 3.7 [0.1 - 19.0] 96.3 3.7
Streptomycin Retail Chickens (15) N/A 13.3 [1.7 - 40.5] 86.7 13.3
Cecal (2) N/A 0.0 [0.0 - 84.2] 100.0
Retail Ground Turkey (1) N/A 0.0 [0.0 - 97.5] 100.0
Cecal (0) N/A N/A N/A
Retail Ground Beef (38) N/A 5.3 [0.6 - 17.7] 94.7 2.6 2.6Cecal (Beef) (103) N/A 1.0 [0.0 - 5.3] 99.0 1.0Cecal (Dairy) (70) N/A 0.0 [0.0 - 5.1] 100.0
Retail Pork Chops (2) N/A 0.0 [0.0 - 84.2] 100.0
Cecal (Market Hogs) (34) N/A 5.9 [0.7 - 19.7] 94.1 2.9 2.9Cecal (Sows) (27) N/A 29.6 [13.8 - 50.2] 70.4 11.1 11.1 7.4
Glycopeptides Vancomycin Retail Chickens (15) 0.0 0.0 [0.0 - 21.8] 26.7 73.3
Cecal (2) 0.0 0.0 [0.0 - 84.2] 50.0 50.0
Retail Ground Turkey (1) 0.0 0.0 [0.0 - 97.5] 100.0
Cecal (0) N/A N/A N/A
Retail Ground Beef (38) 0.0 0.0 [0.0 - 9.3] 2.6 39.5 57.9
Cecal (Beef) (103) 0.0 0.0 [0.0 - 3.5] 62.1 37.9
Cecal (Dairy) (70) 0.0 0.0 [0.0 - 5.1] 65.7 34.3
Retail Pork Chops (2) 0.0 0.0 [0.0 - 84.2] 50.0 50.0
Cecal (Market Hogs) (34) 0.0 0.0 [0.0 - 10.3] 73.5 20.6 5.9
Cecal (Sows) (27) 0.0 0.0 [0.0 - 12.8] 81.5 18.5
Tigecycline Retail Chickens (15) N/A 0.0 [0.0 - 21.8] 6.7 46.7 46.7
Cecal (2) N/A 0.0 [0.0 - 84.2] 50.0 50.0
Retail Ground Turkey (1) N/A 0.0 [0.0 - 97.5] 100.0
Cecal (0) N/A N/A N/A
Retail Ground Beef (38) N/A 0.0 [0.0 - 9.3] 13.2 44.7 36.8 5.3
Cecal (Beef) (103) N/A 0.0 [0.0 - 3.5] 29.1 42.7 21.4 6.8
Cecal (Dairy) (70) N/A 0.0 [0.0 - 5.1] 34.3 45.7 14.3 5.7
Retail Pork Chops (2) N/A 0.0 [0.0 - 84.2] 50.0 50.0
Cecal (Market Hogs) (34) N/A 0.0 [0.0 - 10.3] 23.5 35.3 38.2 2.9
Cecal (Sows) (27) N/A 0.0 [0.0 - 12.8] 7.4 40.7 37.0 14.8
Lincosamides Lincomycin Retail Chickens (15) 0.0 100.0 [78.2 - 100.0] 100.0
Cecal (2) 0.0 100.0 [15.8 - 100.0] 100.0
Retail Ground Turkey (1) 0.0 100.0 [2.5 - 100.0] 100.0
Cecal (0) N/A N/A N/A
Retail Ground Beef (38) 0.0 92.1 [78.6 - 98.3] 7.9 92.1
Cecal (Beef) (103) 0.0 93.2 [86.5 - 97.2] 6.8 93.2
Cecal (Dairy) (70) 0.0 94.3 [86.0 - 98.4] 4.3 1.4 1.4 92.9
Retail Pork Chops (2) 0.0 100.0 [15.8 - 100.0] 50.0 50.0
Cecal (Market Hogs) (34) 8.8 73.5 [55.6 - 87.1] 14.7 2.9 8.8 73.5
Cecal (Sows) (27) 7.4 92.6 [75.7 - 99.1] 7.4 92.6
Chi
cken
sTu
rkey
sC
attle
Sw
ine
1 Percent of isolates with intermediate susceptibility. N/A used when there is no intermediate breakpoint established. 2 Percent of isolates with resistance. Discrepancies between %R and sums of distribution %'s are due to rounding. Percent (%) non-susceptible is reported rather than %R for daptomycin and tigecycline because there is no CLSI breakpoint established.3 95% confidence intervals for percent resistant (%R) were calculated using the Clopper-Pearson exact method4 The unshaded areas indicate the dilution range of the Sensititre plates used to test isolates. Single vertical lines indicate the breakpoints for susceptibility, while double vertical lines indicate the breakpoints for resistance. Numbers in the shaded areas indicate percentage of isolates with MIC's greater than the highest concentrations on the plate. Numbers listed for the lowest tested concentrations represent the percentage of isolates with MIC's equal to or less than the lowest tested concentration.
Sw
ine
Cat
tleS
win
eC
attle
Sw
ine
Turk
eys
Cat
tleC
hick
ens
Table 103a. Distribution of MICs and Occurrence among Enterococcus hirae Isolates, 2013Distribution (%) of MICs (µg/ml)4
Cat
tleC
hick
ens
Turk
eys
Chi
cken
sTu
rkey
sC
attle
Sw
ine
Sw
ine
Chi
cken
sTu
rkey
sC
hick
ens
Turk
eys
212
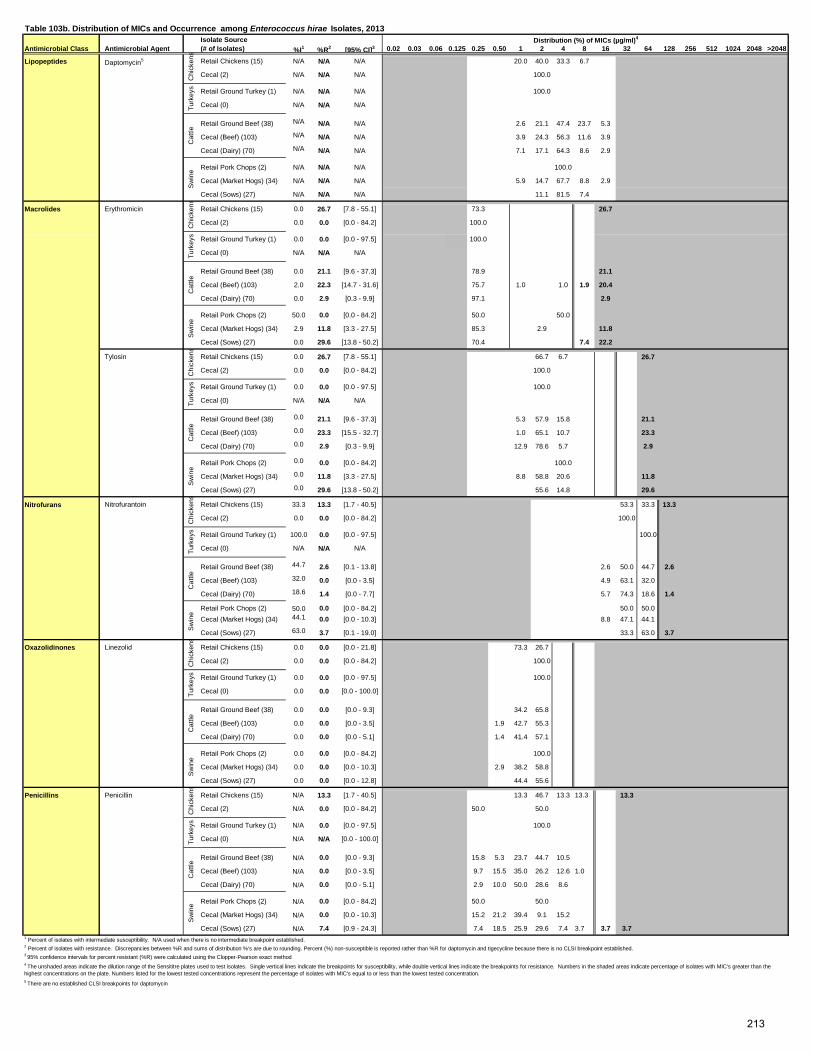
Isolate SourceAntimicrobial Class Antimicrobial Agent (# of Isolates) %I1 %R2 [95% CI]3 0.02 0.03 0.06 0.125 0.25 0.50 1 2 4 8 16 32 64 128 256 512 1024 2048 >2048
Lipopeptides Daptomycin5 Retail Chickens (15) N/A N/A N/A 20.0 40.0 33.3 6.7
Cecal (2) N/A N/A N/A 100.0
Retail Ground Turkey (1) N/A N/A N/A 100.0
Cecal (0) N/A N/A N/A
Retail Ground Beef (38) N/A N/A N/A 2.6 21.1 47.4 23.7 5.3
Cecal (Beef) (103) N/A N/A N/A 3.9 24.3 56.3 11.6 3.9
Cecal (Dairy) (70) N/A N/A N/A 7.1 17.1 64.3 8.6 2.9
Retail Pork Chops (2) N/A N/A N/A 100.0
Cecal (Market Hogs) (34) N/A N/A N/A 5.9 14.7 67.7 8.8 2.9
Cecal (Sows) (27) N/A N/A N/A 11.1 81.5 7.4
Macrolides Erythromicin Retail Chickens (15) 0.0 26.7 [7.8 - 55.1] 73.3 26.7
Cecal (2) 0.0 0.0 [0.0 - 84.2] 100.0
Retail Ground Turkey (1) 0.0 0.0 [0.0 - 97.5] 100.0
Cecal (0) N/A N/A N/A
Retail Ground Beef (38) 0.0 21.1 [9.6 - 37.3] 78.9 21.1
Cecal (Beef) (103) 2.0 22.3 [14.7 - 31.6] 75.7 1.0 1.0 1.9 20.4
Cecal (Dairy) (70) 0.0 2.9 [0.3 - 9.9] 97.1 2.9
Retail Pork Chops (2) 50.0 0.0 [0.0 - 84.2] 50.0 50.0
Cecal (Market Hogs) (34) 2.9 11.8 [3.3 - 27.5] 85.3 2.9 11.8
Cecal (Sows) (27) 0.0 29.6 [13.8 - 50.2] 70.4 7.4 22.2
Tylosin Retail Chickens (15) 0.0 26.7 [7.8 - 55.1] 66.7 6.7 26.7
Cecal (2) 0.0 0.0 [0.0 - 84.2] 100.0
Retail Ground Turkey (1) 0.0 0.0 [0.0 - 97.5] 100.0
Cecal (0) N/A N/A N/A
Retail Ground Beef (38) 0.0 21.1 [9.6 - 37.3] 5.3 57.9 15.8 21.1
Cecal (Beef) (103) 0.0 23.3 [15.5 - 32.7] 1.0 65.1 10.7 23.3
Cecal (Dairy) (70) 0.0 2.9 [0.3 - 9.9] 12.9 78.6 5.7 2.9
Retail Pork Chops (2) 0.0 0.0 [0.0 - 84.2] 100.0
Cecal (Market Hogs) (34) 0.0 11.8 [3.3 - 27.5] 8.8 58.8 20.6 11.8
Cecal (Sows) (27) 0.0 29.6 [13.8 - 50.2] 55.6 14.8 29.6
Nitrofurans Nitrofurantoin Retail Chickens (15) 33.3 13.3 [1.7 - 40.5] 53.3 33.3 13.3
Cecal (2) 0.0 0.0 [0.0 - 84.2] 100.0
Retail Ground Turkey (1) 100.0 0.0 [0.0 - 97.5] 100.0
Cecal (0) N/A N/A N/A
Retail Ground Beef (38) 44.7 2.6 [0.1 - 13.8] 2.6 50.0 44.7 2.6
Cecal (Beef) (103) 32.0 0.0 [0.0 - 3.5] 4.9 63.1 32.0
Cecal (Dairy) (70) 18.6 1.4 [0.0 - 7.7] 5.7 74.3 18.6 1.4
Retail Pork Chops (2) 50.0 0.0 [0.0 - 84.2] 50.0 50.0Cecal (Market Hogs) (34) 44.1 0.0 [0.0 - 10.3] 8.8 47.1 44.1
Cecal (Sows) (27) 63.0 3.7 [0.1 - 19.0] 33.3 63.0 3.7
Oxazolidinones Linezolid Retail Chickens (15) 0.0 0.0 [0.0 - 21.8] 73.3 26.7
Cecal (2) 0.0 0.0 [0.0 - 84.2] 100.0
Retail Ground Turkey (1) 0.0 0.0 [0.0 - 97.5] 100.0
Cecal (0) 0.0 0.0 [0.0 - 100.0]
Retail Ground Beef (38) 0.0 0.0 [0.0 - 9.3] 34.2 65.8
Cecal (Beef) (103) 0.0 0.0 [0.0 - 3.5] 1.9 42.7 55.3
Cecal (Dairy) (70) 0.0 0.0 [0.0 - 5.1] 1.4 41.4 57.1
Retail Pork Chops (2) 0.0 0.0 [0.0 - 84.2] 100.0
Cecal (Market Hogs) (34) 0.0 0.0 [0.0 - 10.3] 2.9 38.2 58.8
Cecal (Sows) (27) 0.0 0.0 [0.0 - 12.8] 44.4 55.6
Penicillins Penicillin Retail Chickens (15) N/A 13.3 [1.7 - 40.5] 13.3 46.7 13.3 13.3 13.3
Cecal (2) N/A 0.0 [0.0 - 84.2] 50.0 50.0
Retail Ground Turkey (1) N/A 0.0 [0.0 - 97.5] 100.0
Cecal (0) N/A N/A [0.0 - 100.0]
Retail Ground Beef (38) N/A 0.0 [0.0 - 9.3] 15.8 5.3 23.7 44.7 10.5
Cecal (Beef) (103) N/A 0.0 [0.0 - 3.5] 9.7 15.5 35.0 26.2 12.6 1.0
Cecal (Dairy) (70) N/A 0.0 [0.0 - 5.1] 2.9 10.0 50.0 28.6 8.6
Retail Pork Chops (2) N/A 0.0 [0.0 - 84.2] 50.0 50.0
Cecal (Market Hogs) (34) N/A 0.0 [0.0 - 10.3] 15.2 21.2 39.4 9.1 15.2
Cecal (Sows) (27) N/A 7.4 [0.9 - 24.3] 7.4 18.5 25.9 29.6 7.4 3.7 3.7 3.7
5 There are no established CLSI breakpoints for daptomycin
1 Percent of isolates with intermediate susceptibility. N/A used when there is no intermediate breakpoint established.
Cat
tleS
win
eC
attle
Turk
eys
Chi
cken
sTu
rkey
sC
hick
ens
Sw
ine
2 Percent of isolates with resistance. Discrepancies between %R and sums of distribution %'s are due to rounding. Percent (%) non-susceptible is reported rather than %R for daptomycin and tigecycline because there is no CLSI breakpoint established.3 95% confidence intervals for percent resistant (%R) were calculated using the Clopper-Pearson exact method4 The unshaded areas indicate the dilution range of the Sensititre plates used to test isolates. Single vertical lines indicate the breakpoints for susceptibility, while double vertical lines indicate the breakpoints for resistance. Numbers in the shaded areas indicate percentage of isolates with MIC's greater than the highest concentrations on the plate. Numbers listed for the lowest tested concentrations represent the percentage of isolates with MIC's equal to or less than the lowest tested concentration.
Chi
cken
sTu
rkey
sC
hick
ens
Sw
ine
Cat
tle
Table 103b. Distribution of MICs and Occurrence among Enterococcus hirae Isolates, 2013Distribution (%) of MICs (µg/ml)4
Turk
eys
Chi
cken
sTu
rkey
sTu
rkey
sC
attle
Cat
tleS
win
eC
attle
Sw
ine
Sw
ine
Chi
cken
s
213
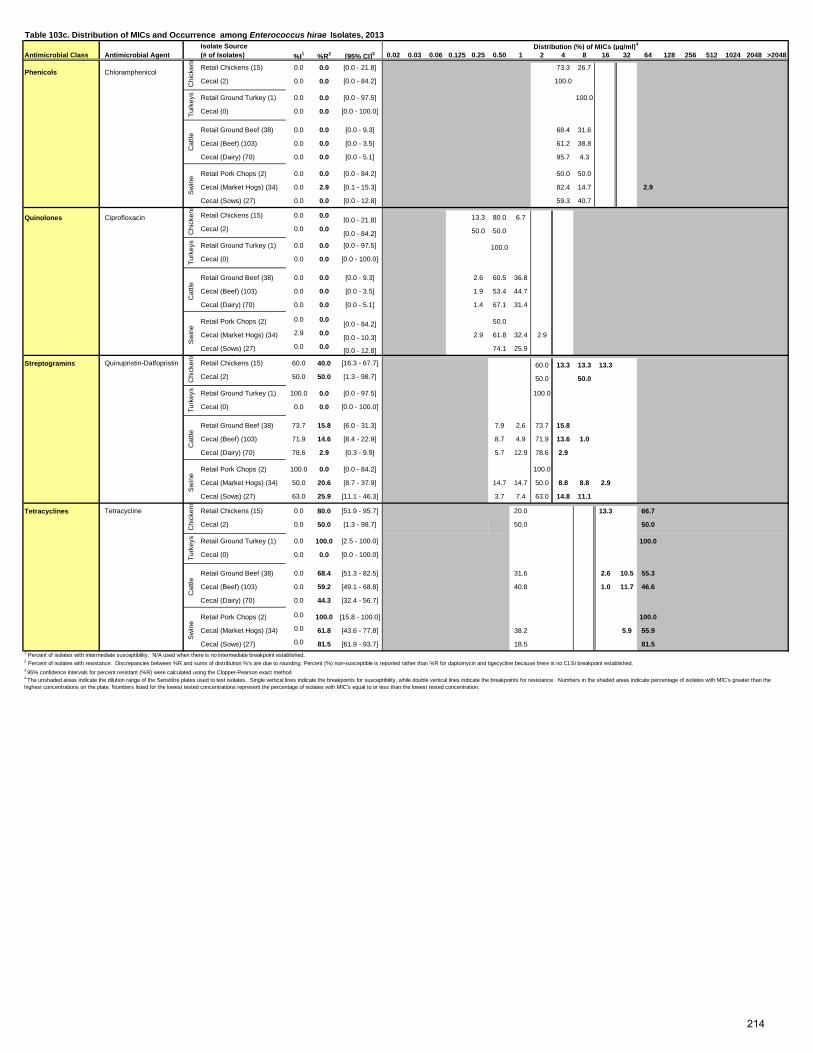
Isolate SourceAntimicrobial Class Antimicrobial Agent (# of Isolates) %I1 %R2 [95% CI]3 0.02 0.03 0.06 0.125 0.25 0.50 1 2 4 8 16 32 64 128 256 512 1024 2048 >2048
Phenicols ChloramphenicolRetail Chickens (15) 0.0 0.0 [0.0 - 21.8] 73.3 26.7
Cecal (2) 0.0 0.0 [0.0 - 84.2] 100.0
Retail Ground Turkey (1) 0.0 0.0 [0.0 - 97.5] 100.0
Cecal (0) 0.0 0.0 [0.0 - 100.0]
Retail Ground Beef (38) 0.0 0.0 [0.0 - 9.3] 68.4 31.6
Cecal (Beef) (103) 0.0 0.0 [0.0 - 3.5] 61.2 38.8
Cecal (Dairy) (70) 0.0 0.0 [0.0 - 5.1] 95.7 4.3
Retail Pork Chops (2) 0.0 0.0 [0.0 - 84.2] 50.0 50.0
Cecal (Market Hogs) (34) 0.0 2.9 [0.1 - 15.3] 82.4 14.7 2.9
Cecal (Sows) (27) 0.0 0.0 [0.0 - 12.8] 59.3 40.7
Quinolones Ciprofloxacin Retail Chickens (15) 0.0 0.0[0.0 - 21.8] 13.3 80.0 6.7
Cecal (2) 0.0 0.0[0.0 - 84.2] 50.0 50.0
Retail Ground Turkey (1) 0.0 0.0 [0.0 - 97.5] 100.0
Cecal (0) 0.0 0.0 [0.0 - 100.0]
Retail Ground Beef (38) 0.0 0.0 [0.0 - 9.3] 2.6 60.5 36.8
Cecal (Beef) (103) 0.0 0.0 [0.0 - 3.5] 1.9 53.4 44.7
Cecal (Dairy) (70) 0.0 0.0 [0.0 - 5.1] 1.4 67.1 31.4
Retail Pork Chops (2) 0.0 0.0[0.0 - 84.2] 50.0
Cecal (Market Hogs) (34) 2.9 0.0[0.0 - 10.3] 2.9 61.8 32.4 2.9
Cecal (Sows) (27) 0.0 0.0 [0.0 - 12.8] 74.1 25.9
Streptogramins Quinupristin-Dalfopristin Retail Chickens (15) 60.0 40.0 [16.3 - 67.7] 60.0 13.3 13.3 13.3Cecal (2) 50.0 50.0 [1.3 - 98.7] 50.0 50.0
Retail Ground Turkey (1) 100.0 0.0 [0.0 - 97.5] 100.0
Cecal (0) 0.0 0.0 [0.0 - 100.0]
Retail Ground Beef (38) 73.7 15.8 [6.0 - 31.3] 7.9 2.6 73.7 15.8
Cecal (Beef) (103) 71.9 14.6 [8.4 - 22.9] 8.7 4.9 71.9 13.6 1.0
Cecal (Dairy) (70) 78.6 2.9 [0.3 - 9.9] 5.7 12.9 78.6 2.9
Retail Pork Chops (2) 100.0 0.0 [0.0 - 84.2] 100.0
Cecal (Market Hogs) (34) 50.0 20.6 [8.7 - 37.9] 14.7 14.7 50.0 8.8 8.8 2.9
Cecal (Sows) (27) 63.0 25.9 [11.1 - 46.3] 3.7 7.4 63.0 14.8 11.1
Tetracyclines Tetracycline Retail Chickens (15) 0.0 80.0 [51.9 - 95.7] 20.0 13.3 66.7
Cecal (2) 0.0 50.0 [1.3 - 98.7] 50.0 50.0
Retail Ground Turkey (1) 0.0 100.0 [2.5 - 100.0] 100.0
Cecal (0) 0.0 0.0 [0.0 - 100.0]
Retail Ground Beef (38) 0.0 68.4 [51.3 - 82.5] 31.6 2.6 10.5 55.3
Cecal (Beef) (103) 0.0 59.2 [49.1 - 68.8] 40.8 1.0 11.7 46.6
Cecal (Dairy) (70) 0.0 44.3 [32.4 - 56.7]
Retail Pork Chops (2) 0.0 100.0 [15.8 - 100.0] 100.0
Cecal (Market Hogs) (34) 0.0 61.8 [43.6 - 77.8] 38.2 5.9 55.9
Cecal (Sows) (27) 0.0 81.5 [61.9 - 93.7] 18.5 81.5
4 The unshaded areas indicate the dilution range of the Sensititre plates used to test isolates. Single vertical lines indicate the breakpoints for susceptibility, while double vertical lines indicate the breakpoints for resistance. Numbers in the shaded areas indicate percentage of isolates with MIC's greater than the highest concentrations on the plate. Numbers listed for the lowest tested concentrations represent the percentage of isolates with MIC's equal to or less than the lowest tested concentration.
Cat
tleS
win
e
1 Percent of isolates with intermediate susceptibility. N/A used when there is no intermediate breakpoint established. 2 Percent of isolates with resistance. Discrepancies between %R and sums of distribution %'s are due to rounding. Percent (%) non-susceptible is reported rather than %R for daptomycin and tigecycline because there is no CLSI breakpoint established.3 95% confidence intervals for percent resistant (%R) were calculated using the Clopper-Pearson exact method
Table 103c. Distribution of MICs and Occurrence among Enterococcus hirae Isolates, 2013
Chi
cken
s
Distribution (%) of MICs (µg/ml)4
Turk
eys
Chi
cken
sTu
rkey
sC
hick
ens
Turk
eys
Chi
cken
sS
win
eC
attle
Sw
ine
Cat
tleTu
rkey
sC
attle
Sw
ine
214
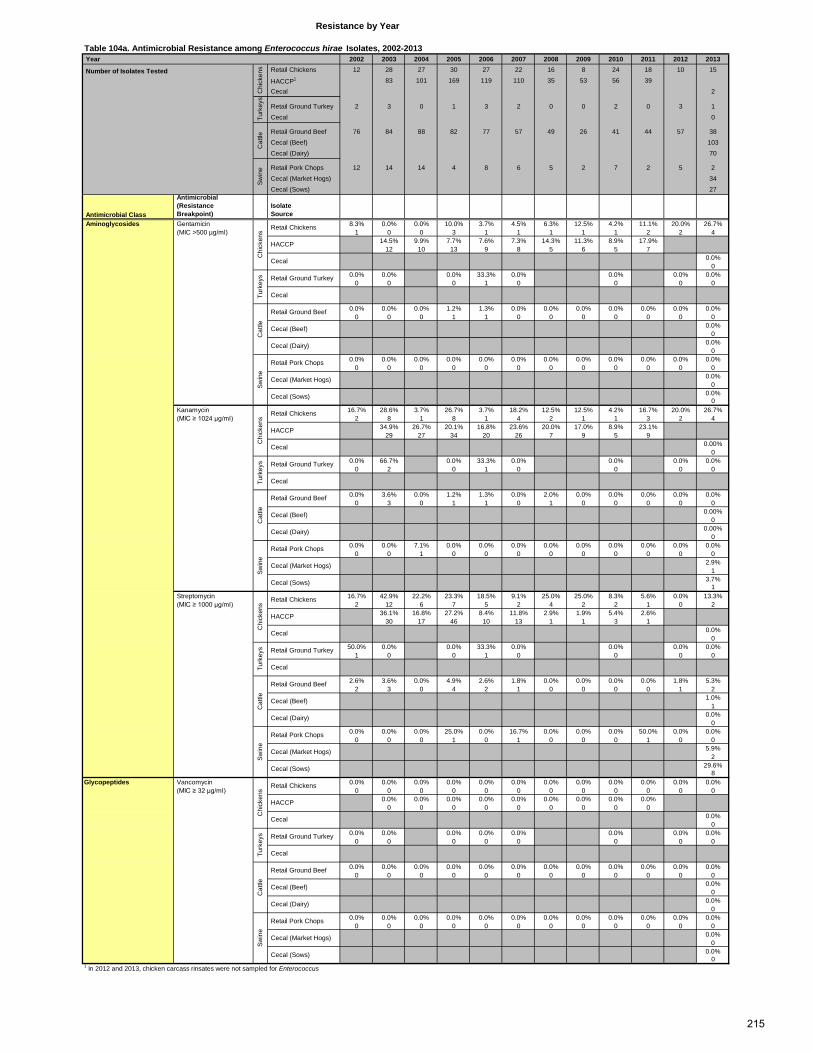
Year 2002 2003 2004 2005 2006 2007 2008 2009 2010 2011 2012 2013 Retail Chickens 12 28 27 30 27 22 16 8 24 18 10 15
HACCP1 83 101 169 119 110 35 53 56 39 Cecal 2
Retail Ground Turkey 2 3 0 1 3 2 0 0 2 0 3 1 Cecal 0
Retail Ground Beef 76 84 88 82 77 57 49 26 41 44 57 38 Cecal (Beef) 103 Cecal (Dairy) 70
Retail Pork Chops 12 14 14 4 8 6 5 2 7 2 5 2 Cecal (Market Hogs) 34
Cecal (Sows) 27
Antimicrobial Class
Antimicrobial (Resistance Breakpoint)
Isolate Source
Aminoglycosides Gentamicin 8.3% 0.0% 0.0% 10.0% 3.7% 4.5% 6.3% 12.5% 4.2% 11.1% 20.0% 26.7% (MIC >500 µg/ml) 1 0 0 3 1 1 1 1 1 2 2 4
14.5% 9.9% 7.7% 7.6% 7.3% 14.3% 11.3% 8.9% 17.9%12 10 13 9 8 5 6 5 7
0.0%0
0.0% 0.0% 0.0% 33.3% 0.0% 0.0% 0.0% 0.0%0 0 0 1 0 0 0 0
0.0% 0.0% 0.0% 1.2% 1.3% 0.0% 0.0% 0.0% 0.0% 0.0% 0.0% 0.0%0 0 0 1 1 0 0 0 0 0 0 0
0.0%0
0.0%0
0.0% 0.0% 0.0% 0.0% 0.0% 0.0% 0.0% 0.0% 0.0% 0.0% 0.0% 0.0%0 0 0 0 0 0 0 0 0 0 0 0
0.0%0
0.0%0
Kanamycin 16.7% 28.6% 3.7% 26.7% 3.7% 18.2% 12.5% 12.5% 4.2% 16.7% 20.0% 26.7% (MIC ≥ 1024 µg/ml) 2 8 1 8 1 4 2 1 1 3 2 4
34.9% 26.7% 20.1% 16.8% 23.6% 20.0% 17.0% 8.9% 23.1%29 27 34 20 26 7 9 5 9
0.00%0
0.0% 66.7% 0.0% 33.3% 0.0% 0.0% 0.0% 0.0%0 2 0 1 0 0 0 0
0.0% 3.6% 0.0% 1.2% 1.3% 0.0% 2.0% 0.0% 0.0% 0.0% 0.0% 0.0%0 3 0 1 1 0 1 0 0 0 0 0
0.00%0
0.00%0
0.0% 0.0% 7.1% 0.0% 0.0% 0.0% 0.0% 0.0% 0.0% 0.0% 0.0% 0.0%0 0 1 0 0 0 0 0 0 0 0 0
2.9%1
3.7%1
Streptomycin 16.7% 42.9% 22.2% 23.3% 18.5% 9.1% 25.0% 25.0% 8.3% 5.6% 0.0% 13.3% (MIC ≥ 1000 µg/ml) 2 12 6 7 5 2 4 2 2 1 0 2
36.1% 16.8% 27.2% 8.4% 11.8% 2.9% 1.9% 5.4% 2.6%30 17 46 10 13 1 1 3 1
0.0%0
50.0% 0.0% 0.0% 33.3% 0.0% 0.0% 0.0% 0.0%1 0 0 1 0 0 0 0
2.6% 3.6% 0.0% 4.9% 2.6% 1.8% 0.0% 0.0% 0.0% 0.0% 1.8% 5.3%2 3 0 4 2 1 0 0 0 0 1 2
1.0%1
0.0%0
0.0% 0.0% 0.0% 25.0% 0.0% 16.7% 0.0% 0.0% 0.0% 50.0% 0.0% 0.0%0 0 0 1 0 1 0 0 0 1 0 0
5.9%2
29.6%8
Glycopeptides Vancomycin 0.0% 0.0% 0.0% 0.0% 0.0% 0.0% 0.0% 0.0% 0.0% 0.0% 0.0% 0.0% (MIC ≥ 32 µg/ml) 0 0 0 0 0 0 0 0 0 0 0 0
0.0% 0.0% 0.0% 0.0% 0.0% 0.0% 0.0% 0.0% 0.0%0 0 0 0 0 0 0 0 0
0.0%0
0.0% 0.0% 0.0% 0.0% 0.0% 0.0% 0.0% 0.0%0 0 0 0 0 0 0 0
0.0% 0.0% 0.0% 0.0% 0.0% 0.0% 0.0% 0.0% 0.0% 0.0% 0.0% 0.0%0 0 0 0 0 0 0 0 0 0 0 0
0.0%0
0.0%0
0.0% 0.0% 0.0% 0.0% 0.0% 0.0% 0.0% 0.0% 0.0% 0.0% 0.0% 0.0%0 0 0 0 0 0 0 0 0 0 0 0
0.0%0
0.0%0
1 In 2012 and 2013, chicken carcass rinsates were not sampled for Enterococcus
Cat
tle
Retail Ground Beef
Cecal (Beef)
Cecal (Dairy)
Swin
e
Retail Pork Chops
Cecal (Market Hogs)
Cecal (Sows)
Chi
cken
s
Retail Chickens
HACCP
Cecal
Turk
eys Retail Ground Turkey
Cecal
Cat
tle
Retail Ground Beef
Cecal (Beef)
Cecal (Dairy)
Swin
e
Retail Pork Chops
Cecal (Market Hogs)
Cecal (Sows)
Chi
cken
s
Retail Chickens
HACCP
Cecal
Turk
eys Retail Ground Turkey
Cecal
Cat
tle
Retail Ground Beef
Cecal (Beef)
Cecal (Dairy)
Swin
e
Retail Pork Chops
Cecal (Market Hogs)
Cecal (Sows)
Chi
cken
s
Retail Chickens
HACCP
Cecal
Turk
eys Retail Ground Turkey
Cecal
Cat
tle
Retail Ground Beef
Cecal (Beef)
Cecal (Dairy)
Swin
e
Retail Pork Chops
Cecal (Market Hogs)
Cecal (Sows)
Swin
eC
hick
ens
Retail Chickens
HACCP
CecalTu
rkey
s Retail Ground Turkey
Cecal
Resistance by Year
Table 104a. Antimicrobial Resistance among Enterococcus hirae Isolates, 2002-2013
Number of Isolates Tested
Chi
cken
sTu
rkey
sC
attle
215
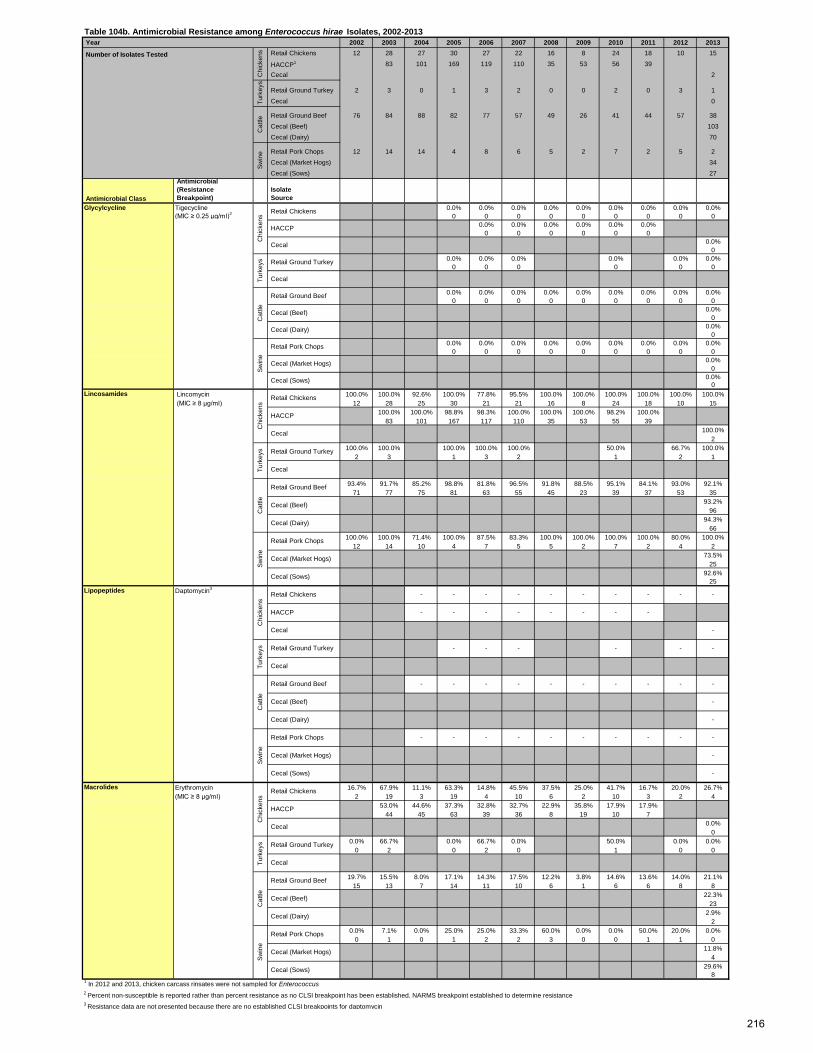
Year 2002 2003 2004 2005 2006 2007 2008 2009 2010 2011 2012 2013 Retail Chickens 12 28 27 30 27 22 16 8 24 18 10 15
HACCP1 83 101 169 119 110 35 53 56 39 Cecal 2
Retail Ground Turkey 2 3 0 1 3 2 0 0 2 0 3 1 Cecal 0
Retail Ground Beef 76 84 88 82 77 57 49 26 41 44 57 38 Cecal (Beef) 103 Cecal (Dairy) 70
Retail Pork Chops 12 14 14 4 8 6 5 2 7 2 5 2 Cecal (Market Hogs) 34
Cecal (Sows) 27
Antimicrobial Class
Antimicrobial (Resistance Breakpoint)
Isolate Source
Glycylcycline Tigecycline 0.0% 0.0% 0.0% 0.0% 0.0% 0.0% 0.0% 0.0% 0.0%(MIC ≥ 0.25 µg/ml)2 0 0 0 0 0 0 0 0 0
0.0% 0.0% 0.0% 0.0% 0.0% 0.0%0 0 0 0 0 0
0.0%0
0.0% 0.0% 0.0% 0.0% 0.0% 0.0%0 0 0 0 0 0
0.0% 0.0% 0.0% 0.0% 0.0% 0.0% 0.0% 0.0% 0.0%0 0 0 0 0 0 0 0 0
0.0%0
0.0%0
0.0% 0.0% 0.0% 0.0% 0.0% 0.0% 0.0% 0.0% 0.0%0 0 0 0 0 0 0 0 0
0.0%0
0.0%0
Lincosamides Lincomycin 100.0% 100.0% 92.6% 100.0% 77.8% 95.5% 100.0% 100.0% 100.0% 100.0% 100.0% 100.0% (MIC ≥ 8 µg/ml) 12 28 25 30 21 21 16 8 24 18 10 15
100.0% 100.0% 98.8% 98.3% 100.0% 100.0% 100.0% 98.2% 100.0%83 101 167 117 110 35 53 55 39
100.0%2
100.0% 100.0% 100.0% 100.0% 100.0% 50.0% 66.7% 100.0%2 3 1 3 2 1 2 1
93.4% 91.7% 85.2% 98.8% 81.8% 96.5% 91.8% 88.5% 95.1% 84.1% 93.0% 92.1%71 77 75 81 63 55 45 23 39 37 53 35
93.2%96
94.3%66
100.0% 100.0% 71.4% 100.0% 87.5% 83.3% 100.0% 100.0% 100.0% 100.0% 80.0% 100.0%12 14 10 4 7 5 5 2 7 2 4 2
73.5%25
92.6%25
Lipopeptides Daptomycin3
Macrolides Erythromycin 16.7% 67.9% 11.1% 63.3% 14.8% 45.5% 37.5% 25.0% 41.7% 16.7% 20.0% 26.7%(MIC ≥ 8 µg/ml) 2 19 3 19 4 10 6 2 10 3 2 4
53.0% 44.6% 37.3% 32.8% 32.7% 22.9% 35.8% 17.9% 17.9%44 45 63 39 36 8 19 10 7
0.0%0
0.0% 66.7% 0.0% 66.7% 0.0% 50.0% 0.0% 0.0%0 2 0 2 0 1 0 0
19.7% 15.5% 8.0% 17.1% 14.3% 17.5% 12.2% 3.8% 14.6% 13.6% 14.0% 21.1%15 13 7 14 11 10 6 1 6 6 8 8
22.3%23
2.9%2
0.0% 7.1% 0.0% 25.0% 25.0% 33.3% 60.0% 0.0% 0.0% 50.0% 20.0% 0.0%0 1 0 1 2 2 3 0 0 1 1 0
11.8%4
29.6%8
1 In 2012 and 2013, chicken carcass rinsates were not sampled for Enterococcus2 Percent non-susceptible is reported rather than percent resistance as no CLSI breakpoint has been established. NARMS breakpoint established to determine resistance3 Resistance data are not presented because there are no established CLSI breakpoints for daptomycin
-
-
-
-
-
- - - - - - - - -
-
-- - - -
- - - - - - - - - -
-
-
- - - - - - - -
- - - - - - - - -
Cat
tle
Retail Ground Beef
Cecal (Beef)
Cecal (Dairy)
Swin
e
Retail Pork Chops
Cecal (Market Hogs)
Cecal (Sows)
Chi
cken
s
Retail Chickens
HACCP
Cecal
Turk
eys Retail Ground Turkey
Cecal
Cat
tle
Retail Ground Beef
Cecal (Beef)
Cecal (Dairy)
Swin
e
Retail Pork Chops
Cecal (Market Hogs)
Cecal (Sows)
Chi
cken
s
Retail Chickens
HACCP
Cecal
Turk
eys Retail Ground Turkey
Cecal
Cat
tle
Retail Ground Beef
Cecal (Beef)
Cecal (Dairy)
Swin
e
Retail Pork Chops
Cecal (Market Hogs)
Cecal (Sows)
Chi
cken
s
Retail Chickens
HACCP
Cecal
Turk
eys Retail Ground Turkey
Cecal
Cat
tle
Retail Ground Beef
Cecal (Beef)
Cecal (Dairy)
Swin
e
Retail Pork Chops
Cecal (Market Hogs)
Cecal (Sows)
Chi
cken
s
Retail Chickens
HACCP
Cecal
Turk
eys Retail Ground Turkey
Cecal
Table 104b. Antimicrobial Resistance among Enterococcus hirae Isolates, 2002-2013
Number of Isolates Tested
Chi
cken
sTu
rkey
sC
attle
Swin
e
216
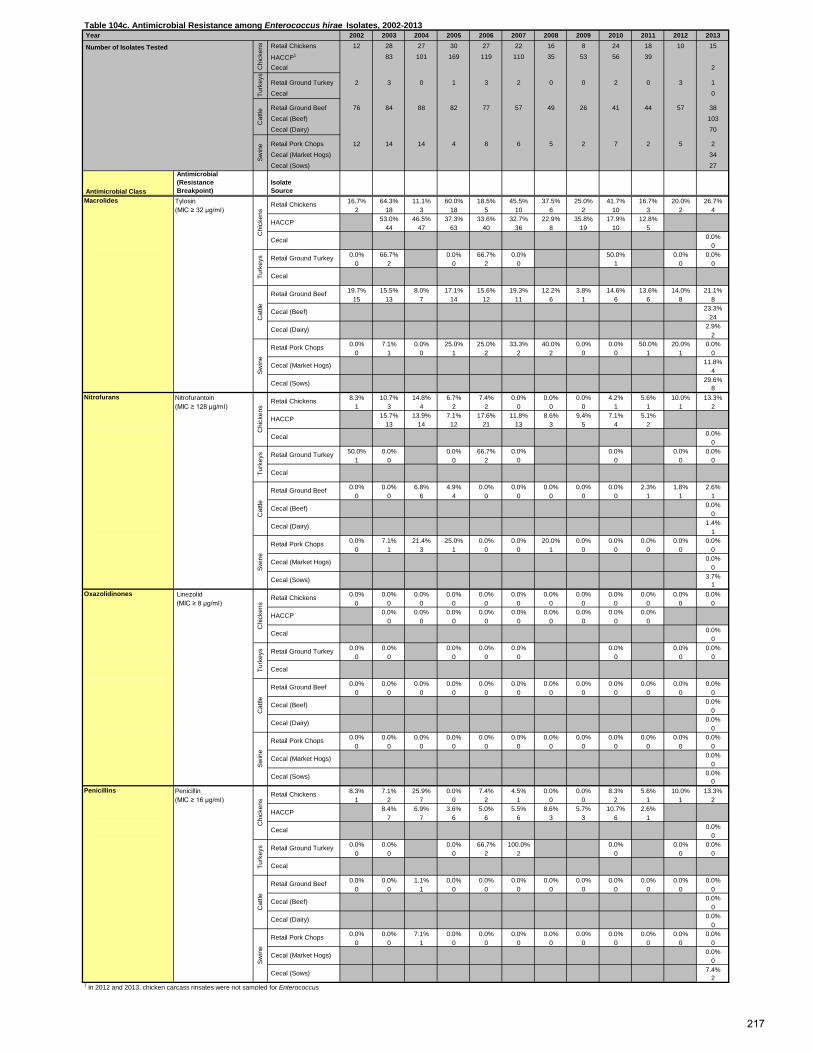
Year 2002 2003 2004 2005 2006 2007 2008 2009 2010 2011 2012 2013 Retail Chickens 12 28 27 30 27 22 16 8 24 18 10 15
HACCP1 83 101 169 119 110 35 53 56 39 Cecal 2
Retail Ground Turkey 2 3 0 1 3 2 0 0 2 0 3 1 Cecal 0
Retail Ground Beef 76 84 88 82 77 57 49 26 41 44 57 38 Cecal (Beef) 103 Cecal (Dairy) 70
Retail Pork Chops 12 14 14 4 8 6 5 2 7 2 5 2 Cecal (Market Hogs) 34
Cecal (Sows) 27
Antimicrobial Class
Antimicrobial (Resistance Breakpoint)
Isolate Source
Macrolides Tylosin 16.7% 64.3% 11.1% 60.0% 18.5% 45.5% 37.5% 25.0% 41.7% 16.7% 20.0% 26.7%(MIC ≥ 32 µg/ml) 2 18 3 18 5 10 6 2 10 3 2 4
53.0% 46.5% 37.3% 33.6% 32.7% 22.9% 35.8% 17.9% 12.8%44 47 63 40 36 8 19 10 5
0.0%0
0.0% 66.7% 0.0% 66.7% 0.0% 50.0% 0.0% 0.0%0 2 0 2 0 1 0 0
19.7% 15.5% 8.0% 17.1% 15.6% 19.3% 12.2% 3.8% 14.6% 13.6% 14.0% 21.1%15 13 7 14 12 11 6 1 6 6 8 8
23.3%24
2.9%2
0.0% 7.1% 0.0% 25.0% 25.0% 33.3% 40.0% 0.0% 0.0% 50.0% 20.0% 0.0%0 1 0 1 2 2 2 0 0 1 1 0
11.8%4
29.6%8
Nitrofurans Nitrofurantoin 8.3% 10.7% 14.8% 6.7% 7.4% 0.0% 0.0% 0.0% 4.2% 5.6% 10.0% 13.3%(MIC ≥ 128 µg/ml) 1 3 4 2 2 0 0 0 1 1 1 2
15.7% 13.9% 7.1% 17.6% 11.8% 8.6% 9.4% 7.1% 5.1%13 14 12 21 13 3 5 4 2
0.0%0
50.0% 0.0% 0.0% 66.7% 0.0% 0.0% 0.0% 0.0%1 0 0 2 0 0 0 0
0.0% 0.0% 6.8% 4.9% 0.0% 0.0% 0.0% 0.0% 0.0% 2.3% 1.8% 2.6%0 0 6 4 0 0 0 0 0 1 1 1
0.0%0
1.4%1
0.0% 7.1% 21.4% 25.0% 0.0% 0.0% 20.0% 0.0% 0.0% 0.0% 0.0% 0.0%0 1 3 1 0 0 1 0 0 0 0 0
0.0%0
3.7%1
Oxazolidinones Linezolid 0.0% 0.0% 0.0% 0.0% 0.0% 0.0% 0.0% 0.0% 0.0% 0.0% 0.0% 0.0% (MIC ≥ 8 µg/ml) 0 0 0 0 0 0 0 0 0 0 0 0
0.0% 0.0% 0.0% 0.0% 0.0% 0.0% 0.0% 0.0% 0.0%0 0 0 0 0 0 0 0 0
0.0%0
0.0% 0.0% 0.0% 0.0% 0.0% 0.0% 0.0% 0.0%0 0 0 0 0 0 0 0
0.0% 0.0% 0.0% 0.0% 0.0% 0.0% 0.0% 0.0% 0.0% 0.0% 0.0% 0.0%0 0 0 0 0 0 0 0 0 0 0 0
0.0%0
0.0%0
0.0% 0.0% 0.0% 0.0% 0.0% 0.0% 0.0% 0.0% 0.0% 0.0% 0.0% 0.0%0 0 0 0 0 0 0 0 0 0 0 0
0.0%0
0.0%0
Penicillins Penicillin 8.3% 7.1% 25.9% 0.0% 7.4% 4.5% 0.0% 0.0% 8.3% 5.6% 10.0% 13.3%(MIC ≥ 16 µg/ml) 1 2 7 0 2 1 0 0 2 1 1 2
8.4% 6.9% 3.6% 5.0% 5.5% 8.6% 5.7% 10.7% 2.6%7 7 6 6 6 3 3 6 1
0.0%0
0.0% 0.0% 0.0% 66.7% 100.0% 0.0% 0.0% 0.0%0 0 0 2 2 0 0 0
0.0% 0.0% 1.1% 0.0% 0.0% 0.0% 0.0% 0.0% 0.0% 0.0% 0.0% 0.0%0 0 1 0 0 0 0 0 0 0 0 0
0.0%0
0.0%0
0.0% 0.0% 7.1% 0.0% 0.0% 0.0% 0.0% 0.0% 0.0% 0.0% 0.0% 0.0%0 0 1 0 0 0 0 0 0 0 0 0
0.0%0
7.4%2
1 In 2012 and 2013, chicken carcass rinsates were not sampled for Enterococcus
Cat
tle
Retail Ground Beef
Cecal (Beef)
Cecal (Dairy)
Swin
e
Retail Pork Chops
Cecal (Market Hogs)
Cecal (Sows)
Chi
cken
s
Retail Chickens
HACCP
Cecal
Turk
eys Retail Ground Turkey
Cecal
Cat
tle
Retail Ground Beef
Cecal (Beef)
Cecal (Dairy)
Swin
e
Retail Pork Chops
Cecal (Market Hogs)
Cecal (Sows)
Chi
cken
s
Retail Chickens
HACCP
Cecal
Turk
eys Retail Ground Turkey
Cecal
Cat
tle
Retail Ground Beef
Cecal (Beef)
Cecal (Dairy)
Swin
e
Retail Pork Chops
Cecal (Market Hogs)
Cecal (Sows)
Chi
cken
s
Retail Chickens
HACCP
Cecal
Turk
eys Retail Ground Turkey
Cecal
Cat
tle
Retail Ground Beef
Cecal (Beef)
Cecal (Dairy)
Swin
e
Retail Pork Chops
Cecal (Market Hogs)
Cecal (Sows)
Chi
cken
s
Retail Chickens
HACCP
Cecal
Turk
eys Retail Ground Turkey
Cecal
Table 104c. Antimicrobial Resistance among Enterococcus hirae Isolates, 2002-2013
Number of Isolates Tested
Chi
cken
sTu
rkey
sC
attle
Swin
e
217
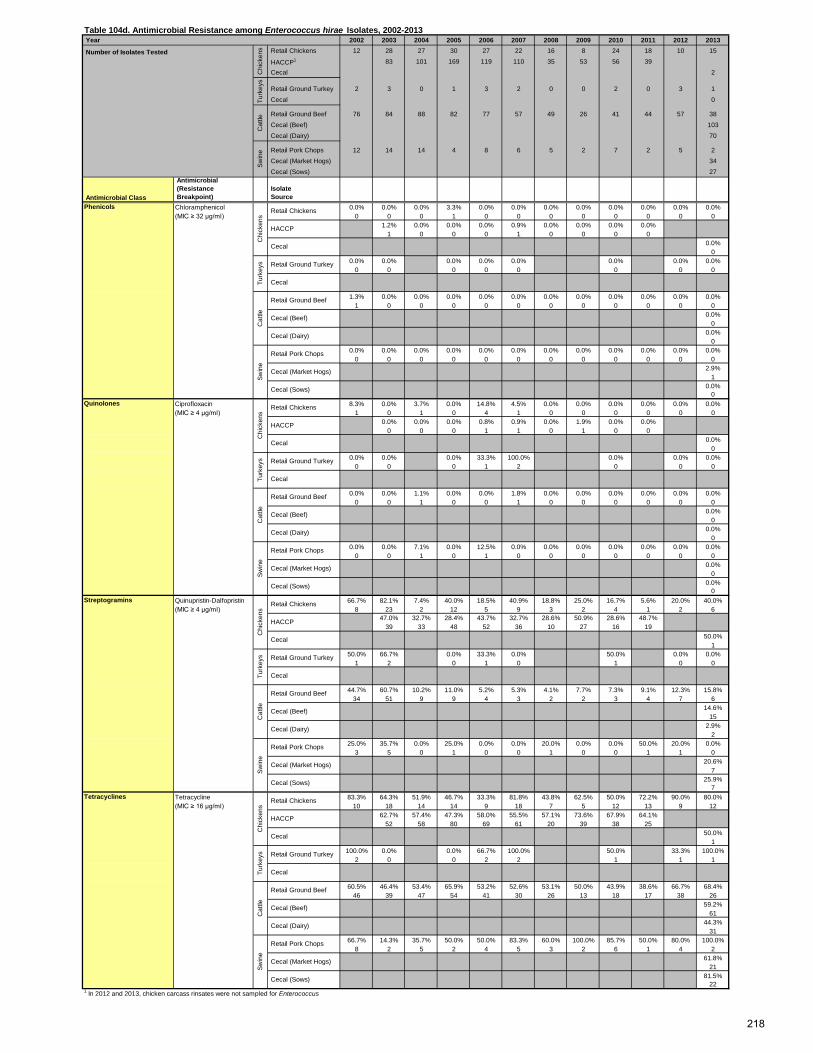
Year 2002 2003 2004 2005 2006 2007 2008 2009 2010 2011 2012 2013 Retail Chickens 12 28 27 30 27 22 16 8 24 18 10 15
HACCP1 83 101 169 119 110 35 53 56 39 Cecal 2
Retail Ground Turkey 2 3 0 1 3 2 0 0 2 0 3 1 Cecal 0
Retail Ground Beef 76 84 88 82 77 57 49 26 41 44 57 38 Cecal (Beef) 103 Cecal (Dairy) 70
Retail Pork Chops 12 14 14 4 8 6 5 2 7 2 5 2 Cecal (Market Hogs) 34
Cecal (Sows) 27
Antimicrobial Class
Antimicrobial (Resistance Breakpoint)
Isolate Source
Phenicols Chloramphenicol 0.0% 0.0% 0.0% 3.3% 0.0% 0.0% 0.0% 0.0% 0.0% 0.0% 0.0% 0.0%(MIC ≥ 32 µg/ml) 0 0 0 1 0 0 0 0 0 0 0 0
1.2% 0.0% 0.0% 0.0% 0.9% 0.0% 0.0% 0.0% 0.0%1 0 0 0 1 0 0 0 0
0.0%0
0.0% 0.0% 0.0% 0.0% 0.0% 0.0% 0.0% 0.0%0 0 0 0 0 0 0 0
1.3% 0.0% 0.0% 0.0% 0.0% 0.0% 0.0% 0.0% 0.0% 0.0% 0.0% 0.0%1 0 0 0 0 0 0 0 0 0 0 0
0.0%0
0.0%0
0.0% 0.0% 0.0% 0.0% 0.0% 0.0% 0.0% 0.0% 0.0% 0.0% 0.0% 0.0%0 0 0 0 0 0 0 0 0 0 0 0
2.9%1
0.0%0
Quinolones Ciprofloxacin 8.3% 0.0% 3.7% 0.0% 14.8% 4.5% 0.0% 0.0% 0.0% 0.0% 0.0% 0.0%(MIC ≥ 4 µg/ml) 1 0 1 0 4 1 0 0 0 0 0 0
0.0% 0.0% 0.0% 0.8% 0.9% 0.0% 1.9% 0.0% 0.0%0 0 0 1 1 0 1 0 0
0.0%0
0.0% 0.0% 0.0% 33.3% 100.0% 0.0% 0.0% 0.0%0 0 0 1 2 0 0 0
0.0% 0.0% 1.1% 0.0% 0.0% 1.8% 0.0% 0.0% 0.0% 0.0% 0.0% 0.0%0 0 1 0 0 1 0 0 0 0 0 0
0.0%0
0.0%0
0.0% 0.0% 7.1% 0.0% 12.5% 0.0% 0.0% 0.0% 0.0% 0.0% 0.0% 0.0%0 0 1 0 1 0 0 0 0 0 0 0
0.0%0
0.0%0
Streptogramins Quinupristin-Dalfopristin 66.7% 82.1% 7.4% 40.0% 18.5% 40.9% 18.8% 25.0% 16.7% 5.6% 20.0% 40.0%(MIC ≥ 4 µg/ml) 8 23 2 12 5 9 3 2 4 1 2 6
47.0% 32.7% 28.4% 43.7% 32.7% 28.6% 50.9% 28.6% 48.7%39 33 48 52 36 10 27 16 19
50.0%1
50.0% 66.7% 0.0% 33.3% 0.0% 50.0% 0.0% 0.0%1 2 0 1 0 1 0 0
44.7% 60.7% 10.2% 11.0% 5.2% 5.3% 4.1% 7.7% 7.3% 9.1% 12.3% 15.8%34 51 9 9 4 3 2 2 3 4 7 6
14.6%15
2.9%2
25.0% 35.7% 0.0% 25.0% 0.0% 0.0% 20.0% 0.0% 0.0% 50.0% 20.0% 0.0%3 5 0 1 0 0 1 0 0 1 1 0
20.6%7
25.9%7
Tetracyclines Tetracycline 83.3% 64.3% 51.9% 46.7% 33.3% 81.8% 43.8% 62.5% 50.0% 72.2% 90.0% 80.0%(MIC ≥ 16 µg/ml) 10 18 14 14 9 18 7 5 12 13 9 12
62.7% 57.4% 47.3% 58.0% 55.5% 57.1% 73.6% 67.9% 64.1%52 58 80 69 61 20 39 38 25
50.0%1
100.0% 0.0% 0.0% 66.7% 100.0% 50.0% 33.3% 100.0%2 0 0 2 2 1 1 1
60.5% 46.4% 53.4% 65.9% 53.2% 52.6% 53.1% 50.0% 43.9% 38.6% 66.7% 68.4%46 39 47 54 41 30 26 13 18 17 38 26
59.2%61
44.3%31
66.7% 14.3% 35.7% 50.0% 50.0% 83.3% 60.0% 100.0% 85.7% 50.0% 80.0% 100.0%8 2 5 2 4 5 3 2 6 1 4 2
61.8%21
81.5%22
1 In 2012 and 2013, chicken carcass rinsates were not sampled for Enterococcus
Cat
tle
Retail Ground Beef
Cecal (Beef)
Cecal (Dairy)
Swin
e
Retail Pork Chops
Cecal (Market Hogs)
Cecal (Sows)
Chi
cken
s
Retail Chickens
HACCP
Cecal
Turk
eys Retail Ground Turkey
Cecal
Cat
tle
Retail Ground Beef
Cecal (Beef)
Cecal (Dairy)
Swin
e
Retail Pork Chops
Cecal (Market Hogs)
Cecal (Sows)
Chi
cken
s
Retail Chickens
HACCP
Cecal
Turk
eys Retail Ground Turkey
Cecal
Cat
tle
Retail Ground Beef
Cecal (Beef)
Cecal (Dairy)
Swin
e
Retail Pork Chops
Cecal (Market Hogs)
Cecal (Sows)
Chi
cken
s
Retail Chickens
HACCP
Cecal
Turk
eys Retail Ground Turkey
Cecal
Cat
tle
Retail Ground Beef
Cecal (Beef)
Cecal (Dairy)
Swin
e
Retail Pork Chops
Cecal (Market Hogs)
Cecal (Sows)
Chi
cken
s
Retail Chickens
HACCP
Cecal
Turk
eys Retail Ground Turkey
Cecal
Table 104d. Antimicrobial Resistance among Enterococcus hirae Isolates, 2002-2013
Number of Isolates Tested
Chi
cken
sTu
rkey
sC
attle
Swin
e
218

Year 2002 2003 2004 2005 2006 2007 2008 2009 2010 2011 2012 2013Number of Isolates Tested Retail Chickens 12 28 27 30 27 22 16 8 24 18 10 15
HACCP1 83 101 169 119 110 35 53 56 39
Cecal 2
Retail Ground Turkey 2 3 0 1 3 2 0 0 2 0 3 1
Cecal 0
Retail Ground Beef 76 84 88 82 77 57 49 26 41 44 57 38 Cecal (Beef) 103 Cecal (Dairy) 70
Retail Pork Chops 12 14 14 4 8 6 5 2 7 2 5 2 Cecal (Market Hogs) 34 Cecal (Sows) 27
Resistance Pattern2 Source0.0% 0.0% 3.7% 0.0% 11.1% 0.0% 0.0% 0.0% 0.0% 0.0% 0.0% 0.0%
1. No Resistance Detected 0 0 1 0 3 0 0 0 0 0 0 00.0% 0.0% 0.6% 1.7% 0.0% 0.0% 0.0% 0.0% 0.0%
0 0 1 2 0 0 0 0 00.0%
00.0% 0.0% 0.0% 0.0% 0.0% 50.0% 33.3% 0.0%
0 0 0 0 0 1 1 0
1.3% 3.6% 6.8% 0.0% 11.7% 0.0% 4.1% 7.7% 4.9% 11.4% 3.5% 2.6%1 3 6 0 9 0 2 2 2 5 2 1
2.9%3
2.9%2
0.0% 0.0% 14.3% 0.0% 0.0% 0.0% 0.0% 0.0% 0.0% 0.0% 0.0% 0.0%0 0 2 0 0 0 0 0 0 0 0 0
8.8%3
0.0%0
2. Resistance to ≥ 3 66.7% 92.9% 37.0% 50.0% 22.2% 68.2% 37.5% 37.5% 20.8% 16.7% 50.0% 53.3% Antimicrobial Classes 8 26 10 15 6 15 6 3 5 3 5 8
67.5% 55.4% 47.3% 56.3% 50.0% 45.7% 66.0% 48.2% 59.0%56 56 80 67 55 16 35 27 23
50.0%1
50.0% 66.7% 0.0% 66.7% 100.0% 50.0% 0.0% 0.0%1 2 0 2 2 1 0 0
39.5% 36.9% 15.9% 19.5% 13.0% 17.5% 12.2% 3.9% 14.6% 15.9% 14.0% 21.1%30 31 14 16 10 10 6 1 6 7 8 8
21.4%22
2.9%2
16.7% 14.3% 14.3% 25.0% 12.5% 33.3% 40.0% 0.0% 0.0% 50.0% 20.0% 0.0%2 2 2 1 1 2 2 0 0 1 1 0
17.7%6
48.2%13
3. Resistant to ≥ 4 25.0% 67.9% 14.8% 36.7% 14.8% 40.9% 6.3% 12.5% 12.5% 11.1% 30.0% 33.3% Antimicrobial Classes 3 19 4 11 4 9 1 1 3 2 3 5
48.2% 28.7% 25.4% 33.6% 30.0% 20.0% 24.5% 14.3% 20.5%40 29 43 40 33 7 13 8 8
0.0%0
50.0% 66.7% 0.0% 66.7% 100.0% 50.0% 0.0% 0.0%1 2 0 2 2 1 0 0
14.5% 14.3% 6.8% 12.2% 3.9% 5.3% 4.1% 3.9% 7.3% 2.3% 10.5% 13.2%11 12 6 10 3 3 2 1 3 1 6 5
12.6%13
2.9%2
0.0% 7.1% 7.1% 25.0% 0.0% 16.7% 20.0% 0.0% 0.0% 50.0% 20.0% 0.0%0 1 1 1 0 1 1 0 0 1 1 0
8.8%3
29.6%8
4. Resistant to ≥ 5 16.7% 32.1% 0.0% 20.0% 11.1% 0.0% 0.0% 0.0% 4.2% 11.1% 0.0% 26.7% Antimicrobial Classes 2 9 0 6 3 0 0 0 1 2 0 4
28.9% 11.9% 12.4% 13.4% 13.6% 2.9% 11.3% 1.8% 10.3%24 12 21 16 15 1 6 1 4
0.0%0
50.0% 0.0% 0.0% 66.7% 0.0% 0.0% 0.0% 0.0%1 0 0 2 0 0 0 0
0.0% 1.2% 1.1% 2.4% 1.3% 1.8% 0.0% 0.0% 0.0% 0.0% 1.8% 5.3%0 1 1 2 1 1 0 0 0 0 1 2
1.0%1
0.0%0
0.0% 0.0% 7.1% 25.0% 0.0% 0.0% 20.0% 0.0% 0.0% 50.0% 0.0% 0.0%0 0 1 1 0 0 1 0 0 1 0 0
2.9%1
11.1%3
1 In 2012 and 2013, chicken carcass rinsates were not sampled for Enterococcus2 Resistance patterns do not include daptomycin as there are no established CLSI breakpoints
Cat
tle
Retail Ground Beef
Cecal (Beef)
Cecal (Dairy)
Sw
ine
Retail Pork Chops
Cecal (Market Hogs)
Cecal (Sows)
Chi
cken
s
Retail Chickens
HACCP
Cecal
Turk
eys Retail Ground Turkey
Cecal
Cat
tle
Retail Ground Beef
Cecal (Beef)
Cecal (Dairy)
Sw
ine
Retail Pork Chops
Cecal (Market Hogs)
Cecal (Sows)
Chi
cken
s
Retail Chickens
HACCP
Cecal
Turk
eys Retail Ground Turkey
Cecal
Cat
tle
Retail Ground Beef
Cecal (Beef)
Cecal (Dairy)
Sw
ine
Retail Pork Chops
Cecal (Market Hogs)
Cecal (Sows)
Chi
cken
s
Retail Chickens
HACCP
Cecal
Turk
eys Retail Ground Turkey
Cecal
Cat
tle
Retail Ground Beef
Cecal (Beef)
Cecal (Dairy)
Sw
ine
Retail Pork Chops
Cecal (Market Hogs)
Cecal (Sows)
Chi
cken
s
HACCP
Cecal
Turk
eys Retail Ground Turkey
Cecal
Multidrug Resistance
Table 105a. Resistance Patterns among Enterococcus hirae Isolates, 2002-2013
Chi
cken
sTu
rkey
sC
attle
Sw
ine
Retail Chickens
219
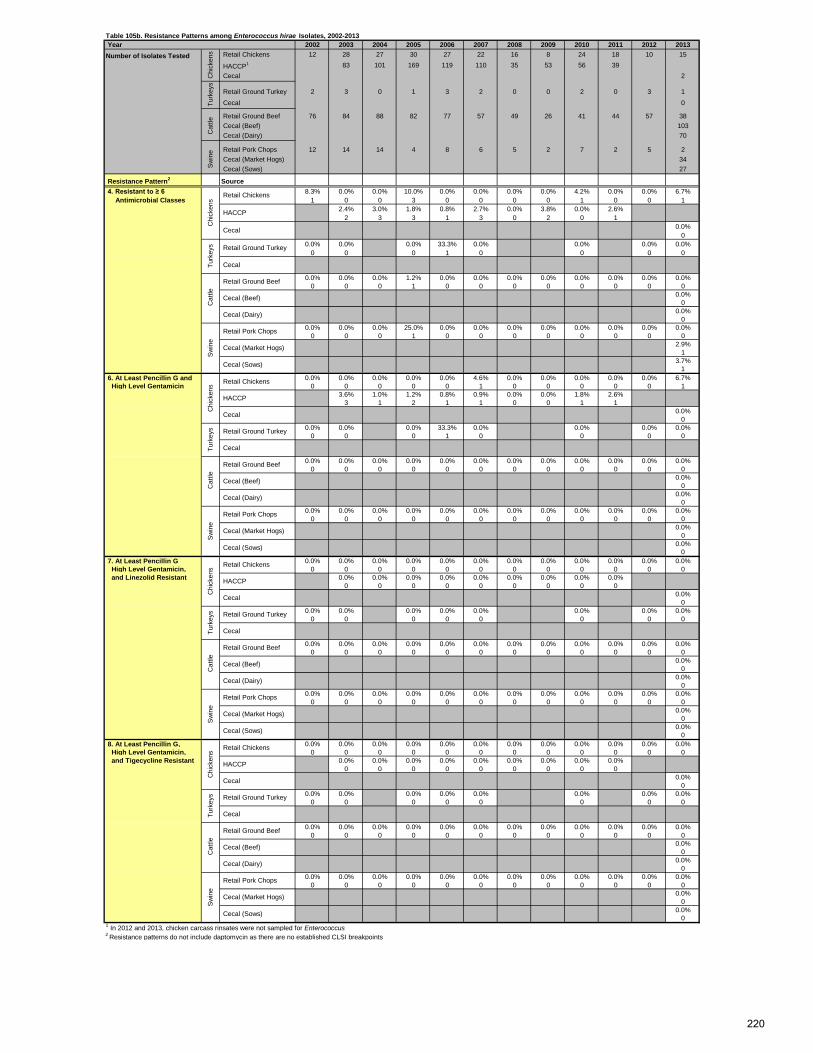
Year 2002 2003 2004 2005 2006 2007 2008 2009 2010 2011 2012 2013Number of Isolates Tested Retail Chickens 12 28 27 30 27 22 16 8 24 18 10 15
HACCP1 83 101 169 119 110 35 53 56 39 Cecal 2
Retail Ground Turkey 2 3 0 1 3 2 0 0 2 0 3 1
Cecal 0
Retail Ground Beef 76 84 88 82 77 57 49 26 41 44 57 38 Cecal (Beef) 103 Cecal (Dairy) 70
Retail Pork Chops 12 14 14 4 8 6 5 2 7 2 5 2 Cecal (Market Hogs) 34 Cecal (Sows) 27
Resistance Pattern2 Source 4. Resistant to ≥ 6 8.3% 0.0% 0.0% 10.0% 0.0% 0.0% 0.0% 0.0% 4.2% 0.0% 0.0% 6.7% Antimicrobial Classes 1 0 0 3 0 0 0 0 1 0 0 1
2.4% 3.0% 1.8% 0.8% 2.7% 0.0% 3.8% 0.0% 2.6%2 3 3 1 3 0 2 0 1
0.0%0
0.0% 0.0% 0.0% 33.3% 0.0% 0.0% 0.0% 0.0%0 0 0 1 0 0 0 0
0.0% 0.0% 0.0% 1.2% 0.0% 0.0% 0.0% 0.0% 0.0% 0.0% 0.0% 0.0%0 0 0 1 0 0 0 0 0 0 0 0
0.0%0
0.0%0
0.0% 0.0% 0.0% 25.0% 0.0% 0.0% 0.0% 0.0% 0.0% 0.0% 0.0% 0.0%0 0 0 1 0 0 0 0 0 0 0 0
2.9%1
3.7%1
6. At Least Pencillin G and 0.0% 0.0% 0.0% 0.0% 0.0% 4.6% 0.0% 0.0% 0.0% 0.0% 0.0% 6.7% High Level Gentamicin 0 0 0 0 0 1 0 0 0 0 0 1
3.6% 1.0% 1.2% 0.8% 0.9% 0.0% 0.0% 1.8% 2.6%3 1 2 1 1 0 0 1 1
0.0%0
0.0% 0.0% 0.0% 33.3% 0.0% 0.0% 0.0% 0.0%0 0 0 1 0 0 0 0
0.0% 0.0% 0.0% 0.0% 0.0% 0.0% 0.0% 0.0% 0.0% 0.0% 0.0% 0.0%0 0 0 0 0 0 0 0 0 0 0 0
0.0%0
0.0%0
0.0% 0.0% 0.0% 0.0% 0.0% 0.0% 0.0% 0.0% 0.0% 0.0% 0.0% 0.0%0 0 0 0 0 0 0 0 0 0 0 0
0.0%0
0.0%0
7. At Least Pencillin G 0.0% 0.0% 0.0% 0.0% 0.0% 0.0% 0.0% 0.0% 0.0% 0.0% 0.0% 0.0% High Level Gentamicin, 0 0 0 0 0 0 0 0 0 0 0 0 and Linezolid Resistant 0.0% 0.0% 0.0% 0.0% 0.0% 0.0% 0.0% 0.0% 0.0%
0 0 0 0 0 0 0 0 00.0%
00.0% 0.0% 0.0% 0.0% 0.0% 0.0% 0.0% 0.0%
0 0 0 0 0 0 0 0
0.0% 0.0% 0.0% 0.0% 0.0% 0.0% 0.0% 0.0% 0.0% 0.0% 0.0% 0.0%0 0 0 0 0 0 0 0 0 0 0 0
0.0%0
0.0%0
0.0% 0.0% 0.0% 0.0% 0.0% 0.0% 0.0% 0.0% 0.0% 0.0% 0.0% 0.0%0 0 0 0 0 0 0 0 0 0 0 0
0.0%0
0.0%0
8. At Least Pencillin G, 0.0% 0.0% 0.0% 0.0% 0.0% 0.0% 0.0% 0.0% 0.0% 0.0% 0.0% 0.0% High Level Gentamicin, 0 0 0 0 0 0 0 0 0 0 0 0 and Tigecycline Resistant 0.0% 0.0% 0.0% 0.0% 0.0% 0.0% 0.0% 0.0% 0.0%
0 0 0 0 0 0 0 0 00.0%
00.0% 0.0% 0.0% 0.0% 0.0% 0.0% 0.0% 0.0%
0 0 0 0 0 0 0 0
0.0% 0.0% 0.0% 0.0% 0.0% 0.0% 0.0% 0.0% 0.0% 0.0% 0.0% 0.0%0 0 0 0 0 0 0 0 0 0 0 0
0.0%0
0.0%0
0.0% 0.0% 0.0% 0.0% 0.0% 0.0% 0.0% 0.0% 0.0% 0.0% 0.0% 0.0%0 0 0 0 0 0 0 0 0 0 0 0
0.0%0
0.0%0
1 In 2012 and 2013, chicken carcass rinsates were not sampled for Enterococcus2 Resistance patterns do not include daptomycin as there are no established CLSI breakpoints
Cat
tle
Retail Ground Beef
Cecal (Beef)
Cecal (Dairy)
Sw
ine
Retail Pork Chops
Cecal (Market Hogs)
Cecal (Sows)
Chi
cken
s Retail Chickens
HACCP
Cecal
Turk
eys Retail Ground Turkey
Cecal
Cat
tle
Retail Ground Beef
Cecal (Beef)
Cecal (Dairy)
Sw
ine
Retail Pork Chops
Cecal (Market Hogs)
Cecal (Sows)
Chi
cken
s Retail Chickens
HACCP
Cecal
Turk
eys Retail Ground Turkey
Cecal
Cat
tle
Retail Ground Beef
Cecal (Beef)
Cecal (Dairy)
Sw
ine
Retail Pork Chops
Cecal (Market Hogs)
Cecal (Sows)
Chi
cken
s Retail Chickens
HACCP
Cecal
Turk
eys Retail Ground Turkey
Cecal
Cat
tle
Retail Ground Beef
Cecal (Beef)
Cecal (Dairy)
Sw
ine
Retail Pork Chops
Cecal (Market Hogs)
Cecal (Sows)
Chi
cken
s
Retail Chickens
HACCP
Cecal
Turk
eys Retail Ground Turkey
Cecal
Table 105b. Resistance Patterns among Enterococcus hirae Isolates, 2002-2013
Chi
cken
sC
attle
Sw
ine
Turk
eys
220
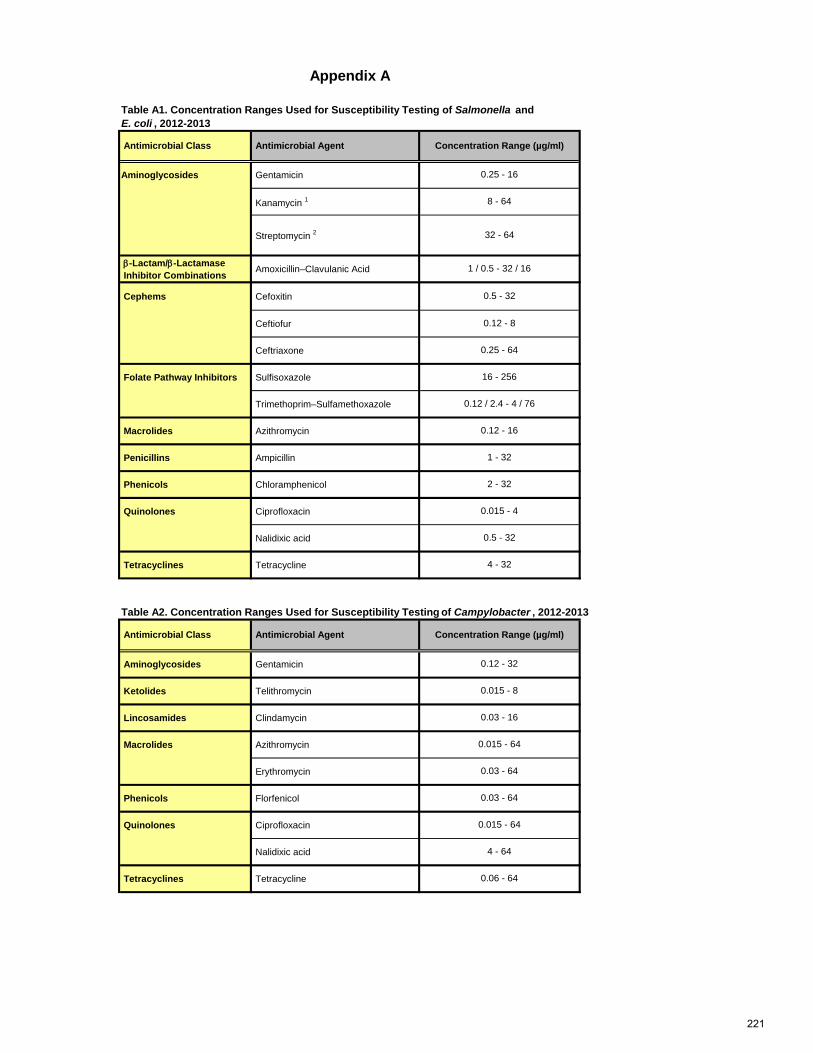
Aminoglycosides Gentamicin
Kanamycin 1
β-Lactam/β-Lactamase Inhibitor Combinations Amoxicillin–Clavulanic Acid
Cephems Cefoxitin
Ceftiofur
Ceftriaxone
Folate Pathway Inhibitors Sulfisoxazole
Trimethoprim–Sulfamethoxazole
Macrolides Azithromycin
Penicillins Ampicillin
Phenicols Chloramphenicol
Quinolones Ciprofloxacin
Nalidixic acid
Tetracyclines Tetracycline
Aminoglycosides Gentamicin
Ketolides Telithromycin
Lincosamides Clindamycin
Macrolides Azithromycin
Erythromycin
Phenicols Florfenicol
Quinolones Ciprofloxacin
Nalidixic acid
Tetracyclines Tetracycline
4 - 64
0.06 - 64
0.03 - 64
0.03 - 64
0.015 - 64
0.015 - 64
0.12 - 32
0.015 - 8
0.03 - 16
0.5 - 32
4 - 32
Table A2. Concentration Ranges Used for Susceptibility Testing of Campylobacter , 2012-2013
Antimicrobial Class Antimicrobial Agent Concentration Range (µg/ml)
0.015 - 4
8 - 64
Streptomycin 2
1 / 0.5 - 32 / 16
0.5 - 32
0.12 - 8
0.25 - 64
16 - 256
0.12 / 2.4 - 4 / 76
0.12 - 16
1 - 32
2 - 32
32 - 64
0.25 - 16
Appendix A
Table A1. Concentration Ranges Used for Susceptibility Testing of Salmonella and E. coli , 2012-2013
Antimicrobial Class Antimicrobial Agent Concentration Range (µg/ml)
221
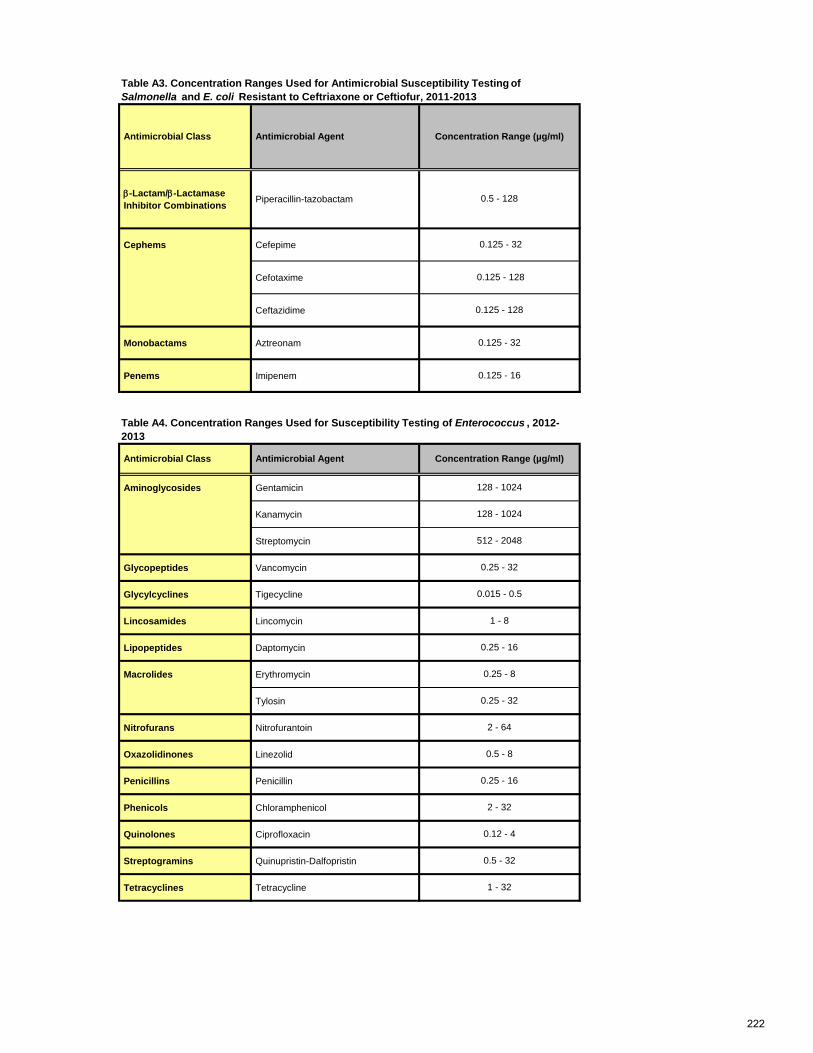
β-Lactam/β-Lactamase Inhibitor Combinations Piperacillin-tazobactam
Cephems Cefepime
Cefotaxime
Ceftazidime
Monobactams Aztreonam
Penems Imipenem
Aminoglycosides Gentamicin
Kanamycin
Streptomycin
Glycopeptides Vancomycin
Glycylcyclines Tigecycline
Lincosamides Lincomycin
Lipopeptides Daptomycin
Macrolides Erythromycin
Tylosin
Nitrofurans Nitrofurantoin
Oxazolidinones Linezolid
Penicillins Penicillin
Phenicols Chloramphenicol
Quinolones Ciprofloxacin
Streptogramins Quinupristin-Dalfopristin
Tetracyclines Tetracycline
2 - 32
0.12 - 4
0.5 - 32
1 - 32
0.25 - 16
0.25 - 8
0.25 - 32
2 - 64
0.5 - 8
0.25 - 16
1 - 8
0.125 - 128
0.125 - 128
0.125 - 32
0.125 - 16
Table A4. Concentration Ranges Used for Susceptibility Testing of Enterococcus , 2012-2013
Antimicrobial Class Antimicrobial Agent Concentration Range (µg/ml)
128 - 1024
128 - 1024
512 - 2048
0.25 - 32
0.015 - 0.5
0.125 - 32
Table A3. Concentration Ranges Used for Antimicrobial Susceptibility Testing of Salmonella and E. coli Resistant to Ceftriaxone or Ceftiofur, 2011-2013
Antimicrobial Class Antimicrobial Agent Concentration Range (µg/ml)
0.5 - 128
222
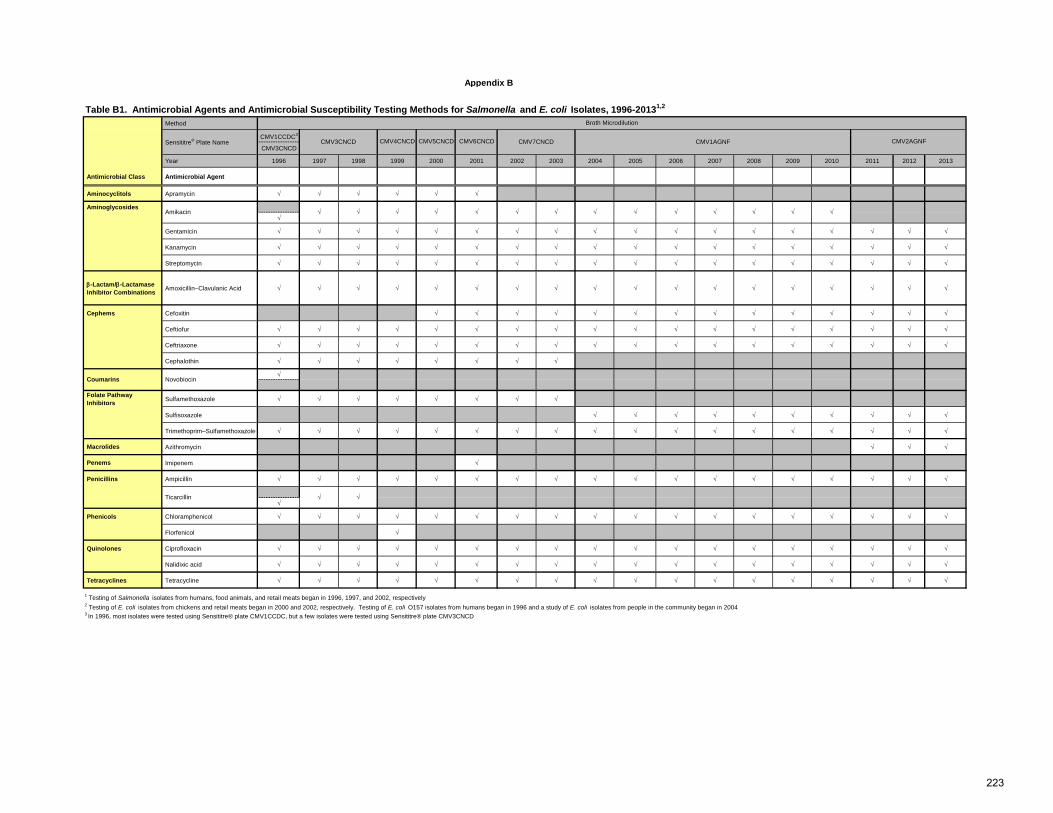
Table B1. Antimicrobial Agents and Antimicrobial Susceptibility Testing Methods for Salmonella and E. coli Isolates, 1996-20131,2
Method
CMV1CCDC3
CMV3CNCD
Year 1996 1997 1998 1999 2000 2001 2002 2003 2004 2005 2006 2007 2008 2009 2010 2011 2012 2013
Antimicrobial Class Antimicrobial Agent
Aminocyclitols Apramycin √ √ √ √ √ √
Aminoglycosides√
Gentamicin √ √ √ √ √ √ √ √ √ √ √ √ √ √ √ √ √ √
Kanamycin √ √ √ √ √ √ √ √ √ √ √ √ √ √ √ √ √ √
Streptomycin √ √ √ √ √ √ √ √ √ √ √ √ √ √ √ √ √ √
β-Lactam/β-Lactamase Inhibitor Combinations Amoxicillin–Clavulanic Acid √ √ √ √ √ √ √ √ √ √ √ √ √ √ √ √ √ √
Cephems Cefoxitin √ √ √ √ √ √ √ √ √ √ √ √ √ √
Ceftiofur √ √ √ √ √ √ √ √ √ √ √ √ √ √ √ √ √ √
Ceftriaxone √ √ √ √ √ √ √ √ √ √ √ √ √ √ √ √ √ √
Cephalothin √ √ √ √ √ √ √ √
√
Folate Pathway Inhibitors Sulfamethoxazole √ √ √ √ √ √ √ √
Sulfisoxazole √ √ √ √ √ √ √ √ √ √
Trimethoprim–Sulfamethoxazole √ √ √ √ √ √ √ √ √ √ √ √ √ √ √ √ √ √
Macrolides Azithromycin √ √ √
Penems Imipenem √
Penicillins Ampicillin √ √ √ √ √ √ √ √ √ √ √ √ √ √ √ √ √ √
√
Phenicols Chloramphenicol √ √ √ √ √ √ √ √ √ √ √ √ √ √ √ √ √ √
Florfenicol √
Quinolones Ciprofloxacin √ √ √ √ √ √ √ √ √ √ √ √ √ √ √ √ √ √
Nalidixic acid √ √ √ √ √ √ √ √ √ √ √ √ √ √ √ √ √ √
Tetracyclines Tetracycline √ √ √ √ √ √ √ √ √ √ √ √ √ √ √ √ √ √
CMV2AGNF
1 Testing of Salmonella isolates from humans, food animals, and retail meats began in 1996, 1997, and 2002, respectively2 Testing of E. coli isolates from chickens and retail meats began in 2000 and 2002, respectively. Testing of E. coli O157 isolates from humans began in 1996 and a study of E. coli isolates from people in the community began in 20043 In 1996, most isolates were tested using Sensititre® plate CMV1CCDC, but a few isolates were tested using Sensititre® plate CMV3CNCD
Coumarins Novobiocin
Ticarcillin √
√ √ Amikacin √
Appendix B
Broth Microdilution
Sensititre® Plate Name CMV3CNCD CMV4CNCD CMV5CNCD CMV6CNCD CMV7CNCD CMV1AGNF
√√ √√ √ √ √ √ √ √ √
√
223
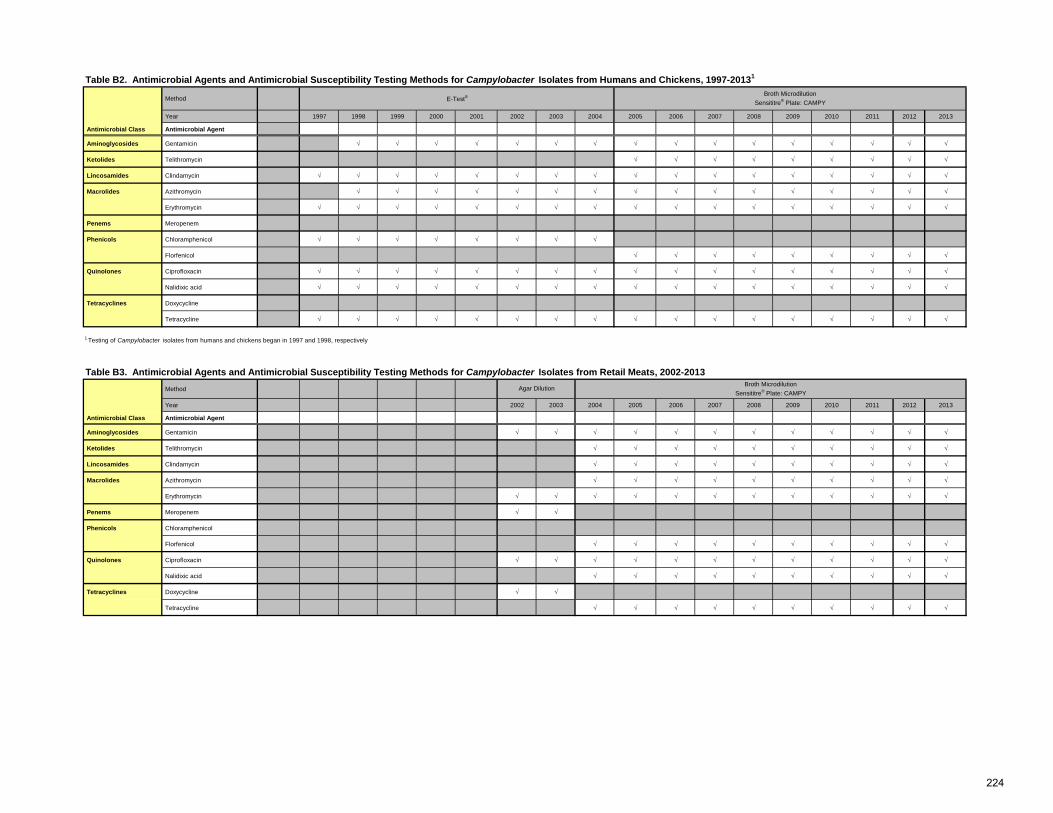
Table B2. Antimicrobial Agents and Antimicrobial Susceptibility Testing Methods for Campylobacter Isolates from Humans and Chickens, 1997-20131
Method
Year 1997 1998 1999 2000 2001 2002 2003 2004 2005 2006 2007 2008 2009 2010 2011 2012 2013
Antimicrobial Class Antimicrobial Agent
Aminoglycosides Gentamicin √ √ √ √ √ √ √ √ √ √ √ √ √ √ √ √
Ketolides Telithromycin √ √ √ √ √ √ √ √ √
Lincosamides Clindamycin √ √ √ √ √ √ √ √ √ √ √ √ √ √ √ √ √
Macrolides Azithromycin √ √ √ √ √ √ √ √ √ √ √ √ √ √ √ √
Erythromycin √ √ √ √ √ √ √ √ √ √ √ √ √ √ √ √ √
Penems Meropenem
Phenicols Chloramphenicol √ √ √ √ √ √ √ √
Florfenicol √ √ √ √ √ √ √ √ √
Quinolones Ciprofloxacin √ √ √ √ √ √ √ √ √ √ √ √ √ √ √ √ √
Nalidixic acid √ √ √ √ √ √ √ √ √ √ √ √ √ √ √ √ √
Tetracyclines Doxycycline
Tetracycline √ √ √ √ √ √ √ √ √ √ √ √ √ √ √ √ √
Table B3. Antimicrobial Agents and Antimicrobial Susceptibility Testing Methods for Campylobacter Isolates from Retail Meats, 2002-2013 Method
Year 2002 2003 2004 2005 2006 2007 2008 2009 2010 2011 2012 2013
Antimicrobial Class Antimicrobial Agent
Aminoglycosides Gentamicin √ √ √ √ √ √ √ √ √ √ √ √
Ketolides Telithromycin √ √ √ √ √ √ √ √ √ √
Lincosamides Clindamycin √ √ √ √ √ √ √ √ √ √
Macrolides Azithromycin √ √ √ √ √ √ √ √ √ √
Erythromycin √ √ √ √ √ √ √ √ √ √ √ √
Penems Meropenem √ √
Phenicols Chloramphenicol
Florfenicol √ √ √ √ √ √ √ √ √ √
Quinolones Ciprofloxacin √ √ √ √ √ √ √ √ √ √ √ √
Nalidixic acid √ √ √ √ √ √ √ √ √ √
Tetracyclines Doxycycline √ √
Tetracycline √ √ √ √ √ √ √ √ √ √
E-Test®Broth Microdilution
Sensititre® Plate: CAMPY
1 Testing of Campylobacter isolates from humans and chickens began in 1997 and 1998, respectively
Agar DilutionBroth Microdilution
Sensititre® Plate: CAMPY
224
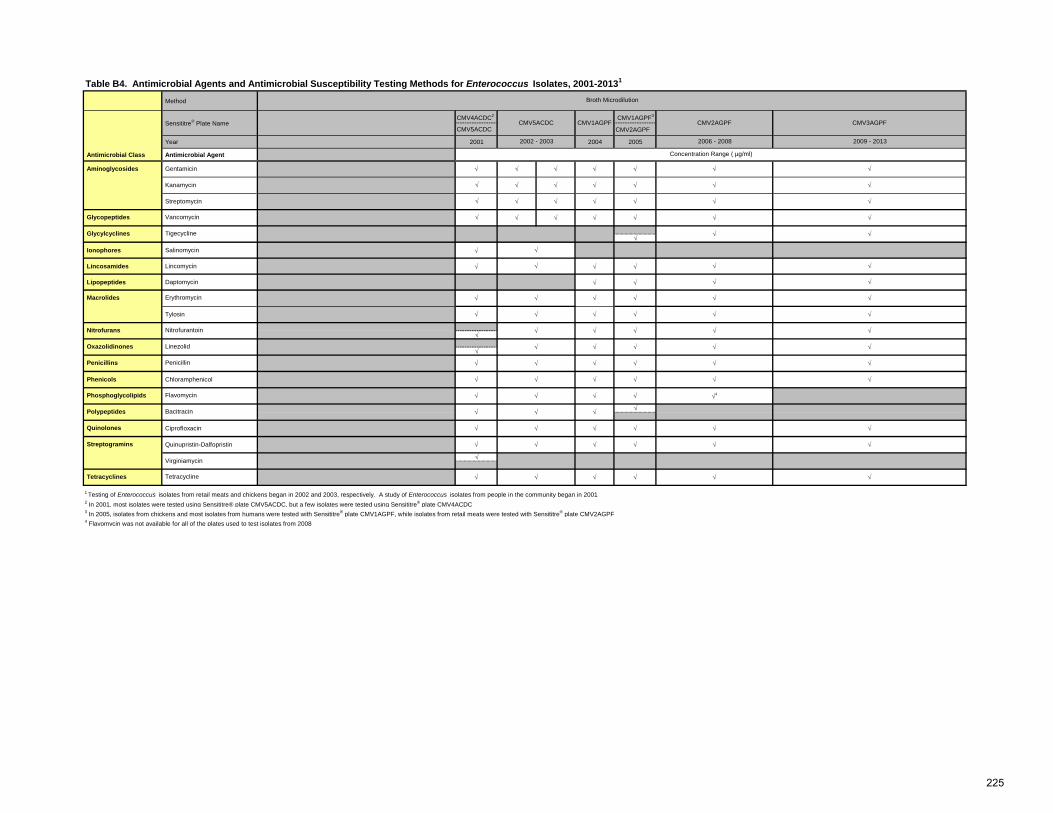
Table B4. Antimicrobial Agents and Antimicrobial Susceptibility Testing Methods for Enterococcus Isolates, 2001-20131
Method
CMV4ACDC2 CMV1AGPF3
CMV5ACDC CMV2AGPF
Year 2001 2004 2005
Antimicrobial Class Antimicrobial Agent
√
Ionophores Salinomycin √
Lincosamides Lincomycin √ √ √
Lipopeptides Daptomycin √ √
√
√
√
√
1 Testing of Enterococcus isolates from retail meats and chickens began in 2002 and 2003, respectively. A study of Enterococcus isolates from people in the community began in 20012 In 2001, most isolates were tested using Sensititre® plate CMV5ACDC, but a few isolates were tested using Sensititre® plate CMV4ACDC3 In 2005, isolates from chickens and most isolates from humans were tested with Sensititre® plate CMV1AGPF, while isolates from retail meats were tested with Sensititre® plate CMV2AGPF4 Flavomycin was not available for all of the plates used to test isolates from 2008
Broth Microdilution
CMV3AGPF
Aminoglycosides
Sensititre® Plate Name CMV5ACDC CMV1AGPF CMV2AGPF
Gentamicin
Glycylcyclines Tigecycline √
√ √ √ √ Glycopeptides Vancomycin √ √
√
Streptomycin √ √ √
√
√ √ √
Kanamycin √
Macrolides Erythromycin √ √ √ √
√
√ √
Nitrofurans Nitrofurantoin √ √ √ √
√ √
√
Tylosin √ √ √ √
√
Phenicols Chloramphenicol √ √ √
√
Penicillins Penicillin √ √ √ √√
√
√
Oxazolidinones Linezolid √ √ √
√
Phosphoglycolipids Flavomycin √ √ √4
√
√ √
√
√
√
Polypeptides Bacitracin √ √
√
√
Streptogramins Quinupristin-Dalfopristin √ √ √
Quinolones Ciprofloxacin √ √ √ √
√
Virginiamycin
Tetracyclines Tetracycline √ √ √ √
√
√
√
√
√
2009 - 2013
Concentration Range ( µg/ml)
√
√
√
√
√ √
√
√
2002 - 2003 2006 - 2008
√ √ √√ √ √
√ √
225
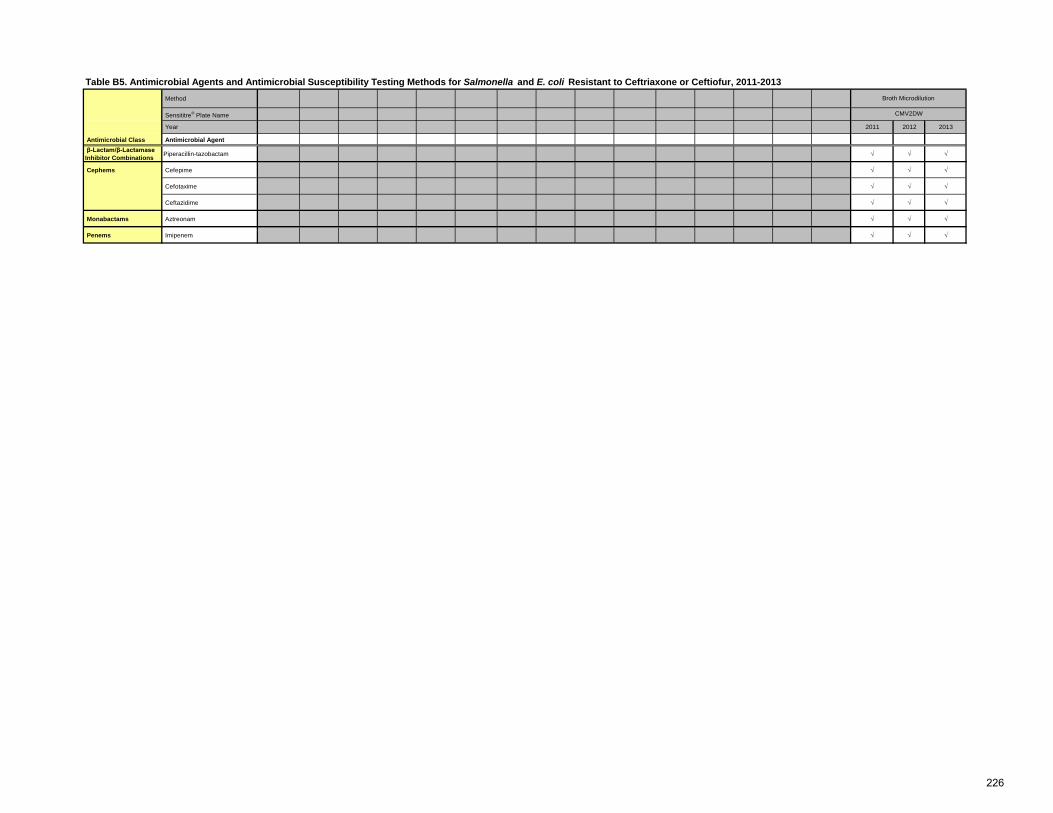
Table B5. Antimicrobial Agents and Antimicrobial Susceptibility Testing Methods for Salmonella and E. coli Resistant to Ceftriaxone or Ceftiofur, 2011-2013 Method
Sensititre® Plate Name
Year 2011 2012 2013
Antimicrobial Class Antimicrobial Agent β-Lactam/β-Lactamase Inhibitor Combinations Piperacillin-tazobactam √ √ √
Cephems Cefepime √ √ √
Cefotaxime √ √ √
Ceftazidime √ √ √
Monabactams Aztreonam √ √ √
Penems Imipenem √ √ √
Broth Microdilution
CMV2DW
226


![UYA 4Y Ultra-Microbalances MYA 4Y Microbalances · UYA 2.4Y MYA 0.8/3.4Y MYA 2.4Y Maximum capacity [Max] 2.1 g 0.8 g / 3 g 2.1 g Minimum load 10 µg 100 µg 100 µg Readability [d]](https://static.fdocument.org/doc/165x107/6026b6e4098ca867535c4ce8/uya-4y-ultra-microbalances-mya-4y-microbalances-uya-24y-mya-0834y-mya-24y-maximum.jpg)