γλώσσες
Σελίδες
Νομικός

Upregulation of the mTOR Complex 1 Pathway by Rheb in Pancreatic β Cells Leads to Increased β Cell Mass and Prevention of Hyperglycemia
Suirin Hamada1 M.D., Kenta Hara1 M.D., Ph.D., Takeshi Hamada1, Hisafumi Yasuda1 M.D., Ph.D., Hiroaki Moriyama1 M.D., Ph.D., Rika Nakayama2 M.S., Masao Nagata1 M.D., Ph.D., and
Koichi Yokono1 M.D., Ph.D.
From the 1 Department of Internal and Geriatric Medicine, Kobe University Graduate School of Medicine, Kobe, Japan; 2 Laboratory for Animal Resources and Genetic Engineering, Center for
Developmental Biology (CDB), RIKEN, Kobe, Japan.
Address correspondence and reprint requests to: Kenta Hara M.D., Ph.D.,
Department of Internal and Geriatric Medicine, Kobe University Graduate School of Medicine,
7-5-1, Kusunoki-cho, Chuo-ku, Kobe, 650-0017, Japan. E-mail:[email protected]
Submitted 18 April 2008 and accepted 25 February 2009.
This is an uncopyedited electronic version of an article accepted for publication in Diabetes. The American Diabetes Association, publisher of Diabetes, is not responsible for any errors or omissions in this version of the manuscript or any version derived from it by third parties. The definitive publisher-authenticated version will be available in a future issue of Diabetes in print and online at http://diabetes.diabetesjournals.org.
Diabetes Publish Ahead of Print, published online March 3, 2009
Copyright American Diabetes Association, Inc., 2009
Regulation of Pancreatic β Cell Mass by the mTOR Complex 1 Pathway In Vivo
2
ABSTRACT
Objective - Components of insulin/IGF1 receptor-mediated signaling pathways in pancreatic β cells have been implicated in the development of diabetes mellitus, in part through the regulation of β cell mass in vivo. Studies in vitro have shown that Rheb plays a key role as a positive upstream regulator of the mTOR complex 1 (mTORC1) pathway in integrating inputs from nutrients and growth factors for cell growth. Our objective was to investigate the role of the mTORC1 pathway in the regulation of β cell mass in vivo. Research Design and Methods - We generated transgenic mice that overexpress Rheb in β cells. We examined the activation of the mTORC1 pathway and its effects on β cell mass, on glucose metabolism and on protection against hyperglycemia. Results - Immunoblots of islet extracts revealed that the phosphorylation levels of ribosomal protein S6 and eukaryotic initiation factor 4E binding protein 1, downstream effectors for mTORC1, were upregulated in transgenic β cells. Immunostaining of the pancreatic sections with anti-phospho-S6 antibody confirmed upregulation of the mTORC1 pathway in β cells in vivo. The mice showed improved glucose tolerance with higher insulin secretion. This arose from increased β cell mass accompanied by increased cell size. The mice also exhibited resistance to hyperglycemia induced by streptozotocin and obesity. Conclusions - Activation of the mTORC1 pathway by Rheb led to increased β cell mass in this mouse model without producing obvious unfavorable effects, giving a potential approach for the treatment of β cell failure and diabetes mellitus.
Regulation of Pancreatic β Cell Mass by the mTOR Complex 1 Pathway In Vivo
3
iabetes mellitus arises from the relative failure of β cells to secrete sufficient insulin to maintain normal
metabolism (1). Under insulin-resistant conditions such as obesity, blood glucose levels are maintained within a normal range if the β cells can compensate for the increased demand. This compensatory mechanism is acquired by an increase in β cell mass through augmentation of islet neogenesis and replication, by hypertrophy, and by a reduction in the rate of β cell death (2).
A number of studies have indicated that insulin and IGF1 receptor-mediated signaling pathways are involved in the regulation of β cell mass (3–11). Activation of the insulin or IGF1 receptors induces tyrosine phosphorylation of insulin receptor substrates (IRSs), which recruit several signal intermediates including phosphoinositide-3 kinase (PI3-K). PI3-K phosphorylates inositol phospholipids, which then activates 3′-phosphoinositide-dependent kinase 1 (PDK1). PDK1 directly phosphorylates and activates p70 S6 kinase and protein kinase B (PKB) synergistically with mTOR (12–14). Ribosomal protein S6 and transcription factor FoxO1, substrates of p70 S6 kinase (p70S6K) and PKB, respectively, are also implicated in this process (15–17).
The Ser/Thr protein kinase mTOR signals through two physically distinct multiprotein complexes called mTOR complexes 1 and 2 (mTORC1 and mTORC2) (12). mTORC1 contains the polypeptides raptor and mLST8 and the ability of raptor to present its substrates properly to the mTOR catalytic domain is essential for the regulation of the translational regulators, eukaryotic initiation factor 4E binding protein 1 (4EBP1) and p70S6K (18, 19). The proximal regulator of mTORC1 is the ras-like small GTPase Rheb (20, 21). Rheb binds directly to the mTOR catalytic domain and activates it in a manner dependent on the state of Rheb nucleotide
charging (22). Insulin or IGF1 enhances Rheb GTP charging via inhibition of the GTPase activating (GAP) function of the product of the tuberous sclerosis (TSC) genes, the TSC1–TSC2 heterodimer (23–31). The mTORC1 pathway is also regulated by nutrients (32). Whereas amino acid depletion interferes with the ability of Rheb to enable mTORC1 to attain an active configuration, glucose depletion reduces Rheb-GTP charging through the ability of the AMP-activated kinase (AMPK) to phosphorylate TSC2 and to direct its GAP activity toward Rheb (33, 34). FKBP38 is also an endogenous inhibitor of mTOR, whose inhibitory activity is antagonized by Rheb in response to growth factors and nutrient availability (35).
To investigate the metabolic role of the mTOR signaling pathway in a mammalian model, we created transgenic mice with an overproduction of Rheb in pancreatic β cells. These mice exhibited increased insulin secretion in response to glucose loading and resistance to streptozotocin- and obesity-induced hyperglycemia, which were accompanied by an increased β cell mass.
RESEARCH DESIGN AND METHODS Animals and genotyping. A wild type human Rheb gene tagged with a FLAG sequence at the N-terminus was introduced downstream of the rat insulin promoter. The transgene was microinjected into pronuclei of C57BL/6N zygotes.
Mice carrying the lethal yellow agouti (Ay) mutation were generated by breeding R3 transgenic mice with KK-Ay strain mice. The obtained F1 littermates carrying the Ay mutation with or without a FLAG-Rheb transgene on C57BL/6 and a KK hybrid background (designated Ay/Rheb and Ay) were analyzed. This study was performed according to the guidelines of the Animal
D
Regulation of Pancreatic β Cell Mass by the mTOR Complex 1 Pathway In Vivo
4
Ethics Committee of Kobe University Graduate School of Medicine. Islet preparation and immunoblot analysis. Islets were isolated by collagenase digestion followed by centrifugation over Histopaque medium (Sigma-Aldrich, St Louis, MO). Cultured islets were extracted in buffer A (20 mM Tris-HCl pH 7.4, 120 mM NaCl, 1 mM EDTA, 5 mM EGTA, 50 mM β-glycerophosphate, 50 mM NaF, 0.3% CHAPS, 1 mM DTT, 4 µg/mL leupeptin, 4 µg/mL aprotinin) and the supernatants were analyzed by immunoblotting with the indicated antibodies. The following antibodies were purchased from Cell Signaling Technologies (Beverly, MA); anti-phospho-S6 ribosomal protein (Ser235/236), anti-S6 ribosomal protein, anti-phospho-4EBP1 (Thr37/46), anti-phospho-4EBP1 (Thr70), anti-phospho-p70 S6 kinase (Thr389), anti-PKB, anti-phospho-PKB (Ser473), anti-phospho-p44/42 MAP kinase (Thr202/Tyr204) and anti-p44/42 MAP kinase. Anti-IRS2 antibody was purchased from upstate (Temecula, CA). Anti-Rheb antibody was kindly provided by N. Oshiro (Biosignal Research Center, Kobe University, Japan). Glucose tolerance testing and insulin tolerance testing. Mice were deprived of food for 16 h and blood was collected from the tail vein after an oral injection (2 g/kg) or intraperitoneal injection (3 g/kg) of glucose. For insulin tolerance testing, mice fed ad libitum were injected with 0.75 U/kg body weight of human regular insulin. Immunohistochemical and morphometric analysis of islets. Immunostaining for insulin and glucagon was performed using guinea pig antibodies against insulin and rabbit antibodies against glucagon (DACO Japan, Kyoto, Japan). The immune complexes were detected with secondary antibodies conjugated with Cy3 or FITC, respectively (Jackson ImmunoResearch Laboratories Inc.,
West Grove, PA). For immunostaining of FLAG, phosphorylated S6 or Ki-67, following antigen retrieval by autoclave at 121 °C for 15 min in 10 mM Sodium Citrate (pH6.0) and quenching of endogenous peroxidase with 3% H2O2 for 10 min, the sections were incubated with the anti-FLAG antibody (DYKDDDDK Tag antibody, Cell Signaling), anti-phospho-S6 ribosomal protein (Ser235/236) or anti-Ki-67 antibody (DAKO Japan). Immunocomplexes were detected with a secondary antibody conjugated with horseradish peroxidase followed by incubation in DAB peroxidase substrate solution. The immunostained sections were counterstained with hematoxylin. For quantification of β cell and α cell area, images of β cells or α cells and of the entire pancreas were obtained using a digital camera (BZ-8000, Keyence Co., Osaka, Japan) and analyzed using WinROOF software (Mitani Corp., Fukui, Japan). The percentage of β cell or α cell area was calculated as the area of all insulin- or glucagon- positive cells based on the total pancreatic area surveyed. The β cell mass was calculated by the percentage of β cell area and pancreas weight. The relative β cell size was calculated by dividing the β cell area by the number of β cell nuclei in the insulin-stained sections. Apoptotic β cells ware analyzed by immunostaining of insulin and TUNEL assay using an ApopTag Fluorescein In Situ Apoptosis Detection Kit (CHEMICON International, Inc. CA) according to the manufacture’s protocol. Streptozotocin treatment. Eight-week-old transgenic mice and wild type littermates were injected intraperitoneally for five consecutive days with streptozotocin (40 mg/kg or 50 mg/kg) dissolved just before injection in 0.1 M citrate buffer. Rapamycin treatment. Mice were injected intraperitoneally with rapamycin (2 mg/kg) dissolved in 0.2% sodium carboxymethylcellulose and 0.25% Tween 80
Regulation of Pancreatic β Cell Mass by the mTOR Complex 1 Pathway In Vivo
5
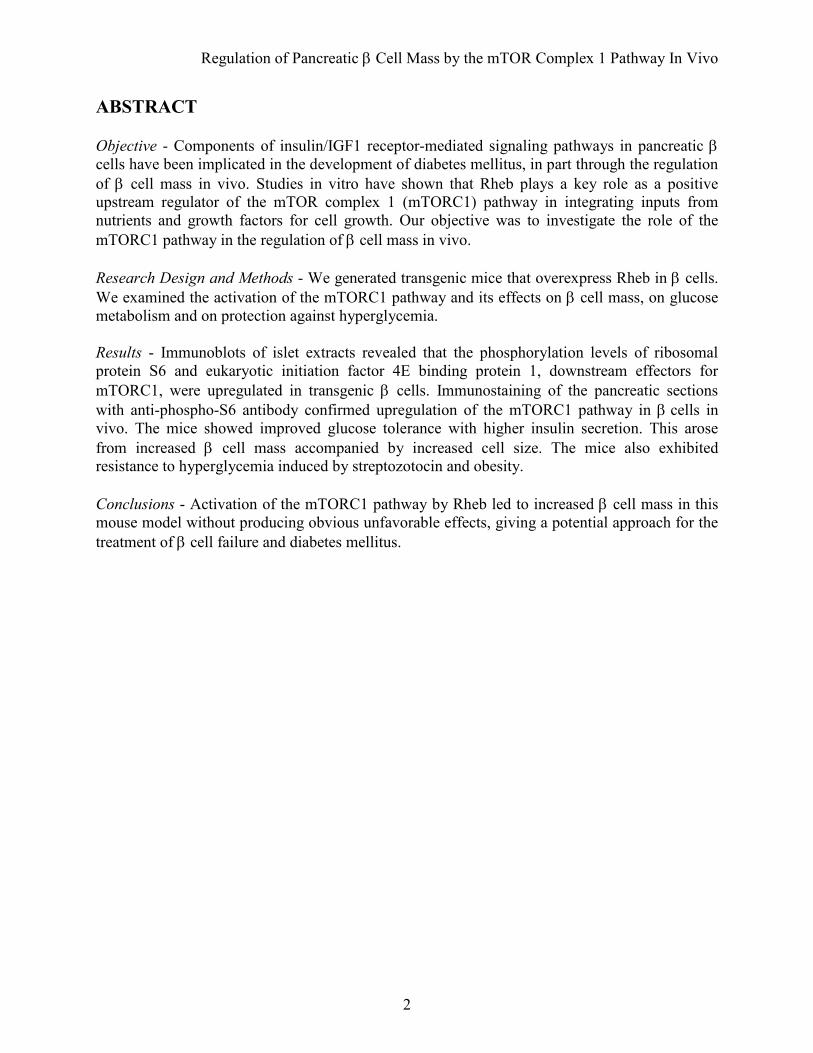
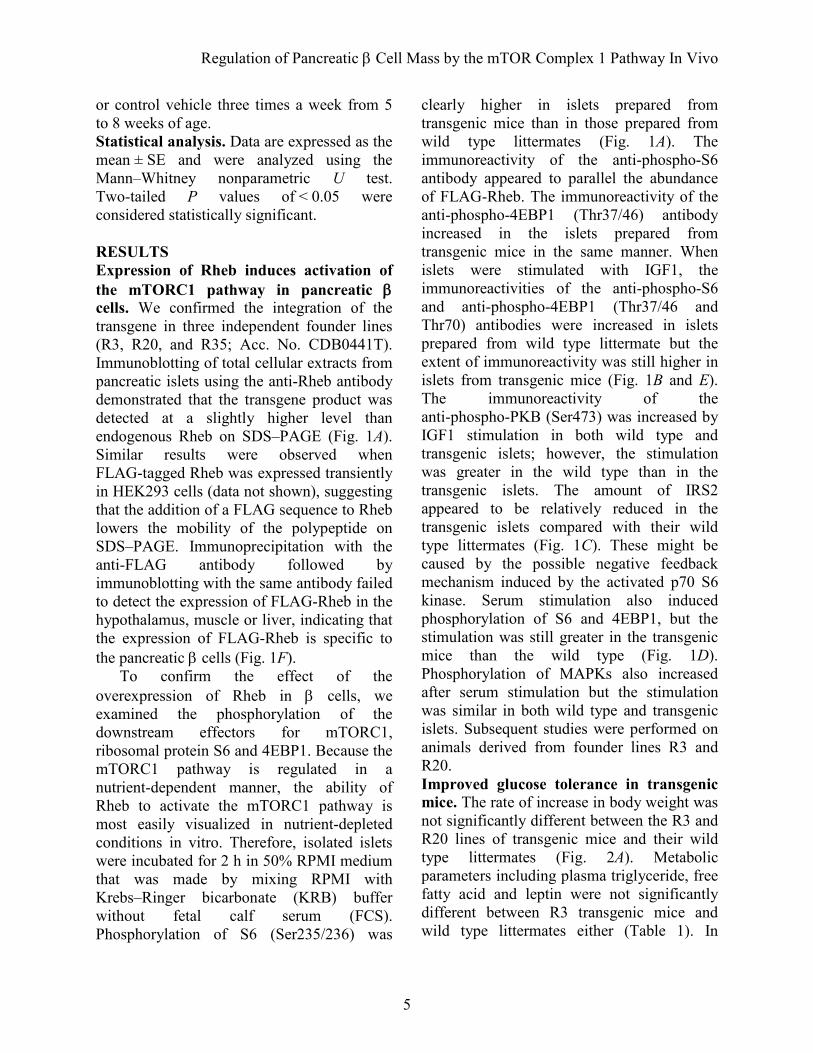
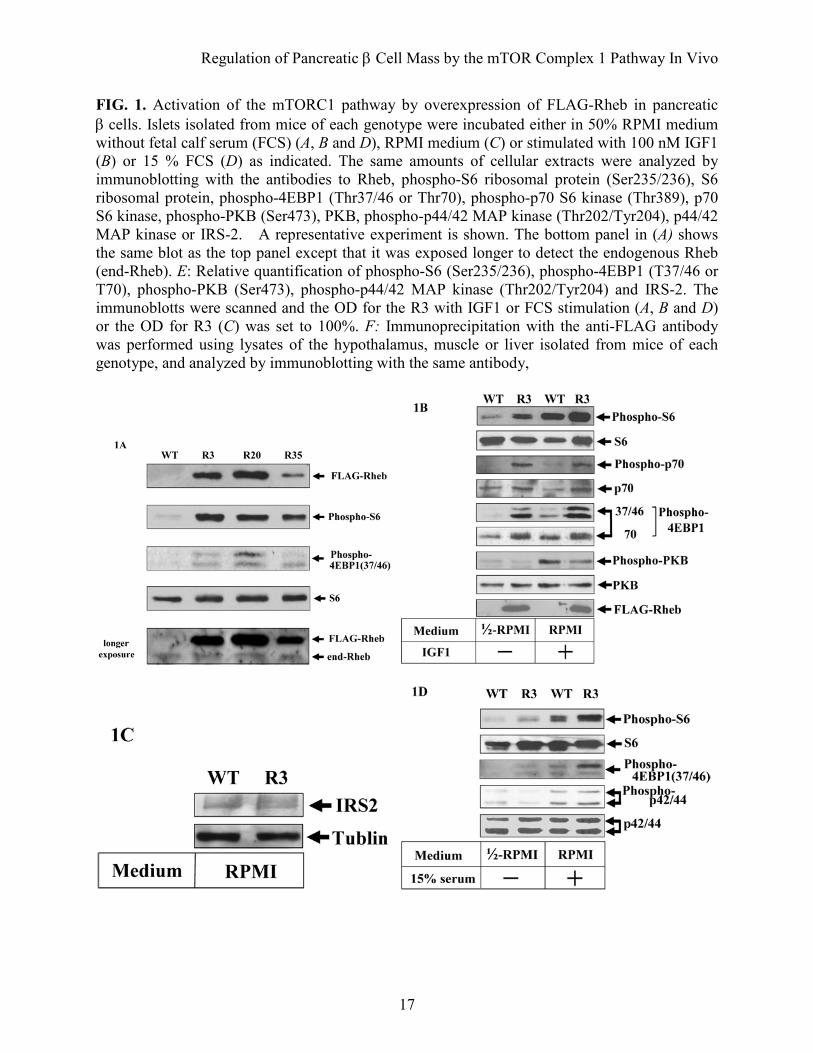
or control vehicle three times a week from 5 to 8 weeks of age. Statistical analysis. Data are expressed as the mean ± SE and were analyzed using the Mann–Whitney nonparametric U test. Two-tailed P values of < 0.05 were considered statistically significant. RESULTS Expression of Rheb induces activation of the mTORC1 pathway in pancreatic β cells. We confirmed the integration of the transgene in three independent founder lines (R3, R20, and R35; Acc. No. CDB0441T). Immunoblotting of total cellular extracts from pancreatic islets using the anti-Rheb antibody demonstrated that the transgene product was detected at a slightly higher level than endogenous Rheb on SDS–PAGE (Fig. 1A). Similar results were observed when FLAG-tagged Rheb was expressed transiently in HEK293 cells (data not shown), suggesting that the addition of a FLAG sequence to Rheb lowers the mobility of the polypeptide on SDS–PAGE. Immunoprecipitation with the anti-FLAG antibody followed by immunoblotting with the same antibody failed to detect the expression of FLAG-Rheb in the hypothalamus, muscle or liver, indicating that the expression of FLAG-Rheb is specific to the pancreatic β cells (Fig. 1F).
To confirm the effect of the overexpression of Rheb in β cells, we examined the phosphorylation of the downstream effectors for mTORC1, ribosomal protein S6 and 4EBP1. Because the mTORC1 pathway is regulated in a nutrient-dependent manner, the ability of Rheb to activate the mTORC1 pathway is most easily visualized in nutrient-depleted conditions in vitro. Therefore, isolated islets were incubated for 2 h in 50% RPMI medium that was made by mixing RPMI with Krebs–Ringer bicarbonate (KRB) buffer without fetal calf serum (FCS). Phosphorylation of S6 (Ser235/236) was
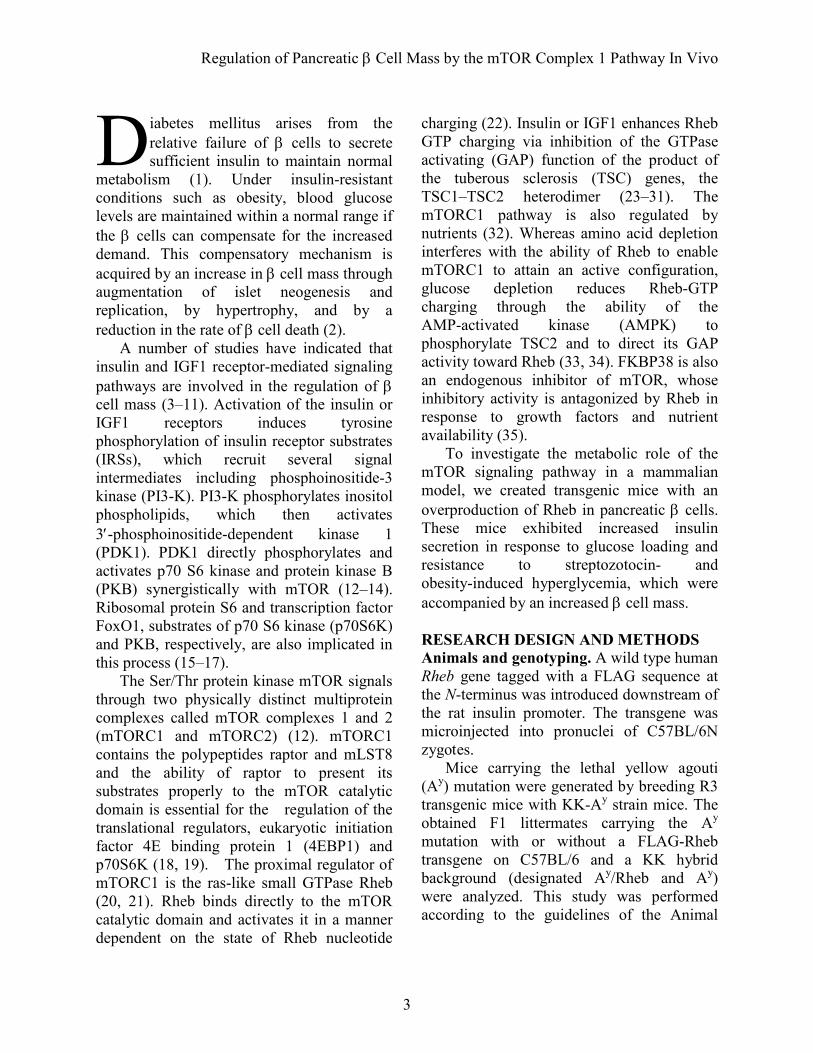
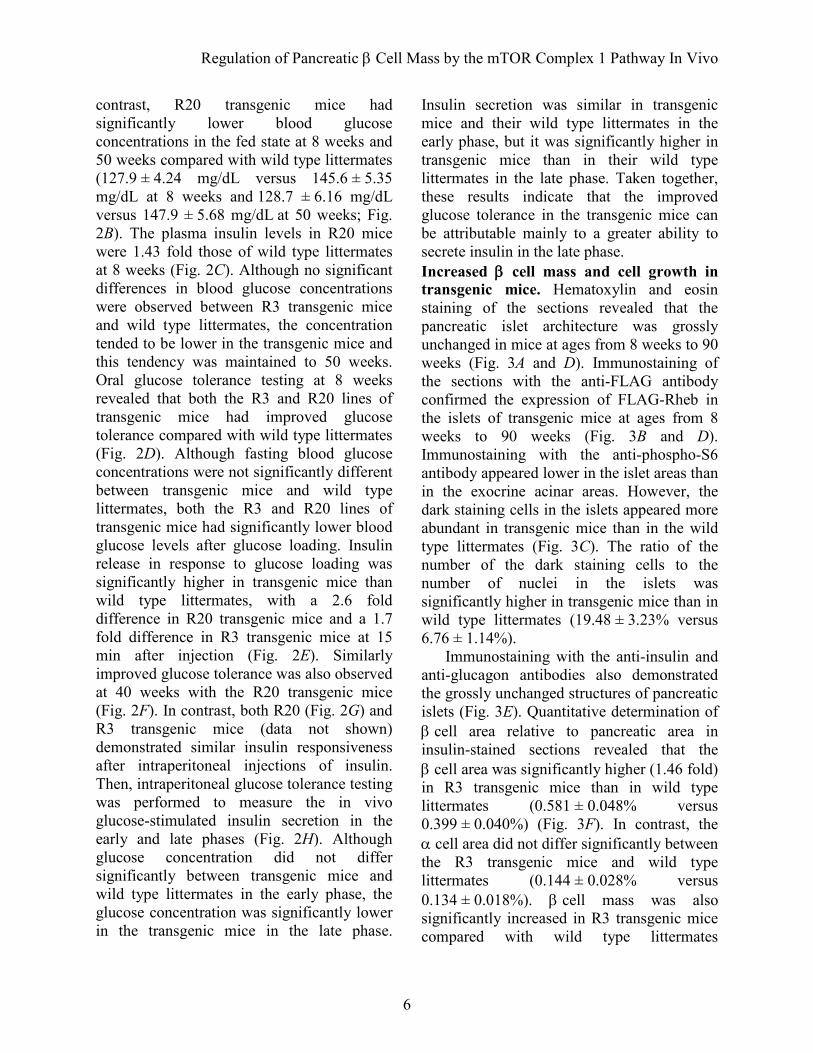
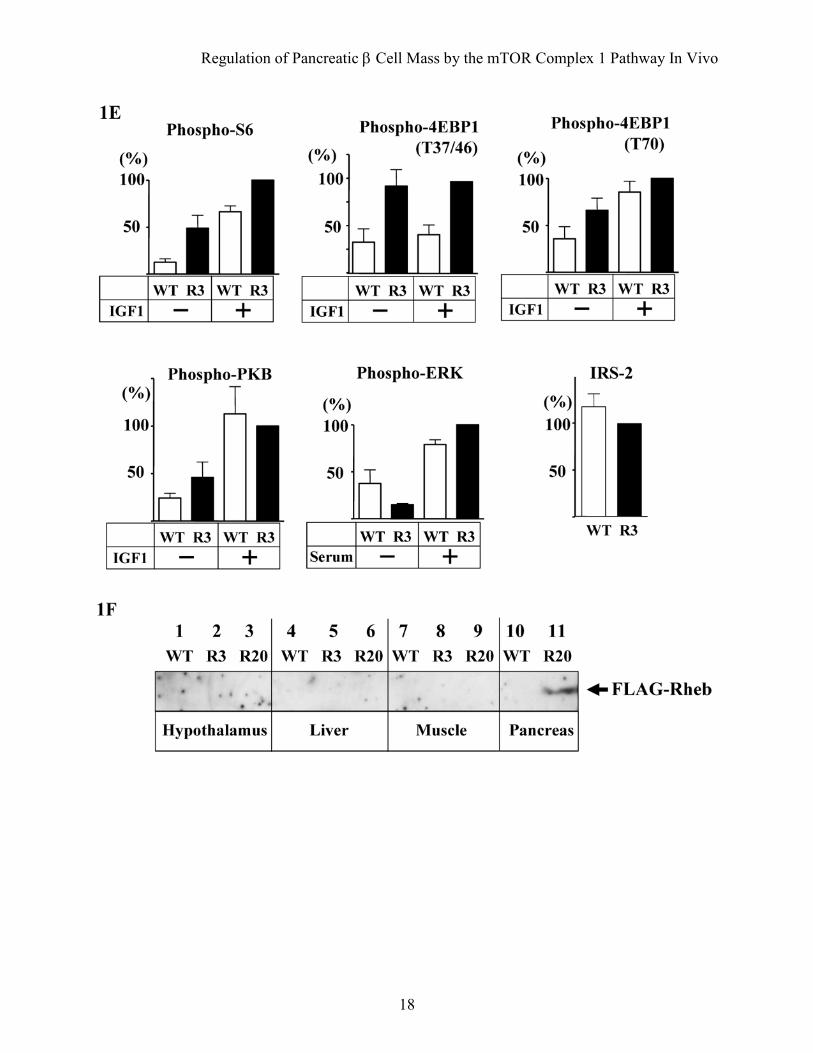
clearly higher in islets prepared from transgenic mice than in those prepared from wild type littermates (Fig. 1A). The immunoreactivity of the anti-phospho-S6 antibody appeared to parallel the abundance of FLAG-Rheb. The immunoreactivity of the anti-phospho-4EBP1 (Thr37/46) antibody increased in the islets prepared from transgenic mice in the same manner. When islets were stimulated with IGF1, the immunoreactivities of the anti-phospho-S6 and anti-phospho-4EBP1 (Thr37/46 and Thr70) antibodies were increased in islets prepared from wild type littermate but the extent of immunoreactivity was still higher in islets from transgenic mice (Fig. 1B and E). The immunoreactivity of the anti-phospho-PKB (Ser473) was increased by IGF1 stimulation in both wild type and transgenic islets; however, the stimulation was greater in the wild type than in the transgenic islets. The amount of IRS2 appeared to be relatively reduced in the transgenic islets compared with their wild type littermates (Fig. 1C). These might be caused by the possible negative feedback mechanism induced by the activated p70 S6 kinase. Serum stimulation also induced phosphorylation of S6 and 4EBP1, but the stimulation was still greater in the transgenic mice than the wild type (Fig. 1D). Phosphorylation of MAPKs also increased after serum stimulation but the stimulation was similar in both wild type and transgenic islets. Subsequent studies were performed on animals derived from founder lines R3 and R20. Improved glucose tolerance in transgenic mice. The rate of increase in body weight was not significantly different between the R3 and R20 lines of transgenic mice and their wild type littermates (Fig. 2A). Metabolic parameters including plasma triglyceride, free fatty acid and leptin were not significantly different between R3 transgenic mice and wild type littermates either (Table 1). In
Regulation of Pancreatic β Cell Mass by the mTOR Complex 1 Pathway In Vivo
6
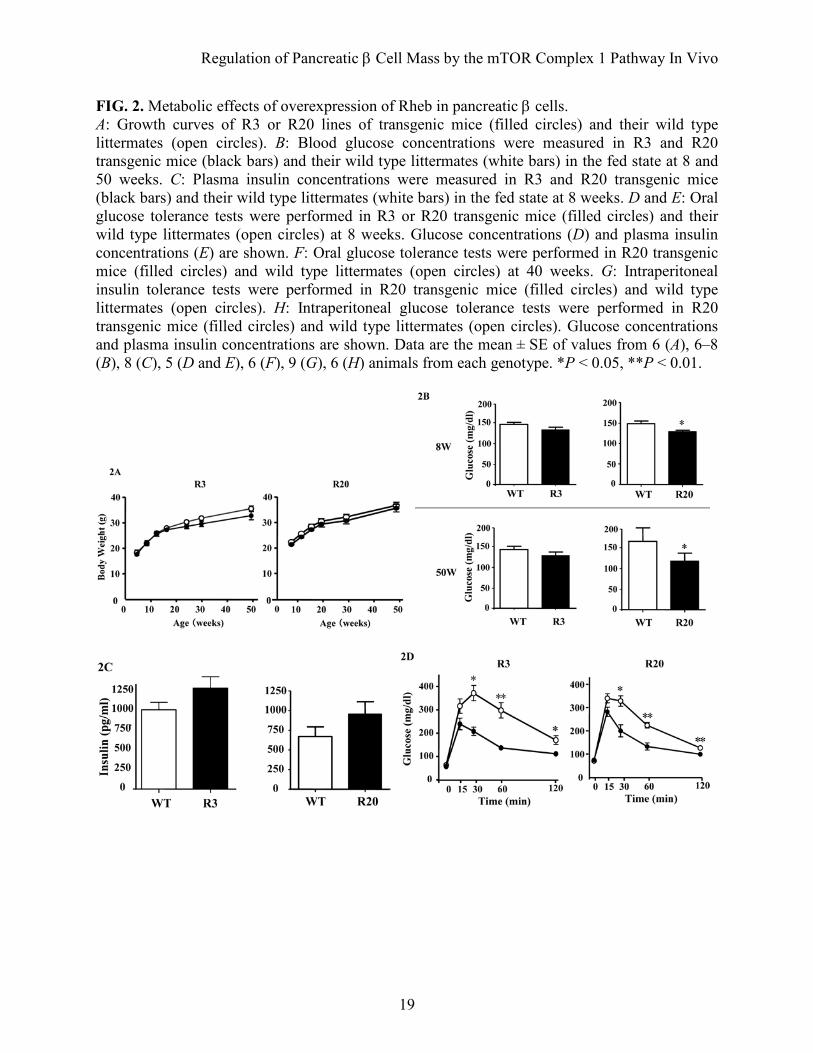
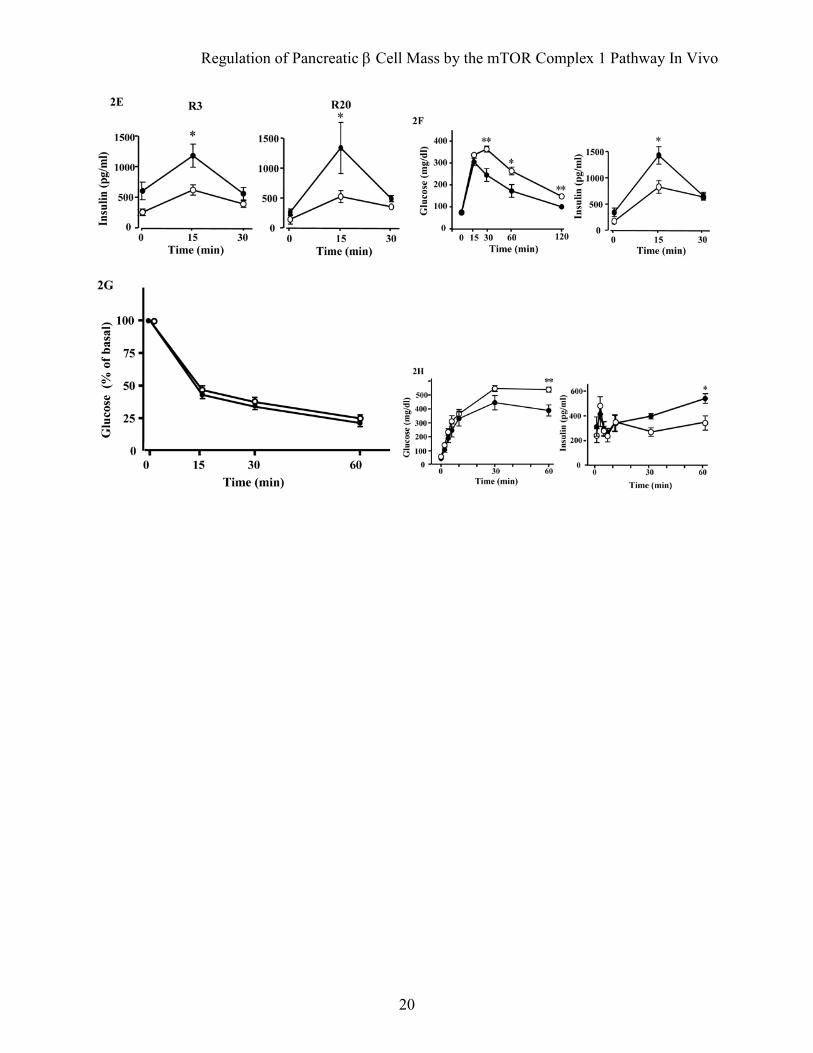
contrast, R20 transgenic mice had significantly lower blood glucose concentrations in the fed state at 8 weeks and 50 weeks compared with wild type littermates (127.9 ± 4.24 mg/dL versus 145.6 ± 5.35 mg/dL at 8 weeks and 128.7 ± 6.16 mg/dL versus 147.9 ± 5.68 mg/dL at 50 weeks; Fig. 2B). The plasma insulin levels in R20 mice were 1.43 fold those of wild type littermates at 8 weeks (Fig. 2C). Although no significant differences in blood glucose concentrations were observed between R3 transgenic mice and wild type littermates, the concentration tended to be lower in the transgenic mice and this tendency was maintained to 50 weeks. Oral glucose tolerance testing at 8 weeks revealed that both the R3 and R20 lines of transgenic mice had improved glucose tolerance compared with wild type littermates (Fig. 2D). Although fasting blood glucose concentrations were not significantly different between transgenic mice and wild type littermates, both the R3 and R20 lines of transgenic mice had significantly lower blood glucose levels after glucose loading. Insulin release in response to glucose loading was significantly higher in transgenic mice than wild type littermates, with a 2.6 fold difference in R20 transgenic mice and a 1.7 fold difference in R3 transgenic mice at 15 min after injection (Fig. 2E). Similarly improved glucose tolerance was also observed at 40 weeks with the R20 transgenic mice (Fig. 2F). In contrast, both R20 (Fig. 2G) and R3 transgenic mice (data not shown) demonstrated similar insulin responsiveness after intraperitoneal injections of insulin. Then, intraperitoneal glucose tolerance testing was performed to measure the in vivo glucose-stimulated insulin secretion in the early and late phases (Fig. 2H). Although glucose concentration did not differ significantly between transgenic mice and wild type littermates in the early phase, the glucose concentration was significantly lower in the transgenic mice in the late phase.
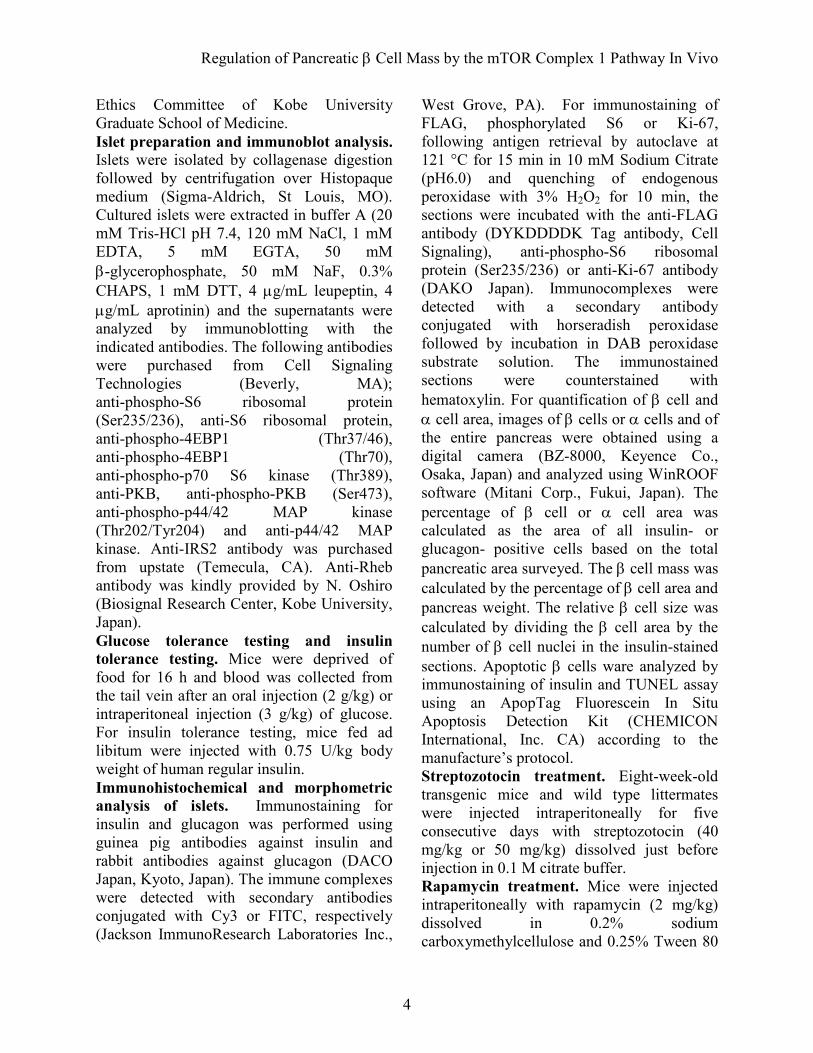
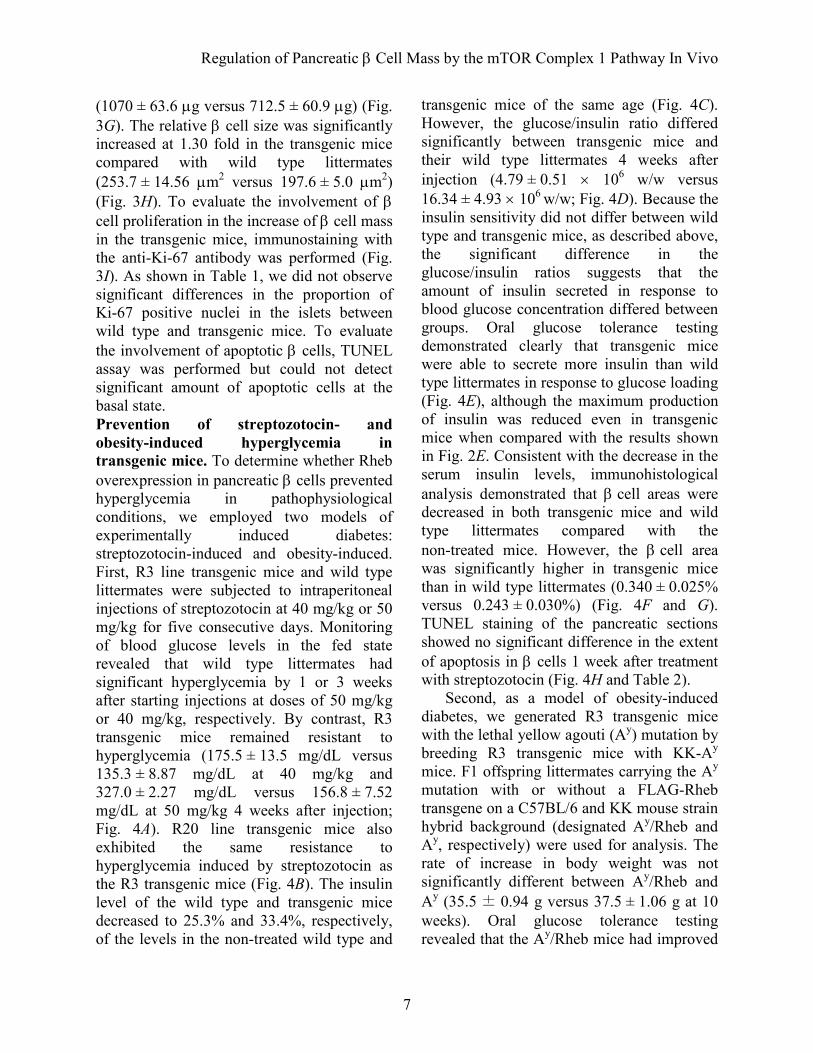
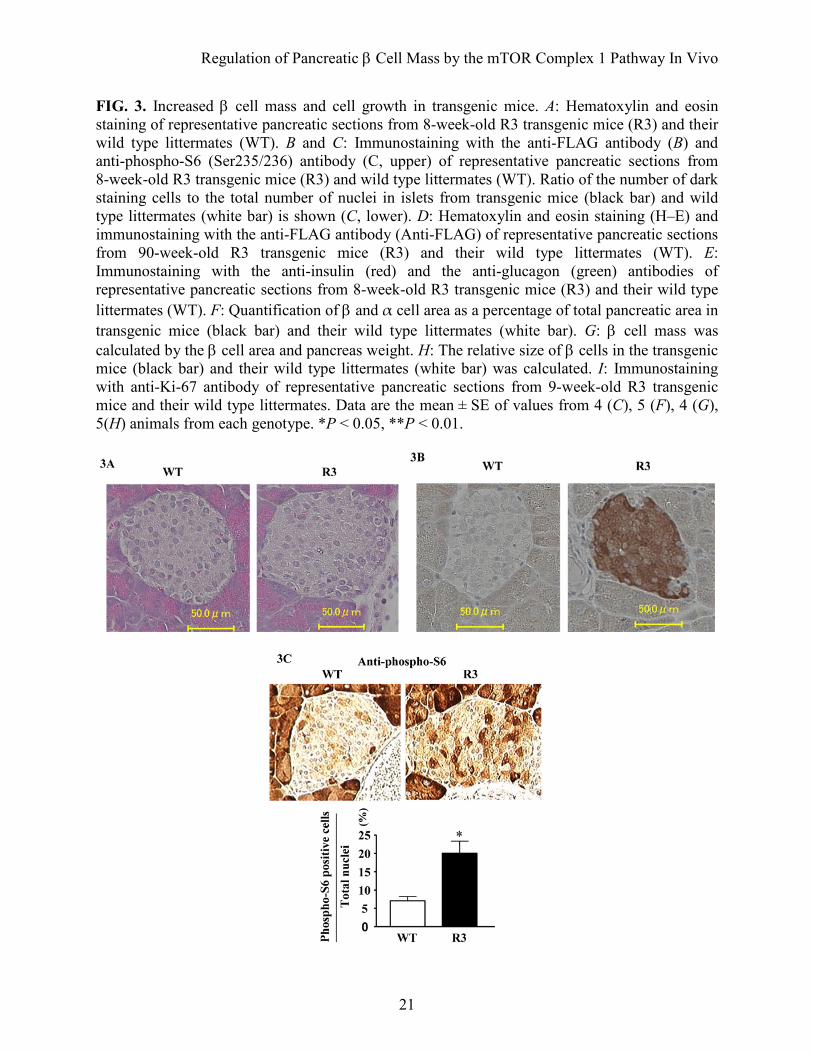
Insulin secretion was similar in transgenic mice and their wild type littermates in the early phase, but it was significantly higher in transgenic mice than in their wild type littermates in the late phase. Taken together, these results indicate that the improved glucose tolerance in the transgenic mice can be attributable mainly to a greater ability to secrete insulin in the late phase. Increased β cell mass and cell growth in transgenic mice. Hematoxylin and eosin staining of the sections revealed that the pancreatic islet architecture was grossly unchanged in mice at ages from 8 weeks to 90 weeks (Fig. 3A and D). Immunostaining of the sections with the anti-FLAG antibody confirmed the expression of FLAG-Rheb in the islets of transgenic mice at ages from 8 weeks to 90 weeks (Fig. 3B and D). Immunostaining with the anti-phospho-S6 antibody appeared lower in the islet areas than in the exocrine acinar areas. However, the dark staining cells in the islets appeared more abundant in transgenic mice than in the wild type littermates (Fig. 3C). The ratio of the number of the dark staining cells to the number of nuclei in the islets was significantly higher in transgenic mice than in wild type littermates (19.48 ± 3.23% versus 6.76 ± 1.14%).
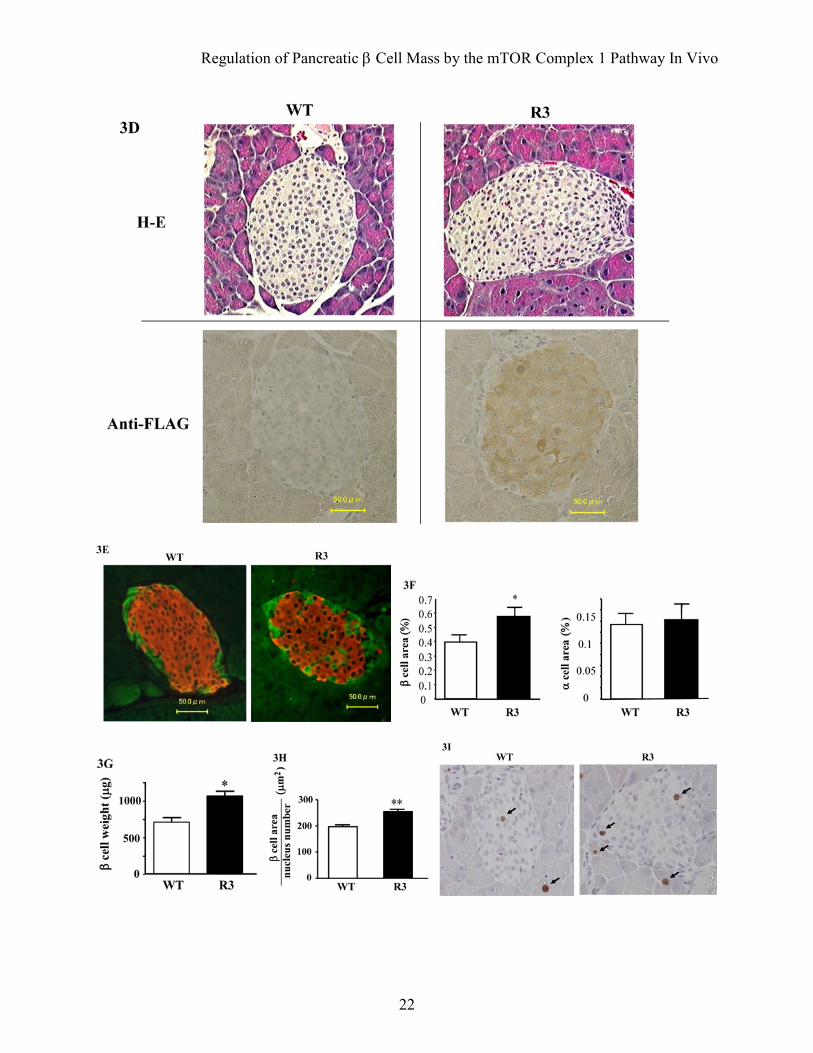
Immunostaining with the anti-insulin and anti-glucagon antibodies also demonstrated the grossly unchanged structures of pancreatic islets (Fig. 3E). Quantitative determination of β cell area relative to pancreatic area in insulin-stained sections revealed that the β cell area was significantly higher (1.46 fold) in R3 transgenic mice than in wild type littermates (0.581 ± 0.048% versus 0.399 ± 0.040%) (Fig. 3F). In contrast, the α cell area did not differ significantly between the R3 transgenic mice and wild type littermates (0.144 ± 0.028% versus 0.134 ± 0.018%). β cell mass was also significantly increased in R3 transgenic mice compared with wild type littermates
Regulation of Pancreatic β Cell Mass by the mTOR Complex 1 Pathway In Vivo
7
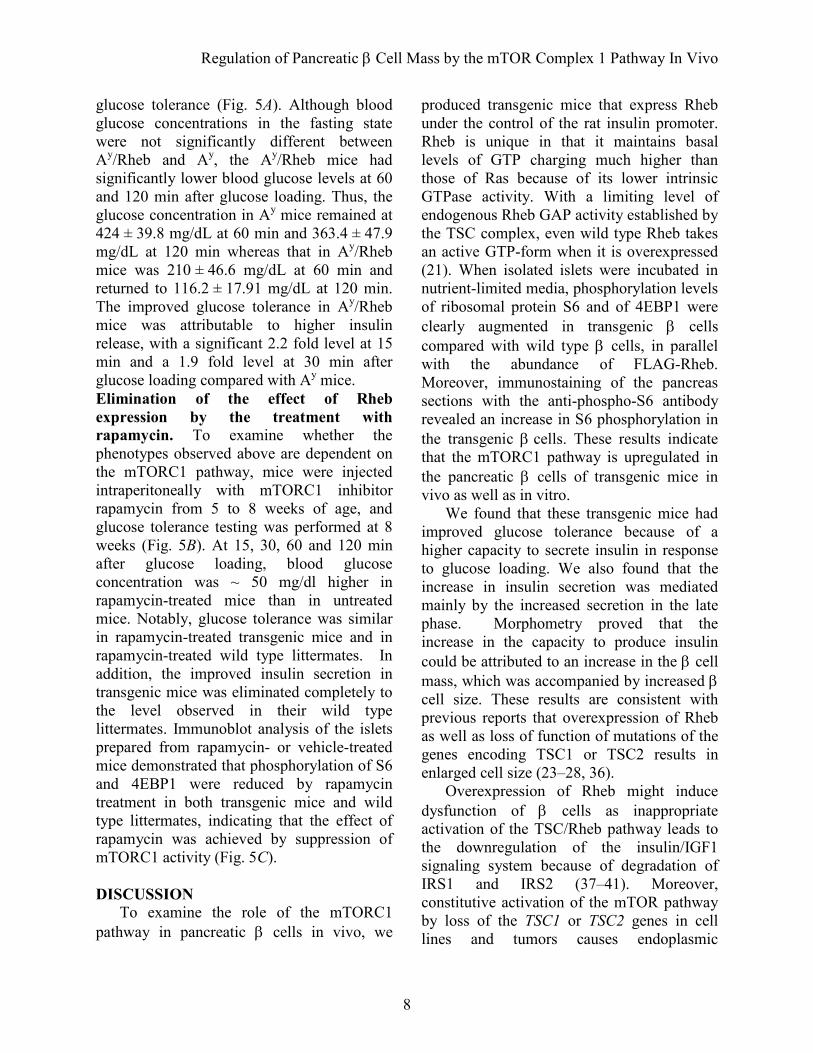
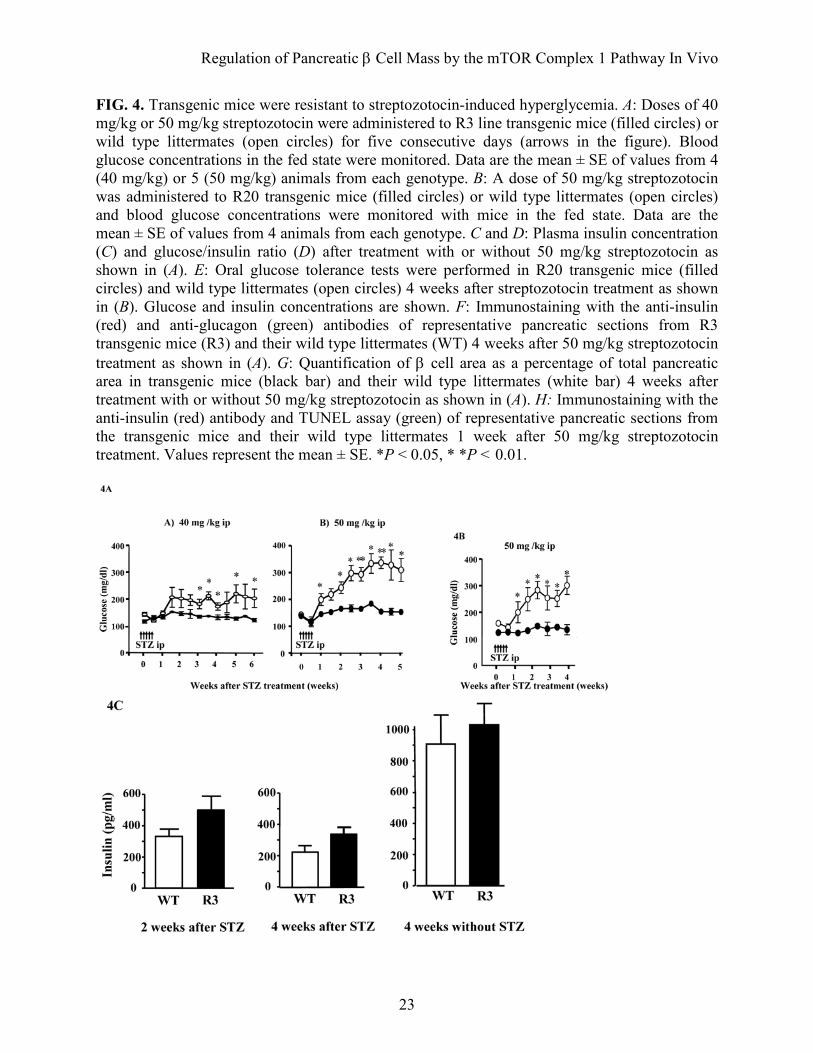
(1070 ± 63.6 µg versus 712.5 ± 60.9 µg) (Fig. 3G). The relative β cell size was significantly increased at 1.30 fold in the transgenic mice compared with wild type littermates (253.7 ± 14.56 µm2 versus 197.6 ± 5.0 µm2) (Fig. 3H). To evaluate the involvement of β cell proliferation in the increase of β cell mass in the transgenic mice, immunostaining with the anti-Ki-67 antibody was performed (Fig. 3I). As shown in Table 1, we did not observe significant differences in the proportion of Ki-67 positive nuclei in the islets between wild type and transgenic mice. To evaluate the involvement of apoptotic β cells, TUNEL assay was performed but could not detect significant amount of apoptotic cells at the basal state. Prevention of streptozotocin- and obesity-induced hyperglycemia in transgenic mice. To determine whether Rheb overexpression in pancreatic β cells prevented hyperglycemia in pathophysiological conditions, we employed two models of experimentally induced diabetes: streptozotocin-induced and obesity-induced. First, R3 line transgenic mice and wild type littermates were subjected to intraperitoneal injections of streptozotocin at 40 mg/kg or 50 mg/kg for five consecutive days. Monitoring of blood glucose levels in the fed state revealed that wild type littermates had significant hyperglycemia by 1 or 3 weeks after starting injections at doses of 50 mg/kg or 40 mg/kg, respectively. By contrast, R3 transgenic mice remained resistant to hyperglycemia (175.5 ± 13.5 mg/dL versus 135.3 ± 8.87 mg/dL at 40 mg/kg and 327.0 ± 2.27 mg/dL versus 156.8 ± 7.52 mg/dL at 50 mg/kg 4 weeks after injection; Fig. 4A). R20 line transgenic mice also exhibited the same resistance to hyperglycemia induced by streptozotocin as the R3 transgenic mice (Fig. 4B). The insulin level of the wild type and transgenic mice decreased to 25.3% and 33.4%, respectively, of the levels in the non-treated wild type and
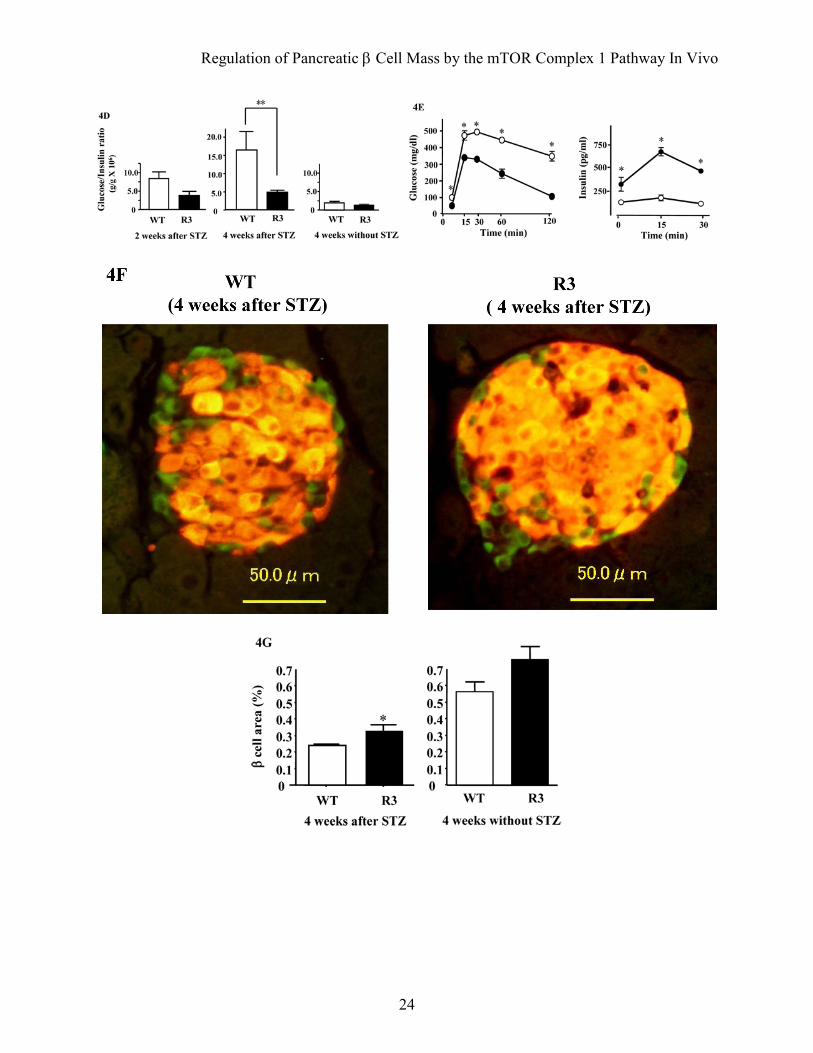
transgenic mice of the same age (Fig. 4C). However, the glucose/insulin ratio differed significantly between transgenic mice and their wild type littermates 4 weeks after injection (4.79 ± 0.51 × 10⁶ w/w versus 16.34 ± 4.93 × 10⁶ w/w; Fig. 4D). Because the insulin sensitivity did not differ between wild type and transgenic mice, as described above, the significant difference in the glucose/insulin ratios suggests that the amount of insulin secreted in response to blood glucose concentration differed between groups. Oral glucose tolerance testing demonstrated clearly that transgenic mice were able to secrete more insulin than wild type littermates in response to glucose loading (Fig. 4E), although the maximum production of insulin was reduced even in transgenic mice when compared with the results shown in Fig. 2E. Consistent with the decrease in the serum insulin levels, immunohistological analysis demonstrated that β cell areas were decreased in both transgenic mice and wild type littermates compared with the non-treated mice. However, the β cell area was significantly higher in transgenic mice than in wild type littermates (0.340 ± 0.025% versus 0.243 ± 0.030%) (Fig. 4F and G). TUNEL staining of the pancreatic sections showed no significant difference in the extent of apoptosis in β cells 1 week after treatment with streptozotocin (Fig. 4H and Table 2).
Second, as a model of obesity-induced diabetes, we generated R3 transgenic mice with the lethal yellow agouti (Ay) mutation by breeding R3 transgenic mice with KK-Ay mice. F1 offspring littermates carrying the Ay mutation with or without a FLAG-Rheb transgene on a C57BL/6 and KK mouse strain hybrid background (designated Ay/Rheb and Ay, respectively) were used for analysis. The rate of increase in body weight was not significantly different between Ay/Rheb and Ay (35.5 ± 0.94 g versus 37.5 ± 1.06 g at 10 weeks). Oral glucose tolerance testing revealed that the Ay/Rheb mice had improved
Regulation of Pancreatic β Cell Mass by the mTOR Complex 1 Pathway In Vivo
8
glucose tolerance (Fig. 5A). Although blood glucose concentrations in the fasting state were not significantly different between Ay/Rheb and Ay, the Ay/Rheb mice had significantly lower blood glucose levels at 60 and 120 min after glucose loading. Thus, the glucose concentration in Ay mice remained at 424 ± 39.8 mg/dL at 60 min and 363.4 ± 47.9 mg/dL at 120 min whereas that in Ay/Rheb mice was 210 ± 46.6 mg/dL at 60 min and returned to 116.2 ± 17.91 mg/dL at 120 min. The improved glucose tolerance in Ay/Rheb mice was attributable to higher insulin release, with a significant 2.2 fold level at 15 min and a 1.9 fold level at 30 min after glucose loading compared with Ay mice. Elimination of the effect of Rheb expression by the treatment with rapamycin. To examine whether the phenotypes observed above are dependent on the mTORC1 pathway, mice were injected intraperitoneally with mTORC1 inhibitor rapamycin from 5 to 8 weeks of age, and glucose tolerance testing was performed at 8 weeks (Fig. 5B). At 15, 30, 60 and 120 min after glucose loading, blood glucose concentration was ~ 50 mg/dl higher in rapamycin-treated mice than in untreated mice. Notably, glucose tolerance was similar in rapamycin-treated transgenic mice and in rapamycin-treated wild type littermates. In addition, the improved insulin secretion in transgenic mice was eliminated completely to the level observed in their wild type littermates. Immunoblot analysis of the islets prepared from rapamycin- or vehicle-treated mice demonstrated that phosphorylation of S6 and 4EBP1 were reduced by rapamycin treatment in both transgenic mice and wild type littermates, indicating that the effect of rapamycin was achieved by suppression of mTORC1 activity (Fig. 5C). DISCUSSION
To examine the role of the mTORC1 pathway in pancreatic β cells in vivo, we
produced transgenic mice that express Rheb under the control of the rat insulin promoter. Rheb is unique in that it maintains basal levels of GTP charging much higher than those of Ras because of its lower intrinsic GTPase activity. With a limiting level of endogenous Rheb GAP activity established by the TSC complex, even wild type Rheb takes an active GTP-form when it is overexpressed (21). When isolated islets were incubated in nutrient-limited media, phosphorylation levels of ribosomal protein S6 and of 4EBP1 were clearly augmented in transgenic β cells compared with wild type β cells, in parallel with the abundance of FLAG-Rheb. Moreover, immunostaining of the pancreas sections with the anti-phospho-S6 antibody revealed an increase in S6 phosphorylation in the transgenic β cells. These results indicate that the mTORC1 pathway is upregulated in the pancreatic β cells of transgenic mice in vivo as well as in vitro.
We found that these transgenic mice had improved glucose tolerance because of a higher capacity to secrete insulin in response to glucose loading. We also found that the increase in insulin secretion was mediated mainly by the increased secretion in the late phase. Morphometry proved that the increase in the capacity to produce insulin could be attributed to an increase in the β cell mass, which was accompanied by increased β cell size. These results are consistent with previous reports that overexpression of Rheb as well as loss of function of mutations of the genes encoding TSC1 or TSC2 results in enlarged cell size (23–28, 36).
Overexpression of Rheb might induce dysfunction of β cells as inappropriate activation of the TSC/Rheb pathway leads to the downregulation of the insulin/IGF1 signaling system because of degradation of IRS1 and IRS2 (37–41). Moreover, constitutive activation of the mTOR pathway by loss of the TSC1 or TSC2 genes in cell lines and tumors causes endoplasmic
Regulation of Pancreatic β Cell Mass by the mTOR Complex 1 Pathway In Vivo
9
reticulum (ER) stress, resulting in inhibition of insulin action and increase in vulnerability to apoptosis (42). Consistent with these reports, Shigeyama et al. demonstrated that mice deficient in TSC2 in pancreatic β cells developed progressive hyperglycemia after 40 weeks of age, although the mice also exhibited hypoglycemia and hyperinsulinemia when young, suggesting that downregulation of insulin action or ER stress might occur with aging (43). By contrast, transgenic mice tended to have lower glucose levels and improved glucose tolerance even at 40-50 weeks. The histological analysis of islets of even 90-week-old mice confirmed no adverse effect on pancreatic β cells. Although the IRS2 level appeared to be relatively reduced in transgenic islets, the extent of the mTORC1 activation might not be strong enough to induce adverse effects on the β cells in these transgenic mice.
Upregulation of IRS2 and Akt or deletion of Pten induces an increase in β cell mass and resistance to hyperglycemia (6, 7, 44). A similar phenotype has been reported for the downregulation of more distal negative mediators of Akt, FoxO1, and p27kip1 (15, 16, 45). These phenotypes are mediated by an increased proliferation of β cells as well as increase in β cell size. Reciprocally, mice deficient for p70S6K or knock-in mice whose S6 protein contains alanine substitutions at all five phosphorylatable serine residues sites show reduced insulin secretion in response to glucose caused by diminished β cell size (5, 17). Because Rheb has been reported to be required for both cell cycle progression and cell growth in Drosophila (28) and because mTORC1 is involved in cell proliferation in some mammalian cells such as cancer cells, it might be premature to conclude only from Ki-67 staining that cell proliferation is not involved in our mouse model.
It should be noted that transgenic mice exhibited resistance to hyperglycemia induced by low dose streptozotocin as well as by
obesity. Although streptozotocin treatment induced a reduction of β cells by 43∼45% in both wild type and transgenic mice, insulin secretion in response to glucose loading was much higher in transgenic mice than in wild type littermates. This suggests that the residual β cell function in transgenic mice might be higher than wild type littermates.
We cannot exclude completely the possibility that overexpression of Rheb might affect intracellular signals other than mTORC1 pathways. Rheb has been reported to inhibit the Raf–dependent MAPK pathway through the interaction of the Ras-binding domain of Braf or cRaf in a rapamycin-insensitive manner (46-48). However, serum stimulation of MAPK phosphorylation did not appear to decrease in the transgenic islets compared with their wild type littermates. In addition, rapamycin treatment eliminated the improved insulin secretion in the transgenic mice completely to the level observed in wild type littermates. Given that MAPKs are not affected significantly by rapamycin, these results supports that the rapamycin-sensitive mTORC1 pathway plays a crucial role in this mouse model.
In conclusion, our findings highlight the importance of the role of the mTORC1 pathway in pancreatic β cells. Activation of the mTORC1 pathway by Rheb led to an increase in β cell mass and protection from hyperglycemia induced by β cell injury and by insulin resistance. Further elucidation of the intracellular signaling mediated by Rheb in pancreatic β cells might thus provide a basis for the development of new therapeutic strategies to improve insulin secretion and thereby prevent the development of diabetes. ACKNOWLEDGEMENTS
We thank Domenico Accili for the generous gift of rat insulin promoter plasmid and Noriko Oshiro for the generous gift of anti-Rheb antibody and Rheb cDNA. We
Regulation of Pancreatic β Cell Mass by the mTOR Complex 1 Pathway In Vivo
10
thank Atsumi Katsuta for her technical assistance. We are grateful to Ushio Kikkawa for helpful discussion and continuous support. This work was supported by a grant for the 21st Century COE
Program “Center of Excellence for Signal Transduction Disease: Diabetes Mellitus as a model” and research grants from the Ministry of Education, Culture, Sports, Science and Technology of Japan (to K. H.).
REFERENCES 1. Kasuga M: Insulin resistance and pancreatic β cell failure. J Clin Invest 116:1756-1760,
2006 2. Rhodes CJ: Type 2 diabetes-a matter of β-cell life and death? Science 307:380-384, 2005 3. Withers DJ, Gutierrez JS, Towery H, Burks DJ, Ren JM, Previs S, Zhang Y, Bernal D,
Pons S, Shulman GI, Bonner-Weir S, White MF: Disruption of IRS-2 causes type 2 diabetes in mice. Nature 391:900-904, 1998
4. Kulkarni RN, Bruning JC, Winnay JN, Postic C, Magnuson MA, Kahn CR: Tissue-specific knockout of the insulin receptor in pancreatic β cells creates an insulin secretory defect similar to that in type 2 diabetes. Cell 96:329-339, 1999
5. Pende M, Kozma SC, Jaquet M, Oorschot V, Burcelin R, Le Marchand-Brustel Y, Klumperman J, Thorens B, Thomas G: Hypoinsulinaemia, glucose intolerance and diminished β-cell size in S6K1-deficient mice. Nature 408:994-997, 2000
6. Tuttle RL, Gill NS, Pugh W, Lee JP, Koeberlein B, Furth EE, Polonsky KS, Naji A, Birnbaum MJ: Regulation of pancreatic β-cell growth and survival by the serine/threonine protein kinase Akt1/PKBα. Nat Med 7:1133-1137, 2001
7. Bernal-Mizrachi E, Wen W, Stahlhut S, Welling CM, Permutt MA: Islet β cell expression of constitutively active Akt1/PKBα induces striking hypertrophy, hyperplasia, and hyperinsulinemia. J Clin Invest 108:1631-1638, 2001
8. Hashimoto N, Kido Y, Uchida T, Matsuda T, Suzuki K, Inoue H, Matsumoto M, Ogawa W, Maeda S, Fujihara H, Ueta Y, Uchiyama Y, Akimoto K, Ohno S, Noda T, Kasuga M: PKCλ regulates glucose-induced insulin secretion through modulation of gene expression in pancreatic β cells. J Clin Invest 115:138-145, 2005
9. Stiles BL, Kuralwalla-Martinez C, Guo W, Gregorian C, Wang Y, Tian J, Magnuson MA, Wu H: Selective deletion of Pten in pancreatic β cells leads to increased islet mass and resistance to STZ-induced diabetes. Mol Cell Biol 26:2772-2781, 2006
10. Hashimoto N, Kido Y, Uchida T, Asahara S, Shigeyama Y, Matsuda T, Takeda A, Tsuchihashi D, Nishizawa A, Ogawa W, Fujimoto Y, Okamura H, Arden KC, Herrera PL, Noda T, Kasuga M: Ablation of PDK1 in pancreatic β cells induces diabetes as a result of loss of β cell mass. Nat Genet 38:589-593, 2006
11. Ueki K, Okada T, Hu J, Liew CW, Assmann A, Dahlgren GM, Peters JL, Shackman JG, Zhang M, Artner I, Satin LS, Stein R, Holzenberger M, Kennedy RT, Kahn CR, Kulkarni RN: Total insulin and IGF-I resistance in pancreatic β cells causes overt diabetes. Nat Genet 38:583-588, 2006
12. Wullschleger S, Loewith R, Hall MN: TOR signaling in growth and metabolism. Cell 124:471-484, 2006
Regulation of Pancreatic β Cell Mass by the mTOR Complex 1 Pathway In Vivo
11
13. Sarbassov DD, Ali SM, Sabatini DM: Growing roles for the mTOR pathway. Curr Opin Cell Biol 17:596-603, 2005
14. Isotani S, Hara K, Tokunaga C, Inoue H, Avruch J, Yonezawa K: Immunopurified mammalian target of rapamycin phosphorylates and activates p70 S6 kinase α in vitro. J Biol Chem 274:34493-34498, 1999
15. Nakae J, Biggs WH III, Kitamura T, Cavenee WK, Wright CV, Arden KC, Accili D: Regulation of insulin action and pancreatic β-cell function by mutated alleles of the gene encoding forkhead transcription factor Foxo1. Nat Genet 32:245-253, 2002
16. Kitamura T, Nakae J, Kitamura Y, Kido Y, Biggs WH III, Wright CV, White MF, Arden KC, Accili D: The forkhead transcription factor Foxo1 links insulin signaling to Pdx1 regulation of pancreatic β cell growth. J Clin Invest 110:1839-1847, 2002
17. Ruvinsky I, Sharon N, Lerer T, Cohen H, Stolovich-Rain M, Nir T, Dor Y, Zisman P, Meyuhas O: Ribosomal protein S6 phosphorylation is a determinant of cell size and glucose homeostasis. Genes Dev 19:2199-2211, 2005
18. Hara K, Maruki Y, Long X, Yoshino K, Oshiro N, Hidayat S, Tokunaga C, Avruch J, Yonezawa K: Raptor, a binding partner of target of rapamycin (TOR), mediates TOR action. Cell 110:177-189, 2002
19. Kim DH, Sarbassov DD, Ali SM, Latek RR, Guntur KV, Erdjument Bromage H, Tempst P, Sabatini DM: GbetaL, a positive regulator of the rapamycin-sensitive pathway required for the nutrient-sensitive interaction between raptor and mTOR. Mol Cell 11:895-904, 2003
20. Aspuria PJ, Tamanoi F: The Rheb family of GTP-binding proteins. Cell Signal 16:1105-1112, 2004
21. Avruch J, Hara K, Lin Y, Liu M, Long X, Ortiz-Vega S, Yonezawa K: Insulin and amino-acid regulation of mTOR signaling and kinase activity through the Rheb GTPase. Oncogene 25:6361-6372, 2006
22. Long X, Lin Y, Ortiz-Vega S, Yonezawa K, Avruch J: Rheb binds and regulates the mTOR kinase. Curr Biol 15:702-713, 2005
23. Tapon N, Ito N, Dickson BJ, Treisman JE, Hariharan IK: The Drosophila tuberous sclerosis complex gene homologs restrict cell growth and cell proliferation. Cell 105:345-355, 2001
24. Potter CJ, Huang H, Xu T: Drosophila Tsc1 functions with Tsc2 to antagonize insulin signaling in regulating cell growth, cell proliferation, and organ size. Cell 105:357-368, 2001
25. Gao X, Pan D: TSC1 and TSC2 tumor suppressors antagonize insulin signaling in cell growth. Genes Dev 15:1383-1392, 2001
26. Stocker H, Radimerski T, Schindelholz B, Wittwer F, Belawat P, Daram P, Breuer S, Thomas G, Hafen E: Rheb is an essential regulator of S6K in controlling cell growth in Drosophila. Nat Cell Biol 5:559-565, 2003
27. Saucedo LJ, Gao X, Chiarelli DA, Li L, Pan D, Edgar BA: Rheb promotes cell growth as a component of the insulin/TOR signaling network. Nat Cell Biol 5:566-571, 2003
28. Patel PH, Thapar N, Guo L, Martinez M, Maris J, Gau CL, Lengyel JA, Tamanoi F: Drosophila Rheb GTPase is required for cell cycle progression and cell growth. J Cell Sci 116:3601-3610, 2003
Regulation of Pancreatic β Cell Mass by the mTOR Complex 1 Pathway In Vivo
12
29. Garami A, Zwartkruis FJT, Nobukuni T, Joaquin M, Roccio M, Stocker H, Kozma SC, Hafen E, Bos JL, Thomas G: Insulin activation of Rheb, a mediator of mTOR/S6K/4E-BP signaling, is inhibited by TSC1 and 2. Mol Cell 11:1457-1466, 2003
30. Tee AR, Manning BD, Roux PP, Cantley LC, Blenis J: Tuberous sclerosis complex gene products, Tuberin and Hamartin, control mTOR signaling by acting as a GTPase-activating protein complex toward Rheb. Curr Biol 13:1259-1268, 2003
31. Gao X, Zhang Y, Arrazola P, Hino O, Kobayashi T, Yeung RS, Ru B, Pan D: Tsc tumour suppressor proteins antagonize amino-acid-TOR signaling. Nat Cell Biol 4:699-704, 2002
32. Hara K, Yonezawa K, Weng QP, Kozlowski MT, Belham C, Avruch J: Amino acid sufficiency and mTOR regulate p70 S6 kinase and eIF-4E BP1 through a common effector mechanism. J Biol Chem 273:14484-14494, 1998
33. Long X, Ortiz-Vega S, Lin Y, Avruch J: Rheb binding to mammalian target of rapamycin (mTOR) is regulated by amino acid sufficiency. J Biol Chem 280:23433-23436, 2005
34. Inoki K, Zhu T, Guan KL: TSC2 mediates cellular energy response to control cell growth and survival. Cell 115:577-590, 2003
35. Bai X, Ma D, Liu A, Shen X, Wang QJ, Liu Y, Jiang Y : Rheb activates mTOR by antagonizing its endogenous inhibitor, FKBP38. Science 318:977-980, 2007
36. Fingar DC, Salama S, Tsou C, Harlow E, Blenis J: Mammalian cell size is controlled by mTOR and its downstream targets S6K1 and 4EBP1/eIF4E. Genes Dev 16:1472-1487, 2002
37. Haruta T, Uno T, Kawahara J, Takano A, Egawa K, Sharma PM, Olefsky JM, Kobayashi M: A rapamycin-sensitive pathway down-regulates insulin signaling via phosphorylation and proteasomal degradation of insulin receptor substrate-1. Mol Endocrinol 14:783-794, 2000
38. Rui L, Fisher TL, Thomas J, White MF: Regulation of insulin/insulin-like growth factor-1 signaling by proteasome-mediated degradation of insulin receptor substrate-2. J Biol Chem 276:40362-40367, 2001
39. Shah OJ, Wang Z, Hunter T: Inappropriate activation of the TSC/Rheb/mTOR/S6K cassette induces IRS1/2 depletion, insulin resistance, and cell survival deficiencies. Curr Biol 14:1650-1656, 2004
40. Harrington LS, Findlay GM, Gray A, Tolkacheva T, Wigfield S, Rebholz H, Barnett J, Leslie NR, Cheng S, Shepherd PR, Gout I, Downes CP, Lamb RF: The TSC1-2 tumor suppressor controls insulin-PI3K signaling via regulation of IRS proteins. J Cell Biol 166:213-223, 2004
41. Briaud I, Dickson LM, Lingohr MK, McCuaig JF, Lawrence JC, Rhodes CJ: Insulin receptor substrate-2 proteasomal degradation mediated by a mammalian target of rapamycin (mTOR)-induced negative feedback down-regulates protein kinase B-mediated signaling pathway in β-cells. J Biol Chem 280:2282-2293, 2005
42. Ozcan U, Ozcan L, Yilmaz E, Duvel K, Sahin M, Manning BD, Hotamisligil GS: Loss of the Tuberous sclerosis complex tumor suppressors triggers the unfolded protein response to regulate insulin signaling and apoptosis. Mol Cell 29: 541-551, 2008
43. Shigeyama Y, Kobayashi T, Kido Y, Hashimoto N, Asahara S-I, Matsuda T, Takeda A, Inoue T, Shibutani Y, Koyanagi M, Uchida T, Inoue M, Hino O, Kasuga M, Noda T: Mol Cell Biol 28:2971-2979, 2008
44. Hennige AM, Burks DJ, Ozcan U, Kulkarni RN, Ye J, Park S, Schubert M, Fisher TL, Dow MA, Leshan R, Zakaria M, Mossa-Basha M, White MF: Upregulation of insulin
Regulation of Pancreatic β Cell Mass by the mTOR Complex 1 Pathway In Vivo
13
receptor substrate-2 in pancreatic β cells prevents diabetes. J Clin Invest 112:1521-1532, 2003
45. Uchida T, Nakamura T, Hashimoto N, Matsuda T, Kotani K, Sakaue H, Kido Y, Hayashi Y, Nakayama KI, White MF, Kasuga M: Deletion of Cdkn1b ameliorates hyperglycemia by maintaining compensatory hyperinsulinemia in diabetic mice. Nat Med 11:175-182, 2005
46. Im E, von Lintig, FC, Chen J, Zhuang S, Qui W, Chowdhury S, Worley PF, Boss GR, Pilz RB: Rheb is in a high activation state and inhibits B-Raf kinase in mammalian cells. Oncogene 21: 6356-6365, 2002
47. Karbowniczek M, Cash T, Cheung M, Robertson GP, Astrinidis A, Henske EP: Regulation of B-Raf kinase activity by Tuberin and Rheb is mammalian target of rapamycin (mTOR) independent. J. Biol. Chem. 279: 29930-29937, 2004
48. Karbowniczek M, Robertson GP, Henske EP: Rheb inhibits C-Raf and B-Raf/C-Raf heterodimerization. J. Biol. Chem. 281: 25447-25456, 2006
Regulation of Pancreatic β Cell Mass by the mTOR Complex 1 Pathway In Vivo
14
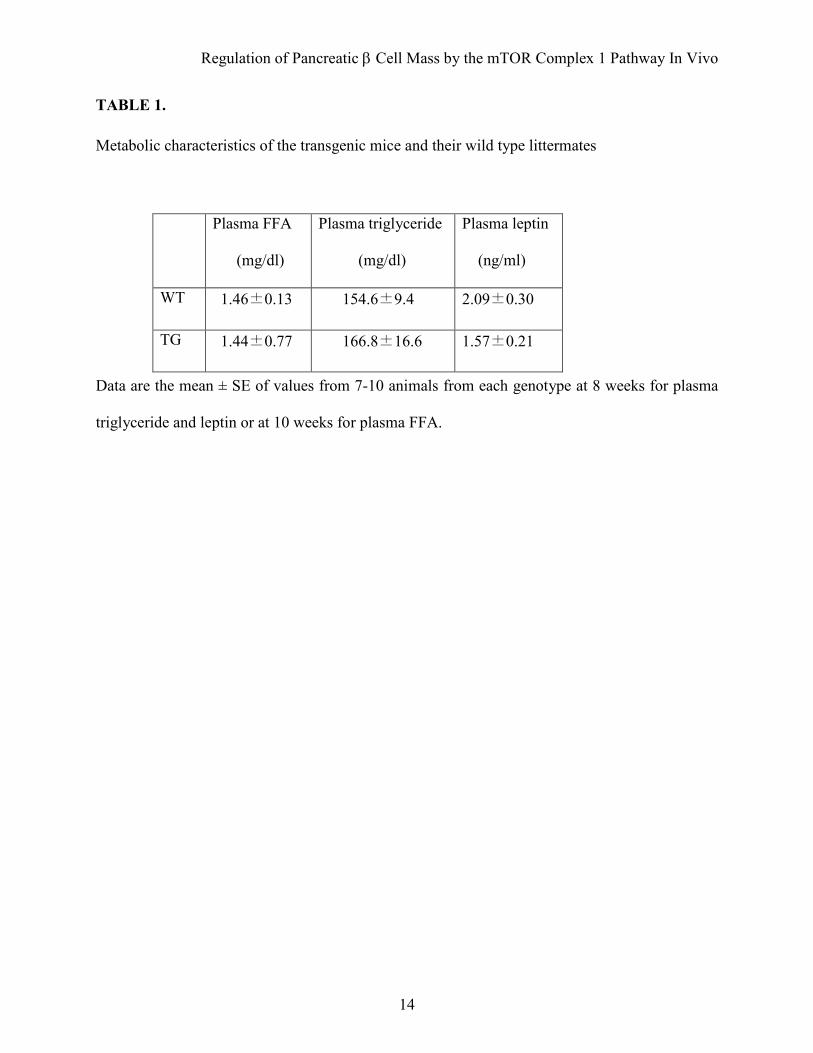
TABLE 1.
Metabolic characteristics of the transgenic mice and their wild type littermates
Plasma FFA
(mg/dl)
Plasma triglyceride
(mg/dl)
Plasma leptin
(ng/ml)
WT 1.46±0.13 154.6±9.4 2.09±0.30
TG 1.44±0.77 166.8±16.6 1.57±0.21
Data are the mean ± SE of values from 7-10 animals from each genotype at 8 weeks for plasma
triglyceride and leptin or at 10 weeks for plasma FFA.
Regulation of Pancreatic β Cell Mass by the mTOR Complex 1 Pathway In Vivo
15
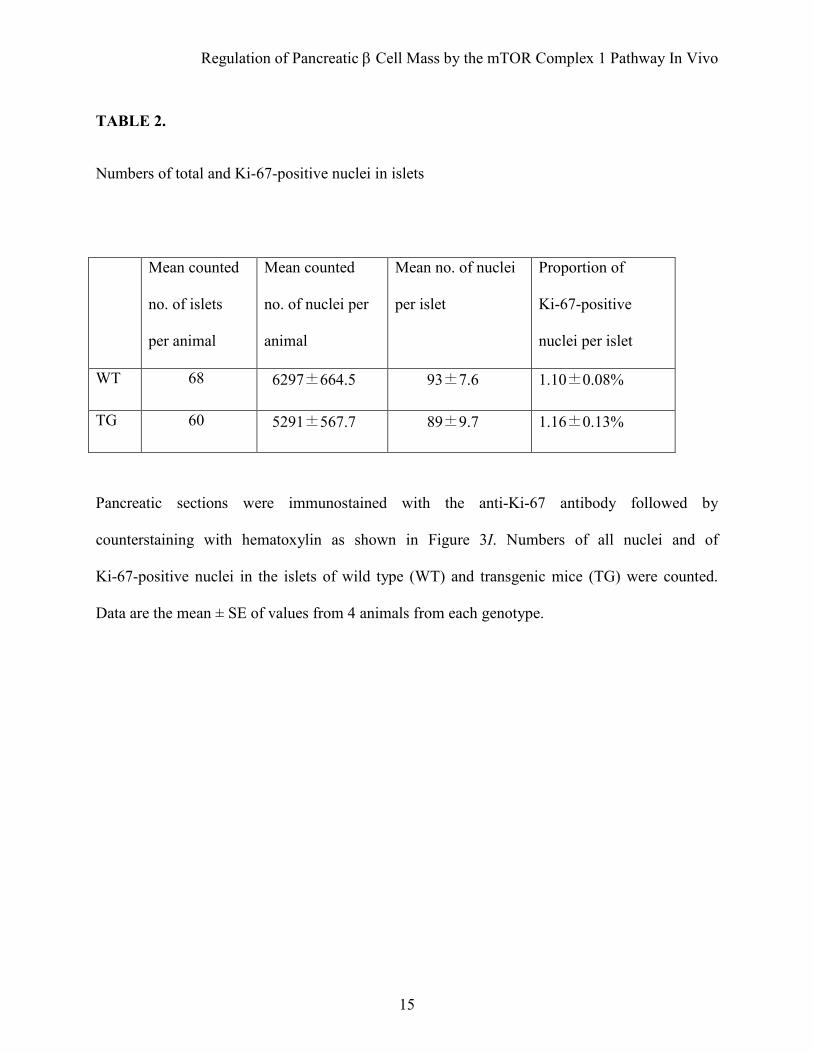
TABLE 2.
Numbers of total and Ki-67-positive nuclei in islets
Mean counted
no. of islets
per animal
Mean counted
no. of nuclei per
animal
Mean no. of nuclei
per islet
Proportion of
Ki-67-positive
nuclei per islet
WT 68 6297±664.5 93±7.6 1.10±0.08%
TG 60 5291±567.7 89±9.7 1.16±0.13%
Pancreatic sections were immunostained with the anti-Ki-67 antibody followed by
counterstaining with hematoxylin as shown in Figure 3I. Numbers of all nuclei and of
Ki-67-positive nuclei in the islets of wild type (WT) and transgenic mice (TG) were counted.
Data are the mean ± SE of values from 4 animals from each genotype.
Regulation of Pancreatic β Cell Mass by the mTOR Complex 1 Pathway In Vivo
16
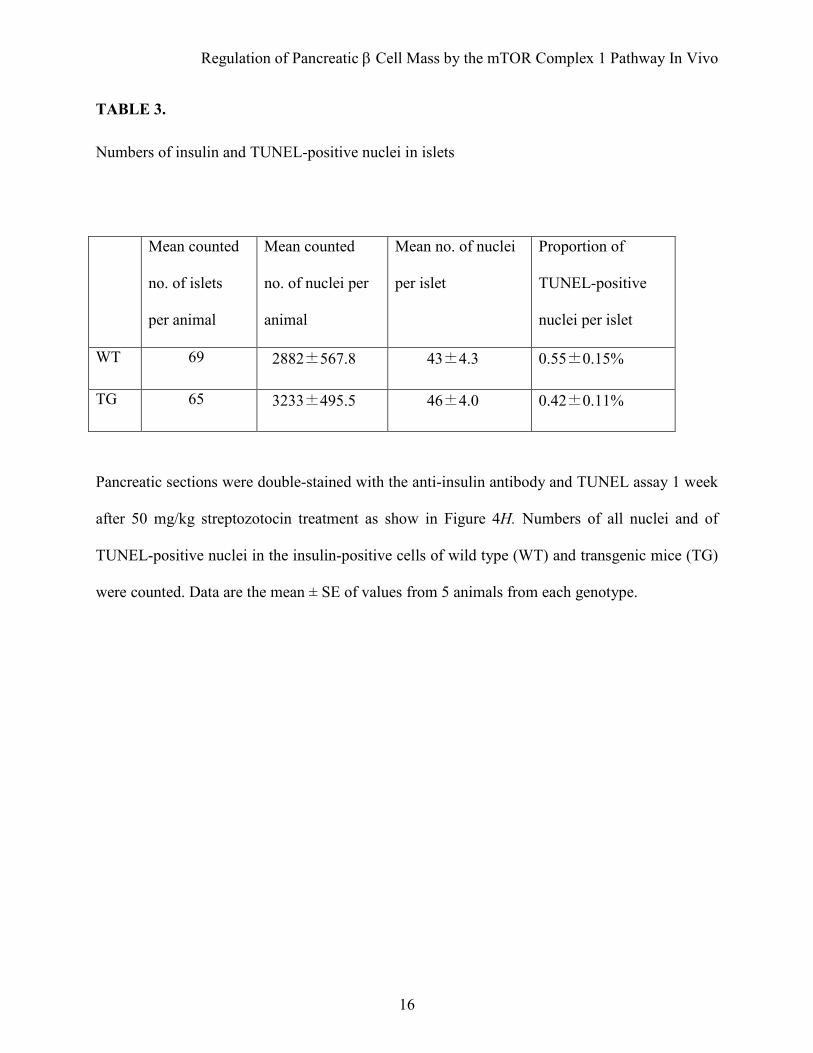
TABLE 3.
Numbers of insulin and TUNEL-positive nuclei in islets
Mean counted
no. of islets
per animal
Mean counted
no. of nuclei per
animal
Mean no. of nuclei
per islet
Proportion of
TUNEL-positive
nuclei per islet
WT 69 2882±567.8 43±4.3 0.55±0.15%
TG 65 3233±495.5 46±4.0 0.42±0.11%
Pancreatic sections were double-stained with the anti-insulin antibody and TUNEL assay 1 week
after 50 mg/kg streptozotocin treatment as show in Figure 4H. Numbers of all nuclei and of
TUNEL-positive nuclei in the insulin-positive cells of wild type (WT) and transgenic mice (TG)
were counted. Data are the mean ± SE of values from 5 animals from each genotype.
Regulation of Pancreatic β Cell Mass by the mTOR Complex 1 Pathway In Vivo
17
FIG. 1. Activation of the mTORC1 pathway by overexpression of FLAG-Rheb in pancreatic β cells. Islets isolated from mice of each genotype were incubated either in 50% RPMI medium without fetal calf serum (FCS) (A, B and D), RPMI medium (C) or stimulated with 100 nM IGF1 (B) or 15 % FCS (D) as indicated. The same amounts of cellular extracts were analyzed by immunoblotting with the antibodies to Rheb, phospho-S6 ribosomal protein (Ser235/236), S6 ribosomal protein, phospho-4EBP1 (Thr37/46 or Thr70), phospho-p70 S6 kinase (Thr389), p70 S6 kinase, phospho-PKB (Ser473), PKB, phospho-p44/42 MAP kinase (Thr202/Tyr204), p44/42 MAP kinase or IRS-2. A representative experiment is shown. The bottom panel in (A) shows the same blot as the top panel except that it was exposed longer to detect the endogenous Rheb (end-Rheb). E: Relative quantification of phospho-S6 (Ser235/236), phospho-4EBP1 (T37/46 or T70), phospho-PKB (Ser473), phospho-p44/42 MAP kinase (Thr202/Tyr204) and IRS-2. The immunoblotts were scanned and the OD for the R3 with IGF1 or FCS stimulation (A, B and D) or the OD for R3 (C) was set to 100%. F: Immunoprecipitation with the anti-FLAG antibody was performed using lysates of the hypothalamus, muscle or liver isolated from mice of each genotype, and analyzed by immunoblotting with the same antibody,
Regulation of Pancreatic β Cell Mass by the mTOR Complex 1 Pathway In Vivo
18
Regulation of Pancreatic β Cell Mass by the mTOR Complex 1 Pathway In Vivo
19
FIG. 2. Metabolic effects of overexpression of Rheb in pancreatic β cells. A: Growth curves of R3 or R20 lines of transgenic mice (filled circles) and their wild type littermates (open circles). B: Blood glucose concentrations were measured in R3 and R20 transgenic mice (black bars) and their wild type littermates (white bars) in the fed state at 8 and 50 weeks. C: Plasma insulin concentrations were measured in R3 and R20 transgenic mice (black bars) and their wild type littermates (white bars) in the fed state at 8 weeks. D and E: Oral glucose tolerance tests were performed in R3 or R20 transgenic mice (filled circles) and their wild type littermates (open circles) at 8 weeks. Glucose concentrations (D) and plasma insulin concentrations (E) are shown. F: Oral glucose tolerance tests were performed in R20 transgenic mice (filled circles) and wild type littermates (open circles) at 40 weeks. G: Intraperitoneal insulin tolerance tests were performed in R20 transgenic mice (filled circles) and wild type littermates (open circles). H: Intraperitoneal glucose tolerance tests were performed in R20 transgenic mice (filled circles) and wild type littermates (open circles). Glucose concentrations and plasma insulin concentrations are shown. Data are the mean ± SE of values from 6 (A), 6–8 (B), 8 (C), 5 (D and E), 6 (F), 9 (G), 6 (H) animals from each genotype. *P < 0.05, **P < 0.01.
Regulation of Pancreatic β Cell Mass by the mTOR Complex 1 Pathway In Vivo
20
Regulation of Pancreatic β Cell Mass by the mTOR Complex 1 Pathway In Vivo
21
FIG. 3. Increased β cell mass and cell growth in transgenic mice. A: Hematoxylin and eosin staining of representative pancreatic sections from 8-week-old R3 transgenic mice (R3) and their wild type littermates (WT). B and C: Immunostaining with the anti-FLAG antibody (B) and anti-phospho-S6 (Ser235/236) antibody (C, upper) of representative pancreatic sections from 8-week-old R3 transgenic mice (R3) and wild type littermates (WT). Ratio of the number of dark staining cells to the total number of nuclei in islets from transgenic mice (black bar) and wild type littermates (white bar) is shown (C, lower). D: Hematoxylin and eosin staining (H–E) and immunostaining with the anti-FLAG antibody (Anti-FLAG) of representative pancreatic sections from 90-week-old R3 transgenic mice (R3) and their wild type littermates (WT). E: Immunostaining with the anti-insulin (red) and the anti-glucagon (green) antibodies of representative pancreatic sections from 8-week-old R3 transgenic mice (R3) and their wild type littermates (WT). F: Quantification of β and α cell area as a percentage of total pancreatic area in transgenic mice (black bar) and their wild type littermates (white bar). G: β cell mass was calculated by the β cell area and pancreas weight. H: The relative size of β cells in the transgenic mice (black bar) and their wild type littermates (white bar) was calculated. I: Immunostaining with anti-Ki-67 antibody of representative pancreatic sections from 9-week-old R3 transgenic mice and their wild type littermates. Data are the mean ± SE of values from 4 (C), 5 (F), 4 (G), 5(H) animals from each genotype. *P < 0.05, **P < 0.01.
Regulation of Pancreatic β Cell Mass by the mTOR Complex 1 Pathway In Vivo
22
Regulation of Pancreatic β Cell Mass by the mTOR Complex 1 Pathway In Vivo
23
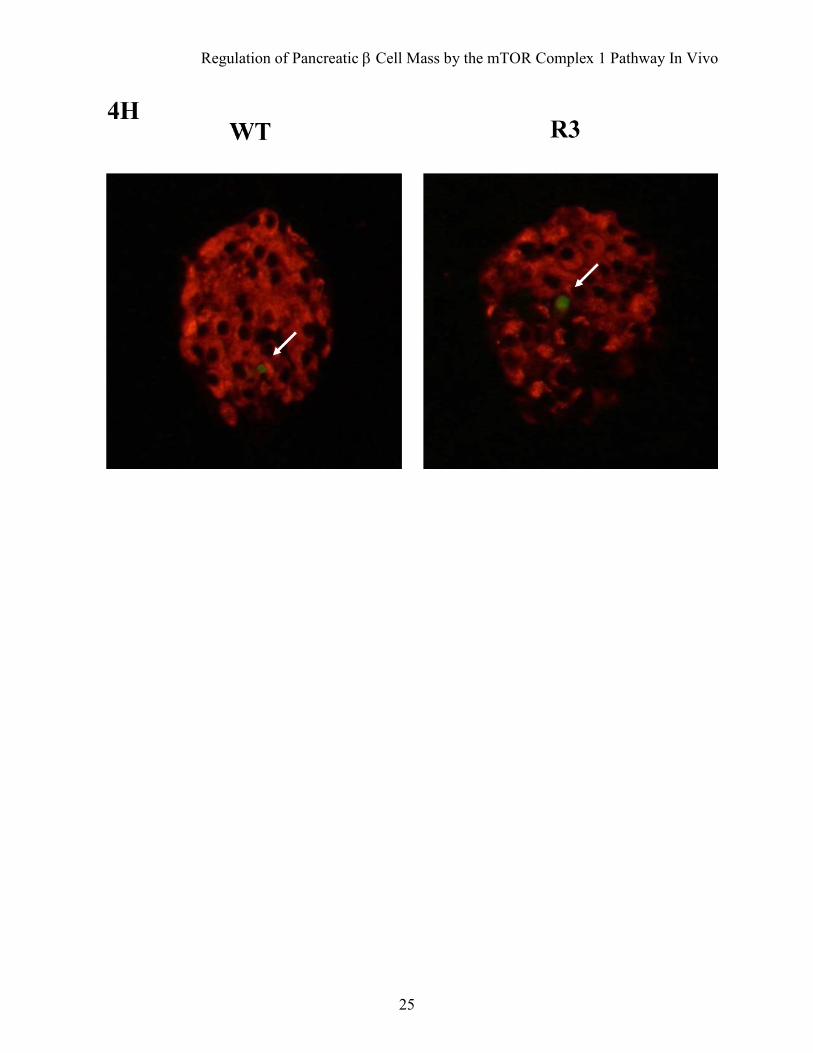
FIG. 4. Transgenic mice were resistant to streptozotocin-induced hyperglycemia. A: Doses of 40 mg/kg or 50 mg/kg streptozotocin were administered to R3 line transgenic mice (filled circles) or wild type littermates (open circles) for five consecutive days (arrows in the figure). Blood glucose concentrations in the fed state were monitored. Data are the mean ± SE of values from 4 (40 mg/kg) or 5 (50 mg/kg) animals from each genotype. B: A dose of 50 mg/kg streptozotocin was administered to R20 transgenic mice (filled circles) or wild type littermates (open circles) and blood glucose concentrations were monitored with mice in the fed state. Data are the mean ± SE of values from 4 animals from each genotype. C and D: Plasma insulin concentration (C) and glucose/insulin ratio (D) after treatment with or without 50 mg/kg streptozotocin as shown in (A). E: Oral glucose tolerance tests were performed in R20 transgenic mice (filled circles) and wild type littermates (open circles) 4 weeks after streptozotocin treatment as shown in (B). Glucose and insulin concentrations are shown. F: Immunostaining with the anti-insulin (red) and anti-glucagon (green) antibodies of representative pancreatic sections from R3 transgenic mice (R3) and their wild type littermates (WT) 4 weeks after 50 mg/kg streptozotocin treatment as shown in (A). G: Quantification of β cell area as a percentage of total pancreatic area in transgenic mice (black bar) and their wild type littermates (white bar) 4 weeks after treatment with or without 50 mg/kg streptozotocin as shown in (A). H: Immunostaining with the anti-insulin (red) antibody and TUNEL assay (green) of representative pancreatic sections from the transgenic mice and their wild type littermates 1 week after 50 mg/kg streptozotocin treatment. Values represent the mean ± SE. *P < 0.05, * *P < 0.01.
Regulation of Pancreatic β Cell Mass by the mTOR Complex 1 Pathway In Vivo
24
Regulation of Pancreatic β Cell Mass by the mTOR Complex 1 Pathway In Vivo
25
Regulation of Pancreatic β Cell Mass by the mTOR Complex 1 Pathway In Vivo
26
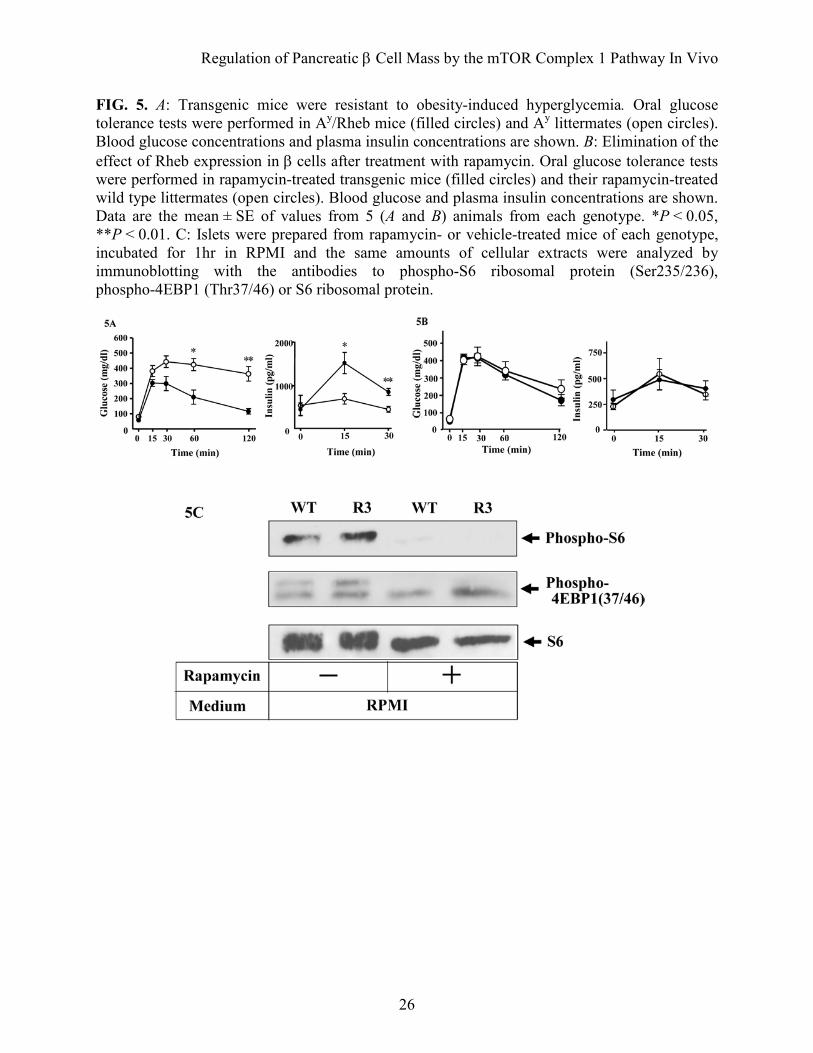
FIG. 5. A: Transgenic mice were resistant to obesity-induced hyperglycemia. Oral glucose tolerance tests were performed in Ay/Rheb mice (filled circles) and Ay littermates (open circles). Blood glucose concentrations and plasma insulin concentrations are shown. B: Elimination of the effect of Rheb expression in β cells after treatment with rapamycin. Oral glucose tolerance tests were performed in rapamycin-treated transgenic mice (filled circles) and their rapamycin-treated wild type littermates (open circles). Blood glucose and plasma insulin concentrations are shown. Data are the mean ± SE of values from 5 (A and B) animals from each genotype. *P < 0.05, **P < 0.01. C: Islets were prepared from rapamycin- or vehicle-treated mice of each genotype, incubated for 1hr in RPMI and the same amounts of cellular extracts were analyzed by immunoblotting with the antibodies to phospho-S6 ribosomal protein (Ser235/236), phospho-4EBP1 (Thr37/46) or S6 ribosomal protein.
Top Related