


γλώσσες
Σελίδες
Νομικός

MIT Lincoln LaboratoryC. D. Richmond-1Tuesday 6th June
ASAP 2006
Signal Model Mismatch and Maximum-Likelihood
Mean-Squared Error Performance
Christ D. Richmond
The Adaptive Sensor Array Processing Workshop MIT Lincoln Laboratory
Session 2A: Adaptive Detection and Estimation 3:50pm, Tuesday 6th June 2006
*This work was sponsored by NAVSEA PEO-IWSS Air Force contract FA8721-05-C-0002. Opinions, interpretations, conclusions, and recommendations are those of the author and are not necessarily endorsed by the United States Government.
MIT Lincoln LaboratoryC. D. Richmond-2Tuesday 6th June
ASAP 2006
Outline
• Introduction
– Problem description
– Goals of analysis
• Mean-squared error prediction
• Numerical examples
• Summary
MIT Lincoln LaboratoryC. D. Richmond-3Tuesday 6th June
ASAP 2006
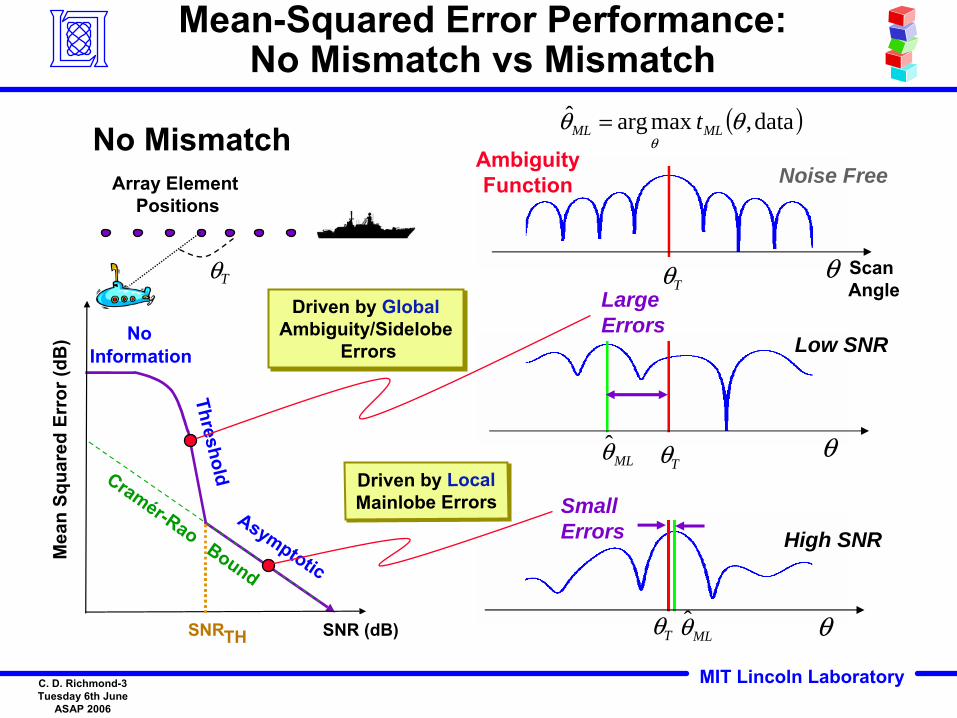
No Information
Threshold
Asymptotic
Mea
n Sq
uare
d Er
ror (
dB)
SNR (dB)SNRTH
Cram�r-Rao Bound
Mean-Squared Error Performance:No Mismatch vs Mismatch
θT
No MismatchArray Element
Positions
θ θT ˆ θ ML
Low SNR
LargeErrors
Driven by GlobalAmbiguity/Sidelobe
Errors
Driven by GlobalAmbiguity/Sidelobe
Errors
( )data, maxargˆ θθθ
MLML t=
Scan Angle
θ θT
Noise FreeAmbiguityFunction
Cramér-RaoBound
θ θT ˆ θ ML
High SNRSmallErrors
Driven by LocalMainlobe ErrorsDriven by LocalMainlobe Errors
MIT Lincoln LaboratoryC. D. Richmond-4Tuesday 6th June
ASAP 2006
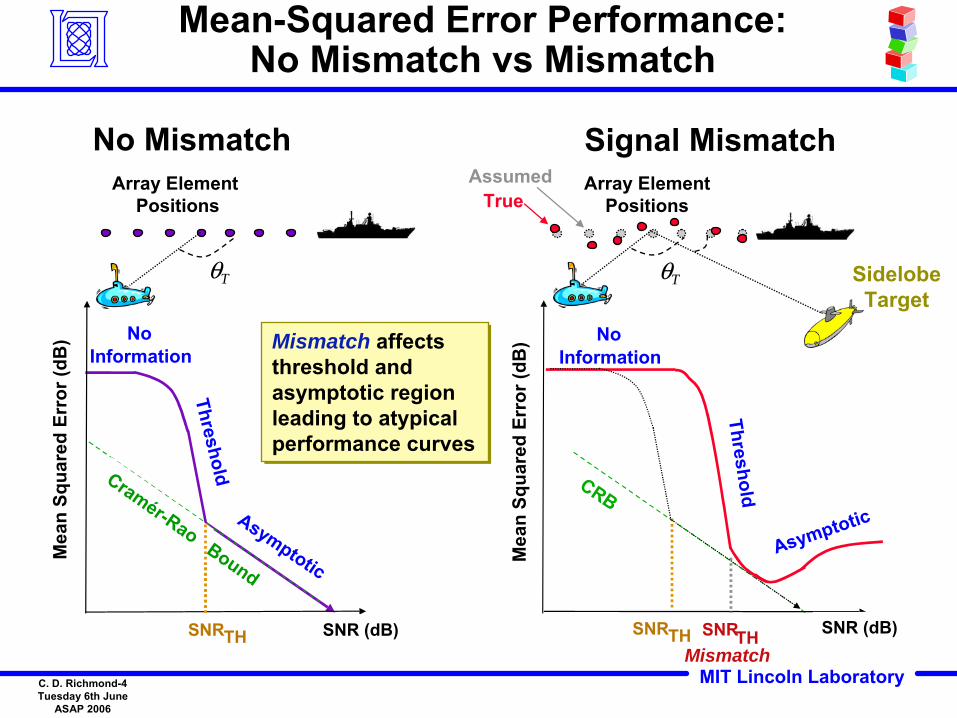
No Information
Threshold
Asymptotic
Mea
n Sq
uare
d Er
ror (
dB)
SNR (dB)SNRTH
Cram�r-Rao Bound
Mean-Squared Error Performance:No Mismatch vs Mismatch
Array Element Positions
Array ElementPositions
No Mismatch Signal Mismatch
TrueAssumed
θT θT SidelobeTarget
SidelobeTarget
Mismatch affects threshold and asymptotic region leading to atypical performance curves
Mismatch affects threshold and asymptotic region leading to atypical performance curves
Cramér-Rao
Cramér-RaoBound
No Information
Threshold
Asymptotic
CRB
SNR (dB)SNRTH
Mea
n Sq
uare
d Er
ror (
dB)
MismatchSNRTH
MIT Lincoln LaboratoryC. D. Richmond-5Tuesday 6th June
ASAP 2006
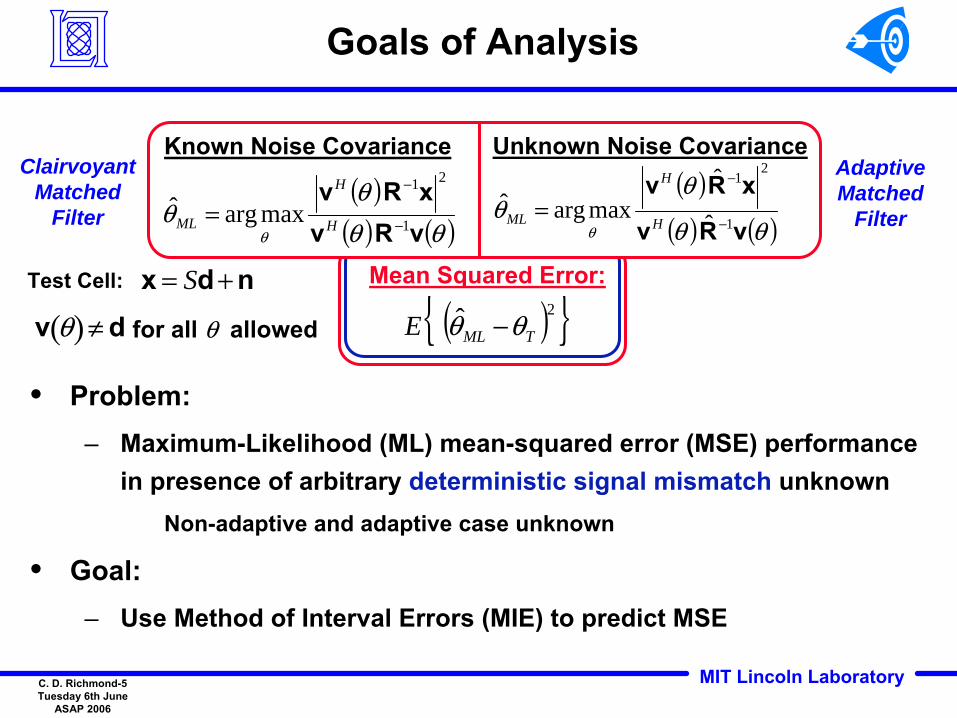
Goals of Analysis
• Problem:– Maximum-Likelihood (ML) mean-squared error (MSE) performance
in presence of arbitrary deterministic signal mismatch unknown Non-adaptive and adaptive case unknown
• Goal:– Use Method of Interval Errors (MIE) to predict MSE
ClairvoyantMatched
Filter
Adaptive Matched
Filter
( ){ }2ˆ TMLE θθ −( ){ }2ˆ TMLE θθ −
Mean Squared Error:
( )( ) ( )θθ
θθ
θ vRv
xRv1
21
ˆ
ˆ maxargˆ
−
−
=H
H
ML
Known Noise Covariance Unknown Noise Covariance
( )( ) ( )θθ
θθ
θ vRvxRv
1
21
maxargˆ−
−
= H
H
ML
x = Sd + n x = Sd + n
v θ( )≠ d v θ( )≠ d
Test Cell:
for all θ allowed
MIT Lincoln LaboratoryC. D. Richmond-6Tuesday 6th June
ASAP 2006
Outline
• Introduction
• Mean-squared error prediction
– Method of interval errors (MIE)
• Numerical examples
• Summary
MIT Lincoln LaboratoryC. D. Richmond-7Tuesday 6th June
ASAP 2006
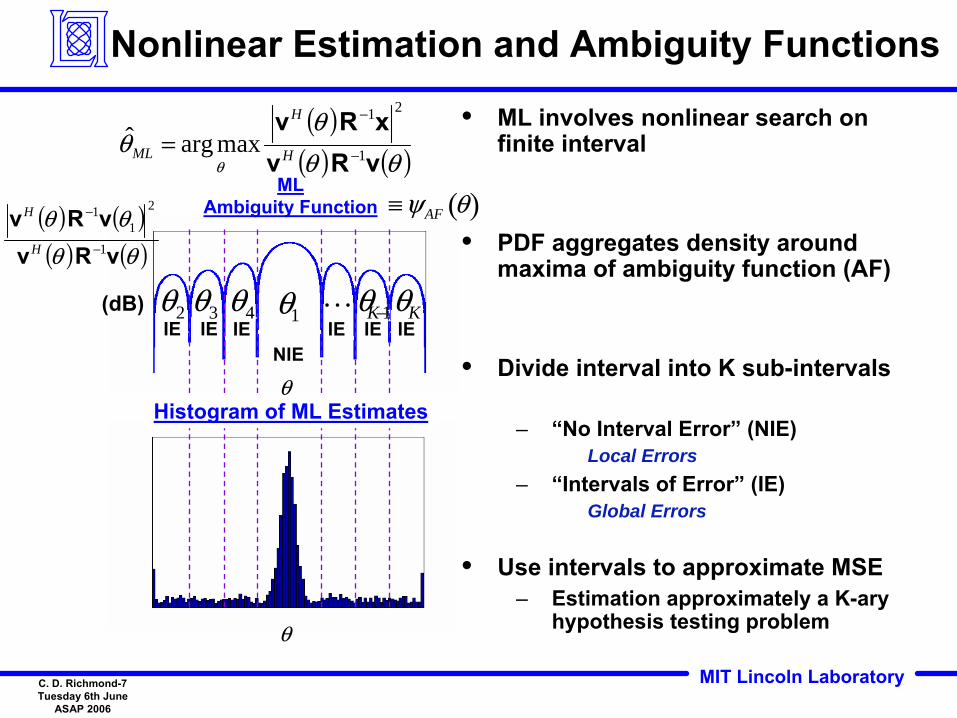
Nonlinear Estimation and Ambiguity Functions
MLAmbiguity Function
• ML involves nonlinear search on finite interval
• PDF aggregates density around maxima of ambiguity function (AF)
• Divide interval into K sub-intervals
– “No Interval Error” (NIE) Local Errors
– “Intervals of Error” (IE) Global Errors
• Use intervals to approximate MSE– Estimation approximately a K-ary
hypothesis testing problem
( )( ) ( )θθ
θθ
θ vRvxRv
1
21
maxargˆ−
−
= H
H
ML
θθ
( ) ( )( ) ( )θθ
θθvRv
vRv1
2
11
−
−
H
H
θ1θ1θ2θ2 θ3θ3 θK−1 θK−1θ4θ4 θK θK IE IE IE IE IE IE
NIE
(dB)
Histogram of ML Estimatesθθ
≡ψAF θ( )
MIT Lincoln LaboratoryC. D. Richmond-8Tuesday 6th June
ASAP 2006
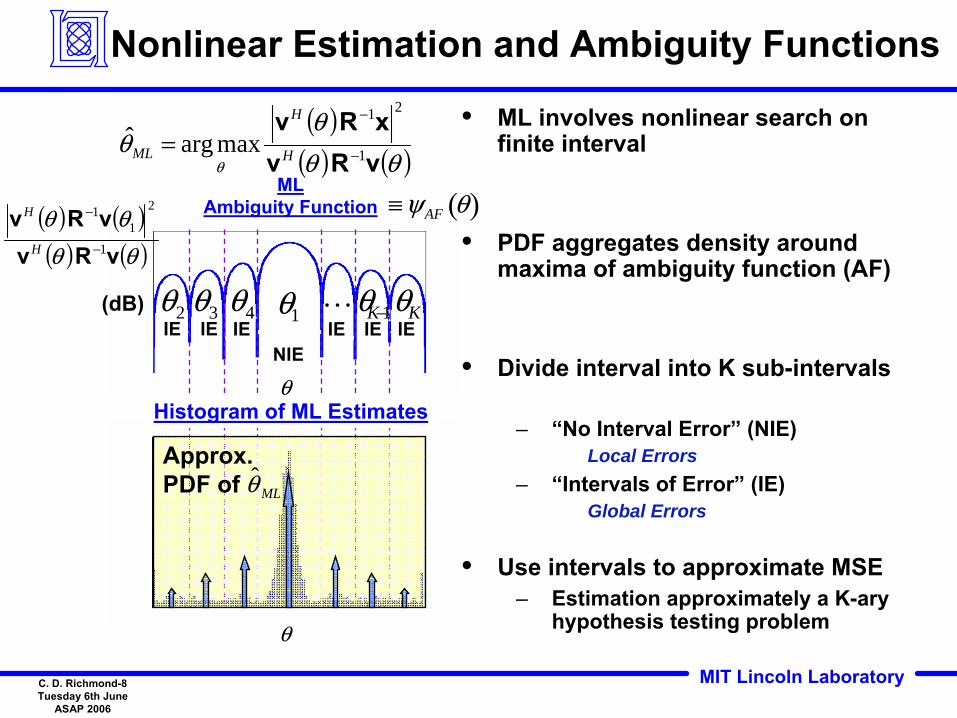
Nonlinear Estimation and Ambiguity Functions
MLAmbiguity Function
• ML involves nonlinear search on finite interval
• PDF aggregates density around maxima of ambiguity function (AF)
• Divide interval into K sub-intervals
– “No Interval Error” (NIE) Local Errors
– “Intervals of Error” (IE) Global Errors
• Use intervals to approximate MSE– Estimation approximately a K-ary
hypothesis testing problem
( )( ) ( )θθ
θθ
θ vRvxRv
1
21
maxargˆ−
−
= H
H
ML
θθ
( ) ( )( ) ( )θθ
θθvRv
vRv1
2
11
−
−
H
H
θ1θ1θ2θ2 θ3θ3 θK−1 θK−1θ4θ4 θK θK IE IE IE IE IE IE
NIE
Approx. PDF of ˆ θ ML
(dB)
Histogram of ML Estimatesθθ
≡ψAF θ( )
MIT Lincoln LaboratoryC. D. Richmond-9Tuesday 6th June
ASAP 2006
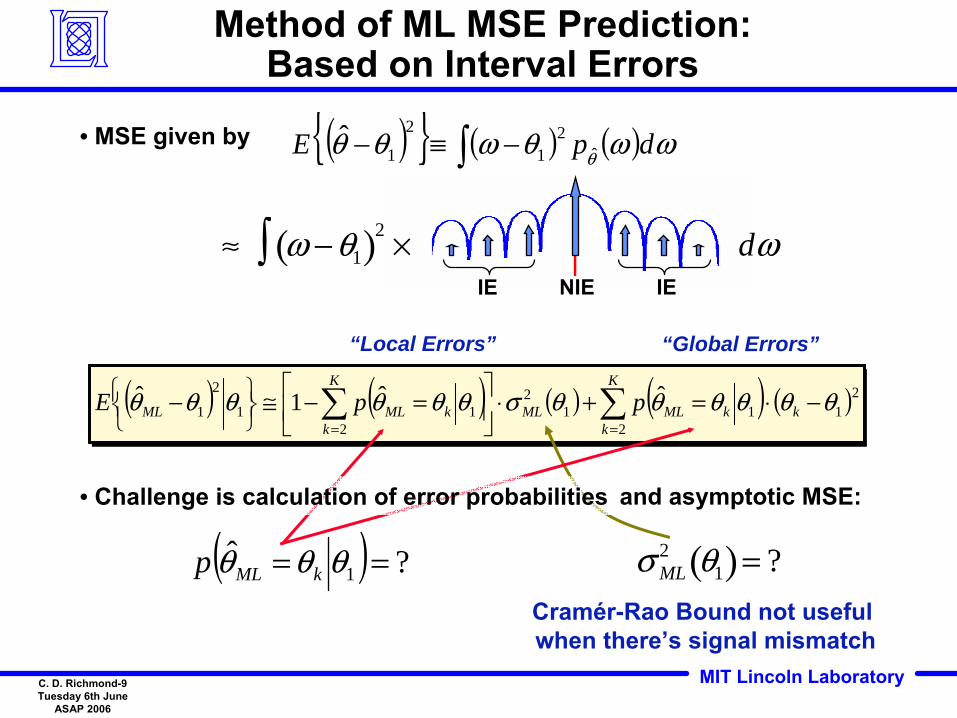
Method of ML MSE Prediction:Based on Interval Errors
• MSE given by ( ){ } ( ) ( )∫ −≡− ωωθωθθ θ dpE ˆ2
1
2
1ˆ
≈ ω −θ1( )2 × dω∫NIEIE IE
“Global Errors”
( ) ( ) ( ) ( ) ( )21
211
2
211
2
1ˆˆ1ˆ θθθθθθσθθθθθθ −⋅=+⋅⎥
⎦
⎤⎢⎣
⎡ =−≅⎭⎬⎫
⎩⎨⎧ − ∑∑
==k
K
kkMLML
K
kkMLML ppE
“Local Errors”
Cramér-Rao Bound not useful when there’s signal mismatch
σ ML2 θ1( )= ?
and asymptotic MSE:
( ) ?ˆ1 == θθθ kMLp
• Challenge is calculation of error probabilities
MIT Lincoln LaboratoryC. D. Richmond-10Tuesday 6th June
ASAP 2006
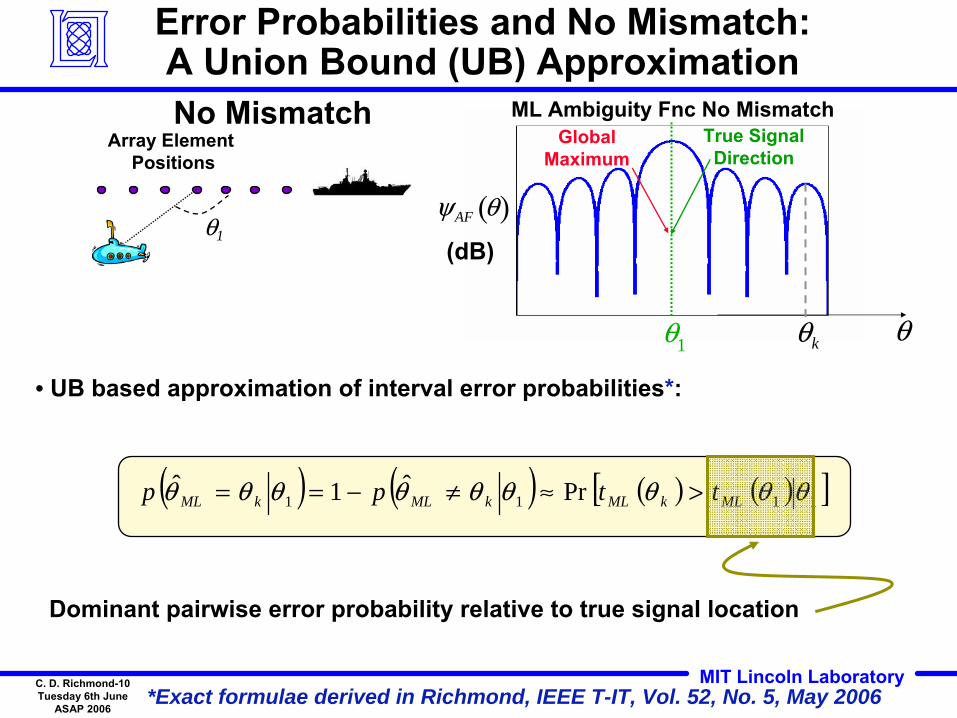
Error Probabilities and No Mismatch:A Union Bound (UB) Approximation
θ1
True SignalDirection
GlobalMaximum
θ θk
Array Element Positions
θ1 ψAF θ( )(dB)
ML Ambiguity Fnc No Mismatch
*Exact formulae derived in Richmond, IEEE T-IT, Vol. 52, No. 5, May 2006
No Mismatch
• UB based approximation of interval error probabilities*:
( ) ( ) ( ) ( )[ ]1111 Prˆ1ˆ θθθθθθθθθ MLkMLkMLkML ttpp >≈≠−==
Dominant pairwise error probability relative to true signal location
MIT Lincoln LaboratoryC. D. Richmond-11Tuesday 6th June
ASAP 2006
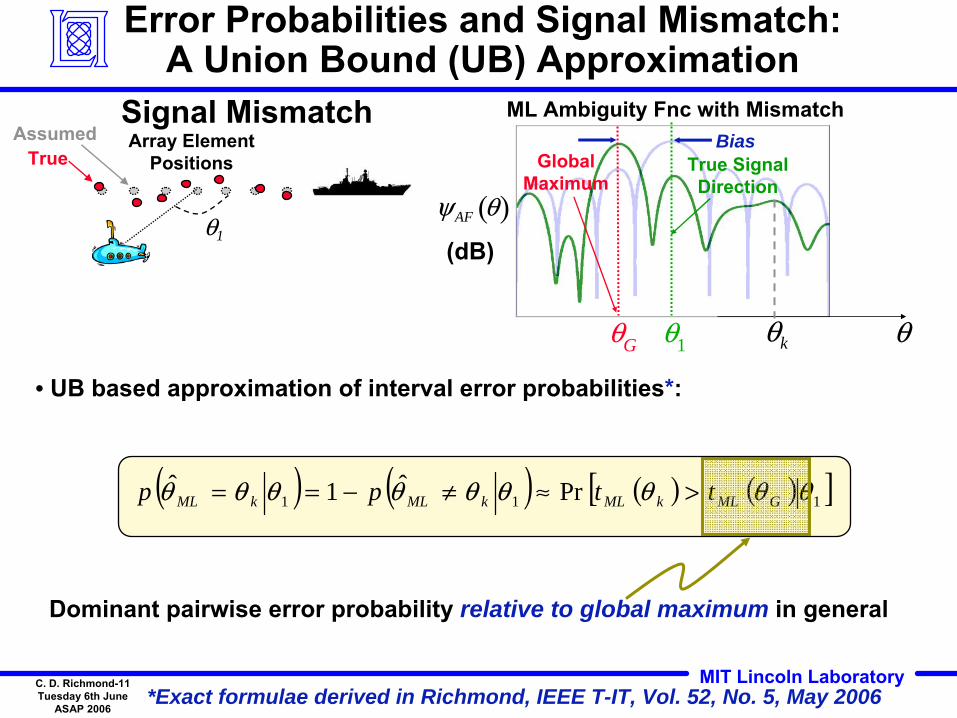
Error Probabilities and Signal Mismatch:A Union Bound (UB) Approximation
ψAF θ( )(dB)
ML Ambiguity Fnc with Mismatch
θθ1
True SignalDirection
θG
GlobalMaximum
BiasArray ElementPositionsTrue
Assumed
θk
θ1
*Exact formulae derived in Richmond, IEEE T-IT, Vol. 52, No. 5, May 2006
Signal Mismatch
( ) ( ) ( ) ( )[ ]111 Prˆ1ˆ θθθθθθθθθ GMLkMLkMLkML ttpp >≈≠−==
• UB based approximation of interval error probabilities*:
Dominant pairwise error probability relative to global maximum in general
MIT Lincoln LaboratoryC. D. Richmond-12Tuesday 6th June
ASAP 2006
ψAF θ( )(dB)
ML Ambiguity Fnc with Mismatch
θθ1
True SignalDirection
θG
GlobalMaximum
Bias
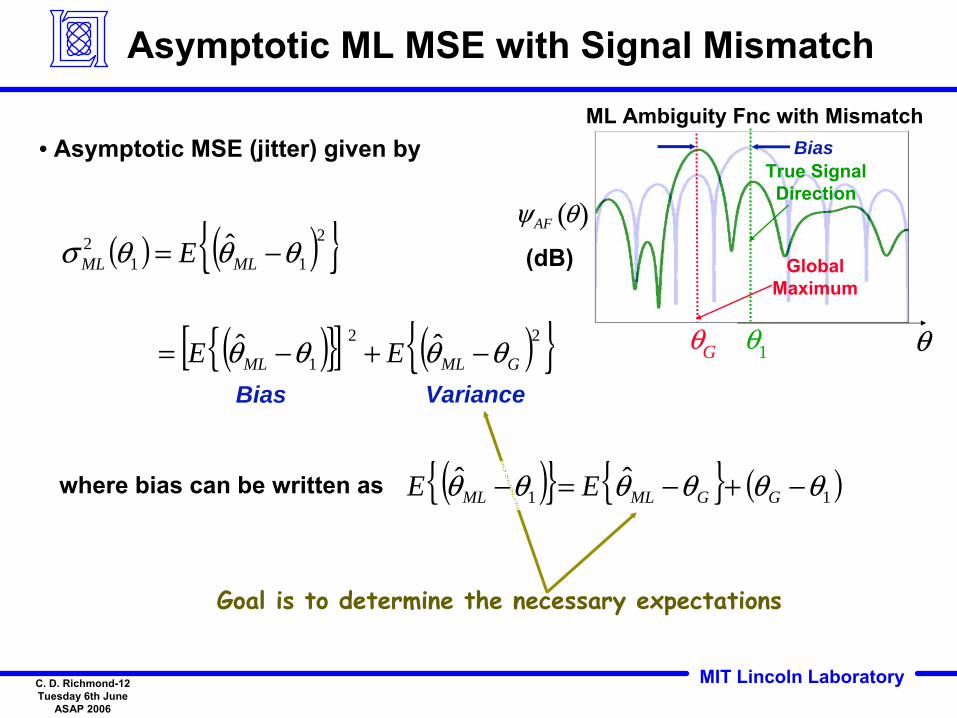
Asymptotic ML MSE with Signal Mismatch
( ) ( ){ }2
112 ˆ θθθσ −= MLML E
( ){ }[ ] ( ){ }22
1ˆ ˆ GMLML EE θθθθ −+−=
Bias Variance
• Asymptotic MSE (jitter) given by
Goal is to determine the necessary expectations
( ){ } { } ( )11ˆ ˆ θθθθθθ −+−=− GGMLML EEwhere bias can be written as
MIT Lincoln LaboratoryC. D. Richmond-13Tuesday 6th June
ASAP 2006
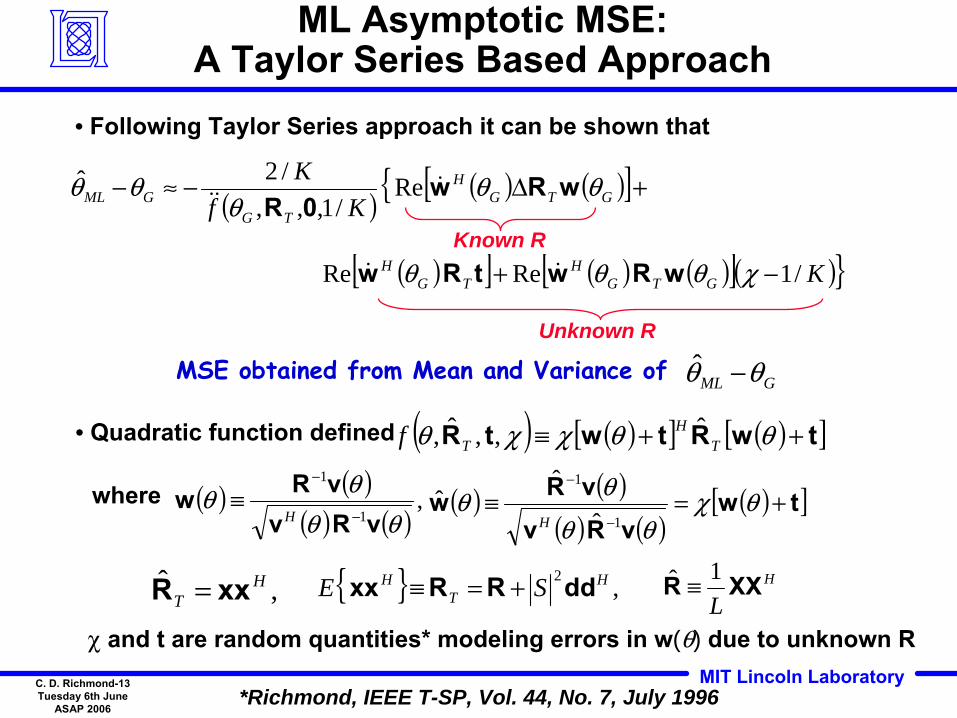
ML Asymptotic MSE:A Taylor Series Based Approach
( ) ( ) ( )[ ]{ +Δ−≈− GTGH
TGGML Kf
K θθθ
θθ wRw0R
Re /1,,,
/2ˆ
• Following Taylor Series approach it can be shown that
MSE obtained from Mean and Variance of GML θθ −ˆ
Known R
Unknown R
*Richmond, IEEE T-SP, Vol. 44, No. 7, July 1996
,ˆ HT xxR =
( ) ( )[ ] ( )[ ]twRtwtR ++≡ θθχχθ TH
Tf ˆ,,ˆ,• Quadratic function defined
{ } , 2 HT
H SE ddRRxx +=≡
( ) ( )( ) ( )
, 1
1
θθθθ
vRvvRw
−
−
≡H
where
χ and t are random quantities* modeling errors in w(θ) due to unknown R
( ) ( )( ) ( )
( )[ ]twvRv
vRw +=≡−
−
θχθθ
θθ1
1
ˆ
ˆˆ
H
H
LXXR 1ˆ ≡
( )[ ] ( ) ( )[ ]( )}KGTGH
TGH /1 Re Re −+ χθθθ wRwtRw
MIT Lincoln LaboratoryC. D. Richmond-14Tuesday 6th June
ASAP 2006
Outline
• Introduction
• Mean-squared error prediction
• Numerical examples
– known noise covariance
– unknown noise covariance
• Summary
MIT Lincoln LaboratoryC. D. Richmond-15Tuesday 6th June
ASAP 2006
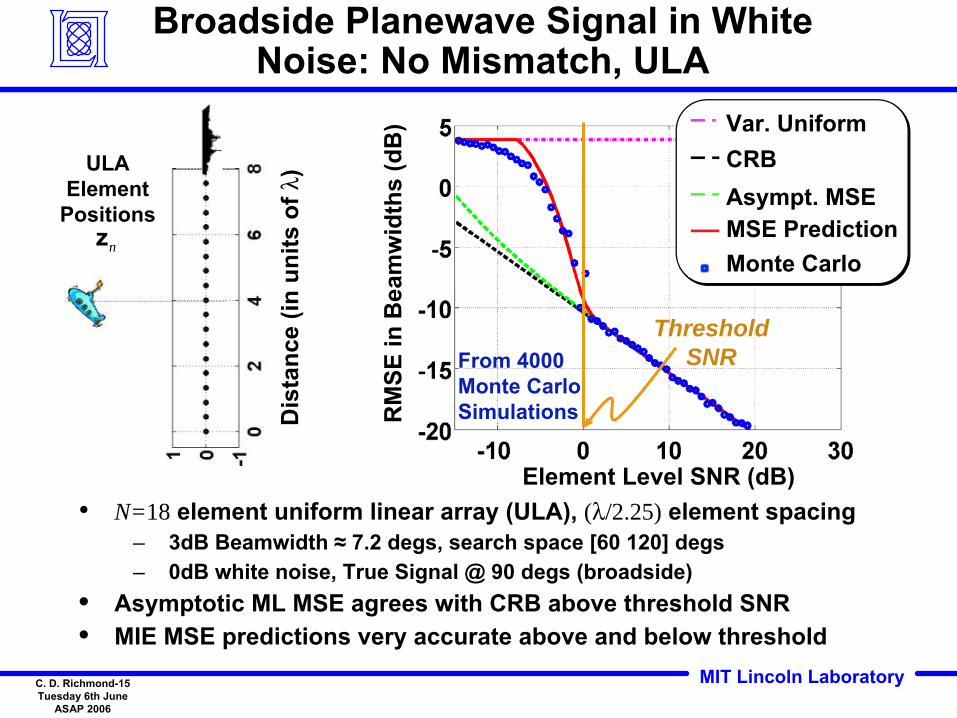
Broadside Planewave Signal in White Noise: No Mismatch, ULA
• N=18 element uniform linear array (ULA), (λ/2.25) element spacing– 3dB Beamwidth ≈ 7.2 degs, search space [60 120] degs– 0dB white noise, True Signal @ 90 degs (broadside)
• Asymptotic ML MSE agrees with CRB above threshold SNR• MIE MSE predictions very accurate above and below threshold
Element Level SNR (dB)
RM
SE in
Bea
mw
idth
s(d
B)
From 4000Monte CarloSimulations
ThresholdSNR
Var. UniformCRBAsympt. MSEMSE PredictionMonte Carlo
Dis
tanc
e (in
uni
ts o
f λ)ULA
ElementPositions
zn
MIT Lincoln LaboratoryC. D. Richmond-16Tuesday 6th June
ASAP 2006
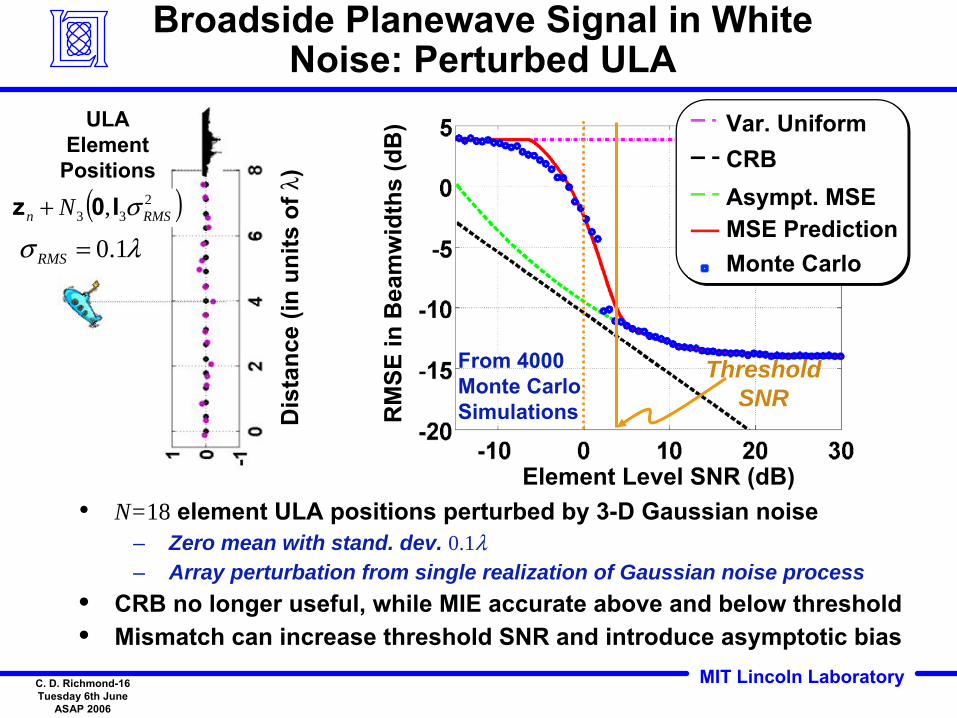
Broadside Planewave Signal in White Noise: Perturbed ULA
• N=18 element ULA positions perturbed by 3-D Gaussian noise– Zero mean with stand. dev. 0.1λ– Array perturbation from single realization of Gaussian noise process
• CRB no longer useful, while MIE accurate above and below threshold• Mismatch can increase threshold SNR and introduce asymptotic bias
RM
SE in
Bea
mw
idth
s(d
B)
Element Level SNR (dB)
ThresholdSNR
From 4000Monte CarloSimulations
Var. UniformCRBAsympt. MSEMSE PredictionMonte Carlo
( )233 , RMSn N σI0z +
λσ 1.0=RMS
Dis
tanc
e (in
uni
ts o
f λ)
ULAElement
Positions
MIT Lincoln LaboratoryC. D. Richmond-17Tuesday 6th June
ASAP 2006
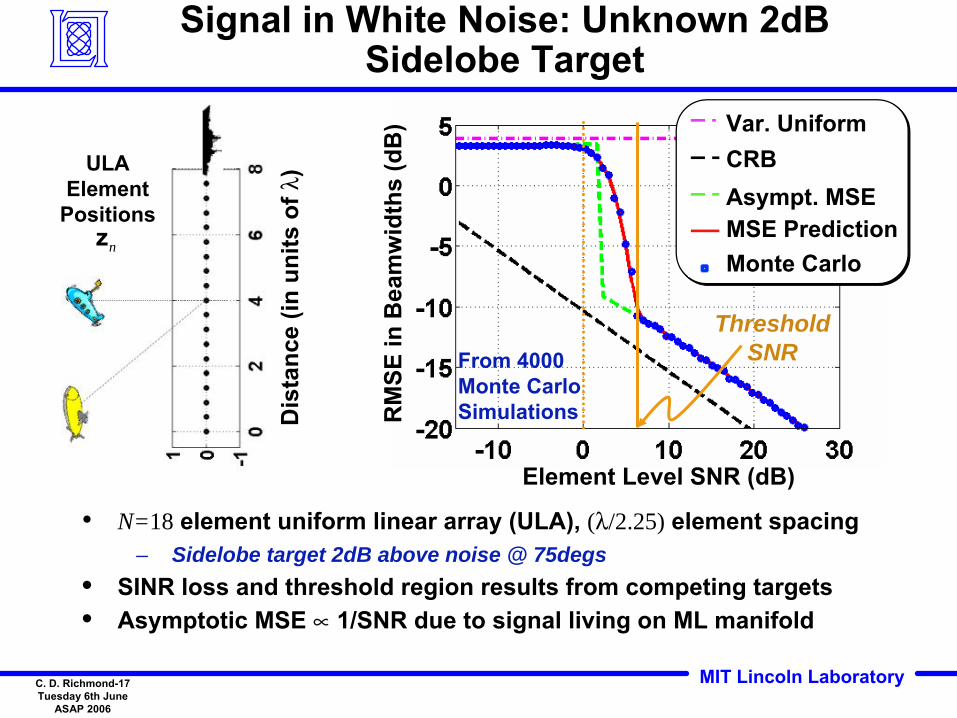
• N=18 element uniform linear array (ULA), (λ/2.25) element spacing– Sidelobe target 2dB above noise @ 75degs
• SINR loss and threshold region results from competing targets• Asymptotic MSE ∝ 1/SNR due to signal living on ML manifold
Element Level SNR (dB)
RM
SE in
Bea
mw
idth
s(d
B)
ThresholdSNRFrom 4000
Monte CarloSimulations
Signal in White Noise: Unknown 2dB Sidelobe Target
Var. UniformCRBAsympt. MSEMSE PredictionMonte Carlo
Dis
tanc
e (in
uni
ts o
f λ)ULA
ElementPositions
zn
MIT Lincoln LaboratoryC. D. Richmond-18Tuesday 6th June
ASAP 2006
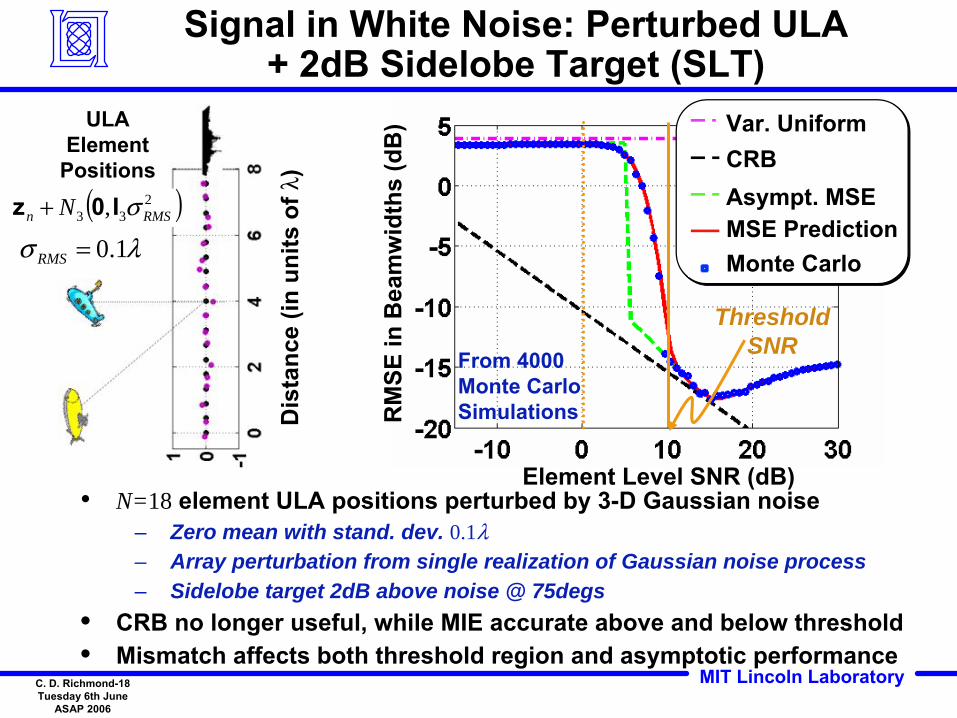
Signal in White Noise: Perturbed ULA + 2dB Sidelobe Target (SLT)
• N=18 element ULA positions perturbed by 3-D Gaussian noise– Zero mean with stand. dev. 0.1λ– Array perturbation from single realization of Gaussian noise process– Sidelobe target 2dB above noise @ 75degs
• CRB no longer useful, while MIE accurate above and below threshold• Mismatch affects both threshold region and asymptotic performance
RM
SE in
Bea
mw
idth
s(d
B)
Element Level SNR (dB)
ThresholdSNRFrom 4000
Monte CarloSimulations
Var. UniformCRBAsympt. MSEMSE PredictionMonte Carlo
( )233 , RMSn N σI0z +
λσ 1.0=RMS
Dis
tanc
e (in
uni
ts o
f λ)
ULAElement
Positions
MIT Lincoln LaboratoryC. D. Richmond-19Tuesday 6th June
ASAP 2006
Outline
• Introduction
• Mean-squared error prediction
• Numerical examples
– known noise covariance
– unknown noise covariance
• Summary
MIT Lincoln LaboratoryC. D. Richmond-20Tuesday 6th June
ASAP 2006
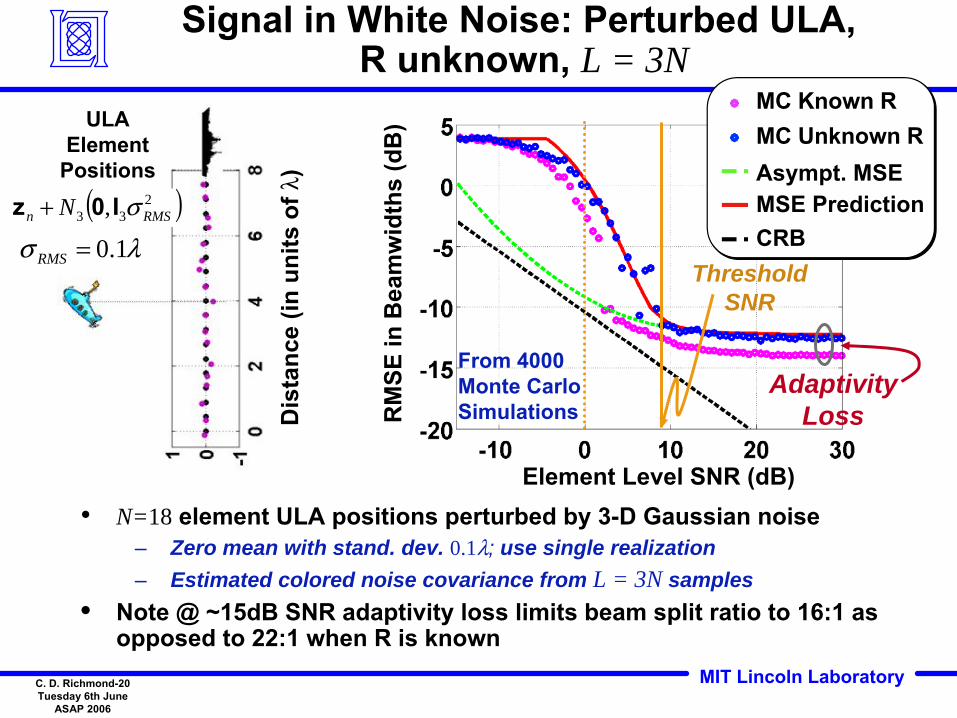
Signal in White Noise: Perturbed ULA,R unknown, L = 3N
• N=18 element ULA positions perturbed by 3-D Gaussian noise– Zero mean with stand. dev. 0.1λ; use single realization – Estimated colored noise covariance from L = 3N samples
• Note @ ~15dB SNR adaptivity loss limits beam split ratio to 16:1 as opposed to 22:1 when R is known
RM
SE in
Bea
mw
idth
s(d
B)
Element Level SNR (dB)
ThresholdSNR
From 4000Monte CarloSimulations
AdaptivityLoss
MC Known RMC Unknown RAsympt. MSEMSE PredictionCRB
( )233 , RMSn N σI0z +
λσ 1.0=RMS
Dis
tanc
e (in
uni
ts o
f λ)
ULAElement
Positions
MIT Lincoln LaboratoryC. D. Richmond-21Tuesday 6th June
ASAP 2006
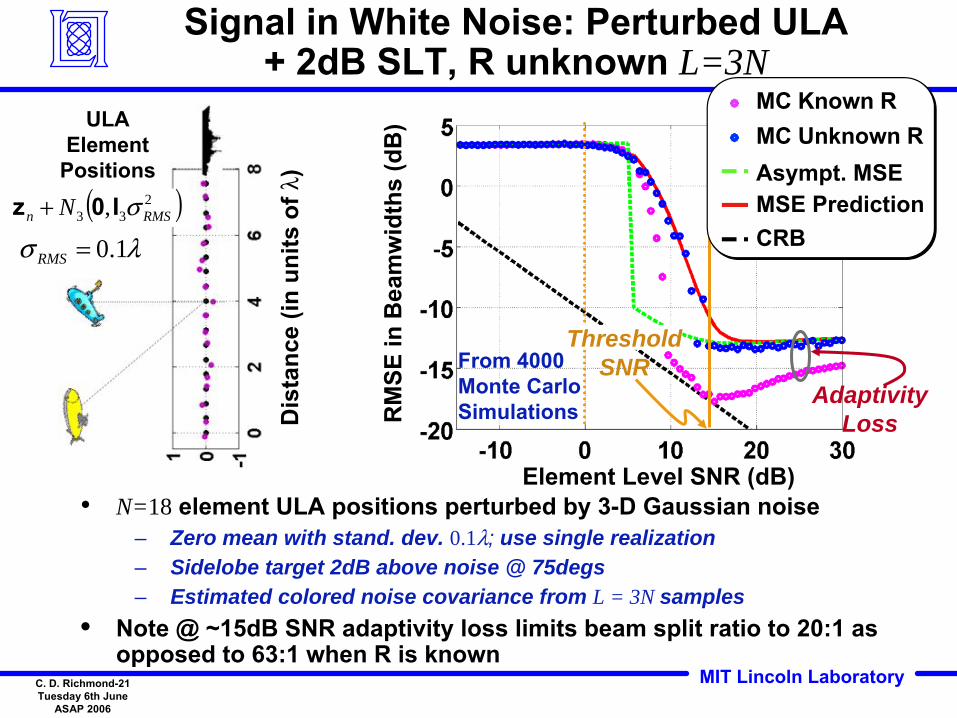
Signal in White Noise: Perturbed ULA + 2dB SLT, R unknown L=3N
• N=18 element ULA positions perturbed by 3-D Gaussian noise– Zero mean with stand. dev. 0.1λ; use single realization – Sidelobe target 2dB above noise @ 75degs– Estimated colored noise covariance from L = 3N samples
• Note @ ~15dB SNR adaptivity loss limits beam split ratio to 20:1 as opposed to 63:1 when R is known
RM
SE in
Bea
mw
idth
s(d
B)
Element Level SNR (dB)
From 4000Monte CarloSimulations
AdaptivityLoss
ThresholdSNR
MC Known RMC Unknown RAsympt. MSEMSE PredictionCRB
( )233 , RMSn N σI0z +
λσ 1.0=RMS
Dis
tanc
e (in
uni
ts o
f λ)
ULAElement
Positions
MIT Lincoln LaboratoryC. D. Richmond-22Tuesday 6th June
ASAP 2006
Outline
• Introduction
• Mean-squared error prediction
• Numerical examples
• Summary
MIT Lincoln LaboratoryC. D. Richmond-23Tuesday 6th June
ASAP 2006
Summary
• Developed theory to predict impact of signal mismatch on ML estimation accuracy
– arbitrary deterministic signal mismatch allowed
– above and below threshold SNR performance considered
– finite sample effects due to noise covariance estimation included
• Generalizes previous work on ML threshold region performance and provides tools useful for system design and analysis
• Circumvents need for time consuming Monte Carlo simulations
• Asymptotic ML MSE easily extended to stochastic signal mismatch
Top Related