


γλώσσες
Σελίδες
Νομικός

Principles
Case Study
Spectrum inventory and uti l izat ion evaluation
Summary
01
02
03
04

Principles
Principles
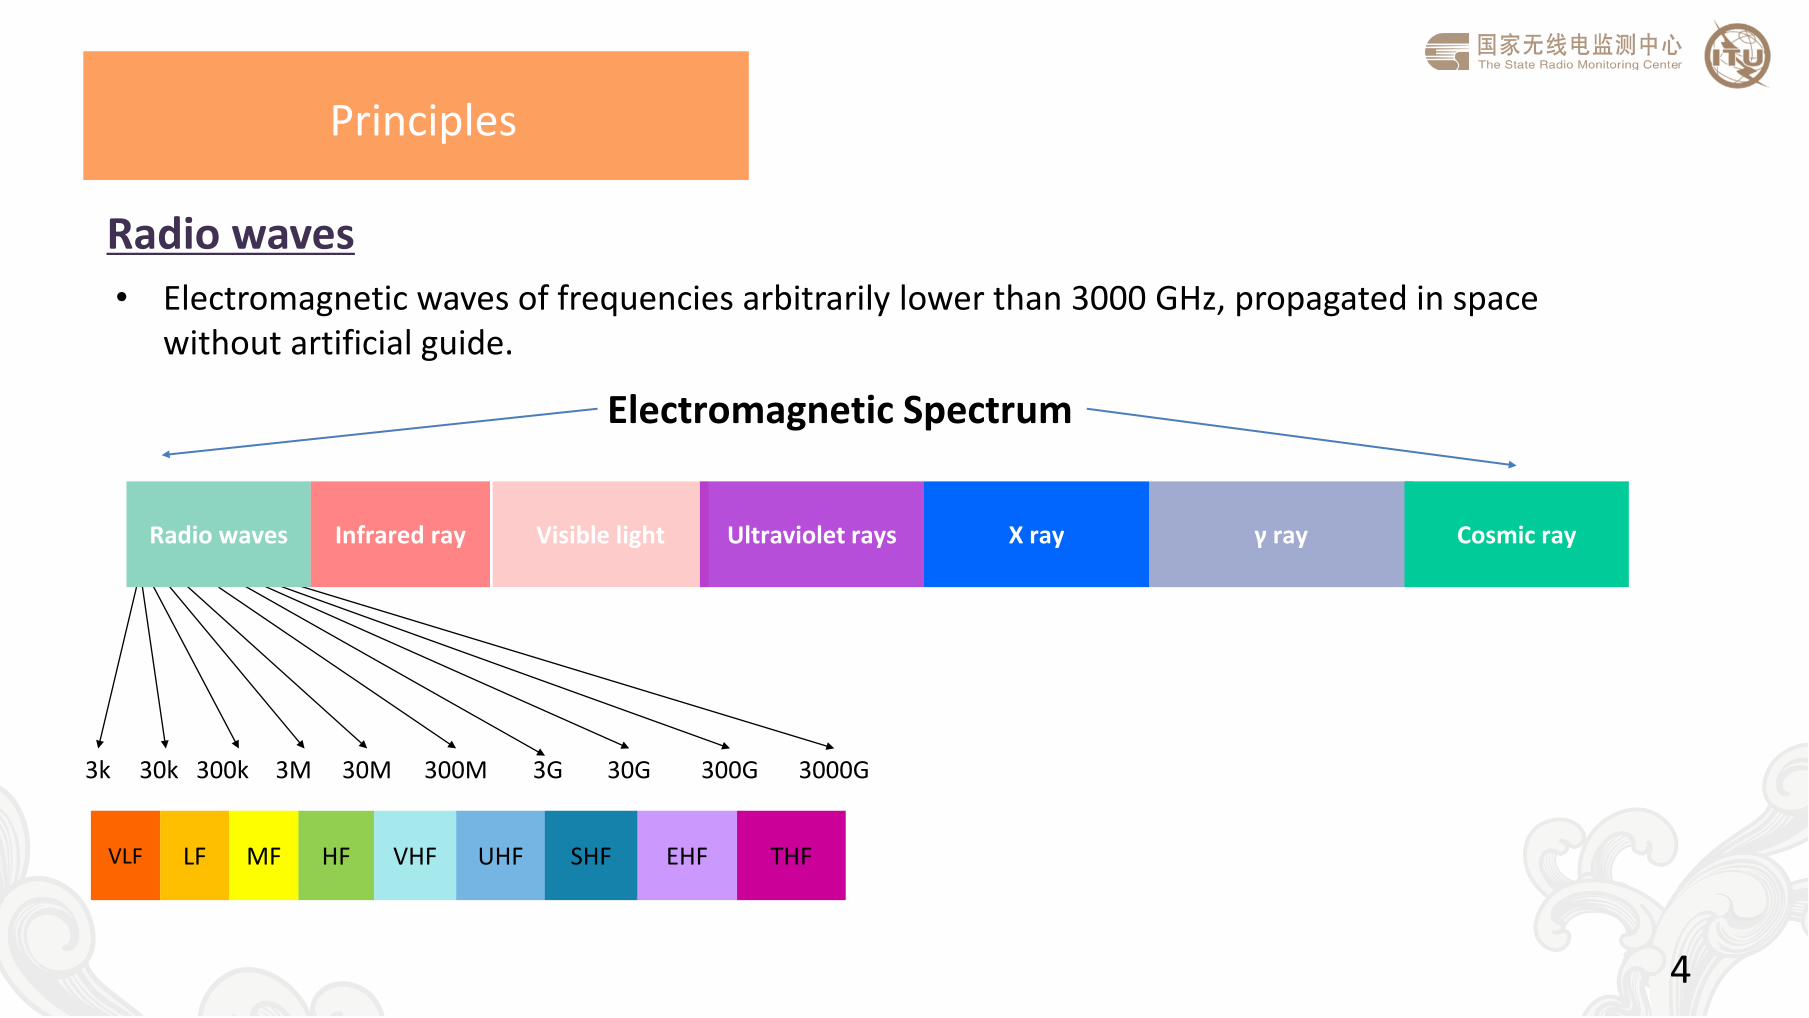
Radio waves
THF EHF VLF LF HF VHF UHF SHF MF
3k 300k 30k 3M 30M 300M 3G 30G 300G 3000G
γ ray X ray Radio waves Infrared ray Visible light Ultraviolet rays Cosmic ray
Electromagnetic Spectrum
• Electromagnetic waves of frequencies arbitrarily lower than 3000 GHz, propagated in space without artificial guide.
4
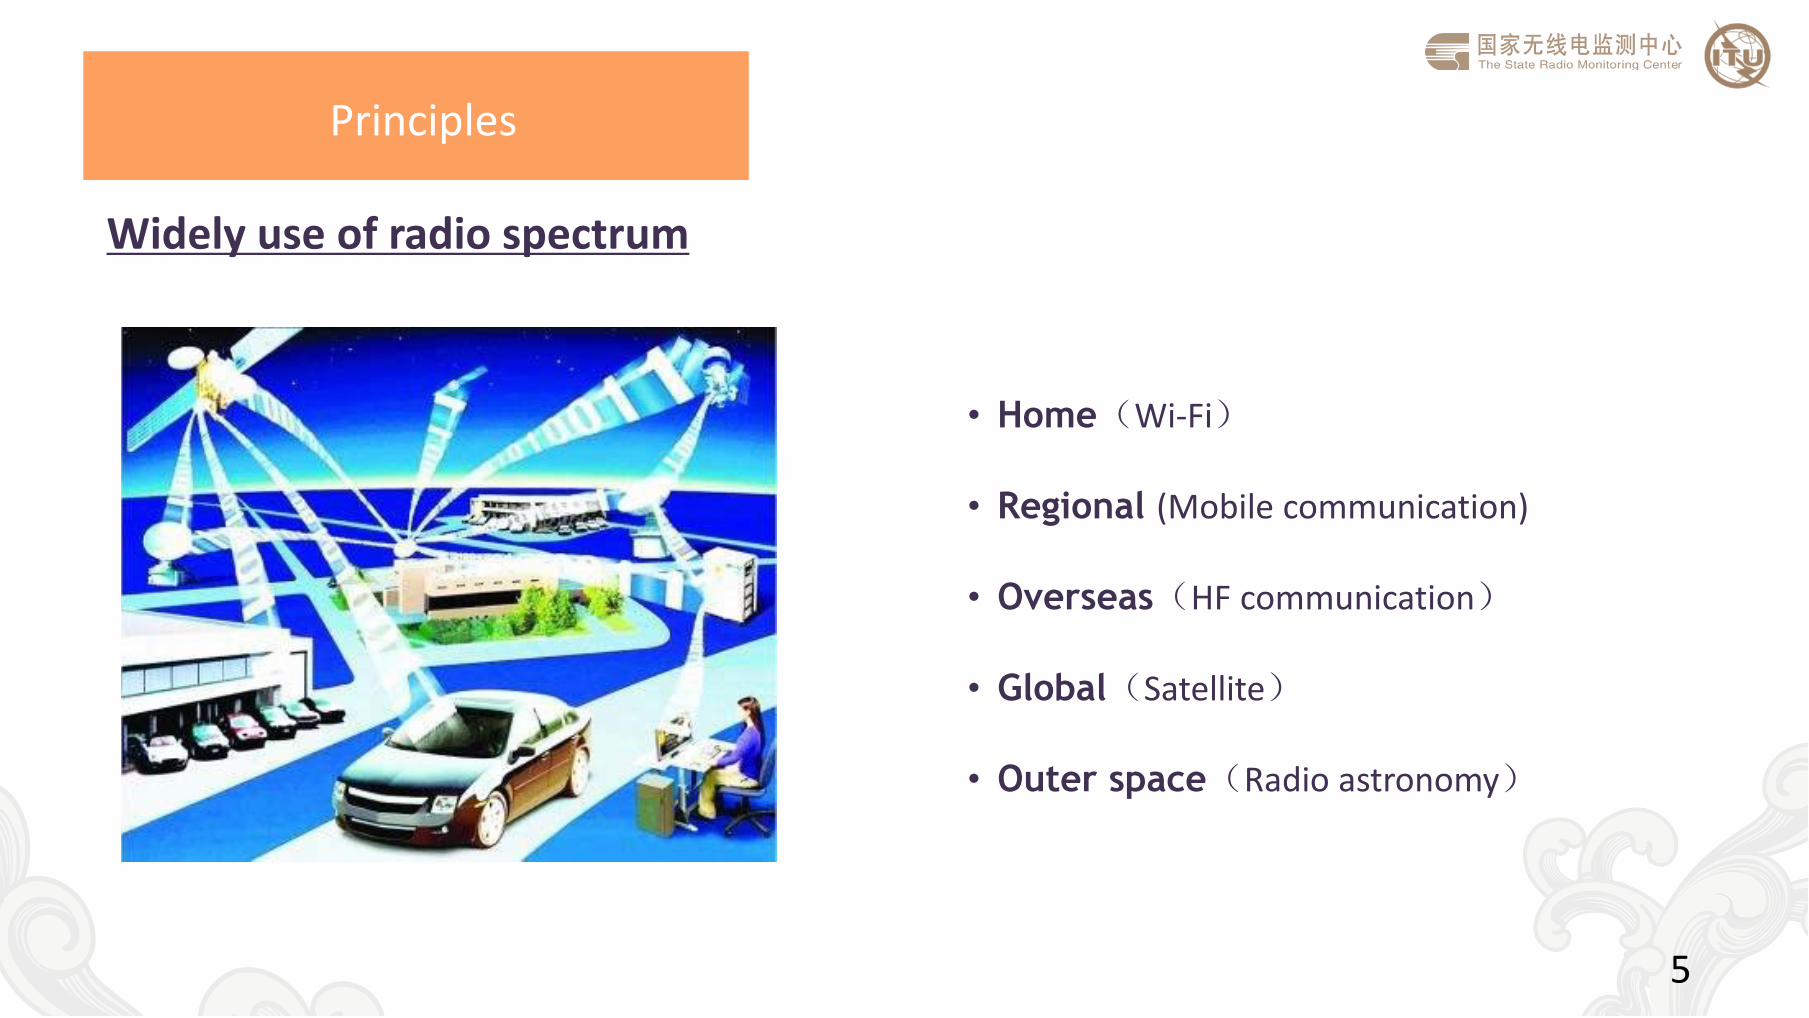
• Home(Wi-Fi)
• Regional (Mobile communication)
• Overseas(HF communication)
• Global(Satellite)
• Outer space(Radio astronomy)
Widely use of radio spectrum
Principles
5
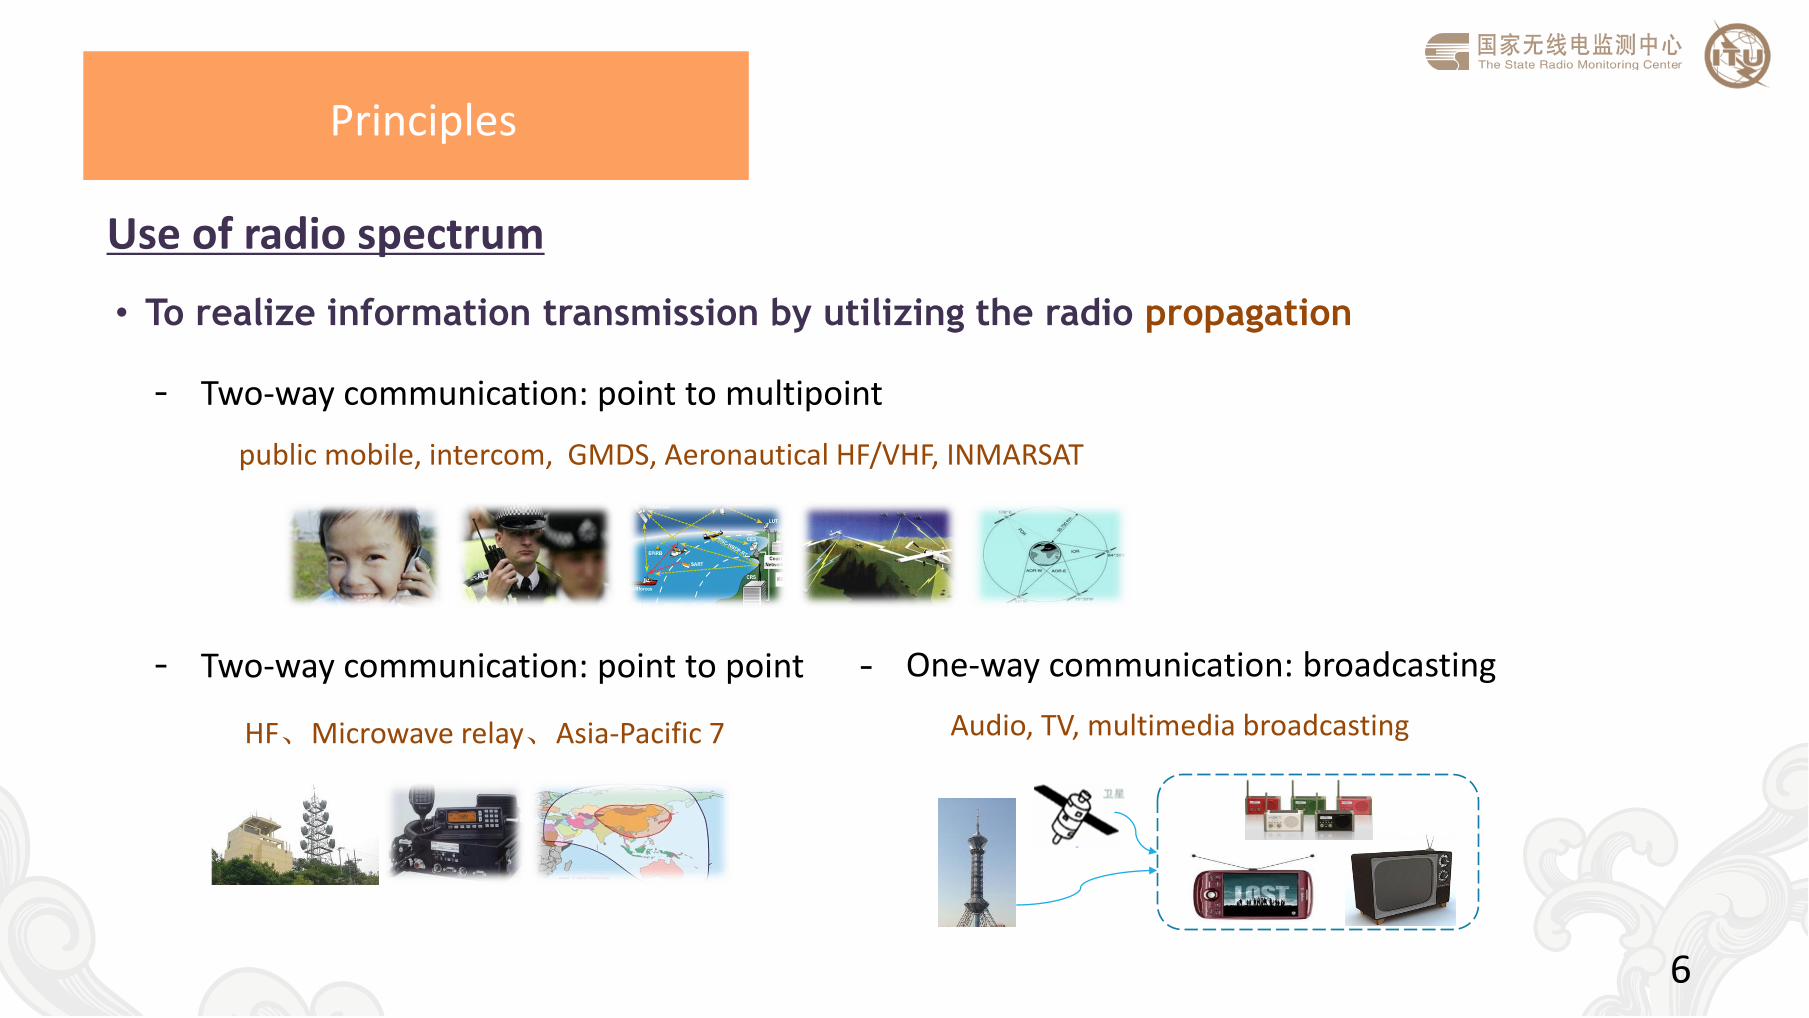
- Two-way communication: point to multipoint
public mobile, intercom, GMDS, Aeronautical HF/VHF, INMARSAT
- Two-way communication: point to point
HF、Microwave relay、Asia-Pacific 7
- One-way communication: broadcasting
Audio, TV, multimedia broadcasting
Use of radio spectrum
• To realize information transmission by utilizing the radio propagation
Principles
6
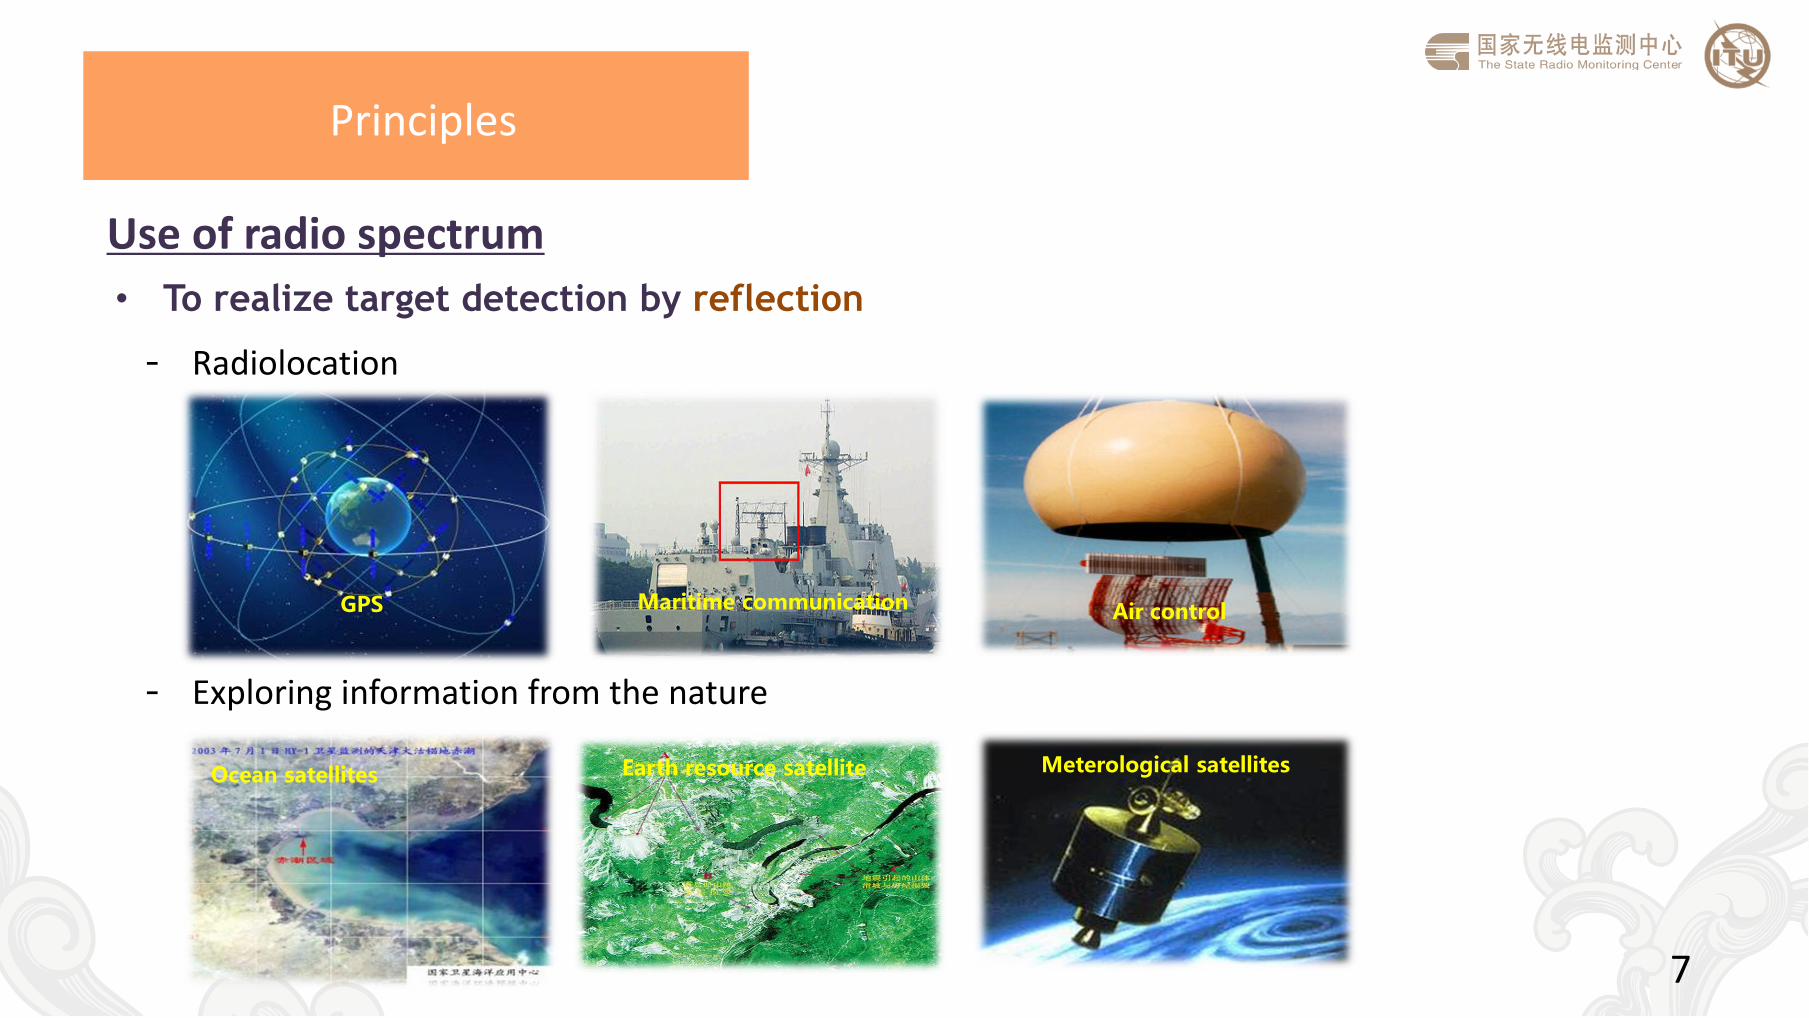
Use of radio spectrum
• To realize target detection by reflection
- Radiolocation
- Exploring information from the nature
Maritime communication Air control GPS
Earth resource satellite Ocean satellites Meterological satellites
Principles
7
Use of radio spectrum
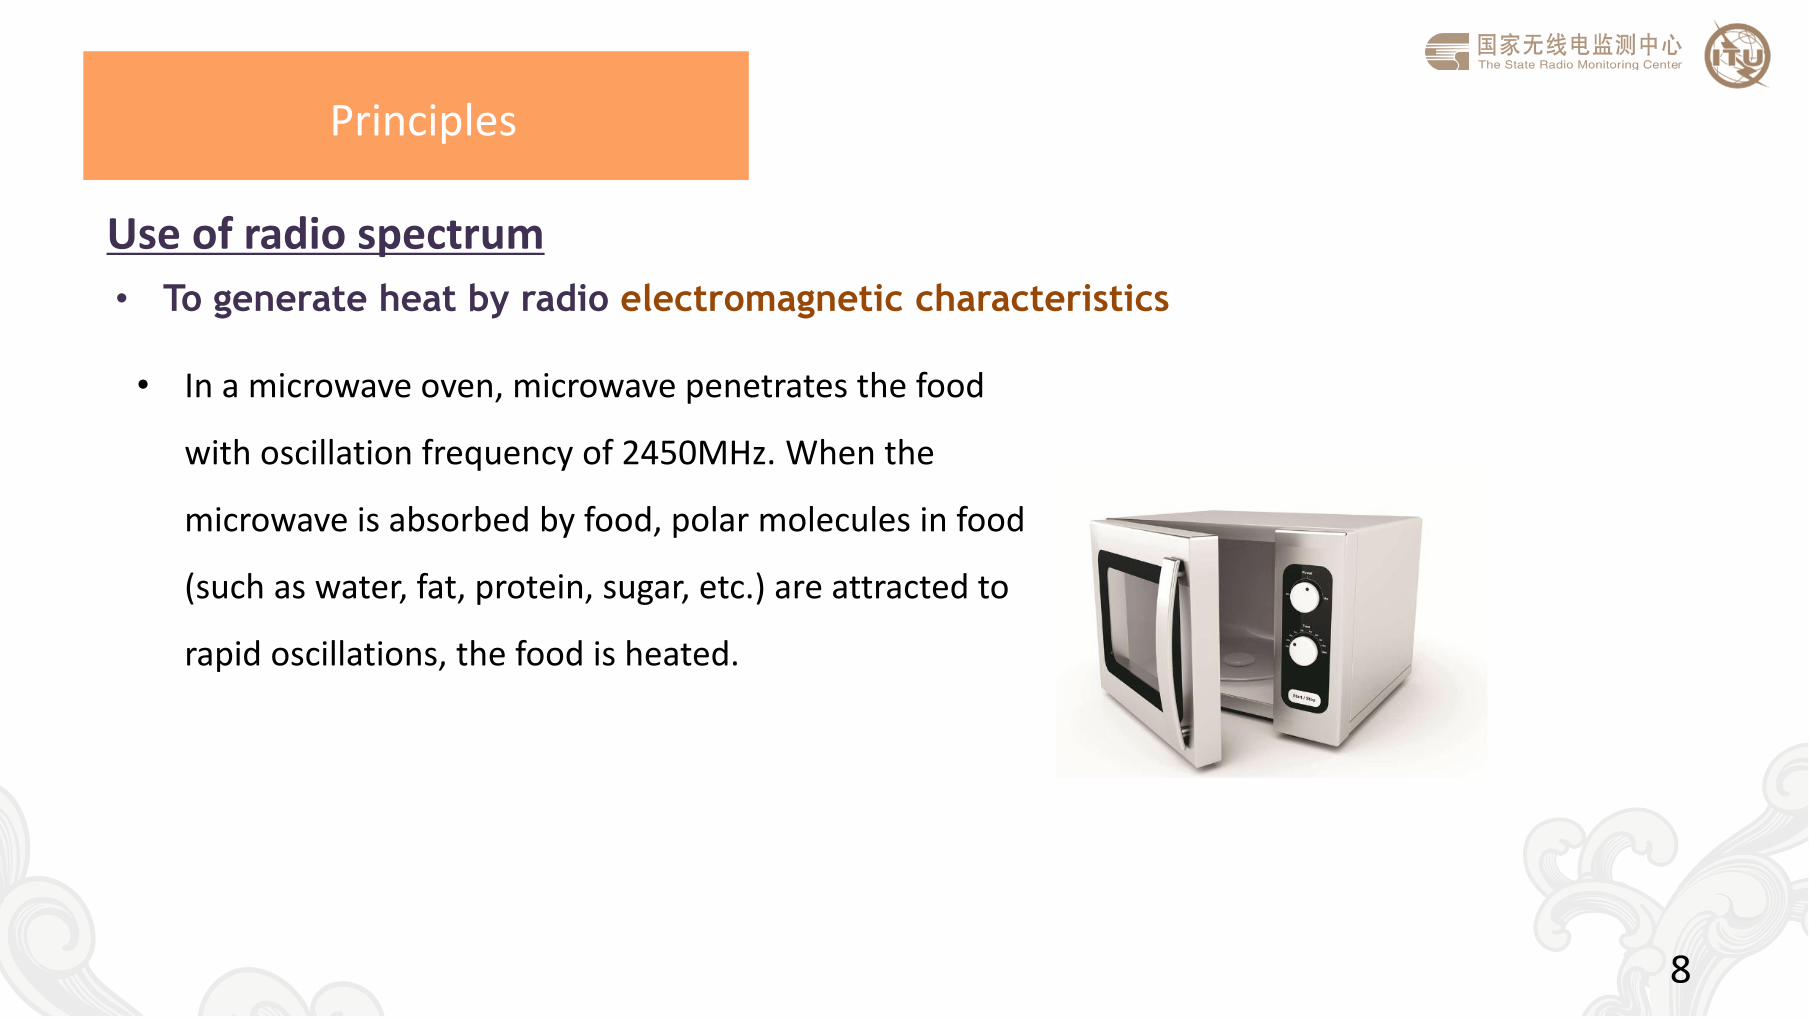
• To generate heat by radio electromagnetic characteristics
• In a microwave oven, microwave penetrates the food
with oscillation frequency of 2450MHz. When the
microwave is absorbed by food, polar molecules in food
(such as water, fat, protein, sugar, etc.) are attracted to
rapid oscillations, the food is heated.
Principles
8
Use of radio spectrum
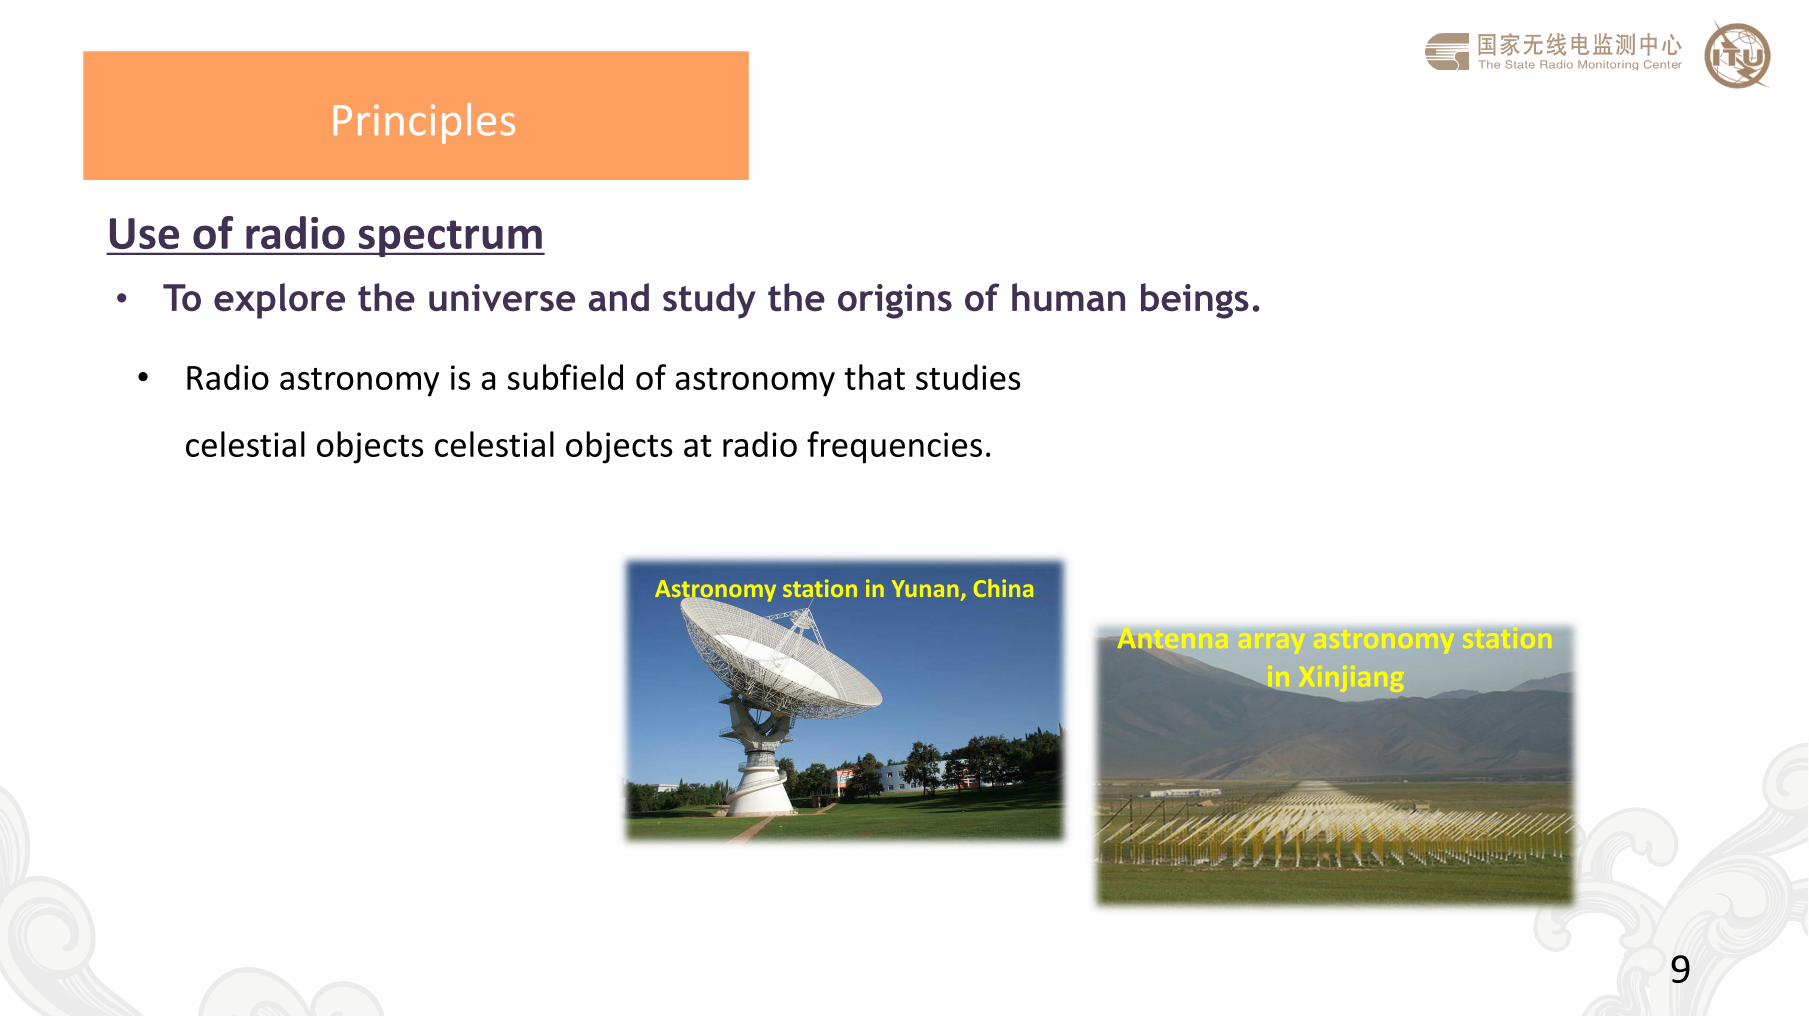
• To explore the universe and study the origins of human beings.
• Radio astronomy is a subfield of astronomy that studies
celestial objects celestial objects at radio frequencies.
Astronomy station in Yunan, China
Antenna array astronomy station in Xinjiang
Principles
9
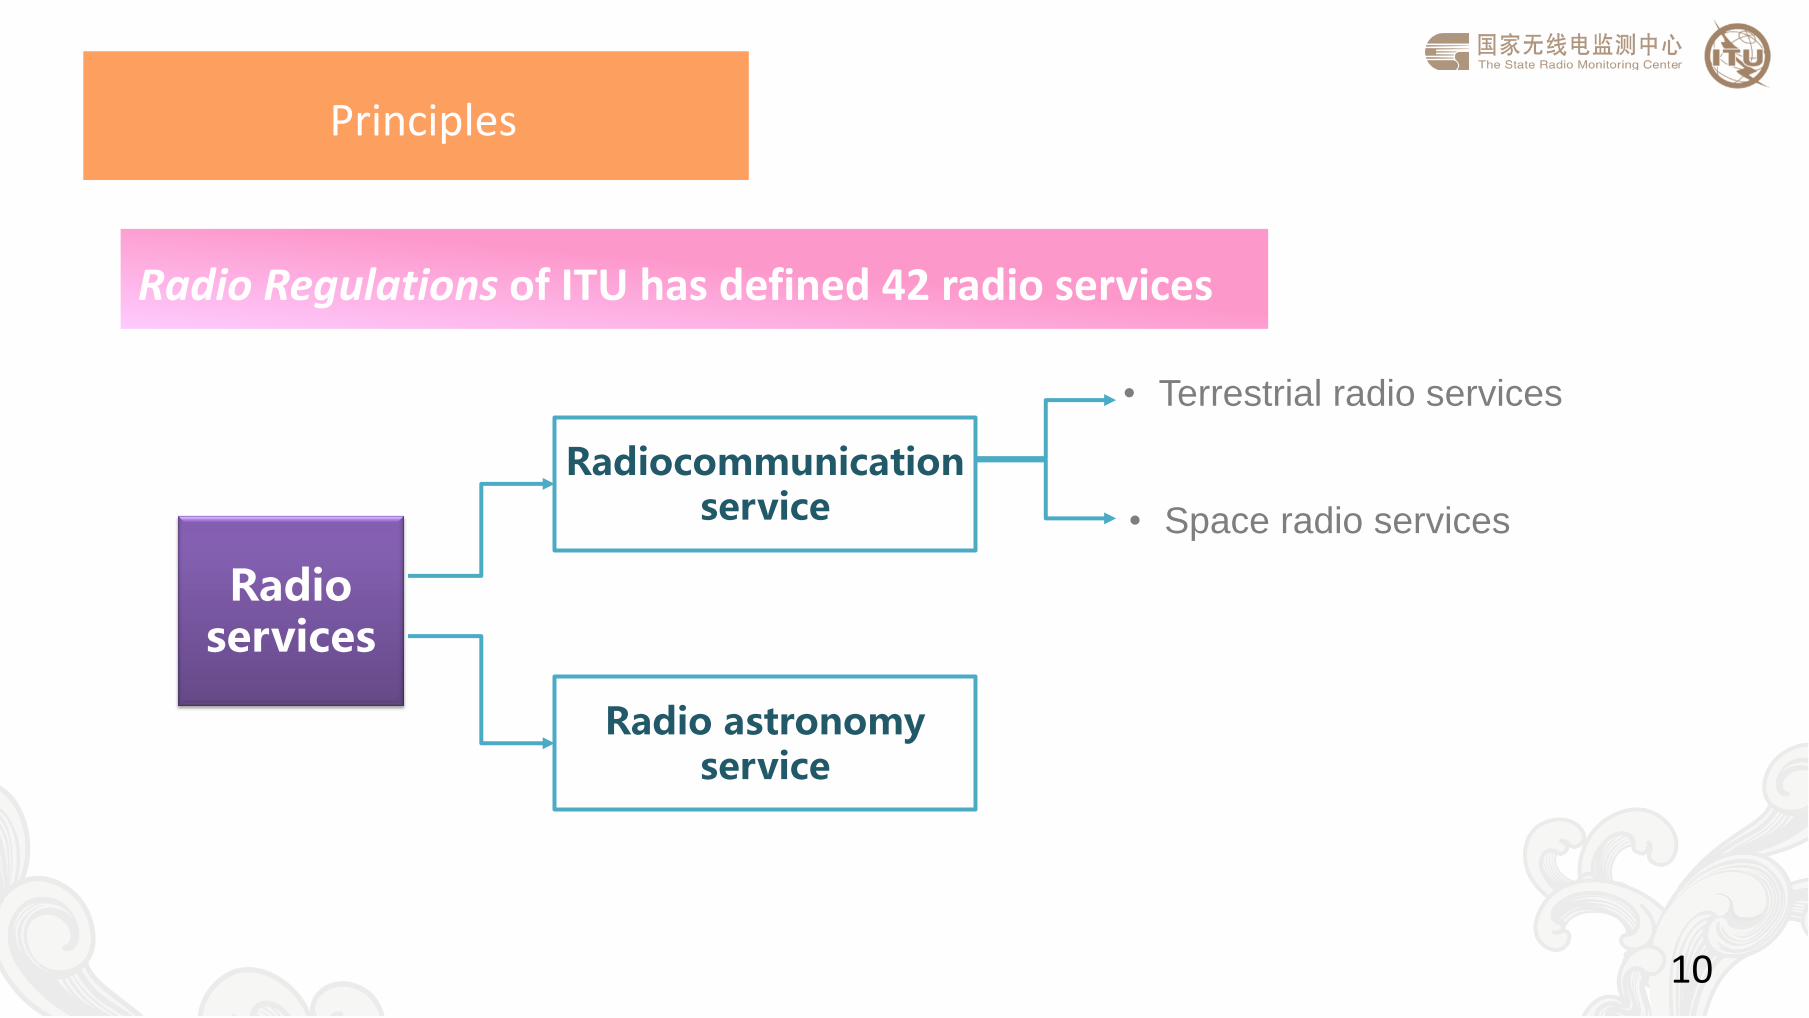
Radio Regulations of ITU has defined 42 radio services
Radio services
Radiocommunication service
Radio astronomy service
• Terrestrial radio services
• Space radio services
Principles
10
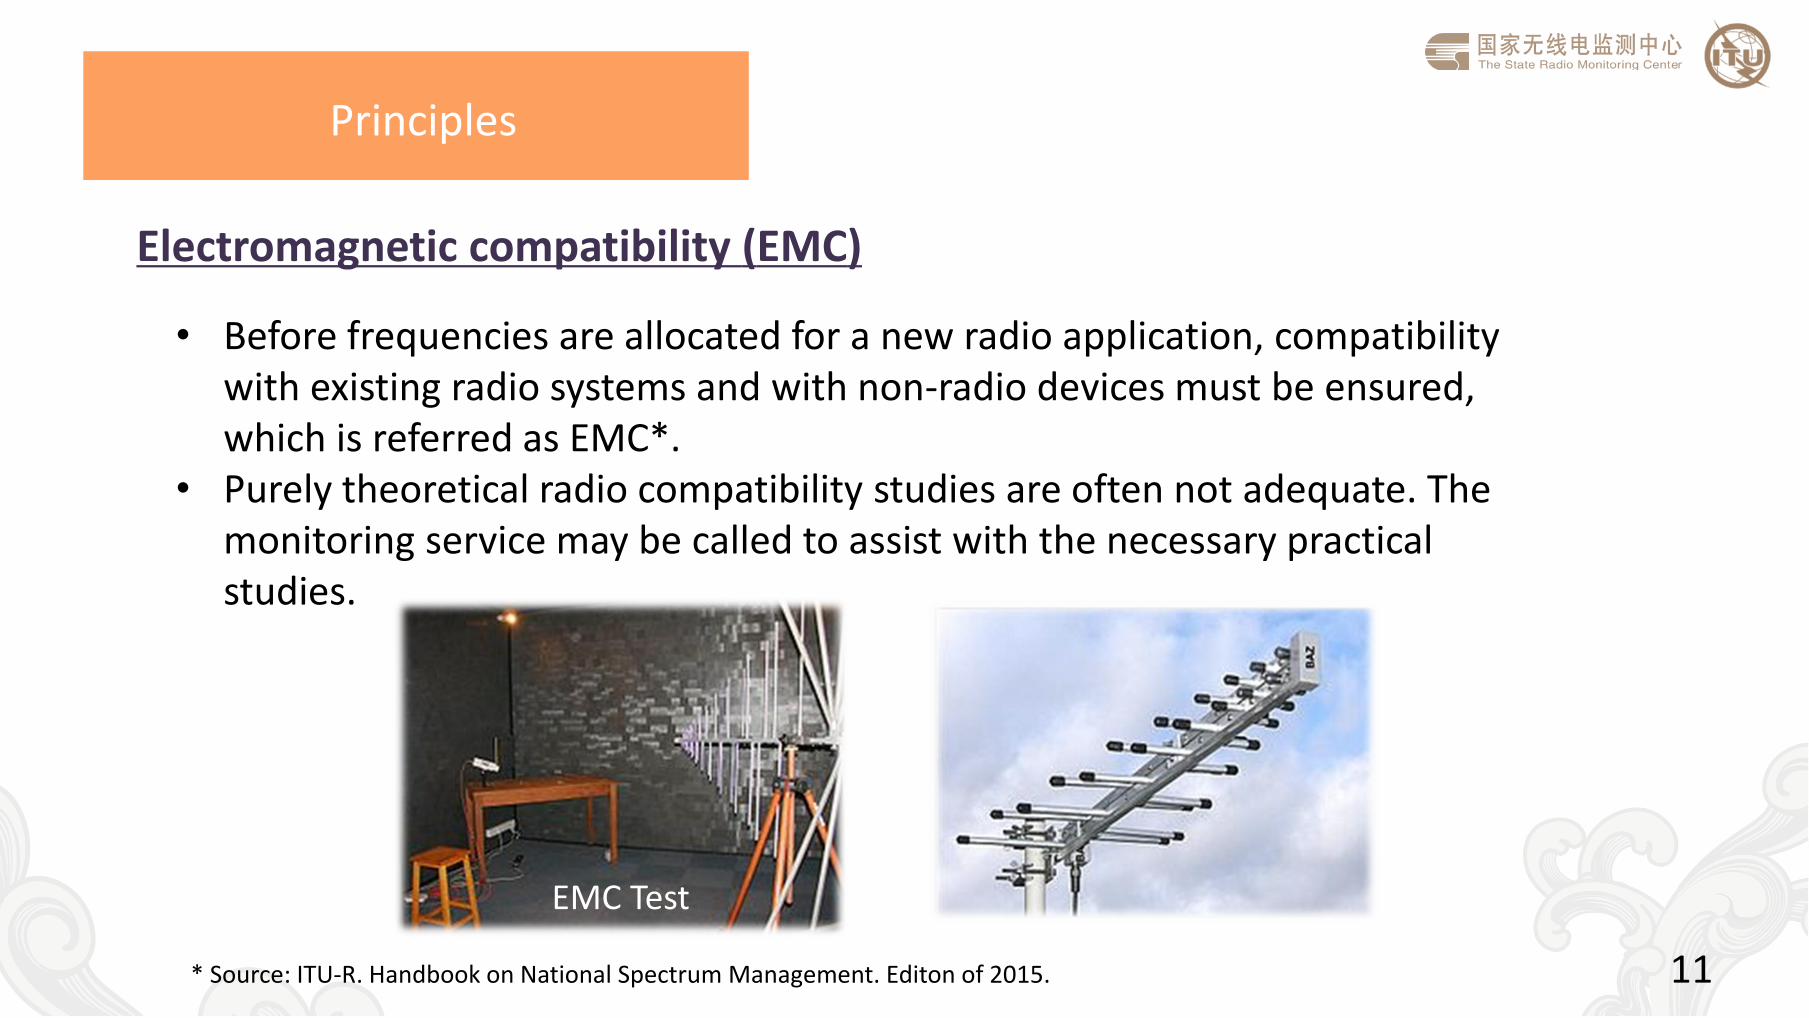
Electromagnetic compatibility (EMC)
• Before frequencies are allocated for a new radio application, compatibility with existing radio systems and with non-radio devices must be ensured, which is referred as EMC*.
• Purely theoretical radio compatibility studies are often not adequate. The monitoring service may be called to assist with the necessary practical studies.
EMC Test
Principles
11 * Source: ITU-R. Handbook on National Spectrum Management. Editon of 2015.
Technical parameters
• Carrier frequencies • Transmitter power • Bandwidth • Unwanted emission • Intermodulation products • Sensitivity of radio receivers
Principles
12
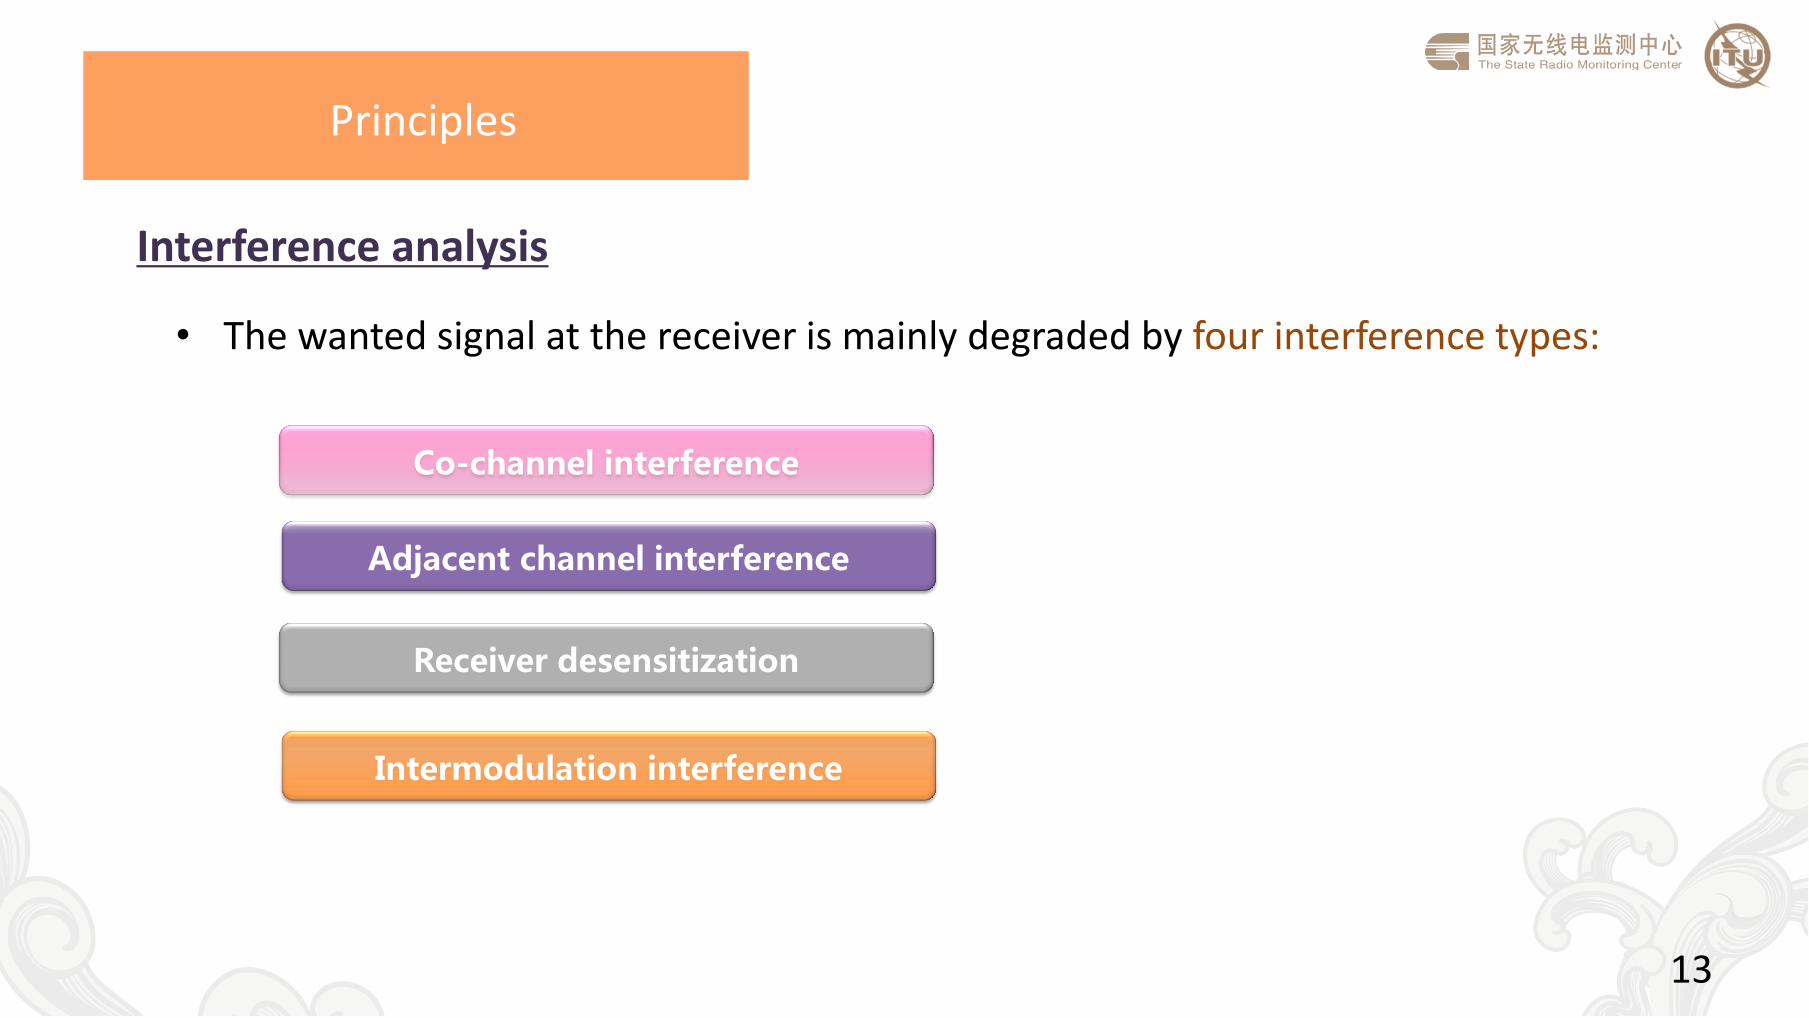
Interference analysis
Principles
• The wanted signal at the receiver is mainly degraded by four interference types:
Co-channel interference
Adjacent channel interference
Receiver desensitization
Intermodulation interference
13
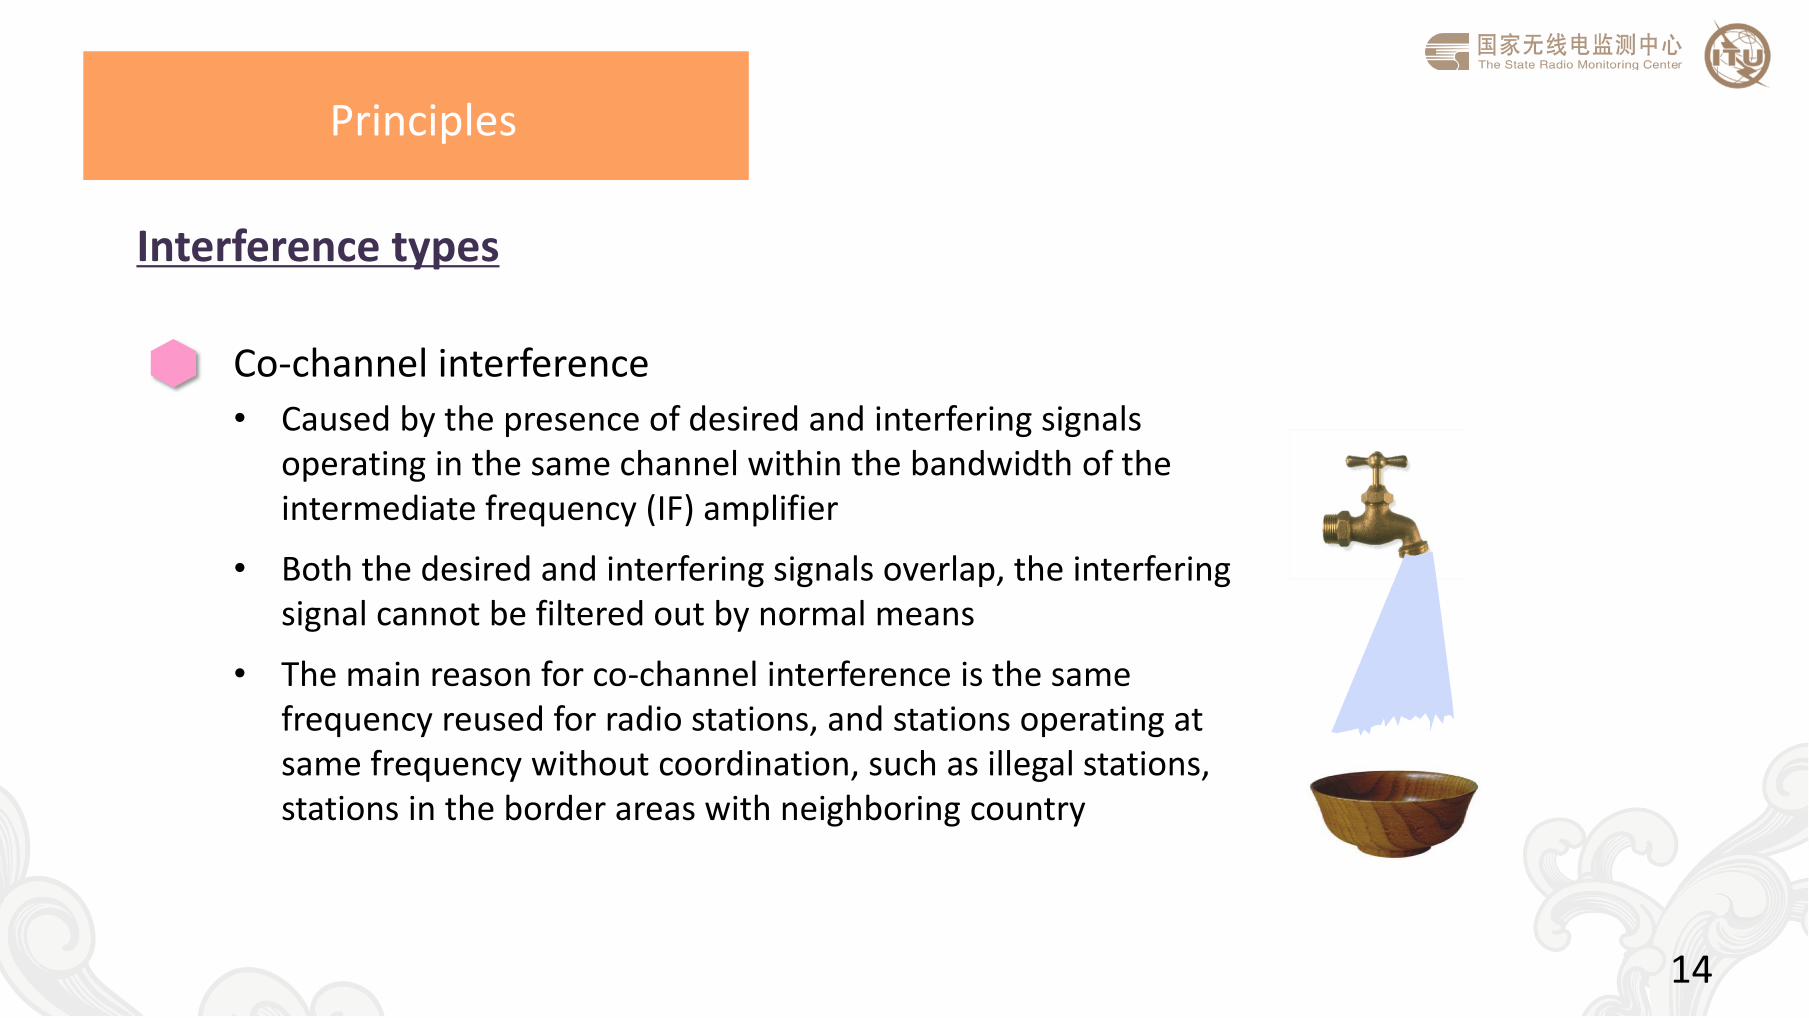
Co-channel interference
• Caused by the presence of desired and interfering signals operating in the same channel within the bandwidth of the intermediate frequency (IF) amplifier
• Both the desired and interfering signals overlap, the interfering signal cannot be filtered out by normal means
• The main reason for co-channel interference is the same frequency reused for radio stations, and stations operating at same frequency without coordination, such as illegal stations, stations in the border areas with neighboring country
EMC Test
Principles
Interference types
14
EMC Test
Principles
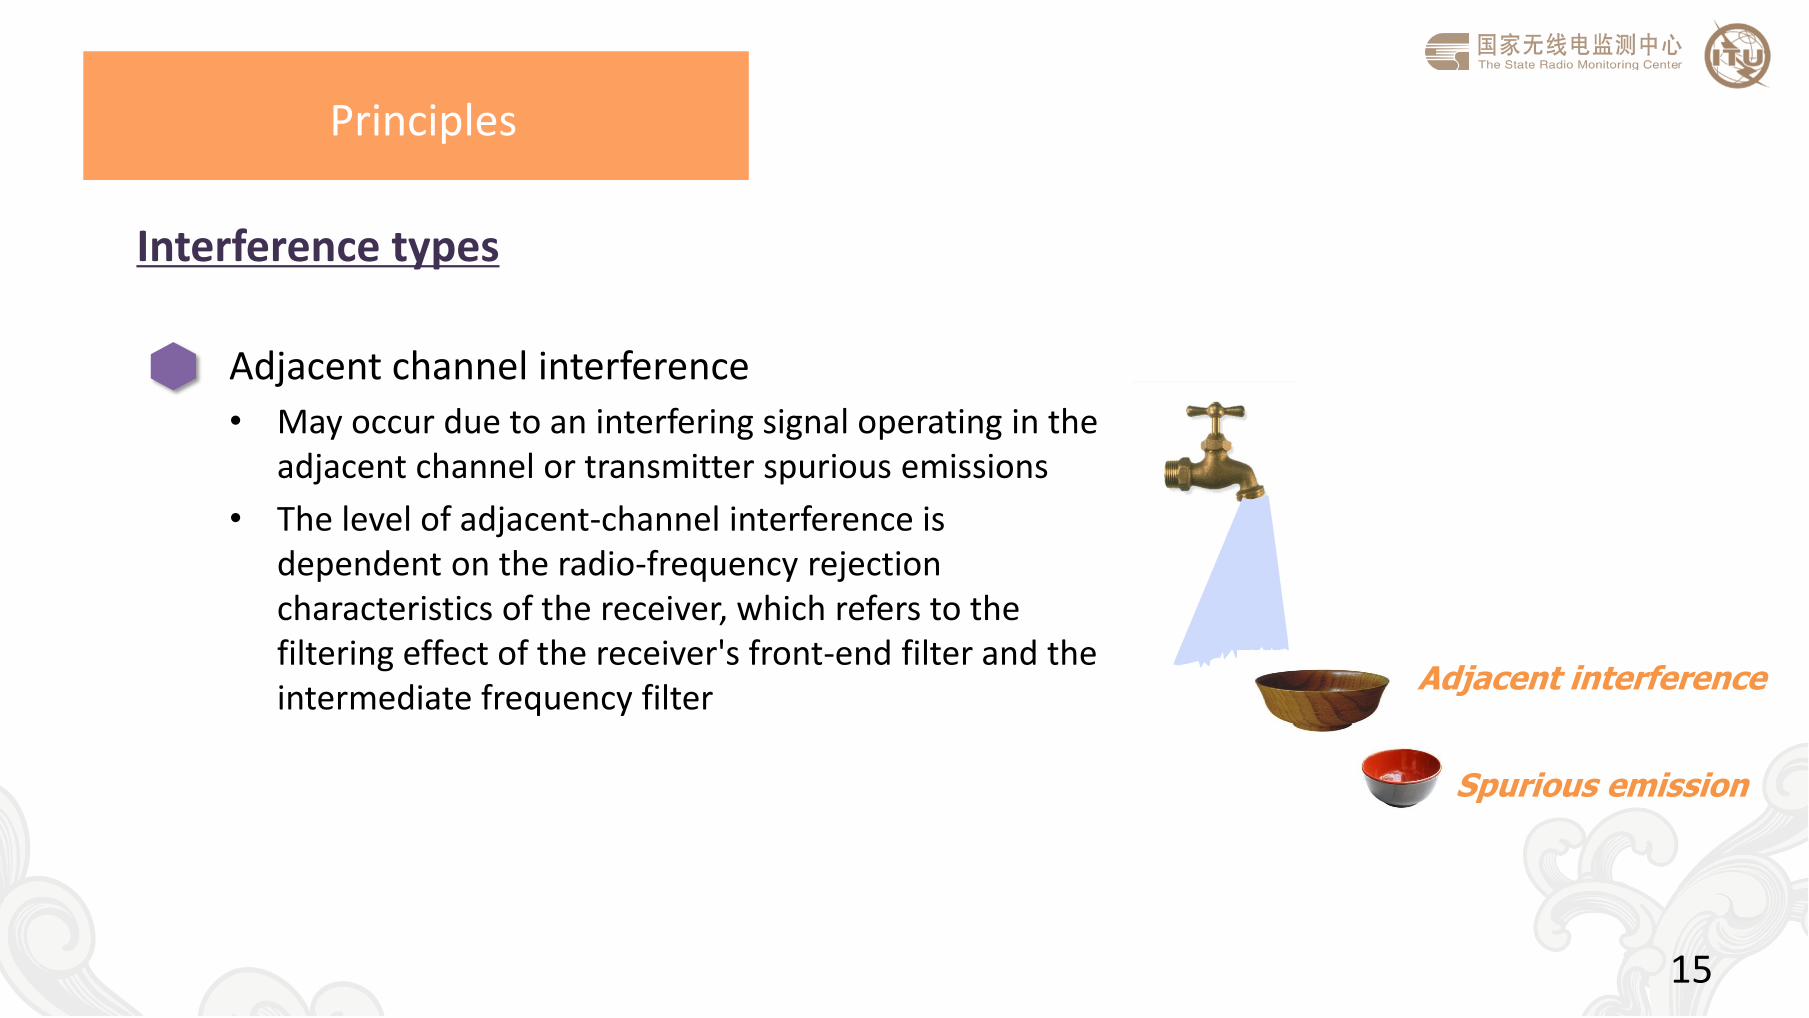
Adjacent channel interference
• May occur due to an interfering signal operating in the adjacent channel or transmitter spurious emissions
• The level of adjacent-channel interference is dependent on the radio-frequency rejection characteristics of the receiver, which refers to the filtering effect of the receiver's front-end filter and the intermediate frequency filter
Adjacent interference
Spurious emission
15
Interference types
EMC Test
Principles
Interference types
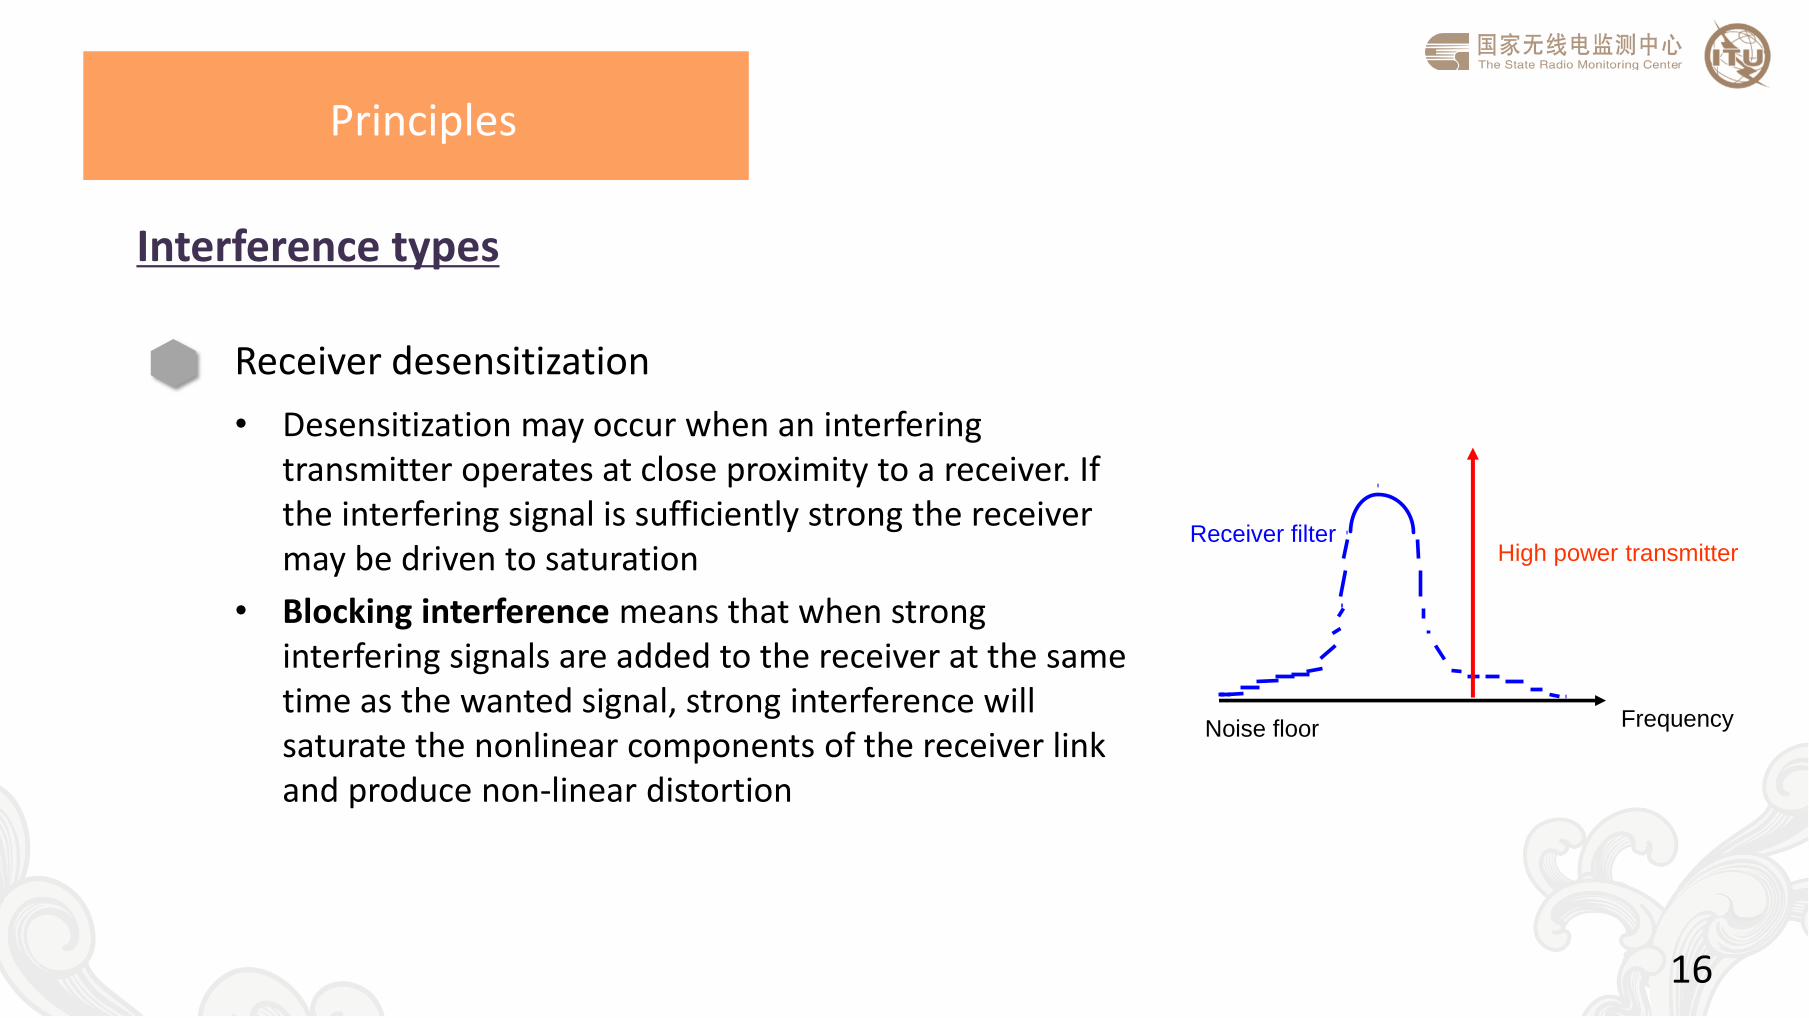
Receiver desensitization
• Desensitization may occur when an interfering transmitter operates at close proximity to a receiver. If the interfering signal is sufficiently strong the receiver may be driven to saturation
• Blocking interference means that when strong interfering signals are added to the receiver at the same time as the wanted signal, strong interference will saturate the nonlinear components of the receiver link and produce non-linear distortion
Receiver filter High power transmitter
Frequency Noise floor
16
Principles
Interference types
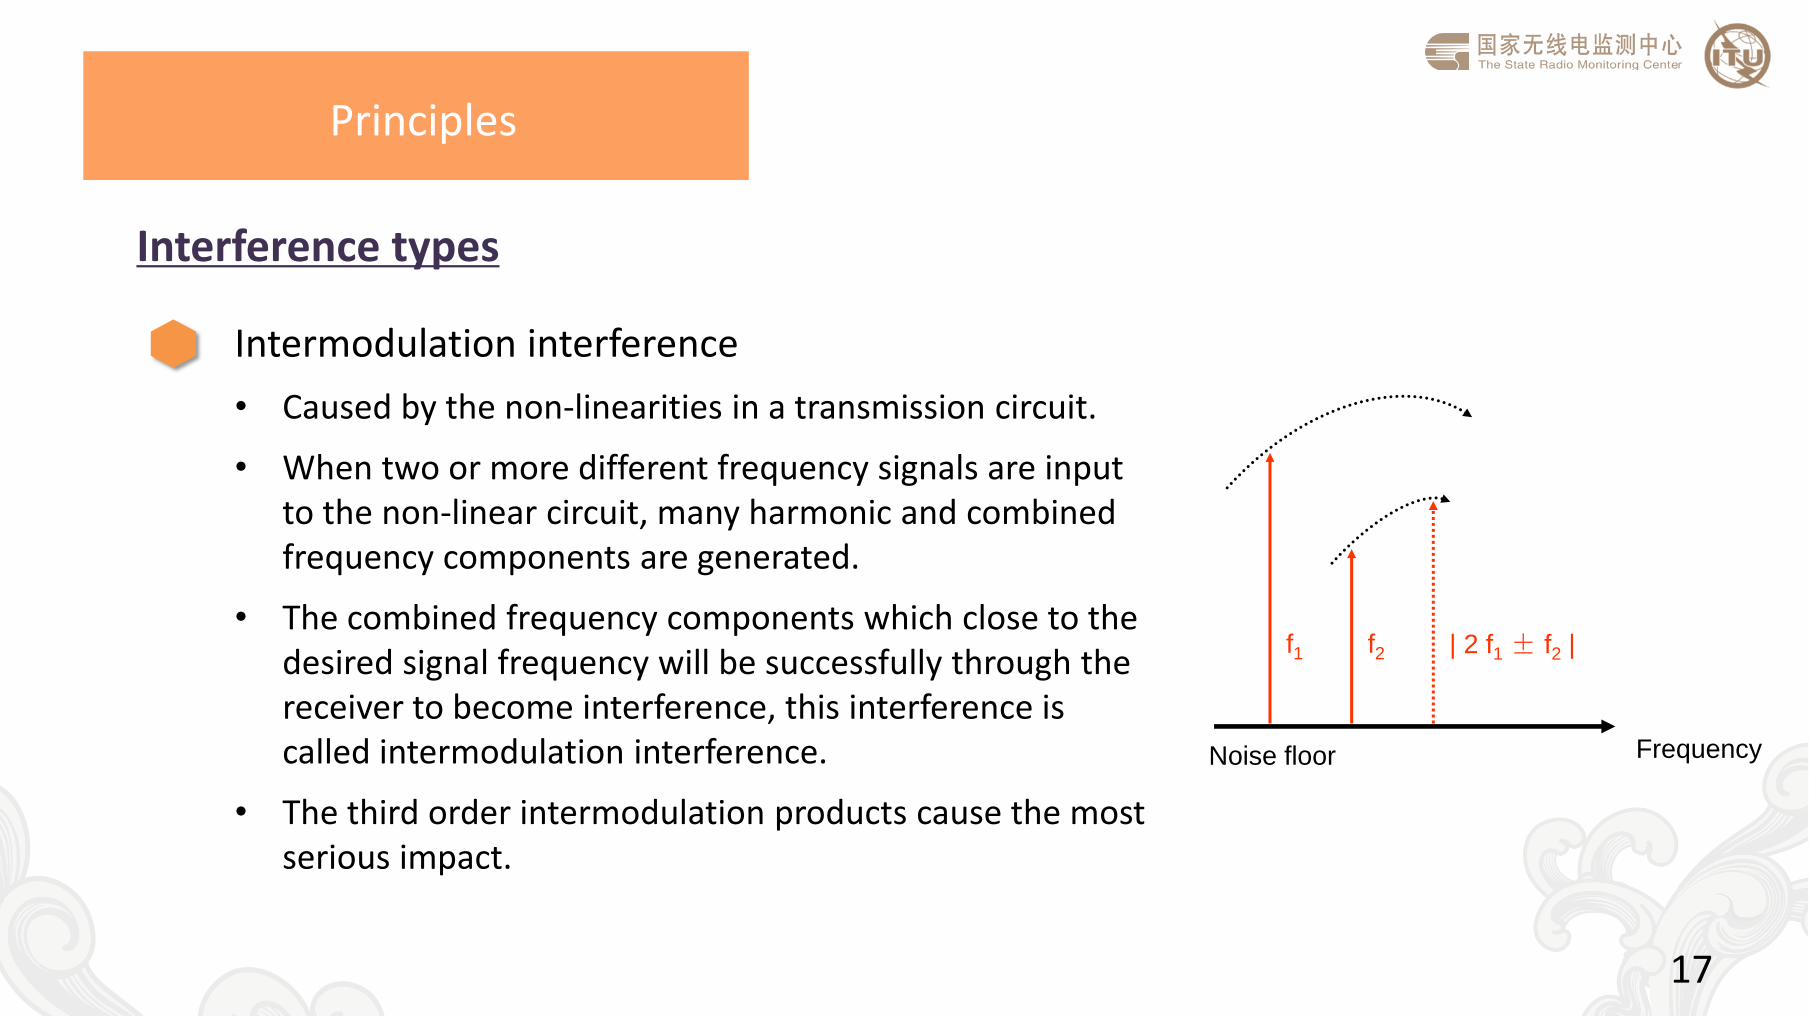
Intermodulation interference
• Caused by the non-linearities in a transmission circuit.
• When two or more different frequency signals are input to the non-linear circuit, many harmonic and combined frequency components are generated.
• The combined frequency components which close to the desired signal frequency will be successfully through the receiver to become interference, this interference is called intermodulation interference.
• The third order intermodulation products cause the most serious impact.
Frequency
f1 f2 | 2 f1 ± f2 |
Noise floor
17
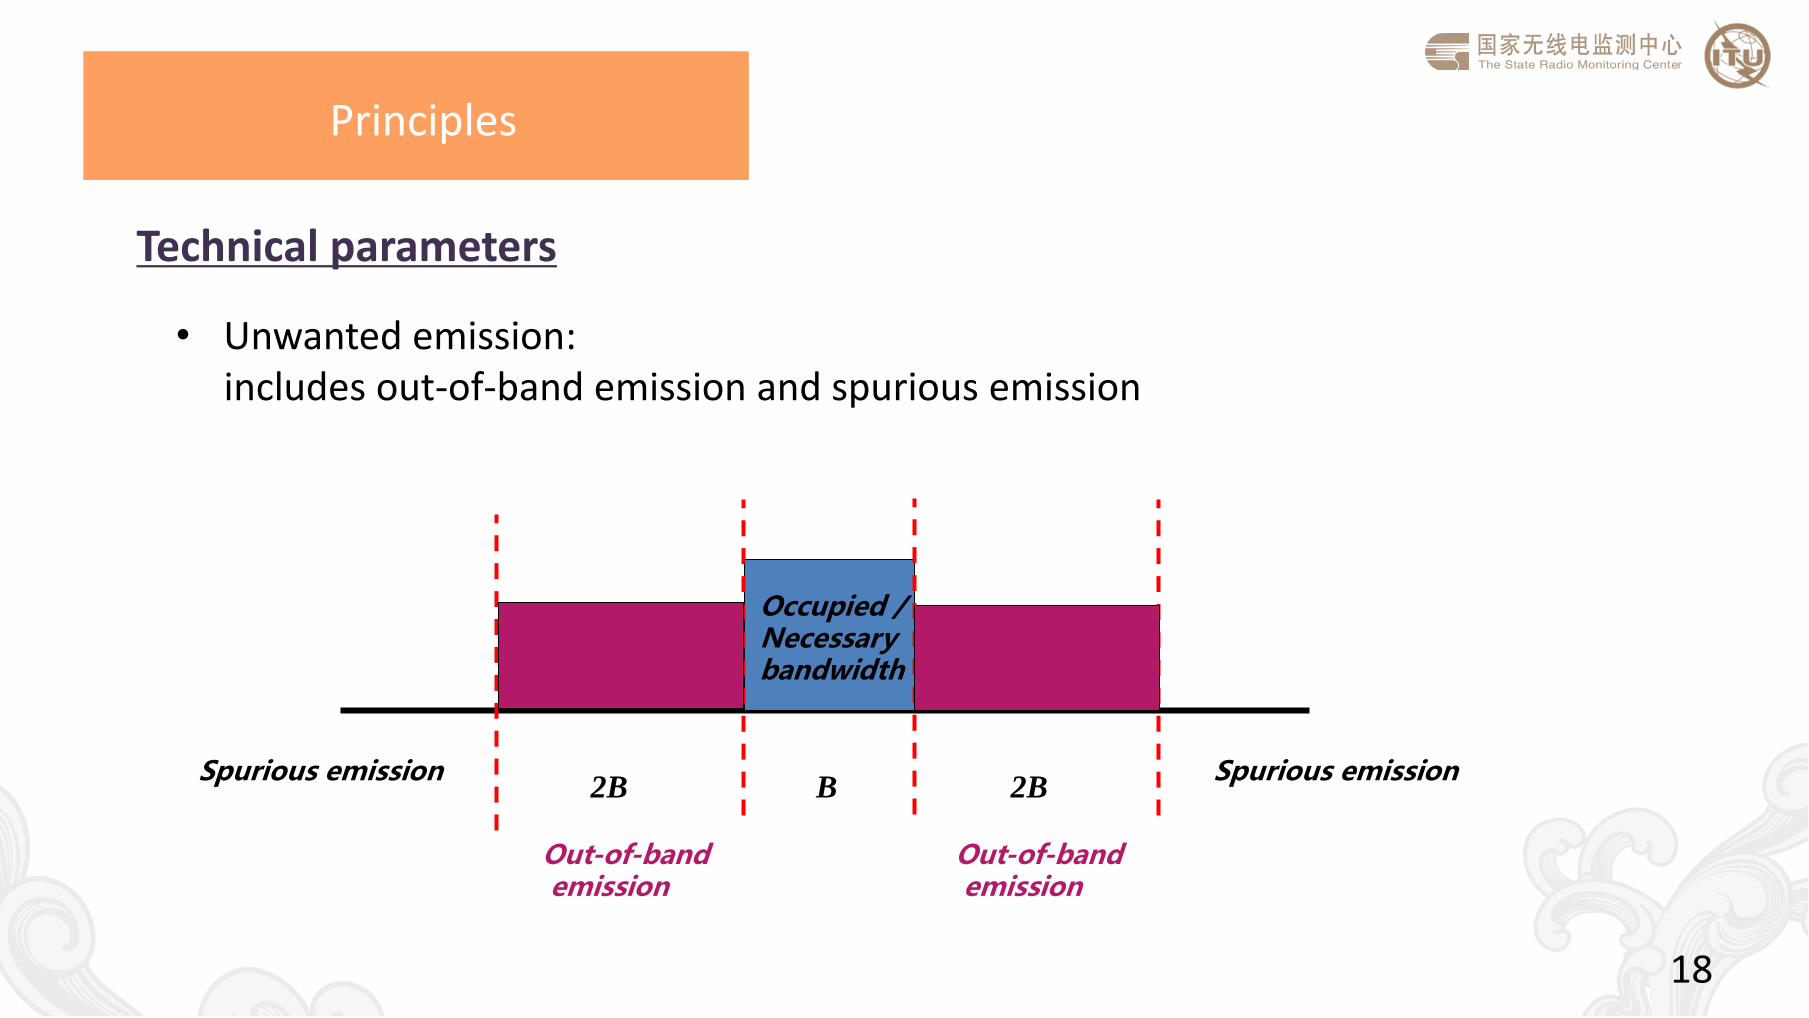
B 2B 2B
• Unwanted emission: includes out-of-band emission and spurious emission
Principles
Occupied / Necessary bandwidth
Out-of-band emission
Spurious emission
Out-of-band emission
Spurious emission
18
Technical parameters
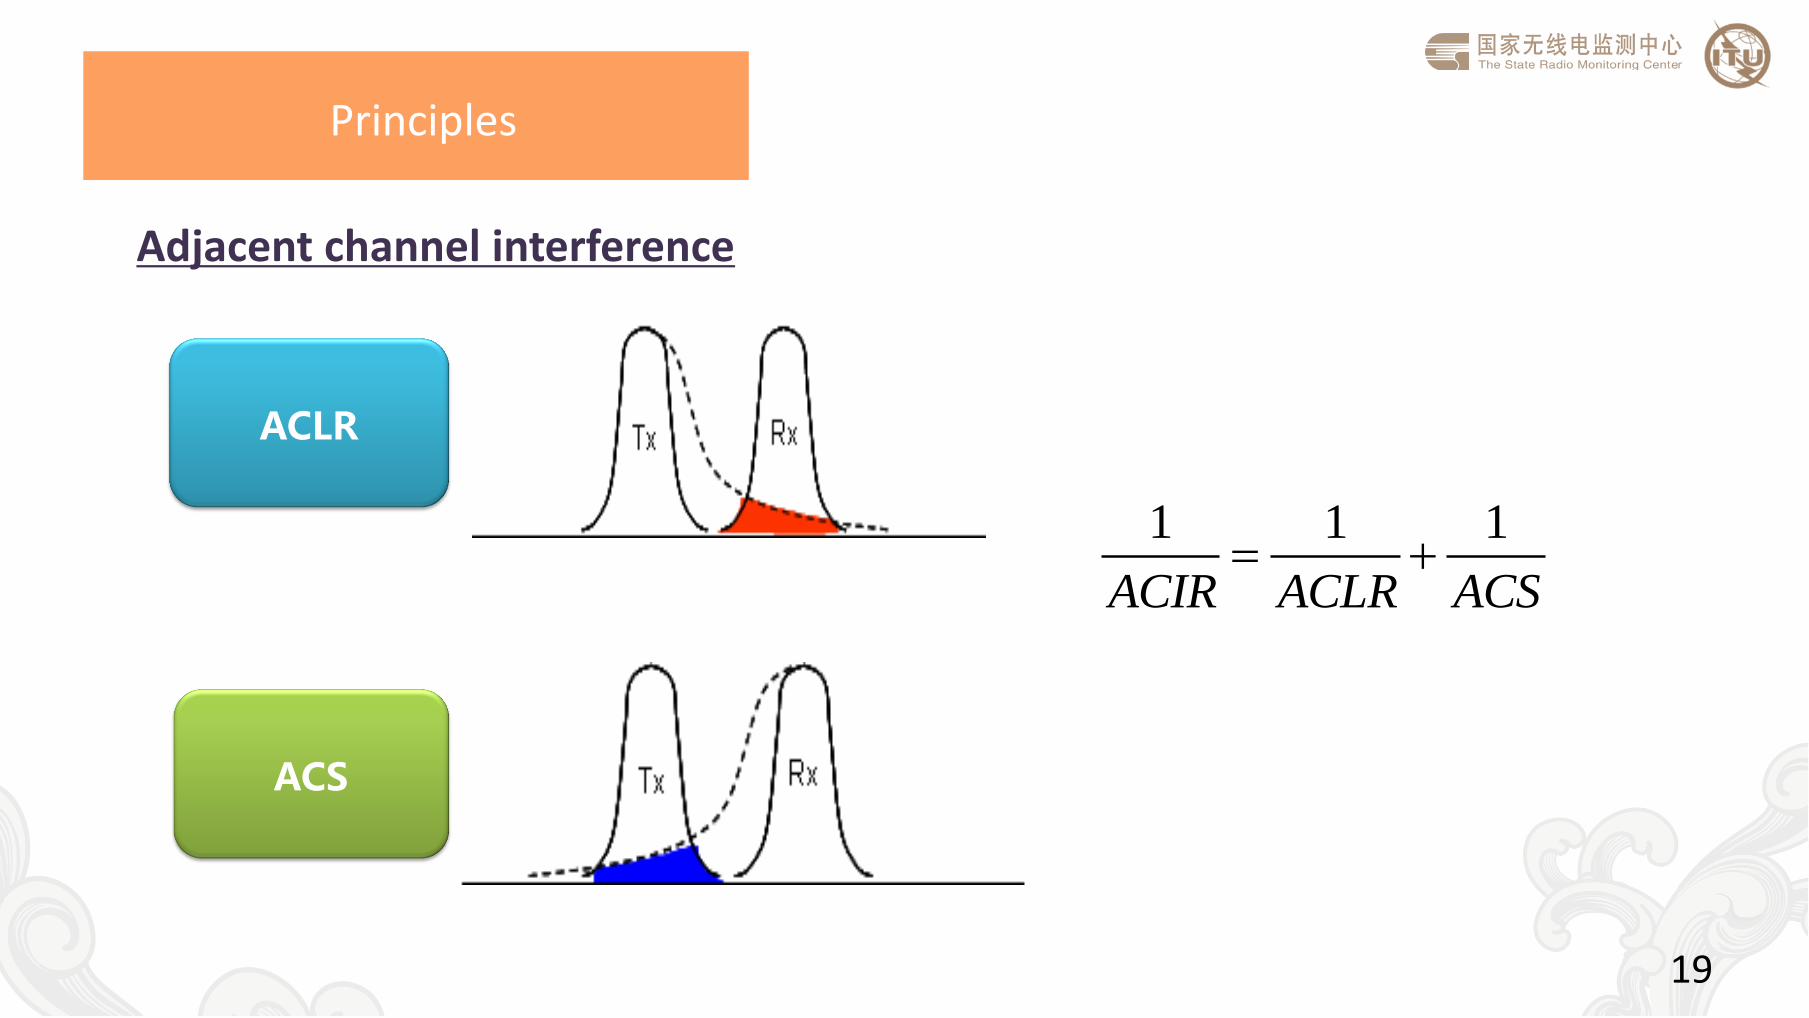
Adjacent channel interference
EMC Test
ACLR
ACS
1 1 1
ACIR ACLR ACS
Principles
19
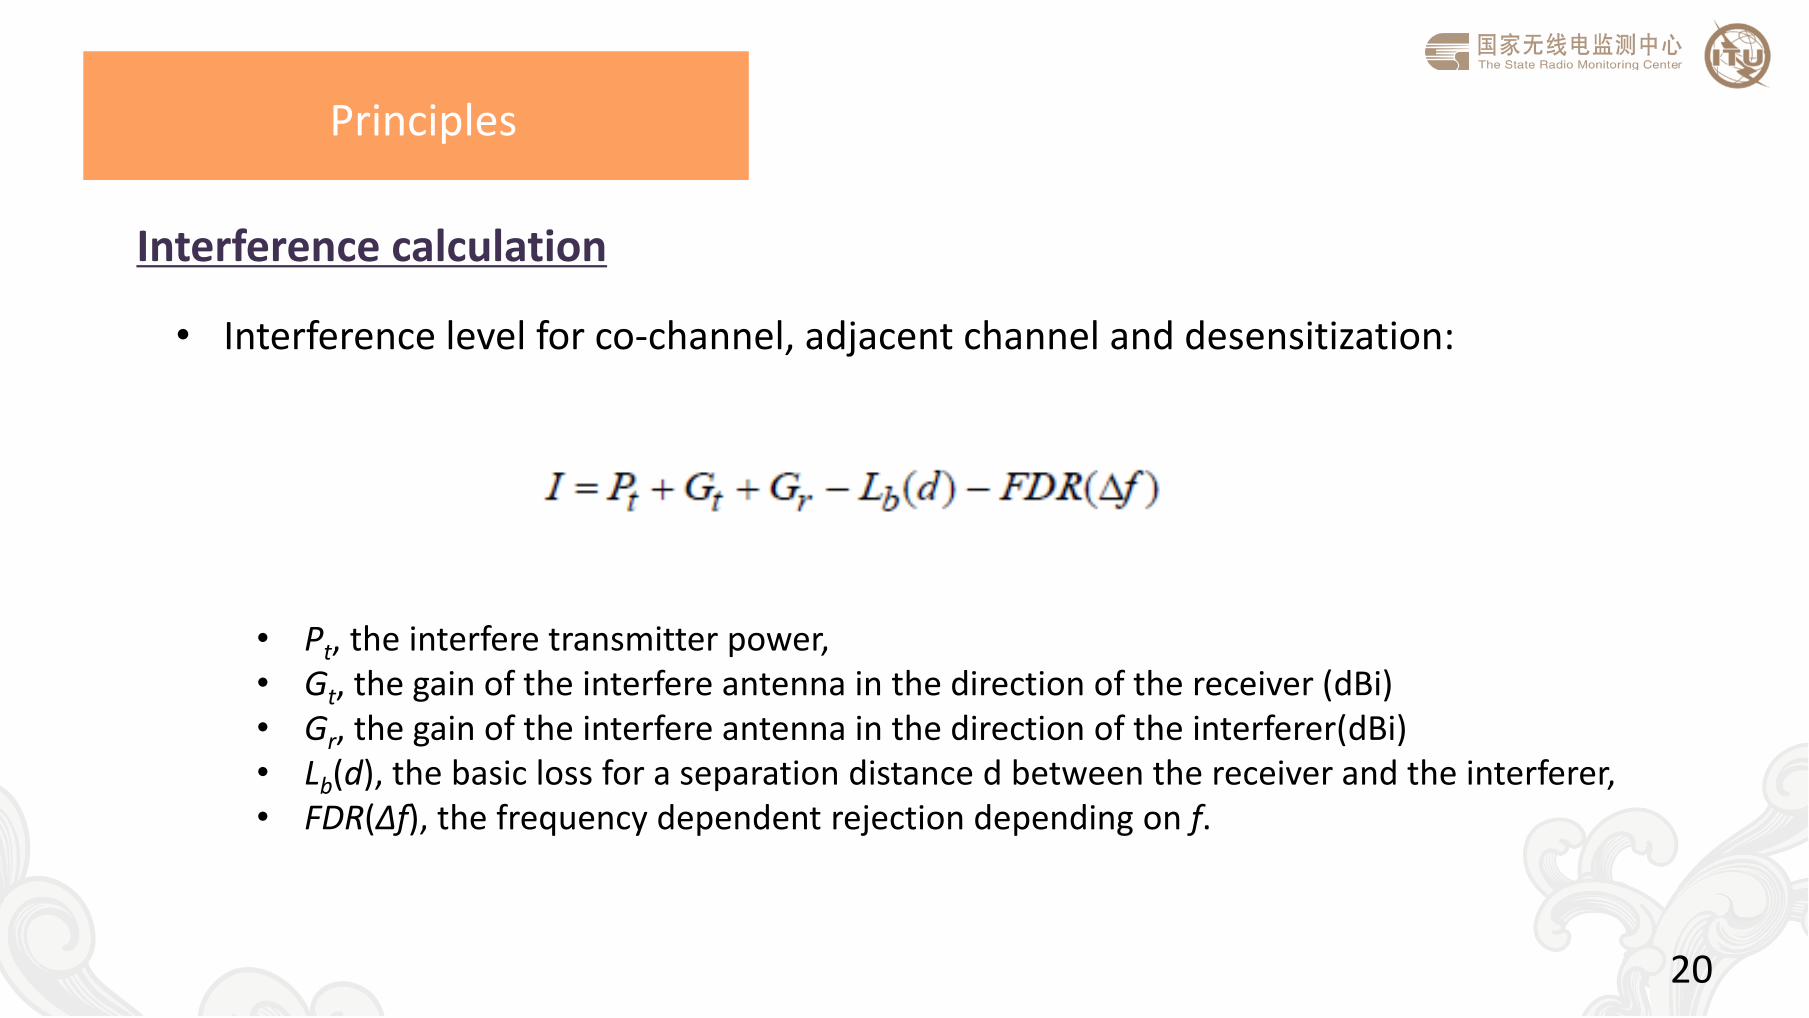
• Interference level for co-channel, adjacent channel and desensitization: • Pt, the interfere transmitter power, • Gt, the gain of the interfere antenna in the direction of the receiver (dBi) • Gr, the gain of the interfere antenna in the direction of the interferer(dBi) • Lb(d), the basic loss for a separation distance d between the receiver and the interferer, • FDR(∆f), the frequency dependent rejection depending on f.
Principles
Interference calculation
20
Model of propagation
• Core factors of spectrum engineering in EMC link budget calculation
• ITU-R Recommendation P. series
• Terrestrial/Space
• ITU-R Study Group 3
• Other models
• 3GPP Technical Report, e.g. TR 36.873 Study on 3D channel model for LTE
• Intra-system/Inter-system
Principles
21
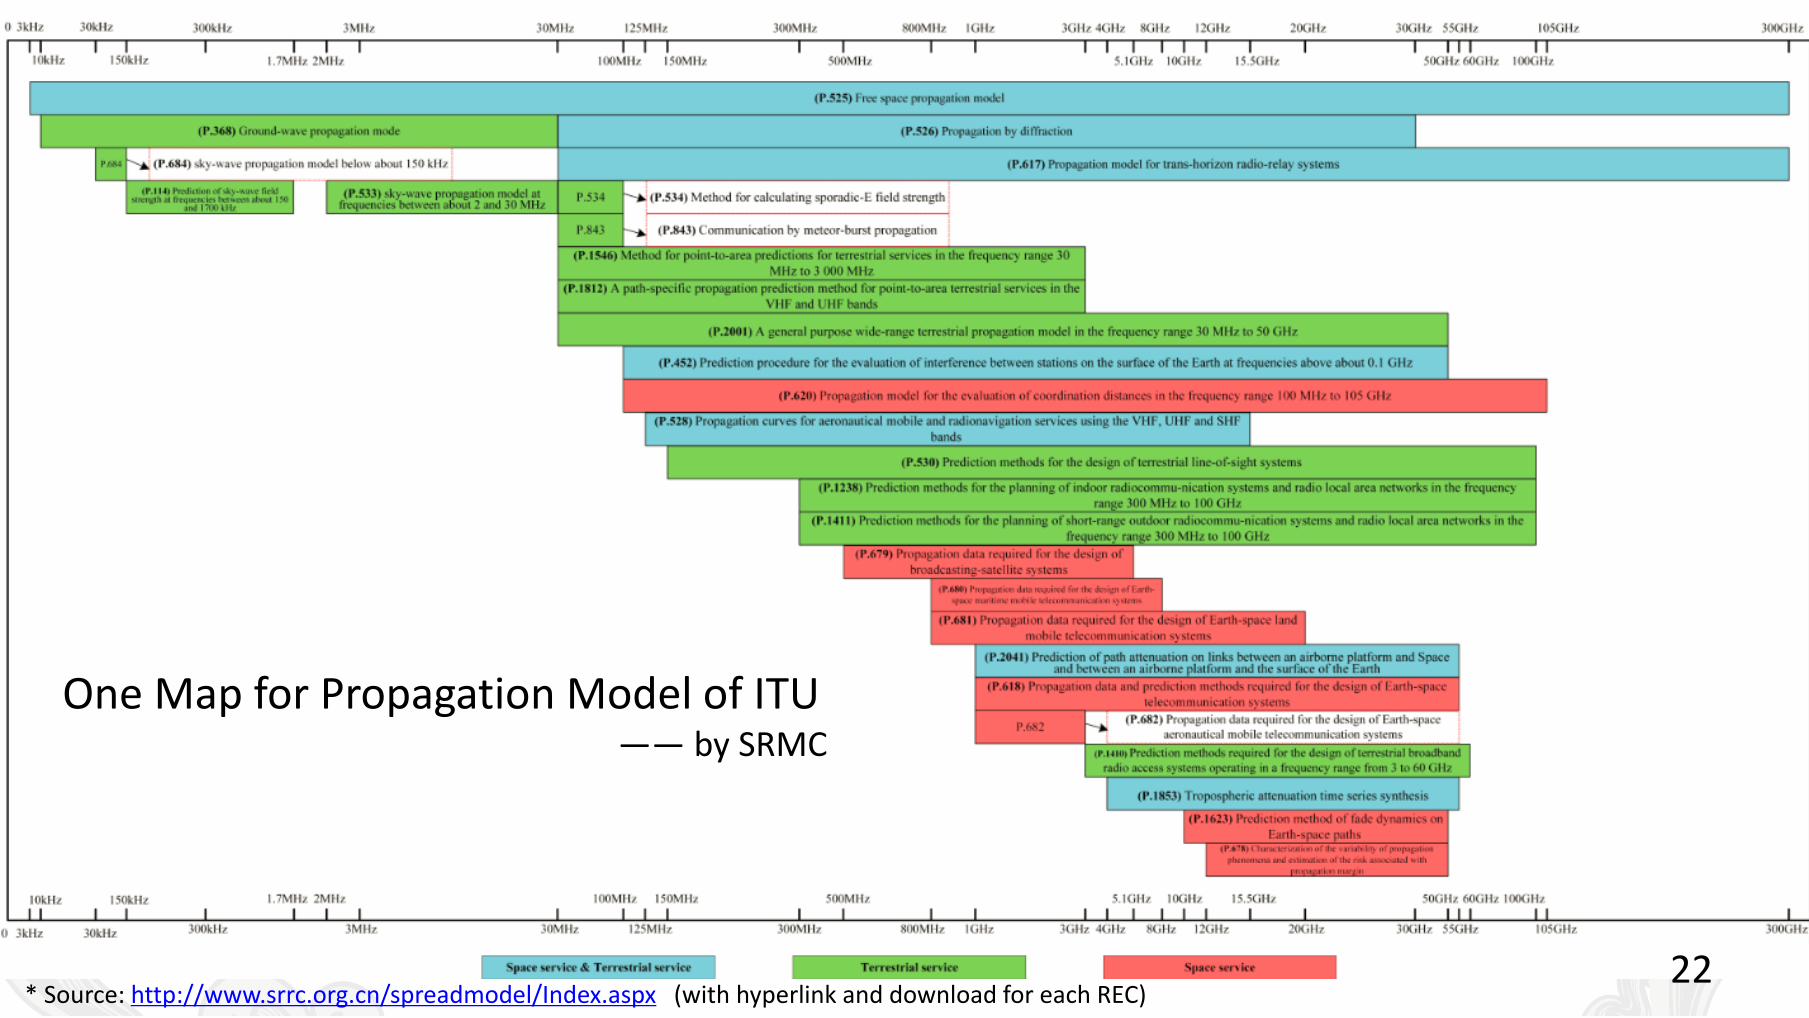
Model of propagation
• 待补充
EMC Test
Principles
EMC Test
* Source: http://www.srrc.org.cn/spreadmodel/Index.aspx (with hyperlink and download for each REC)
One Map for Propagation Model of ITU —— by SRMC
22
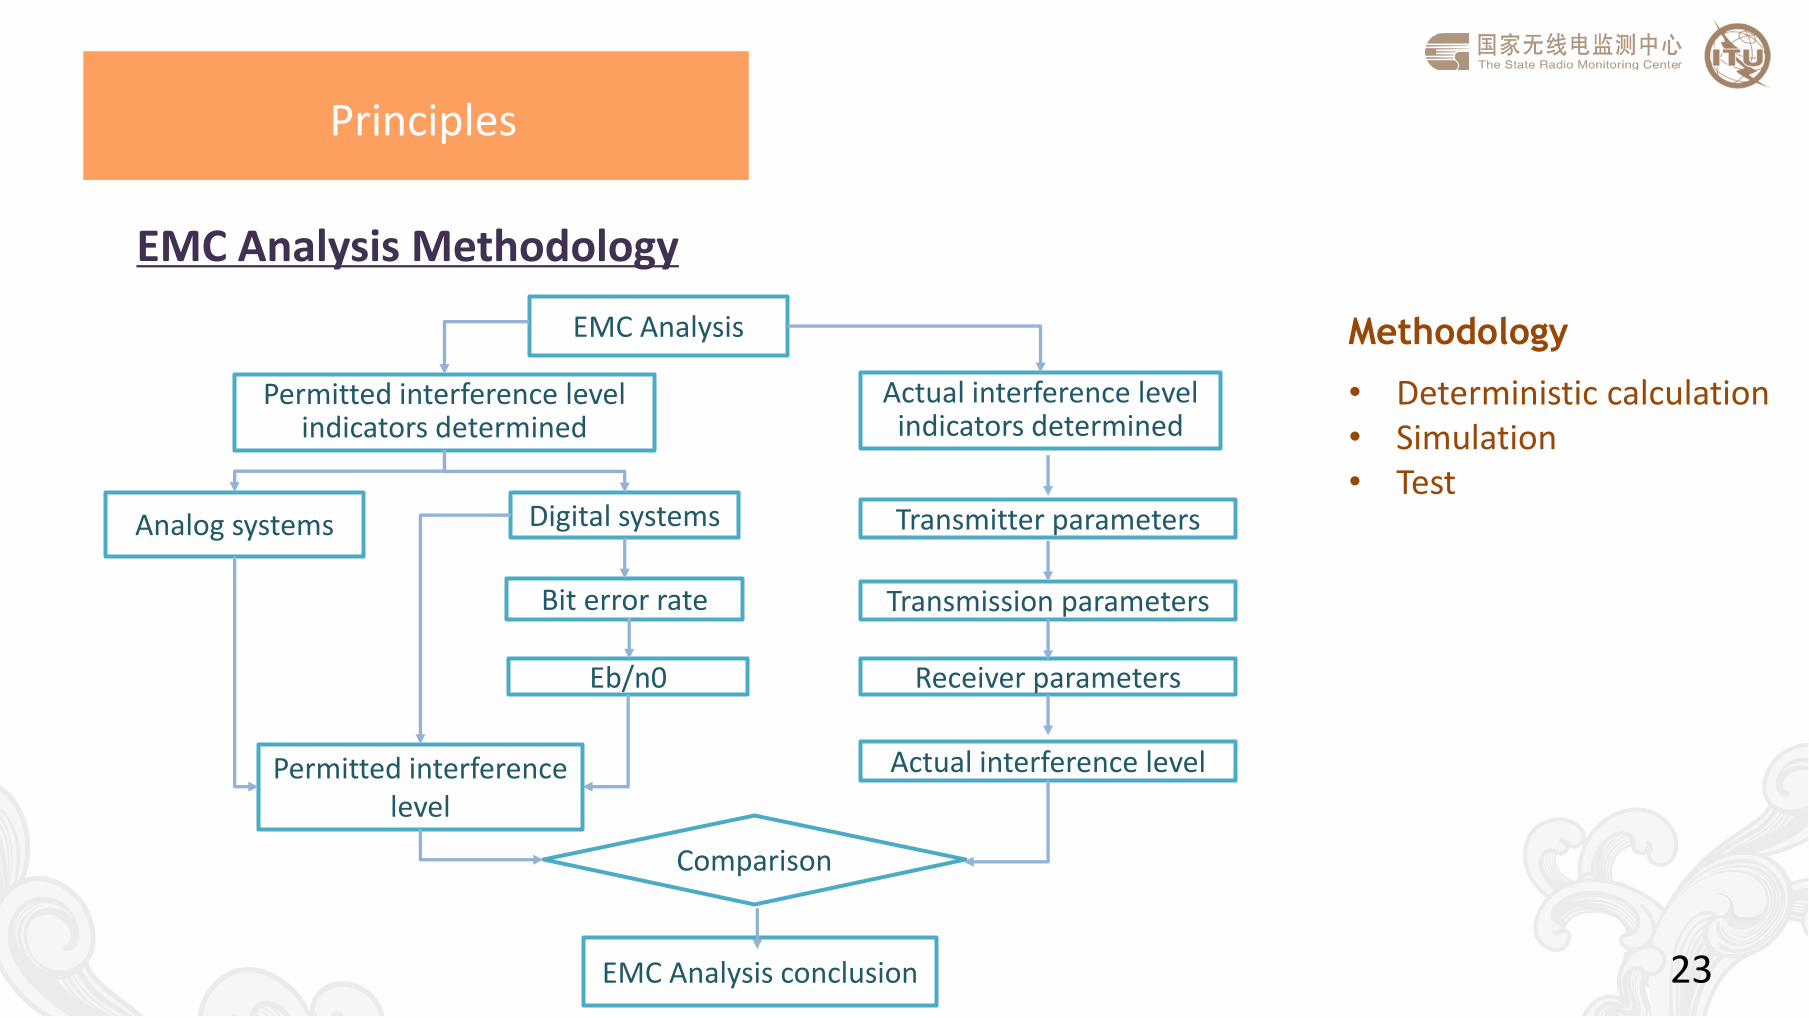
EMC Analysis Methodology
Principles
EMC Analysis
Permitted interference level indicators determined
Actual interference level indicators determined
Analog systems Digital systems
Bit error rate
Eb/n0
Permitted interference level
Transmitter parameters
Transmission parameters
Receiver parameters
Actual interference level
Comparison
EMC Analysis conclusion
Methodology
• Deterministic calculation • Simulation • Test
23

Case study:
5G and ISS @26GHz
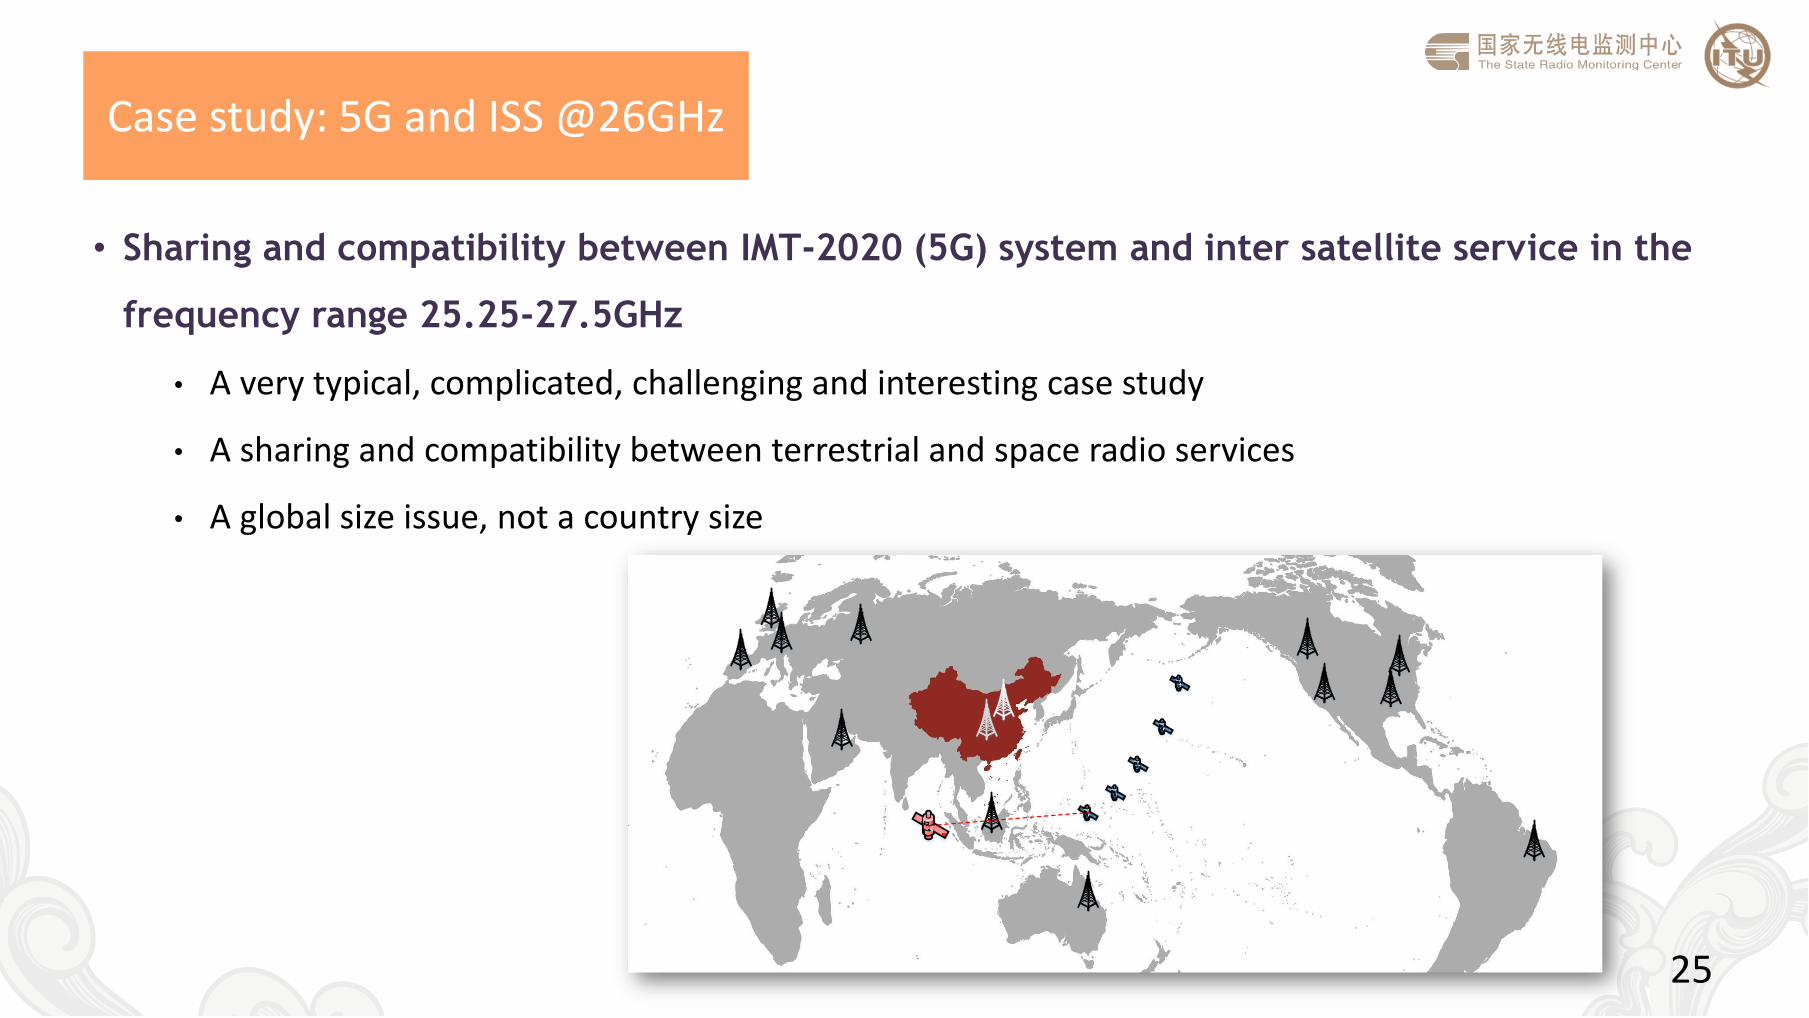
Case study: 5G and ISS @26GHz
25
• Sharing and compatibility between IMT-2020 (5G) system and inter satellite service in the
frequency range 25.25-27.5GHz
• A very typical, complicated, challenging and interesting case study
• A sharing and compatibility between terrestrial and space radio services
• A global size issue, not a country size
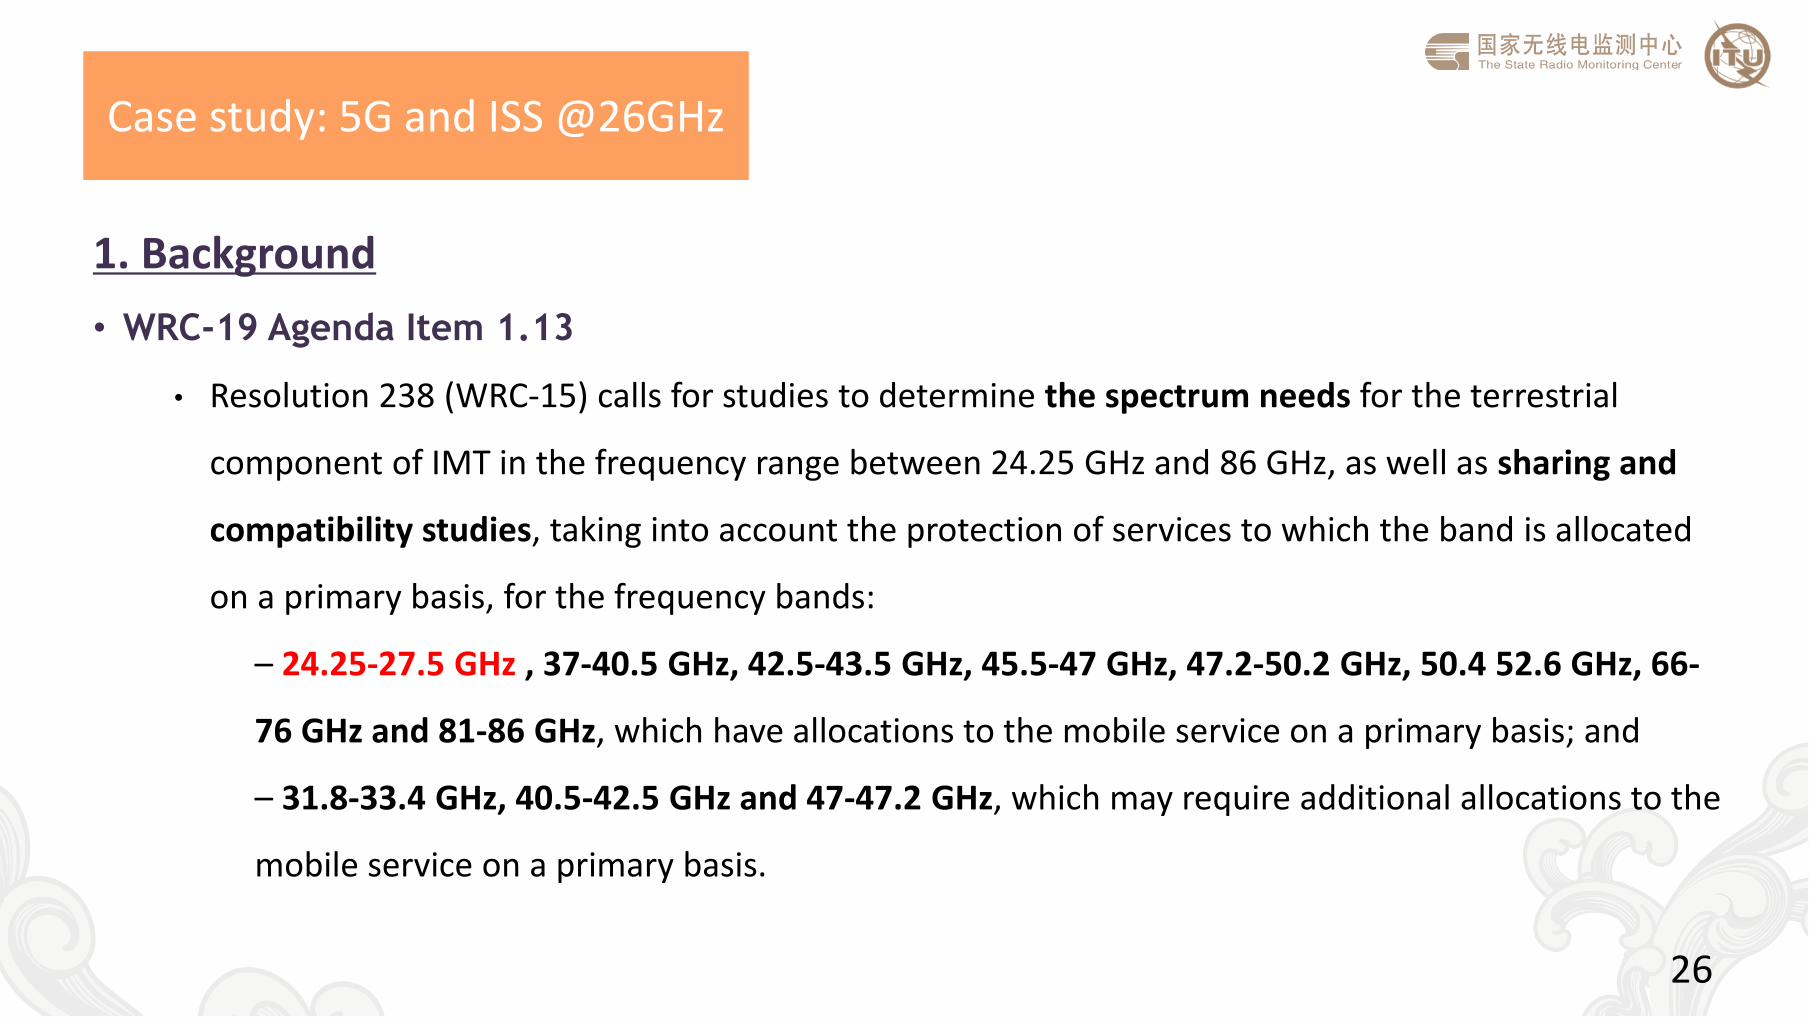
Case study: 5G and ISS @26GHz
1. Background
• WRC-19 Agenda Item 1.13
• Resolution 238 (WRC-15) calls for studies to determine the spectrum needs for the terrestrial
component of IMT in the frequency range between 24.25 GHz and 86 GHz, as well as sharing and
compatibility studies, taking into account the protection of services to which the band is allocated
on a primary basis, for the frequency bands:
– 24.25-27.5 GHz , 37-40.5 GHz, 42.5-43.5 GHz, 45.5-47 GHz, 47.2-50.2 GHz, 50.4 52.6 GHz, 66-
76 GHz and 81-86 GHz, which have allocations to the mobile service on a primary basis; and
– 31.8-33.4 GHz, 40.5-42.5 GHz and 47-47.2 GHz, which may require additional allocations to the
mobile service on a primary basis.
26
27
Case study: 5G and ISS @26GHz
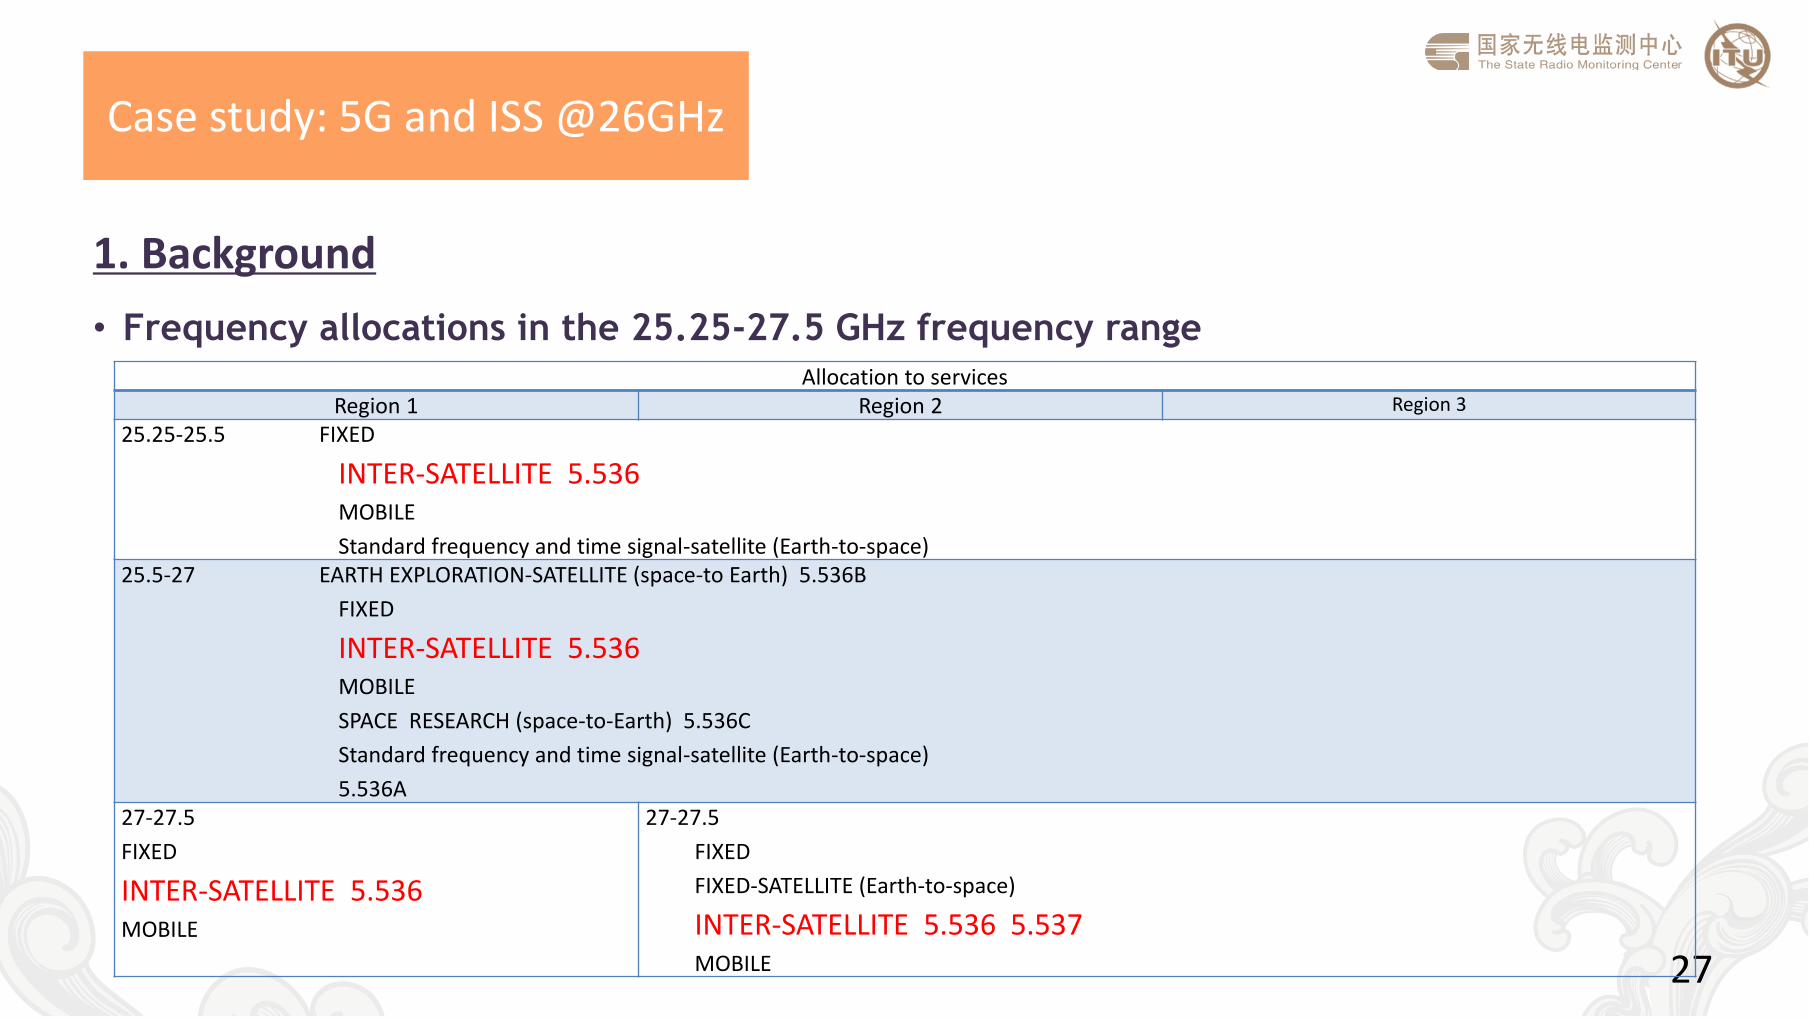
1. Background
• Frequency allocations in the 25.25-27.5 GHz frequency range
Allocation to services
Region 1 Region 2 Region 3
25.25-25.5 FIXED
INTER-SATELLITE 5.536 MOBILE
Standard frequency and time signal-satellite (Earth-to-space) 25.5-27 EARTH EXPLORATION-SATELLITE (space-to Earth) 5.536B
FIXED
INTER-SATELLITE 5.536 MOBILE
SPACE RESEARCH (space-to-Earth) 5.536C
Standard frequency and time signal-satellite (Earth-to-space)
5.536A
27-27.5
FIXED
INTER-SATELLITE 5.536 MOBILE
27-27.5
FIXED
FIXED-SATELLITE (Earth-to-space)
INTER-SATELLITE 5.536 5.537 MOBILE
Case study: 5G and ISS @26GHz
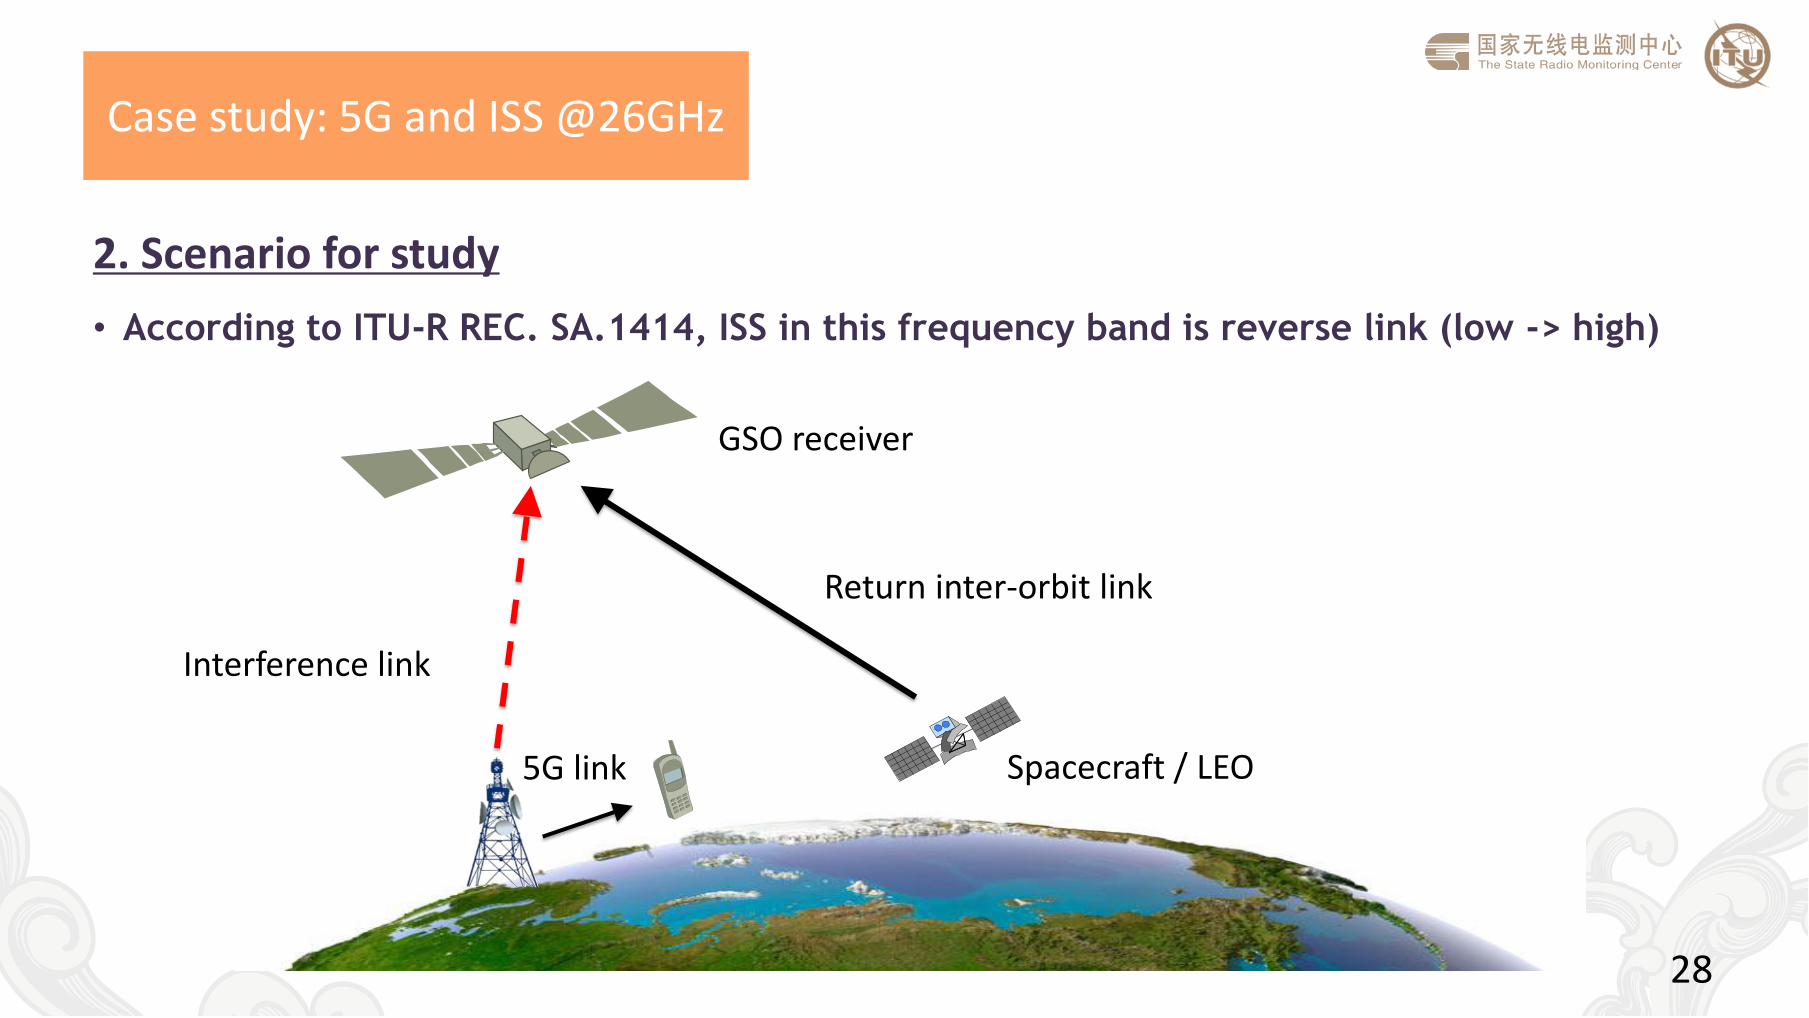
2. Scenario for study
• According to ITU-R REC. SA.1414, ISS in this frequency band is reverse link (low -> high)
Return inter-orbit link
Interference link
28
GSO receiver
5G link Spacecraft / LEO
Case study: 5G and ISS @26GHz
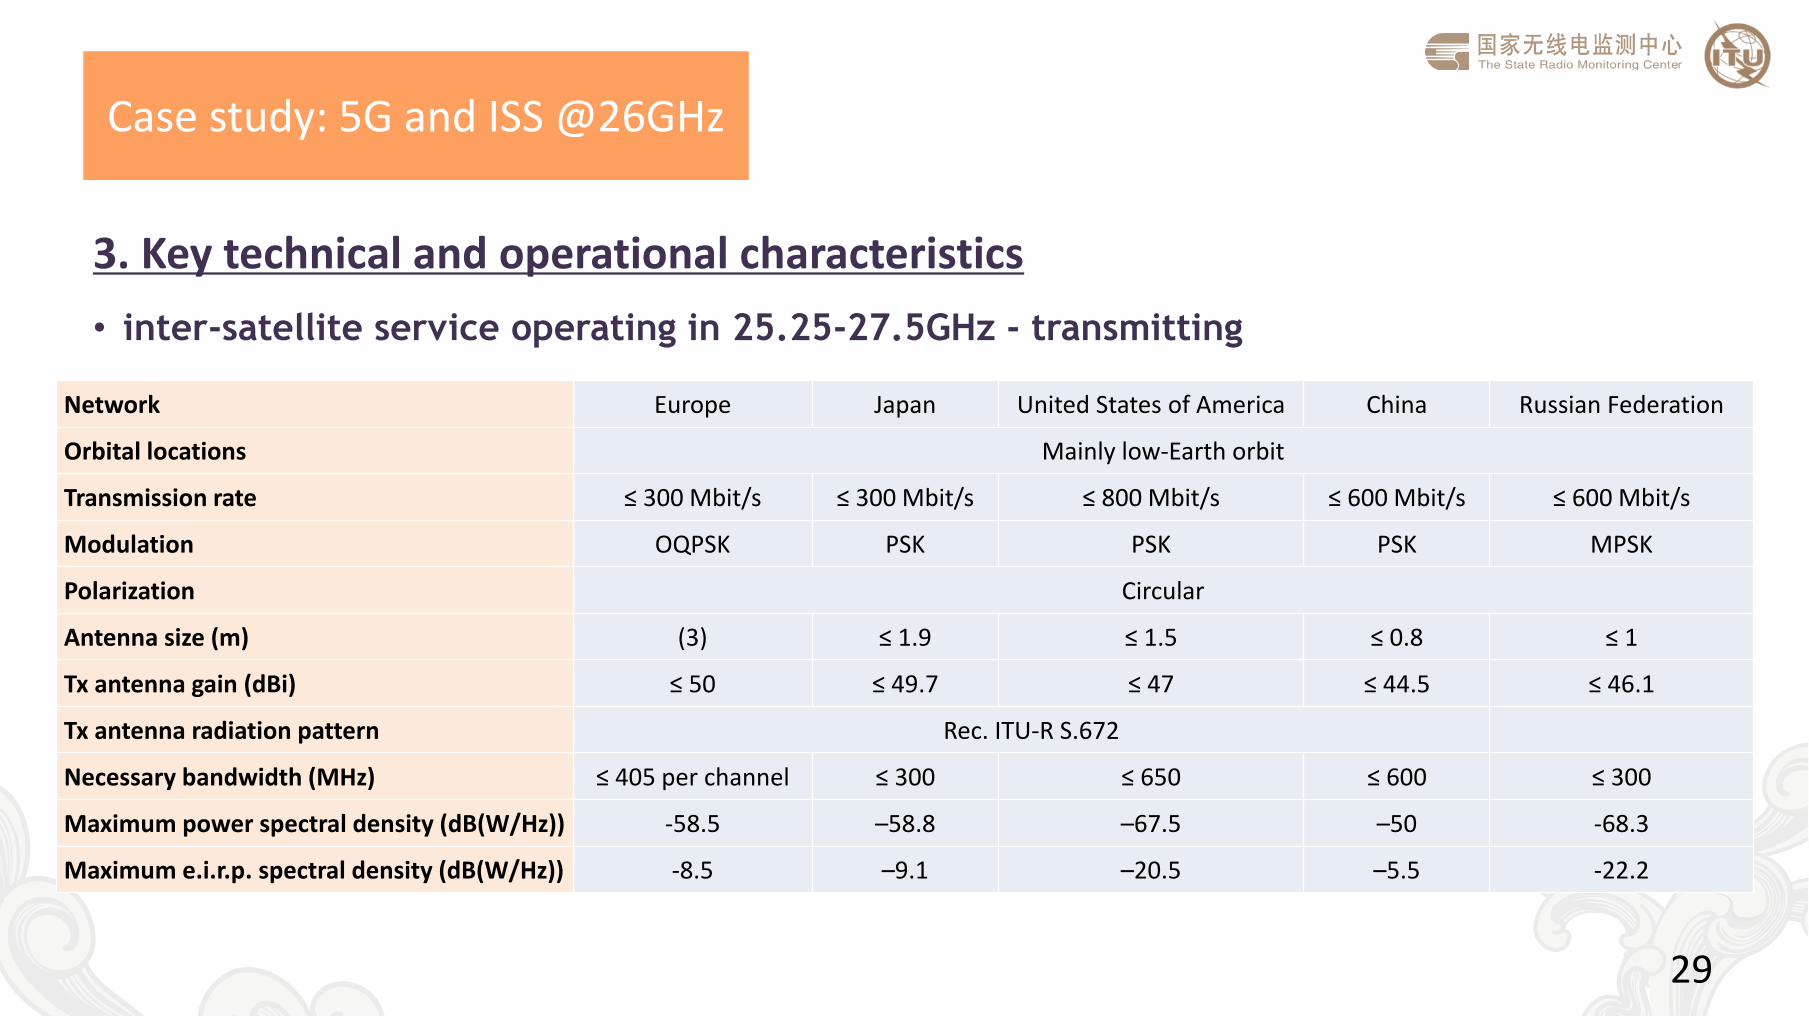
3. Key technical and operational characteristics
• inter-satellite service operating in 25.25-27.5GHz - transmitting
29
Network Europe Japan United States of America China Russian Federation
Orbital locations Mainly low-Earth orbit
Transmission rate ≤ 300 Mbit/s ≤ 300 Mbit/s ≤ 800 Mbit/s ≤ 600 Mbit/s ≤ 600 Mbit/s
Modulation OQPSK PSK PSK PSK MPSK
Polarization Circular
Antenna size (m) (3) ≤ 1.9 ≤ 1.5 ≤ 0.8 ≤ 1
Tx antenna gain (dBi) ≤ 50 ≤ 49.7 ≤ 47 ≤ 44.5 ≤ 46.1
Tx antenna radiation pattern Rec. ITU-R S.672
Necessary bandwidth (MHz) ≤ 405 per channel ≤ 300 ≤ 650 ≤ 600 ≤ 300
Maximum power spectral density (dB(W/Hz)) -58.5 –58.8 –67.5 –50 -68.3
Maximum e.i.r.p. spectral density (dB(W/Hz)) -8.5 –9.1 –20.5 –5.5 -22.2
Case study: 5G and ISS @26GHz
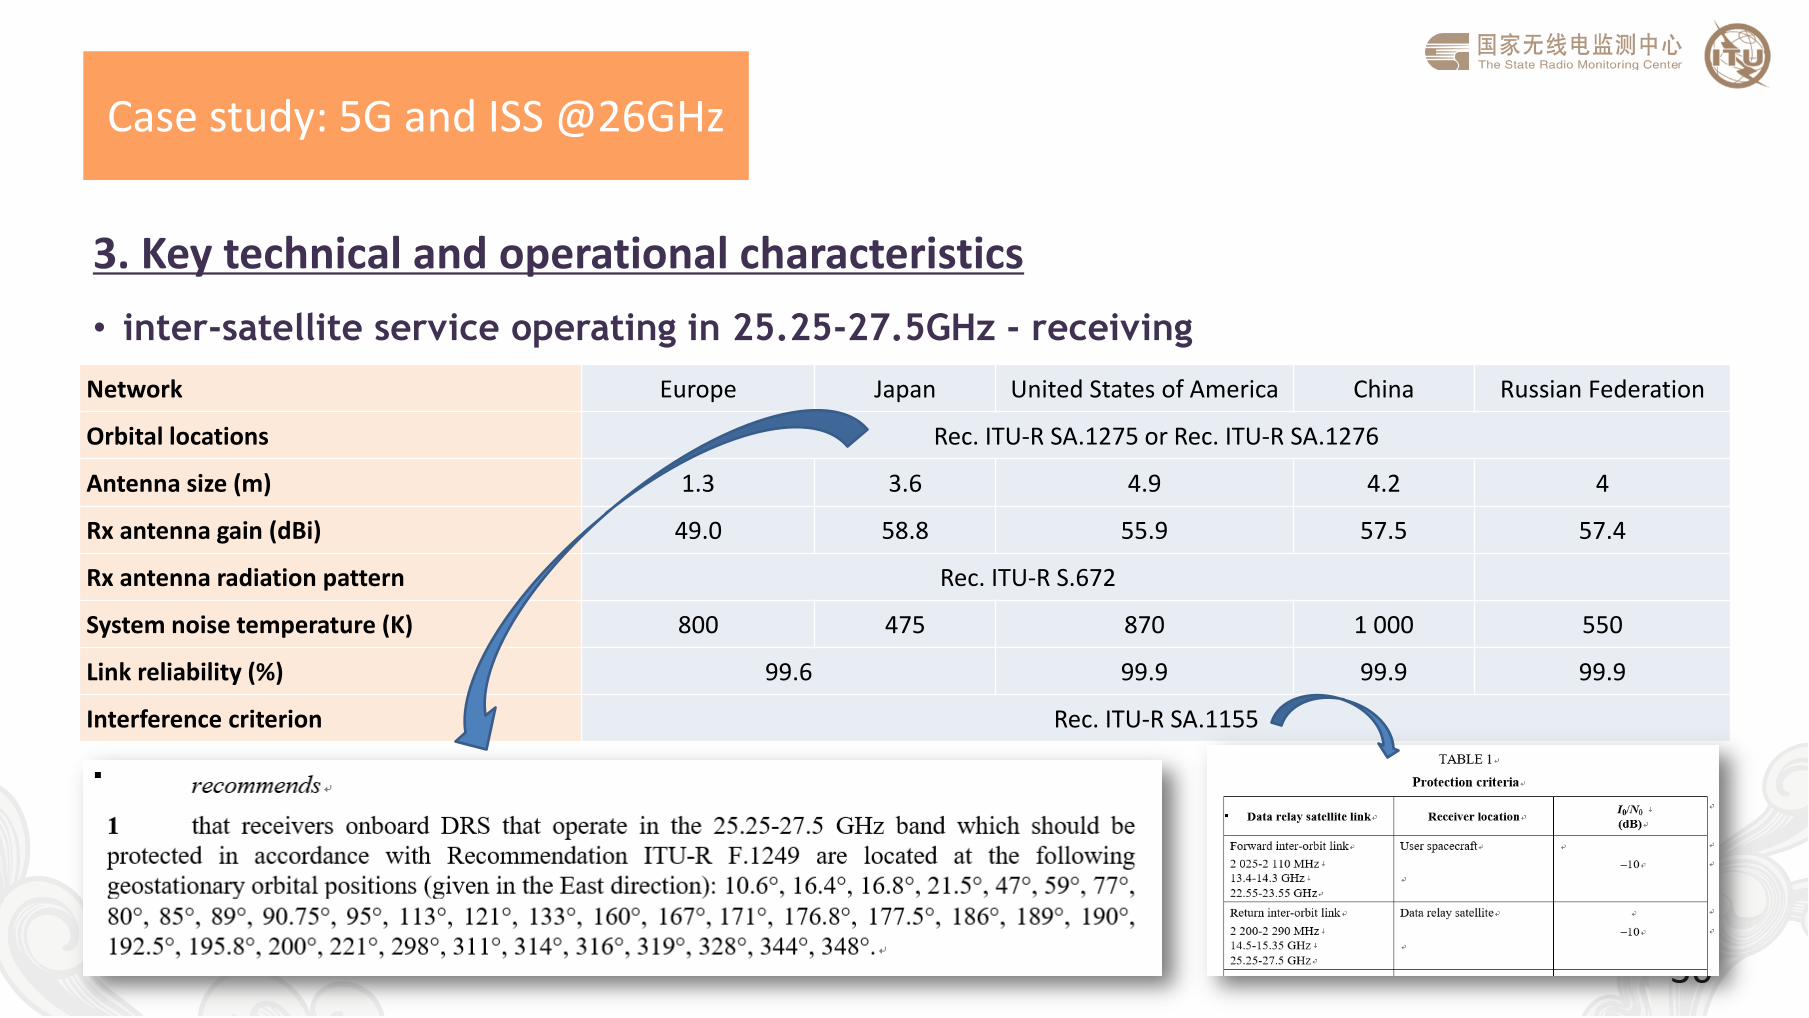
3. Key technical and operational characteristics
• inter-satellite service operating in 25.25-27.5GHz - receiving
30
Network Europe Japan United States of America China Russian Federation
Orbital locations Rec. ITU-R SA.1275 or Rec. ITU-R SA.1276
Antenna size (m) 1.3 3.6 4.9 4.2 4
Rx antenna gain (dBi) 49.0 58.8 55.9 57.5 57.4
Rx antenna radiation pattern Rec. ITU-R S.672
System noise temperature (K) 800 475 870 1 000 550
Link reliability (%) 99.6 99.9 99.9 99.9
Interference criterion Rec. ITU-R SA.1155
Case study: 5G and ISS @26GHz
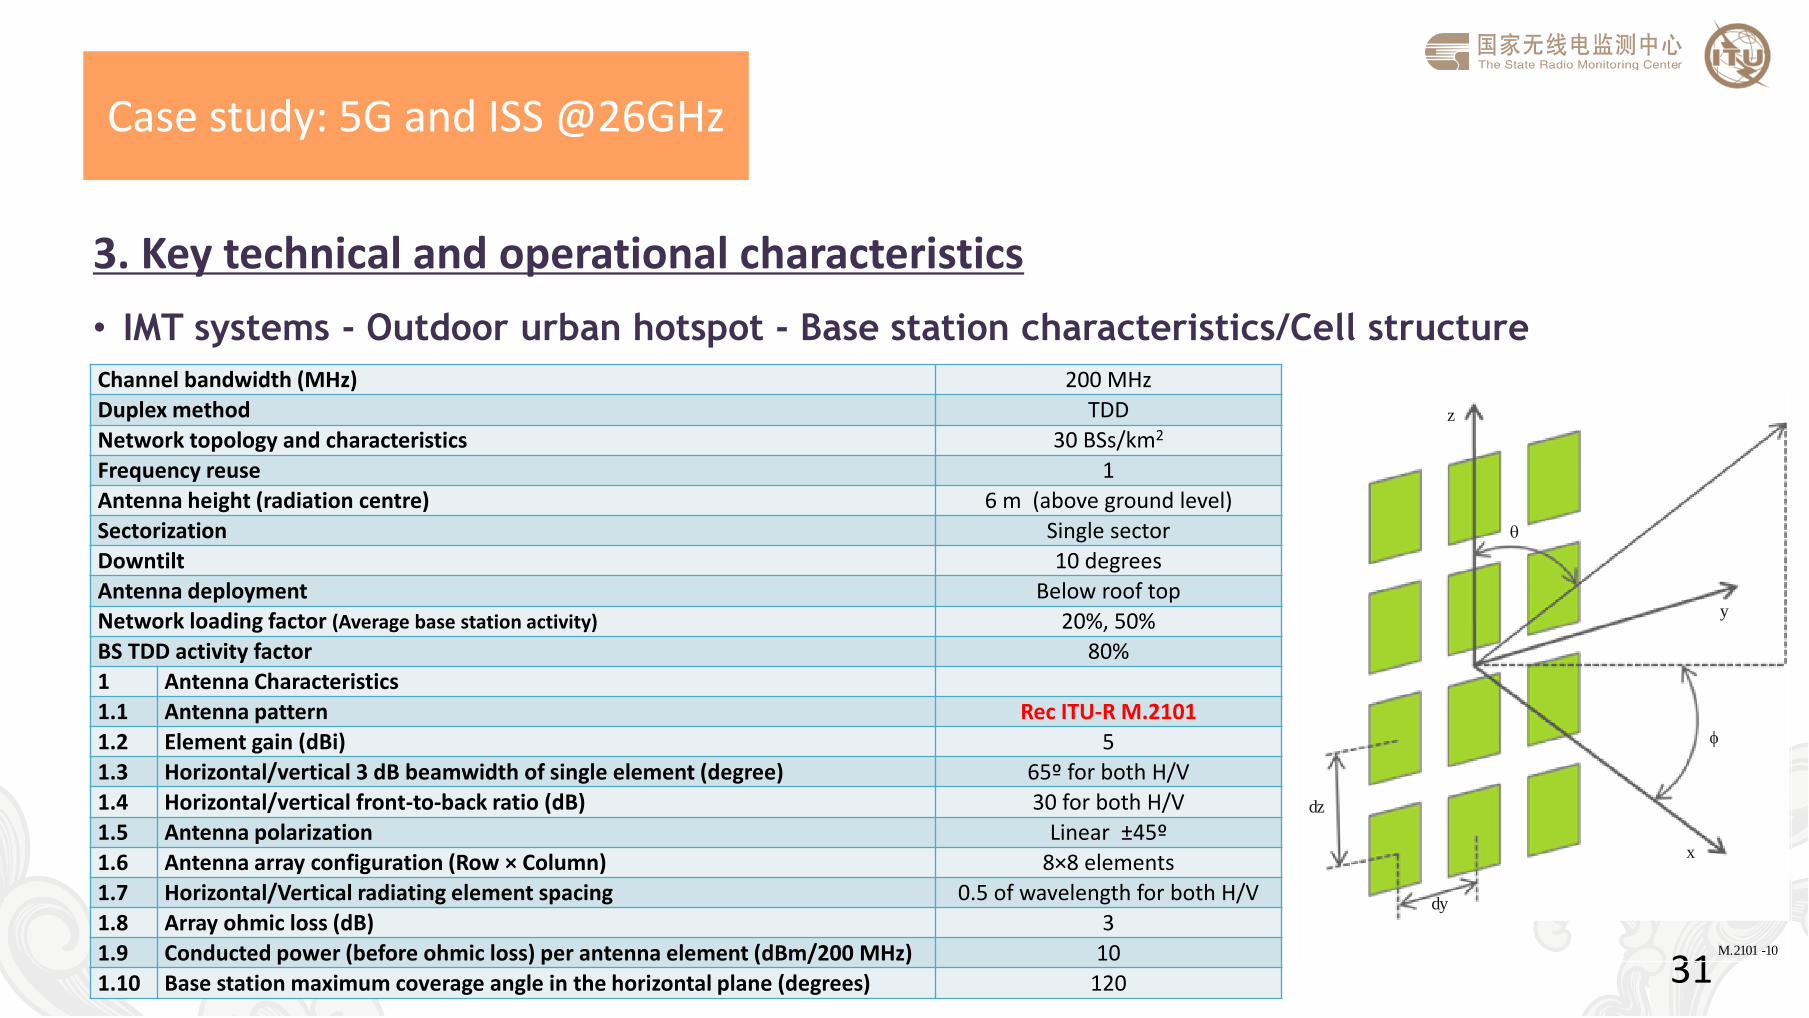
3. Key technical and operational characteristics
• IMT systems - Outdoor urban hotspot - Base station characteristics/Cell structure
31
Channel bandwidth (MHz) 200 MHz
Duplex method TDD
Network topology and characteristics 30 BSs/km2
Frequency reuse 1
Antenna height (radiation centre) 6 m (above ground level)
Sectorization Single sector
Downtilt 10 degrees
Antenna deployment Below roof top
Network loading factor (Average base station activity) 20%, 50%
BS TDD activity factor 80%
1 Antenna Characteristics
1.1 Antenna pattern Rec ITU-R M.2101
1.2 Element gain (dBi) 5
1.3 Horizontal/vertical 3 dB beamwidth of single element (degree) 65º for both H/V
1.4 Horizontal/vertical front-to-back ratio (dB) 30 for both H/V
1.5 Antenna polarization Linear ±45º
1.6 Antenna array configuration (Row × Column) 8×8 elements
1.7 Horizontal/Vertical radiating element spacing 0.5 of wavelength for both H/V
1.8 Array ohmic loss (dB) 3
1.9 Conducted power (before ohmic loss) per antenna element (dBm/200 MHz) 10
1.10 Base station maximum coverage angle in the horizontal plane (degrees) 120
M.2101 10-
dz
z
y
dy
x
Case study: 5G and ISS @26GHz
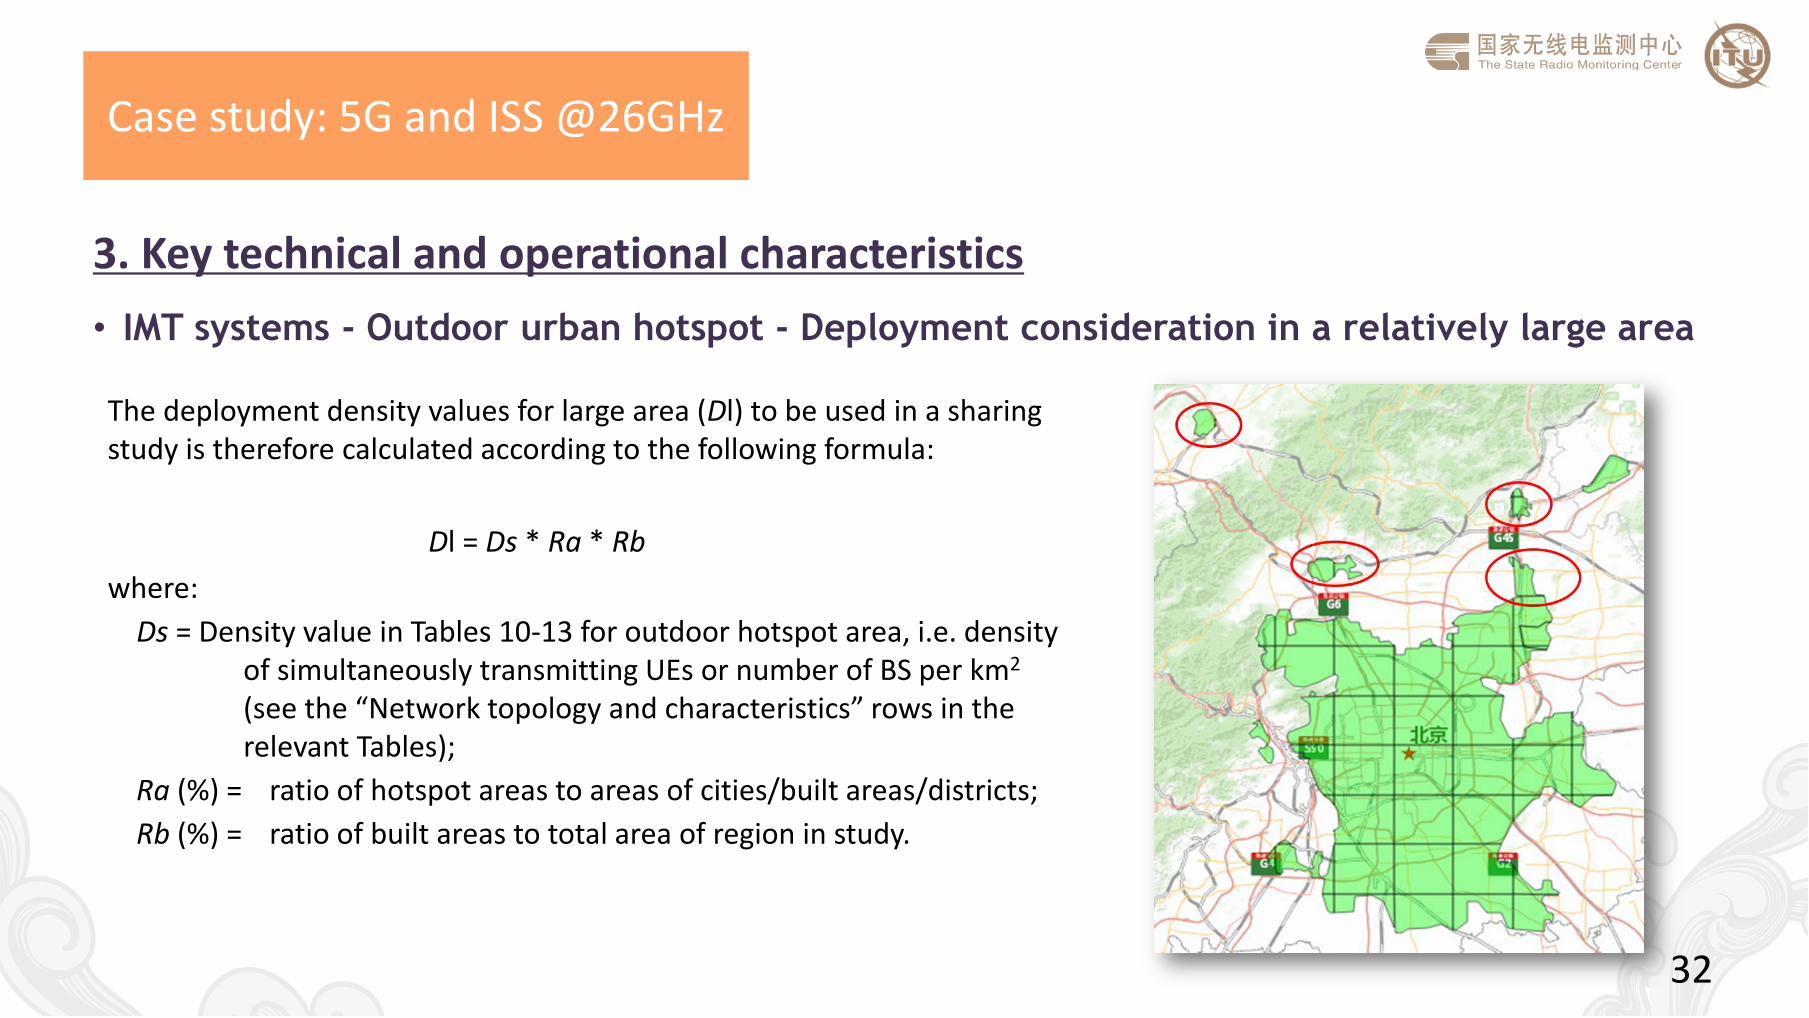
3. Key technical and operational characteristics
• IMT systems - Outdoor urban hotspot - Deployment consideration in a relatively large area
32
The deployment density values for large area (Dl) to be used in a sharing study is therefore calculated according to the following formula:
Dl = Ds * Ra * Rb
where:
Ds = Density value in Tables 10-13 for outdoor hotspot area, i.e. density of simultaneously transmitting UEs or number of BS per km2 (see the “Network topology and characteristics” rows in the relevant Tables);
Ra (%) = ratio of hotspot areas to areas of cities/built areas/districts;
Rb (%) = ratio of built areas to total area of region in study.
Case study: 5G and ISS @26GHz
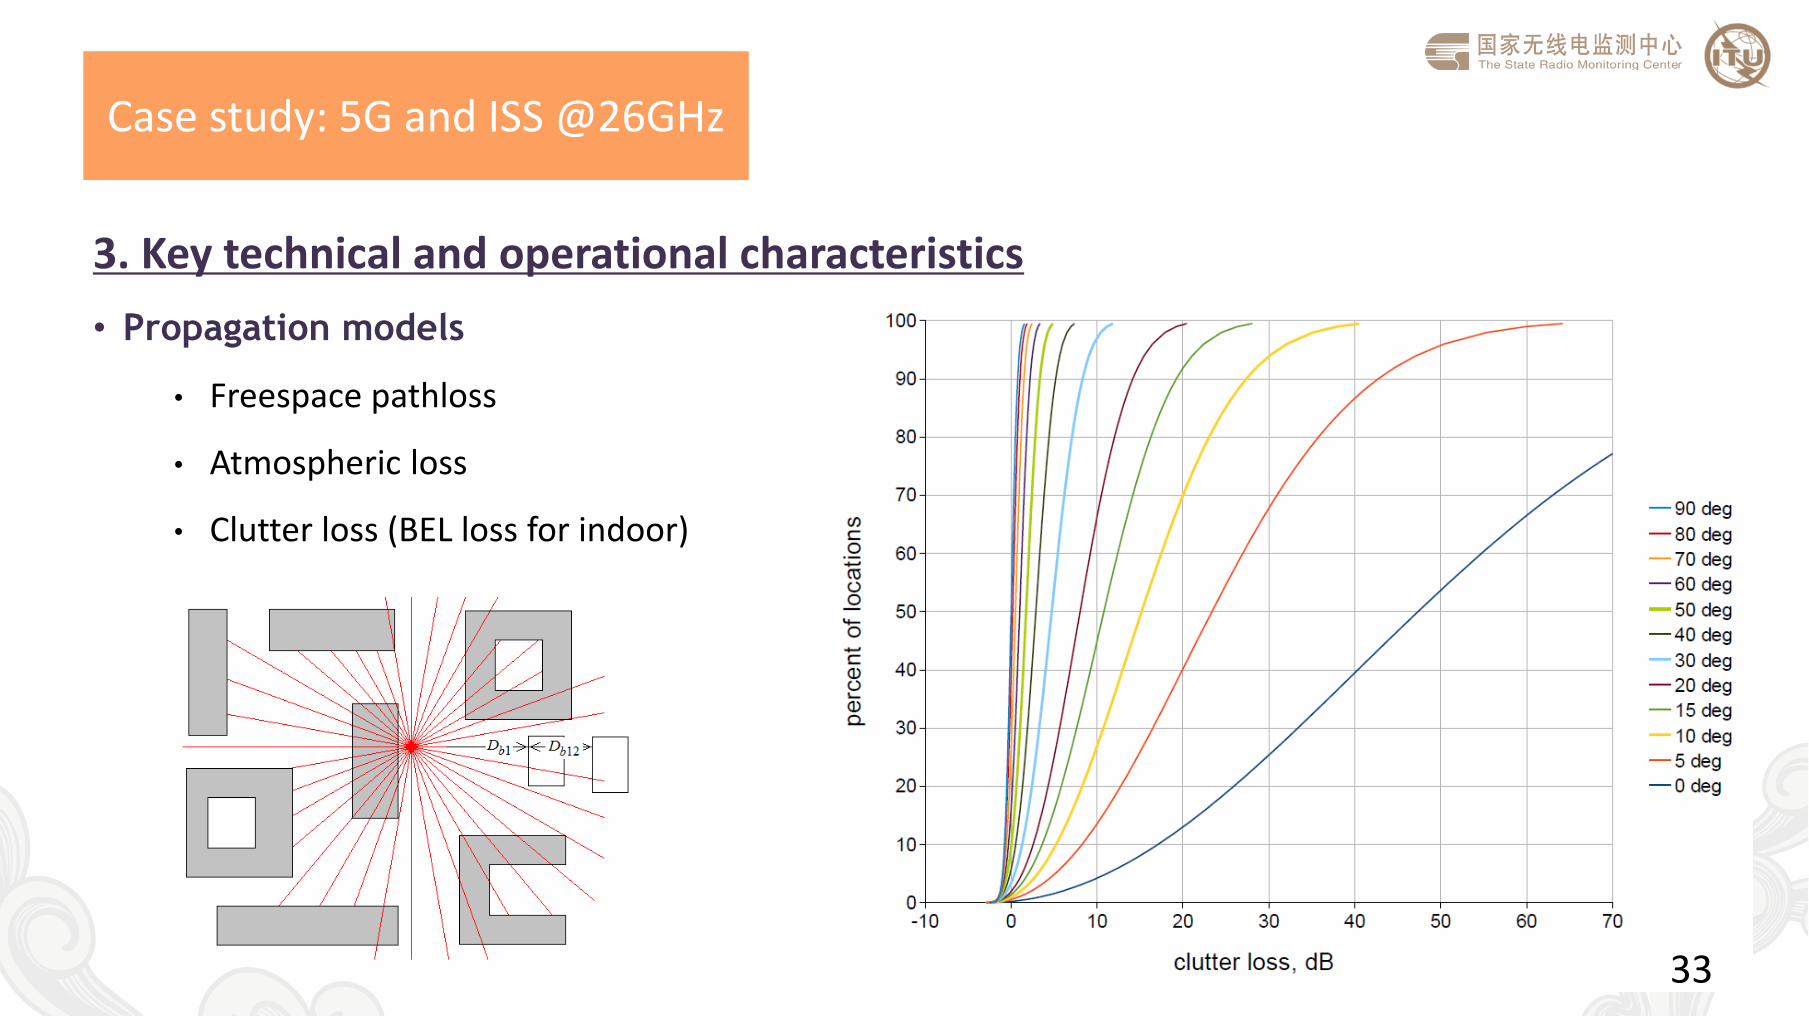
3. Key technical and operational characteristics
• Propagation models
• Freespace pathloss
• Atmospheric loss
• Clutter loss (BEL loss for indoor)
33
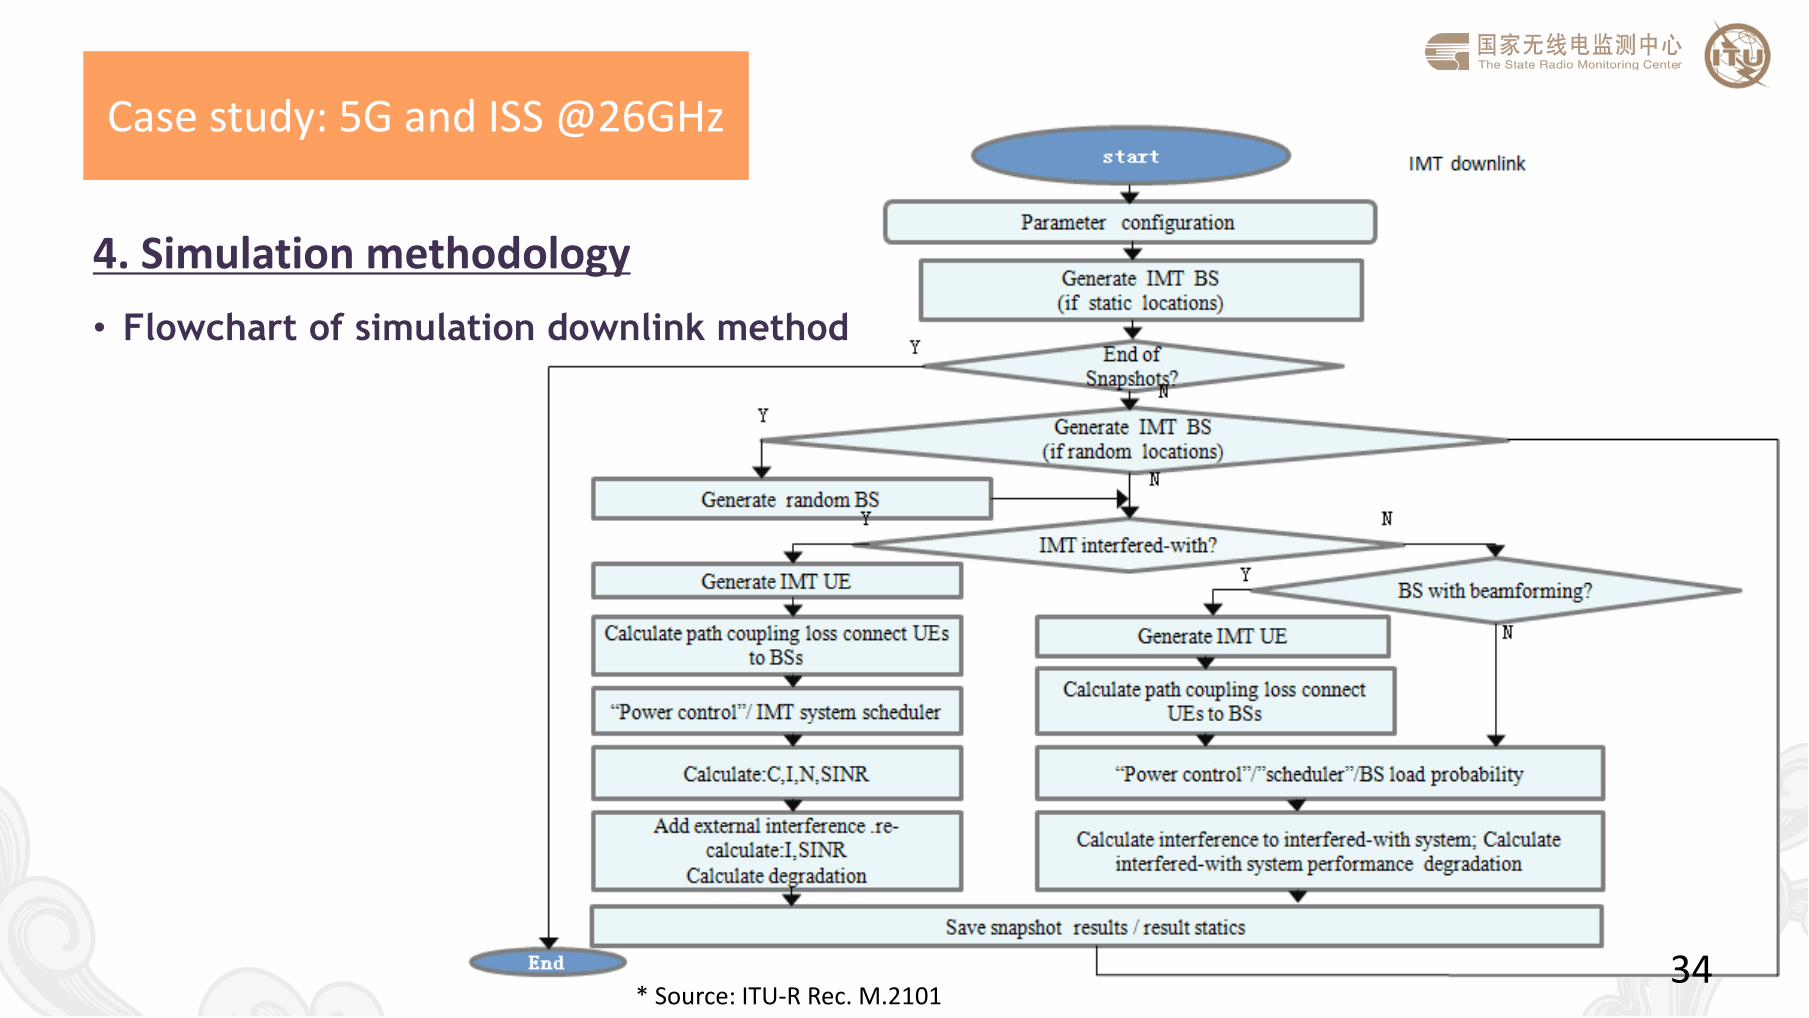
Case study: 5G and ISS @26GHz
4. Simulation methodology
• Flowchart of simulation downlink method
34 * Source: ITU-R Rec. M.2101
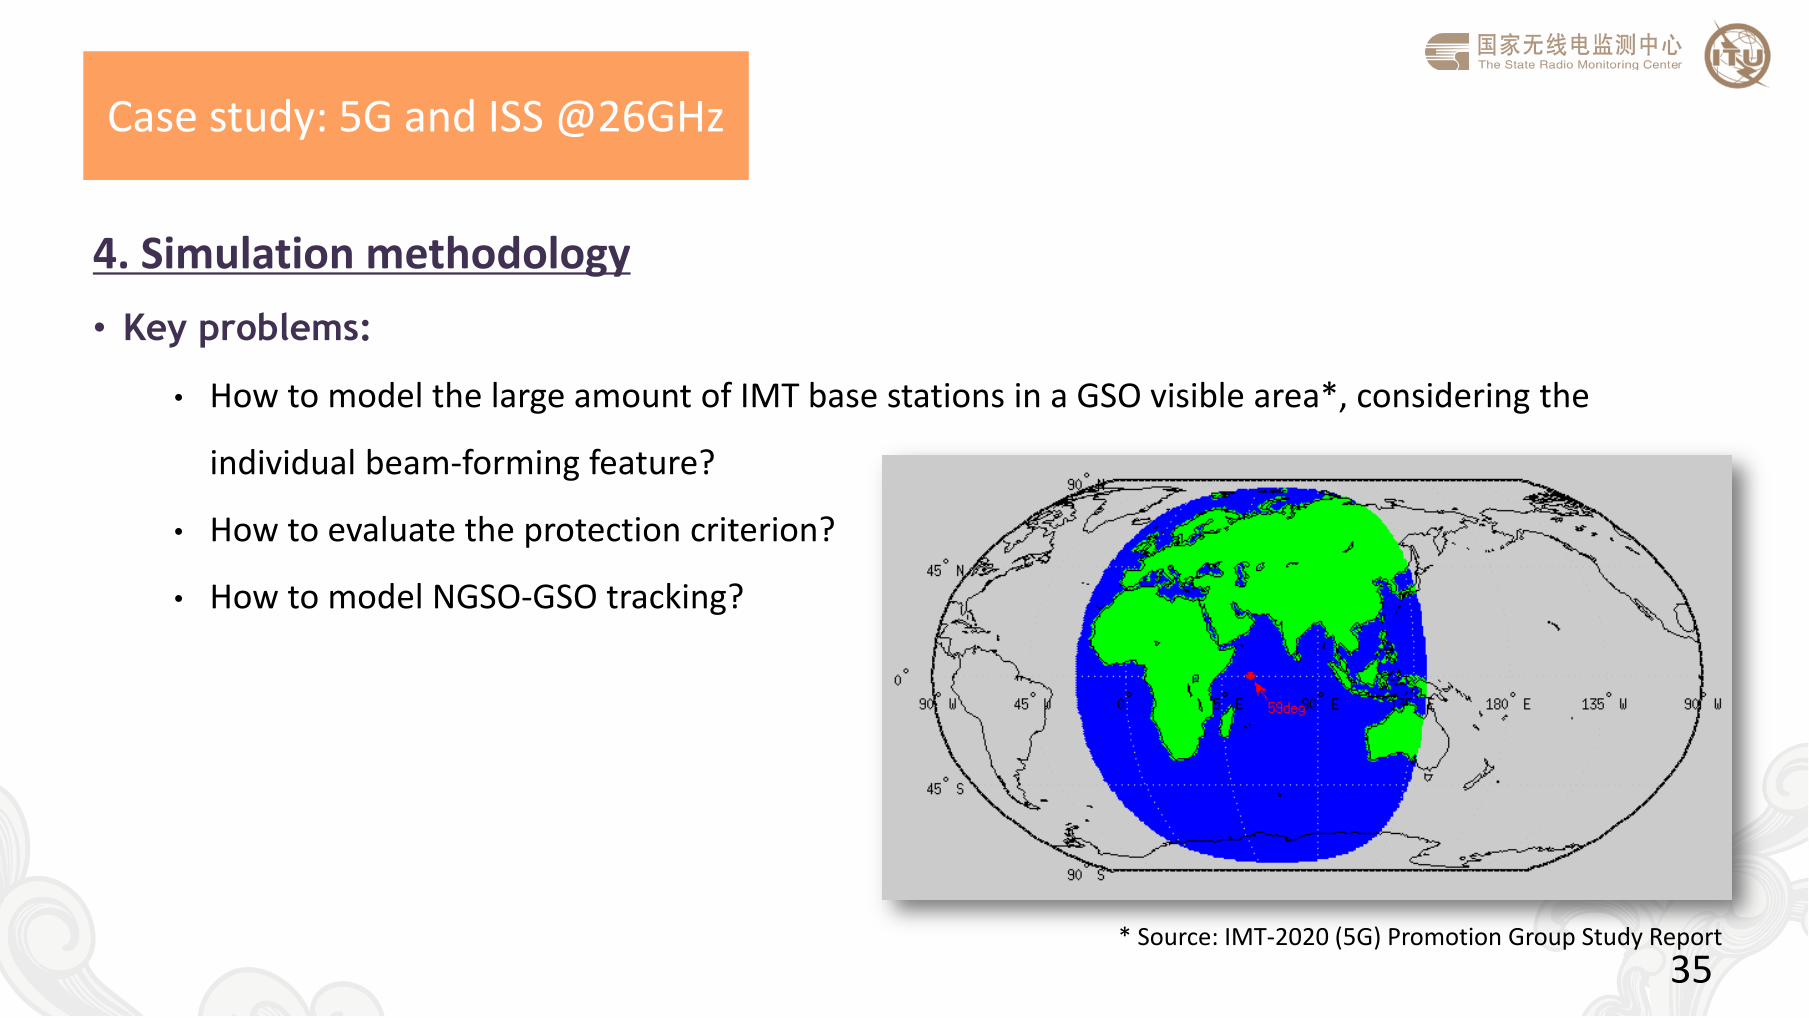
Case study: 5G and ISS @26GHz
4. Simulation methodology
• Key problems:
• How to model the large amount of IMT base stations in a GSO visible area*, considering the
individual beam-forming feature?
• How to evaluate the protection criterion?
• How to model NGSO-GSO tracking?
35 * Source: IMT-2020 (5G) Promotion Group Study Report
Case study: 5G and ISS @26GHz
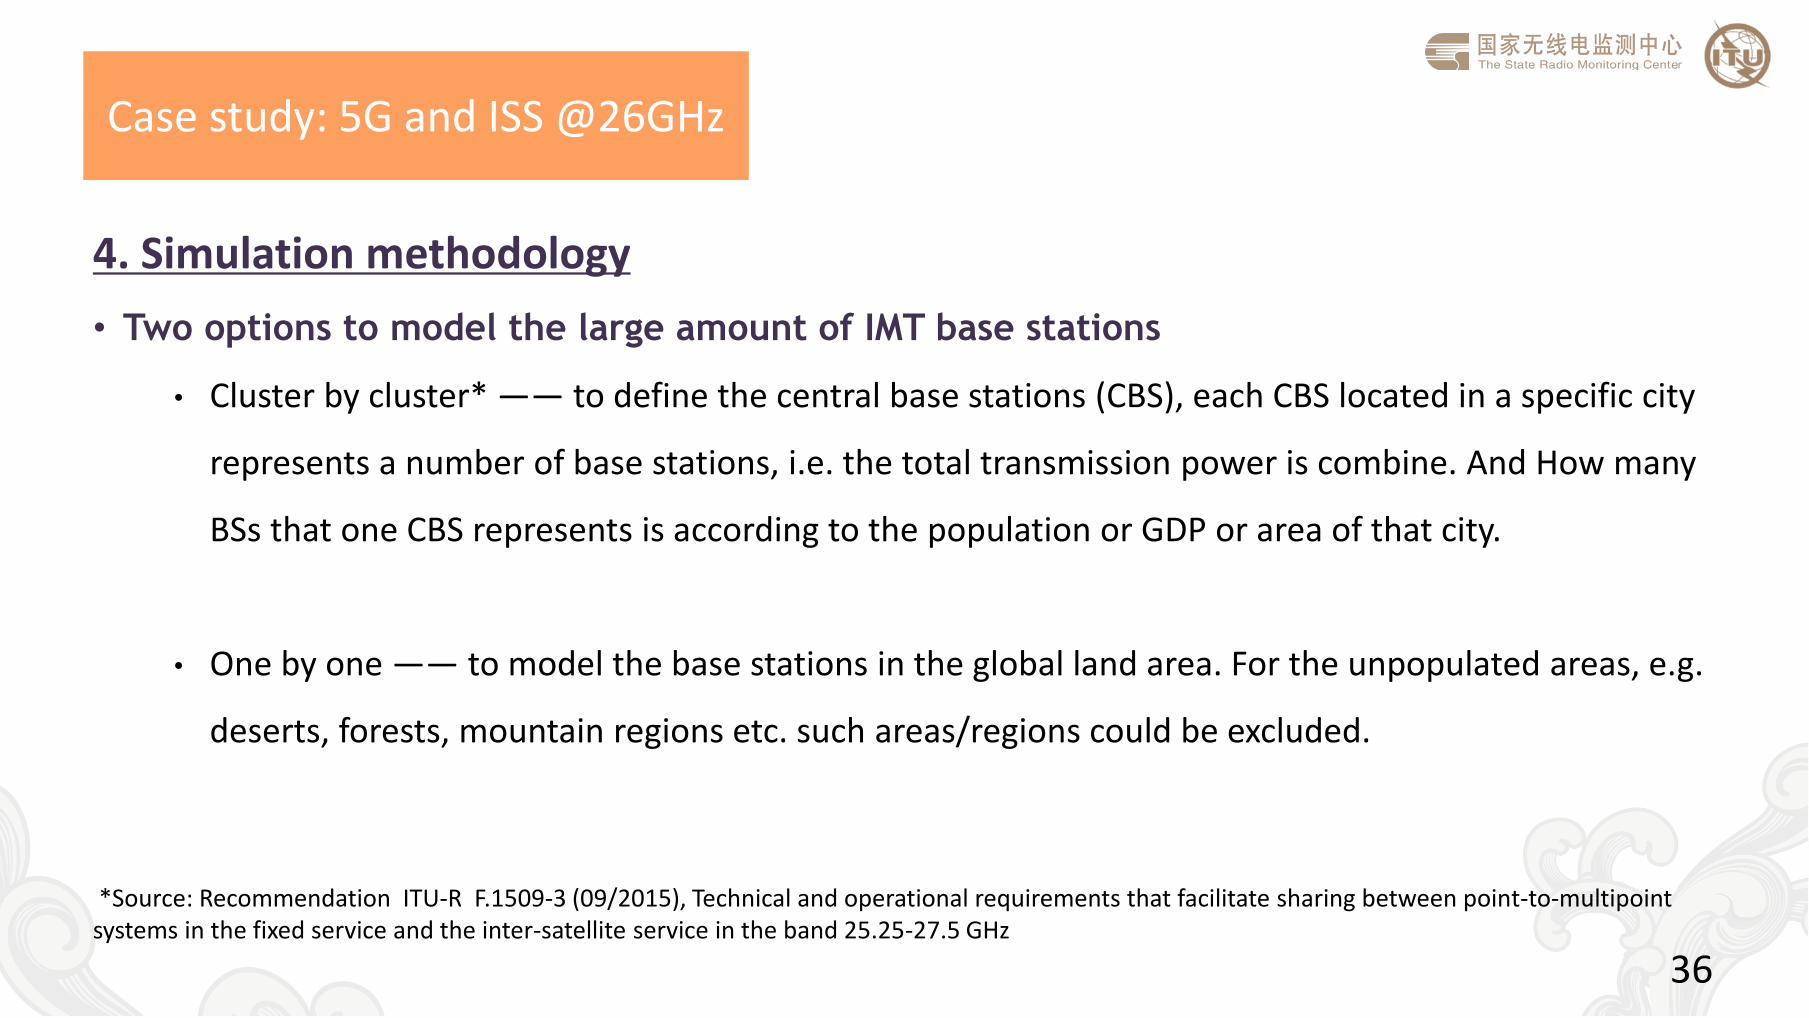
4. Simulation methodology
• Two options to model the large amount of IMT base stations
• Cluster by cluster* —— to define the central base stations (CBS), each CBS located in a specific city
represents a number of base stations, i.e. the total transmission power is combine. And How many
BSs that one CBS represents is according to the population or GDP or area of that city.
• One by one —— to model the base stations in the global land area. For the unpopulated areas, e.g.
deserts, forests, mountain regions etc. such areas/regions could be excluded.
36
*Source: Recommendation ITU-R F.1509-3 (09/2015), Technical and operational requirements that facilitate sharing between point-to-multipoint systems in the fixed service and the inter-satellite service in the band 25.25-27.5 GHz
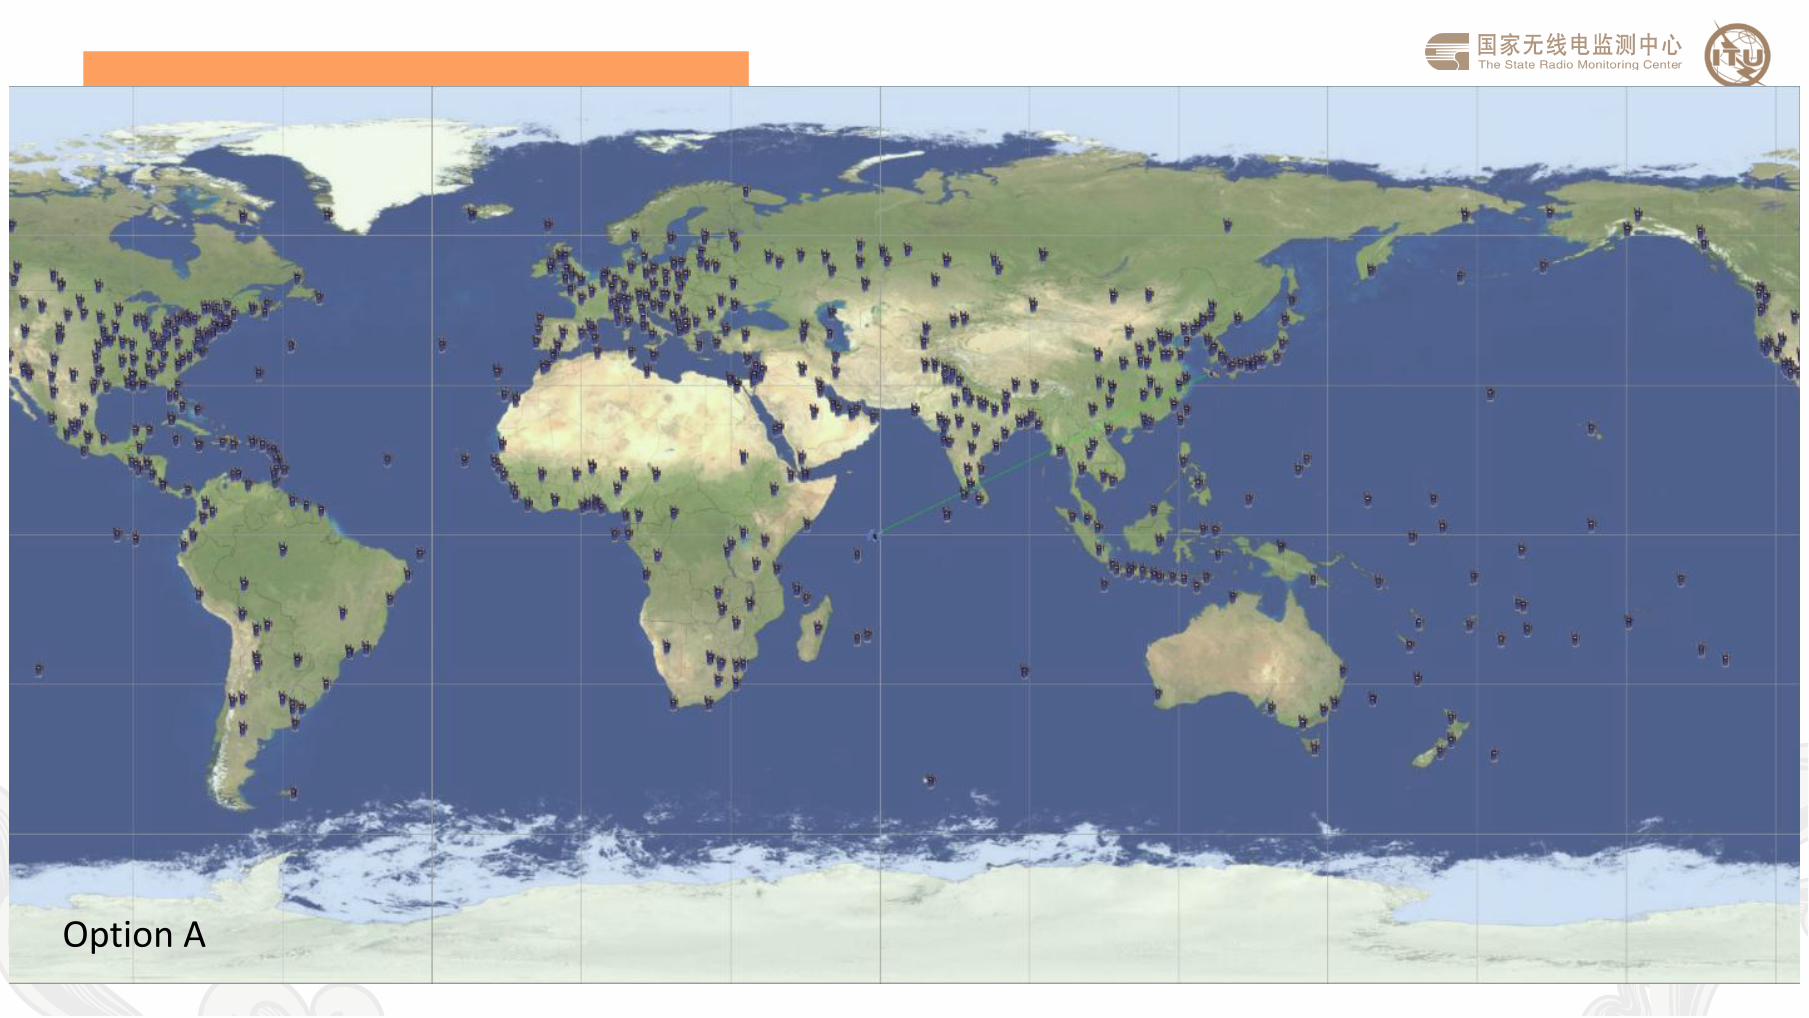
Case study: 5G and ISS @26GHz
4. Simulation methodology
• Two options to model the large amount of IMT base stations
• One by one
• Cluster by cluster
37 Option A
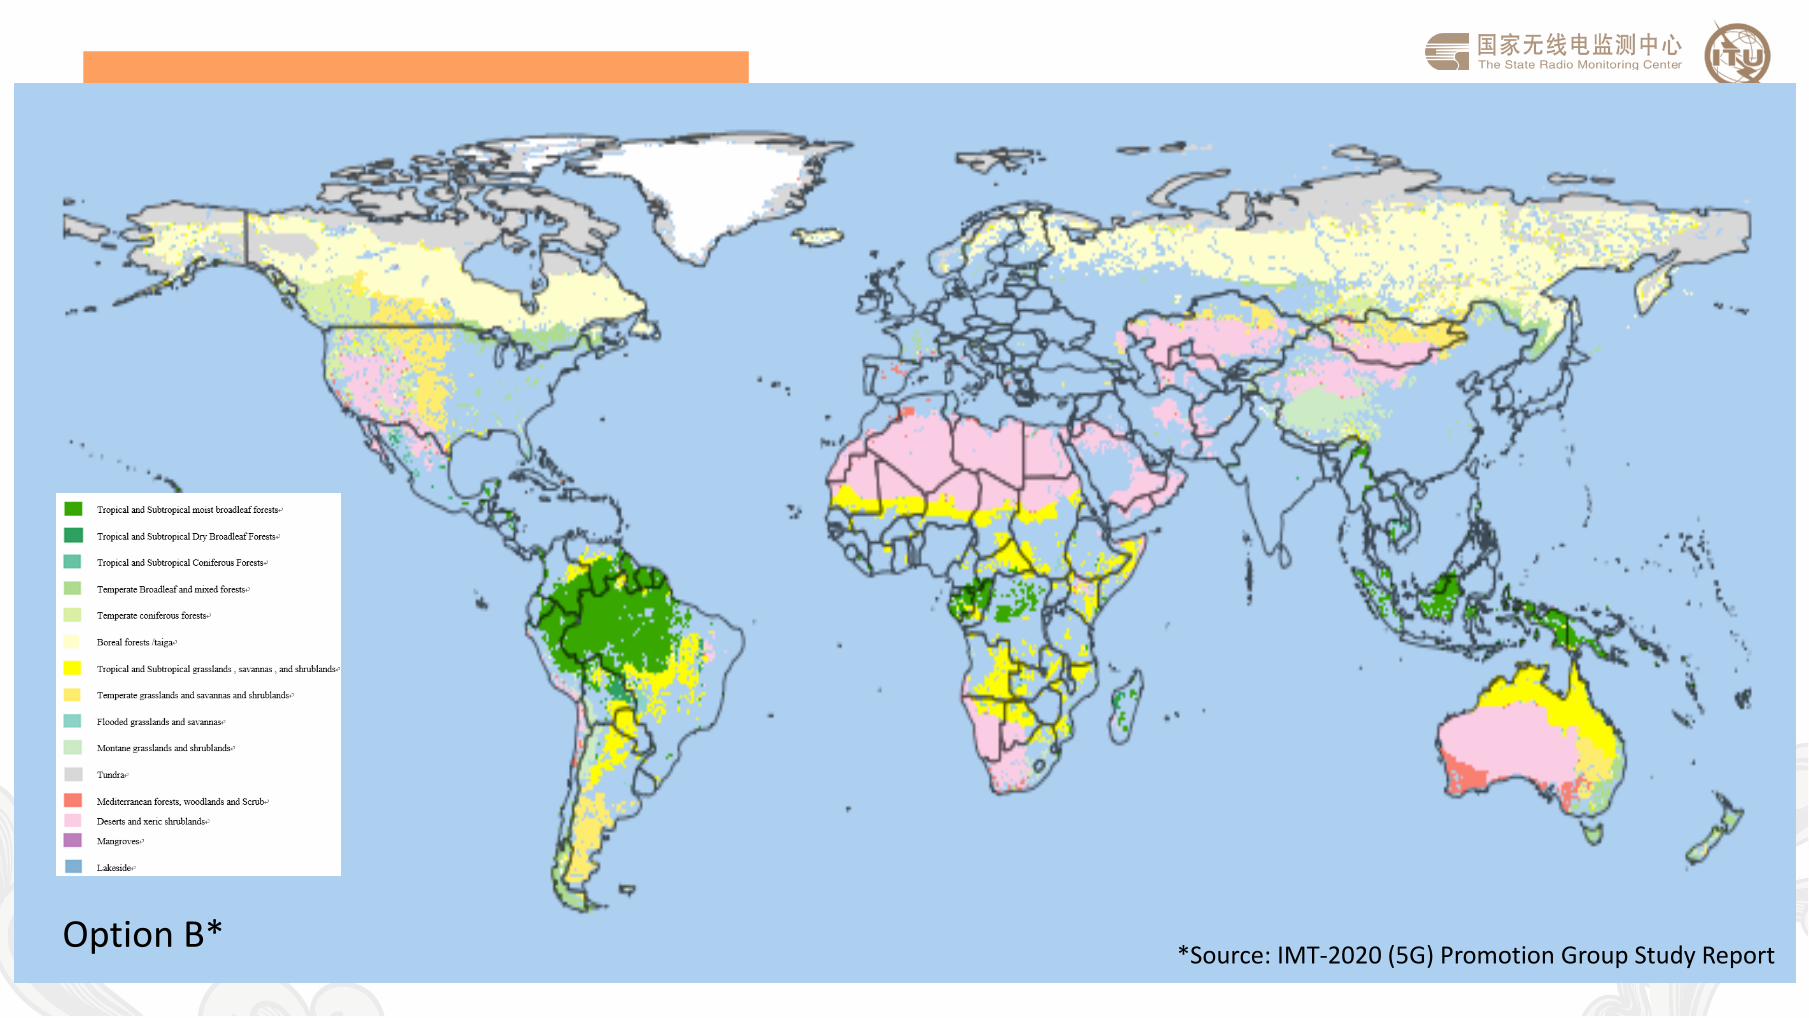
Case study: 5G and ISS @26GHz
4. Simulation methodology
• Two options to model the large amount of IMT base stations
• One by one
• Cluster by cluster
38 Option B*
*Source: IMT-2020 (5G) Promotion Group Study Report
Case study: 5G and ISS @26GHz
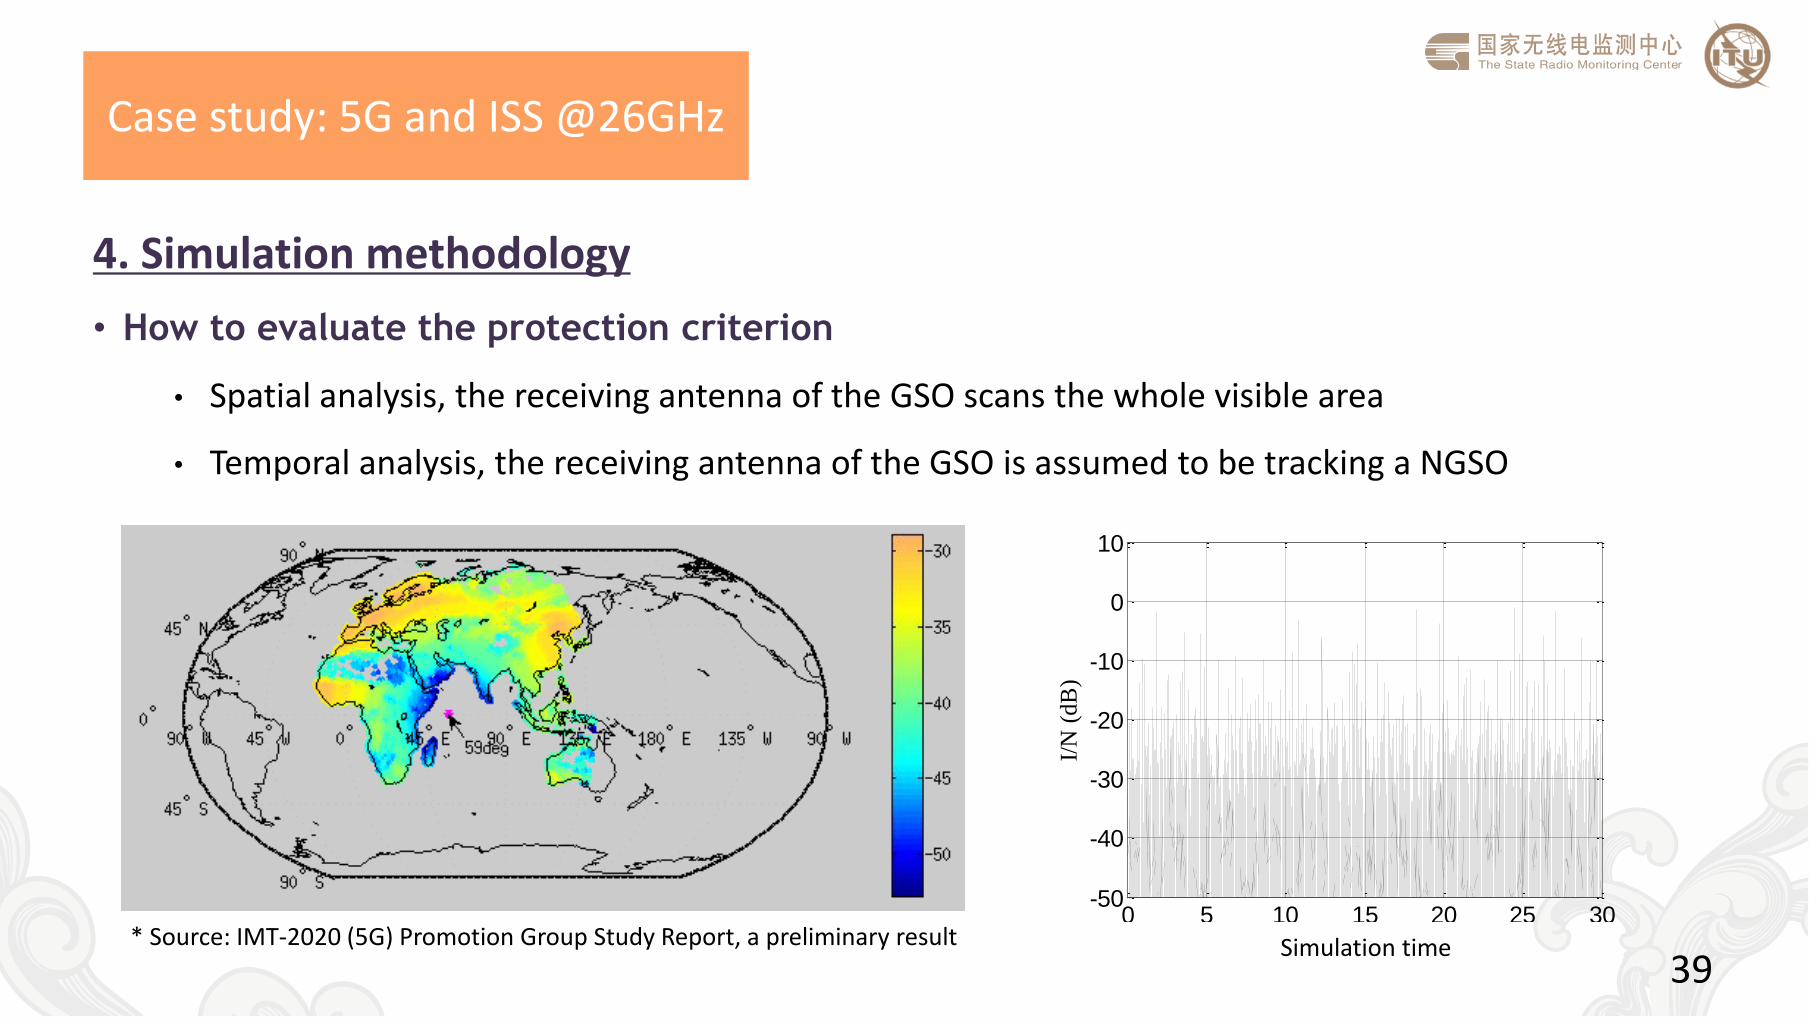
4. Simulation methodology
• How to evaluate the protection criterion
• Spatial analysis, the receiving antenna of the GSO scans the whole visible area
• Temporal analysis, the receiving antenna of the GSO is assumed to be tracking a NGSO
39
0 5 10 15 20 25 30-50
-40
-30
-20
-10
0
10
卫星运行时间(天)
I/N
(d
B)
Simulation time * Source: IMT-2020 (5G) Promotion Group Study Report, a preliminary result
Case study: 5G and ISS @26GHz
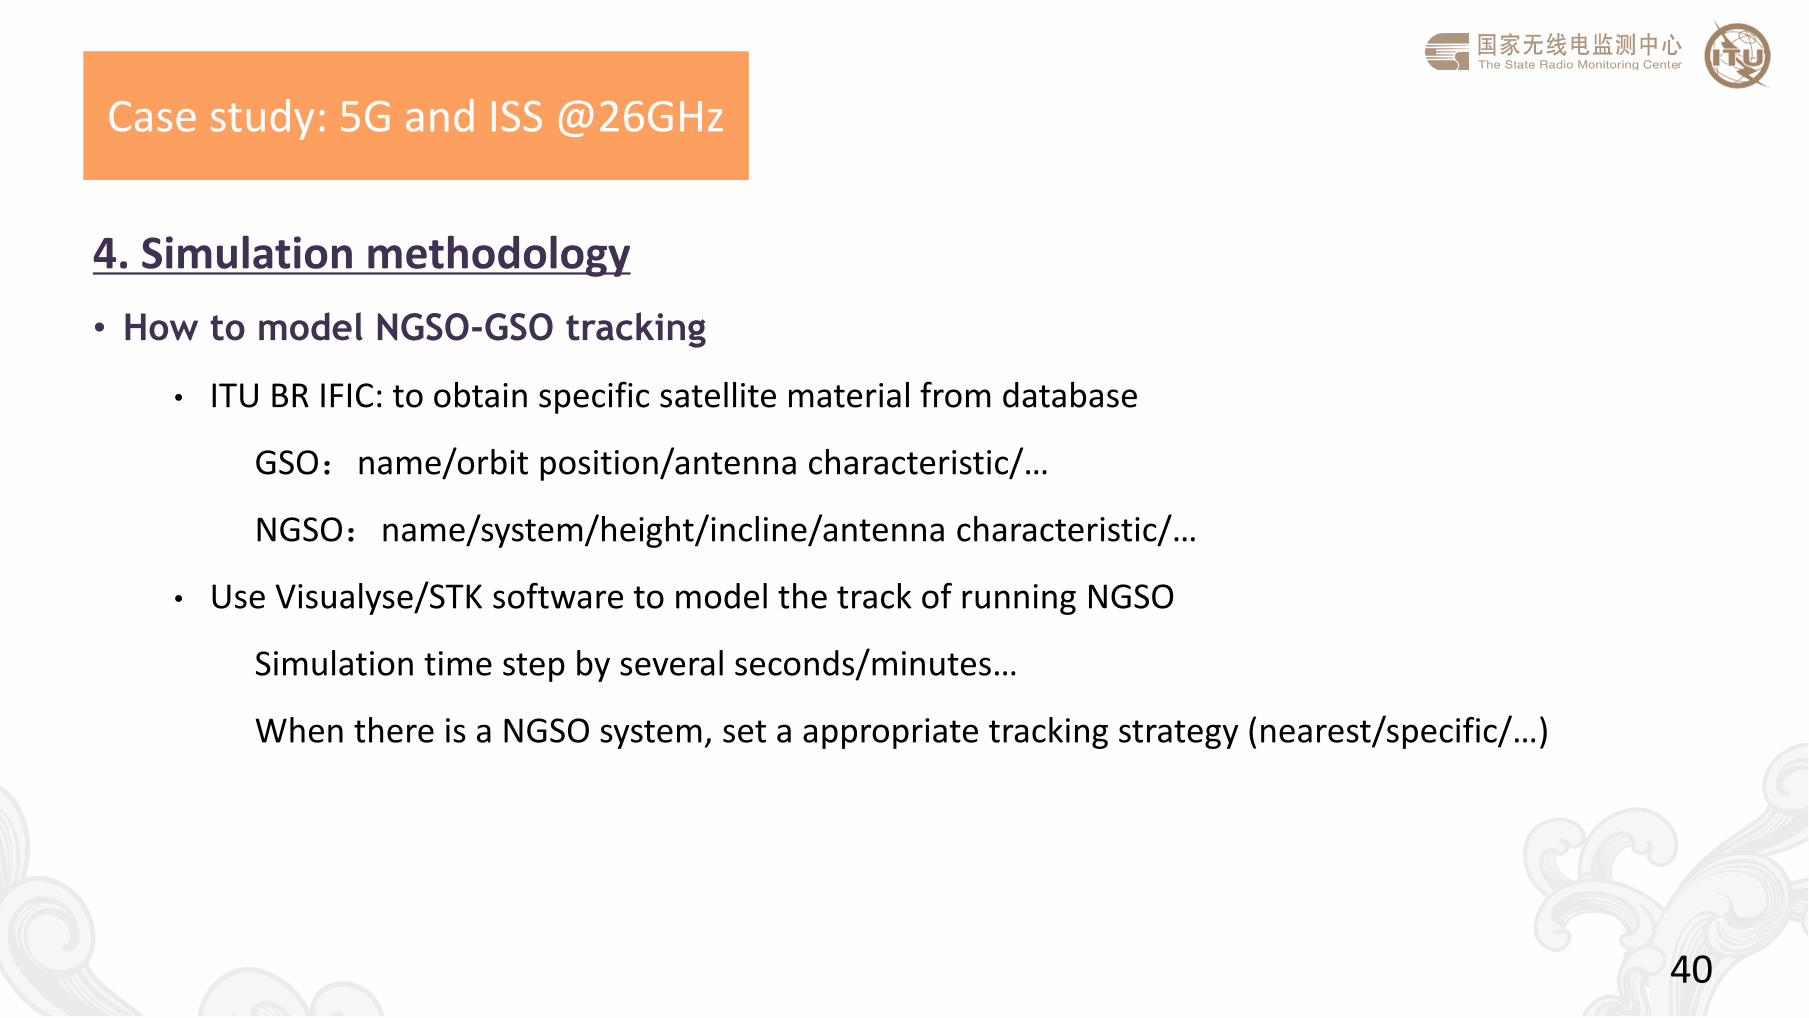
4. Simulation methodology
• How to model NGSO-GSO tracking
• ITU BR IFIC: to obtain specific satellite material from database
GSO:name/orbit position/antenna characteristic/…
NGSO:name/system/height/incline/antenna characteristic/…
• Use Visualyse/STK software to model the track of running NGSO
Simulation time step by several seconds/minutes…
When there is a NGSO system, set a appropriate tracking strategy (nearest/specific/…)
40

Spectrum inventory
and utilization
evaluation
Spectrum inventory and utilization evaluation
42
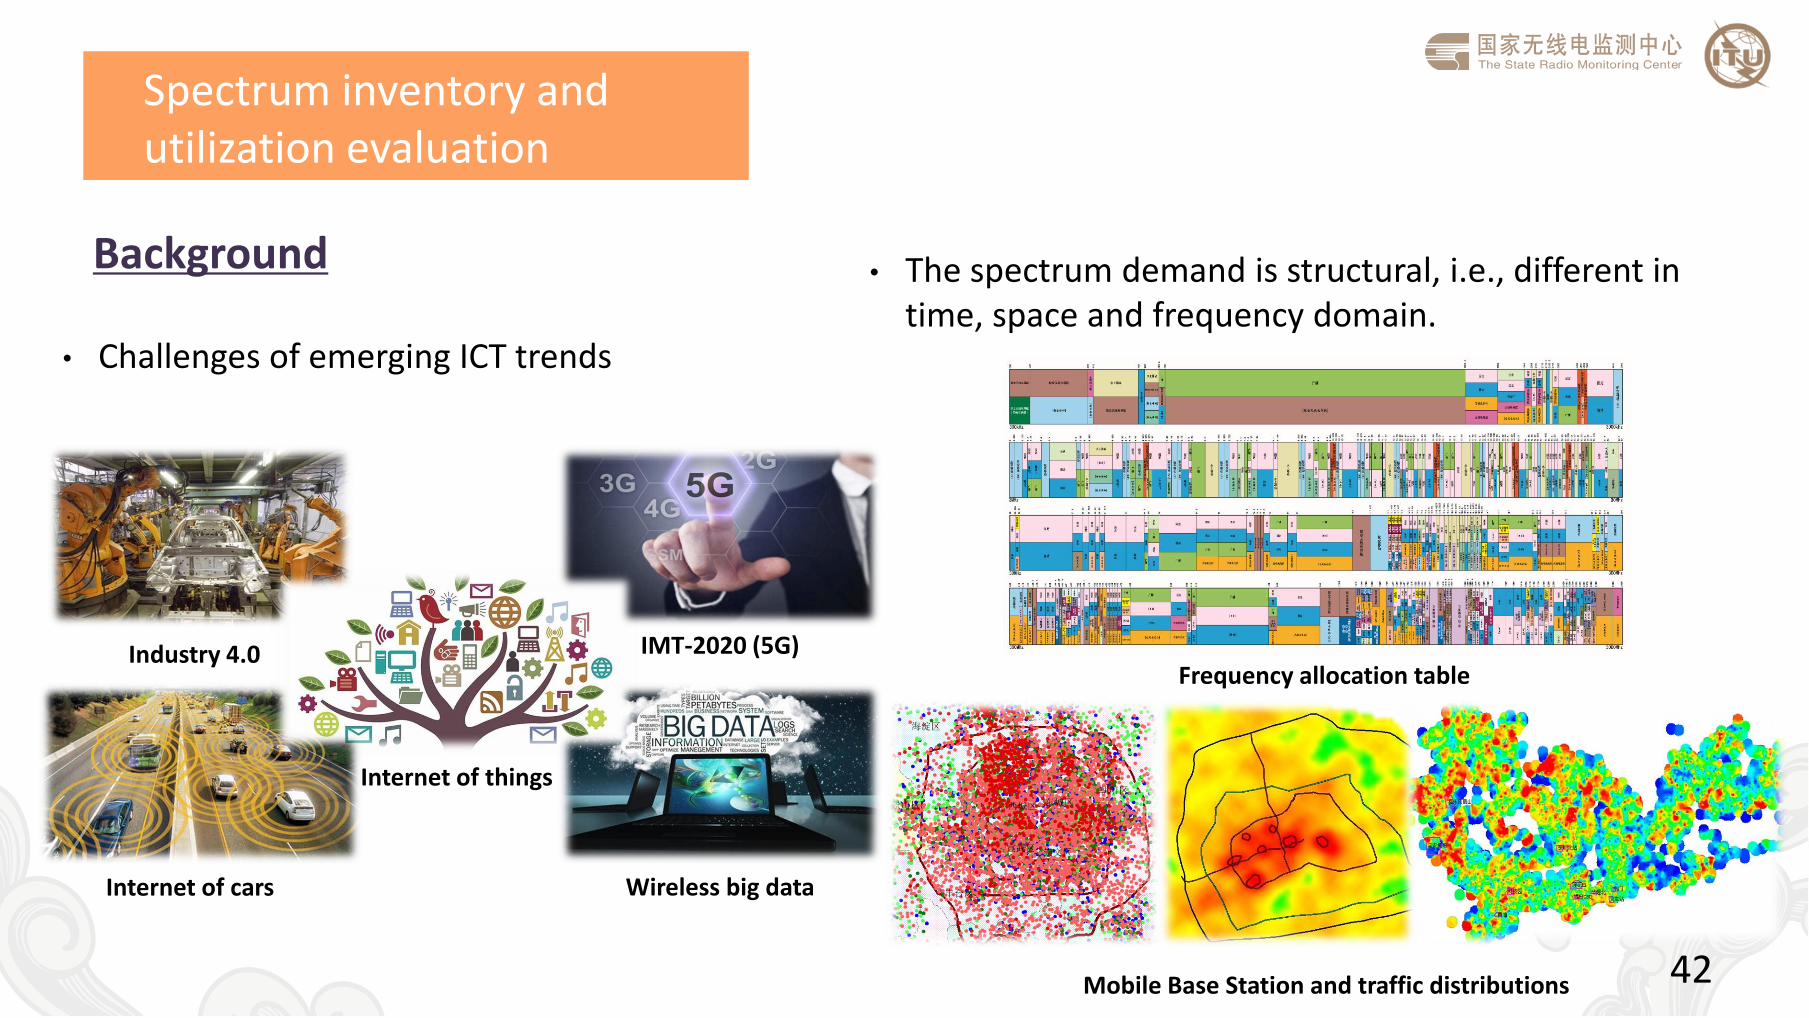
Background
Mobile Base Station and traffic distributions
• The spectrum demand is structural, i.e., different in time, space and frequency domain.
Frequency allocation table Industry 4.0
Internet of cars
Internet of things
IMT-2020 (5G)
Wireless big data
• Challenges of emerging ICT trends
Spectrum inventory and utilization evaluation
43
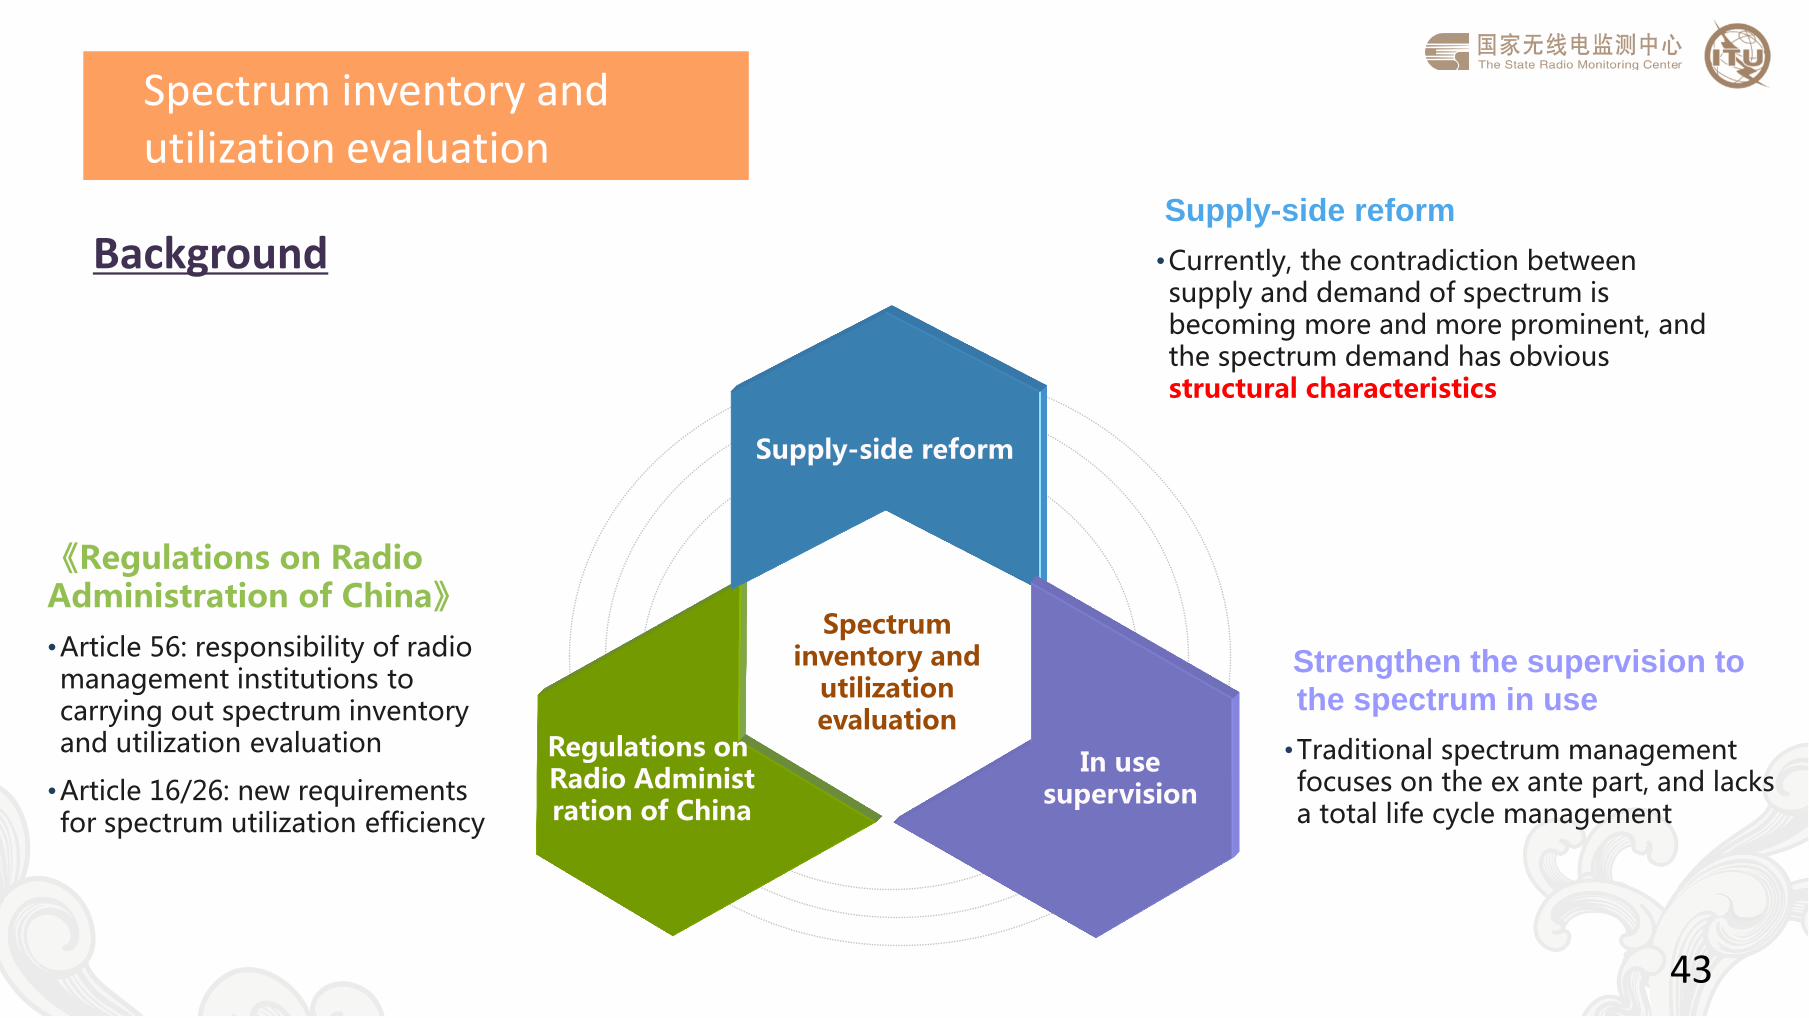
Background
Spectrum inventory and
utilization evaluation
Supply-side reform
Regulations on Radio Administration of China
In use supervision
《Regulations on Radio Administration of China》
•Article 56: responsibility of radio management institutions to carrying out spectrum inventory and utilization evaluation
•Article 16/26: new requirements for spectrum utilization efficiency
Strengthen the supervision to
the spectrum in use
•Traditional spectrum management focuses on the ex ante part, and lacks a total life cycle management
Supply-side reform
•Currently, the contradiction between supply and demand of spectrum is becoming more and more prominent, and the spectrum demand has obvious structural characteristics
Spectrum inventory in 2015
44
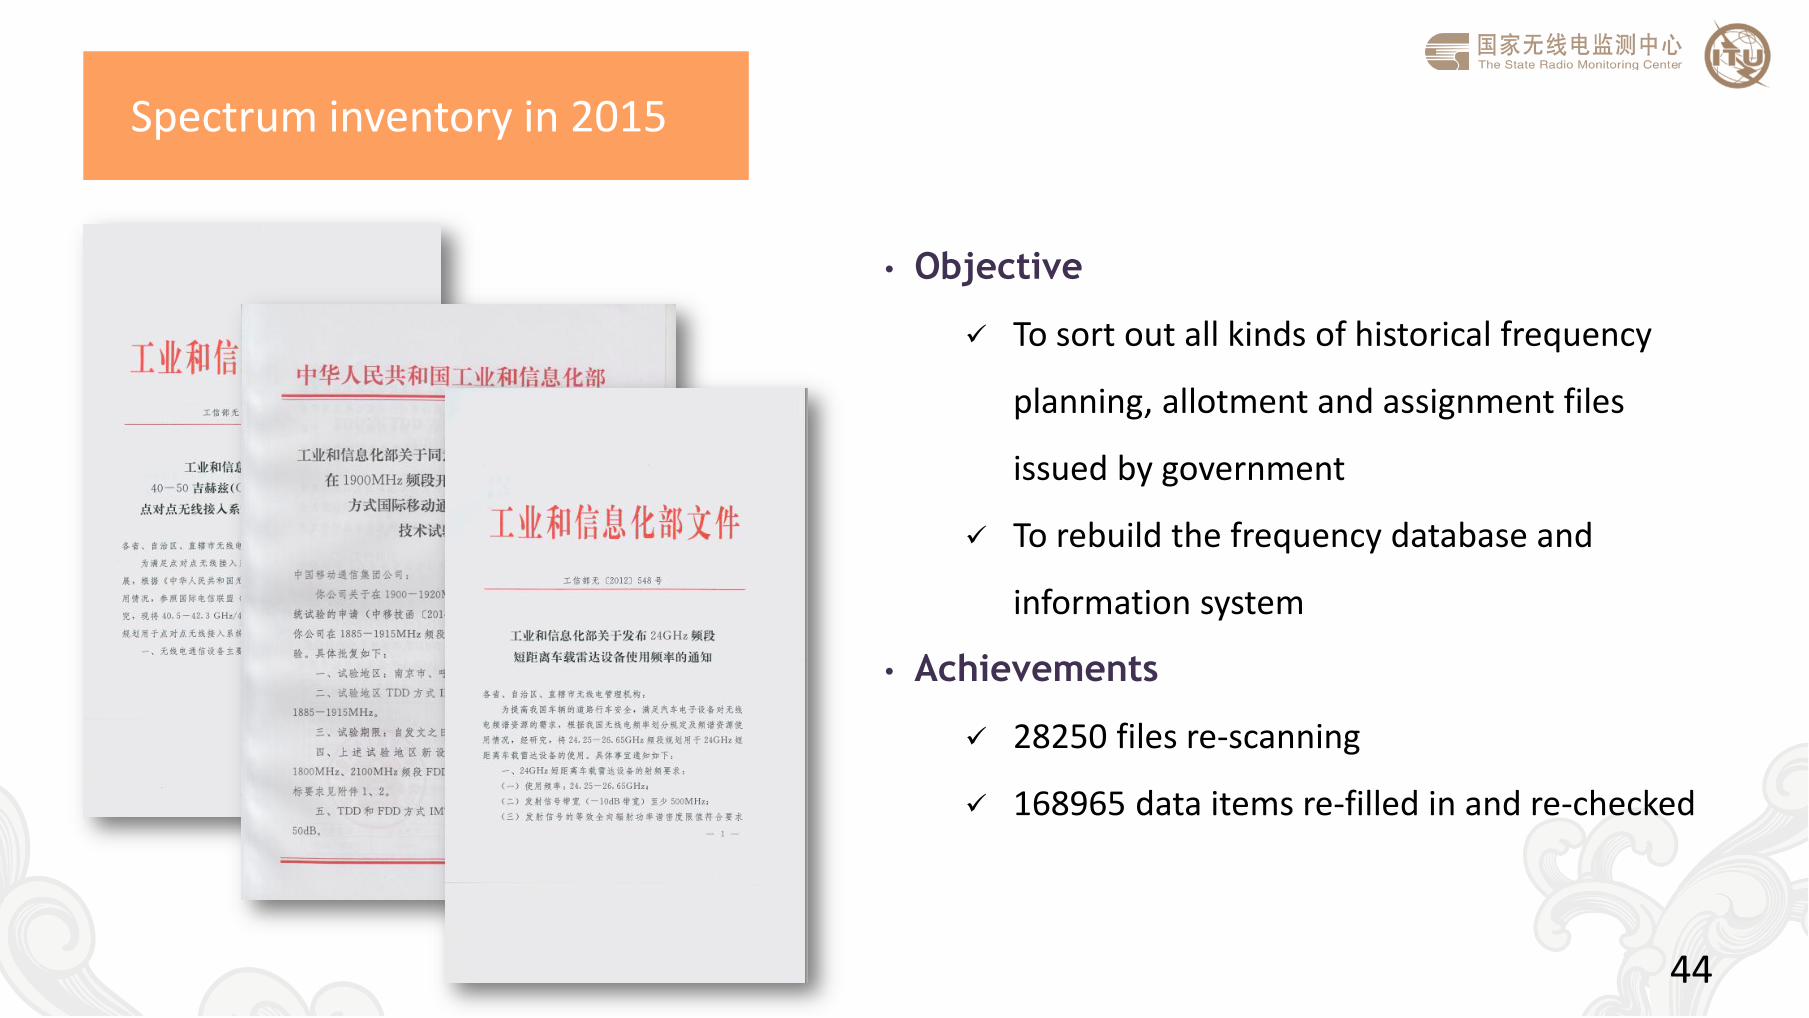
• Objective
To sort out all kinds of historical frequency
planning, allotment and assignment files
issued by government
To rebuild the frequency database and
information system
• Achievements
28250 files re-scanning
168965 data items re-filled in and re-checked
Spectrum inventory in 2015
45
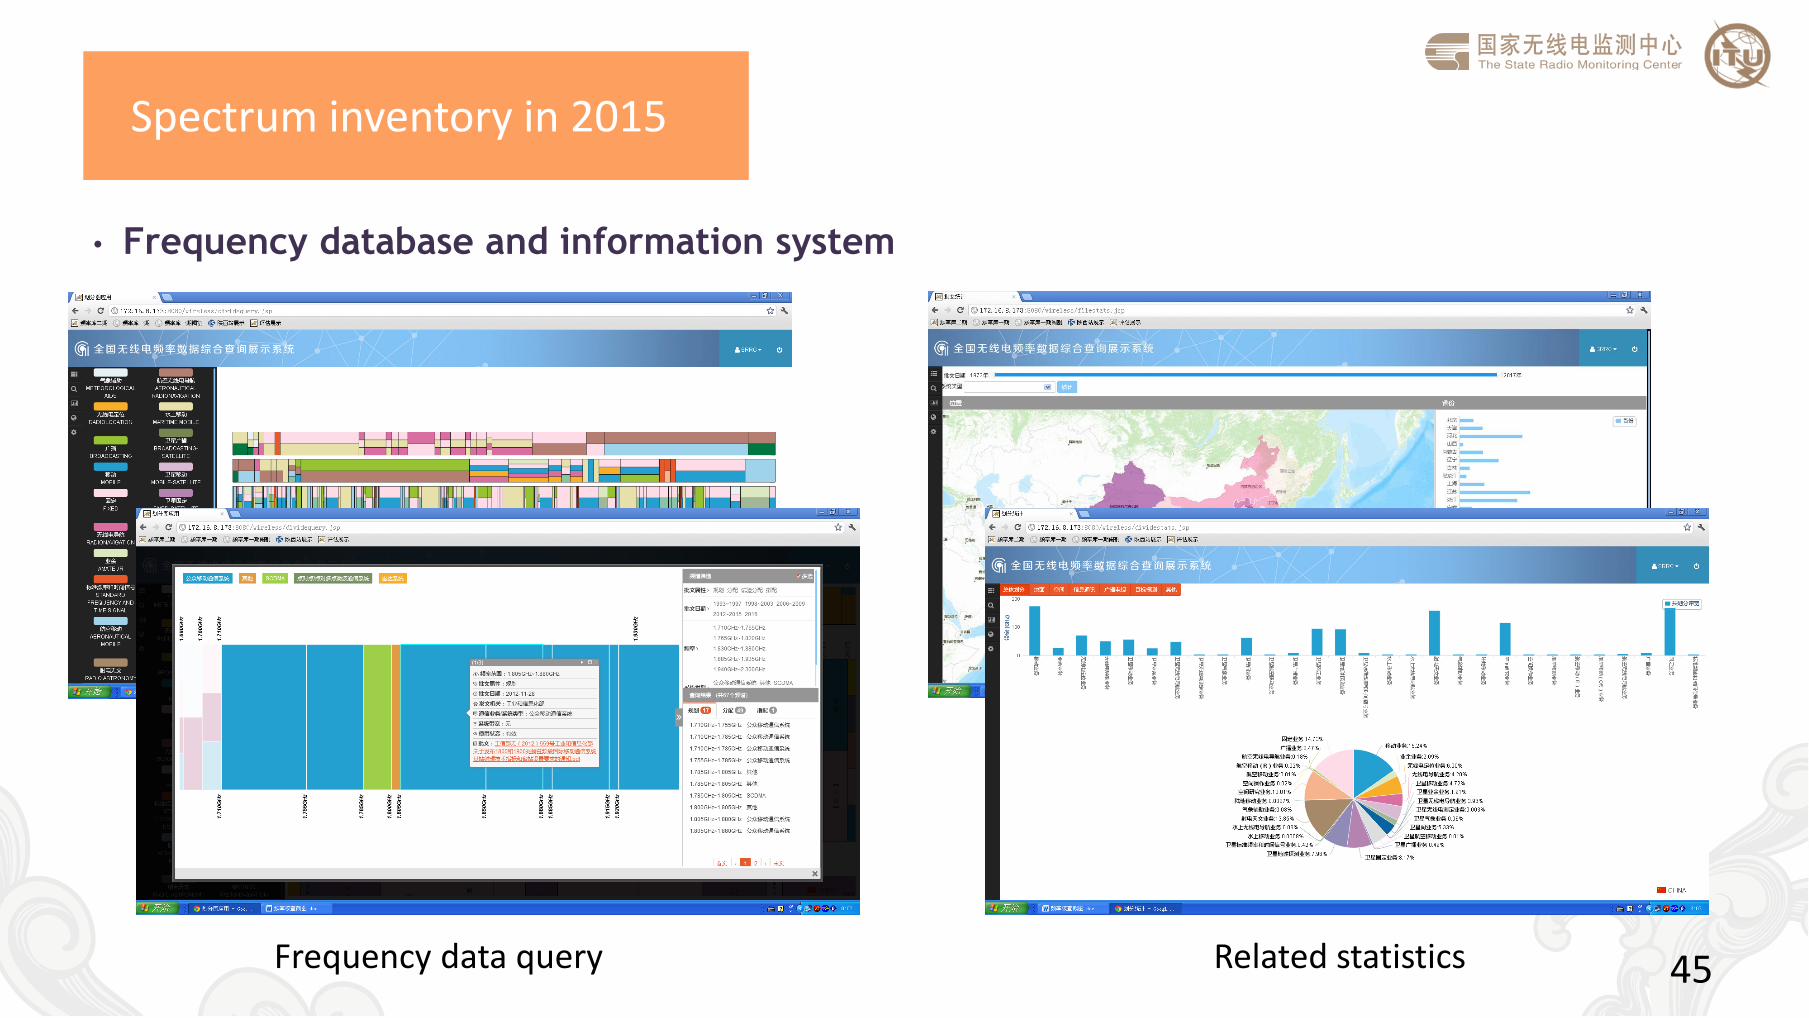
• Frequency database and information system
Frequency data query Related statistics
Spectrum utilization evaluation in 2016
46
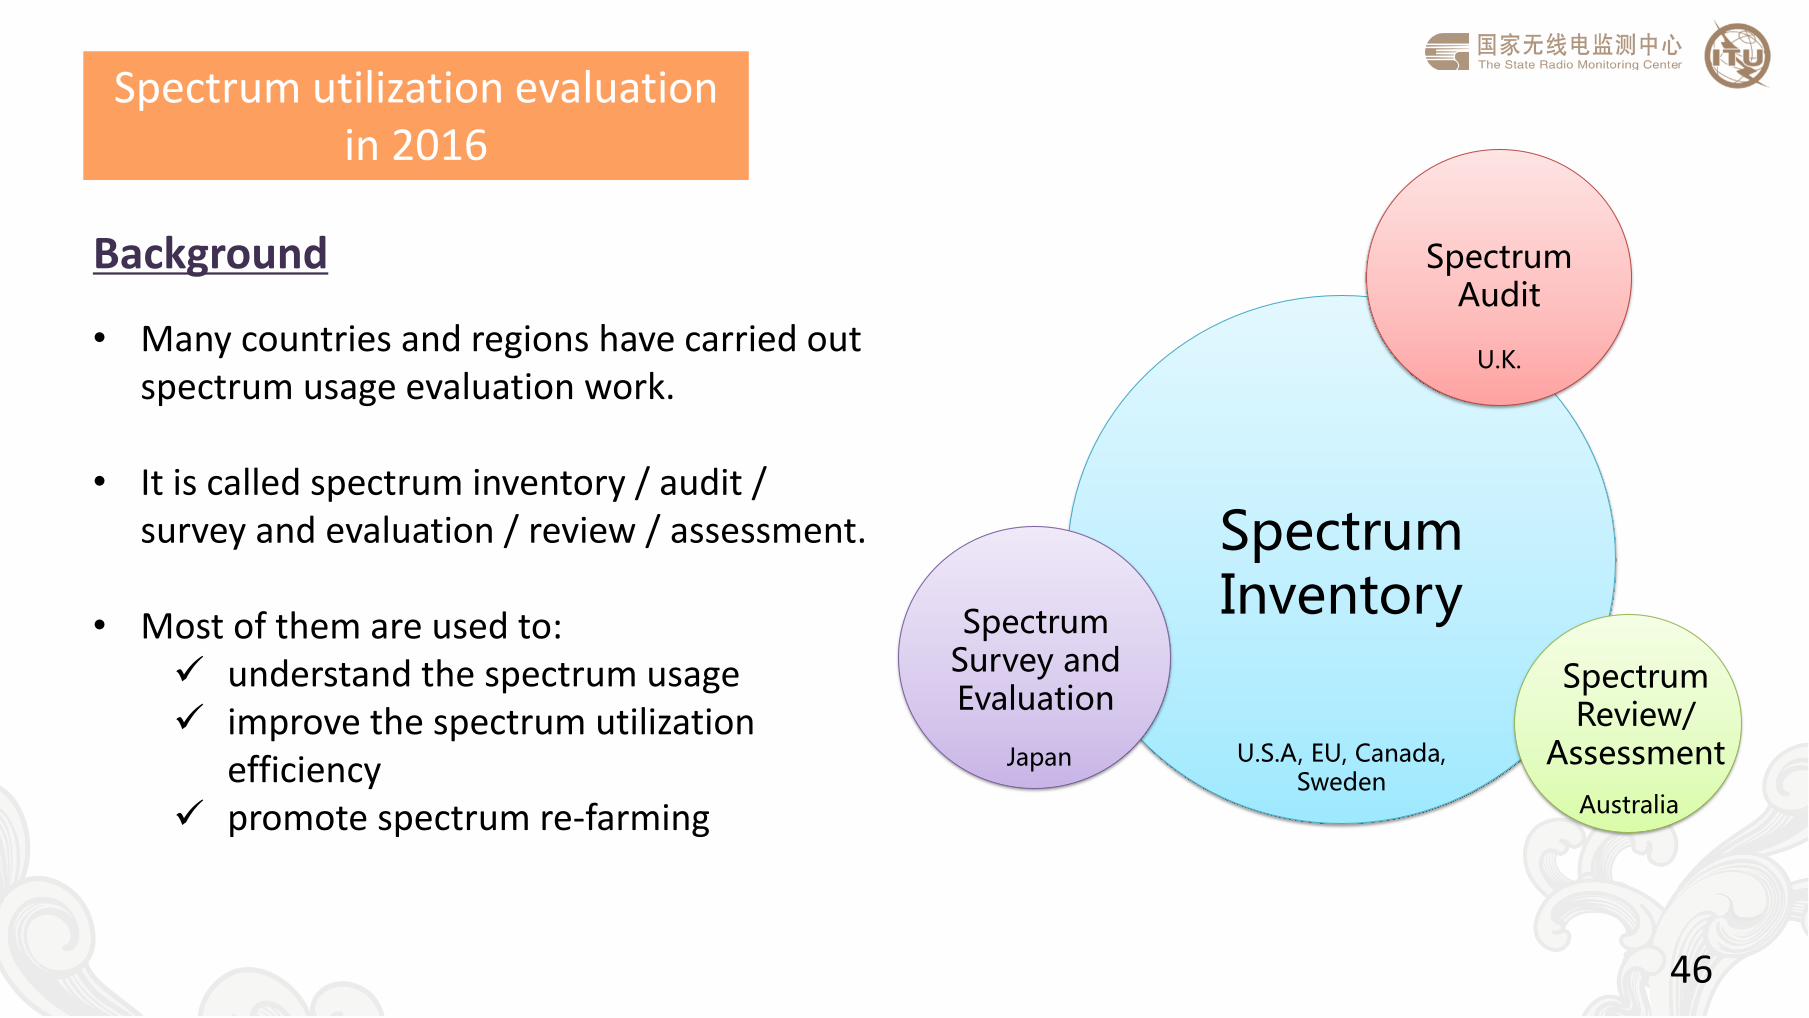
Spectrum Inventory
U.S.A, EU, Canada, Sweden
Spectrum Survey and Evaluation
Japan
Spectrum Review/
Assessment
Australia
Spectrum Audit
U.K. • Many countries and regions have carried out
spectrum usage evaluation work.
• It is called spectrum inventory / audit / survey and evaluation / review / assessment.
• Most of them are used to: understand the spectrum usage improve the spectrum utilization
efficiency promote spectrum re-farming
Background
Spectrum utilization evaluation in 2016
47
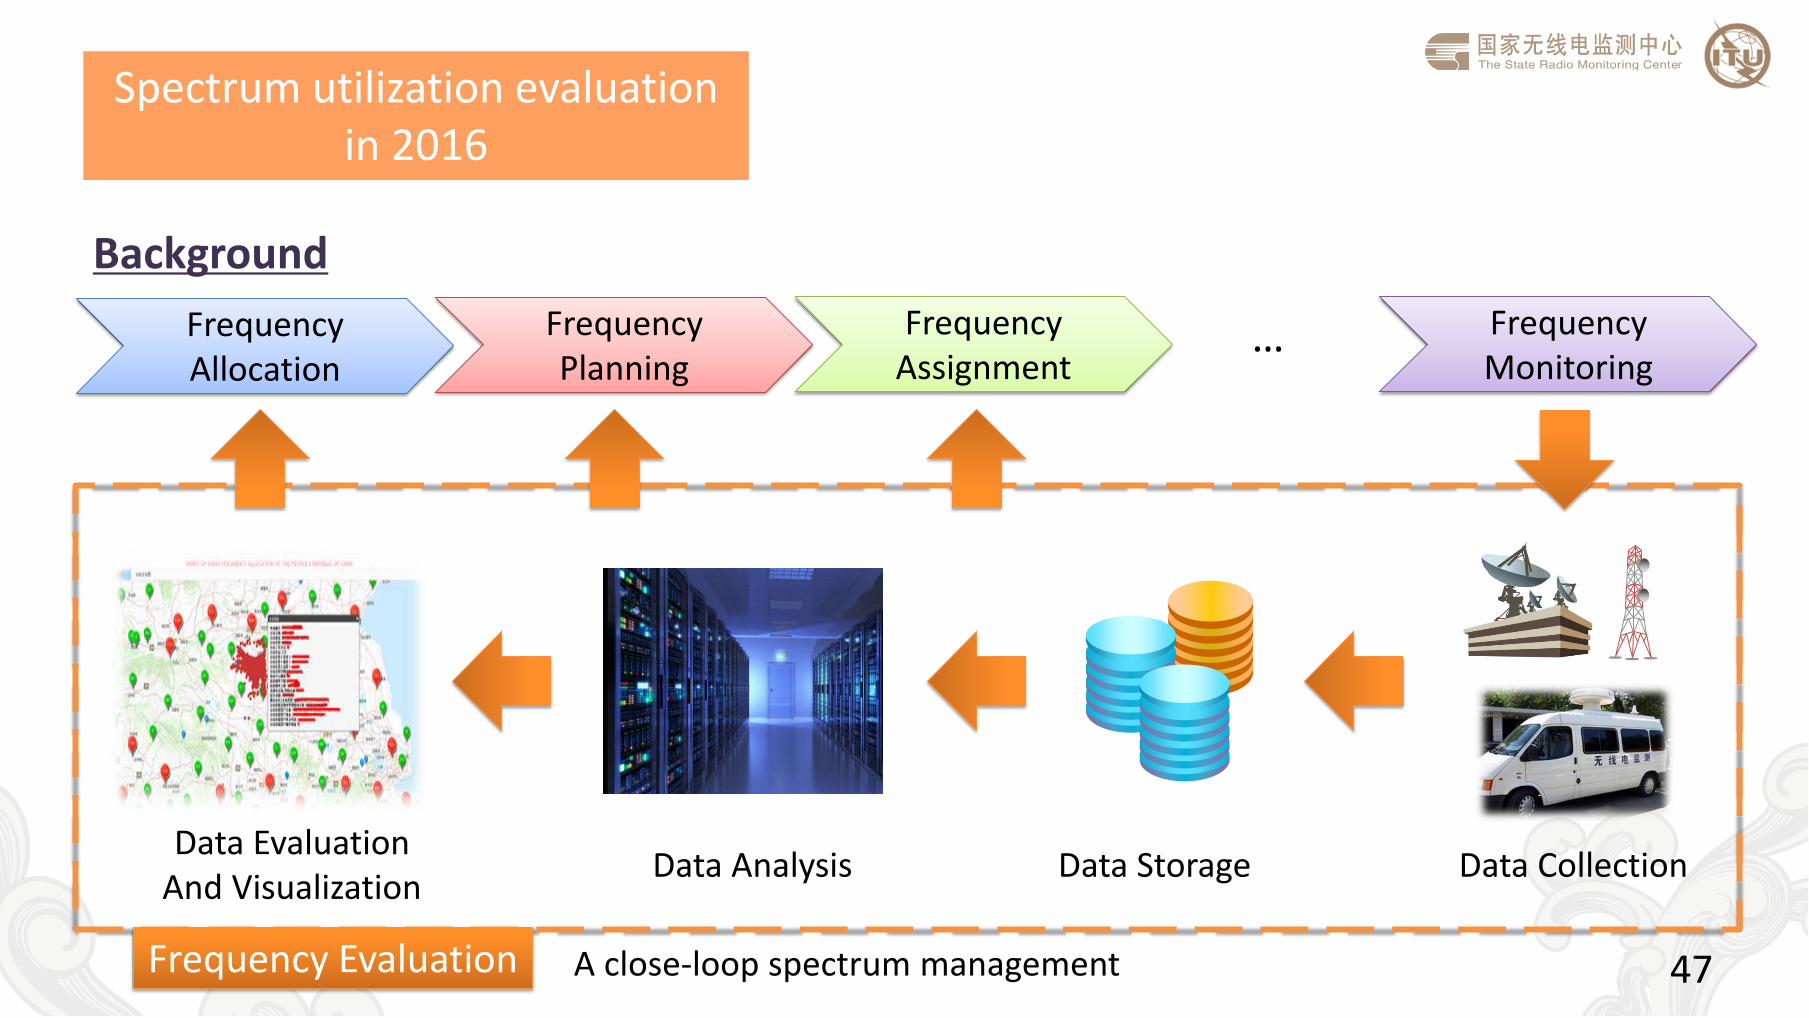
Frequency Allocation
Frequency Planning
Frequency Assignment
Frequency Monitoring
…
Frequency Evaluation
Data Collection Data Storage Data Analysis Data Evaluation
And Visualization
A close-loop spectrum management
Background
Spectrum utilization evaluation in 2016
48
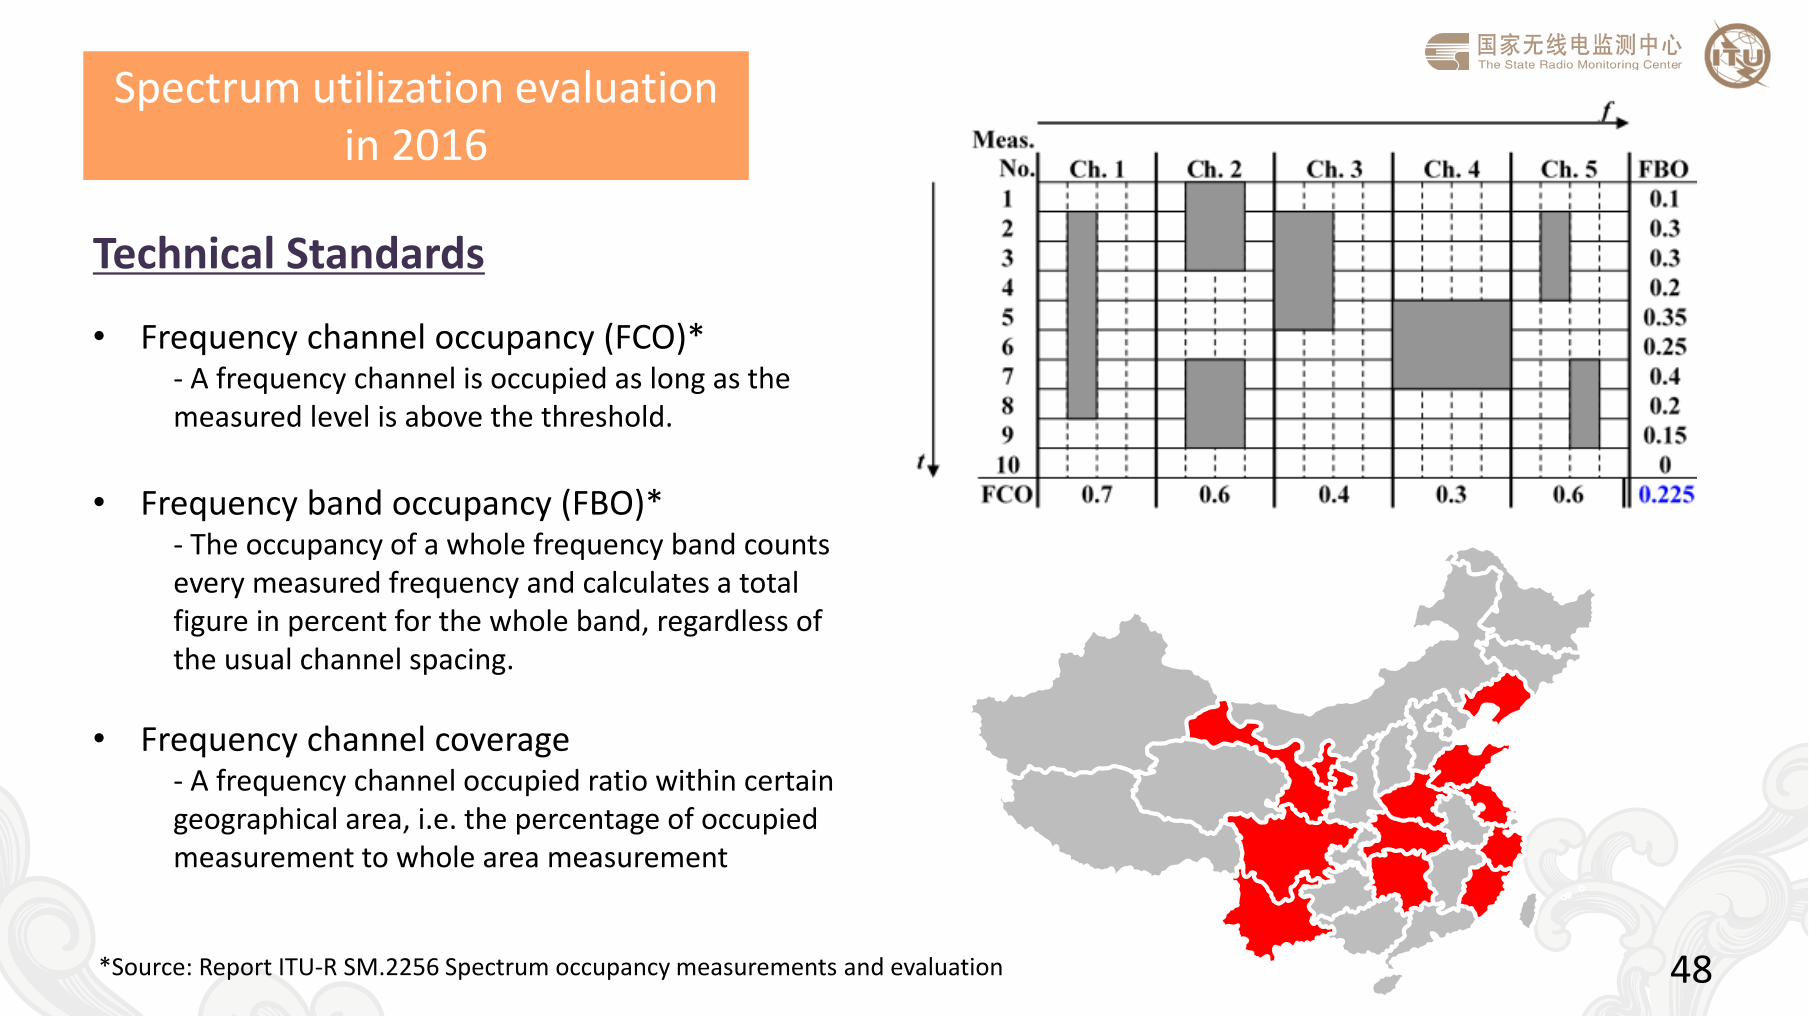
Technical Standards
• Frequency channel occupancy (FCO)* - A frequency channel is occupied as long as the measured level is above the threshold.
• Frequency band occupancy (FBO)*
- The occupancy of a whole frequency band counts every measured frequency and calculates a total figure in percent for the whole band, regardless of the usual channel spacing.
• Frequency channel coverage - A frequency channel occupied ratio within certain geographical area, i.e. the percentage of occupied measurement to whole area measurement
*Source: Report ITU-R SM.2256 Spectrum occupancy measurements and evaluation
Spectrum utilization evaluation in 2016
49
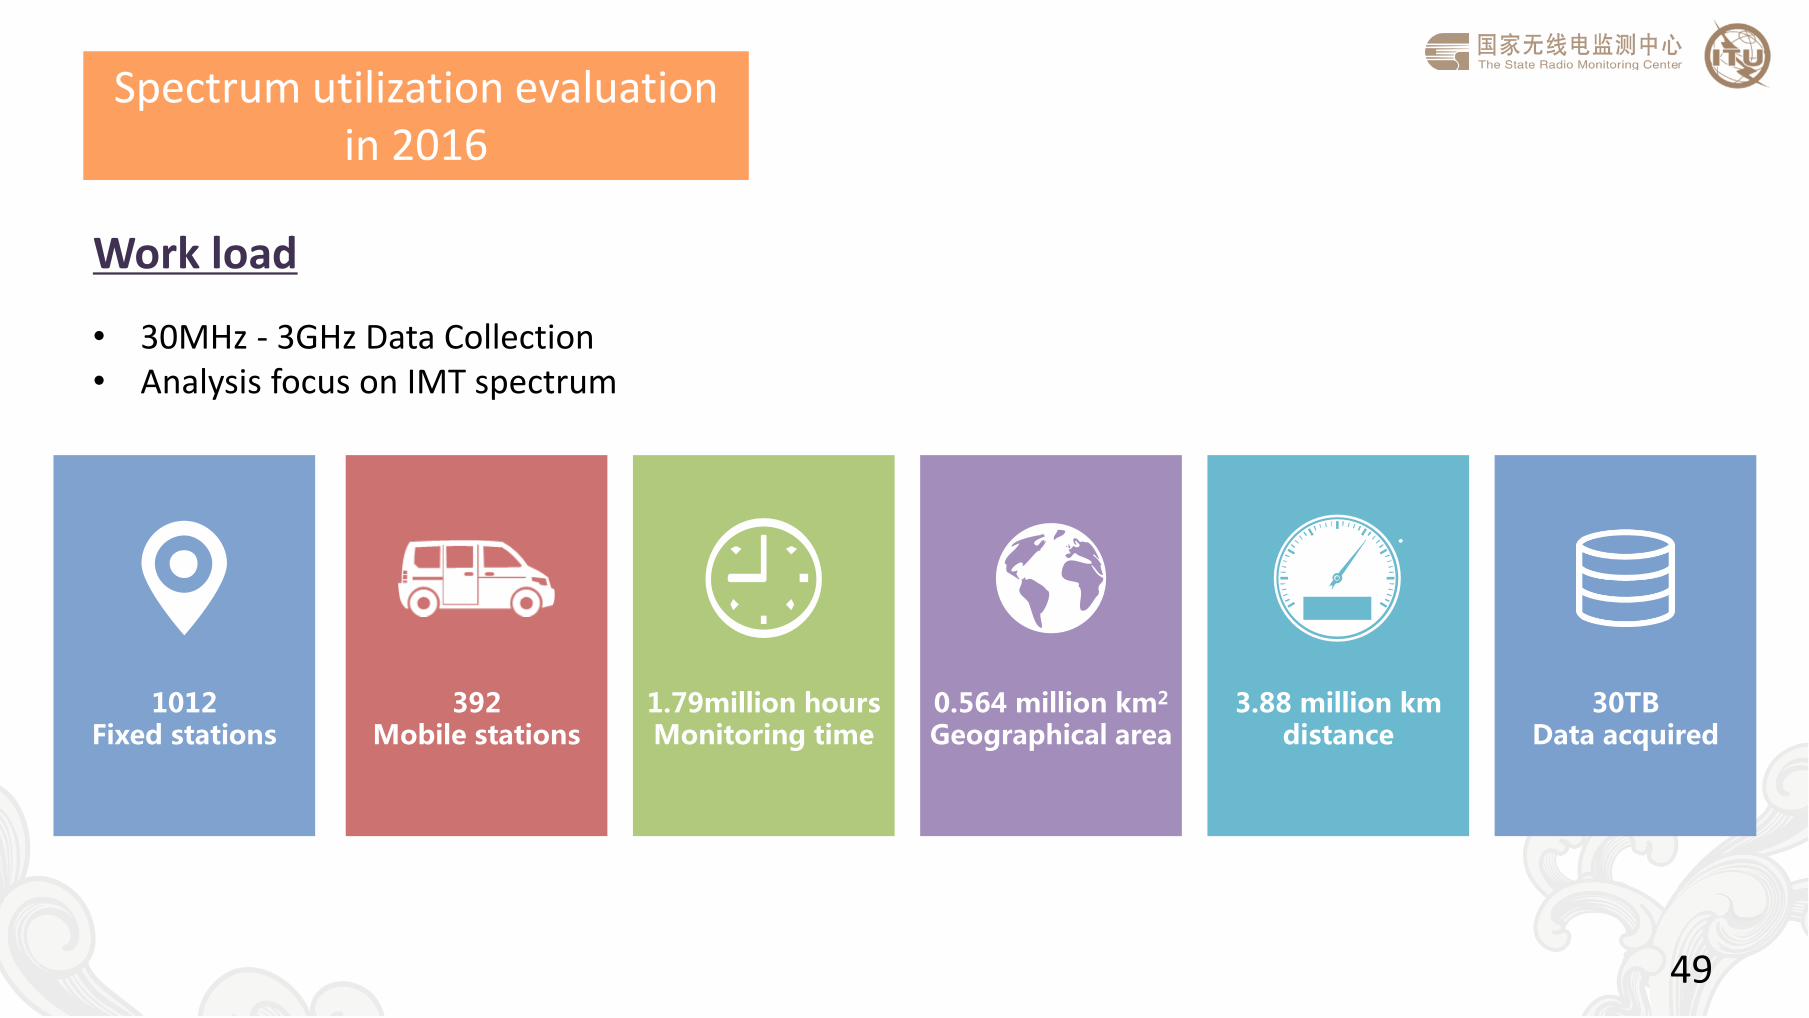
Work load
1.79million hours Monitoring time
1012 Fixed stations
30TB Data acquired
392 Mobile stations
3.88 million km distance
0.564 million km2 Geographical area
• 30MHz - 3GHz Data Collection • Analysis focus on IMT spectrum
Spectrum utilization evaluation in 2016
50
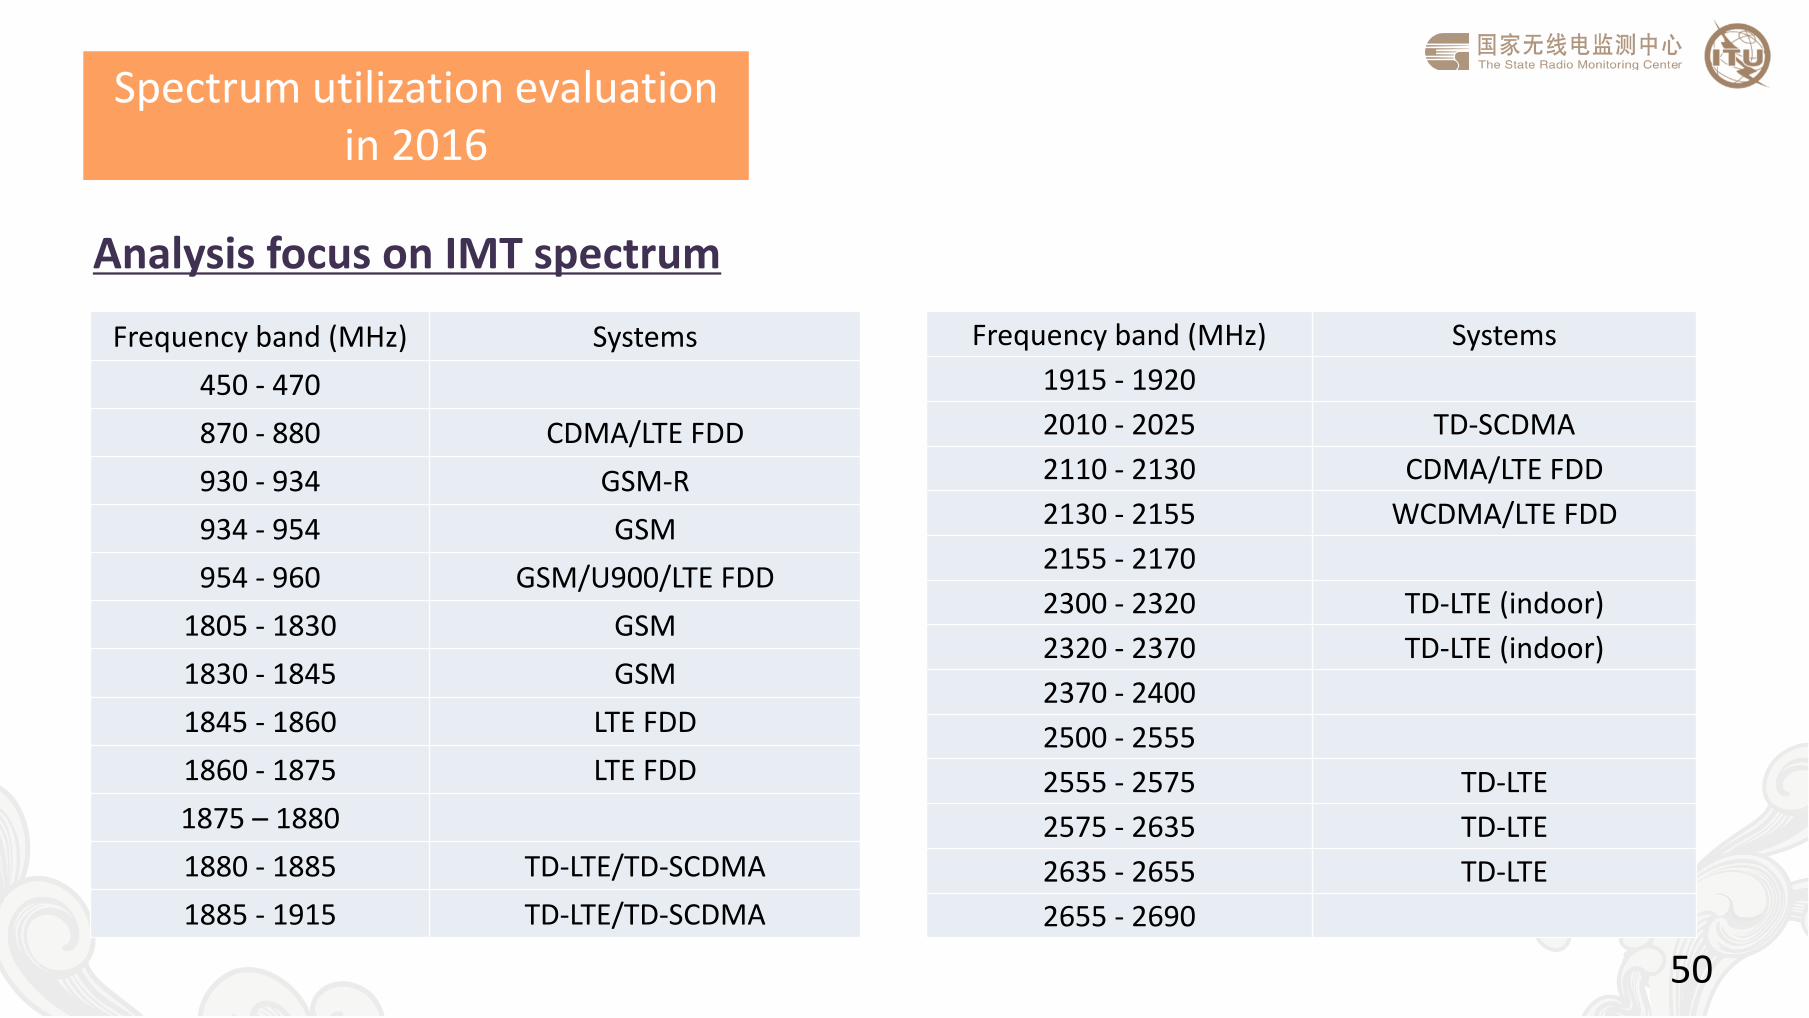
Analysis focus on IMT spectrum
Frequency band (MHz) Systems
450 - 470
870 - 880 CDMA/LTE FDD
930 - 934 GSM-R
934 - 954 GSM
954 - 960 GSM/U900/LTE FDD
1805 - 1830 GSM
1830 - 1845 GSM
1845 - 1860 LTE FDD
1860 - 1875 LTE FDD
1875 – 1880
1880 - 1885 TD-LTE/TD-SCDMA
1885 - 1915 TD-LTE/TD-SCDMA
Frequency band (MHz) Systems
1915 - 1920
2010 - 2025 TD-SCDMA
2110 - 2130 CDMA/LTE FDD
2130 - 2155 WCDMA/LTE FDD
2155 - 2170
2300 - 2320 TD-LTE (indoor)
2320 - 2370 TD-LTE (indoor)
2370 - 2400
2500 - 2555
2555 - 2575 TD-LTE
2575 - 2635 TD-LTE
2635 - 2655 TD-LTE
2655 - 2690
Spectrum utilization evaluation in 2016
51
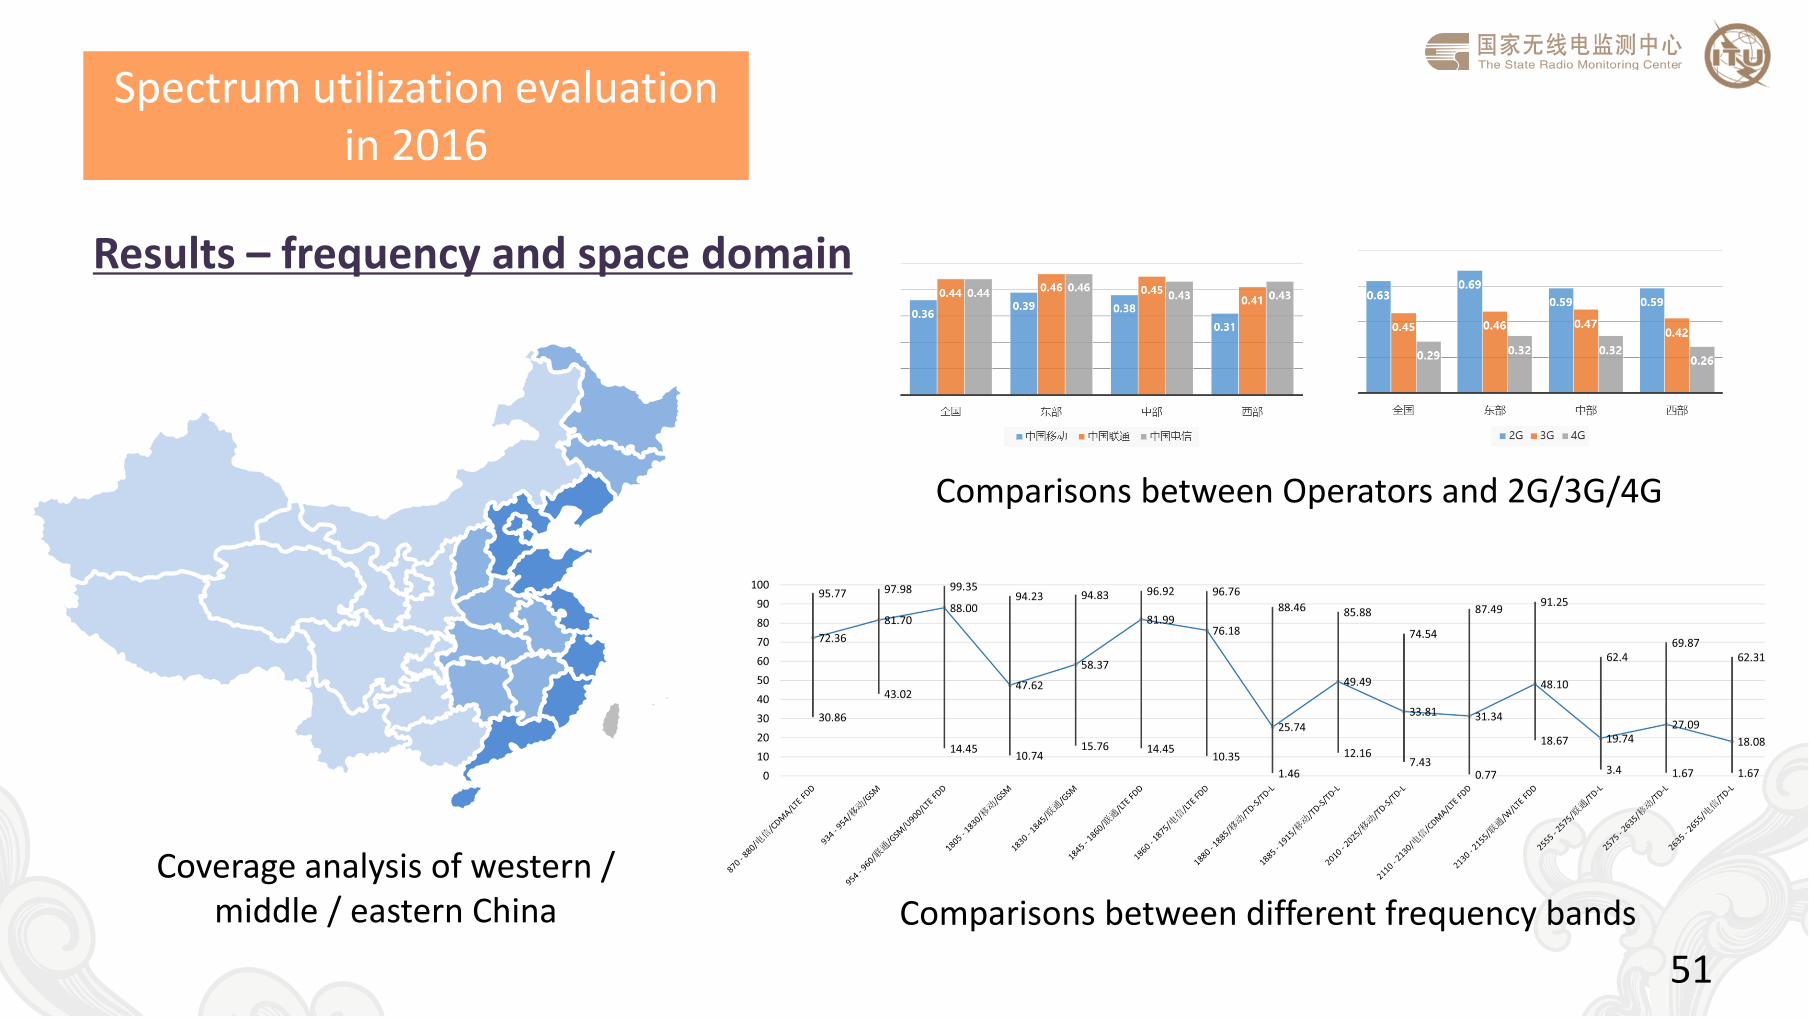
Results – frequency and space domain
Coverage analysis of western / middle / eastern China
Comparisons between Operators and 2G/3G/4G
Comparisons between different frequency bands
Spectrum utilization evaluation in 2016
52
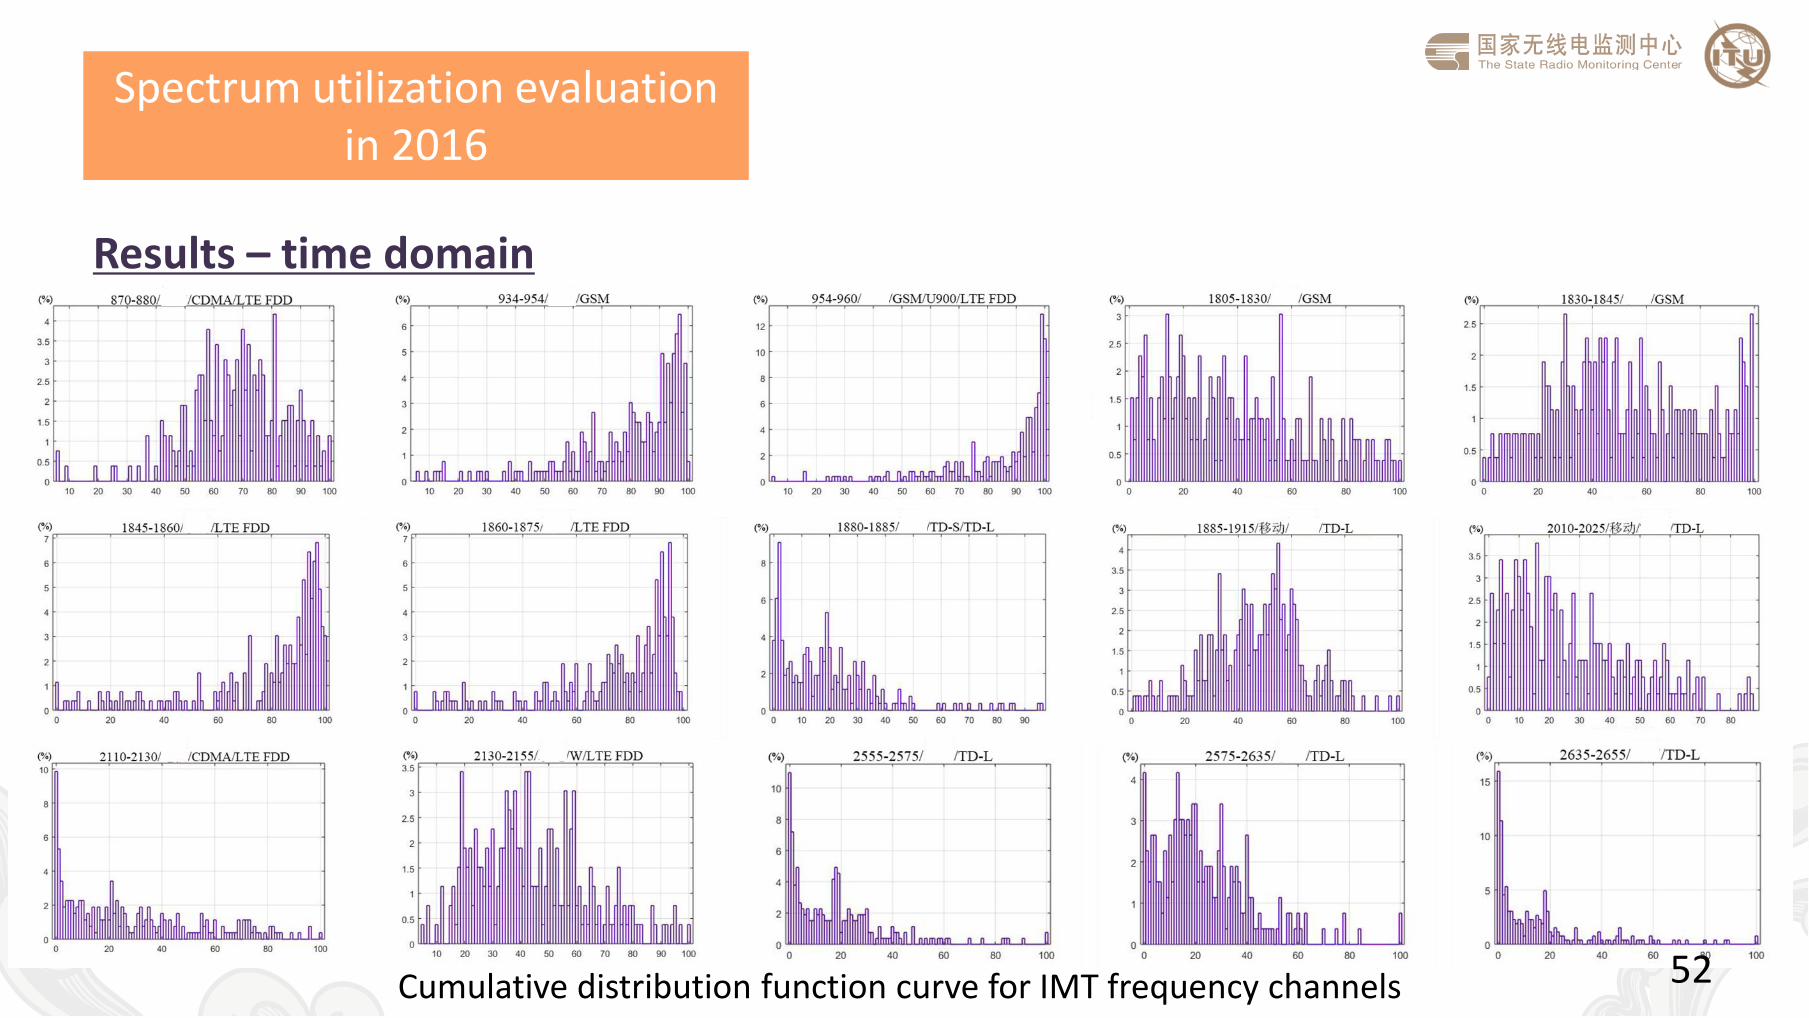
Results – time domain
Cumulative distribution function curve for IMT frequency channels
Spectrum utilization evaluation in 2016
53
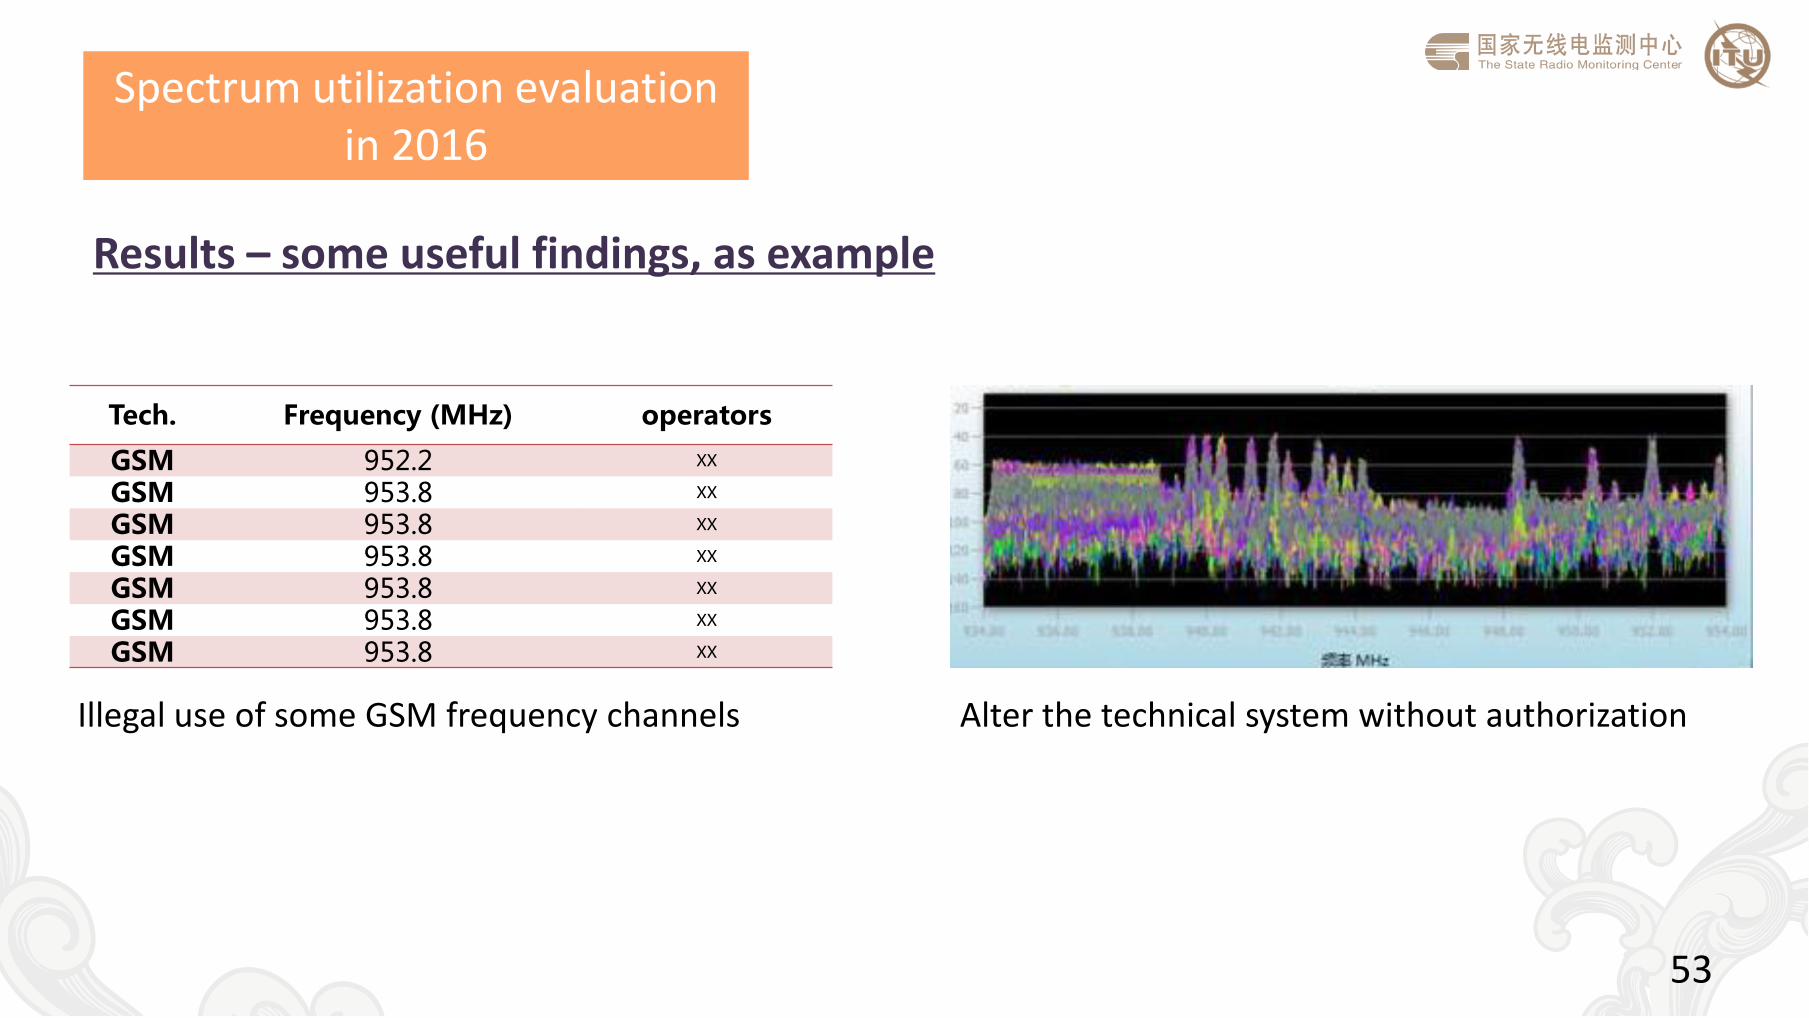
Results – some useful findings, as example
Tech. Frequency (MHz) operators
GSM 952.2 XX
GSM 953.8 XX
GSM 953.8 XX
GSM 953.8 XX
GSM 953.8 XX
GSM 953.8 XX
GSM 953.8 XX
Illegal use of some GSM frequency channels Alter the technical system without authorization

Summary
Summary
55
• The radio frequencies and any associated orbits, including the geostationary-satellite orbit are limited natural resources and that they must be used rationally, efficiently and economically. This is the Preamble of ITU-R Radio Regulations and also the objective of spectrum engineering.
• Before frequencies are allocated for a new radio application, compatibility with existing radio systems and with non-radio devices must be ensured. The spectrum engineers are responsible for define appropriate technical parameters, finding clearly sharing conditions, and developing interference mitigation mechanisms to ensure the compatibility between different radio services in time, frequency and space domain.
• To consider the spectrum inventory and utilization evaluation is necessary to make a close-loop management. To strengthen the supervision to the spectrum in use is a key mean to improve the utilization efficiency of the spectrum.

Top Related