


γλώσσες
Σελίδες
Νομικός

1
PREPARATION AND CHARACTERIZATION OF COPPER OXIDE
NANOPARTICLES AND DETERMINATION OF ENHANCEMENT IN CRITICAL
HEAT FLUX
Jagdeep M.KSHIRSAGAR1 Ramakant SHRIVASTAVA
1 Prakash S ADWANI
1
1Department of Mechanical Engineering, Government Engineering College, Aurangabad (India)
Email: [email protected], [email protected]
ABSTRACT: ------------------------------------------------------------------------------------------------------------ ---- The main focus of the present work is to prepare the CuO nanoparticles by economical Sol-Gel method and further to prepare the CuO nanofluid with base fluid as deionised water. The size of
nanoparticles is determined by Debye- Scherer formula and size of the particles is conformed
20.4054nm. Critical heat flux characteristics of nanofluid were investigated with different weight concentrations of CuO nanoparticles. The experimental work revealed an increase in critical heat flux value just
about 57.26 percent. Surface roughness of heater surface is measured for all weight concentrations of
nanofluid which shows increase in Ra value up to some extent is a cause to enhance CHF.
Keywords: Nanoparticles, Nanofluid, Critical Heat Flux (CHF), Enhancement, Deionised Water.
1.0 INTRODUCTION:
Copper oxide (CuO) nanoparticles are synthesized by aqueous precipitation method using copper
chloride as a precursor and NaOH as stabilizing agent. This gives large scale production of
nanoparticles. In the last decade, the developments of nano size materials of metal and metal oxide
particles are intensively pursued because of their prominence in different fields of applications. In all
the transition metal oxides, CuO nanoparticles are used for the applications of magnetic storage
devices, solar energy transfer, sensors and super capacitors, Chemical plants etc.
In general there are number of metal oxides are available in nature but some of the metal oxides are
most useful in accordance with their applications in day to day life in science and technology. In the
periodic table transition metals are large in number and have number of applications in different
fields. Among the oxides of transition metals, copper oxide nanoparticles are of special interest
because of their efficiency as nanofluid in heat transfer application. For example it has been reported
that addition of CuO improves the thermal conductivity of water [1,2]. CuO is a semiconducting
compound with a narrow band gap and used for photoconductive and Photo thermal applications.
Some transition metal oxides like ZnO, TiO2 and Fe3O4 etc. proved as potential candidates for so
many applications. In the same way CuO is also one of the useful metal oxides and which has so
many applications in various fields. The uniqueness of CuO nanoparticles is even though, they are
metallic in bulk but they behave like semiconductors when they are in nano size. Semiconducting
materials have been particularly interesting because of their great practical importance in electronic
and optoelectronic devices, such as electrochemical cell, gas sensors, magnetic storage devices, field
emitters, high-tc super conductors, nanofluid and catalysts etc. Due to the potentiality of CuO, it acts
as a catalyst; whereas all metal oxides are not useful for the catalytic activity. In the fabrication of
super capacitors also CuO is very useful and in nano range it has the wide band gap nearly equal to
ZnO. The favourable band gap of CuO around 2.6 eV makes it useful for solar energy conversion and
it can be used as solar cell window material. CuO nanoparticles act as a good catalyst in some of the
chemical reactions. CuO nanoparticles were prepared by sol-gel method. In this method CuCl2.2H2O
2
(0.2 M) is added with acetic acid and heated to 100 0C with continuous stirring. To control the pH of
the above solution, NaOH is added to the solution till pH reached desired value. The color of the
solution changed from sky blue to black with precipitation. The black precipitation was washed 3-4
times with distilled water. Finally the solution was centrifuged and dried in air for one day. The CuO
nanoparticles were characterized by studying their structure with X-ray diffraction and composition
by energy dispersive X-ray analysis. The size of the nanoparticles is estimated by XRD and
transmission electron microscopy.
These nanoparticles are used to prepare nanofluid with base fluid as deionised water and experiment
is conducted to determine critical heat flux at different weight percent concentration in which
maximum enhancement in CHF at 1.5 weight percent of CuO nanofluid observed 57.26 percent.
2.0 Preparation of CuO Nanoparticles:
Nanoparticles are prepared by using economical Sol-Gel method and characterization is done to
finalize the size and purity of prepared nanoparticles.
2.1 Sol- gel method of synthesis:
There are various techniques to prepare nanocrystals e.g. sputtering, laser ablation, cluster deposition,
sol-gel method etc. In the present work the synthesis of CuO is preferred by sol-gel route because this
method is easy and economical [3, 4].The sol-gel process involves the formation of colloidal
suspension (sol) and gelatine of the sol to form a network in continuous liquid phase (gel). The
precursors for synthesizing these colloids consist usually of a metal or metalloid element surrounded
by various reactive legends.
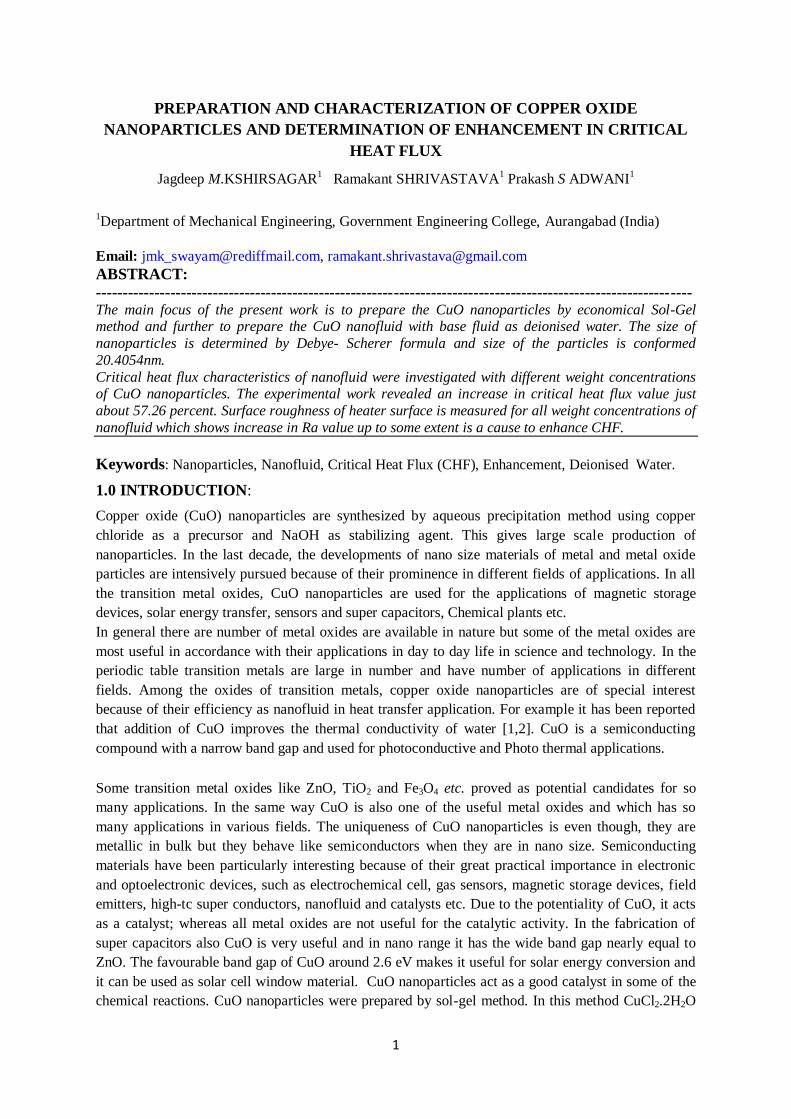
The aqueous solution of CuCl2.2H2O (0.2 M) is prepared in cleaned round bottom flask. 1 ml of
glacial acetic acid is added to above aqueous solution and heated to 100 °C with constant stirring. 8 M
NaOH is added to above heated solution till pH reaches to 7. The colour of the solution turned from
green to black immediately and the large amount of black precipitate is formed immediately. the
entire process is depicted in figure 1 (a) and figure 1 (b).The precipitate is centrifuged and washed 3-
4 times with deionised water. The obtained precipitate was dried in air for 24 hours. This powder is
further used for the characterization of CuO nanoparticles. The chemical reaction is as follows,
CuCl2 + 2 NaOH Cu(OH)2 + 2 NaCl
And copper hydroxide decomposes into copper oxide on heating as follows,
Cu(OH)2 CuO + H2O
3
Figure 1 Aqueous solution of CuCl2 turned from green figure 1 (a) to black figure 1 (b) after addition of
NaOH solution drop wise
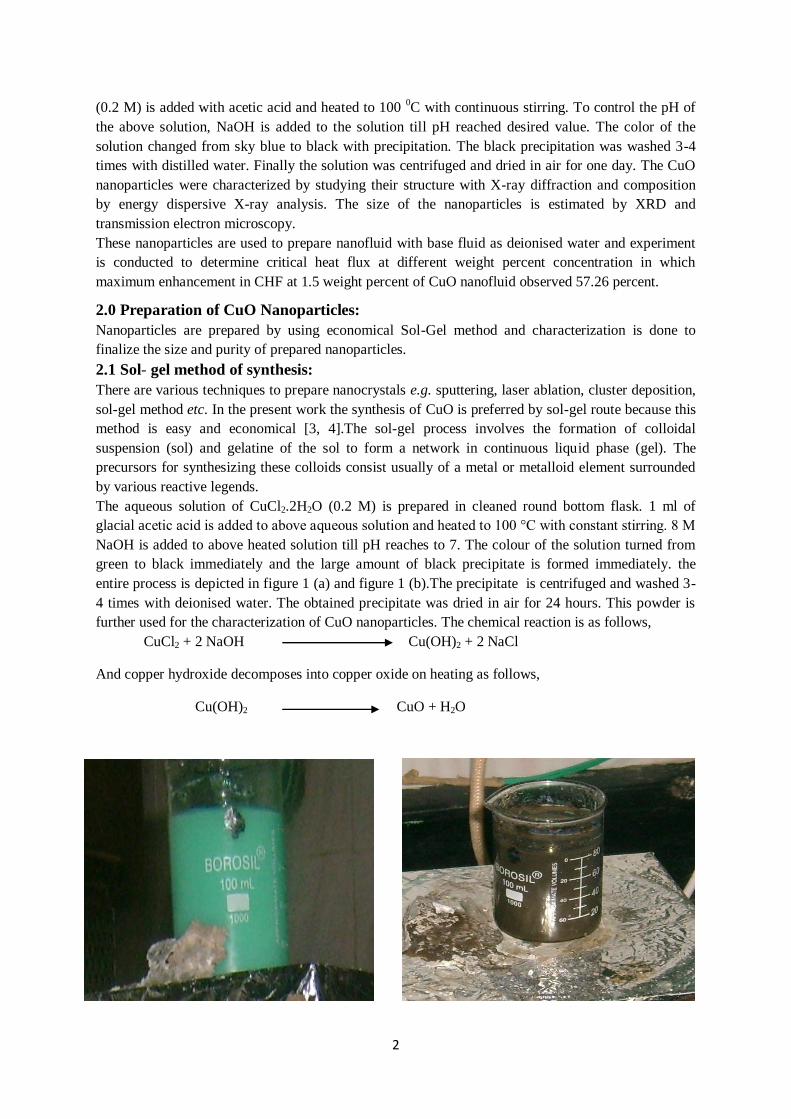
Figure 1:(c): black precipitate of CuO
3.0: Structure and microstructure of CuO nanoparticles: The structural and micro structural properties of the CuO nanoparticles prepared by Sol –Gel
method are as follows;
3.1 Structure analysis CuO of Nanoparticles:
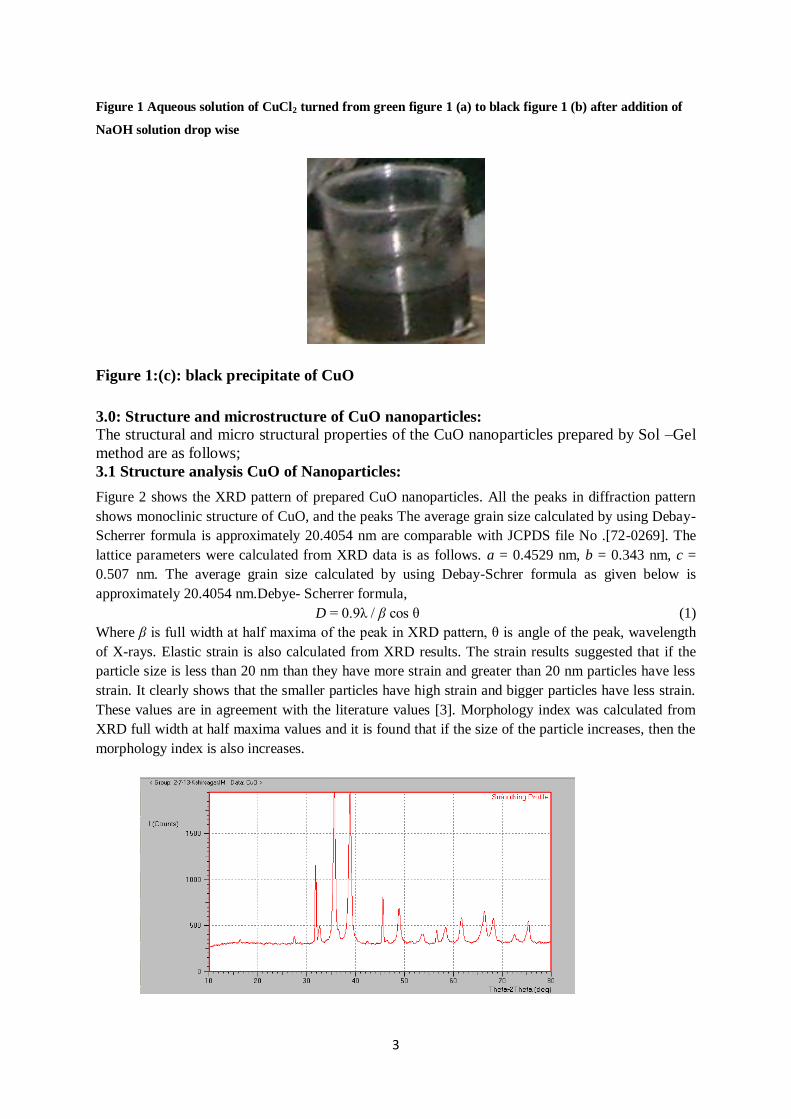
Figure 2 shows the XRD pattern of prepared CuO nanoparticles. All the peaks in diffraction pattern
shows monoclinic structure of CuO, and the peaks The average grain size calculated by using Debay-
Scherrer formula is approximately 20.4054 nm are comparable with JCPDS file No .[72-0269]. The
lattice parameters were calculated from XRD data is as follows. a = 0.4529 nm, b = 0.343 nm, c =
0.507 nm. The average grain size calculated by using Debay-Schrer formula as given below is
approximately 20.4054 nm.Debye- Scherrer formula,
D = 0.9λ / β cos θ (1)
Where β is full width at half maxima of the peak in XRD pattern, θ is angle of the peak, wavelength
of X-rays. Elastic strain is also calculated from XRD results. The strain results suggested that if the
particle size is less than 20 nm than they have more strain and greater than 20 nm particles have less
strain. It clearly shows that the smaller particles have high strain and bigger particles have less strain.
These values are in agreement with the literature values [3]. Morphology index was calculated from
XRD full width at half maxima values and it is found that if the size of the particle increases, then the
morphology index is also increases.
4
Figure 2: XRD pattern of CuO nanoparticle
3.2 Scanning Electron Microscopy (SEM) Examination:
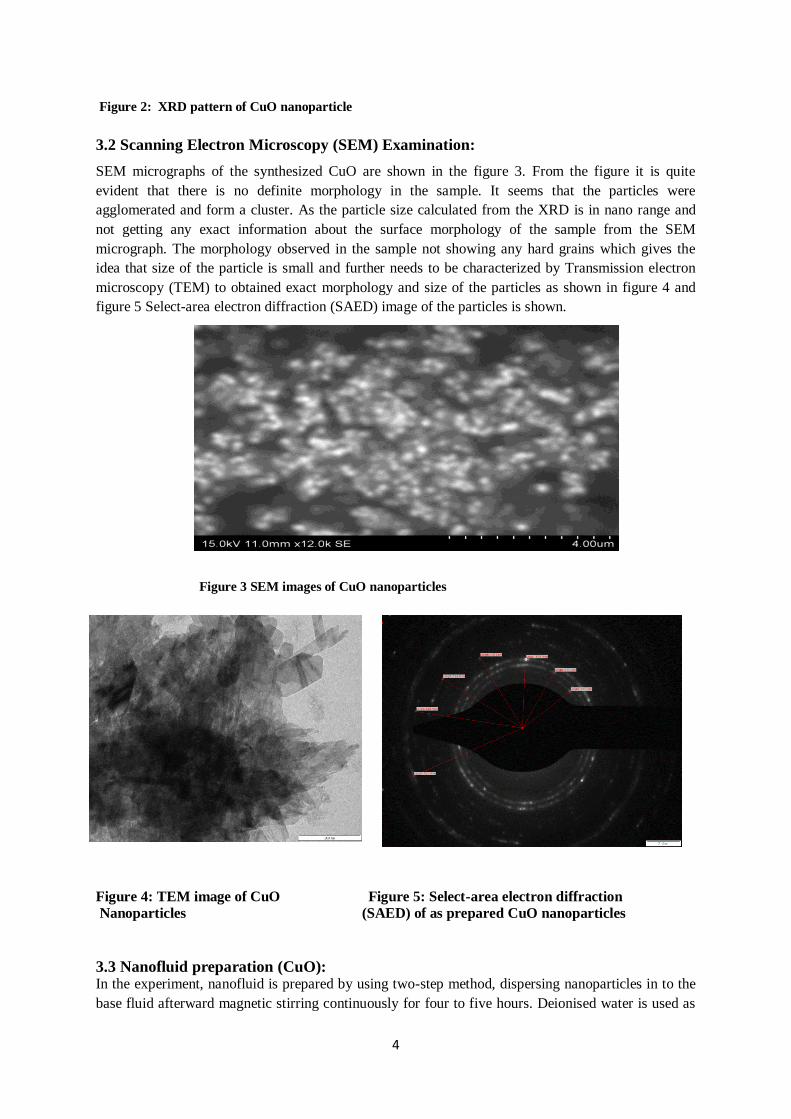
SEM micrographs of the synthesized CuO are shown in the figure 3. From the figure it is quite
evident that there is no definite morphology in the sample. It seems that the particles were
agglomerated and form a cluster. As the particle size calculated from the XRD is in nano range and
not getting any exact information about the surface morphology of the sample from the SEM
micrograph. The morphology observed in the sample not showing any hard grains which gives the
idea that size of the particle is small and further needs to be characterized by Transmission electron
microscopy (TEM) to obtained exact morphology and size of the particles as shown in figure 4 and
figure 5 Select-area electron diffraction (SAED) image of the particles is shown.
Figure 3 SEM images of CuO nanoparticles
Figure 4: TEM image of CuO Figure 5: Select-area electron diffraction Nanoparticles (SAED) of as prepared CuO nanoparticles
3.3 Nanofluid preparation (CuO): In the experiment, nanofluid is prepared by using two-step method, dispersing nanoparticles in to the
base fluid afterward magnetic stirring continuously for four to five hours. Deionised water is used as
5
base fluid and CuO nanoparticles are used without using any additives. The CuO nanoparticles are
prepared in the laboratory by Sol-Gel method. It is observed that surfactants could be used to stabilize
the nanoparticles suspension, but it may have influence on the rheological behaviour of the fluid and
boiling heat transfer [5]. Das et al. noted that nanoparticles dispersed without surfactant did not
change the surface tension of the base fluid [6].
In the present experiment, surfactants are not used and ultrasonic excitation was performed for 4
hours just before the experiment. A glass beaker of 500 ml capacity is used for the preparation of
nanofluid. Magnetic stirrer make Maneto company, Model # 08849-00, rating 150 B & 230 V AC
supply is used. A magnetic needle of 10 x 10 mm used to stirrer the solution. Mercury thermometer is
used for temperature measurement. CONTECH 0.1 mg weighing balance is used.
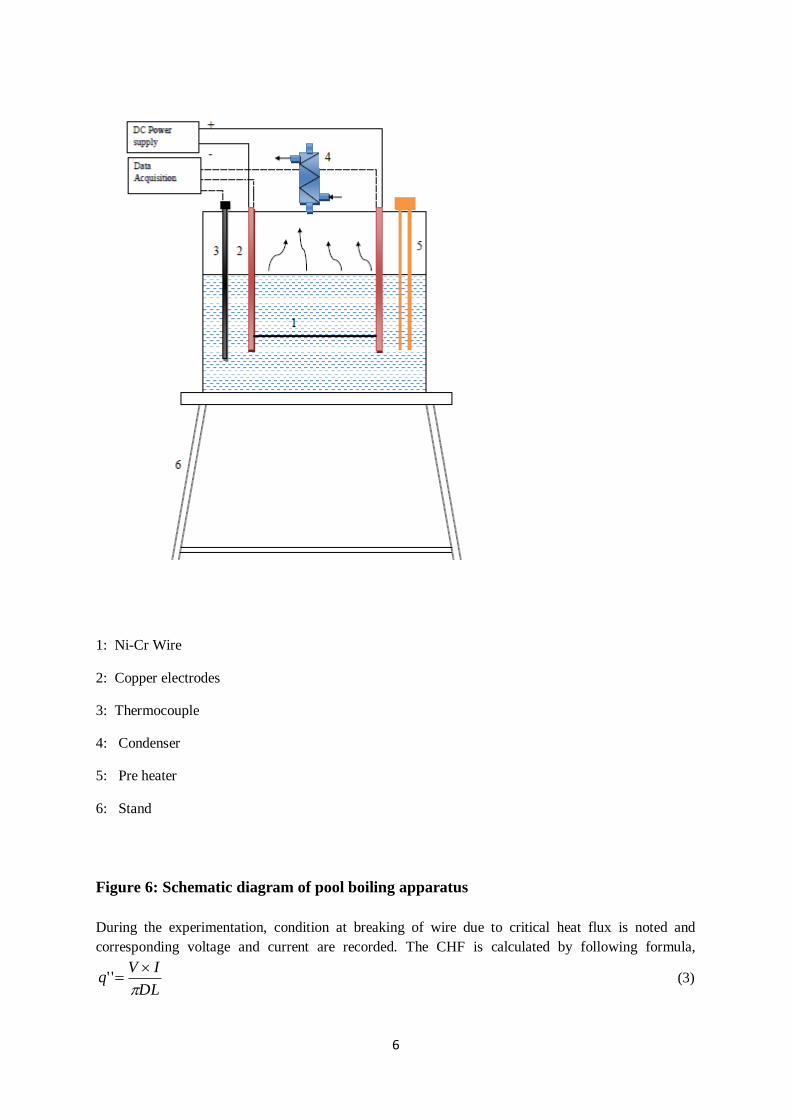
4.0 Determination of enhancement in CHF:
The NiCr wire having 0.321 mm diameter is used as heater surface. The length of the heater is 110
mm. For benchmarking the experiment the Zuber’s correlation is used initially for deionised water,
average CHF for ten experiments is found to be 1.2 MW/m2,( refer figure 7).
4.1 Theoretical determination of CHF
Methodology and correlation used are presented below:
The well known Zuber’s correlation is used for validation of the test set up. Experimental values of
q"CHF is compared with that as predicted by Zuber’s correlation. q"CHF is calculated using zuber’s
correlation:
25.05.0149.0
vlfggCHFghq (2)
4.2 Experimental determination of CHF with Ni-Cr wire:
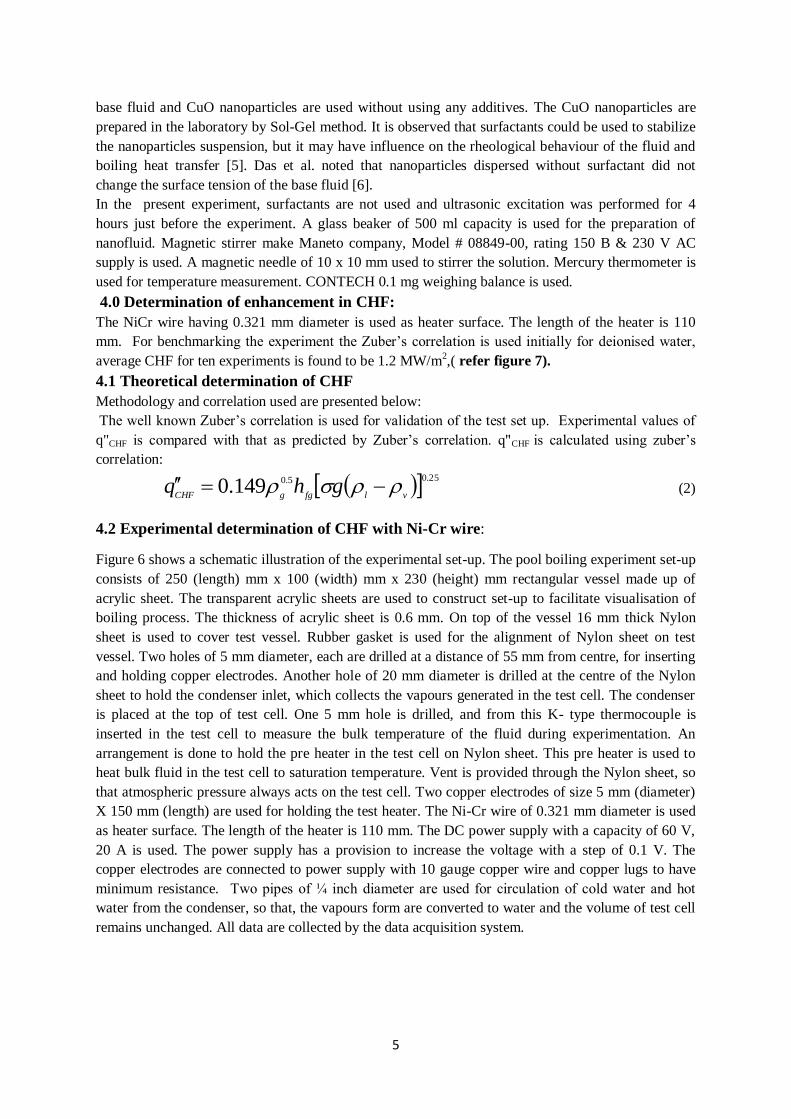
Figure 6 shows a schematic illustration of the experimental set-up. The pool boiling experiment set-up
consists of 250 (length) mm x 100 (width) mm x 230 (height) mm rectangular vessel made up of
acrylic sheet. The transparent acrylic sheets are used to construct set-up to facilitate visualisation of
boiling process. The thickness of acrylic sheet is 0.6 mm. On top of the vessel 16 mm thick Nylon
sheet is used to cover test vessel. Rubber gasket is used for the alignment of Nylon sheet on test
vessel. Two holes of 5 mm diameter, each are drilled at a distance of 55 mm from centre, for inserting
and holding copper electrodes. Another hole of 20 mm diameter is drilled at the centre of the Nylon
sheet to hold the condenser inlet, which collects the vapours generated in the test cell. The condenser
is placed at the top of test cell. One 5 mm hole is drilled, and from this K- type thermocouple is
inserted in the test cell to measure the bulk temperature of the fluid during experimentation. An
arrangement is done to hold the pre heater in the test cell on Nylon sheet. This pre heater is used to
heat bulk fluid in the test cell to saturation temperature. Vent is provided through the Nylon sheet, so
that atmospheric pressure always acts on the test cell. Two copper electrodes of size 5 mm (diameter)
X 150 mm (length) are used for holding the test heater. The Ni-Cr wire of 0.321 mm diameter is used
as heater surface. The length of the heater is 110 mm. The DC power supply with a capacity of 60 V,
20 A is used. The power supply has a provision to increase the voltage with a step of 0.1 V. The
copper electrodes are connected to power supply with 10 gauge copper wire and copper lugs to have
minimum resistance. Two pipes of ¼ inch diameter are used for circulation of cold water and hot
water from the condenser, so that, the vapours form are converted to water and the volume of test cell
remains unchanged. All data are collected by the data acquisition system.
6
1: Ni-Cr Wire
2: Copper electrodes
3: Thermocouple
4: Condenser
5: Pre heater
6: Stand
Figure 6: Schematic diagram of pool boiling apparatus
During the experimentation, condition at breaking of wire due to critical heat flux is noted and
corresponding voltage and current are recorded. The CHF is calculated by following formula,
DL
IVq
'' (3)
7
4.3 Uncertainty in CHF:
The main source of uncertainty of the applied voltage and current only due to contact resistance
between the wire heater and electrodes connected with the clamps in addition to this uncertainty also
associated with length and diameter of the Ni-Cr wire heater.
The uncertainty is computed as below by using the equation proposed by Holman [7]
)4..(......................................................................
2222
L
L
d
d
I
I
V
V
q
q
222281.131.049.363.1
q
q
%26.4
q
q
The uncertainty of the applied voltage and current are 1.63percent and 3.49 percent respectively. And the uncertainty of diameter and length are 0.31percent and 1.81percent respectively. From the above
analysis the maximum uncertainty for pool boiling is estimated 4.26 percent.
Figure: 7 Variation in CHF with different weight concentration of CuO nanofluid
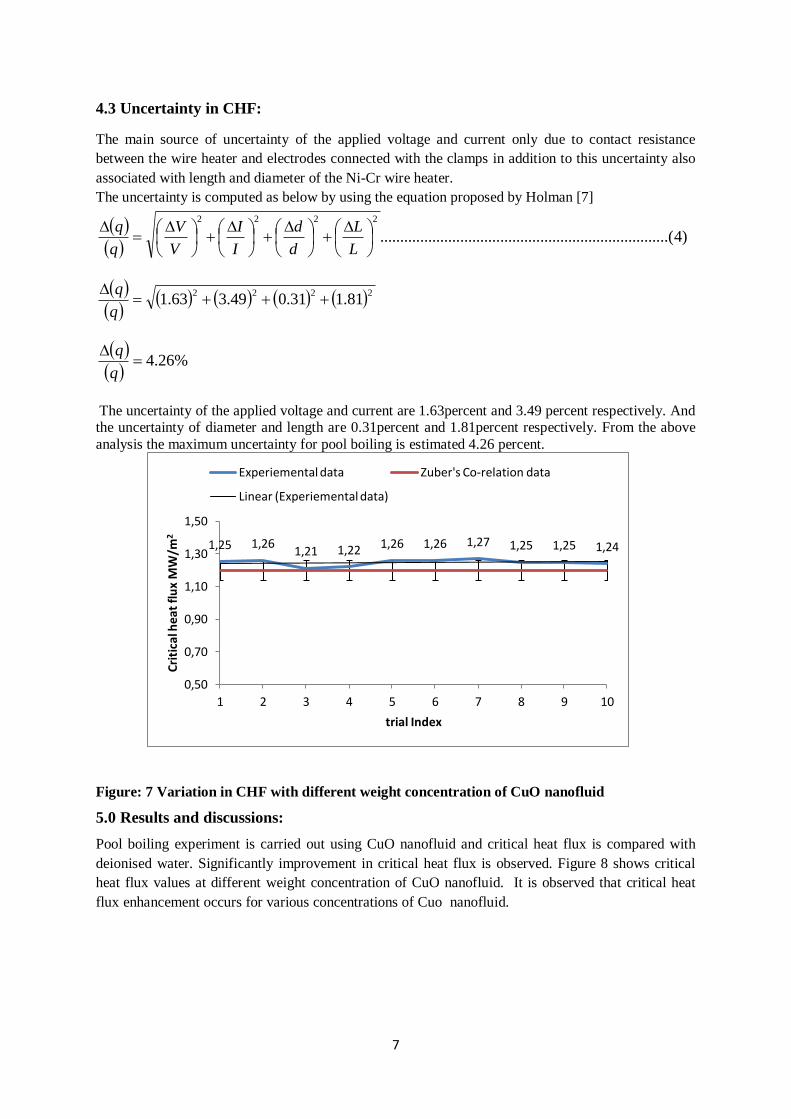
5.0 Results and discussions:
Pool boiling experiment is carried out using CuO nanofluid and critical heat flux is compared with
deionised water. Significantly improvement in critical heat flux is observed. Figure 8 shows critical
heat flux values at different weight concentration of CuO nanofluid. It is observed that critical heat
flux enhancement occurs for various concentrations of Cuo nanofluid.
1,25 1,26 1,21 1,22 1,26 1,26 1,27 1,25 1,25 1,24
0,50
0,70
0,90
1,10
1,30
1,50
1 2 3 4 5 6 7 8 9 10
Cri
tica
l hea
t fl
ux
MW
/m2
trial Index
Experiemental data Zuber's Co-relation data
Linear (Experiemental data)
8
weight concentration of CuO
0.2 0.4 0.6 0.8 1.0 1.2 1.4 1.6
crit
ical
hea
t fl
ux (
MW
/m2
)
1.0
1.2
1.4
1.6
1.8
2.0
2.2
CHF-DI water-Zuber
CHF-DI water EXP
CHF-CuO nanofluid-Zuber
Figure 8: CHF at different weight concentration of CuO nanofluid.
The critical heat flux (CHF) of nanofluid has been compared with pure water by various researchers
.The critical heat flux enhancement is nearly 73 percent for stain steel wire with Al2O3, ZrO2, and SiO2
nanofluid , Kim et al.[8] the enhancement in CHF is only due to increase of contact area by deposition
of nanoparticles over the heating surface. The nanoparticles generate porous layer on the test section
tube surface thus reducing the contact angle between the fluid and heater surface [8]. The existence of
sorption layer enhance the trapping of liquid in nano porous sorption layer and prevents the vapour
blankets formation, so that the CHF increases with increasing the sorption layer thickness at lower
particle concentration range.
After the particle concentration exceeds a certain value, the sorption layer thickness would not
increase and therefore CHF not increased, figure 10 shows the enhancement in critical heat flux with
concentration of nanoparticles compare with deionised water it is observed from figure 10, CHF of
nanofluid is greater than deionised water. Nanoparticles affect the surface characteristics and therefore
influence the boiling heat transfer. The concentration increased surface deposition of the nanoparticles
thickened and more micronized structures were formed on a heating surface; the similar phenomenon
was also reported by Kim et al. [9].
The results show that CHF enhancement is definitely possible by using different nanofluid
instead of deionised water for cooling fluids. However the surface Coating of heater surface
is depending on particles concentrations of the nanofluid, a layer build up which may
increase or decrease surface roughness that will depend upon porosity and nanoparticles size.
9
weight concentration of CuO
0.2 0.4 0.6 0.8 1.0 1.2 1.4 1.6
CH
F nano
fluid/C
HF w
ater
1.1
1.2
1.3
1.4
1.5
1.6
1.7
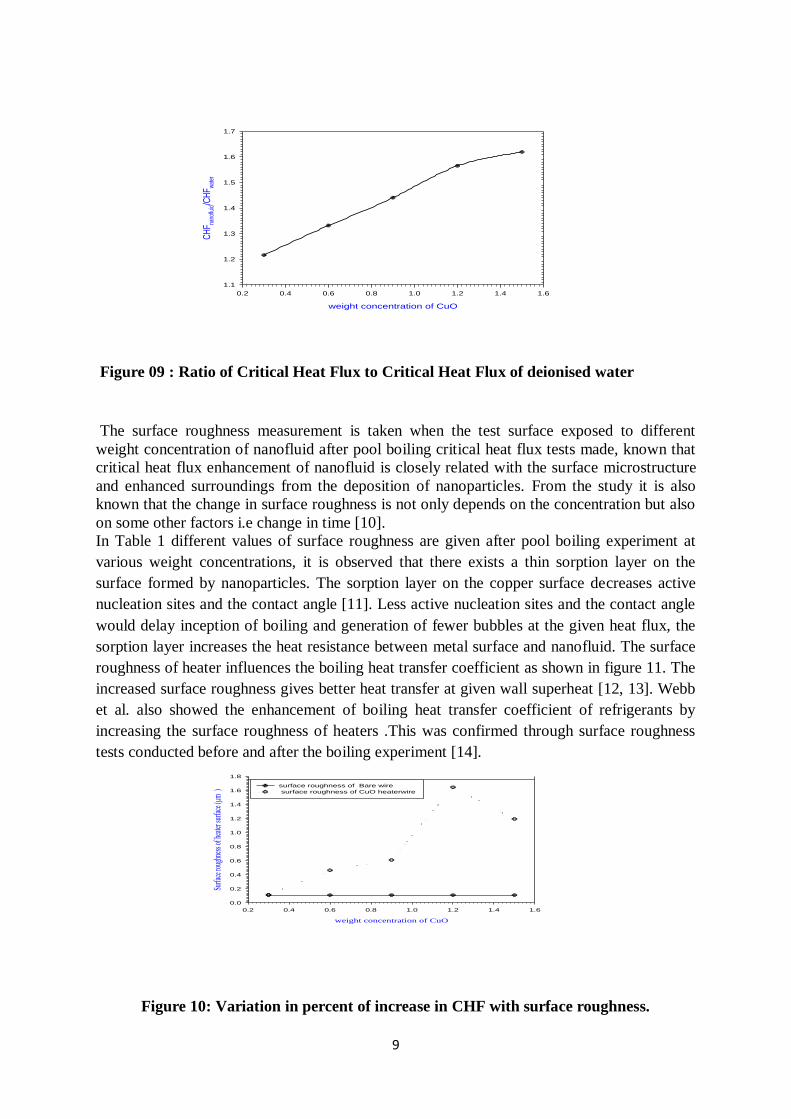
Figure 09 : Ratio of Critical Heat Flux to Critical Heat Flux of deionised water
The surface roughness measurement is taken when the test surface exposed to different
weight concentration of nanofluid after pool boiling critical heat flux tests made, known that
critical heat flux enhancement of nanofluid is closely related with the surface microstructure
and enhanced surroundings from the deposition of nanoparticles. From the study it is also
known that the change in surface roughness is not only depends on the concentration but also
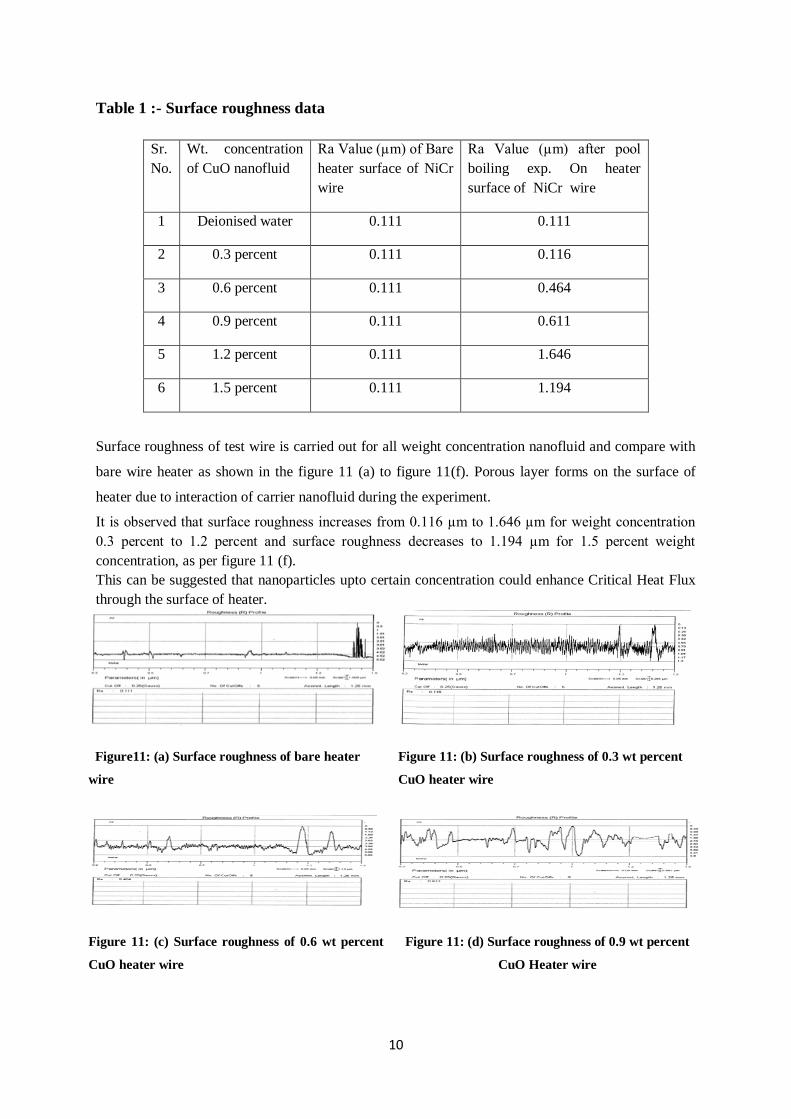
on some other factors i.e change in time [10]. In Table 1 different values of surface roughness are given after pool boiling experiment at
various weight concentrations, it is observed that there exists a thin sorption layer on the
surface formed by nanoparticles. The sorption layer on the copper surface decreases active
nucleation sites and the contact angle [11]. Less active nucleation sites and the contact angle
would delay inception of boiling and generation of fewer bubbles at the given heat flux, the
sorption layer increases the heat resistance between metal surface and nanofluid. The surface
roughness of heater influences the boiling heat transfer coefficient as shown in figure 11. The
increased surface roughness gives better heat transfer at given wall superheat [12, 13]. Webb
et al. also showed the enhancement of boiling heat transfer coefficient of refrigerants by
increasing the surface roughness of heaters .This was confirmed through surface roughness
tests conducted before and after the boiling experiment [14].
weight concentration of CuO
0.2 0.4 0.6 0.8 1.0 1.2 1.4 1.6
Surfa
ce ro
ughn
ess o
f hea
ter su
rface
(µm
)
0.0
0.2
0.4
0.6
0.8
1.0
1.2
1.4
1.6
1.8
surface roughness of Bare wire
surface roughness of CuO heaterwire
Figure 10: Variation in percent of increase in CHF with surface roughness.
10
Table 1 :- Surface roughness data
Sr.
No.
Wt. concentration
of CuO nanofluid
Ra Value (µm) of Bare
heater surface of NiCr
wire
Ra Value (µm) after pool
boiling exp. On heater
surface of NiCr wire
1 Deionised water 0.111 0.111
2 0.3 percent 0.111 0.116
3 0.6 percent 0.111 0.464
4 0.9 percent 0.111 0.611
5 1.2 percent 0.111 1.646
6 1.5 percent 0.111 1.194
Surface roughness of test wire is carried out for all weight concentration nanofluid and compare with
bare wire heater as shown in the figure 11 (a) to figure 11(f). Porous layer forms on the surface of
heater due to interaction of carrier nanofluid during the experiment.
It is observed that surface roughness increases from 0.116 µm to 1.646 µm for weight concentration
0.3 percent to 1.2 percent and surface roughness decreases to 1.194 µm for 1.5 percent weight
concentration, as per figure 11 (f).
This can be suggested that nanoparticles upto certain concentration could enhance Critical Heat Flux
through the surface of heater.
Figure11: (a) Surface roughness of bare heater
wire
Figure 11: (b) Surface roughness of 0.3 wt percent
CuO heater wire
Figure 11: (c) Surface roughness of 0.6 wt percent
CuO heater wire
Figure 11: (d) Surface roughness of 0.9 wt percent
CuO Heater wire
11
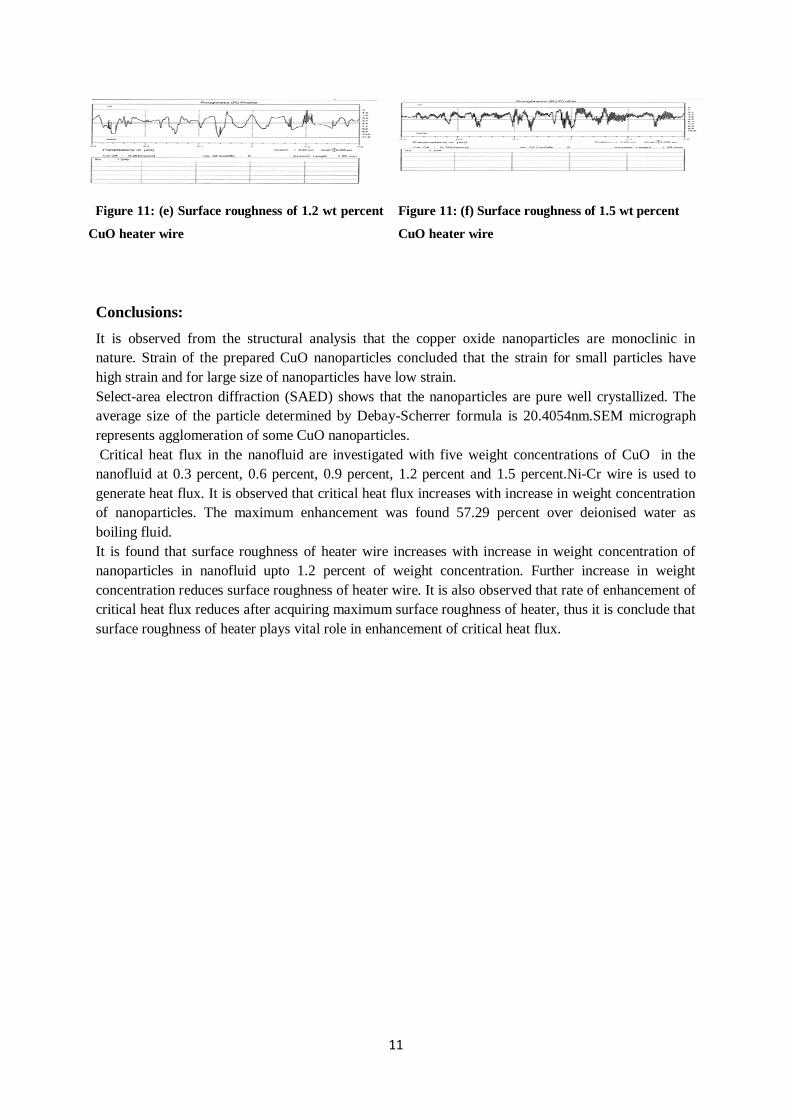
Figure 11: (e) Surface roughness of 1.2 wt percent
CuO heater wire
Figure 11: (f) Surface roughness of 1.5 wt percent
CuO heater wire
Conclusions:
It is observed from the structural analysis that the copper oxide nanoparticles are monoclinic in
nature. Strain of the prepared CuO nanoparticles concluded that the strain for small particles have
high strain and for large size of nanoparticles have low strain.
Select-area electron diffraction (SAED) shows that the nanoparticles are pure well crystallized. The
average size of the particle determined by Debay-Scherrer formula is 20.4054nm.SEM micrograph
represents agglomeration of some CuO nanoparticles.
Critical heat flux in the nanofluid are investigated with five weight concentrations of CuO in the
nanofluid at 0.3 percent, 0.6 percent, 0.9 percent, 1.2 percent and 1.5 percent.Ni-Cr wire is used to
generate heat flux. It is observed that critical heat flux increases with increase in weight concentration
of nanoparticles. The maximum enhancement was found 57.29 percent over deionised water as
boiling fluid.
It is found that surface roughness of heater wire increases with increase in weight concentration of
nanoparticles in nanofluid upto 1.2 percent of weight concentration. Further increase in weight
concentration reduces surface roughness of heater wire. It is also observed that rate of enhancement of
critical heat flux reduces after acquiring maximum surface roughness of heater, thus it is conclude that
surface roughness of heater plays vital role in enhancement of critical heat flux.
12
Nomenclature:
Abbreviations Greek symbols
hfg latent heat of vaporization, [kJ/kg]
Ts temperature of heater surface, [ ]
Tsat saturation temperature, [ ]
Critical heat flux, [MW/m2]
A area of heater surface, [m2]
D diameter of heater, [m]
L length of heater, [m]
density of liquid
density of vapour
CHF Critical Heat Flux
I current [ampere]
V voltage [volts]
Ra avrage roughness[µm]
M Mole
difference
surface tension, [N/m]
X- ray wavelength of vapour
jets, [m]
peak, [radian]
full width half maxima of the peak,
[radian]
frequency, [Hz]
density, [kg/m3]
g acceleration due to gravity
Subscripts
C Critical
HF Heat flux
fg Vaporization
sat Saturation
l: Liquid
v Vapour
References:
[1]. Chon C.H., K.D.Kihm, ‘‘Thermal Conductivity Enhancement of Nanofluid by Browian Motion’’ ASME Journal Heat Transfer 12 2005 pp 810 [2].Das S.K, Putra N.,Thiesen P., Roetzel w., ‘‘Temperature Dependence of thermal conductivity enhancement for nanofluids’’ ASME Journal Heat Transfer 125 2003 PP 567 [3]M. Nagaraju, K. Mukkanti, R. BuchiReddy, Y. Aparna, NCONSEA (National Conference on Nano science and nano engineering application), op025, 31(2012) [4]. Y.Aparna, K.Venkateswara Rao, P. Srinivasa Subbarao, ‘‘Preparation and Characterization of CuO Nanoparticles by Novel Sol-Gel Technique’’Journal of Nano and Electronic Physics 4 2012 pp 3005(1-4) [5]. Wen D, Ding Y, ‘‘Experimental investigation into the pool boiling heat transfer of aqueous based C-alumina nanofluids, Journal nanoparticle Res.7, 2005 pp.265-274.
13
[6]. S.K.Das ,Putra,N.,Roetzel,W., Pool boiling characteristics of nanofluids .international journal of Heat and Mass Transfer 46, 2003 pp 851-862 [7]. Holman J.P.Experimental methods for engineer’s,7
thed.Chap3,McGraw-Hill,New York (2007).
[8]. Kim H.,J.kim, M Kim, ‘‘Experimental study on CHF characteristics of water-TiO2 nanofluids’’ Nucl. Eng.Technol.38 (1) 2006 pp 61-69 [9]. KimS.J, I.C.Bang, J.Buongiorno,L.W.Hu, ‘‘ Surface wettability changes during pool boiling of nanofluids and its effect on critical heat flux’’ International Journal of Heat Mass Transfer 50 2007 pp 4105-4116. [10].HegdeRamakrishnaN. Shrikantha S.Rao,R.P.Reddy.‘‘Experimental studies on CHF enhancement in pool boiling with CuO- water nanofluid’’Heat and Mass Transfer48 2012 pp 1031-1041 [11]. Liu Z.H., QiuY.H. ‘‘Boiling heat transfer characteristics of nanofluids jet impingement on a plate surface’’ Journal Heat Mass Transfer 43 2007 pp 699-706 [12]. Kang M.G., ‘‘Effect of surface roughness on pool boiling heat transfer’’ International Journal Heat Mass Transfer 43 2000 pp 4073-4085. [13]. LiuZ.H.QiuY.H. ‘‘Enhanced boiling heat transfer in restricted spaces of a compact tube bundle with enhanced tubes’’ Application Thermal Engineering. 22 2002 pp1931-1941. [14]. Webb R.L.,C.Pais ‘‘Nucleate pool boiling data for five refrigerants on plain integral-fin and enhanced tube geometries’’ International Journal of Heat Mass Transfer 35 1992 pp 1893- 1904.
Top Related