


γλώσσες
Σελίδες
Νομικός

Effect of Voltage Dip Duration on Cyclic Light Flicker L A W R E N C E B R I E G E i L
A S S O C I A T E " ΚΎΈΈ
ILICKER," as consid-
cyclic flicker due to the terminals of the electric
the sensation of change in the illumination intensity
ior in the brightness of sta-t ionary objects. Only one j phase of the nicker problem jwill be discussed, namely, the I fluctuations of voltage at the jlights which produce the illumination. The performance !of 100-watt incandescent and 15-watt "white" fluorescent jlamps in particular will be covered. ! It is customary to treat flicker in two general groups: jcyclic and noncyclic. Cyclic flicker is caused by periodic Ivoltage fluctuations such as may be produced by the ^operation of a seam welder, while noncyclic flicker is due ]to occasional voltage dips, as may be caused by the random joperation of a spot welder. A comprehensive report1
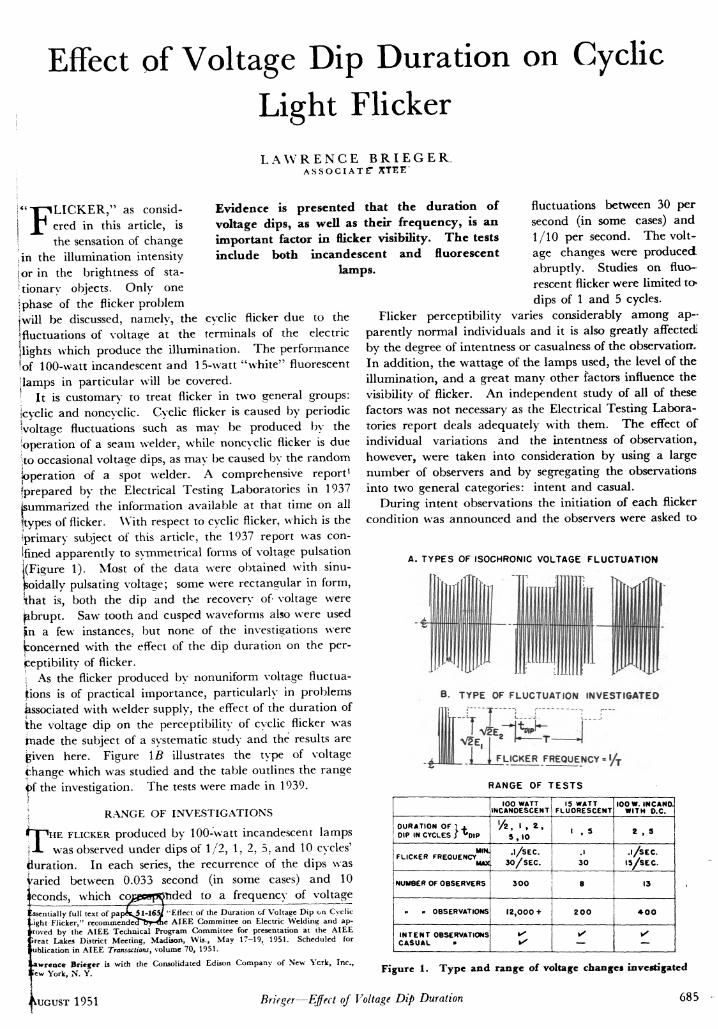
jprepared by the Electrical Testing Laboratories in 1937 (summarized the information available at that time on all ftypes of flicker. With respect to cyclic flicker, which is the [primary subject of this article, the 1937 report was con-Ifined apparently to symmetrical forms of voltage pulsation j(Figure 1). Most of the data were obtained with sinu-poidally pulsating voltage; some were rectangular in form, khat is, both the dip and the recovery of voltage were fabrupt. Saw tooth and cusped waveforms also were used μι a few instances, but none of the investigations were jconcerned with the effect of the dip duration on the per-ceptibility of flicker.
\ As the flicker produced by nonuniform voltage fluctua-tions is of practical importance, particularly in problems associated with welder supply, the effect of the duration of the voltage dip on the perceptibility of cyclic flicker was made the subject of a systematic study and the results are £iven here. Figure \B illustrates the type of voltage Change which was studied and the table outlines the range p{ the investigation. The tests were made in 1939.
RANGE OF INVESTIGATIONS
' Μ Π Η Ε FLICKER produced by 100-watt incandescent lamps
j-L was observed under dips of 1/2, 1, 2, 5. and 10 cycles' duration. In each series, the recurrence of the dips was Varied between 0.033 second (in some cases) and 10 jeconds, which cqaseep^nded to a frequency of voltage
Evidence is presented that the duration of voltage dips, as well as their frequency, is an important factor in flicker visibility. The tests include both incandescent and fluorescent
lamps.
Essentially full text of pap^^5 l - l6Äf ' Effect of the Duration of Voltage Dip on Cyclic t i gh t Flicker," recommended'hT-me AIEE Committee on Electric Welding and ap-proved by the AIEE Technical Program Committee for presentation at the AIEE f r e a t Lakes District Meeting, Madison, Wis., May 17-19, 1951. Scheduled for
ublication In AIEE Transactions, volume 70, 1951.
iawreoce Briefer is with the Consolidated Edison Company of New York, Inc.,
f e w York, N . Y.
fluctuations between 30 per second (in some cases) and 1/10 per second. The volt-age changes were produced abruptly. Studies on fluo-rescent flicker were limited to» dips of 1 and 5 cycles.
Flicker perceptibility varies considerably among a p -parently normal individuals and it is also gready affected! by the degree of intentness or casualness of the observation. In addition, the wattage of the lamps used, the level of the illumination, and a great many other factors influence the visibility of flicker. An independent study of all of these factors was not necessary as the Electrical Testing Labora-tories report deals adequately with them. The effect of individual variations and the intentness of observation, however, were taken into consideration by using a large number of observers and by segregating the observations into two general categories: intent and casual.
During intent observations the initiation of each flicker condition was announced and the observers were asked to
A. TYPES OF ISOCHRONIC VOLTAGE FLUCTUATION
B. TYPE OF FLUCTUATION INVESTIGATED
j FLICKER FREQUENCY = «/j
RANGE OF TESTS
DURATION OF I +
OIP IN CYCLES / H l P
MIN FLICKER FREQUENCY
MAX
NUMBER OF OBSERVERS
·. OBSERVATIONS
I N T E N T OBSERVATIONS C A S U A L -
100 WATT INCANOESCENT
' / 2 , 1 , ! ,
5 , 1 0
. l / S E C .
3 0 / S E C .
3 0 0
1 2 , 0 0 0 +
•
15 WATT FLUORESCENT
• . 5
.1
3 0
8
2 0 0
•
100 W. INC AND. WITH O.C.
^ , 5
. l / S E C .
1 5 / S E C .
13
♦ 0 0
•
Figure 1. Type and range of voltage changes investigated
f UGUST 1951 Brieger—Effect of Voltage Dip Duration 685
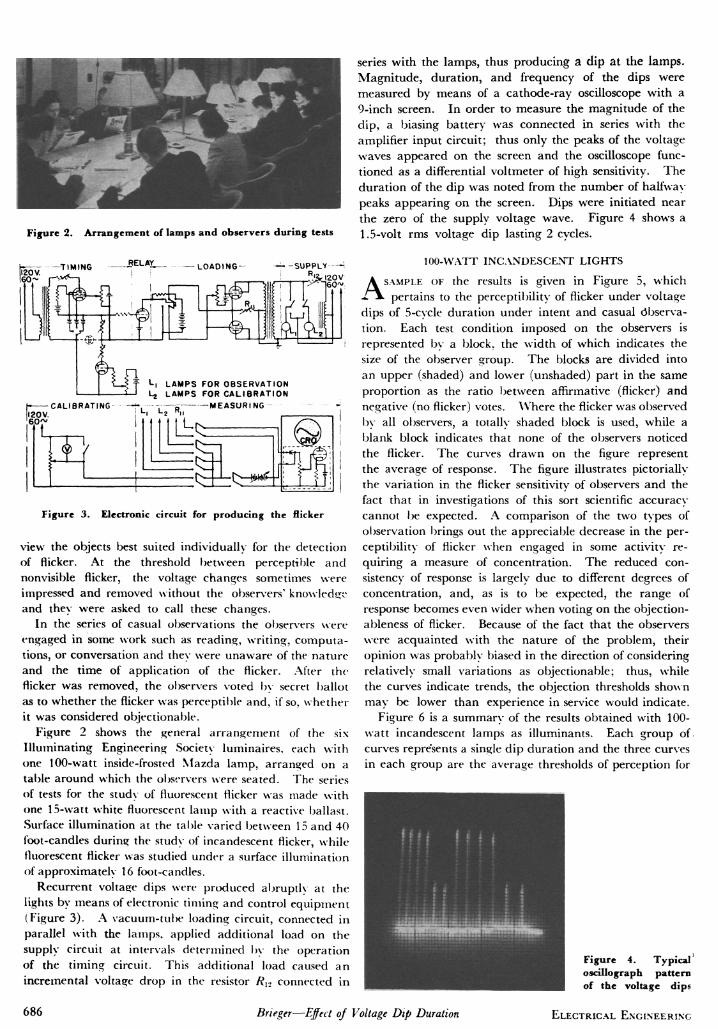
Figure 2. Arrangement of lamps and observers during tests
RELAY
Figure 3. Electronic circuit for producing the flicker
view the objects best suited individually for the detection of flicker. At the threshold between perceptible and nonvisible flicker, the voltage changes sometimes were impressed and removed without the observers' knowledge and they were asked to call these changes.
In the series of casual observations the observers were engaged in some work such as reading, writing, computa-tions, or conversation and they were unaware of the nature and the time of application of the flicker. After the flicker was removed, the observers voted by secret ballot as to whether the flicker was perceptible and, if so, whether it was considered objectionable.
Figure 2 shows the general arrangement of the six Illuminating Engineering Society luminaires, each with one 100-watt inside-frosted Mazda lamp, arranged on a table around which the observers were seated. The series of tests for the study of fluorescent flicker was made with one 15-watt white fluorescent lamp with a reactive ballast. Surface illumination at the table varied between 15 and 40 foot-candles during the study of incandescent flicker, while fluorescent flicker was studied under a surface illumination of approximately 16 foot-candles.
Recurrent voltage dips were produced abruptly at the lights by means of electronic timing and control equipment (Figure 3). A vacuum-tube loading circuit, connected in parallel with the lamps, applied additional load on the supply circuit at intervals determined by the operation of the timing circuit. This additional load caused an incremental voltage drop in the resistor Rl2 connected in
series with the lamps, thus producing a dip at the lamps. Magnitude, duration, and frequency of the dips were measured by means of a cathode-ray oscilloscope with a 9-inch screen. In order to measure the magnitude of the dip, a biasing battery was connected in series with the amplifier input circuit; thus only the peaks of the voltage waves appeared on the screen and the oscilloscope func-tioned as a differential voltmeter of high sensitivity. The duration of the dip was noted from the number of halfway peaks appearing on the screen. Dips were initiated near the zero of the supply voltage wave. Figure 4 shows a 1.5-volt rms voltage dip lasting 2 cycles.
100-WATT INCANDESCENT LIGHTS
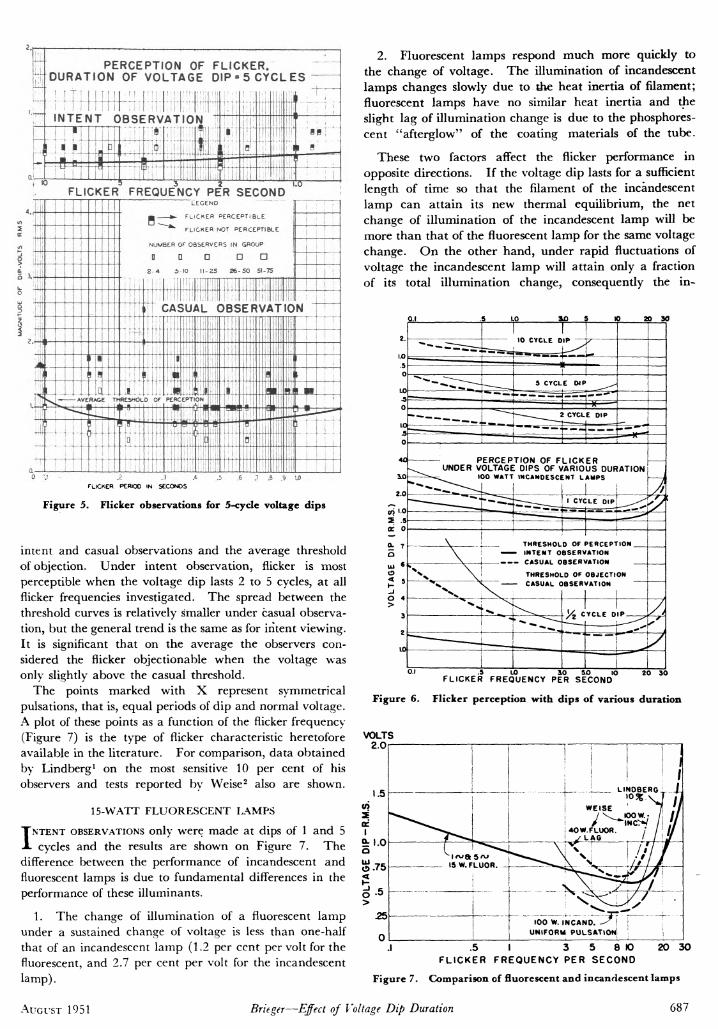
A SAMPLE OF the results is given in Figure 5, which - ^ V pertains to the perceptibility of flicker under voltage dips of 5-cycle duration under intent and casual observa-tion. Each test condition imposed on the observers is represented by a block, the width of which indicates the size of the observer group. The blocks are divided into an upper (shaded) and lower (unshaded) part in the same proportion as the ratio between affirmative (flicker) and negative (no flicker) votes. Where the flicker was observed by all observers, a totally shaded block is used, while a blank block indicates that none of the observers noticed the flicker. The curves drawn on the figure represent the average of response. The figure illustrates pictorially the variation in the flicker sensitivity of observers and the fact that in investigations of this sort scientific accuracy cannot be expected. A comparison of the two types of observation brings out the appreciable decrease in the per-ceptibility of flicker when engaged in some activity re-quiring a measure of concentration. The reduced con-sistency of response is largely due to different degrees of concentration, and, as is to be expected, the range of response becomes even wider when voting on the objection-ableness of flicker. Because of the fact that the observers were acquainted with the nature of the problem, their opinion was probably biased in the direction of considering relatively small variations as objectionable; thus, while the curves indicate trends, the objection thresholds shown may be lower than experience in service would indicate.
Figure 6 is a summary of the results obtained with 100-watt incandescent lamps as illuminants. Each group of curves represents a single dip duration and the three curves in each group are the average thresholds of perception for
Figure 4. Typical oscillograph pattern of the voltage dips
686 Brieger—Effect of Voltage Dip Duration ELECTRICAL ENGINEERING
H PERCEPTION OF FLICKER. DURATION OF VOLTAGE DIP«5 CYCLES
! ( T ! I ! f f ! | ■ ! I | " ; I I I
INTENT OBSERVATION I * : Ίί
I ■
MTTMI t= B
FLICKER FREQUENCY PER SECOND '*°
to h 5 Τ ί
^ i'
LEGEND
■■ ► FLICKER PERCEPTIBLE
"""""*' FLICKER NOT PERCEPTIBLE
NUMBER OF OBSERVERS IN GROUP
o o a a n 2 A 5 10 11-25 2 6 - 5 0 51-75
Figure 5. Flicker observations for 5-cycle voltage dips
intent and casual observations and the average threshold of objection. Under intent observation, flicker is most perceptible when the voltage dip lasts 2 to 5 cycles, at all flicker frequencies investigated. The spread between the threshold curves is relatively smaller under casual observa-tion, but the general trend is the same as for intent viewing. It is significant that on the average the observers con-sidered the flicker objectionable when the voltage was only slightly above the casual threshold.
The points marked with X represent symmetrical pulsations, that is, equal periods of dip and normal voltage. A plot of these points as a function of the flicker frequency (Figure 7) is the type of flicker characteristic heretofore available in the literature. For comparison, data obtained by Lindberg1 on the most sensitive 10 per cent of his observers and tests reported by Weise2 also are shown.
15-WATT FLUORESCENT LAMPS
INTENT OBSERVATIONS only were made at dips of 1 and 5
cycles and the results are shown on Figure 7. The difference between the performance of incandescent and fluorescent lamps is due to fundamental differences in the performance of these illuminants.
1. The change of illumination of a fluorescent lamp under a sustained change of voltage is less than one-half that of an incandescent lamp (1.2 per cent per volt for the fluorescent, and 2.7 per cent per volt for the incandescent lamp).
2. Fluorescent lamps respond much more quickly to the change of voltage. The illumination of incandescent lamps changes slowly due to the heat inertia of filament; fluorescent lamps have no similar heat inertia and the slight lag of illumination change is due to the phosphores-cent "afterglow" of the coating materials of the tube.
These two factors affect the flicker performance in opposite directions. If the voltage dip lasts for a sufficient length of time so that the filament of the incandescent lamp can attain its new thermal equilibrium, the net change of illumination of the incandescent lamp will be more than that of the fluorescent lamp for the same voltage change. O n the other hand, under rapid fluctuations of voltage the incandescent lamp will attain only a fraction of its total illumination change, consequently the in-
PERCEPTION OF FLICKER UNDER VOLTAGE DIPS OF VARIOUS DURATION
100 WATT INCANDESCENT LAMPS
. 5 LO 10 5J0 10 __ „
FLICKER FREQUENCY PER SECOND
Figure 6. Flicker perception with dips of various duration
VOLTS
.5 I 3 5 8 10 FLICKER FREQUENCY PER SECOND
20 30
Figure 7. Comparison of fluorescent and incandescent lamps
AUGUST 1951 Brieger—Effect of Voltage Dip Duration 687
Δΐ_»8.4%
AL»4% t - C Y C L E p i p
AV-4*|V.(RMSJ
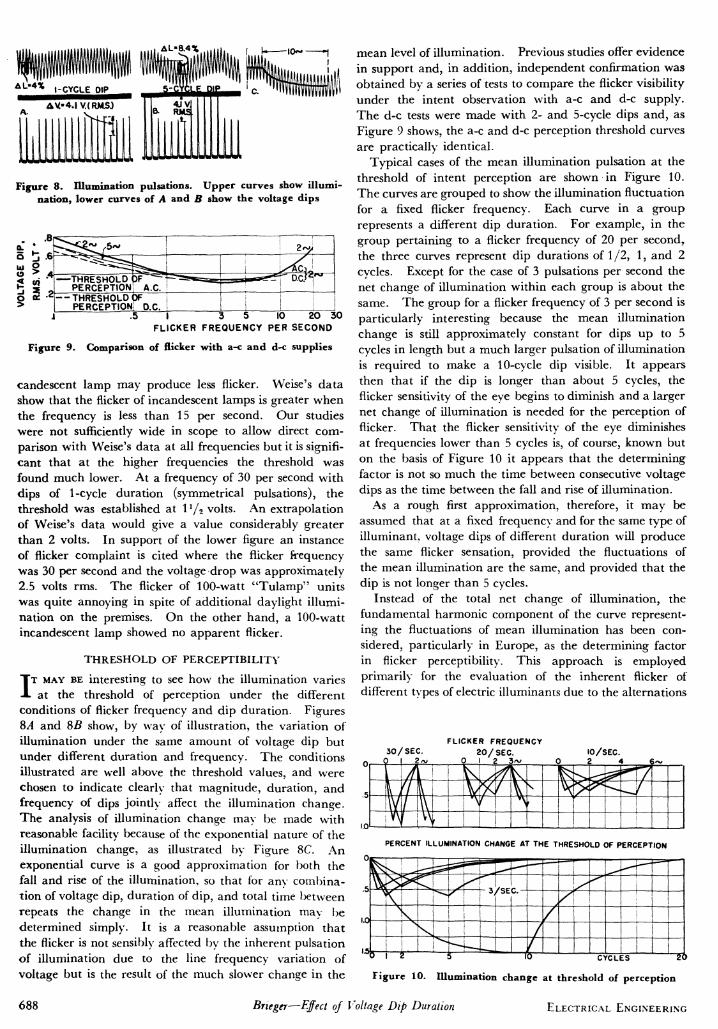
Figure 8. Illumination pulsations. Upper curves show illumi-nation, lower curves of A and B show the voltage dips
.5 I 3 5 10 20 30 FLICKER FREQUENCY PER SECOND
Figure 9. Comparison of flicker with a-c and d-c supplies
candescent lamp may produce less flicker. Weise's data show that the flicker of incandescent lamps is greater when the frequency is less than 15 per second. Our studies were not sufficiently wide in scope to allow direct com-parison with Weise's data at all frequencies but it is signifi-cant that at the higher frequencies the threshold was found much lower. At a frequency of 30 per second with dips of 1-cycle duration (symmetrical pulsations), the threshold was established at 11/2 volts. An extrapolation of Weise's data would give a value considerably greater than 2 volts. In support of the lower figure an instance of flicker complaint is cited where the flicker frequency was 30 per second and the voltage drop was approximately 2.5 volts rms. The flicker of 100-watt "Tu lamp" units was quite annoying in spite of additional daylight illumi-nation on the premises. On the other hand, a 100-watt incandescent lamp showed no apparent flicker.
THRESHOLD OF PERCEPTIBILITY
IT MAY BE interesting to see how the illumination varies at the threshold of perception under the different
conditions of flicker frequency and dip duration. Figures 8A and SB show, by way of illustration, the variation of illumination under the same amount of voltage dip but under different duration and frequency. The conditions illustrated are well above the threshold values, and were chosen to indicate clearly that magnitude, duration, and frequency of dips jointly affect the illumination change. The analysis of illumination change may be made with reasonable facility because of the exponential nature of the illumination change, as illustrated by Figure 8C. An exponential curve is a good approximation for both the fall and rise of the illumination, so that for any combina-tion of voltage dip, duration of dip, and total time between repeats the change in the mean illumination may be determined simply. It is a reasonable assumption that the flicker is not sensibly affected by the inherent pulsation of illumination due to the line frequency variation of voltage but is the result of the much slower change in the
mean level of illumination. Previous studies offer evidence in support and, in addition, independent confirmation was obtained by a series of tests to compare the flicker visibility under the intent observation with a-c and d-c supply. The d-c tests were made with 2- and 5-cycle dips and, as Figure 9 shows, the a-c and d-c perception threshold curves are practically identical.
Typical cases of the mean illumination pulsation at the threshold of intent perception are shown in Figure 10. The curves are grouped to show the illumination fluctuation for a fixed flicker frequency. Each curve in a group represents a different dip duration. For example, in the group pertaining to a flicker frequency of 20 per second, the three curves represent dip durations of 1/2, 1, and 2 cycles. Except for the case of 3 pulsations per second the net change of illumination within each group is about the same. The group for a flicker frequency of 3 per second is particularly interesting because the mean illumination change is still approximately constant for dips up to 5 cycles in length but a much larger pulsation of illumination is required to make a 10-cycle dip visible. It appears then that if the dip is longer than about 5 cycles, the flicker sensitivity of the eye begins to diminish and a larger net change of illumination is needed for the perception of flicker. That the flicker sensitivity of the eye diminishes at frequencies lower than 5 cycles is, of course, known but on the basis of Figure 10 it appears that the determining factor is not so much the time between consecutive voltage dips as the time between the fall and rise of illumination.
As a rough first approximation, therefore, it may be assumed that at a fixed frequency and for the same type of illuminant, voltage dips of different duration will produce the same flicker sensation, provided the fluctuations of the mean illumination are the same, and provided that the dip is not longer than 5 cycles.
Instead of the total net change of illumination, the fundamental harmonic component of the curve represent-ing the fluctuations of mean illumination has been con-sidered, particularly in Europe, as the determining factor in flicker perceptibility. This approach is employed primarily for the evaluation of the inherent flicker of different types of electric illuminants due to the alternations
0
5
10
30 /SEC. ) 1 gru
j >
A 1
1 V N
FLIC :KER F 2 0 /
) 1 ί
REQUENCY SEC. > 3 ~ , 0
^ ^
1
t> r
0/SEC. > 4
-^ ?< J S*0
.
< 7 f
i*v
PERCENT ILLUMINATION CHANGE AT THE THRESHOLD OF PERCEPTION
0
5
10
15 0
!
< y (
i
5
Γ 3>
/SE
i ö
=
0Ί rcLi
"— \
| ES
i i |
1_J L-5ö
Figure 10. Illumination change at threshold of perception
688 Brieger—Effect of Voltage Dip Duration ELECTRICAL ENGINEERING
of line voltage at line frequency3-5 but it also has been applied to the comparison of incandescent and fluorescent flicker due to low frequency voltage variations.6
FREQUENCY-CHANGER WELDER FLICKER
PUBLISHED CYCLIC flicker studies, including the present
one, are confined to sustained pulsations. Re-ciprocating compressors, conventional seam welders, and high-speed automatic spot welders are typical loads to which the available data would apply. Frequency-changer welders7·8 developed in the last few years also produce cyclic line voltage variations, but in spot welding applications of the system the voltage pulsates only briefly, each time a spot is welded. The response of the nervous system to such short-lived pulsations may not be the same as the reaction to a sustained flicker of the same frequency.
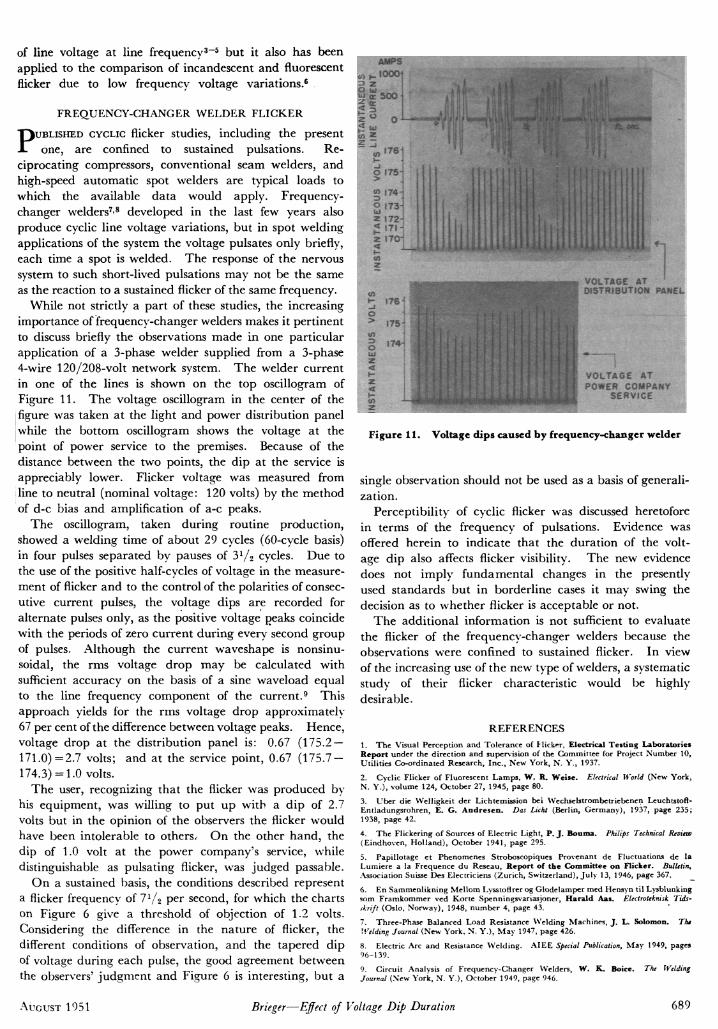
While not strictly a part of these studies, the increasing importance of frequency-changer welders makes it pertinent to discuss briefly the observations made in one particular application of a 3-phase welder supplied from a 3-phase 4-wire 120/208-volt network system. The welder current in one of the lines is shown on the top oscillogram of Figure 11. The voltage oscillogram in the center of the figure was taken at the light and power distribution panel while the bottom oscillogram shows the voltage at the point of power service to the premises. Because of the distance between the two points, the dip at the service is appreciably lower. Flicker voltage was measured from line to neutral (nominal voltage: 120 volts) by the method of d-c bias and amplification of a-c peaks.
The oscillogram, taken during routine production, showed a welding time of about 29 cycles (60-cycle basis) in four pulses separated by pauses of 3l/2 cycles. Due to the use of the positive half-cycles of voltage in the measure-ment of flicker and to the control of the polarities of consec-utive current pulses, the voltage dips are recorded for alternate pulses only, as the positive voltage peaks coincide with the periods of zero current during every second group of pulses. Although the current waveshape is nonsinu-soidal, the rms voltage drop may be calculated with sufficient accuracy on the basis of a sine waveload equal to the line frequency component of the current.9 This approach yields for the rms voltage drop approximately 67 per cent of the difference between voltage peaks. Hence, voltage drop at the distribution panel is: 0.67 (175.2 — 171.0) =2.7 volts; and at the service point, 0.67 (175.7 — 174.3) = 1.0 volts.
The user, recognizing that the flicker was produced by his equipment, was willing to put up with a dip of 2.7 volts but in the opinion of the observers the flicker would have been intolerable to others.· On the other hand, the dip of 1.0 volt at the power company's service, while distinguishable as pulsating flicker, was judged passable.
On a sustained basis, the conditions described represent a flicker frequency of 7l/2 per second, for which the charts on Figure 6 give a threshold of objection of 1.2 volts. Considering the difference in the nature of flicker, the different conditions of observation, and the tapered dip of voltage during each pulse, the good agreement between the observers' judgment and Figure 6 is interesting, but a
Figure 11. Voltage dips caused by frequency-changer welder
single observation should not be used as a basis of generali-zation.
Perceptibility of cyclic flicker was discussed heretofore in terms of the frequency of pulsations. Evidence was offered herein to indicate that the duration of the volt-age dip also affects flicker visibility. The new evidence does not imply fundamental changes in the presently used standards but in borderline cases it may swing the decision as to whether flicker is acceptable or not.
The additional information is not sufficient to evaluate the flicker of the frequency-changer welders because the observations were confined to sustained flicker. In view of the increasing use of the new type of welders, a systematic study of their flicker characteristic would be highly desirable.
REFERENCES
1. The Visual Perception and Tolerance of Flicker, Electrical Testing Laboratories Report under the direction and supervision of the Committee for Project Number 10, Utilities Co-ordinated Research, Inc. , New York, N. Y., 1937.
2. Cyclic Flicker of Fluorescent Lamps, W. R, Weise. Electrical World (New York, N . Y.), volume 124, October 27, 1945, page 80.
3. Über die Welligkeit der Lichtemission bei Wechselstrombetriebenen Leuchtstoff-Entladungsrohren, E. G. Andresen. Das Ucht (Berlin, Germany), 1937, page 235; 1938, page 42.
4. The Flickering of Sources of Electric Light, P. J. Bouma. Philips Technical Review (Eindhoven, Holland), October 1941, page 295.
5. Papillotage et Phenomenes Stroboscopiques Provenant de Fluctuations de la Lumiere a la Frequence du Reseau, Report of the Committee on Flicker. Bulletin, Association Suisse Des Electriciens (Zurich, Switzerland), July 13, 1946, page 367.
6. En Sammenlikning Mellom Lysstoffrer og Glodelamper med Hensyn til Lysblunking som Framkommer ved Korte Spenningsvariasjoner, Harald Aas. Electroteknisk Tids-skrift (Oslo, Norway), 1948, number 4, page 43.
7. Three-Phase Balanced Load Resistance Welding Machines, J. L. Solomon. The Welding Journal (New York, N. Y.), May 1947, page 426.
8. Electric Arc and Resistance Welding. AIEE Special Publication, May 1949, pages 96-139.
9. Circuit Analysis of Frequency-Changer Welders, W. K. Boice. The Welding Journal (New York, N. Y.), October 1949, page 946.
AUGUST 1951 Brieger—Effect of Voltage Dip Duration 689
Top Related