
γλώσσες
Σελίδες
Νομικός

BGD10, 13317–13352, 2013
Amino acidcomposition and
δ15N
B. Gaye et al.
Title Page
Abstract Introduction
Conclusions References
Tables Figures
J I
J I
Back Close
Full Screen / Esc
Printer-friendly Version
Interactive Discussion
Discussion
Paper
|D
iscussionP
aper|
Discussion
Paper
|D
iscussionP
aper|
Biogeosciences Discuss., 10, 13317–13352, 2013www.biogeosciences-discuss.net/10/13317/2013/doi:10.5194/bgd-10-13317-2013© Author(s) 2013. CC Attribution 3.0 License.
EGU Journal Logos (RGB)
Advances in Geosciences
Open A
ccess
Natural Hazards and Earth System
Sciences
Open A
ccess
Annales Geophysicae
Open A
ccess
Nonlinear Processes in Geophysics
Open A
ccess
Atmospheric Chemistry
and Physics
Open A
ccess
Atmospheric Chemistry
and Physics
Open A
ccess
Discussions
Atmospheric Measurement
Techniques
Open A
ccess
Atmospheric Measurement
Techniques
Open A
ccess
Discussions
Biogeosciences
Open A
ccess
Open A
ccess
BiogeosciencesDiscussions
Climate of the Past
Open A
ccess
Open A
ccess
Climate of the Past
Discussions
Earth System Dynamics
Open A
ccess
Open A
ccess
Earth System Dynamics
Discussions
GeoscientificInstrumentation
Methods andData Systems
Open A
ccess
GeoscientificInstrumentation
Methods andData Systems
Open A
ccess
Discussions
GeoscientificModel Development
Open A
ccess
Open A
ccess
GeoscientificModel Development
Discussions
Hydrology and Earth System
Sciences
Open A
ccess
Hydrology and Earth System
Sciences
Open A
ccess
Discussions
Ocean ScienceO
pen Access
Open A
ccess
Ocean ScienceDiscussions
Solid Earth
Open A
ccess
Open A
ccess
Solid EarthDiscussions
The Cryosphere
Open A
ccess
Open A
ccess
The CryosphereDiscussions
Natural Hazards and Earth System
Sciences
Open A
ccess
Discussions
This discussion paper is/has been under review for the journal Biogeosciences (BG).Please refer to the corresponding final paper in BG if available.
Amino acid composition and δ15N ofsuspended matter in the Arabian SeaB. Gaye1, B. Nagel2, K. Dähnke2, T. Rixen1,3, N. Lahajnar1, and K.-C. Emeis1,2
1Institut für Biogeochemie und Meereschemie, Universität Hamburg, Hamburg, Germany2Helmholtz-Zentrum Geesthacht, Zentrum für Material- und Küstenforschung GmbH,Geesthacht, Germany3Leibniz-Zentrum für Marine Tropenökologie, Bremen, Germany
Received: 13 June 2013 – Accepted: 16 July 2013 – Published: 12 August 2013
Correspondence to: B. Gaye ([email protected])
Published by Copernicus Publications on behalf of the European Geosciences Union.
13317
BGD10, 13317–13352, 2013
Amino acidcomposition and
δ15N
B. Gaye et al.
Title Page
Abstract Introduction
Conclusions References
Tables Figures
J I
J I
Back Close
Full Screen / Esc
Printer-friendly Version
Interactive Discussion
Discussion
Paper
|D
iscussionP
aper|
Discussion
Paper
|D
iscussionP
aper|
Abstract
Sedimentation in the ocean is fed by large aggregates produced in the surface mixedlayer that sink rapidly through the water column. These particles sampled by sedi-ment traps have often been proposed to interact by disaggregation and scavengingwith a pool of fine suspended matter with very slow sinking velocities and thus a long5
residence time. We investigated the amino acid composition and stable nitrogen iso-topic ratios of suspended matter sampled during the late SW monsoon season in theArabian Sea and compared them to those of sinking particles to investigate organicmatter degradation/modification during passage through the water column. We foundthat amino acid (AA) composition of mixed layer suspended matter corresponds more10
to fresh plankton and their aggregates, whereas AA composition of suspended matterin the sub-thermocline water column deviated progressively from mixed layer compo-sition. We conclude that suspended matter in deep waters and in the mixed layers ofoligotrophic stations is dominated by fine material that has a long residence time andorganic matter that is resistant to degradation. Whereas SPM in areas of high primary15
productivity is essentially derived from fresh plankton and thus has a strong imprintof the subsurface nitrate source, SPM at oligotrophic stations and at subthermoclinedepths appears to exchange amino acids with the DOC pool influencing also the δ15Nvalues.
1 Introduction20
Most planktonic organisms and the mineral particles transported into the deep oceanare very small and have very low sinking velocities, so that oceanic sedimentationdepends mainly on the formation and settling of large particles (Degens and Ittekkot,1987; McCave, 1984). These are, generally, formed in surface water involving biologicalprocesses. Fecal pellets are a minor proportion of sinking particles (Pilskaln and Honjo,25
1987), whereas macroscopic aggregates of organic and inorganic matter, the so called
13318
BGD10, 13317–13352, 2013
Amino acidcomposition and
δ15N
B. Gaye et al.
Title Page
Abstract Introduction
Conclusions References
Tables Figures
J I
J I
Back Close
Full Screen / Esc
Printer-friendly Version
Interactive Discussion
Discussion
Paper
|D
iscussionP
aper|
Discussion
Paper
|D
iscussionP
aper|
marine snow, are the major means of transport of material to the sediments (Alldredgeand Silver, 1988). Contrary to the large sinking particles small suspended particles withlow sinking velocities remain suspended for months to years if not scavenged by therare sinking particles (McCave, 1984). Whereas sediment traps, deployed over days orweeks in the water column, are suitable to sample sinking aggregates, filtration of con-5
ventional water samples collects the fine grained suspended matter (SPM) which doesnot sink (Silver et al., 1998). There is evidence that in-situ filtration systems sampleboth fine and large particles so that their composition is intermediate between that ofmaterial intercepted by sediment traps and that obtained by filtration of water samples(Abramson et al., 2011; Bishop et al., 1985).10
Total organic matter concentrations as well as labile constituents of organic mat-ter in sinking particles intercepted by sediment traps decrease with increasing waterdepth (Haake et al., 1993a, 1992; Lee et al., 2000). This suggests that degradationproceeds on large aggregates while sinking in the water column despite their rapidsinking speeds of 10–150 md−1 (McDonnell and Buesseler, 2010). Studies of organic15
constituents such as pigments, amino acids, and fatty acids suggest that organic mat-ter in SPM is less degraded than that of sinking particles (Abramson et al., 2011; Leeet al., 1983; Rontani et al., 2011; Wakeham and Canuel, 1988). This is somewhatcounterintuitive, as the much longer residence time of fine particles in the water col-umn would imply stronger degradation of organic matter (Degens and Ittekkot, 1987;20
McCave, 1984). Based on these observations, models of particle aggregation and dis-aggregation with differential settling of labile and refractory matter have been formu-lated (Abramson et al., 2011; Lee et al., 1983; Wakeham and Canuel, 1988) with acentral concept of photo-oxidation of lipids to radicals in SPM of surface waters thatmakes them resistant towards biotic degradation (Rontani et al., 2011).25
Amino acids are frequently used to characterize and quantify the degradation stateof organic matter. Indicators are amino acid concentrations, especially their contribu-tions to organic carbon (AA-C %) or nitrogen (AA-N %) (Cowie and Hedges, 1994)as well as specific changes in amino acid monomer distribution. Ratios of individual
13319
BGD10, 13317–13352, 2013
Amino acidcomposition and
δ15N
B. Gaye et al.
Title Page
Abstract Introduction
Conclusions References
Tables Figures
J I
J I
Back Close
Full Screen / Esc
Printer-friendly Version
Interactive Discussion
Discussion
Paper
|D
iscussionP
aper|
Discussion
Paper
|D
iscussionP
aper|
amino acids such as Asp/β-Ala and Glu/γ-Aba (Cowie and Hedges, 1994; Ittekkotet al., 1984b; Lee and Cronin, 1984), or the more complex Reactivity Index (RI; Jen-nerjahn and Ittekkot, 1997) and Degradation Index (DI; Dauwe and Middelburg, 1998;Dauwe et al., 1999) have been established to classify organic matter degradation (In-galls et al., 2003; Möbius et al., 2010; Pantoja et al., 2004; Unger et al., 2005). These5
biogeochemical indicators of organic matter quality were essentially developed for ma-rine sinking particles and sediments. They are of limited use in other sample sets andmaterials, such as marine SPM and samples from fresh and brackish waters, so thatindividual and adapted indices (usually derived from statistical analyzes of composi-tional data by principal components analysis PCA) must be developed to differentiate10
states of degradation (Abramson et al., 2011; Gaye et al., 2007; Goutx et al., 2007;Menzel et al., 2013; Sheridan et al., 2002).
To contribute to the understanding of oceanic particle dynamics and organic matterdegradation we collected particulate matter from the Arabian Sea by filtration of largevolumes of water (i) from conventional samplers and (ii) by in situ pumps and analyzed15
the particles for amino acid composition and stable nitrogen isotopic ratios (δ15N).These data are compared to data from long-term trap investigations in the ArabianSea (Gaye-Haake et al., 2005; Haake et al., 1992, 1996; Rixen et al., 2009; Schäferand Ittekkot, 1993, 1995). Nutrient data and δ15NNO3
values are available from the
sampling sites (Gaye et al., 2013; Rixen et al., 2013) and permit an evaluation of δ15N20
values of SPM (δ15NPN) in relation to the dissolved nitrate source. This serves to testwhether SPM influences and contributes to the δ15N signal exported from the mixedlayer into the deep ocean.
13320
BGD10, 13317–13352, 2013
Amino acidcomposition and
δ15N
B. Gaye et al.
Title Page
Abstract Introduction
Conclusions References
Tables Figures
J I
J I
Back Close
Full Screen / Esc
Printer-friendly Version
Interactive Discussion
Discussion
Paper
|D
iscussionP
aper|
Discussion
Paper
|D
iscussionP
aper|
2 Material and methods
2.1 Study area
The Arabian Sea is highly productive due to monsoon-driven upwelling of thermoclinenutrients along the western margins off Oman and Somalia (Fischer et al., 1996; Wig-gert et al., 2005; Woodward et al., 1999). It also hosts one of the worlds’ major oxygen5
deficient zones (ODZ) situated between 100 m and about 1200 m water depth. There,about one third of the global oceanic nitrogen loss occurs (Gruber, 2008; Gruber andSarmiento, 1997) mostly due to heterotrophic denitrification (Bulow et al., 2010; Wardet al., 2009). This process has a strong isotopic effect of 20–30 %� (Altabet et al.,1999a; Brandes et al., 1998; Cline and Kaplan, 1975), so that δ15N values of nitrate10
(δ15NNO3) in the upper ODZ of the Arabian Sea are high and reach up to > 20 %�
(Yoshinari et al., 1997). Upwelling off Oman occurs during the SW monsoon from Juneto September, when Ekman pumping brings water from 150 m water depth to the sur-face (Morrison et al., 1998). 15N enriched nitrate from the top of the ODZ then reachesthe euphotic zone and is further converted into particulate matter by primary producers.15
Strongest denitrification is not encountered in the most productive region off Omanbut in the north eastern Arabian Sea as reflected in maximum nitrite accumulation inthe oxygen-deficient water column interval (Naqvi, 1987, 1991; Yoshinari et al., 1997).This spatial decoupling of the productivity and denitrification maxima is related to thecirculation in the basin. The oxygenated Indian Central Water (ICW) enters the Arabian20
Sea from the SW and becomes oxygen and nitrate depleted on its way to the east (Bön-ing and Bard, 2009; Morrison, 1997; Morrison et al., 1998). Local source of mid-waterre-oxygenation are the Persian Gulf Water and the Red Sea Water in the western Ara-bian Sea (Mantoura et al., 1993; Prasad et al., 2001), and a seasonal (SW-monsoonal)undercurrent from the Bay of Bengal flowing north along the Indian margin (Naqvi et al.,25
2005).Sediment trap studies in offshore areas and at the Pakistan margin (Gaye-Haake
et al., 2005; Schäfer and Ittekkot, 1993) reveal that δ15N of sinking particles sampled13321
BGD10, 13317–13352, 2013
Amino acidcomposition and
δ15N
B. Gaye et al.
Title Page
Abstract Introduction
Conclusions References
Tables Figures
J I
J I
Back Close
Full Screen / Esc
Printer-friendly Version
Interactive Discussion
Discussion
Paper
|D
iscussionP
aper|
Discussion
Paper
|D
iscussionP
aper|
in bimonthly to monthly resolution range from 5 to 9 %� with inter-annual averagesranging from 5.8–7.8 %�. Early diagenetic processes and diagenetic enrichment at thesediment water interface prior to burial further increases the δ15N of surface sedimentsto values > 12 %� in the central Arabian Sea (Gaye-Haake et al., 2005; Möbius et al.,2011).5
2.2 Sampling
Water samples were taken at 14 stations with a Seabird SBE 32 Water Samplerequipped with 10 L PVC sample bottles during cruise R/V Meteor 74/1b in 2007 (Fig. 1).Between 3 L and 45 L of water were filtered on pre-combusted (450 ◦C overnight) andWhatman GF/F glass fibre filters (47 mm diameter) at water depths between 0 m (sur-10
face) and 450 m. At five stations in-situ pumps (McLane WTS LV) were used whichfiltered between 200 L and 950 L water on pre-combusted (450 ◦C overnight) WhatmanGF/F filters (142 mm diameter). Samples were dried at 40 ◦C for two days and the dryweight was used to determine total suspended matter concentrations (SPM) in mgL−1.Samples from in-situ pumps were only used for δ15N analyzes as filters were not pre-15
weighed.
2.3 Analyses
Total carbon and nitrogen were measured by a Carlo Erba Nitrogen Analyser 1500 (Mi-lan, Italy). Organic carbon (POC) was determined after three acid treatments of sam-ples to remove carbonate. Precision of this method is 0.05 % for carbon and 0.005 %20
for nitrogen. Organic matter (OM) was calculated by multiplying the organic carboncontent with 1.8 (Müller et al., 1986). Carbonate carbon is the difference between totaland organic carbon.
Ratios of 15N/14N of particulate nitrogen (δ15NPN values) were determined usinga Delta Plus XP isotope ratio mass spectrometer connected with a ConFlo-III inter-25
face after high-temperature flash combustion in a Thermo Finnigan Flash EA 1112 at
13322
BGD10, 13317–13352, 2013
Amino acidcomposition and
δ15N
B. Gaye et al.
Title Page
Abstract Introduction
Conclusions References
Tables Figures
J I
J I
Back Close
Full Screen / Esc
Printer-friendly Version
Interactive Discussion
Discussion
Paper
|D
iscussionP
aper|
Discussion
Paper
|D
iscussionP
aper|
1050 ◦C. Isotope ratios are reported in %� using the delta-notation
δ15Nsample = ((15N/14N)sample/(15N/14N)reference −1) ·1000 (1)
Pure tank N2 calibrated against the reference standards IAEA-N1 (ammonium sul-fate, δ15N = +0.4 %�) and IAEA-N2 (ammonium sulfate, δ15N = +20.3 %�) of the In-ternational Atomic Energy Agency was used as a working standard. δ15N is given5
as the per mil deviation from the N-isotope composition of atmospheric N2. Duplicatemeasurements of samples differ by less than 0.15 %�. The laboratory’s long-term 2σstandard deviation for IAEA-N1 standard is 0.09 %�.
Nutrient concentrations in filtered water samples were determined by a Skalar Auto-analyser and δ15N of nitrate were determined using the “denitrifier method” (Casciotti10
et al., 2002; Sigman et al., 2001); data are taken from Rixen et al. (2013) and Gayeet al. (2013).
Total hydrolysable amino acids and hexosamines (AA) were analysed with aBiochrom 30 Amino Acid Analyser after hydrolysis of ca. 1–2 mg for suspended par-ticulate matter (collected on GF/F filters) with 6 N HCl for 22 h at 110 ◦C under a pure15
argon atmosphere. A particle free aliquot was three times evaporated to dryness inorder to remove the remaining acid; the residue was taken up in an acidic buffer (pH:2.2). After injection and subsequent separation with a cation exchange resin, the in-dividual monomers were post-column derivatized with o-phthaldialdehyde in the pres-ence of 2-mercaptoethanol and detected with a Merck Hitachi L-2480 fluorescence20
detector. Duplicate analysis of a standard solution according to this method results ina relative error of 0.1 to 1.3 % for the concentrations of individual AA monomers and0.2 to 3.0 % for individual AA monomers of SPM samples. Molar percentages of indi-vidual monomers are used to calculate the reactivity index (RI) and the degradationindex (DI). The RI is the ratio of the labile amino acids Tyr and Phe divided by the25
sum of the non-protein amino acids β-Ala and γ-Aba. (Jennerjahn and Ittekkot, 1997).The DI assesses the diagenetic alteration of a sample by comparing it to a set of 28samples of different degradational states and environments compiled by Dauwe and
13323
BGD10, 13317–13352, 2013
Amino acidcomposition and
δ15N
B. Gaye et al.
Title Page
Abstract Introduction
Conclusions References
Tables Figures
J I
J I
Back Close
Full Screen / Esc
Printer-friendly Version
Interactive Discussion
Discussion
Paper
|D
iscussionP
aper|
Discussion
Paper
|D
iscussionP
aper|
Middelburg (1998) and Dauwe et al. (1999). Molar percentages of individual AA arestandardised by the mean and standard deviations of the 28-sample data set. The DIthen integrates the AA weighed by the factor coefficients for the first axis of the principalcomponent analyses (PCA) of Dauwe et al. (1999) according to the formula:
DI = Σ[
vari −AVGvari
STDvari
]· fac.coef.i (2)5
where vari is the original mole percentage of each AAi , AVGvari and STDvari are themean and standard deviations, respectively, and fac.coef.i is the factor coefficient ofthe first axis of the PCA of Dauwe et al. (1999). The DI thus represents the cumulativedeviation of the 14 amino acids with respect to an assumed average molar composition.Higher (lower) values of RI and DI indicate less (more) degradation.10
3 Results
3.1 SPM, POC, and nitrogen
SPM concentrations between 1.3–8.2 mgL−1 in Arabian Sea surface waters were en-countered at the western stations off Oman (#944–947) (Fig. 2a). POC concentrationswere elevated (140–860 µgL−1) in the surface mixed layer of these stations, and also15
along the southern transect (#948–951; Fig. 2b), and both SPM and POC concentra-tions decreased with depth at these stations (Fig. 2a, b, Table 1). SPM≤ 0.5 mgL−1 andPOC≤ 100 µgL−1 occurred along the northern transect (#953–958) in surface watersand below 100 m at all locations (Table 1).
C/N ratios of SPM on filters are between 5 and 10 with no apparent depth trend.20
Organic carbon weight percentages vary between 3 and 27 % (Table 1). Lowest per-centages were observed in the samples from the western Arabian. Some of thesestations have considerably elevated POC concentrations in surface SPM. Samples ofthe northern transect and most deep samples have POC percentages between 15 and
13324
BGD10, 13317–13352, 2013
Amino acidcomposition and
δ15N
B. Gaye et al.
Title Page
Abstract Introduction
Conclusions References
Tables Figures
J I
J I
Back Close
Full Screen / Esc
Printer-friendly Version
Interactive Discussion
Discussion
Paper
|D
iscussionP
aper|
Discussion
Paper
|D
iscussionP
aper|
25 % with no apparent depth related trend. Carbonate percentages are relatively lowwith values between 0 and 12.6 %.
3.2 δ15N ratios of particulate nitrogen
δ15NPN are between 4.5 and 9.3 %� in waters < 100 m depth of the Arabian Sea (Fig.3a), between 8.5 and 9.6 %� at 100–150 m depth and between 6.9 and 9.4 %� at ≥5
200 m water depth, respectively (Fig. 3; Table 1). The δ15NPN of samples from deepsea pumps are slightly depleted compared to SPM from water samplers in samples at15–50 m. The observed difference are quite small and may as well be due to spatialvariations in δ15NPN of the Arabian Sea rather than to the two different techniques.
3.3 Amino acids10
In the Arabian Sea total hydrolysable amino acid concentrations are significantly cor-related with POC (R2 = 0.64; n = 40) and with N concentrations (R2 = 0.82; n = 40).Amino acids and hexosamines concentrations are between 28 and 297 mgg−1 of drySPM, between 27 and 597 µgL−1, and comprise 20–60 % of total organic carbon andbetween 50 and 100 % of nitrogen, respectively. The non-protein amino acids are15
present only in trace amounts so that Asp/β-Ala and Glu/γ-Aba ratios are > 100 inmost samples. The DI values are around 1 and the RI values are between 9 and 55,respectively (Table 1). Similar to POC, amino acid concentrations and percentage con-tribution of amino acid carbon and nitrogen of total organic carbon and nitrogen haveno depth trend at stations #951–958.20
13325
BGD10, 13317–13352, 2013
Amino acidcomposition and
δ15N
B. Gaye et al.
Title Page
Abstract Introduction
Conclusions References
Tables Figures
J I
J I
Back Close
Full Screen / Esc
Printer-friendly Version
Interactive Discussion
Discussion
Paper
|D
iscussionP
aper|
Discussion
Paper
|D
iscussionP
aper|
4 Discussion
4.1 SPM concentration and composition
High SPM and organic carbon concentrations with maxima at stations #944 and #946were observed in the western Arabian Sea where upwelling was still active in lateSeptember 2007 (Fig. 2). The negative correlation between sea surface temperature5
(SST) and organic POC concentrations in surface waters (R2 = −0.81, n = 14) sug-gests a close relationship between upwelling related primary productivity and surfacewater POC concentrations. SPM concentrations are also negatively correlated withSST, but the correlation is less significant. The reason is, probably, a dilution caused bythe dust input from the Arabian Peninsula which is very high during the SW monsoon10
(Ramaswamy et al., 1991). SPM concentrations drop immediately below the thermo-cline to values below 0.5 mgL−1 equivalent to those in surface water along the north-ern oligotrophic transect. Concentrations below 0.5 mgL−1 thus represent the standingstock of subthermocline SPM in the Arabian Sea. Elevated SPM concentrations in thesurface mixed layer are evidently due to seasonally or locally enhanced productivity,15
when biomass material adds to the standing stock. Minima of SPM and POC concen-trations are ∼ 0.2 mgL−1 and ∼ 40 µCgL−1, respectively. The mass of POC extrapo-lated over a water column of 3000–4000 m is between 120–160 gCm−2. Annual aver-age export production of the Arabian Sea is ∼ 90 gCm−2 a−1 (Rixen et al., 2005) andthe available estimate of the mean residence time water in the ODZ is about 11±4 yr20
(Olson et al., 1993). The exchange between sinking and suspended POC may, thus,be quite limited.
4.2 Source of organic matter as indicated by amino acid spectra
Amino acid composition of SPM deviates from Arabian Sea plankton, sinking particlesand surface sediments. Whereas sinking particles (intercepted by sediment traps) and25
sediments have patterns dominated by Gly> Asp> Glu> Ala (Haake et al., 1992),
13326
BGD10, 13317–13352, 2013
Amino acidcomposition and
δ15N
B. Gaye et al.
Title Page
Abstract Introduction
Conclusions References
Tables Figures
J I
J I
Back Close
Full Screen / Esc
Printer-friendly Version
Interactive Discussion
Discussion
Paper
|D
iscussionP
aper|
Discussion
Paper
|D
iscussionP
aper|
SPM is dominated by Gly> Glu> Asp> Ser. SPM samples have lower Mol-% non-protein AA (β-Ala and γ-Aba) and considerably higher amino acid carbon percentagesthan sinking particles and sediments (Haake et al., 1996), which would suggest that or-ganic matter in SPM is less degraded. Also, commonly used indicators such as Asp/β-Al and Glu/γ-Aba ratios, and the more complex indicators DI and RI reveal no trend5
with depth, which would imply that the SPM pool below the surface mixed layer is en-tirely homogeneous (Table 1; see methods for explanation). But these indicators weredeveloped to trace mineralisation and organic matter degradation of sinking particlesand sediments (Cowie and Hedges, 1994; Dauwe and Middelburg, 1998; Dauwe et al.,1999; Ittekkot et al., 1984a, b; Jennerjahn and Ittekkot, 1997; Lee, 1988), and are likely10
unsuitable or too coarse to track changes in SPM. To recognise compositional differ-entiation of SPM, we carried out a Principal Component Analysis (PCA) of amino acidMol-% for the SPM sample set. The highest positive factor loadings were contributedby the amino acids Asp, Thr, Ala, Val, Ile, Leu and Phe of which most are abundant infresh plankton (Gaye et al., 2007; Ingalls et al., 2006; Lee, 1988). The amino acids with15
negative factor loadings (Ser, Glu, Gly and Arg) are some of those considered as typ-ical for carbonaceous and siliceous frustules (Cowie and Hedges, 1992; Hecky et al.,1973), but have so far not been encountered to group in amino acid PCAs (Gaye et al.,2007; Ingalls et al., 2006) (Table 2). This factor thus distinguishes samples based on thepresence or absence of fresh plankton. In consequence the scores of individual sam-20
ples have a clear trend with depth from high scores in shallower samples to low scoresin deep samples. Moreover, samples from the mixed layers and the sub-thermoclineof high production sites have higher F1 scores than those from less productive sites(Table 2). The basic trend is an enrichment of Glu, Gly and Ser in deep SPM and in low-productivity surface waters, whereas mixed-layer SPM in productive areas resembles25
fresh plankton (Fig. 4).The depth-related change in amino acid composition of SPM found in this PCA is
different from that observed in sinking particles. Bacterial degradation of sinking freshplankton and attached bacteria of similar amino acid composition (Cowie and Hedges,
13327
BGD10, 13317–13352, 2013
Amino acidcomposition and
δ15N
B. Gaye et al.
Title Page
Abstract Introduction
Conclusions References
Tables Figures
J I
J I
Back Close
Full Screen / Esc
Printer-friendly Version
Interactive Discussion
Discussion
Paper
|D
iscussionP
aper|
Discussion
Paper
|D
iscussionP
aper|
1992) progresses with depth and shifts the amino acid composition to typical degrada-tion products of proteinogenic amino acids, such as the non-protein amino acids β-Ala,γ-Aba and Orn (Cowie and Hedges, 1994; Lee and Cronin, 1982, 1984). SPM from theeuphotic zone in our sample set is similar to sinking particles caught at 1000–3000 mdepth, whereas SPM in samples deeper than ≥ 100 m is different (Fig. 4; data from5
Haake et al., 1992, 1996). Results of a second PCA of all SPM amino acid spectrafrom this data set, average values for sediment trap deployments between 1986 and1990, and plankton samples from the Arabian Sea corroborate that SPM on the onehand and plankton/sinking materials on the other hand are compositionally different(Fig. 5). The first factor (53 % of the total variance) has positive loadings of Val, Ala,10
Thr, Lys, Met, Tyr, Asp, His, β-Aba and γ-Aba, and negative factor loadings of Ser, Glu,Ile and Leu. Scores of individual samples on this factor clearly separate SPM (nega-tive scores) from plankton and trap samples (positive scores). The second factor (23 %of the total variance) reveals modifications related to water depth. High scores marktrap and SPM samples from shallow depths, and low scores SPM samples from sub-15
thermocline depths and deeper traps. Negative scores of trap samples are related tothe enrichment of degradation products Orn and the non-protein amino acids, as wellas His and Gly. Negative scores of deep SPM are mainly due to the negative loadingsof Ser and Gly. The second factor produces a similar order of SPM samples in theexpanded data set including sinking matter and fresh plankton, as the factor analyses20
carried out using SPM only (Table 2). These results illustrate the difference betweensinking and suspended particles and show that amino acid spectra of SPM and sinkingparticles depart from plankton and further diverge with depth.
Diverging amino acid composition of SPM and sinking particles may be related tothe difference in source and bulk composition. SPM from the euphotic zone contains25
aggregated coccolithophorids and diatoms, which are also present in sediment trapsamples (H. Schulz, personal communication, 2012). SPM from the surface layer thusis probably a mixture of fresh plankton, biogenic aggregates and fine non- or very
13328
BGD10, 13317–13352, 2013
Amino acidcomposition and
δ15N
B. Gaye et al.
Title Page
Abstract Introduction
Conclusions References
Tables Figures
J I
J I
Back Close
Full Screen / Esc
Printer-friendly Version
Interactive Discussion
Discussion
Paper
|D
iscussionP
aper|
Discussion
Paper
|D
iscussionP
aper|
slow-sinking mineral matter. Admixture of plankton-derived organic matter is obviouslycorrelated to primary productivity.
It has often been found that amino acids enriched in cell walls as well as in tests ofcarbonaceous and siliceous frustules are more resistant to degradation and becomeenriched during organic matter degradation (Lomstein et al., 2006). Gly, Thr, and Ser5
are present in diatom cell walls and siliceous tests (Cowie and Hedges, 1992; Heckyet al., 1973) and Asp and Glu are enriched in foraminiferal tests and are, moreover,preferably adsorbed to carbonates (Carter, 1978; Carter and Mitterer, 1978; Cowie andHedges, 1992). Selective enrichment in shell matrices could be an important mecha-nism on sinking particles, because frustules of carbonate (30–70 %) and biogenic opal10
(10–50 %) dominate bulk composition in all samples (Haake et al., 1993b; Lee et al.,1998). Only Asp is enriched on sinking particles suggesting that degradation of freshplankton is still predominant over selective preservation of cell wall constituents and ad-sorbed amino acids. On the other hand, Glu, Ser and Gly enrichment in SPM cannot beattributed to preservation of frustules, because their content is rather low in SPM. For15
example, carbonate contributes only 0–6 % to total SPM. So, even if the contributionof biogenic opal to total SPM at the upwelling stations is higher than that of biogeniccarbonate, we assume that biogenic frustules rarely exceed 10 % of total SPM. Totalorganic matter percentages are between 5.4–49 % with an average of 32 %; and weassume that lithogenic matter contributes more than 50 % to SPM.20
These observations lead to the conclusion that amino acids adsorbed to or part ofbiogenic frustules cannot progressively dominate the amino acid spectra of SPM. Wepostulate that instead selective sorption of amino acids to lithogenic mineral surfacesmay be an important process influencing SPM amino acid composition (Carter, 1978;Hedges and Hare, 1987). Sorption of dissolved organic matter to mineral surface of25
different origin has been investigated in detail (Arnarson and Keil, 2005, 2007; Keilet al., 1994; Mayer, 1999). However, the degradability of organic matter appears to bemore important for its preservation than the sorption process itself, and degradation canproceed on organic matter adsorbed to mineral surfaces (Satterberg et al., 2003; Taylor,
13329
BGD10, 13317–13352, 2013
Amino acidcomposition and
δ15N
B. Gaye et al.
Title Page
Abstract Introduction
Conclusions References
Tables Figures
J I
J I
Back Close
Full Screen / Esc
Printer-friendly Version
Interactive Discussion
Discussion
Paper
|D
iscussionP
aper|
Discussion
Paper
|D
iscussionP
aper|
1995). The high concentrations of organic matter in SPM may not be explained bysorption of dissolved moieties to mineral surfaces only, but may indicate that dissolvedorganic matter is transferred into the particulate organic matter pool by aggregation(Chin et al., 1998). Studies by McCarthy et al. (2004) and McCarthy et al. (1997) foundrelatively undegraded dissolved organic nitrogen of an autotrophic origin in the deep5
ocean which may have been protected from degradation by a gel-matrix structure (Chinet al., 1998).
Sinking particles on the other hand are sites of bacterial decomposition of plankton-derived organic matter and accumulate degradation products such as non-proteinamino acids (Alldredge et al., 1986; Alldredge and Silver, 1988; Lee and Cronin, 1982;10
Silver et al., 1998). Larger particles escape faster from the euphotic zone due to the“ballast-effect” of biogenic frustules and rapidly transport labile organic matter to thedeep sea and to the sediments (Klaas and Archer, 2002; Salter et al., 2010). Due totheir fast escape from the photic zone they contain less free radicals that are assumedto prevent microbial degradation (Rontani et al., 2011).15
4.3 Nitrate assimilation and δ15NPN
Arabian Sea subsurface waters have δ15NNO3values between 7–8 %� (Gaye et al.,
2013). This enrichment relative to deep ocean nitrate (δ15NNO3= 4.8 %� ; Sigman et al.,
2000) may be related to upward mixing and diffusion of isotopically enriched nitratefrom the upper ODZ, or to recycling of the 15N-enriched particulate organic matter from20
upwelling areas where nitrate from the ODZ can reach the surface waters.Assimilation of nitrate in surface waters follows the “Rayleigh closed system” model,
if the substrate is not replenished. In this case the δ15NNO3of the nitrate substrate can
be calculated according to Mariotti et al. (1981):
δ15Nsubstrate = δ15Ninitial.substrate−15ε{ln(f )} . (3)25
13330
BGD10, 13317–13352, 2013
Amino acidcomposition and
δ15N
B. Gaye et al.
Title Page
Abstract Introduction
Conclusions References
Tables Figures
J I
J I
Back Close
Full Screen / Esc
Printer-friendly Version
Interactive Discussion
Discussion
Paper
|D
iscussionP
aper|
Discussion
Paper
|D
iscussionP
aper|
Values for f (the fraction of nitrate+nitrite remaining) are calculated according to
f = ([NO3]+ [NO2])/([NO3]+ [NO3def]) (4)
where NO3def is the nitrate deficit calculated from the stoichiometric relationship es-tablished from Arabian Sea JGOFS data that accounts for a preformed nitrate deficit(Codispoti et al., 2001)5
NO3def =(
14.89 ·([
PO3−4
]−0.28
)−([
NO−3
]+[NO−
2
]+[NH+
4
]))·0.86 . (5)
The isotopic effect of assimilation can be obtained from the slope of the linear re-gression of ln(f ) against the δ15NNO3.substrate. This regression carried out for all δ15NNO3
from depths ≤ 100 m results in 15ε = 4.1 %� with a correlation coefficient of R2 = 0.89(n = 16). The calculated isotopic effect is slightly lower than the isotopic effect of1015ε ∼ 5.0 %� commonly assumed for assimilation (Sigman et al., 1999; Wada, 1980).Subsurface δ15NNO3
is about 8 %� (= δ15Ninitial.substrate).
Organic matter produced by assimilation should be depleted in 15N relative to thesubstrate following the calculation of the instantaneous product
δ15Ninst.product = δ15Nsubstrate−15ε . (6)15
The accumulated product should have a δ15N according to
δ15Nacc.product = δ15Ninitial.substrate+15ε{f/(1− f )} ln(f ) . (7)
We would expect the δ15NPN to be in the range of the instantaneous product rather thanthe accumulated product because we know from sediment trap studies that productivitysignals from surface water are transferred into the deep ocean (1000–3000 m) with a20
delay of only two weeks (Haake et al., 1996; Rixen et al., 2000).While δ15NNO3
in the mixed layer can be explained by Rayleigh fractionation during
assimilation, many of the measured δ15NPN do not plot close to the δ15Ninst.product of13331
BGD10, 13317–13352, 2013
Amino acidcomposition and
δ15N
B. Gaye et al.
Title Page
Abstract Introduction
Conclusions References
Tables Figures
J I
J I
Back Close
Full Screen / Esc
Printer-friendly Version
Interactive Discussion
Discussion
Paper
|D
iscussionP
aper|
Discussion
Paper
|D
iscussionP
aper|
Rayleigh fractionation (Fig. 6). Samples from the nitrate-depleted oligotrophic stations(lowest f ) are lower than the expected δ15Ninst.product. Samples with δ15NPN above the
δ15Ninst.product are from the upwelling areas and from depths in the lower euphotic zone.
There are several explanations feasible for the deviation of δ15NPN from the calcu-lated δ15Ninst.product. Under the oligotrophic late- to post-monsoon conditions along the5
northern transect and at the eastern locations the isotopic effect of assimilation maybe smaller than 15ε = 4 %� due to nutrient limitation. Uptake of regenerated ammoniummay also be significant and reduce the δ15NPN (Waser et al., 1998). The value forδ15Ninitial.substrate is possibly higher at the near coastal stations as upwelling from 150 mdepth would entrain water with a δ15NNO3
∼ 11 %�. Also, most of the assimilation may10
have taken place at shallower depths where the f ratio is lower.Although some of the expected patterns such as high δ15NPN at upwelling stations
are found, δ15NPN cannot be explained by Rayleigh assimilation, whereas the δ15NNO3
and also the δ15N of sinking particles fit the Rayleigh model (Fig. 6). As described inearlier studies, processes such as aggregation, disaggregation, consumption as well15
as vertical mixing processes complicate the interpretation of δ15N from SPM (Altabet,1988, 1989; Voss et al., 1996). In addition to possible reasons for a deviation of individ-ual samples described above, we believe that an important contribution to the observeddeviation of the δ15NPN from the Rayleigh model is the fact that SPM contains not onlyfresh plankton and aggregates, but also fine material with a very long residence time20
in the ocean. We know little about source and decomposition processes of the organicmatter in SPM. As SPM from the euphotic zone contains fresh plankton and aggregatesit includes the signal of the nitrogen source of plankton, especially when productivity ishigh.
Our highest δ15NPN from the two stations of active upwelling are elevated compared25
to the non-upwelling stations. A study from the spring intermonsoon period revealedthe influence of seasonal nitrogen fixation reducing δ15NPN to 4 %� in surface watersaround 10◦ N in the central Arabian Sea (Montoya and Voss, 2006). In contrast, deep
13332
BGD10, 13317–13352, 2013
Amino acidcomposition and
δ15N
B. Gaye et al.
Title Page
Abstract Introduction
Conclusions References
Tables Figures
J I
J I
Back Close
Full Screen / Esc
Printer-friendly Version
Interactive Discussion
Discussion
Paper
|D
iscussionP
aper|
Discussion
Paper
|D
iscussionP
aper|
δ15NPN as well as δ15NPN sampled under oligotrophic conditions appears to be domi-nated by organic matter attached to fine, probably, very slowly sinking mineral particles.This organic matter is amino acid rich with 30–50 % of POC and 50–85 % of total ni-trogen contributed by amino acids. We hypothesize that due to the long residence timeof fine particles in the ocean and their possible exchange with the more homogenous5
dissolved organic matter pool the regional differences in δ15NPN of deep SPM mustbe much smaller than that in surface SPM, sinking particles and underlying sediments.The differences observed between δ15NPN in the surface mixed layer and the sub-thermocline depths may be due to this difference in organic matter source (Altabet,1988, 1989; Altabet et al., 1999b; Montoya and Voss, 2006; Voss et al., 1996).10
4.4 Preservation of the δ15N signal of the nitrogen source in sediments
Our snapshot of surface SPM from the late SW-monsoonal upwelling off Oman pro-duced δ15NPN values of 8.7 and 9.2 % under active upwelling conditions derived froma δ15NNO3
source of ∼ 11 %�. This difference is due to the isotopic effect of assimilationand confirms that nutrients are not completely utilized in the upwelling areas, but are15
advected into the central Arabian Sea (Naqvi, 2008). Surface sediments from stations#944 and #945 had δ15N values of 9.4 and 8.8 %, respectively, which is remarkablyclose to the observed δ15NPN in surface waters. This is in line with the assumption thatslope sediments from the ODZ preserve the primary δ15N signal of the N source with-out a diagenetic enrichment (Altabet et al., 1999b; Möbius et al., 2011) and are thus20
very good sedimentary archives for the reconstruction of the upwelling and denitrifica-tion history. However, in contrast to the core denitrification zone in the northern andnorth eastern Arabian Sea where δ15NNO3
values at 150 m are enriched to > 20 %�(Gaye et al., 2013), the western Arabian Sea subsurface and upper ODZ waters areventilated by oxygen rich ICW as well as branches of the Persian Gulf and Red Sea Wa-25
ter (Morrison, 1997; Prasad et al., 2001). This inflow leads to locally depleted δ15NNO3
13333
BGD10, 13317–13352, 2013
Amino acidcomposition and
δ15N
B. Gaye et al.
Title Page
Abstract Introduction
Conclusions References
Tables Figures
J I
J I
Back Close
Full Screen / Esc
Printer-friendly Version
Interactive Discussion
Discussion
Paper
|D
iscussionP
aper|
Discussion
Paper
|D
iscussionP
aper|
values at the depths of upwelling source waters, probably due to nitrite reoxidation(Gaye et al., 2013).
5 Conclusions
SPM and sinking particles in deep waters of the Arabian Sea differ in their bulk andamino acid composition. Sinking particles are plankton-derived and exhibit progressive5
degradation by becoming depleted in plankton constituents and accumulating productsof bacterial degradation with increasing water depth. Surface SPM is basically a mix-ture of plankton-derived organic matter and organic matter with a typical SPM aminoacid spectrum.
The observed progressive change of SPM amino acid spectra with depth in our set10
of samples from the surface to a maximum depth of 450 m could be due to, both, adecreasing dilution with plankton derived organic matter or a progressive enrichmentof the AA characteristic of SPM. We suspect that the enrichment of Gly, Ser and Gluis not due to a preferential preservation of organic matter in cell-walls or frustules butrather to sorption or coagulation and attachment of dissolved organic matter to fine15
particles. The divergence of amino acid spectra of SPM and sinking particles withwater depth further suggests that the exchange between the two particle classes israther insignificant. This is also corroborated by the relatively small amount of organiccarbon in SPM in the Arabian Sea which is in the same order of magnitude as the totalexport production of one or two years.20
These findings have important implications for δ15NPN measurements of SPM. Sur-face SPM from stations with active upwelling has a δ15NPN signal of 8.7–9.2 %� derivedfrom nitrate with δ15NNO3
∼ 11 %� from about 150 m water depth. A similar δ15N signalis typical for sediments from the slope of the Oman upwelling area, so that we can as-sume to find ideal sites for a reconstruction of the upwelling and denitrification history.25
However, δ15NPN of SPM from oligotrophic sites and deeper waters do, most probably,not correspond with the nitrogen source, but are dominated by exchange processes
13334
BGD10, 13317–13352, 2013
Amino acidcomposition and
δ15N
B. Gaye et al.
Title Page
Abstract Introduction
Conclusions References
Tables Figures
J I
J I
Back Close
Full Screen / Esc
Printer-friendly Version
Interactive Discussion
Discussion
Paper
|D
iscussionP
aper|
Discussion
Paper
|D
iscussionP
aper|
with dissolved amino acids. We suggest that exchange with the dissolved pool couldbe an important process modulating organic matter on SPM. This suggested mecha-nism needs more detailed investigations and its role in the global cycling of elementsand their documentation in sediment records needs to be assessed.
Acknowledgements. We thank Udo Hübner for operating the CTD and water samplers as well5
as captain Uwe Pahl and crew of R/V Meteor (M 74-1b) for their excellent technical support.We are grateful to Marcel M. M. Kuypers for letting us use his deep sea pumps. Jürgen Möbiushelped with his suggestions and many discussions. Financial support for the Meteor cruisecame from the Deutsche Forschungsgemeinschaft (DFG Grant No. GA 755/4-1).
References10
Abramson, L., Lee, C., Liu, Z., Wakeham, S. G., and Szlosek, J.: Exchange between sus-pended and sinking particles in the northwest Mediterranean as inferred from the organiccomposition of in situ pump and sediment trap samples, Limnol. Oceanogr., 55, 725–739,2011.
Alldredge, A. L. and Silver, M. W.: Charateristics, dynamics and signficance of marine snow,15
Prog. Oceanogr., 20, 41–82, 1988.Alldredge, A. L., Cole, J. E., and Caron, D. A.: Production of heterotrophic bacteria inhabiting
macroscopic organic aggregates (marine snow) from surface waters, Limnol. Oceanogr., 31,68–78, 1986.
Altabet, M. A.: Variations in nitrogen isotopic composition between sinking and suspended20
particles: implications for nitrogen cycling and particle transformation in the open ocean,Deep-Sea Res., 35, 535–554, 1988.
Altabet, M. A.: A time-series study of the vertial structure of nitrogen and particle dynamics inthe Sargasso Sea, Limnol. Oceanogr., 34, 1185–1201, 1989.
Altabet, M., Murray, D., and Prell, W.: Climatically linked oscillations in Arabian Sea denitrifica-25
tion over the past 1 m.y.: implications for the marine N cycle, Paleoceanography, 14, 732–743, 1999a.
13335
BGD10, 13317–13352, 2013
Amino acidcomposition and
δ15N
B. Gaye et al.
Title Page
Abstract Introduction
Conclusions References
Tables Figures
J I
J I
Back Close
Full Screen / Esc
Printer-friendly Version
Interactive Discussion
Discussion
Paper
|D
iscussionP
aper|
Discussion
Paper
|D
iscussionP
aper|
Altabet, M. A., Pilskaln, C. H., Thunell, R.C., Pride, C., Sigman, D., Chavez, F., and Francois,R.: The nitrogen isotope biogeochemistry of sinking particles from the margin of the easternNorth Pacific, Deep-Sea Res. Pt. I, 46, 655–679, 1999b.
Arnarson, T. S. and Keil, R. G.: Influence of organic-mineral aggregates on microbial degrada-tion of the dinoflagellate Scrippsiella trochoidea, Geochim. Cosmochim. Ac., 69, 2111–2117,5
2005.Arnarson, T. S. and Keil, R. G.: Changes in organic matter-mineral interactions for marine
sediments with varying oxygen exposure times, Geochim. Cosmochim. Ac., 71, 3545–3556,2007.
Bishop, J. K. B., Schupack, D., Sherrell, R. M., and Conte, M.: A multiple-unit large-volume10
in situ filtration system for sampling oceanic particulate matter in mesoscale environments,in: Mapping Strategies in Chemical Oceanography, edited by: Zirino, A., American ChemicalSociety, 155–175, 1985.
Böning, P. and Bard, E.: Millenial/centennial-scale thermocline ventilation changes in the IndianOcean as reflected by aragonite preservation and geochemical variations in the Arabian Sea15
sediments, Geochim. Cosmochim. Ac., 73, 6771–6788, 2009.Brandes, J. A., Devol, A. H., Yoshinari, T., Jayakumar, D. A., and Naqvi, S. W. A.: Isotopic
composition of nitrate in the central Arabian Sea and eastern tropical North Pacific: a tracerfor mixing and nitrogen cycles, Limnol. Oceanogr., 43, 1680–1689, 1998.
Bulow, S. E., Rich, J. J., Naik, H. S., Pratihary, A. K., and Ward, B. B.: Denitrification exceeds20
anammox as a nitrogen loss pathway in the Arabian Sea oxygen minimum zone, Deep-SeaRes. Pt. I, 57, 384–393, 2010.
Carter, P. W.: Adsorption of amino acid-containing organic matter by calcite and quartz,Geochim. Cosmochim. Ac., 42, 1239–1242, 1978.
Carter, P. W. and Mitterer, R. M.: Amino acid composition of organic matter associated with25
carbonate and non-carbonate sediments, Geochim. Cosmochim. Ac., 42, 1231–1238, 1978.Casciotti, K. L., Sigman, D. M., Hastings, M. G., Böhlke, J. K., and Hilkert, A.: Measurement
of the oxygen isotopic composition of nitrate in seawater and freshwater using the denitrifiermethod, Anal. Chem., 74, 4905–4912, 2002.
Chin, W.-C., Orellana, M. V., and Verdugo, P.: Spontaneous assembly of marine dissolved or-30
ganic matter into polymer gels, Nature, 391, 568–572, 1998.Cline, J. D. and Kaplan, I. R.: Isotopic fractionation of dissolved nitrate during denitrification in
the eastern tropical North Pacific, Mar. Chem., 3, 271–299, 1975.
13336
BGD10, 13317–13352, 2013
Amino acidcomposition and
δ15N
B. Gaye et al.
Title Page
Abstract Introduction
Conclusions References
Tables Figures
J I
J I
Back Close
Full Screen / Esc
Printer-friendly Version
Interactive Discussion
Discussion
Paper
|D
iscussionP
aper|
Discussion
Paper
|D
iscussionP
aper|
Codispoti, L. A., Brandes, J. A., Christensen, J. P., Devol, A. H., Naqvi, S. W. A., Pearl, H. W.,and Yoshinari, T.: The oceanic fixed nitrogen and nitrous oxide budgets: moving targets aswe enter the anthropocene?, Sci. Mar., 65, 85–105, 2001.
Cowie, G. L. and Hedges, J. I.: Sources and reactivities of amino acids in a coastal marineenvironment, Limnol. Oceanogr., 37, 703–724, 1992.5
Cowie, G. L. and Hedges, J. I.: Biogeochemical indicators of diagenetic alteration in naturalorganic-matter mixtures, Nature, 369, 304–307, 1994.
Dauwe, B. and Middelburg, J. J.: Amino acids and hexosamines as indicators of organic matterdegradation state in North Sea sediments, Limnol. Oceanogr., 43, 782–798, 1998.
Dauwe, B., Middelburg, J. J., Hermann, P. M. J., and Heip, C. H. R.: Linking diagenetic alteration10
of amino acids and bulk organic matter reactivity, Limnol. Oceanogr., 44, 1809–1814, 1999.Degens, E. T. and Ittekkot, V.: The carbon cycle – tracking the path of organic particles from sea
to sediment, in: Marine Petroleum Source Rocks, edited by: Brooks, J. M. and Fleet, A. J.,Geological Society Special Publication, 122–135, 1987.
Fischer, J., Schott, F., and Stramma, L.: Currents and transport of the Great Whirl-Socotra15
Gyre system during the summer monsoon, August 1993, J. Geophys. Res., 101, 3573–3587,1996.
Gaye, B., Fahl, K., Kodina, L. A., Lahajnar, N., Nagel, B., Unger, D., and Gebhardt, C. A.:Particulate matter fluxes in the southern and central Kara Sea compared to sediments: bulkfluxes, amino acids, stable carbon and nitrogen isotopes, sterols and fatty acids, Cont. Shelf.20
Res., 27, 2570–2594, 2007.Gaye, B., Nagel, B., Dähnke, K., Rixen, T., and Emeis, K.: Evidence of parallel denitrification
and nitrite oxidation in the ODZ of the Arabian Sea from paired stable isotopes of nitrate andnitrite, Global Biogeochem. Cy., submitted, 2013.
Gaye-Haake, B., Lahajnar, N., Emeis, K.-Ch., Unger, D., Rixen, T., Suthhof, A., Ramaswamy,25
V., Schulz, H., Paropkari, A. L., Guptha, M. V. S., and Ittekkot, V.: Stable nitrogen isotopicratios of sinking particles and sediments from the northern Indian Ocean, Mar. Chem., 96,243–255, 2005.
Goutx, M., Wakeham, S. G., Lee, C., Duflos, M., Guigue, C., Liu, Zhanfei, Moriceau, B., Sem-pére, R., Tedetti, M., and Xue, J.: Composition and degradation of marine particles with30
different settling velocities in the northwestern Mediterranean Sea, Limnol. Oceanogr., 52,1645–1664, 2007.
13337
BGD10, 13317–13352, 2013
Amino acidcomposition and
δ15N
B. Gaye et al.
Title Page
Abstract Introduction
Conclusions References
Tables Figures
J I
J I
Back Close
Full Screen / Esc
Printer-friendly Version
Interactive Discussion
Discussion
Paper
|D
iscussionP
aper|
Discussion
Paper
|D
iscussionP
aper|
Gruber, N.: The marine nitrogen cycle: overview and challenges, in: Nitrogen in the MarineEnvironment, 2nd edn., edited by: Capone, D. G., Bronk, D. A., Mulholland, M. R., and Car-penter, E., Academic Press, San Diego, 1–50, 2008.
Gruber, N. and Sarmiento, J. L.: Global patterns of marine nitrogen fixation and denitrification,Global Biogeochem. Cy., 11, 235–266, 1997.5
Haake, B., Ittekkot, V., Ramaswamy, V., Nair, R. R., and Honjo, S.: Fluxes of amino acids andhexosamines of the deep Arabian Sea, Mar. Chem., 40, 291–314, 1992.
Haake, B., Ittekkot, V., Honjo, S., and Manganini, S.: Amino acids, hexosamines and carbo-hydrate fluxes to the deep Subarctic Pacific (Station P), Deep-Sea Res. Pt. I, 40, 547–560,1993a.10
Haake, B., Ittekkot, V., Rixen, T., Ramaswamy, V., Nair, R. R., and Curry, W. B.: Seasonality andinterannual variability of particle fluxes to the deep Arabian Sea, Deep-Sea Res. Pt. I, 40,1323–1344, 1993b.
Haake, B., Rixen, T., Reemtsma, T., Ramaswamy, V., and Ittekkot, V.: Processes determiningseasonality and interannual variability of settling particle fluxes to the deep Arabian Sea, in:15
Particle Flux in the Ocean, edited by: Ittekkot, V., Schäfer, P., Honjo, S., and Depetris, P. J.,John Wiley & Sons Ltd., 251–270, 1996.
Hecky, R. E., Mopper, K., Kilham, P., and Degens, E. T.: The amino acid and sugar compositionof diatom cell-walls, Mar. Biol., 19, 323–331, 1973.
Hedges, J. I. and Hare, P. E.: Amino acid adsorption by clay minerals in distilled water, Geochim.20
Cosmochim. Ac., 51, 255–259, 1987.Ingalls, A. E., Lee, C., and Druffel, E. R. M.: Preservation of organic matter in mound-forming
coral skeletons, Geochim. Cosmochim. Ac., 67, 2827–2841, 2003.Ingalls, A. E., Liu, Z., and Lee, C.: Seasonal trends in the pigment and amino acid compositions
of sinking particles in biogenic CaCO3 and SiO2 dominated regions of the Pacific sector of25
the southern Ocean along 170◦ W, Deep-Sea Res. Pt. I, 53, 836–859, 2006.Ittekkot, V., Degens, E. T., and Honjo, S.: Seasonality in the fluxes of sugars, amino acids, and
amino sugars to the deep ocean: Panama Basin, Deep-Sea Res., 31, 1071–1083, 1984a.Ittekkot, V., Deuser, W. G., and Degens, E. T.: Seasonality in the fluxes of sugars, amino
acids, and amino sugars to the deep ocean: Sargasso Sea, Deep-Sea Res., 31, 1057–1069,30
1984b.
13338
BGD10, 13317–13352, 2013
Amino acidcomposition and
δ15N
B. Gaye et al.
Title Page
Abstract Introduction
Conclusions References
Tables Figures
J I
J I
Back Close
Full Screen / Esc
Printer-friendly Version
Interactive Discussion
Discussion
Paper
|D
iscussionP
aper|
Discussion
Paper
|D
iscussionP
aper|
Jennerjahn, T. and Ittekkot, V.: Organic matter in sediments in the mangrove areas and adjacentcontinental margins of Brazil: I. Amino acids and hexosamines, Oceanol. Acta, 20, 359–369,1997.
Keil, R. G., Montlucon, D. B., Prahl, F. G., and Hedges, J. I.: Sorptive preservation of labileorganic-matter in marine-sediments, Nature, 370, 549–552, 1994.5
Klaas, C. and Archer, D. E.: Association of sinking organic matter with various types of mineralballast in the deep sea: implications for the rain ratio, Global Biogeochem. Cy., 16, 1116,doi:10.1029/2001GB001765, 2002.
Lee, C.: Amino acids and amine biogeochemistry in marine particulate material and sedi-ments, in: Nitrogen Cycling in Coastal Marine Environments, edited by: Blackburn, T. H.10
and Sörensen, J., SCOPE, Wiley and Sons, 125–141, 1988.Lee, C. and Cronin, C.: The vertical flux of particulate organic nitrogen in the sea: decomposi-
tion of amino acids in the Peru upwelling area and the equatorial Atlantic, J. Mar. Res., 40,227–251, 1982.
Lee, C. and Cronin, C.: Particulate amino acids in the sea: effects of primary productivity and15
biological decomposition, J. Mar. Res., 42, 1075–1097, 1984.Lee, C., Wakeham, S. G., and Farrington, J. W.: Variations in the composition of particulate
organic matter in a time-series sediment trap, Mar. Chem., 13, 181–194, 1983.Lee, C., Murray, D. W., Barber, T. T., Buesseler, K. O., Dymond, J., Hedges, J. I., Honjo, S.,
Manganini, S.J., Marra, J., Moser, C., Peterson, M. L., Prell, W. L., and Wakeham, S. G.:20
Particulate organic carbon fluxes: compilation of results from the 1995 US JGOFS ArabianSea Process study, Deep-Sea Res. Pt. II, 45, 2489–2501, 1998.
Lee, C., Wakeham, S. G., and Hedges, J. I.: Composition and flux of particulate amino acidsand chloropigments in equatorial Pacific seawater and sediments, Deep-Sea Res. Pt. I, 47,1535–1568, 2000.25
Lomstein, B. A., Jorgensen, B. B., Schubert, C. J., and Niggemann, J.: Amino acid biogeo- andstereochemistry in coastal Chilean sediments, Geochim. Cosmochim. Ac., 70, 2970–2989,2006.
Mantoura, R. F. C., Law, C. S., Owens, N. J. P., Burkill, P. H., Woodward, E. M. S., Howland, R.J. M., and Llewellyn, C. A.: Nitrogen geochemical cycling in the northwestern Indian Ocean,30
Deep-Sea Res. Pt. II, 40, 651–671, 1993.
13339
BGD10, 13317–13352, 2013
Amino acidcomposition and
δ15N
B. Gaye et al.
Title Page
Abstract Introduction
Conclusions References
Tables Figures
J I
J I
Back Close
Full Screen / Esc
Printer-friendly Version
Interactive Discussion
Discussion
Paper
|D
iscussionP
aper|
Discussion
Paper
|D
iscussionP
aper|
Mariotti, A., Germon, J. C., Hubert, P., Kaiser, P., Letolle, R., Tardieux, A., and Tardieux, P.: Ex-perimental determination of nitrogen kinetic isotope fractionation: some principles; illustrationfor the denitrification and nitrification processes, Plant Soil, 62, 413–430, 1981.
Mayer, L. M.: Extent of coverage of mineral surfaces by organic matter in marine sediments,Geochim. Cosmochim. Ac., 63, 207–215, 1999.5
McCarthy, M. D., Pratum, T., Hedges, J. I., and Benner, R.: Chemical composition of dissolvedorganic nitrogen in the ocean, Nature, 390, 150–154, 1997.
McCarthy, M. D., Benner, R., Lee, C., Hedges, J. I., and Fogel, M. L.: Amino acid carbon isotopicfractionation patterns in oceanic dissolved organic matter: an unaltered photoautotrophicsource for dissolved organic nitrogen in the ocean?, Mar. Chem., 92, 123–134, 2004.10
McCave, I. N.: Size spectra and aggregation of suspended particles in the ocean, Deep-SeaRes., 31, 329–352, 1984.
McDonnell, A. M. P. and Buesseler, K. O.: Variability in the average sinking velocity of marineparticles, Limnol. Oceanogr., 55, 2085–2096, 2010.
Menzel, P., Gaye, B., Wiesner, M. G., Prasad, S., Stebich, M., Das, B. K., Anoop, A., Riedel, N.,15
and Basavaiah, N.: Influence of bottom water anoxia on nitrogen isotopic ratios and aminoacid contributions of recent sediments from small eutrophic Lonar Lake, Central India, Lim-nol. Oceanogr., 58, 1061–1074, 2013.
Möbius, J., Lahajnar, N., and Emeis, K.-C.: Diagenetic control of nitrogen isotope ratios inHolocene sapropels and recent sediments from the Eastern Mediterranean Sea, Biogeo-20
sciences, 7, 3901–3914, doi:10.5194/bg-7-3901-2010, 2010.Möbius, J., Gaye, B., Lahajnar, N., Bahlmann, E., and Emeis, K.-C.: Influence of diagenesis
on sedimentary δ15N in the Arabian Sea over the last 130 kyr, Mar. Geol., 284, 127–138,doi:10.1016/j.margeo.2011.03.013, 2011.
Montoya, J. P. and Voss, M.: Nitrogen cycling in suboxic waters: isotopic signatures of nitrogen25
transformation in the Arabian Sea oxygen minimum zone, in: Past and Present Water ColumnAnoxia, edited by: Neretin, L. N., Springer, Amsterdam, 259–281, 2006.
Morrison, J. M.: Inter-monsoonal changes in the T-S properties of the near-surface waters ofthe northern Arabian Sea, Geophys. Res. Lett., 24, 2553–2556, 1997.
Morrison, J. M., Codispoti, L. A., Gaurin, S., Jones, B., Manghnani, V., and Zheng, Z.: Seasonal30
variations of hydrographic and nutrient fields during the US JGOFS Arabian Sea ProcessStudy, Deep-Sea Res. Pt. II, 45, 2053–2101, 1998.
13340
BGD10, 13317–13352, 2013
Amino acidcomposition and
δ15N
B. Gaye et al.
Title Page
Abstract Introduction
Conclusions References
Tables Figures
J I
J I
Back Close
Full Screen / Esc
Printer-friendly Version
Interactive Discussion
Discussion
Paper
|D
iscussionP
aper|
Discussion
Paper
|D
iscussionP
aper|
Müller, P. J., Suess, E., and Ungerer, C. A.: Amino acids and amino sugars of surface particulateand sediment trap material from waters of the Scotia Sea, Deep-Sea Res., 33, 819–838,1986.
Naqvi, S. W. A.: Some aspects of the oxygen-deficient conditions and denitrification in theArabian Sea, J. Mar. Res., 45, 1049–1072, 1987.5
Naqvi, W. A.: Geographical extent of denitrification in the Arabian Sea in relation to somephysical processes, Oceanol. Acta, 14, 281–290, 1991.
Naqvi, S. W. A.: The Indian Ocean, in: Nitrogen in the Marine Environment, edited by:Capone, D. G., Bronk, D. A., Mulholland, M. R., and Carpenter, E. J., Elsevier, Amsterdam,the Netherlands, 631–681, 2008.10
Naqvi, S. W. A., Naik, H., Jayakumar, D. A., Shailaja, M. S., and Narvekar, P. V.: Seasonal oxy-gen deficiency over the western continental shelf of India, in: Past and Present Water ColumnAnoxia, NATO Science Series, edited by: Neretin, L. N., Jorgensen, B. B., and Murray, J. W.,Kluwer-Springer, 2005.
Olson, D. B., Hitchcock, G. L., Fine, R. A., and Warren, B. A.: Maintenance of the low-oxygen15
layer in the central Arabian Sea, Deep-Sea Res. Pt. II, 40, 673–685, 1993.Pantoja, S., Sepúlveda, J., and Gonzálvez, H. E.: Decomposition of sinking proteinaceous ma-
terial during fall in the oxygen minimum zone off northern Chile, Deep-Sea Res. Pt. I, 51,55–70, 2004.
Pilskaln, C. H. and Honjo, S.: The fecal pellet fraction of biogeochemical particle fluxes to the20
deep sea, Global Biogeochem. Cy., 1, 31–48, 1987.Prasad, T. G., Ikeda, M., and Kumar, S. P.: Seasonal spreading of the Persian Gulf water mass
in the Arabian Sea, J. Geophys. Res., 106, 17059–17071, 2001.Ramaswamy, V., Nair, R. R., Manganini, S., Haake, B., and Ittekkot, V.: Lithogenic fluxes to the
deep Arabian Sea measured by sediment traps, Deep-Sea Res. Pt. I, 38, 169–184, 1991.25
Rixen, T., Haake, B., and Ittekkot, V.: Sedimentation in the western Arabian Sea: the role ofwater mass advection, coastal and open ocean upwelling, Deep-Sea Res. Pt. II, 47, 2155–2178, 2000.
Rixen, T., Guptha, M. V. S., and Ittekkot, V.: Deep ocean fluxes and their link to surface oceanprocesses and the biological pump, Prog. Oceanogr., 65, 240–259, 2005.30
Rixen, T., Ramaswamy, V., Gaye, B., Herunadi, B., Maier-Reimer, E., Bange, H. W., and Ittekkot,V.: Monsoonal and ENSO impacts on particle fluxes and the biological pump in the Indian
13341
BGD10, 13317–13352, 2013
Amino acidcomposition and
δ15N
B. Gaye et al.
Title Page
Abstract Introduction
Conclusions References
Tables Figures
J I
J I
Back Close
Full Screen / Esc
Printer-friendly Version
Interactive Discussion
Discussion
Paper
|D
iscussionP
aper|
Discussion
Paper
|D
iscussionP
aper|
Ocean, in: Geophysical Monograph American Geophysical Union, edited by: Wiggert, J. D.,Hood, R. R., Naqvi, S. W. A., Brink, K. H., and Smith, S. L., Washington DC, 365–383, 2009.
Rixen, T., Baum, A., Gaye, B., Nagel, B.: Seasonal and interannual variations of the denitrifyingzone in the Arabian Sea, Biogeosciences Discuss., submitted, 2013.
Rontani, J.-F., Zabeti, N., and Wakeham, S. G.: Degradation of particulate organic matter in the5
equatorial Pacific Ocean: biotic or abiotic?, Limnol. Oceanogr., 56, 333–349, 2011.Salter, I., Kemp, A. E. S., Lampitt, R. S., and Gledhill, M.: The association between biogenic and
inorganic minerals and the amino acid composition of settling particles, Limnol. Oceanogr.,55, 2207–2218, 2010.
Satterberg, J., Arnarson, T. S., Lessard, E. J., and Keil, R. G.: Sorption of organic matter from10
four phytoplankton species to montmorillonite, chlorite and kaolinite in seawater, Mar. Chem.,81, 11–18, 2003.
Schäfer, P. and Ittekkot, V.: Seasonal variability of δ15N in settling particles in the Arabian Seaand its palaeochemical significance, Naturwissenschaften, 80, 511–513, 1993.
Schäfer, P. and Ittekkot, V.: Isotope biogeochemistry of nitrogen in the northern Indian Ocean,15
Mitt. Geol.-Paläont. Inst. Univ. Hamburg, 78, 67–93, 1995.Sheridan, C. C., Lee, C., Wakeham, S. G., and Bishop, J. K. B.: Suspended particle organic
composition and cycling in surface and midwaters of the equatorial Pacific Ocean, Deep-SeaRes. Pt. I, 49, 1983–2008, 2002.
Sigman, D. M., Altabet, M. A., McCorkle, D. C., Francois, R., and Fischer, G.: The δ15N of20
nitrate in the Southern Ocean: consumption of nitrate in surface waters, Global Biogeochem.Cy., 13, 1149–1166, 1999.
Sigman, D. M., Altabet, M. A., McCorkle, D. C., Francois, R., and Fischer, G.: The δ15N of nitratein the Southern Ocean: nitrogen cycling and circulation in the ocean interior, J. Geophys.Res., 105, 19599–19614, 2000.25
Sigman, D. M., Casciotti, K. L., Andreani, M., Barford, C., Galanter, M., and Bohlke, J. K.: Abacterial method for the nitrogen isotopic analysis of nitrate in seawater and freshwater,Anal. Chem., 73, 4145–4153, 2001.
Silver, M. W., Coale, S. L., Pilskaln, C. H., and Steinberg, D. R.: Giant aggreagates: importanceas microbial centers and agents of material flux in the mesopelagic zone, Limnol. Oceanogr.,30
43, 498–507, 1998.Taylor, G. T.: Microbial degradation of sorbed and dissolved protein in seawater, Limnol.
Oceanogr., 40, 875–885, 1995.
13342
BGD10, 13317–13352, 2013
Amino acidcomposition and
δ15N
B. Gaye et al.
Title Page
Abstract Introduction
Conclusions References
Tables Figures
J I
J I
Back Close
Full Screen / Esc
Printer-friendly Version
Interactive Discussion
Discussion
Paper
|D
iscussionP
aper|
Discussion
Paper
|D
iscussionP
aper|
Unger, D., Gaye-Haake, B., Gebhardt, A. C., and Ittekkot, V.: Biogeochemistry of suspendedand sedimentary material from the Ob and Yenisei rivers and the adjacent Kara Sea: aminoacids and amino sugars, Cont. Shelf. Res., 25, 437–460, 2005.
Voss, M., Altabet, M. A., and Bodungen, B. V.: δ15N in sedimenting particles as indicator ofeuphotic-zone processes, Deep-Sea Res., 43, 33–47, 1996.5
Wada, E.: Nitrogen isotope fractionation and its significance in biogeochemical processes oc-curing in marine environments, in: Isotope Marine Chemistry (Uchida Rokakuho), edited by:Goldberg, E. D., Horibe, Y., and Saruhashi, K., Tokyo, 375–398, 1980.
Wakeham, S. G. and Canuel, E. A.: Organic geochemistry of particulate matter in the easterntropical North Pacific: implications for particle dynamics, J. Mar. Res., 46, 183–213, 1988.10
Ward, B. B., Devol, A. H., Rich, J. J., Chang, B. X., Bulow, S. E., Naik, H., Pratihary, A., andJayakumar, A.: Denitrification as the dominant nitrogen loss process in the Arabian Sea,Nature, 461, 78–81, 2009.
Waser, N. A. D., Harrison, P. J., Nielsen, B., Calvert, S. E., and Turpin, D. H.: Nitrogen isotopefractionation during the uptake and assimilation of nitrate, nitrite, ammonium, and urea by a15
marine diatom, Limnol. Oceanogr., 43, 215–224, 1998.Wiggert, J. D., Hood, R. R., Banse, K., and Kindle, J. C.: Monsoon-driven biogeochemical
processes in the Arabian Sea, Prog. Oceanogr., 65, 176–213, 2005.Woodward, E. M. S., Rees, A. P., and Stephens, J. A.: The influence of the south-west monsoon
upon the nutrient biogeochemistry of the Arabian Sea, Deep-Sea Res. Pt. II, 46, 571–591,20
1999.Yoshinari, T., Altabet, M. A., Naqvi, W. A., Codispoti, L. A., Jayakumar, D. A., Kuhland, M.,
and Devol, A. H.: Nitrogen and oxygen isotopic composition of N2O from suboxic waters ofthe eastern tropical North Pacific and the Arabian Sea – measurement by continuous-flowisotope-ratio monitoring, Mar. Chem., 56, 253–264, 1997.25
13343
BGD10, 13317–13352, 2013
Amino acidcomposition and
δ15N
B. Gaye et al.
Title Page
Abstract Introduction
Conclusions References
Tables Figures
J I
J I
Back Close
Full Screen / Esc
Printer-friendly Version
Interactive Discussion
Discussion
Paper
|D
iscussionP
aper|
Discussion
Paper
|D
iscussionP
aper|
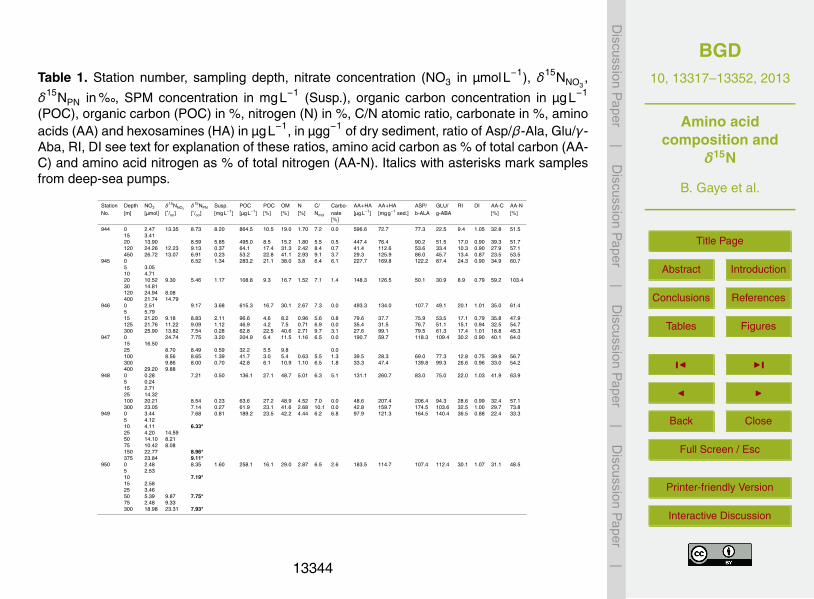
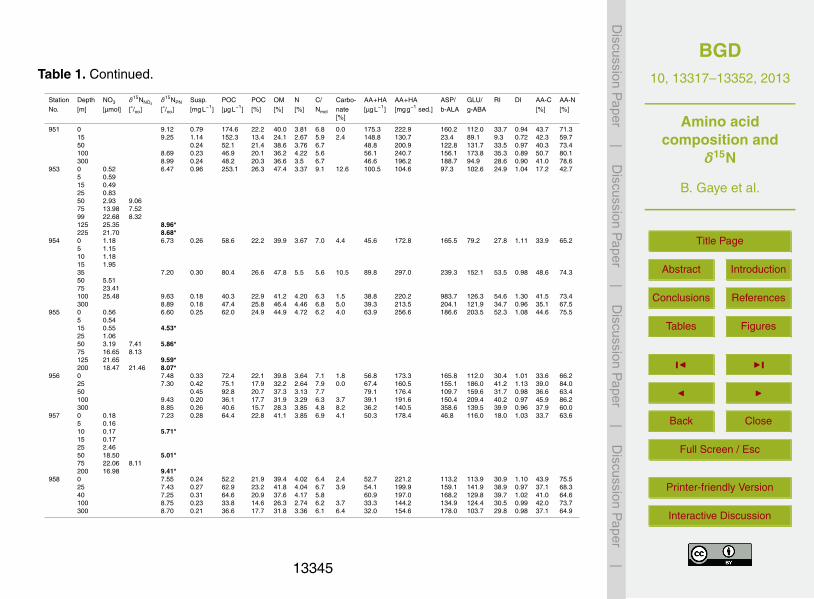
Table 1. Station number, sampling depth, nitrate concentration (NO3 in µmolL−1), δ15NNO3,
δ15NPN in %�, SPM concentration in mgL−1 (Susp.), organic carbon concentration in µgL−1
(POC), organic carbon (POC) in %, nitrogen (N) in %, C/N atomic ratio, carbonate in %, aminoacids (AA) and hexosamines (HA) in µgL−1, in µgg−1 of dry sediment, ratio of Asp/β-Ala, Glu/γ-Aba, RI, DI see text for explanation of these ratios, amino acid carbon as % of total carbon (AA-C) and amino acid nitrogen as % of total nitrogen (AA-N). Italics with asterisks mark samplesfrom deep-sea pumps.
Station Depth NO3 δ15NNO3δ15NPN Susp. POC POC OM N C/ Carbo- AA+HA AA+HA ASP/ GLU/ RI DI AA-C AA-N
No. [m] [µmol] [◦/oo] [◦/oo] [mgL−1] [µgL−1] [%] [%] [%] Nmol nate [µgL−1] [mgg−1 sed.] b-ALA g-ABA [%] [%][%]
944 0 2.47 13.35 8.73 8.20 864.5 10.5 19.0 1.70 7.2 0.0 596.6 72.7 77.3 22.5 9.4 1.05 32.8 51.515 3.4120 13.90 8.59 5.85 495.0 8.5 15.2 1.80 5.5 0.5 447.4 76.4 90.2 51.5 17.0 0.90 39.3 51.7120 24.26 12.23 9.13 0.37 64.1 17.4 31.3 2.42 8.4 0.7 41.4 112.6 53.6 33.4 10.3 0.90 27.9 57.1450 26.72 13.07 6.91 0.23 53.2 22.8 41.1 2.93 9.1 3.7 29.3 125.9 86.0 45.7 13.4 0.87 23.5 53.5
945 0 6.52 1.34 283.2 21.1 38.0 3.8 6.4 6.1 227.7 169.8 122.2 87.4 24.3 0.90 34.9 60.75 3.0510 4.7120 10.52 9.30 5.46 1.17 108.8 9.3 16.7 1.52 7.1 1.4 148.3 126.5 50.1 30.9 8.9 0.79 59.2 103.430 14.81120 24.94 8.08400 21.74 14.79
946 0 2.51 9.17 3.68 615.3 16.7 30.1 2.67 7.3 0.0 493.3 134.0 107.7 49.1 20.1 1.01 35.0 61.45 5.7915 21.20 9.18 8.83 2.11 96.6 4.6 8.2 0.96 5.6 0.8 79.6 37.7 75.9 53.5 17.1 0.79 35.8 47.9125 21.76 11.22 9.09 1.12 46.9 4.2 7.5 0.71 6.9 0.0 35.4 31.5 76.7 51.1 15.1 0.94 32.5 54.7300 25.90 13.82 7.54 0.28 62.8 22.5 40.6 2.71 9.7 3.1 27.6 99.1 79.5 61.3 17.4 1.01 18.8 45.3
947 0 24.74 7.75 3.20 204.9 6.4 11.5 1.16 6.5 0.0 190.7 59.7 118.3 109.4 30.2 0.90 40.1 64.015 16.5025 8.70 8.49 0.59 32.2 5.5 9.8 0.0100 8.56 8.65 1.39 41.7 3.0 5.4 0.63 5.5 1.3 39.5 28.3 69.0 77.3 12.8 0.75 39.9 56.7300 9.86 8.00 0.70 42.8 6.1 10.9 1.10 6.5 1.8 33.3 47.4 139.8 99.3 26.6 0.96 33.0 54.2400 29.20 9.88
948 0 0.28 7.21 0.50 136.1 27.1 48.7 5.01 6.3 5.1 131.1 260.7 83.0 75.0 22.0 1.03 41.9 63.95 0.2415 2.7125 14.32100 20.21 8.54 0.23 63.6 27.2 48.9 4.52 7.0 0.0 48.6 207.4 206.4 94.3 28.6 0.99 32.4 57.1300 23.05 7.14 0.27 61.9 23.1 41.6 2.68 10.1 0.0 42.8 159.7 174.5 103.6 32.5 1.00 29.7 73.8
949 0 3.44 7.68 0.81 189.2 23.5 42.2 4.44 6.2 6.8 97.9 121.3 164.5 140.4 36.5 0.88 22.4 33.35 4.1210 4.11 6.33*25 4.20 14.5950 14.10 8.2175 10.42 8.08150 22.77 8.96*375 23.84 9.11*
950 0 2.48 8.35 1.60 258.1 16.1 29.0 2.87 6.5 2.6 183.5 114.7 107.4 112.4 30.1 1.07 31.1 48.55 2.5310 7.19*15 2.5825 3.4650 5.39 9.87 7.75*75 2.48 9.33300 18.98 23.31 7.93*
13344
BGD10, 13317–13352, 2013
Amino acidcomposition and
δ15N
B. Gaye et al.
Title Page
Abstract Introduction
Conclusions References
Tables Figures
J I
J I
Back Close
Full Screen / Esc
Printer-friendly Version
Interactive Discussion
Discussion
Paper
|D
iscussionP
aper|
Discussion
Paper
|D
iscussionP
aper|
Table 1. Continued.
Station Depth NO3 δ15NNO3δ15NPN Susp. POC POC OM N C/ Carbo- AA+HA AA+HA ASP/ GLU/ RI DI AA-C AA-N
No. [m] [µmol] [◦/oo] [◦/oo] [mgL−1] [µgL−1] [%] [%] [%] Nmol nate [µgL−1] [mgg−1 sed.] b-ALA g-ABA [%] [%][%]
951 0 9.12 0.79 174.6 22.2 40.0 3.81 6.8 0.0 175.3 222.9 160.2 112.0 33.7 0.94 43.7 71.315 9.25 1.14 152.3 13.4 24.1 2.67 5.9 2.4 148.8 130.7 23.4 89.1 9.3 0.72 42.3 59.750 0.24 52.1 21.4 38.6 3.76 6.7 48.8 200.9 122.8 131.7 33.5 0.97 40.3 73.4100 8.69 0.23 46.9 20.1 36.2 4.22 5.6 56.1 240.7 156.1 173.8 35.3 0.89 50.7 80.1300 8.99 0.24 48.2 20.3 36.6 3.5 6.7 46.6 196.2 188.7 94.9 28.6 0.90 41.0 78.6
953 0 0.52 6.47 0.96 253.1 26.3 47.4 3.37 9.1 12.6 100.5 104.6 97.3 102.6 24.9 1.04 17.2 42.75 0.5915 0.4925 0.8350 2.93 9.0675 13.98 7.5299 22.68 8.32125 25.35 8.96*225 21.70 8.68*
954 0 1.18 6.73 0.26 58.6 22.2 39.9 3.67 7.0 4.4 45.6 172.8 165.5 79.2 27.8 1.11 33.9 65.25 1.1510 1.1815 1.9535 7.20 0.30 80.4 26.6 47.8 5.5 5.6 10.5 89.8 297.0 239.3 152.1 53.5 0.98 48.6 74.350 5.5175 23.41100 25.48 9.63 0.18 40.3 22.9 41.2 4.20 6.3 1.5 38.8 220.2 983.7 126.3 54.6 1.30 41.5 73.4300 8.89 0.18 47.4 25.8 46.4 4.46 6.8 5.0 39.3 213.5 204.1 121.9 34.7 0.96 35.1 67.5
955 0 0.56 6.60 0.25 62.0 24.9 44.9 4.72 6.2 4.0 63.9 256.6 186.6 203.5 52.3 1.08 44.6 75.55 0.5415 0.55 4.53*25 1.0650 3.19 7.41 5.86*75 16.65 8.13125 21.65 9.59*200 18.47 21.46 8.07*
956 0 7.48 0.33 72.4 22.1 39.8 3.64 7.1 1.8 56.8 173.3 165.8 112.0 30.4 1.01 33.6 66.225 7.30 0.42 75.1 17.9 32.2 2.64 7.9 0.0 67.4 160.5 155.1 186.0 41.2 1.13 39.0 84.050 0.45 92.8 20.7 37.3 3.13 7.7 79.1 176.4 109.7 159.6 31.7 0.98 36.6 63.4100 9.43 0.20 36.1 17.7 31.9 3.29 6.3 3.7 39.1 191.6 150.4 209.4 40.2 0.97 45.9 86.2300 8.85 0.26 40.6 15.7 28.3 3.85 4.8 8.2 36.2 140.5 358.6 139.5 39.9 0.96 37.9 60.0
957 0 0.18 7.23 0.28 64.4 22.8 41.1 3.85 6.9 4.1 50.3 178.4 46.8 116.0 18.0 1.03 33.7 63.65 0.1610 0.17 5.71*15 0.1725 2.4650 18.50 5.01*75 22.06 8.11200 16.98 9.41*
958 0 7.55 0.24 52.2 21.9 39.4 4.02 6.4 2.4 52.7 221.2 113.2 113.9 30.9 1.10 43.9 75.525 7.43 0.27 62.9 23.2 41.8 4.04 6.7 3.9 54.1 199.9 159.1 141.9 38.9 0.97 37.1 68.340 7.25 0.31 64.6 20.9 37.6 4.17 5.8 60.9 197.0 168.2 129.8 39.7 1.02 41.0 64.6100 8.75 0.23 33.8 14.6 26.3 2.74 6.2 3.7 33.3 144.2 134.9 124.4 30.5 0.99 42.0 73.7300 8.70 0.21 36.6 17.7 31.8 3.36 6.1 6.4 32.0 154.6 178.0 103.7 29.8 0.98 37.1 64.9
13345
BGD10, 13317–13352, 2013
Amino acidcomposition and
δ15N
B. Gaye et al.
Title Page
Abstract Introduction
Conclusions References
Tables Figures
J I
J I
Back Close
Full Screen / Esc
Printer-friendly Version
Interactive Discussion
Discussion
Paper
|D
iscussionP
aper|
Discussion
Paper
|D
iscussionP
aper|
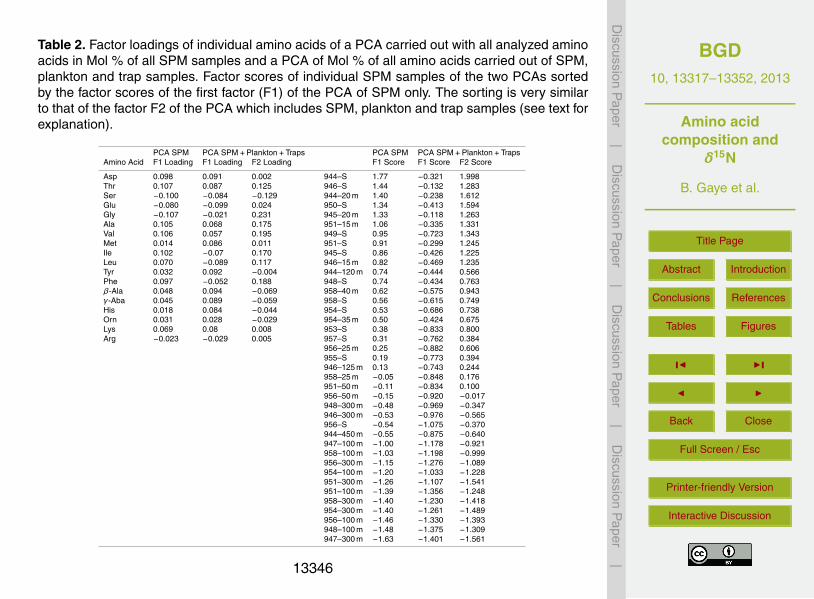
Table 2. Factor loadings of individual amino acids of a PCA carried out with all analyzed aminoacids in Mol % of all SPM samples and a PCA of Mol % of all amino acids carried out of SPM,plankton and trap samples. Factor scores of individual SPM samples of the two PCAs sortedby the factor scores of the first factor (F1) of the PCA of SPM only. The sorting is very similarto that of the factor F2 of the PCA which includes SPM, plankton and trap samples (see text forexplanation).
PCA SPM PCA SPM+Plankton+Traps PCA SPM PCA SPM+Plankton+TrapsAmino Acid F1 Loading F1 Loading F2 Loading F1 Score F1 Score F2 Score
Asp 0.098 0.091 0.002 944–S 1.77 −0.321 1.998Thr 0.107 0.087 0.125 946–S 1.44 −0.132 1.283Ser −0.100 −0.084 −0.129 944–20 m 1.40 −0.238 1.612Glu −0.080 −0.099 0.024 950–S 1.34 −0.413 1.594Gly −0.107 −0.021 0.231 945–20 m 1.33 −0.118 1.263Ala 0.105 0.068 0.175 951–15 m 1.06 −0.335 1.331Val 0.106 0.057 0.195 949–S 0.95 −0.723 1.343Met 0.014 0.086 0.011 951–S 0.91 −0.299 1.245Ile 0.102 −0.07 0.170 945–S 0.86 −0.426 1.225Leu 0.070 −0.089 0.117 946–15 m 0.82 −0.469 1.235Tyr 0.032 0.092 −0.004 944–120 m 0.74 −0.444 0.566Phe 0.097 −0.052 0.188 948–S 0.74 −0.434 0.763β-Ala 0.048 0.094 −0.069 958–40 m 0.62 −0.575 0.943γ-Aba 0.045 0.089 −0.059 958–S 0.56 −0.615 0.749His 0.018 0.084 −0.044 954–S 0.53 −0.686 0.738Orn 0.031 0.028 −0.029 954–35 m 0.50 −0.424 0.675Lys 0.069 0.08 0.008 953–S 0.38 −0.833 0.800Arg −0.023 −0.029 0.005 957–S 0.31 −0.762 0.384
956–25 m 0.25 −0.882 0.606955–S 0.19 −0.773 0.394946–125 m 0.13 −0.743 0.244958–25 m −0.05 −0.848 0.176951–50 m −0.11 −0.834 0.100956–50 m −0.15 −0.920 −0.017948–300 m −0.48 −0.969 −0.347946–300 m −0.53 −0.976 −0.565956–S −0.54 −1.075 −0.370944–450 m −0.55 −0.875 −0.640947–100 m −1.00 −1.178 −0.921958–100 m −1.03 −1.198 −0.999956–300 m −1.15 −1.276 −1.089954–100 m −1.20 −1.033 −1.228951–300 m −1.26 −1.107 −1.541951–100 m −1.39 −1.356 −1.248958–300 m −1.40 −1.230 −1.418954–300 m −1.40 −1.261 −1.489956–100 m −1.46 −1.330 −1.393948–100 m −1.48 −1.375 −1.309947–300 m −1.63 −1.401 −1.561
13346
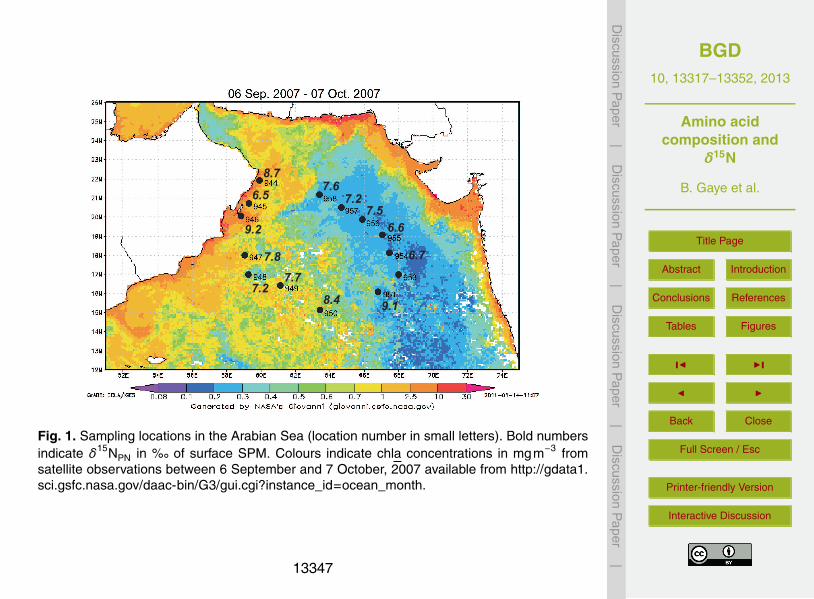
BGD10, 13317–13352, 2013
Amino acidcomposition and
δ15N
B. Gaye et al.
Title Page
Abstract Introduction
Conclusions References
Tables Figures
J I
J I
Back Close
Full Screen / Esc
Printer-friendly Version
Interactive Discussion
Discussion
Paper
|D
iscussionP
aper|
Discussion
Paper
|D
iscussionP
aper|
8.7
6.5
9.2
7.8
7.27.7
8.49.1
6.7
6.6
7.5
7.2
7.6
Fig. 1. Sampling locations in the Arabian Sea (location number in small letters). Bold numbersindicate δ15NPN in %� of surface SPM. Colours indicate chla concentrations in mgm−3 fromsatellite observations between 6 September and 7 October, 2007 available from http://gdata1.sci.gsfc.nasa.gov/daac-bin/G3/gui.cgi?instance_id=ocean_month.
13347
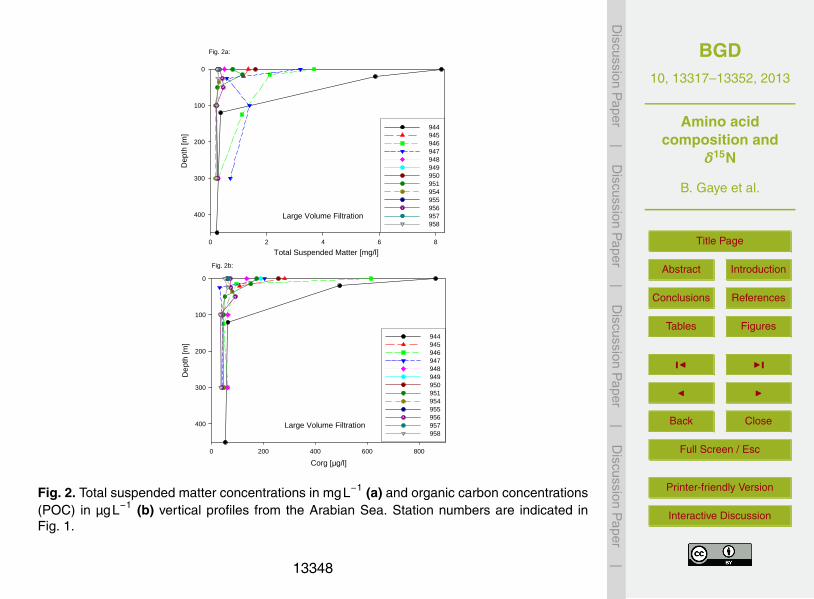
BGD10, 13317–13352, 2013
Amino acidcomposition and
δ15N
B. Gaye et al.
Title Page
Abstract Introduction
Conclusions References
Tables Figures
J I
J I
Back Close
Full Screen / Esc
Printer-friendly Version
Interactive Discussion
Discussion
Paper
|D
iscussionP
aper|
Discussion
Paper
|D
iscussionP
aper|
Large Volume Filtration
Total Suspended Matter [mg/l]0 2 4 6 8
Dep
th [m
]
0
100
200
300
400
944945946947948949950951954955956957958
Large Volume Filtration
Corg [µg/l]
0 200 400 600 800
Dep
th [m
]
0
100
200
300
400
944945946947948949950951954955956957958
Fig. 2a:
Fig. 2b:
Fig. 2. Total suspended matter concentrations in mgL−1 (a) and organic carbon concentrations(POC) in µgL−1 (b) vertical profiles from the Arabian Sea. Station numbers are indicated inFig. 1.
13348
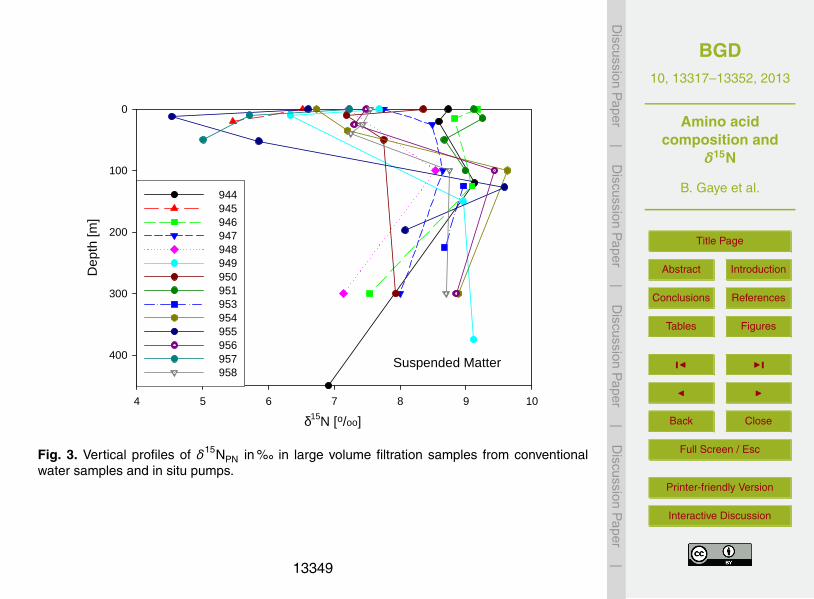
BGD10, 13317–13352, 2013
Amino acidcomposition and
δ15N
B. Gaye et al.
Title Page
Abstract Introduction
Conclusions References
Tables Figures
J I
J I
Back Close
Full Screen / Esc
Printer-friendly Version
Interactive Discussion
Discussion
Paper
|D
iscussionP
aper|
Discussion
Paper
|D
iscussionP
aper|
Suspended Matter
δ15N [o/oo]
4 5 6 7 8 9 10
Dep
th [m
]0
100
200
300
400
944945946947948949950951953954955956957958
Fig. 3. Vertical profiles of δ15NPN in %� in large volume filtration samples from conventionalwater samples and in situ pumps.
13349
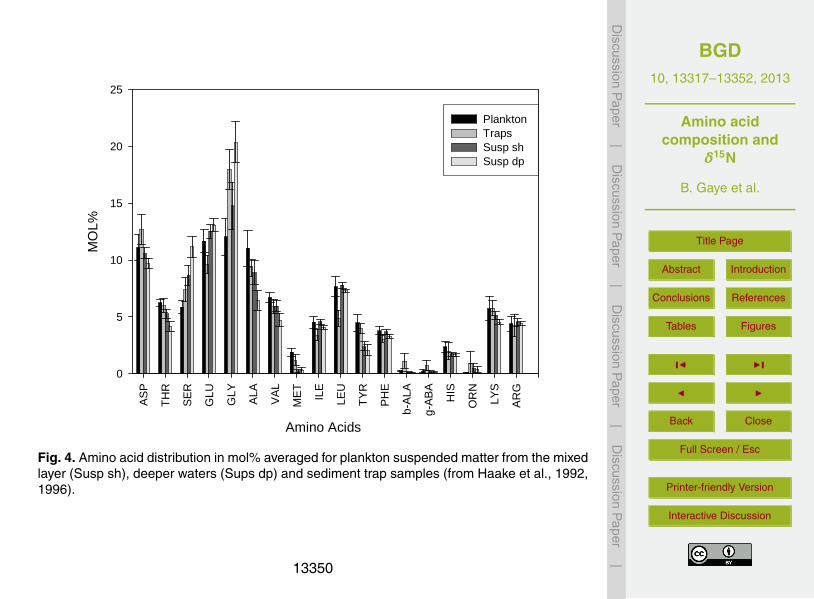
BGD10, 13317–13352, 2013
Amino acidcomposition and
δ15N
B. Gaye et al.
Title Page
Abstract Introduction
Conclusions References
Tables Figures
J I
J I
Back Close
Full Screen / Esc
Printer-friendly Version
Interactive Discussion
Discussion
Paper
|D
iscussionP
aper|
Discussion
Paper
|D
iscussionP
aper|
Amino Acids
AS
P
TH
R
SE
R
GLU
GLY
ALA
VA
L
ME
T
ILE
LEU
TY
R
PH
E
b-A
LA
g-A
BA
HIS
OR
N
LYS
AR
G
MO
L%
0
5
10
15
20
25
Plankton Traps Susp sh Susp dp
Fig. 4. Amino acid distribution in mol% averaged for plankton suspended matter from the mixedlayer (Susp sh), deeper waters (Sups dp) and sediment trap samples (from Haake et al., 1992,1996).
13350
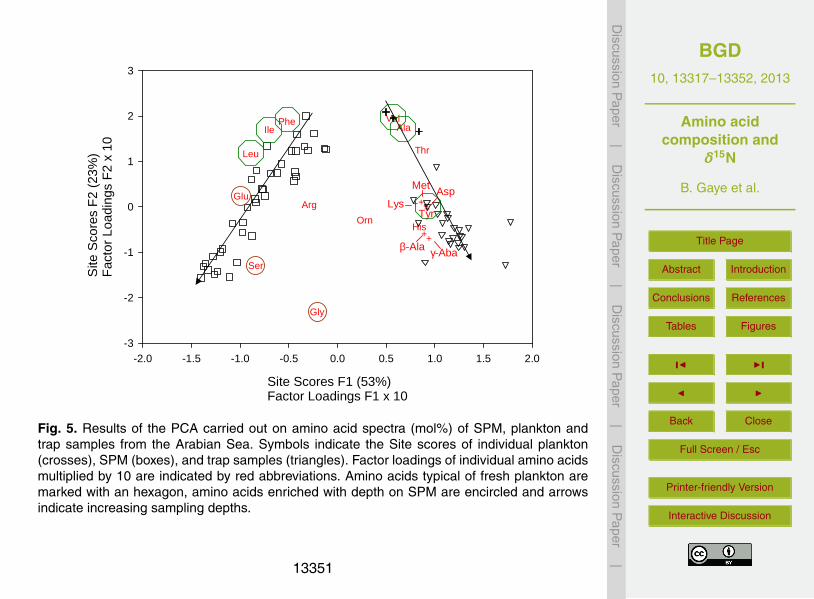
BGD10, 13317–13352, 2013
Amino acidcomposition and
δ15N
B. Gaye et al.
Title Page
Abstract Introduction
Conclusions References
Tables Figures
J I
J I
Back Close
Full Screen / Esc
Printer-friendly Version
Interactive Discussion
Discussion
Paper
|D
iscussionP
aper|
Discussion
Paper
|D
iscussionP
aper|
Site Scores F1 (53%)Factor Loadings F1 x 10
-2.0 -1.5 -1.0 -0.5 0.0 0.5 1.0 1.5 2.0
Site
Sco
res
F2
(23%
)F
acto
r Lo
adin
gs F
2 x
10
-3
-2
-1
0
1
2
3
+
Thr
Ser
Glu
Gly
AlaVal
+
Ile
Leu
+
Phe
++His
Orn
+Arg
β-Ala γ-Aba
Lys
MetAsp
Tyr
Fig. 5. Results of the PCA carried out on amino acid spectra (mol%) of SPM, plankton andtrap samples from the Arabian Sea. Symbols indicate the Site scores of individual plankton(crosses), SPM (boxes), and trap samples (triangles). Factor loadings of individual amino acidsmultiplied by 10 are indicated by red abbreviations. Amino acids typical of fresh plankton aremarked with an hexagon, amino acids enriched with depth on SPM are encircled and arrowsindicate increasing sampling depths.
13351
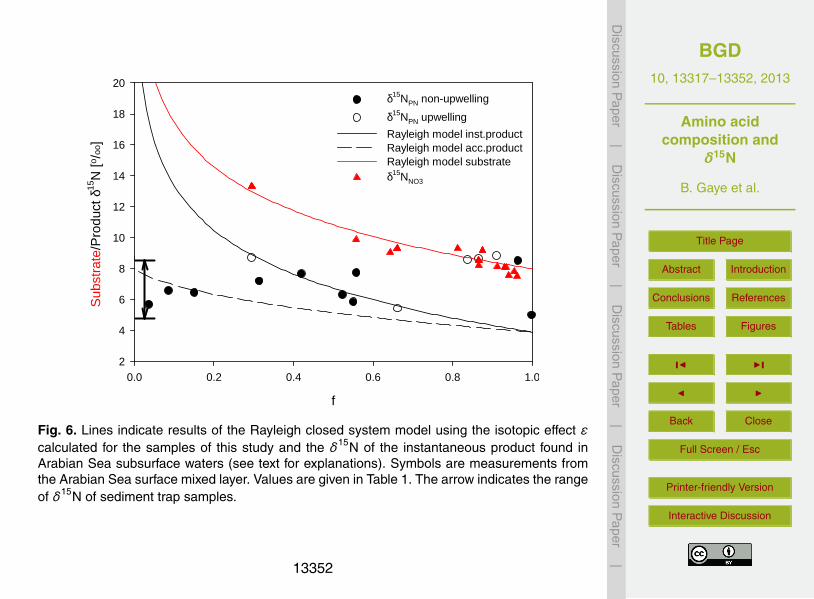
BGD10, 13317–13352, 2013
Amino acidcomposition and
δ15N
B. Gaye et al.
Title Page
Abstract Introduction
Conclusions References
Tables Figures
J I
J I
Back Close
Full Screen / Esc
Printer-friendly Version
Interactive Discussion
Discussion
Paper
|D
iscussionP
aper|
Discussion
Paper
|D
iscussionP
aper|
f
0.0 0.2 0.4 0.6 0.8 1.0
Sub
stra
te/P
rodu
ct δ
15N
[o/o
o ]
2
4
6
8
10
12
14
16
18
20δ15NPN non-upwelling
δ15NPN upwelling
Rayleigh model inst.productRayleigh model acc.productRayleigh model substrateδ15NNO3
Fig. 6. Lines indicate results of the Rayleigh closed system model using the isotopic effect εcalculated for the samples of this study and the δ15N of the instantaneous product found inArabian Sea subsurface waters (see text for explanations). Symbols are measurements fromthe Arabian Sea surface mixed layer. Values are given in Table 1. The arrow indicates the rangeof δ15N of sediment trap samples.
13352
Top Related