

γλώσσες
Σελίδες
Νομικός

λ = (325 nm - 1064 nm) P ≤ 500 mWVISIBLE AND OR INVISIBLE LASER RADIATION
AVOID EXPOSURE TO BEAMCLASS 3B LASER PRODUCT
* Laser safety classifications depend on individual systems and options [email protected] www.horiba.com/scientificUSA: +1 732 494 8660 France: +33 (0)1 69 74 72 00 Germany: +49 (0)89 4623 17-0UK: +44 (0)20 8204 8142 Italy: +39 2 5760 3050 Japan: +81 (0)3 6206 4721China: +86 (0)21 6289 6060 Brazil: +55 (0)11 5545 1500 Other: +33 (0)1 69 74 72 00 Th
is d
ocum
ent i
s no
t con
trac
tual
ly b
indi
ng u
nder
any
circ
umst
ance
s -
Prin
ted
in F
ranc
e -
©H
OR
IBA
Job
in Y
von
08/2
013
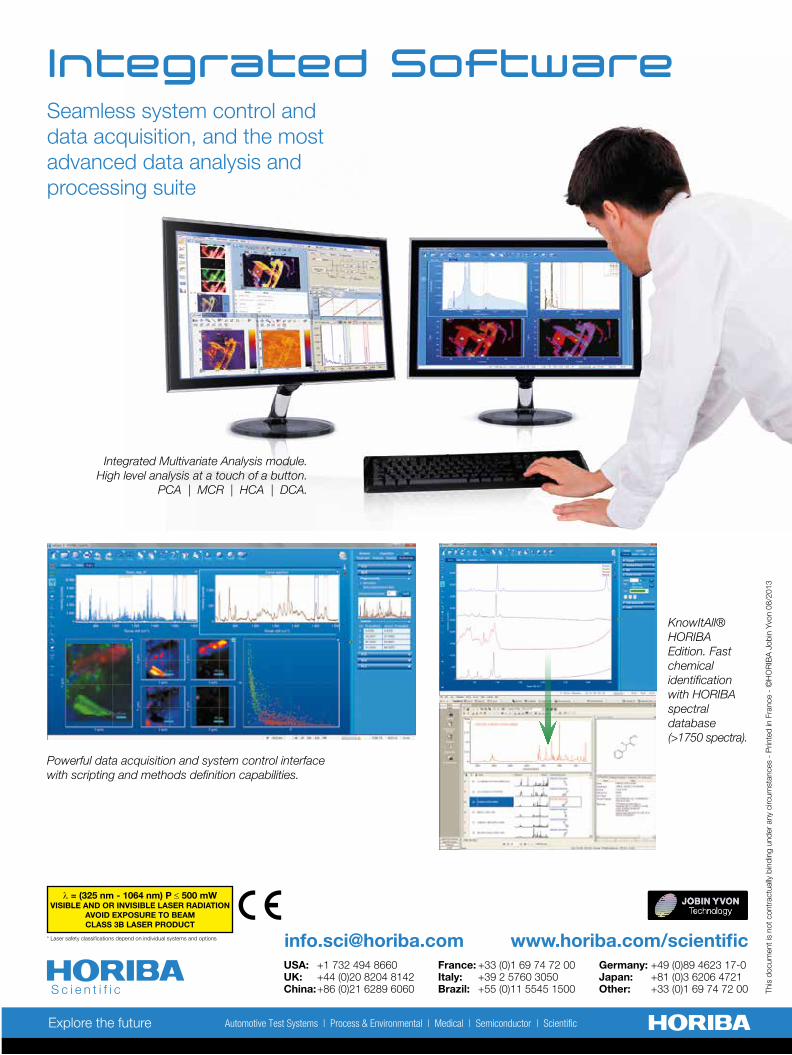
Integrated Software
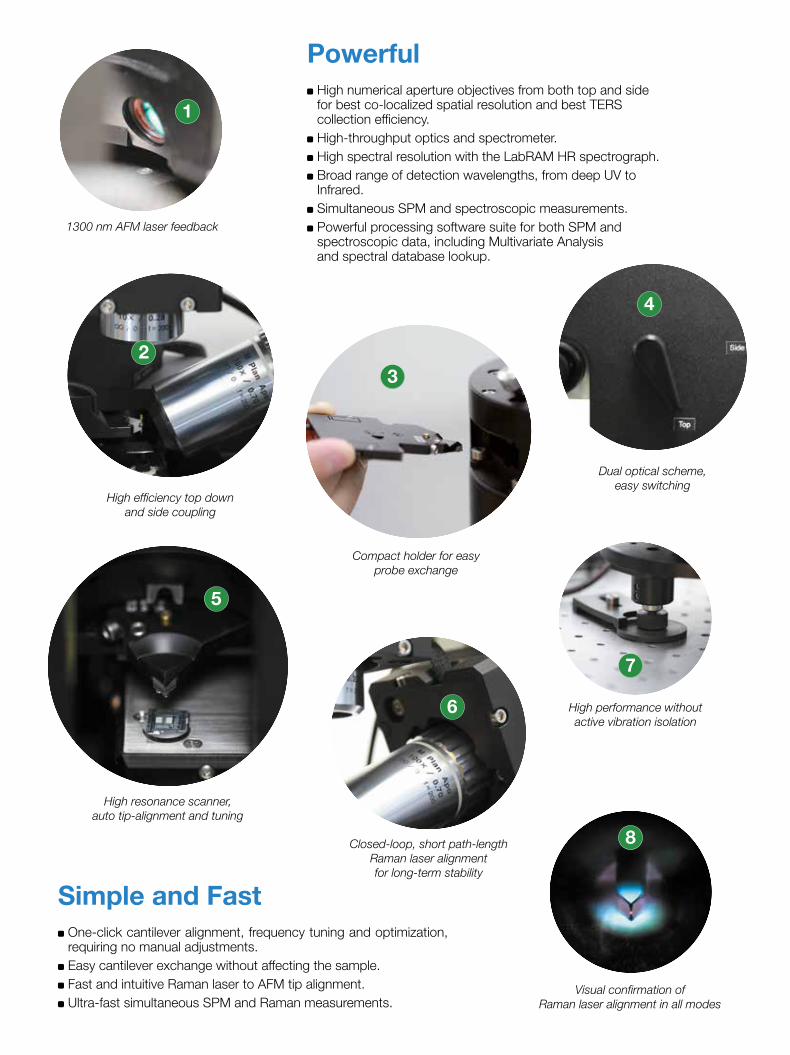
Simple and Fast One-click cantilever alignment, frequency tuning and optimization, requiring no manual adjustments.
Easy cantilever exchange without affecting the sample. Fast and intuitive Raman laser to AFM tip alignment. Ultra-fast simultaneous SPM and Raman measurements.
Powerful High numerical aperture objectives from both top and side for best co-localized spatial resolution and best TERS collection efficiency.
High-throughput optics and spectrometer. High spectral resolution with the LabRAM HR spectrograph. Broad range of detection wavelengths, from deep UV to Infrared.
Simultaneous SPM and spectroscopic measurements. Powerful processing software suite for both SPM and spectroscopic data, including Multivariate Analysis and spectral database lookup.
Seamless system control and data acquisition, and the most advanced data analysis and processing suite
1300 nm AFM laser feedback
Dual optical scheme,easy switching
Closed-loop, short path-length Raman laser alignment for long-term stability
Visual confirmation ofRaman laser alignment in all modes
High resonance scanner, auto tip-alignment and tuning
High performance without active vibration isolation
High efficiency top downand side coupling
Compact holder for easyprobe exchange
Powerful data acquisition and system control interfacewith scripting and methods definition capabilities.
Integrated Multivariate Analysis module.High level analysis at a touch of a button.
PCA | MCR | HCA | DCA.
KnowItAll® HORIBA Edition. Fast chemical identification with HORIBA spectral database (>1750 spectra).
1
23
4
5
6
7
8
Nano-SpectroscopySolutionsAFM-Raman, TERS, NSOM
Chemical imaging at the nanoscale
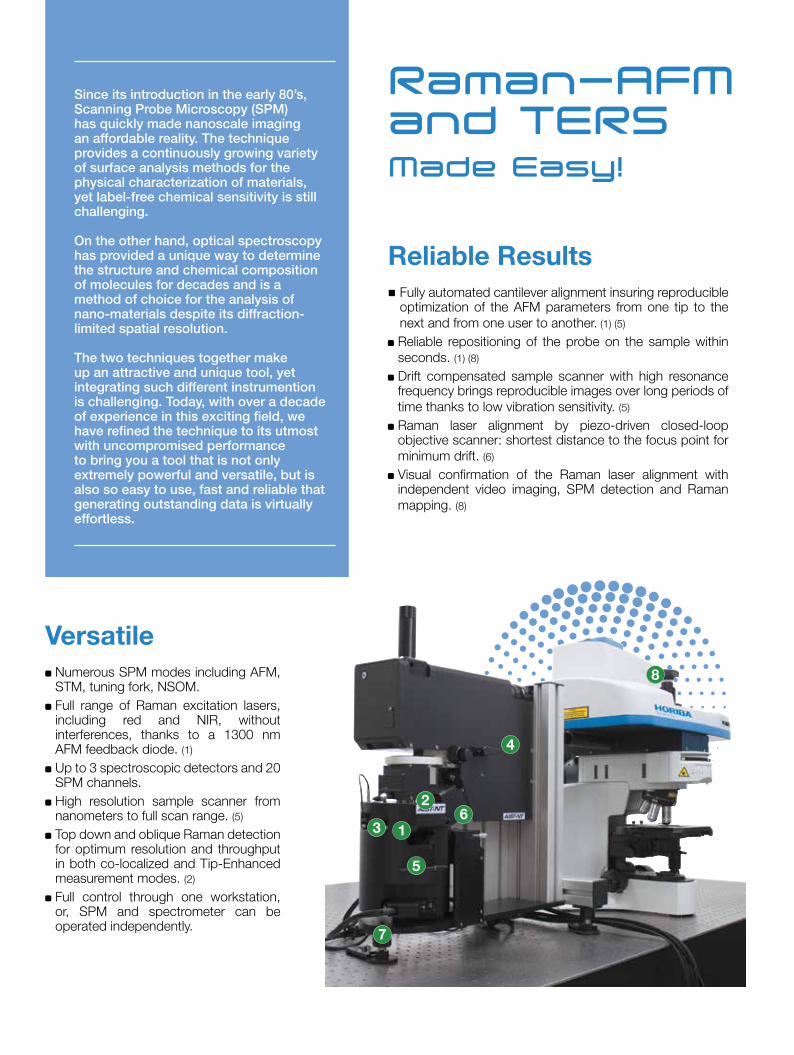
Versatile Numerous SPM modes including AFM, STM, tuning fork, NSOM.
Full range of Raman excitation lasers, including red and NIR, without interferences, thanks to a 1300 nm AFM feedback diode. (1)
Up to 3 spectroscopic detectors and 20 SPM channels.
High resolution sample scanner from nanometers to full scan range. (5)
Top down and oblique Raman detection for optimum resolution and throughput in both co-localized and Tip-Enhanced measurement modes. (2)
Full control through one workstation, or, SPM and spectrometer can be operated independently.
The Ultimate Tool for Physical and Chemical Characterization
Reliable Resultsn Fully automated cantilever alignment insuring reproducible
optimization of the AFM parameters from one tip to the next and from one user to another. (1) (5)
Reliable repositioning of the probe on the sample within seconds. (1) (8)
Drift compensated sample scanner with high resonance frequency brings reproducible images over long periods of time thanks to low vibration sensitivity. (5)
Raman laser alignment by piezo-driven closed-loop objective scanner: shortest distance to the focus point for minimum drift. (6)
Visual confirmation of the Raman laser alignment with independent video imaging, SPM detection and Raman mapping. (8)
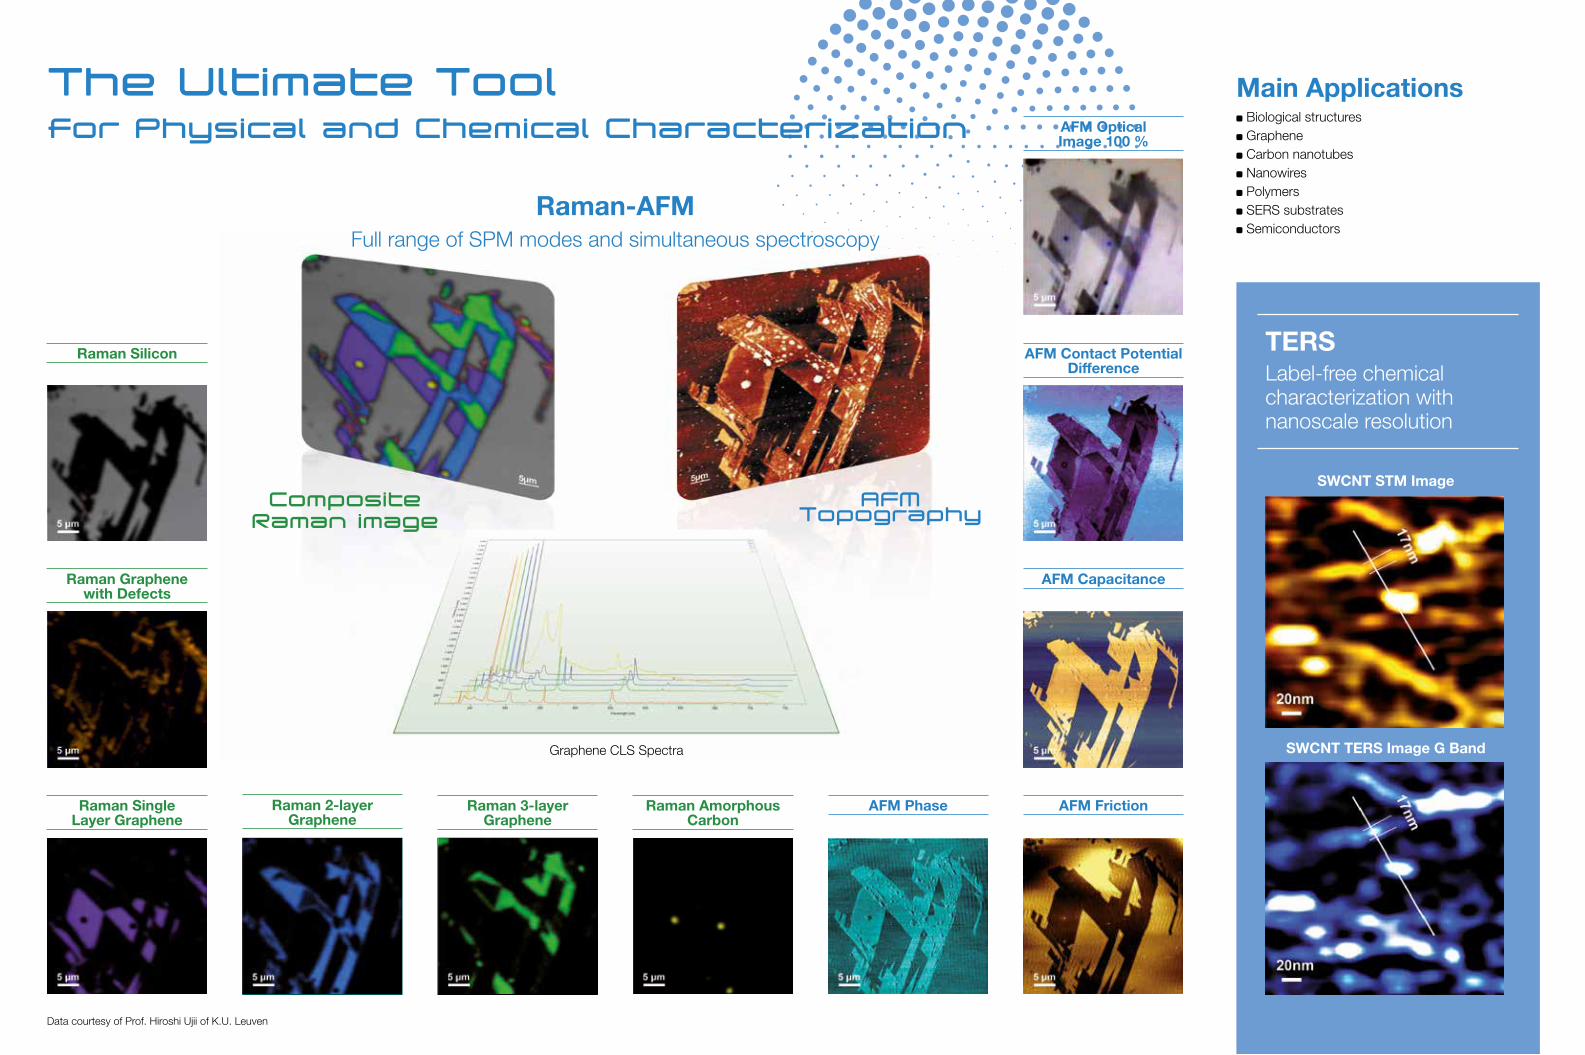
Data courtesy of Prof. Hiroshi Ujii of K.U. Leuven
Graphene CLS Spectra
Main Applications Biological structures Graphene Carbon nanotubes Nanowires Polymers SERS substrates Semiconductors
Raman-AFMFull range of SPM modes and simultaneous spectroscopy
Raman-AFM and TERSMade Easy!
Since its introduction in the early 80’s, Scanning Probe Microscopy (SPM) has quickly made nanoscale imaging an affordable reality. The technique provides a continuously growing variety of surface analysis methods for the physical characterization of materials, yet label-free chemical sensitivity is still challenging.
On the other hand, optical spectroscopy has provided a unique way to determine the structure and chemical composition of molecules for decades and is a method of choice for the analysis of nano-materials despite its diffraction-limited spatial resolution.
The two techniques together make up an attractive and unique tool, yet integrating such different instrumention is challenging. Today, with over a decade of experience in this exciting field, we have refined the technique to its utmost with uncompromised performance to bring you a tool that is not only extremely powerful and versatile, but is also so easy to use, fast and reliable that generating outstanding data is virtually effortless.
TERSLabel-free chemical characterization with nanoscale resolution
SWCNT STM Image
SWCNT TERS Image G Band
AFM Topography
CompositeRaman image
1
2
3
4
8
5
6
7
Raman Silicon
Raman 3-layer Graphene
Raman Amorphous Carbon
Raman 2-layer Graphene
AFM Phase AFM Friction
AFM Capacitance
AFM Contact Potential Difference
AFM Optical Image 100 %
Raman Graphene with Defects
Raman Single Layer Graphene
λ = (325 nm - 1064 nm) P ≤ 500 mWVISIBLE AND OR INVISIBLE LASER RADIATION
AVOID EXPOSURE TO BEAMCLASS 3B LASER PRODUCT
* Laser safety classifications depend on individual systems and options [email protected] www.horiba.com/scientificUSA: +1 732 494 8660 France: +33 (0)1 69 74 72 00 Germany: +49 (0)89 4623 17-0UK: +44 (0)20 8204 8142 Italy: +39 2 5760 3050 Japan: +81 (0)3 6206 4721China: +86 (0)21 6289 6060 Brazil: +55 (0)11 5545 1500 Other: +33 (0)1 69 74 72 00 Th
is d
ocum
ent i
s no
t con
trac
tual
ly b
indi
ng u
nder
any
circ
umst
ance
s -
Prin
ted
in F
ranc
e -
©H
OR
IBA
Job
in Y
von
08/2
013
Integrated Software
Simple and Fast One-click cantilever alignment, frequency tuning and optimization, requiring no manual adjustments.
Easy cantilever exchange without affecting the sample. Fast and intuitive Raman laser to AFM tip alignment. Ultra-fast simultaneous SPM and Raman measurements.
Powerful High numerical aperture objectives from both top and side for best co-localized spatial resolution and best TERS collection efficiency.
High-throughput optics and spectrometer. High spectral resolution with the LabRAM HR spectrograph. Broad range of detection wavelengths, from deep UV to Infrared.
Simultaneous SPM and spectroscopic measurements. Powerful processing software suite for both SPM and spectroscopic data, including Multivariate Analysis and spectral database lookup.
Seamless system control and data acquisition, and the most advanced data analysis and processing suite
1300 nm AFM laser feedback
Dual optical scheme,easy switching
Closed-loop, short path-length Raman laser alignment for long-term stability
Visual confirmation ofRaman laser alignment in all modes
High resonance scanner, auto tip-alignment and tuning
High performance without active vibration isolation
High efficiency top downand side coupling
Compact holder for easyprobe exchange
Powerful data acquisition and system control interfacewith scripting and methods definition capabilities.
Integrated Multivariate Analysis module.High level analysis at a touch of a button.
PCA | MCR | HCA | DCA.
KnowItAll® HORIBA Edition. Fast chemical identification with HORIBA spectral database (>1750 spectra).
1
23
4
5
6
7
8
Nano-SpectroscopySolutionsAFM-Raman, TERS, NSOM
Chemical imaging at the nanoscale
Versatile Numerous SPM modes including AFM, STM, tuning fork, NSOM.
Full range of Raman excitation lasers, including red and NIR, without interferences, thanks to a 1300 nm AFM feedback diode. (1)
Up to 3 spectroscopic detectors and 20 SPM channels.
High resolution sample scanner from nanometers to full scan range. (5)
Top down and oblique Raman detection for optimum resolution and throughput in both co-localized and Tip-Enhanced measurement modes. (2)
Full control through one workstation, or, SPM and spectrometer can be operated independently.
The Ultimate Tool for Physical and Chemical Characterization
Reliable Resultsn Fully automated cantilever alignment insuring reproducible
optimization of the AFM parameters from one tip to the next and from one user to another. (1) (5)
Reliable repositioning of the probe on the sample within seconds. (1) (8)
Drift compensated sample scanner with high resonance frequency brings reproducible images over long periods of time thanks to low vibration sensitivity. (5)
Raman laser alignment by piezo-driven closed-loop objective scanner: shortest distance to the focus point for minimum drift. (6)
Visual confirmation of the Raman laser alignment with independent video imaging, SPM detection and Raman mapping. (8)
Data courtesy of Prof. Hiroshi Ujii of K.U. Leuven
Graphene CLS Spectra
Main Applications Biological structures Graphene Carbon nanotubes Nanowires Polymers SERS substrates Semiconductors
Raman-AFMFull range of SPM modes and simultaneous spectroscopy
Raman-AFM and TERSMade Easy!
Since its introduction in the early 80’s, Scanning Probe Microscopy (SPM) has quickly made nanoscale imaging an affordable reality. The technique provides a continuously growing variety of surface analysis methods for the physical characterization of materials, yet label-free chemical sensitivity is still challenging.
On the other hand, optical spectroscopy has provided a unique way to determine the structure and chemical composition of molecules for decades and is a method of choice for the analysis of nano-materials despite its diffraction-limited spatial resolution.
The two techniques together make up an attractive and unique tool, yet integrating such different instrumention is challenging. Today, with over a decade of experience in this exciting field, we have refined the technique to its utmost with uncompromised performance to bring you a tool that is not only extremely powerful and versatile, but is also so easy to use, fast and reliable that generating outstanding data is virtually effortless.
TERSLabel-free chemical characterization with nanoscale resolution
SWCNT STM Image
SWCNT TERS Image G Band
AFM Topography
CompositeRaman image
1
2
3
4
8
5
6
7
Raman Silicon
Raman 3-layer Graphene
Raman Amorphous Carbon
Raman 2-layer Graphene
AFM Phase AFM Friction
AFM Capacitance
AFM Contact Potential Difference
AFM Optical Image 100 %
Raman Graphene with Defects
Raman Single Layer Graphene
λ = (325 nm - 1064 nm) P ≤ 500 mWVISIBLE AND OR INVISIBLE LASER RADIATION
AVOID EXPOSURE TO BEAMCLASS 3B LASER PRODUCT
* Laser safety classifications depend on individual systems and options [email protected] www.horiba.com/scientificUSA: +1 732 494 8660 France: +33 (0)1 69 74 72 00 Germany: +49 (0)89 4623 17-0UK: +44 (0)20 8204 8142 Italy: +39 2 5760 3050 Japan: +81 (0)3 6206 4721China: +86 (0)21 6289 6060 Brazil: +55 (0)11 5545 1500 Other: +33 (0)1 69 74 72 00 Th
is d
ocum
ent i
s no
t con
trac
tual
ly b
indi
ng u
nder
any
circ
umst
ance
s -
Prin
ted
in F
ranc
e -
©H
OR
IBA
Job
in Y
von
08/2
013
Integrated Software
Simple and Fast One-click cantilever alignment, frequency tuning and optimization, requiring no manual adjustments.
Easy cantilever exchange without affecting the sample. Fast and intuitive Raman laser to AFM tip alignment. Ultra-fast simultaneous SPM and Raman measurements.
Powerful High numerical aperture objectives from both top and side for best co-localized spatial resolution and best TERS collection efficiency.
High-throughput optics and spectrometer. High spectral resolution with the LabRAM HR spectrograph. Broad range of detection wavelengths, from deep UV to Infrared.
Simultaneous SPM and spectroscopic measurements. Powerful processing software suite for both SPM and spectroscopic data, including Multivariate Analysis and spectral database lookup.
Seamless system control and data acquisition, and the most advanced data analysis and processing suite
1300 nm AFM laser feedback
Dual optical scheme,easy switching
Closed-loop, short path-length Raman laser alignment for long-term stability
Visual confirmation ofRaman laser alignment in all modes
High resonance scanner, auto tip-alignment and tuning
High performance without active vibration isolation
High efficiency top downand side coupling
Compact holder for easyprobe exchange
Powerful data acquisition and system control interfacewith scripting and methods definition capabilities.
Integrated Multivariate Analysis module.High level analysis at a touch of a button.
PCA | MCR | HCA | DCA.
KnowItAll® HORIBA Edition. Fast chemical identification with HORIBA spectral database (>1750 spectra).
1
23
4
5
6
7
8
Nano-SpectroscopySolutionsAFM-Raman, TERS, NSOM
Chemical imaging at the nanoscale
Top Related