
Valence fluctuation in CeMo Si C - arXiv
18
arXiv:1303.2801v1 [cond-mat.mtrl-sci] 12 Mar 2013 Valence fluctuation in CeMo 2 Si 2 C U. B. Paramanik a , Anupam a , U. Burkhard b , R. Prasad a , C. Geibel b , Z. Hossain ∗,a , a Department of Physics, Indian Institute of Technology, Kanpur 208016, India b Max-Planck Institute for Chemical Physics of Solids, 01187 Dresden, Germany Abstract We report on the valence fluctuation of Ce in CeMo 2 Si 2 C as studied by means of magnetic susceptibility χ(T ), specific heat C (T ), electrical resistivity ρ(T ) and x-ray absorption spectroscopy. Powder x-ray diffraction revealed that CeMo 2 Si 2 C crystallizes in CeCr 2 Si 2 C-type layered tetragonal crystal structure (space group P4/mmm). The unit cell volume of CeMo 2 Si 2 C deviates from the expected lan- thanide contraction, indicating non-trivalent state of Ce ions in this compound. The observed weak temperature dependence of the magnetic susceptibility and its low value indicate that Ce ions are in valence fluctuating state. The formal L III Ce va- lence in CeMo 2 Si 2 C < ν> = 3.11 as determined from x-ray absorption spectroscopy measurement is well bellow the value < ν>≃ 3.4 in tetravalent Ce compound CeO 2 . The temperature dependence of specific heat does not show any anomaly down to 1.8 K which rules out any magnetic ordering in the system. The Sommerfeld coef- ficient obtained from the specific heat data is γ = 23.4 mJ/mol K 2 . The electrical resistivity follows the T 2 behavior in the low temperature range below 35 K con- firming a Fermi liquid behavior. Accordingly both the Kadowaki Wood ratio A/γ 2 and the Sommerfeld Wilson ratio χ(0)/γ are in the range expected for Fermi-liquid systems. In order to get some information on the electronic states, we calculated the band structure within the density functional theory, eventhough this approach is not able to treat 4f electrons accurately. The non-f electron states crossing the Fermi level have mostly Mo 4d character. They provide the states with which the 4f sates are strongly hybridized, leading to the intermediate valent state. Key words: Rare earth alloys and compounds, Valence fluctuations, Magnetic measurements, Heat Capacity, x-ray absorption spectroscopy, electronic structure. PACS: 75.30.Mb, 61.05.cj, 65.40.Ba, 71.20.-b ∗ Corresponding author: Tel.: +91 51 2679 7464. E-mail address: [email protected] Preprint submitted to JOURNAL OF ALLOYS AND COMPOUNDS11 September 2018
Transcript of Valence fluctuation in CeMo Si C - arXiv
arX
iv:1
303.
2801
v1 [
cond
-mat
.mtr
l-sc
i] 1
2 M
ar 2
013
Valence fluctuation in CeMo2Si2C
U. B. Paramanik a, Anupam a, U. Burkhard b, R. Prasad a,C. Geibel b, Z. Hossain ∗,a,
aDepartment of Physics, Indian Institute of Technology, Kanpur 208016, IndiabMax-Planck Institute for Chemical Physics of Solids, 01187 Dresden, Germany
Abstract
We report on the valence fluctuation of Ce in CeMo2Si2C as studied by meansof magnetic susceptibility χ(T ), specific heat C(T ), electrical resistivity ρ(T ) andx-ray absorption spectroscopy. Powder x-ray diffraction revealed that CeMo2Si2Ccrystallizes in CeCr2Si2C-type layered tetragonal crystal structure (space groupP4/mmm). The unit cell volume of CeMo2Si2C deviates from the expected lan-thanide contraction, indicating non-trivalent state of Ce ions in this compound. Theobserved weak temperature dependence of the magnetic susceptibility and its lowvalue indicate that Ce ions are in valence fluctuating state. The formal LIII Ce va-lence in CeMo2Si2C <ν> = 3.11 as determined from x-ray absorption spectroscopymeasurement is well bellow the value <ν>≃ 3.4 in tetravalent Ce compound CeO2.The temperature dependence of specific heat does not show any anomaly down to1.8 K which rules out any magnetic ordering in the system. The Sommerfeld coef-ficient obtained from the specific heat data is γ = 23.4 mJ/molK2. The electricalresistivity follows the T 2 behavior in the low temperature range below 35 K con-firming a Fermi liquid behavior. Accordingly both the Kadowaki Wood ratio A/γ2
and the Sommerfeld Wilson ratio χ(0)/γ are in the range expected for Fermi-liquidsystems. In order to get some information on the electronic states, we calculatedthe band structure within the density functional theory, eventhough this approachis not able to treat 4f electrons accurately. The non-f electron states crossing theFermi level have mostly Mo 4d character. They provide the states with which the4f sates are strongly hybridized, leading to the intermediate valent state.
Key words: Rare earth alloys and compounds, Valence fluctuations, Magneticmeasurements, Heat Capacity, x-ray absorption spectroscopy, electronic structure.PACS: 75.30.Mb, 61.05.cj, 65.40.Ba, 71.20.-b
∗ Corresponding author: Tel.: +91 51 2679 7464. E-mail address: [email protected]
Preprint submitted to JOURNAL OF ALLOYS AND COMPOUNDS11 September 2018
1 Introduction
The Ce-based intermetallic compounds have attracted tremendous attentionwith interesting phenomena such as valence fluctuations, heavy fermion be-havior, quantum criticality, unconventional superconductivity and Kondo ef-fect, etc.[1,2,3,4] These anomalous properties arise due to the hybridizationbetween the localized 4f electrons and conduction electrons. Usually, the com-petition between Ruderman-Kittel-Kasuya-Yosida (RKKY) and Kondo inter-actions determines the ground state of these compounds. While the RKKYinteraction favors a long-range magnetic order, the Kondo interactions havea tendency to screen the magnetic moments which lead to a non-magneticground state.[5,6] The result of these two interactions is summarized in theDoniach phase diagram.[5] A quantum critical point exists in the regime wherethe strength of RKKY and Kondo interactions are comparable. Quantum crit-icality in heavy fermion systems is one of the hot topics in condensed matterphysics. In Ce-based compounds, quantum criticality and associated unusualphysical properties such as the non-Fermi liquid behavior are found near themagnetic non-magnetic crossover, where the Ce valency is very close to 3+.Usually one uses a tuning parameter such as pressure, doping or magneticfield to tune the electronic ground state of the system close to quantum crit-ical point. Many Ce-based compounds exhibit magnetically mediated uncon-ventional superconductivity in the quantum critical regime. Despite the firstsuch superconductor, CeCu2Si2,[7] was discovered 35 years ago, many fun-damental questions have yet not been settled and there is still an intensiveresearch going on these superconductors. Pressure experiments on pure andGe-doped CeCu2Si2 revealed two superconducting domes, one at lower pres-sure attributed to the magnetic quantum critical point and the other oneat a higher pressure which could be related to valence fluctuation. [8,9] Incontrast, unconventional superconductivity was not found in Yb-compoundsnear a magnetic quantum critical point, even though there are examples ofYb-compounds showing quantum criticality. YbAlB4 is the only compoundshowing superconductivity which is proposed to be connected with criticalvalence fluctuations.[10,11,12] This provided additional incentive for the in-vestigations of valence fluctuation phenomenon.
In our search for new valence fluctuating compound that may show quantumcriticality similar to that of YbAlB4, we have synthesized and investigated thephysical properties of CeMo2Si2C . To the best of our knowledge, there is noreport in the literature on the layered intermetallic compound CeMo2Si2C.The structurally homologous compound, PrMo2Si2C[13] has been reported toform in CeCr2Si2C-type (“filled” CeMg2Si2-type) tetragonal crystal structure(space group P4/mmm). The magnetic measurements on PrMo2Si2C havesuggested a trivalent state of Pr in this compound. RCr2Si2C (R = Y, La-Sm,Gd-Er), an isoelectronic structural homologue series of CeMo2Si2C, has been
2
reported to exhibit ferromagnetic ordering of rare earth ions[14] but interme-diate valence for R = Ce.[15,16] We present the structural and physical prop-erties of CeMo2Si2C, viz., x-ray diffraction (XRD), dc magnetic susceptibility,electrical resistivity, specific heat and x-ray absorption spectroscopy (XAS)and discuss the results in the context of the calculated electronic structure.From our measurements, we show that Ce ions are in a valence fluctuatingstate in this compound.
2 Methods
2.1 Experiment
Polycrystalline sample of CeMo2Si2C has been prepared by the standard arcmelting technique on a water cooled copper hearth. Since the melting pointof Molybdenum element is very high, therefore, we first arc melted Si andMo together in the stoichiometric ratio. Then the as-obtained pellet was arcmelted with carbon and subsequently with cerium. All the constituent ele-ments were of high purity (99.9% and above). The samples were flipped aftereach melting and were melted several times to ensure homogeneity. The arcmelted button was sealed in the Ta crucible and annealed in a vacuum furnaceat 1500C for five days. The phase purity of the sample was checked by pow-der x-ray diffraction using Cu-Kα radiation and scanning electron micrograph(SEM). Energy dispersive x-ray (EDX) analysis was used to check the stoi-chiometry of the sample. Electrical resistivity measurements were carried outusing conventional four probe technique in the temperature range 2-300 K ina physical property measurement system (PPMS, Quantum design). A com-mercial superconducting quantum interference device (SQUID) magnetometer(MPMS, Quantum design) was used for magnetic measurements. The specificheat was measured by relaxation method in a physical property measurementsystem (PPMS, Quantum design). The absorption spectra of CeMo2Si2C atthe Ce-LIII edge (E = 5723 eV) have been recorded in transmission mode atthe EXAFS beam line Al using the Si (111) double crystal monochromator.The absorption behavior has been determined in the energy range 5450 eVto 6200 eV with a minimal step size of ∆E = 0.2 eV close to the absorptionedge e.g. 5723± 25 eV. The powdered sample with particle size smaller than20µm was distributed on self adhesive Kapton foil. Multi-layers of 4 foils cor-responding to 8 mg/cm2 resulted an absorption edge step of ∆µ = 0.5 whichrepresents the difference of the low and high energy background functions atthe absorption edge. Evaluation of spectra, energy calibration and normal-ization have been performed with the Athena modul of the Horae softwarepackage.[17] The simultaneously measured reference spectra of the Ce3+ com-pound CePO4 was used for energy calibration and was measured together with
3
the CeO2 reference material with a dominant Ce4+ contribution.
2.2 Method of calculation
We have performed the density-functional band structure calculations usingtwo full potential codes: local orbital minimum basis band structure scheme(FPLO)[18] and full-potential linearized augmented plane wave (FLAPW)method implemented in WIEN2K code.[19] Perdew-Burke-Ernzerhof (PBE)form of the generalized gradient approximation (GGA) was employed forthe exchange correlation potential.[20]Additionally, to account for the strongCoulomb repulsion within the Ce 4f orbitals a typical value of the Coulombenergy U = 6 eV has been chosen for the GGA+U calculations.[21,22] The cal-culations were performed using the experimentally obtained lattice parametersof CeMo2Si2C where the full-lattice optimizations were done using Rietveldrefined atomic coordinates.
3 RESULTS AND DISCUSSION
3.1 Experiment
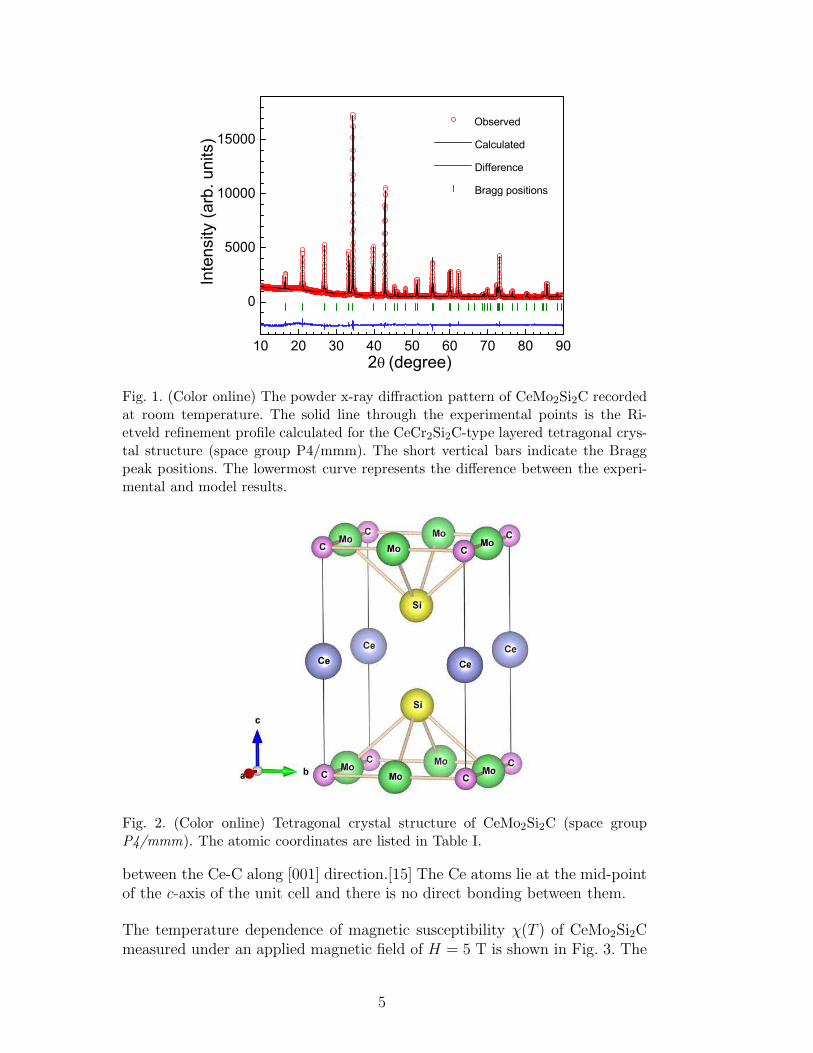
Figure 1 shows the XRD pattern of CeMo2Si2C together with the structuralRietveld refinement profile for the CeCr2Si2C-type layered tetragonal crys-tal structure (space group P4/mmm). Powder x-ray diffraction data werecollected on the crushed sample and analyzed by Rietveld refinement usingFullProf software.[23] The obtained lattice parameters for CeMo2Si2C are a= 4.213(1) A, and c = 5.376(1) A which are smaller than the values reportedfor homologous PrMo2Si2C (a = 4.214 A and c = 5.409 A).[13] That meansCeMo2Si2C unit cell volume does not follow the usual lanthanide contractionwhich is a first indication for a valence fluctuating Ce states.
The crystallographic parameters obtained from the least square refinement ofXRD data are listed in Table 1. The XRD and SEM reveal the single phasenature of the sample. The EDX composition analysis confirmed the desiredstoichiometry of CeMo2Si2C. The CeCr2Si2C-type primitive tetragonal crystalstructure of CeMo2Si2C is presented schematically in Fig. 2. This structureis different from the very common tetragonal ThCr2Si2-type structure: anadditional carbon atom sharing the same edge with Mo forms a layer of MoC.The loss of the body centering results in the c/a ratio 1.27 which is almosthalf of usually observed ratio of about 2.5 in the ThCr2Si2-type structure. Thevalue of the lattice parameter c in this structure suggests a covalent bonding
4
10 20 30 40 50 60 70 80 90
0
5000
10000
15000Observed
Calculated
Difference
Bragg positions
Inte
nsity
(arb
. uni
ts)
2 (degree)
Fig. 1. (Color online) The powder x-ray diffraction pattern of CeMo2Si2C recordedat room temperature. The solid line through the experimental points is the Ri-etveld refinement profile calculated for the CeCr2Si2C-type layered tetragonal crys-tal structure (space group P4/mmm). The short vertical bars indicate the Braggpeak positions. The lowermost curve represents the difference between the experi-mental and model results.
Fig. 2. (Color online) Tetragonal crystal structure of CeMo2Si2C (space groupP4/mmm). The atomic coordinates are listed in Table I.
between the Ce-C along [001] direction.[15] The Ce atoms lie at the mid-pointof the c-axis of the unit cell and there is no direct bonding between them.
The temperature dependence of magnetic susceptibility χ(T ) of CeMo2Si2Cmeasured under an applied magnetic field of H = 5 T is shown in Fig. 3. The
5
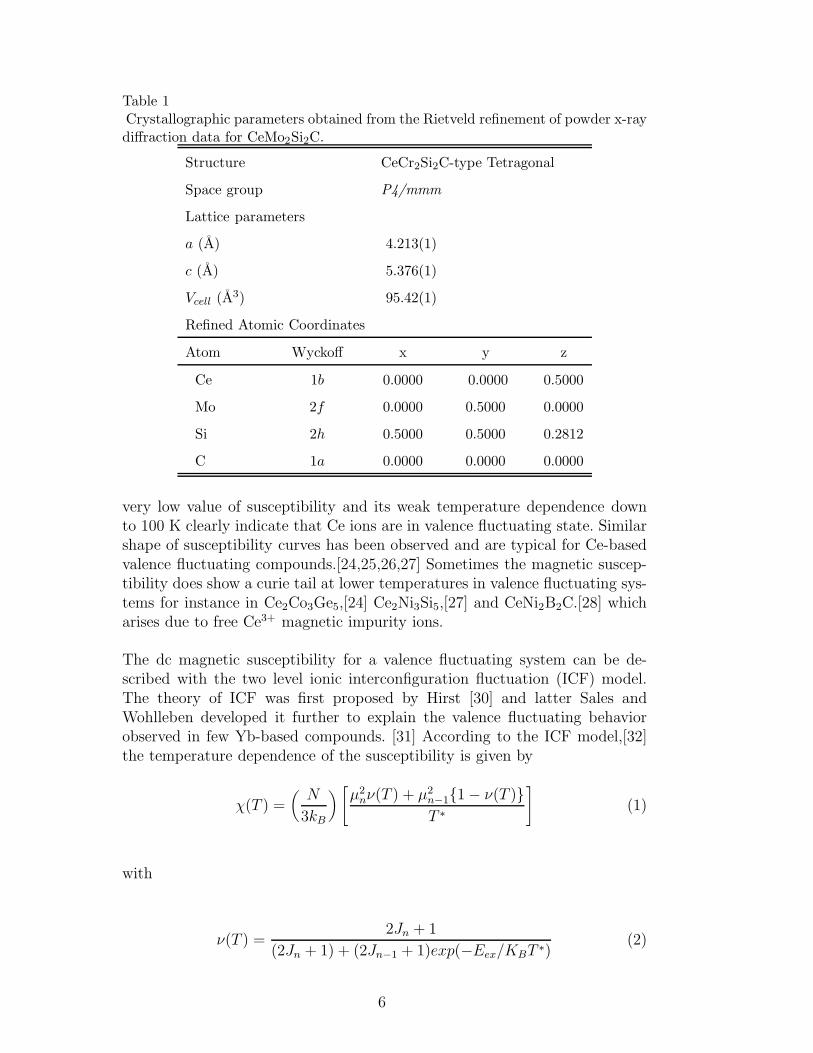
Table 1Crystallographic parameters obtained from the Rietveld refinement of powder x-raydiffraction data for CeMo2Si2C.
Structure CeCr2Si2C-type Tetragonal
Space group P4/mmm
Lattice parameters
a (A) 4.213(1)
c (A) 5.376(1)
Vcell (A3) 95.42(1)
Refined Atomic Coordinates
Atom Wyckoff x y z
Ce 1b 0.0000 0.0000 0.5000
Mo 2f 0.0000 0.5000 0.0000
Si 2h 0.5000 0.5000 0.2812
C 1a 0.0000 0.0000 0.0000
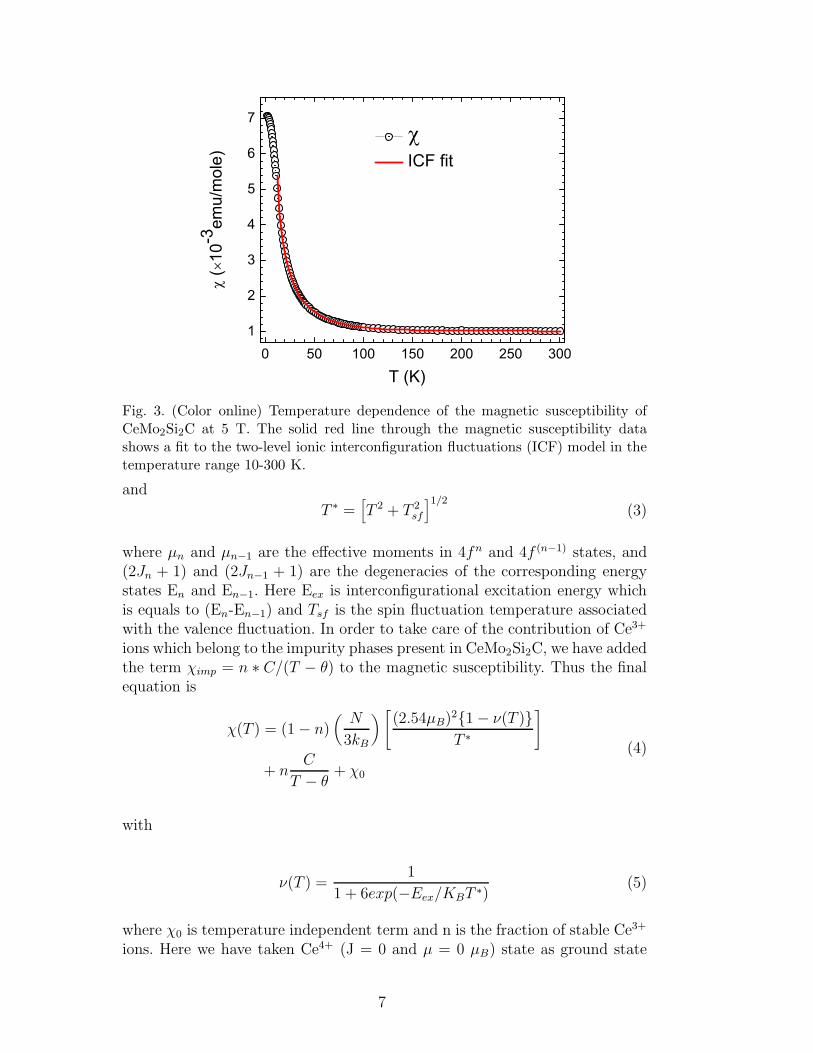
very low value of susceptibility and its weak temperature dependence downto 100 K clearly indicate that Ce ions are in valence fluctuating state. Similarshape of susceptibility curves has been observed and are typical for Ce-basedvalence fluctuating compounds.[24,25,26,27] Sometimes the magnetic suscep-tibility does show a curie tail at lower temperatures in valence fluctuating sys-tems for instance in Ce2Co3Ge5,[24] Ce2Ni3Si5,[27] and CeNi2B2C.[28] whicharises due to free Ce3+ magnetic impurity ions.
The dc magnetic susceptibility for a valence fluctuating system can be de-scribed with the two level ionic interconfiguration fluctuation (ICF) model.The theory of ICF was first proposed by Hirst [30] and latter Sales andWohlleben developed it further to explain the valence fluctuating behaviorobserved in few Yb-based compounds. [31] According to the ICF model,[32]the temperature dependence of the susceptibility is given by
χ(T ) =(
N
3kB
)[µ2nν(T ) + µ2
n−11− ν(T )
T ∗
](1)
with
ν(T ) =2Jn + 1
(2Jn + 1) + (2Jn−1 + 1)exp(−Eex/KBT ∗)(2)
6
0 50 100 150 200 250 3001
2
3
4
5
6
7
ICF fit
(10
-3em
u/m
ole)
T (K)
Fig. 3. (Color online) Temperature dependence of the magnetic susceptibility ofCeMo2Si2C at 5 T. The solid red line through the magnetic susceptibility datashows a fit to the two-level ionic interconfiguration fluctuations (ICF) model in thetemperature range 10-300 K.
and
T ∗ =[T 2 + T 2
sf
]1/2(3)
where µn and µn−1 are the effective moments in 4fn and 4f (n−1) states, and(2Jn + 1) and (2Jn−1 + 1) are the degeneracies of the corresponding energystates En and En−1. Here Eex is interconfigurational excitation energy whichis equals to (En-En−1) and Tsf is the spin fluctuation temperature associatedwith the valence fluctuation. In order to take care of the contribution of Ce3+
ions which belong to the impurity phases present in CeMo2Si2C, we have addedthe term χimp = n ∗ C/(T − θ) to the magnetic susceptibility. Thus the finalequation is
χ(T ) = (1− n)(
N
3kB
)[(2.54µB)
21− ν(T )
T ∗
]
+ nC
T − θ+ χ0
(4)
with
ν(T ) =1
1 + 6exp(−Eex/KBT ∗)(5)
where χ0 is temperature independent term and n is the fraction of stable Ce3+
ions. Here we have taken Ce4+ (J = 0 and µ = 0 µB) state as ground state
7
and Ce3+ (J = 52and µ = 2.54 µB) as an excited state. The solid line through
the magnetic susceptibility data in Fig. 3 is the fit to the equation 4. Thevalues of parameters obtained from the least square fits are n = 0.06, Eex =677 ± 12 K, Tsf = 205 ± 3 K, θ = 1.9 K and χ0 = −1.67 × 10⁻⁴ emu/mole.The values of Eex and Tsf are in the range of typical values found for thevalence-fluctuating system Ce2Rh3Si5 (Eex = 845 K and Tsf = 129 K).[22]
0 50 100 150 200 250 300
1
2
3
4
5
6
7
(10
-3em
u/m
ole)
0 50 100 150 200 250 300
4
6
8
10
-
imp (
10-4em
u/m
ole) - imp
fit
T (K)
T (K)
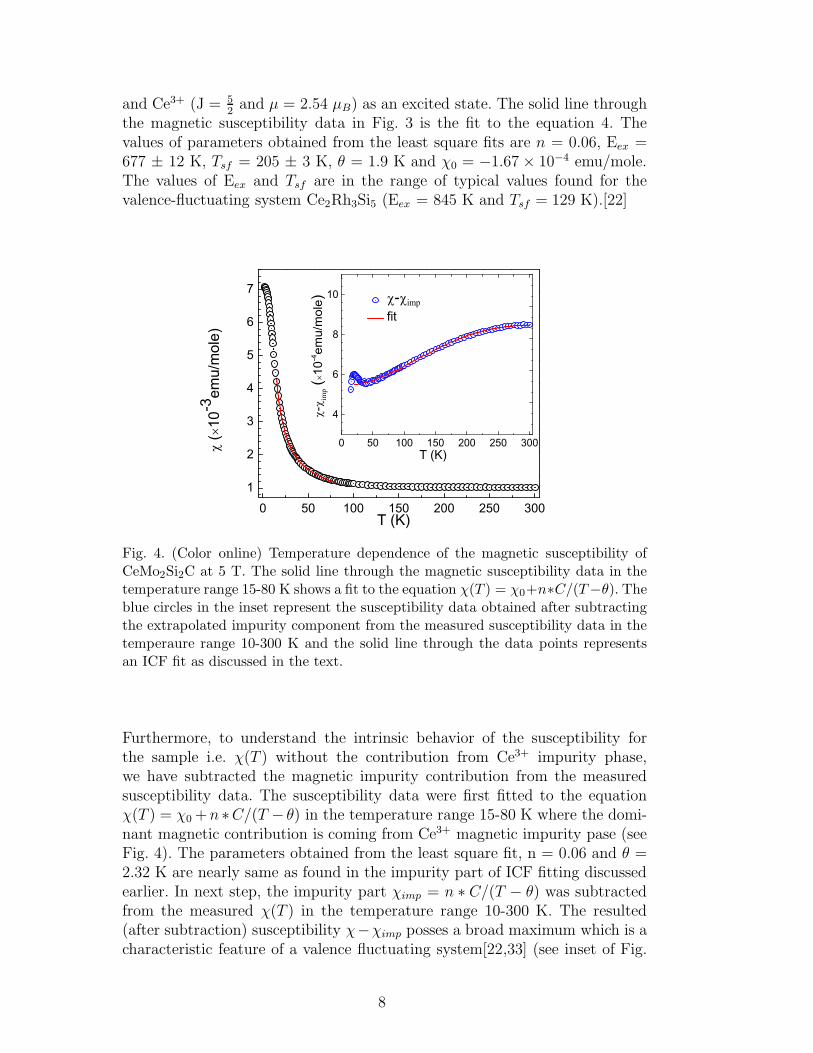
Fig. 4. (Color online) Temperature dependence of the magnetic susceptibility ofCeMo2Si2C at 5 T. The solid line through the magnetic susceptibility data in thetemperature range 15-80 K shows a fit to the equation χ(T ) = χ0+n∗C/(T−θ). Theblue circles in the inset represent the susceptibility data obtained after subtractingthe extrapolated impurity component from the measured susceptibility data in thetemperaure range 10-300 K and the solid line through the data points representsan ICF fit as discussed in the text.
Furthermore, to understand the intrinsic behavior of the susceptibility forthe sample i.e. χ(T ) without the contribution from Ce3+ impurity phase,we have subtracted the magnetic impurity contribution from the measuredsusceptibility data. The susceptibility data were first fitted to the equationχ(T ) = χ0+n ∗C/(T − θ) in the temperature range 15-80 K where the domi-nant magnetic contribution is coming from Ce3+ magnetic impurity pase (seeFig. 4). The parameters obtained from the least square fit, n = 0.06 and θ =2.32 K are nearly same as found in the impurity part of ICF fitting discussedearlier. In next step, the impurity part χimp = n ∗ C/(T − θ) was subtractedfrom the measured χ(T ) in the temperature range 10-300 K. The resulted(after subtraction) susceptibility χ−χimp posses a broad maximum which is acharacteristic feature of a valence fluctuating system[22,33] (see inset of Fig.
8
4). The χ− χimp data were fitted to the following ICF equation
χ(T ) = (1− n)(
N
3kB
)[(2.54µB)
21− ν(T )
T ∗
]
+ χ0
(6)
where the impurity concentration n is kept fixed at 0.06. The fit to the datayields the values Eex = 701 ± 4 K, Tsf = 217 ± 1 K and χ0 = −1.24 ×10⁻⁴ emu/mole, which are close to the values obtained from the ICF fittingearlier above.
0 10 20 30 400.00
0.05
0.10
0.15
0.20
0.25
ZFC
(em
u/m
ole)
T (K)
1 T 0.5 T 0.1 T 0.01 T
FC
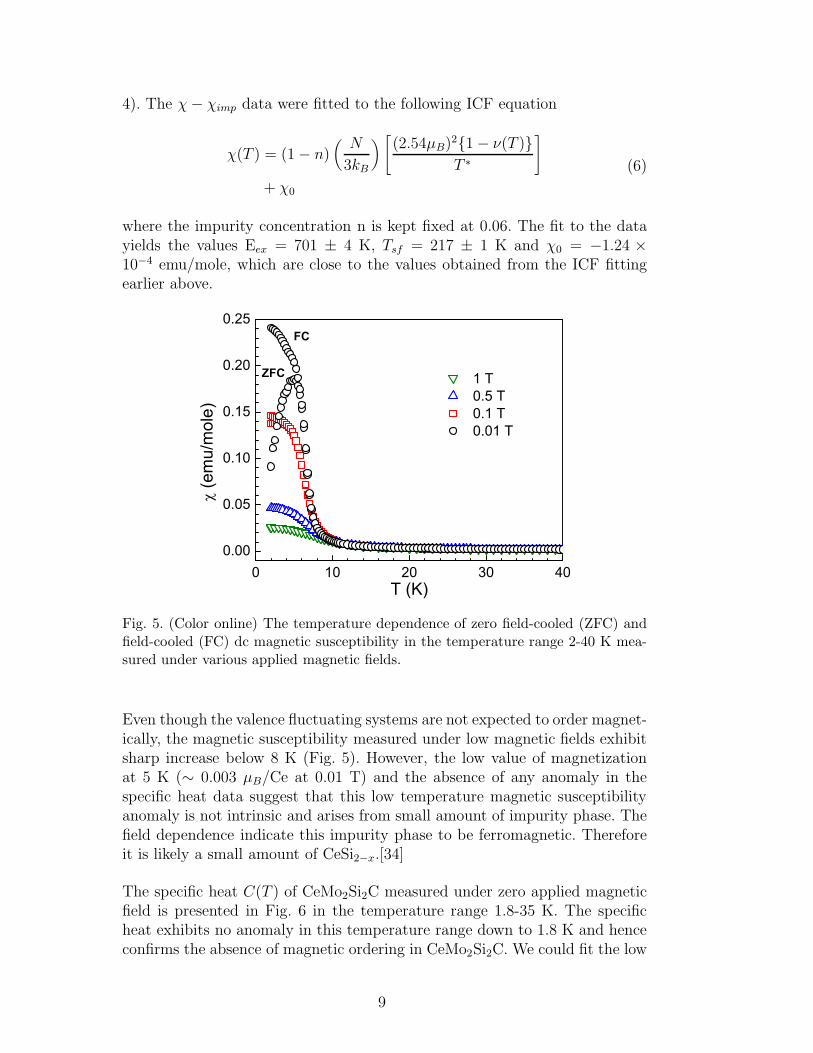
Fig. 5. (Color online) The temperature dependence of zero field-cooled (ZFC) andfield-cooled (FC) dc magnetic susceptibility in the temperature range 2-40 K mea-sured under various applied magnetic fields.
Even though the valence fluctuating systems are not expected to order magnet-ically, the magnetic susceptibility measured under low magnetic fields exhibitsharp increase below 8 K (Fig. 5). However, the low value of magnetizationat 5 K (∼ 0.003 µB/Ce at 0.01 T) and the absence of any anomaly in thespecific heat data suggest that this low temperature magnetic susceptibilityanomaly is not intrinsic and arises from small amount of impurity phase. Thefield dependence indicate this impurity phase to be ferromagnetic. Thereforeit is likely a small amount of CeSi2−x.[34]
The specific heat C(T ) of CeMo2Si2C measured under zero applied magneticfield is presented in Fig. 6 in the temperature range 1.8-35 K. The specificheat exhibits no anomaly in this temperature range down to 1.8 K and henceconfirms the absence of magnetic ordering in CeMo2Si2C. We could fit the low
9
0 5 10 15 20 25 300
2
4
6
8
2 4 6 8 10 120.0
0.2
0.4
0.6
C (J
/mol
e-K)
T (K)
C (J
/mol
e-K
)T (K)
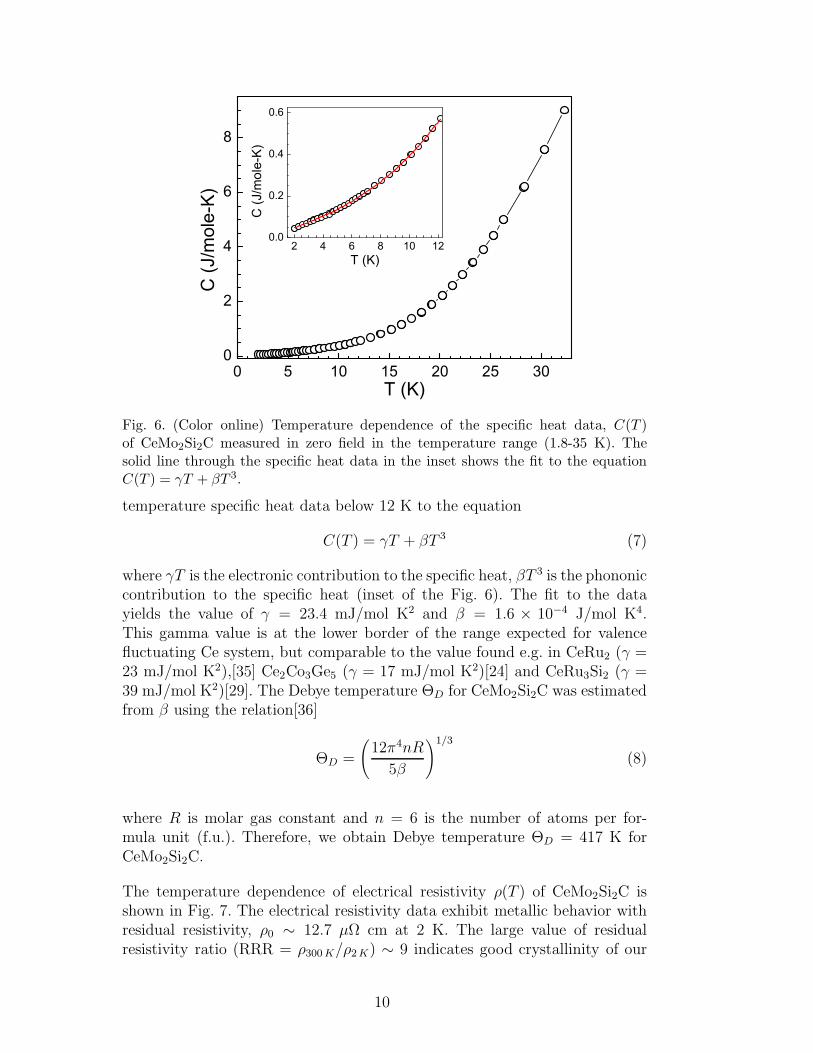
Fig. 6. (Color online) Temperature dependence of the specific heat data, C(T )of CeMo2Si2C measured in zero field in the temperature range (1.8-35 K). Thesolid line through the specific heat data in the inset shows the fit to the equationC(T ) = γT + βT 3.
temperature specific heat data below 12 K to the equation
C(T ) = γT + βT 3 (7)
where γT is the electronic contribution to the specific heat, βT 3 is the phononiccontribution to the specific heat (inset of the Fig. 6). The fit to the datayields the value of γ = 23.4 mJ/mol K2 and β = 1.6 × 10⁻⁴ J/mol K4.This gamma value is at the lower border of the range expected for valencefluctuating Ce system, but comparable to the value found e.g. in CeRu2 (γ =23 mJ/mol K2),[35] Ce2Co3Ge5 (γ = 17 mJ/mol K2)[24] and CeRu3Si2 (γ =39 mJ/mol K2)[29]. The Debye temperature ΘD for CeMo2Si2C was estimatedfrom β using the relation[36]
ΘD =
(12π4nR
5β
)1/3
(8)
where R is molar gas constant and n = 6 is the number of atoms per for-mula unit (f.u.). Therefore, we obtain Debye temperature ΘD = 417 K forCeMo2Si2C.
The temperature dependence of electrical resistivity ρ(T ) of CeMo2Si2C isshown in Fig. 7. The electrical resistivity data exhibit metallic behavior withresidual resistivity, ρ0 ∼ 12.7 µΩ cm at 2 K. The large value of residualresistivity ratio (RRR = ρ300K/ρ2K) ∼ 9 indicates good crystallinity of our
10
50 100 150 200 250 3000
20
40
60
80
100
120
0 400 800 1200
13
14
15
16
( c
m)
T (K)
( c
m)
T2 (K2)
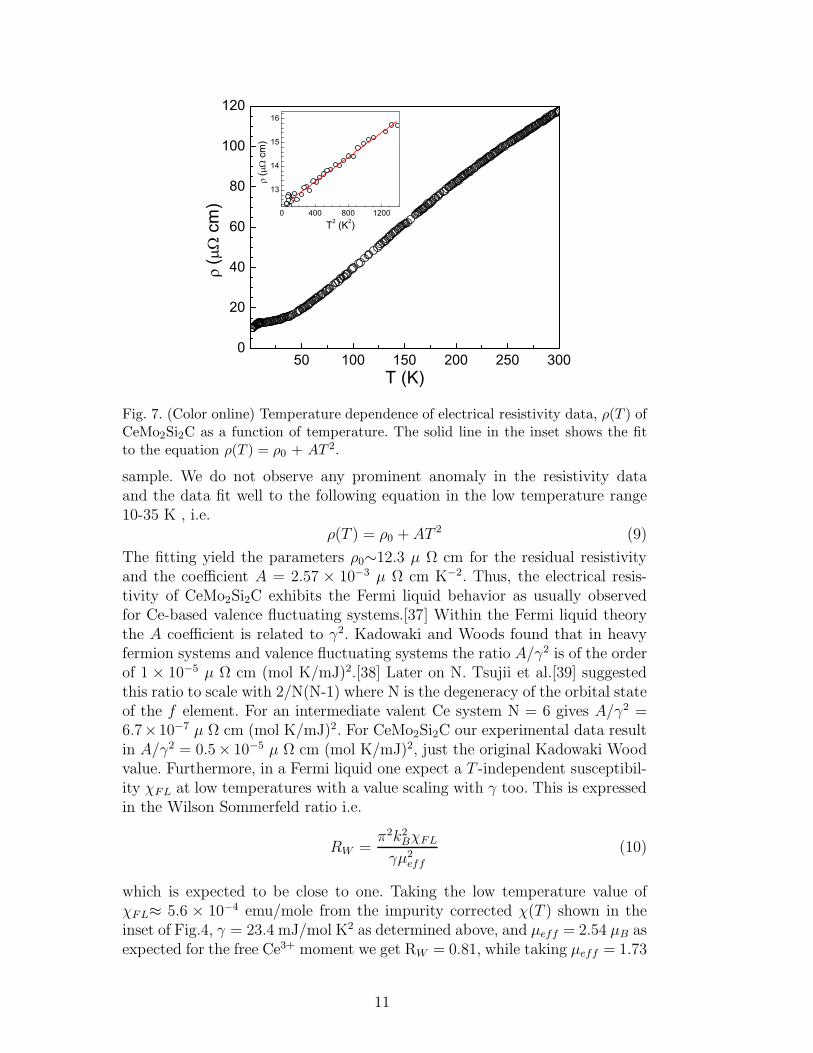
Fig. 7. (Color online) Temperature dependence of electrical resistivity data, ρ(T ) ofCeMo2Si2C as a function of temperature. The solid line in the inset shows the fitto the equation ρ(T ) = ρ0 + AT 2.
sample. We do not observe any prominent anomaly in the resistivity dataand the data fit well to the following equation in the low temperature range10-35 K , i.e.
ρ(T ) = ρ0 + AT 2 (9)
The fitting yield the parameters ρ0∼12.3 µ Ω cm for the residual resistivityand the coefficient A = 2.57 × 10⁻³ µ Ω cm K−2. Thus, the electrical resis-tivity of CeMo2Si2C exhibits the Fermi liquid behavior as usually observedfor Ce-based valence fluctuating systems.[37] Within the Fermi liquid theorythe A coefficient is related to γ2. Kadowaki and Woods found that in heavyfermion systems and valence fluctuating systems the ratio A/γ2 is of the orderof 1 × 10⁻⁵ µ Ω cm (mol K/mJ)2.[38] Later on N. Tsujii et al.[39] suggestedthis ratio to scale with 2/N(N-1) where N is the degeneracy of the orbital stateof the f element. For an intermediate valent Ce system N = 6 gives A/γ2 =6.7×10⁻⁷ µ Ω cm (mol K/mJ)2. For CeMo2Si2C our experimental data resultin A/γ2 = 0.5× 10⁻⁵ µ Ω cm (mol K/mJ)2, just the original Kadowaki Woodvalue. Furthermore, in a Fermi liquid one expect a T -independent susceptibil-ity χFL at low temperatures with a value scaling with γ too. This is expressedin the Wilson Sommerfeld ratio i.e.
RW =π2k2
BχFL
γµ2eff
(10)
which is expected to be close to one. Taking the low temperature value ofχFL≈ 5.6 × 10⁻⁴ emu/mole from the impurity corrected χ(T ) shown in theinset of Fig.4, γ = 23.4 mJ/mol K2 as determined above, and µeff = 2.54 µB asexpected for the free Ce3+ moment we get RW = 0.81, while taking µeff = 1.73
11
as for a free conduction electron, one get RW = 1.7. Thus, low T susceptibility,specific heat and resistivity data fulfill Fermi liquid expectations.
5700 5710 5720 5730 5740 57500.0
0.5
1.0
1.5
2.0
4f 0
Abs
orpt
ion
(arb
. uni
ts)
Energy (eV)
CeMo2Si2C fit step
4f 1
4f 0 4f 1
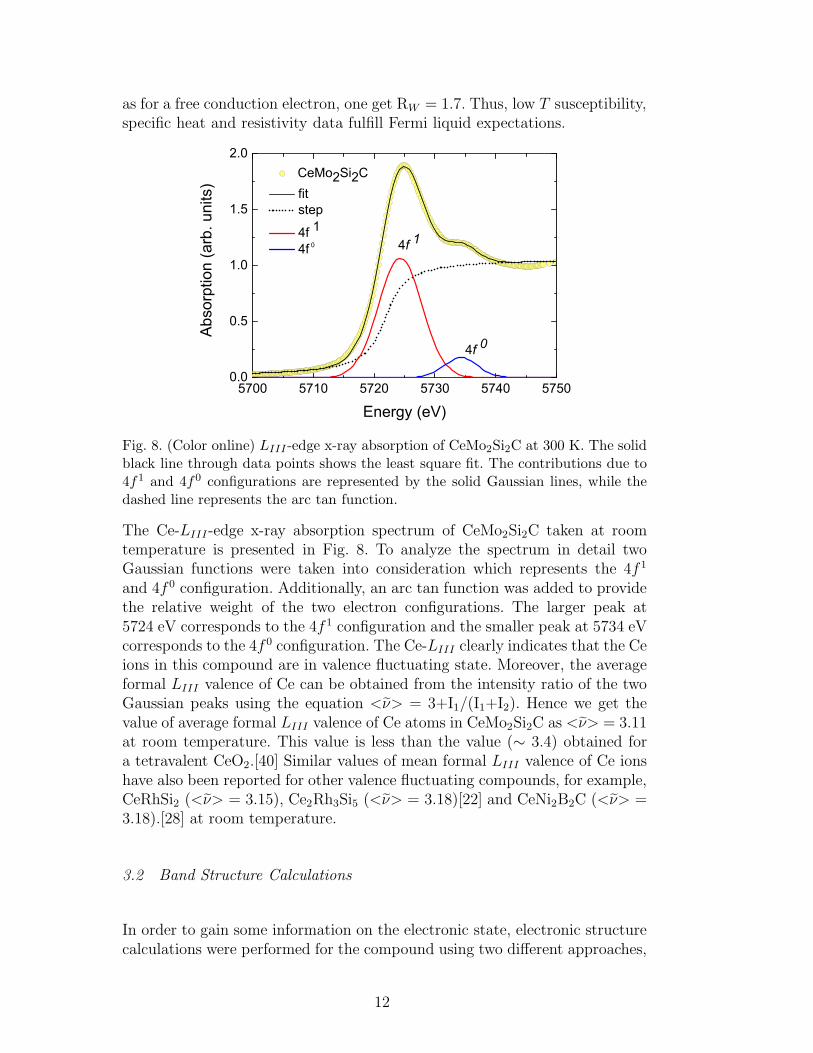
Fig. 8. (Color online) LIII -edge x-ray absorption of CeMo2Si2C at 300 K. The solidblack line through data points shows the least square fit. The contributions due to4f1 and 4f0 configurations are represented by the solid Gaussian lines, while thedashed line represents the arc tan function.
The Ce-LIII-edge x-ray absorption spectrum of CeMo2Si2C taken at roomtemperature is presented in Fig. 8. To analyze the spectrum in detail twoGaussian functions were taken into consideration which represents the 4f 1
and 4f 0 configuration. Additionally, an arc tan function was added to providethe relative weight of the two electron configurations. The larger peak at5724 eV corresponds to the 4f 1 configuration and the smaller peak at 5734 eVcorresponds to the 4f 0 configuration. The Ce-LIII clearly indicates that the Ceions in this compound are in valence fluctuating state. Moreover, the averageformal LIII valence of Ce can be obtained from the intensity ratio of the twoGaussian peaks using the equation <ν> = 3+I1/(I1+I2). Hence we get thevalue of average formal LIII valence of Ce atoms in CeMo2Si2C as <ν> = 3.11at room temperature. This value is less than the value (∼ 3.4) obtained fora tetravalent CeO2.[40] Similar values of mean formal LIII valence of Ce ionshave also been reported for other valence fluctuating compounds, for example,CeRhSi2 (<ν> = 3.15), Ce2Rh3Si5 (<ν> = 3.18)[22] and CeNi2B2C (<ν> =3.18).[28] at room temperature.
3.2 Band Structure Calculations
In order to gain some information on the electronic state, electronic structurecalculations were performed for the compound using two different approaches,
12
-18 -15 -12 -9 -6 -3 0 30
10
20
30
40
total DOS GGA total DOS GGA+U
Binding energy (eV)
DO
S (s
tate
s/eV
/f.u)
CeMo2Si2C
Ce 5p
0.0
0.5
1.0
1.5
2.0
0.0
0.5
1.0
1.5
0.0
0.5
1.0
1.5
-12 -9 -6 -3 0 30.0
0.5
1.0
1.5
B
Ce 5p Ce 4d Ce 4f
GGA+U
B
Mo 5s Mo 4p Mo 4d
B
A
Si 3s Si 3p
Binding Energy (eV)
DO
S (S
tate
s/eV
/ato
m)
B
A
C 2s C 2p
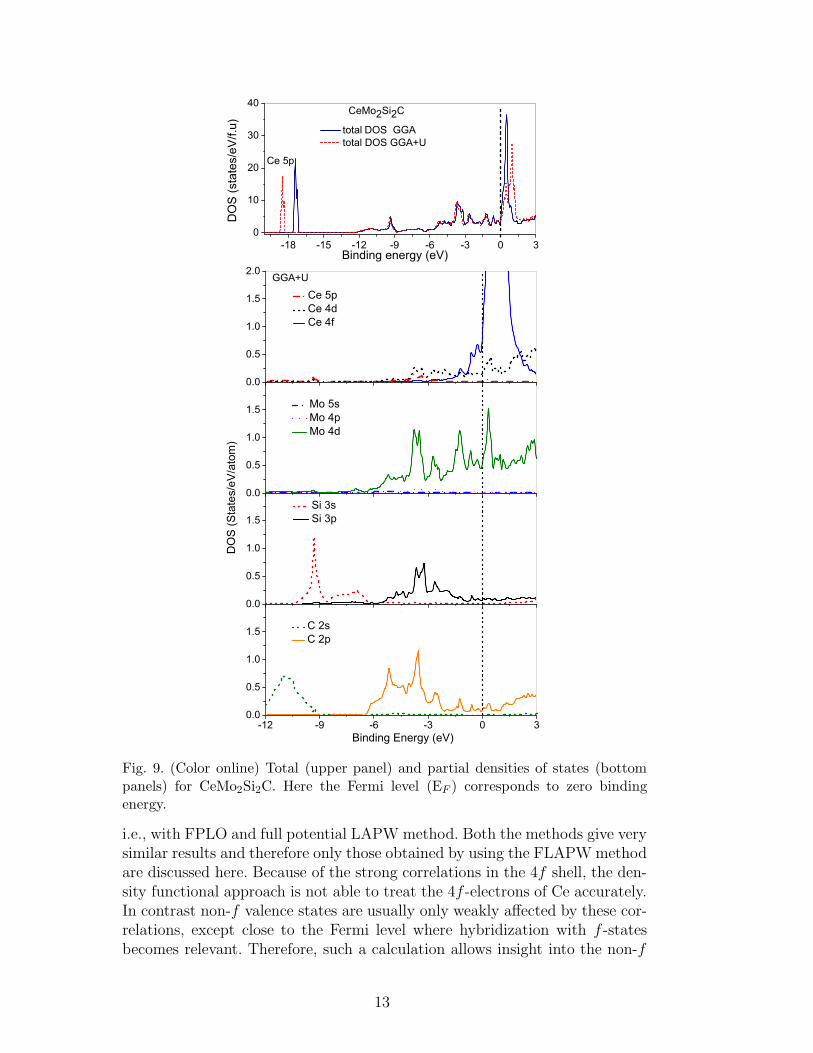
Fig. 9. (Color online) Total (upper panel) and partial densities of states (bottompanels) for CeMo2Si2C. Here the Fermi level (EF ) corresponds to zero bindingenergy.
i.e., with FPLO and full potential LAPW method. Both the methods give verysimilar results and therefore only those obtained by using the FLAPWmethodare discussed here. Because of the strong correlations in the 4f shell, the den-sity functional approach is not able to treat the 4f -electrons of Ce accurately.In contrast non-f valence states are usually only weakly affected by these cor-relations, except close to the Fermi level where hybridization with f -statesbecomes relevant. Therefore, such a calculation allows insight into the non-f
13
valence states and gives some information on the states which are hybridizedwith the Ce 4f states at the Fermi level. In this method the unit cell is dividedinto non-overlapping muffin-tin spheres centered at the atomic sites and aninterstitial region. The muffin-tin radii were chosen to be of 2.5 a.u. for Ce,2.1 a.u. for Mo, 2.2 a.u. for Si and 1.86 a.u for C. The set of plane-wave expan-sion KMAX was determined as RMT×KMAX equal to 7 and K mesh used was13×13×10. We have performed the calculations with and without spin polar-ization. Notably the self-consistent results for magnetic solutions were nearlythe same as those for non-magnetic ones because the spin polarized calcula-tion resulted in a non-magnetic state. Total and local magnetic moments wereapproximately zero (∼ 10−5 µB/Ce) in the spin polarized calculations.
Figure 9 shows the total and partial Density of States (DOSs) for CeMo2Si2C,calculated within the GGA and GGA+U (U = 6 eV) approximations. Todescribe in detail, here we divide the total DOS into four main parts.
(1) The peak located below -16 eV is due to Ce 5p electronic state. It is re-markable that the GGA+U peak is shifted towards higher binding energyby 1 eV with respect to GGA.
(2) The sub-band situated between -12 eV and -6 eV, is formed mainly bySi 3s and C 2s states.
(3) The third part, which is located between the -6 to -2 eV contains stronglyhybridized Mo 4d , Si 3p and C 2p states. Hybridized states of Ce 4d andC 2p are observed as well just below the Fermi level (see the partialdensity of states of Fig. 9).
(4) The bottom of the conduction band or at the Fermi level, the main con-tribution to the DOS is provided by Ce 4f and Mo 4d electronic states.Hybridization between Ce 4f and Mo 4d states are observed near theFermi level. In case of GGA+U the main peak (Ce 4f) is broadened andslightly shifted towards right side above the Fermi level in comparison toGGA and consequently reduced the occupancy of Ce 4f electrons at theFermi level.
It should be noted that at the Fermi level a small contribution to the totalDOS come from Ce 5d, Si 3p and C 2p states as well. The orbital occupancy ofelectrons inside the atomic sphere of the Ce atom is calculated by the GGA ap-proach as 6s1.98 5d0.64 4f 0.94 and by GGA+U calculation as 6s1.99 5d0.85 4f 0.64.Thus the f-count in these calculations is slightly (GGA) or far (GGA+U) be-low 1. Comparison with the LIII result shows that GGA overestimate the fcount while GGA+U provides more realistic value of f electron count.
Based on the DOS at the Fermi level here we obtained the Sommerfeld coeffi-cients γ0 and the Pauli paramagnetic susceptibility χFL as calculated under theassumption of free electron model, γ0 = (π2/3)N [EF ]K
2B and χFL = µ2
BN [EF ],where N [EF ] is the electron density of states at the Fermi level. All the calcu-
14
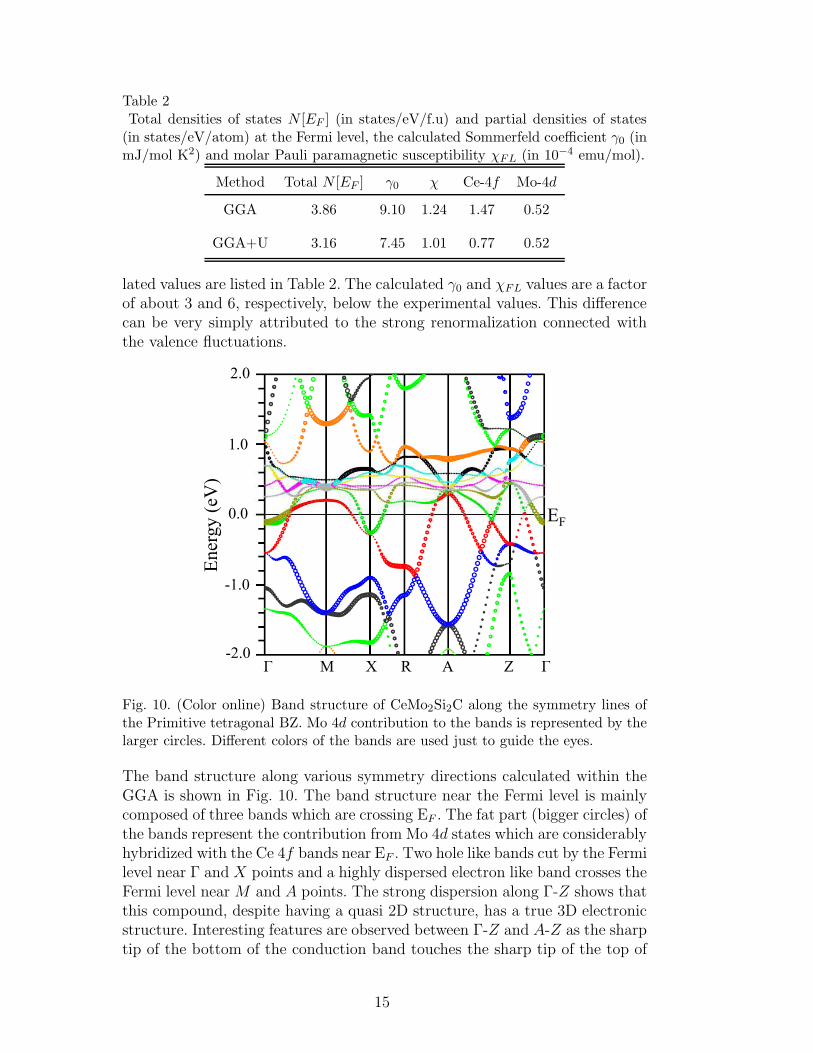
Table 2Total densities of states N [EF ] (in states/eV/f.u) and partial densities of states(in states/eV/atom) at the Fermi level, the calculated Sommerfeld coefficient γ0 (inmJ/mol K2) and molar Pauli paramagnetic susceptibility χFL (in 10−4 emu/mol).
Method Total N [EF ] γ0 χ Ce-4f Mo-4d
GGA 3.86 9.10 1.24 1.47 0.52
GGA+U 3.16 7.45 1.01 0.77 0.52
lated values are listed in Table 2. The calculated γ0 and χFL values are a factorof about 3 and 6, respectively, below the experimental values. This differencecan be very simply attributed to the strong renormalization connected withthe valence fluctuations.
2.0
1.0
y (
eV)
0.0 EF
En
ergy
1 0
F
-1.0
-2.0 M X R A Z
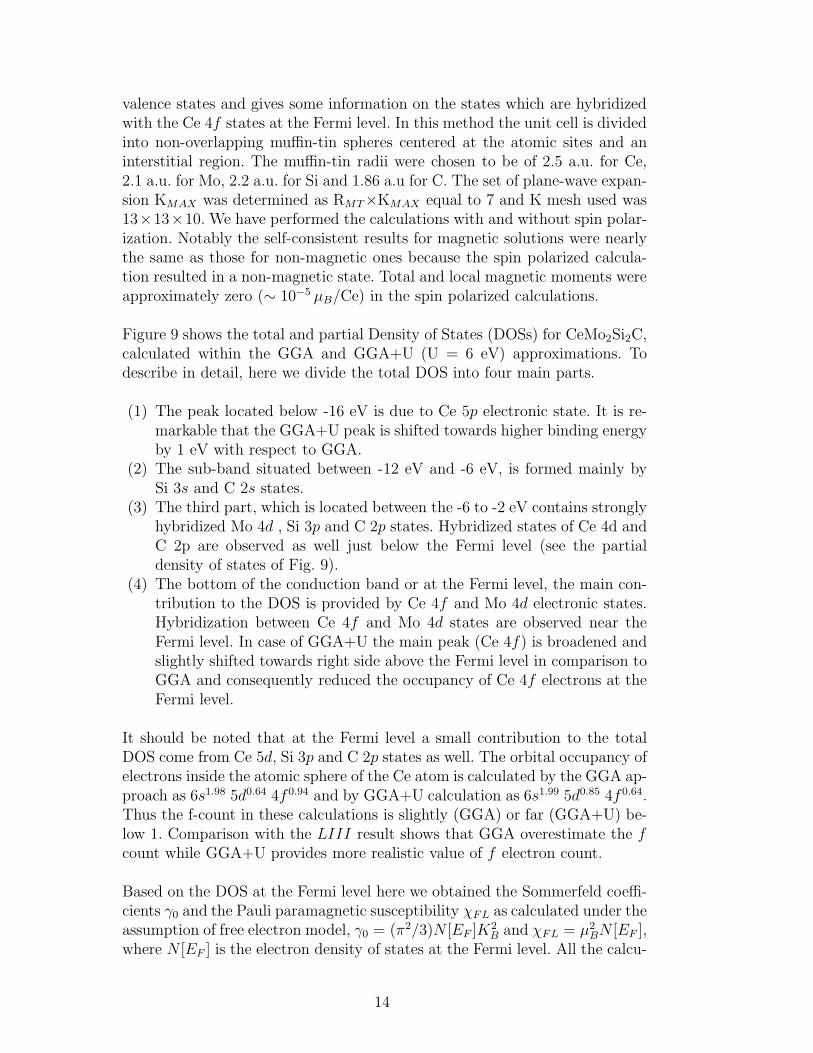
Fig. 10. (Color online) Band structure of CeMo2Si2C along the symmetry lines ofthe Primitive tetragonal BZ. Mo 4d contribution to the bands is represented by thelarger circles. Different colors of the bands are used just to guide the eyes.
The band structure along various symmetry directions calculated within theGGA is shown in Fig. 10. The band structure near the Fermi level is mainlycomposed of three bands which are crossing EF . The fat part (bigger circles) ofthe bands represent the contribution from Mo 4d states which are considerablyhybridized with the Ce 4f bands near EF . Two hole like bands cut by the Fermilevel near Γ and X points and a highly dispersed electron like band crosses theFermi level near M and A points. The strong dispersion along Γ-Z shows thatthis compound, despite having a quasi 2D structure, has a true 3D electronicstructure. Interesting features are observed between Γ-Z and A-Z as the sharptip of the bottom of the conduction band touches the sharp tip of the top of
15
the valence band.
4 Conclusion
To summarize, our comprehensive studies of physical properties of CeMo2Si2Cby χ(T ), C(T ), ρ(T ), and XAS measurements reveal the valence fluctuatingstate of Ce in CeMo2Si2C. The compound crystallizes in the CeCr2Si2C-typelayered tetragonal structure (space group P4/mmm). The value of magneticsusceptibility is very low and almost independent of temperature except acurie tail at lower temperature (as observed in many valence fluctuating com-pounds) which arises due to a small amount (∼ 6 %) of an impurity Ce3+
phase present in the sample. An ICF analysis of χ(T ) result in a fluctuationtemperature Tsf = 205 ± 3 K and an interconfigurational excitation energyEex = 677 ± 12 K. The temperature dependence of specific heat at zero mag-netic field does not show any anomaly throughout the temperature range andhence confirms the absence of any magnetic ordering down to 2 K. The Som-merfeld coefficient obtained from the specific heat data γ = 23.4 mJ/mol K2
is relatively low for a valence fluctuating compound which indicates a stronghybridization of Ce 4f states with the conduction states at the Fermi level.The electrical resistivity exhibits a metallic behavior with a T 2 dependence inthe low temperature range indicating the Fermi liquid behavior as observed formany Ce-based valence fluctuating systems. XAS studies indicate an averageformal LIII valence <ν> = 3.11 hence gives a direct evidence for valence fluc-tuations. Nevertheless, this value is less than that obtained for a tetravalentCeO2 (<ν> ≃ 3.4). The density functional calculations show strong disper-sions along all direction evidencing a 3D electronic structure despite the quasi2D chemical structure. Strong hybridization is found between Mo 4d, Si 3pand C 2p states, and between Ce 4d and C 2p states at lower binding ener-gies below the Fermi level. The bands at the Fermi level bear a large Mo 4dcharacter and provide the states which are hybridized with the Ce 4f states.
Acknowledgements
This work has been supported by the Council of Scientific and IndustrialResearch, New Delhi (Grant No. 80(0080)/12/ EMR-II).
References
[1] D. Wohlleben and B. Wittershagen, Adv. Phys. 34, (1985) 403.
16
[2] G. R. Stewart, Rev. Mod. Phys. 56, (1984) 755.
[3] N. B. Brandt and V. V. Moshchalkov, Adv. Phys. 33, (1984) 373.
[4] P. Gegenwart, Q. Si, and F. Steglich, Nature Phys. 4, (2008) 186.
[5] S. Doniach, Physica B 91, (1977) 231.
[6] C. Lacroix and M. Cyrot, Phys. Rev. B 20, (1979) 1969.
[7] F. Steglich, J. Aarts, C. D. Bredl, W. Lieke, D. Meschede, W. Franz, and H.Schafer, Phys. Rev. Lett. 43, (1979) 25.
[8] H. Q. Yuan, F. M. Grosche, M. Deppe, C. Geibel, G. Sparn, and F. Steglich,Science 302, 5653 (2003) 2104.
[9] E. Lengyel, M. Nicklas, H. S. Jeevan, C. Geibel, and F. Steglich, Phys. Rev.Lett. 107, (2011) 057001.
[10] S. Nakatsuji, K. Kuga, Y. Machida, T. Tayama, T. Sakakibara, Y. Karaki, H.Ishimoto, S. Yonezawa, Y. Maeno, E. Pearson, G. G. Lonzarich, L. Balicas, H.Lee, and Z. Fisk, Nature Physics, 4, (2008) 603.
[11] Yosuke Matsumoto, Kentaro Kuga, Takahiro Tomita, Yoshitomo Karaki, andSatoru Nakatsuji Phys. Rev. B 84, (2011) 125126.
[12] Matsumoto Yosuke, Nakatsuji Satoru, and Kuga Kentaro, Science 331, (2011)6015 316.
[13] E. Dashjav, W. Schnelle, F. R. Wagner, G. Kreiner, and R. Kniep, Z. Kristallogr.NCS 221, (2006) 267.
[14] V. Klosek, A. Verniere, B. Malaman, J. Tobola, S. Kaprzyk, Phys. Rev. B 78,(2008) 104419.
[15] Chengchun Tang , Shoushan Fan , Meijian Zhu, J. of Allyos and Compounds299, (2000) 1.
[16] K. Mukherjee, K. K. Iyer, and E. V. Sampathkumaran, J. Phys. : Condens.Matter 22, (2010) 295603.
[17] Athena, Artemis, Hephaestus: data analysis for X-ray absorption spectroscopyusing IFEFFIT, J. Synchrotron Rad. 12, (2005) 537.
[18] K. Koepernik and H. Eschrig, Phys. Rev. B 59, (1999) 1743.
[19] P. Blaha, K. Schwarz, and G. Madsen, An Augmented Plane Wave Plus LocalOrbitals Program for Calculating Crystal Properties. Vienna University ofTechnology, Vienna (2001).
[20] V. I. Anisimov and O. Gunnarsson Phys. Rev. B 43, (1991) 7570.
[21] J. P. Perdew, K. Burke, and M. Ernzerhof, Phys. Rev. Lett. 77, (1996) 3865.
17
[22] D. Kaczorowski, A. P. Pikul, U. Burkhardt, M. Schmidt, A. Slebarski, A.Szajek, M. Werwinski, and Yu Grin, J. Phys.: Condens. Matter 22, (2010)215601.
[23] J. Rodrıguez-Carvajal, Physica B 192, 55 (1993); Program Fullprof, LLB-JRC,Laboratoire Leon Brillouin, CEA-Saclay, France, 1996.
[24] S. Layek, V. K. Anand, and Z. Hossain, J. Magn. Magn. Mater 321, (2009)3447.
[25] D. P. Rojas, L. C. J. Pereira, P. Salamakha, E. B. Lopes, J. C. Waerenborgh,L. M. da Silva, and F. G. Gandra, J. Alloys Compd. 391, (2005) L5.
[26] A. Kowalczyk, M. Pugaczowa-Michalska, and T. Tolinski, Phys. Status SolidiB 242, (2005) 433.
[27] C. Mazumdar, R. Nagarajan, S. K. Dhar, L. C. Gupta, R. Vijayaraghavan, andB. D. Padalia, Phys. Rev. B 46, (1992) 9009.
[28] E. Alleno, Z. Hossain, C. Godart, R. Nagarajan and L. C. Gupta, Phys. Rev.B 52, (1995) 7428.
[29] U. Rauchschwalbe, W. Lieke, F. Steglich, C. Godart, L. C. Gupta, and R. D.Parks Phys. Rev. B 30, (1984) 444.
[30] L. L. Hirst, Phys. Kondens. Mater. 11, (1970) 255.
[31] B. C. Sales, D. K. Wohlleben, Phys. Rev. Lett. 35, (1975) 1240.
[32] W. Franz, F. Steglich, W. Zell, D. Wohlleben, and F. Pobell, Phys. Rev. Lett.45, (1980) 64.
[33] S. K. Malik, and D. T. Adroja, Phys. Rev. B. 43, (1991) 6277(R).
[34] H. Yashima, H. Mori, T. Satoh, and K. Kohn, Solid State Commun. 43, (1982)193.
[35] J. W. Allen, S.-J. Oh, I. Lindau, M. B. Maple, J. F. Suassuna, and S. B.Hagstrom, Phys. Rev. B 26, (1982) 445.
[36] C. Kittel, Introduction to Solid State Physics, 8th edition (Wiley, New York,2005).
[37] K. Andres, J. E. Graebner, and H. R. Ott, Phys. Rev. Lett. 35, (1975) 1779.
[38] K. Kadowaki and S. B. Woods, Solid State Commun. 58, (1986) 507.
[39] N. Tsujii H. Kontani, and K. Yoshimura, Phys. Rev. Lett. 94, (2005) 057201.
[40] E. E. Vainshtein, S. M. Bloklin, and Y. B. Paderno, Sov. Phys. Solid State 6,(1965) 2318.
18

![arXiv:0809.4897v3 [math.RT] 14 Feb 2010](https://static.fdocument.org/doc/165x107/6169dd0511a7b741a34c3520/arxiv08094897v3-mathrt-14-feb-2010.jpg)
![arXiv:1402.0554v2 [math.DG] 13 Oct 2014](https://static.fdocument.org/doc/165x107/61f6310056ebe4599706ea79/arxiv14020554v2-mathdg-13-oct-2014.jpg)
![arXiv:2109.00944v1 [math.CO] 2 Sep 2021](https://static.fdocument.org/doc/165x107/6169bdd411a7b741a34ad8e8/arxiv210900944v1-mathco-2-sep-2021.jpg)
![arXiv:2001.03873v1 [math.PR] 12 Jan 2020](https://static.fdocument.org/doc/165x107/61d127520915697de928ec36/arxiv200103873v1-mathpr-12-jan-2020.jpg)
![arXiv:1010.2424v1 [hep-th] 12 Oct 2010 · arXiv:1010.2424v1 [hep-th] 12 Oct 2010 Θεωρίαχορδώνκαιφυσικέςεφαρμογέςαυτήςσε ...](https://static.fdocument.org/doc/165x107/5edd1a42ad6a402d66681158/arxiv10102424v1-hep-th-12-oct-2010-arxiv10102424v1-hep-th-12-oct-2010-ff.jpg)
![arXiv:2111.04391v1 [math.OC] 8 Nov 2021](https://static.fdocument.org/doc/165x107/61d35e3d10581779f3727cb5/arxiv211104391v1-mathoc-8-nov-2021.jpg)
![arXiv:1504.08157v1 [math.FA] 30 Apr 2015](https://static.fdocument.org/doc/165x107/61e1574303fa89661c3edcb6/arxiv150408157v1-mathfa-30-apr-2015.jpg)


![arXiv:1408.3858v3 [math.CO] 30 Nov 2015](https://static.fdocument.org/doc/165x107/61aad0fff556580fb75f94c4/arxiv14083858v3-mathco-30-nov-2015.jpg)
![arXiv:1701.02964v1 [math.NT] 11 Jan 2017](https://static.fdocument.org/doc/165x107/616fad47a6f2c87b131207e7/arxiv170102964v1-mathnt-11-jan-2017.jpg)
![arXiv:1407.1527v1 [math.QA] 6 Jul 2014](https://static.fdocument.org/doc/165x107/61fbdd68675b262e674da46b/arxiv14071527v1-mathqa-6-jul-2014.jpg)

![arXiv:2106.12439v1 [math.AP] 23 Jun 2021](https://static.fdocument.org/doc/165x107/61ca9583f0b22249394bd28a/arxiv210612439v1-mathap-23-jun-2021.jpg)