Thermal study of target
15
T HERMAL STUDY OF TARGET Benjamin Lepers IPHC Strasbourg June 2, 2010 Benjamin Lepers, Gerard Gaudiot () Meeting - WP2 - EUROν-Strasbourg June 2, 2010 1 / 15
Transcript of Thermal study of target
THERMAL STUDY OF TARGET
Benjamin LepersIPHC Strasbourg
June 2, 2010
Benjamin Lepers, Gerard Gaudiot () Meeting - WP2 - EURO ν-Strasbourg June 2, 2010 1 / 15
OUTLINE
Goalobtain max temperature inside the target, select materials, powerfeasibility, cooling requirements
Modelgeometry, equations; boundary conditions
Resultspower distribution; temperature distribution
Benjamin Lepers, Gerard Gaudiot () Meeting - WP2 - EURO ν-Strasbourg June 2, 2010 2 / 15
HORN PROTOTYPE, CERN
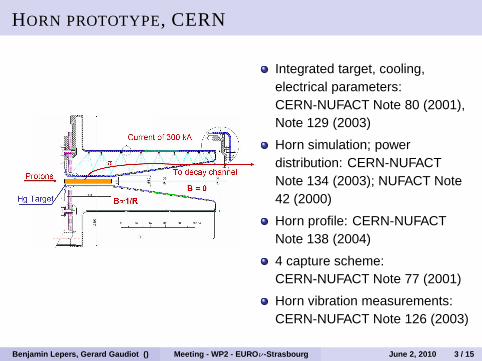
Integrated target, cooling,electrical parameters:CERN-NUFACT Note 80 (2001),Note 129 (2003)
Horn simulation; powerdistribution: CERN-NUFACTNote 134 (2003); NUFACT Note42 (2000)
Horn profile: CERN-NUFACTNote 138 (2004)
4 capture scheme:CERN-NUFACT Note 77 (2001)
Horn vibration measurements:CERN-NUFACT Note 126 (2003)
Benjamin Lepers, Gerard Gaudiot () Meeting - WP2 - EURO ν-Strasbourg June 2, 2010 3 / 15

GEOMETRY
horn current
target regionz
R
electromagnetic horn to focusthe pions
integrated target
2 heat sources: beam + joulelosses
cooling circuit, impinging jets
axi symmetric model, radiusR = 1.5 cm, length L = 78 cm.
boundary conditions:insulation + convection
h = 5,10,15,20 kW/(m2K)
Benjamin Lepers, Gerard Gaudiot () Meeting - WP2 - EURO ν-Strasbourg June 2, 2010 4 / 15
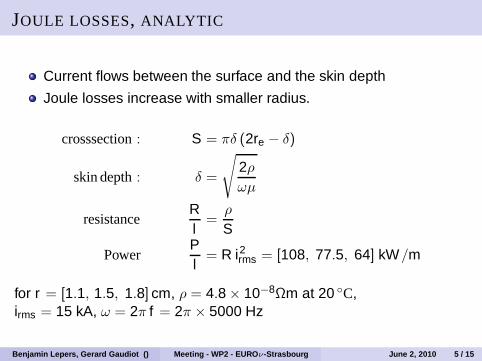
JOULE LOSSES, ANALYTIC
Current flows between the surface and the skin depth
Joule losses increase with smaller radius.
crosssection: S = πδ (2re − δ)
skin depth: δ =
√
2ρωµ
resistanceRl=
ρ
S
PowerPl= R i2rms = [108, 77.5, 64] kW/m
for r = [1.1, 1.5, 1.8] cm, ρ = 4.8 × 10⁻⁸Ωm at 20 C,irms = 15 kA, ω = 2π f = 2π × 5000 Hz
Benjamin Lepers, Gerard Gaudiot () Meeting - WP2 - EURO ν-Strasbourg June 2, 2010 5 / 15
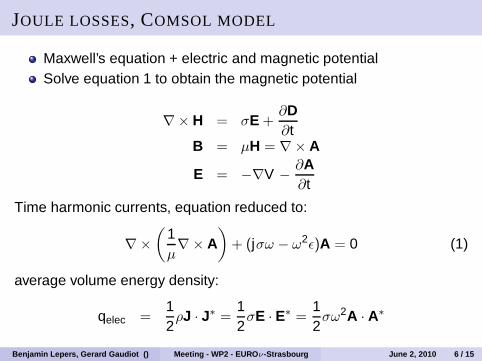
JOULE LOSSES, COMSOL MODEL
Maxwell’s equation + electric and magnetic potentialSolve equation 1 to obtain the magnetic potential
∇× H = σE +∂D∂t
B = µH = ∇× A
E = −∇V −∂A∂t
Time harmonic currents, equation reduced to:
∇×
(
1µ∇× A
)
+ (jσω − ω2ε)A = 0 (1)
average volume energy density:
qelec =12ρJ · J∗ =
12σE · E∗ =
12σω2A · A∗
Benjamin Lepers, Gerard Gaudiot () Meeting - WP2 - EURO ν-Strasbourg June 2, 2010 6 / 15

HEAT EQUATION, STEADY STATE
∇ · [k ∇T (r , z)] + q(r , z) = 0
q(r , z) = qbeam(r , z) + qelec(r , z)
k is the thermal conductivity.
qbeam: power distribution inside the target, obtained with Flukasimulation. Pbeam = 1,4 MW, proton kinetic energy 4.5 GeV,beam width σbm = 4,6 mm.
qelec: resistive loss with irms = 15 kA
material conductivity σbm Qbeam Qelec
[W/mK] [mm] [kW] [kW]Al 170 4 278 60
6 256 60Be 80. . . 200 4 165 56.3
6 153 56.3
Benjamin Lepers, Gerard Gaudiot () Meeting - WP2 - EURO ν-Strasbourg June 2, 2010 7 / 15

BOUNDARY CONDITIONS
Thermal
Thermal insulation q = 0 everywhere except on the surfacer = 1.5 cm
Convection cooling on the cylinder surface withh = 5,10,15,20kW/(m2K)
q = 2πR L h (Ts − T∞)
Ts and T∞ the surface and fluid temperature, q heat flux
Electrical
z = 0, 0.78 m, r = 0 m: ∇× A = 0 ( A⊥ = 0 and Bn = 0)
r = R; surface current: Js = I02πR =
√2×15kA2πR
Benjamin Lepers, Gerard Gaudiot () Meeting - WP2 - EURO ν-Strasbourg June 2, 2010 8 / 15
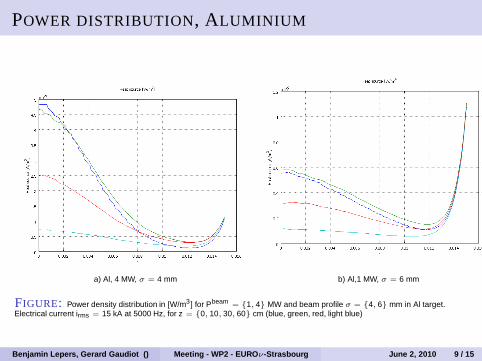
POWER DISTRIBUTION, ALUMINIUM
a) Al, 4 MW, σ = 4 mm b) Al,1 MW, σ = 6 mm
FIGURE: Power density distribution in [W/m3] for Pbeam= 1, 4 MW and beam profile σ = 4, 6 mm in Al target.
Electrical current irms = 15 kA at 5000 Hz, for z = 0, 10, 30, 60 cm (blue, green, red, light blue)
Benjamin Lepers, Gerard Gaudiot () Meeting - WP2 - EURO ν-Strasbourg June 2, 2010 9 / 15
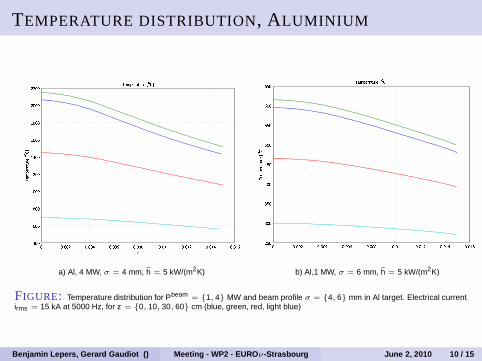
TEMPERATURE DISTRIBUTION, ALUMINIUM
!" #$%&# '()*+,-.--.,-/--/,-,--,,-0--0,-
123425678529:;< - -=--+ -=--/ -=--0 -=--> -=-? -=-?+ -=-?/ -=-?0#a) Al, 4 MW, σ = 4 mm, h = 5 kW/(m2K) b) Al,1 MW, σ = 6 mm, h = 5 kW/(m2K)
FIGURE: Temperature distribution for Pbeam= 1, 4 MW and beam profile σ = 4, 6 mm in Al target. Electrical current
irms = 15 kA at 5000 Hz, for z = 0, 10, 30, 60 cm (blue, green, red, light blue)
Benjamin Lepers, Gerard Gaudiot () Meeting - WP2 - EURO ν-Strasbourg June 2, 2010 10 / 15

POWER DISTRIBUTION, BERYLLIUM@ABC DEFGHA IJKLMNOOPQR
RPQSSPQT
UVWXYZ[\]V_abcdROeO OPOOS OPOOf OPOOg OPOOh OPOR OPORS OPORf OPORgG
ijkl mnopqj rstuvwxxyzxyxy|xyxy~xyxyxyxyzzyz
zxx xyxx xyxx xyxx xyxx xyxz xyxz xyxz xyxzp
a) Be, 4 MW, σ = 4 mm b) Be,1 MW, σ = 6 mm
FIGURE: Power density distribution in [W/m3] for Pbeam= 1, 4 MW and beam profile σ = 4, 6 mm in Be target.
Electrical current irms = 15 kA at 5000 Hz, for z = 0, 10, 30, 60 cm (blue, green, red, light blue)
Benjamin Lepers, Gerard Gaudiot () Meeting - WP2 - EURO ν-Strasbourg June 2, 2010 11 / 15

TEMPERATURE DISTRIBUTION, BERYLLIUM ¡¡¢¡¡£¡¡¤¡¡¡¤¥¡¡¤ ¡¡¤¢¡¡¤£¡¡¥¡¡¡
¦§©§ª«¬ª§®°± ¡ ¡²¡¡¥ ¡²¡¡ ¡²¡¡¢ ¡²¡¡£ ¡²¡¤ ¡²¡¤¥ ¡²¡¤ ¡²¡¤¢³´µ¶´·¸¹º·´ »¼½¾
¿ÀÀ¿ÁÀÂÀÀÂÁÀÃÀÀÃÁÀÁÀÀÄÅÆÇÅÈÉÊËÈÅÌÍÎÏ À ÀÐÀÀ¿ ÀÐÀÀÃ ÀÐÀÀÑ ÀÐÀÀÒ ÀÐÀÓ ÀÐÀÓ¿ ÀÐÀÓÃ ÀÐÀÓÑ·
a) Be, 4 MW, σ = 4 mm, h = 5 kW/(m2K) b) Be,1 MW, σ = 6 mm, h = 5 kW/(m2K)
FIGURE: Temperature distribution for Pbeam= 1, 4 MW and beam profile σ = 4, 6 mm in Be target. Electrical current
irms = 15 kA at 5000 Hz, for z = 0, 10, 30, 60 cm (blue, green, red, light blue)
continue with h = 5,10,15,20 kW/(m2K)Benjamin Lepers, Gerard Gaudiot () Meeting - WP2 - EURO ν-Strasbourg June 2, 2010 12 / 15

TEMPERATURE VERSUS CONVECTION COEFF H, AL
Aluminium_4MW
300400500600700800900
100011001200130014001500160017001800190020002100
0 5000 10000 15000 20000 25000
h coefficient (W/(m^2K))
Tem
pera
ture
[°C
]
Aluminium_1MW
100
150
200
250
300
350
400
450
500
550
600
650
700
0 5000 10000 15000 20000 25000
h coeff convection (W/(m^2 K))
Tem
pera
ture
(°C
)
Tcore, Ts: core and surface temperaturefor σbm
= 4, 6 mm and Pbeam= 4 MW
T 4mmcore , T 6mm
core , T 4mms , T 6mm
s (yellow, purple,blue, brown)
Temperature exceeds melting point of Al(555 C)at 4 MW
not feasible with Aluminium at 4 MW forthis h cooling range
T 4mmcore , T 6mm
core , T 4mms , T 6mm
s (dark blue,green, pink, blue) for σbm
= 4, 6 andPbeam
= 1 MW
Tcore . 300 C → h & 13,20kW/m2K(σ = 6, 4mm)
large core temperature differencebetween σ = 6, 4mm beam, not forsurface temperature
Benjamin Lepers, Gerard Gaudiot () Meeting - WP2 - EURO ν-Strasbourg June 2, 2010 13 / 15
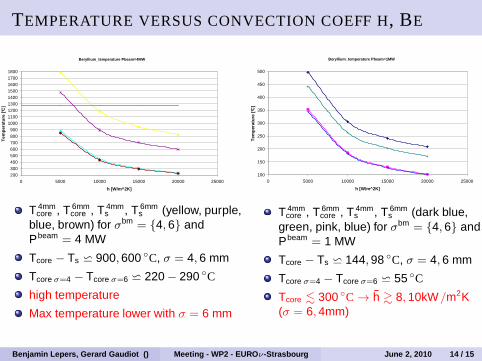
TEMPERATURE VERSUS CONVECTION COEFF H, BE
Beryllium_temperature Pbeam=4MW
200
300
400
500
600
700
800
900
1000
1100
1200
1300
1400
1500
1600
1700
1800
0 5000 10000 15000 20000 25000
h [W/m^2K]
Tem
pera
ture
[°C
]
Beryllium_temperature Pbeam=1MW
100
150
200
250
300
350
400
450
500
0 5000 10000 15000 20000 25000
h [W/m^2K]
Tem
pera
ture
[°C
]
T 4mmcore , T 6mm
core , T 4mms , T 6mm
s (yellow, purple,blue, brown) for σbm
= 4, 6 andPbeam
= 4 MW
Tcore − Ts w 900,600 C, σ = 4, 6 mm
Tcore σ=4 − Tcore σ=6 w 220 − 290 C
high temperature
Max temperature lower with σ = 6 mm
T 4mmcore , T 6mm
core , T 4mms , T 6mm
s (dark blue,green, pink, blue) for σbm
= 4, 6 andPbeam
= 1 MW
Tcore − Ts w 144,98 C, σ = 4, 6 mm
Tcore σ=4 − Tcore σ=6 w 55 C
Tcore . 300 C → h & 8, 10kW/m2K(σ = 6, 4mm)
Benjamin Lepers, Gerard Gaudiot () Meeting - WP2 - EURO ν-Strasbourg June 2, 2010 14 / 15
CONCLUSION – NEXT STEPS
Study of target cooling for 1,4 MW - beam and Joule effect
Aluminium material cannot be used at 4 MW
Possible for Beryllium (and also AlBeMet, Carbon)
Seem difficult to use a solid target at 4 MW; need very efficientcooling h & 20kW/(m2K )
Ok at 1 MW with high cooling rate h ∼ 10kW/(m2K )
Next stepscooling - find explicit realisations: flow rates, pressures, nozzledimensionsdesign complexity versus physics performance degradation
Other: mechanical stress
Benjamin Lepers, Gerard Gaudiot () Meeting - WP2 - EURO ν-Strasbourg June 2, 2010 15 / 15