The Selective Hydrogenation of octanal in the presence of ...
172
The Selective Hydrogenation of octanal in the presence of octene using γ-alumina supported copper-silver bimetallic catalysts by Letisha Deeplal School of Chemistry and Physics University of KwaZulu-Natal Westville Durban 4000
Transcript of The Selective Hydrogenation of octanal in the presence of ...
The Selective Hydrogenation
of octanal in the presence of octene using
γ-alumina supported copper-silver bimetallic
catalysts
by
Letisha Deeplal
School of Chemistry and Physics
University of KwaZulu-Natal
Westville
Durban
4000
ii
The Selective Hydrogenation
of octanal in the presence of octene using
γ-alumina supported copper-silver bimetallic
catalysts
by
Letisha Deeplal
School of Chemistry and Physics
University of KwaZulu-Natal
Westville
Durban
4000
Submitted in fulfillment of the academic
requirements, for the degree
Masters of Science in the
School of Chemistry and Physics
University of KwaZulu-Natal,
November 2014
i
Abstract This work pertains to the selective hydrogenation of octanal in the presence of octene, which has
applications in the hydroformylation process. The octanal should be hydrogenated to the desired
product, octanol, while avoiding or inhibiting the hydrogenation of octene. Since octene is more
thermodynamically favoured to hydrogenate, complete octene hydrogenation inhibition is
difficult.
This study aims to obtain a deeper understanding of the surface chemistry, which occurs on γ-
alumina supported copper-silver bimetallic catalysts. This was done by first investigated
monometallic copper catalyst at different weight loadings (5 and 15 wt%), then extending this to
different weight loadings of the CuAg bimetallic catalysts, while maintaining the total metal
loading. Additionally, the effect of the Cu-Ag metal ratios and impregnation sequence were
investigated. Seven CuAg bimetallic catalysts and two Cu monometallic catalysts were
synthesized via wet impregnation, and characterized using various techniques to determine
surface morphology and the metal-metal and metal-support interaction on the catalyst surface.
The characterization showed higher copper loadings (15 wt%) formed agglomerates. The 5 wt%
catalysts showed the metals to be well dispersed, with the effect of impregnation sequence
showed significant differences simultaneous impregnation and the sequential bimetallic catalysts
resulting in changes to the metal dispersion and catalyst acidity.
The feed used consisted of 2% octene, 10% octanal and 88% octanol. All reactions were
temperature and pressure dependent, with optimum conditions of 50 bar and 160 °C. The overall
result from catalytic testing showed silver to play a significant role in the selective hydrogenation
of octanal in the presence of octene. The effect of impregnation sequence showed the
simultaneous impregnation to give higher octanal and octene conversions, compared to the
sequential impregnation catalysts, due to the synergistic effect between two metals in close
contact with each other. Sequential impregnation showed that when the copper was impregnated
first followed by silver, produced lower octene conversions, and hence was a more suitable
catalyst system for selective hydrogenation. This research showed that γ-alumina supported

ii
CuAg catalysts are beneficial for the selective hydrogenation of octanal while in the presence of
octene in a competitive reaction environment.

iii
Preface
I hereby declare that the work conducted in this research effort and presented in this thesis, is my
own work conduced from February 2013 to November 2014, at the Catalysis Research Group at
the University of KwaZulu-Natal, Westville, Durban, under the supervision of Prof. Holger B.
Friedrich.
This work has not been submitted at this or any other university or tertiary institution. Where the
work of others have been used, it has been duly recognized in this text.
iv
Declaration
I, Letisha Deeplal, declare that:
1. The research reported in this thesis , except where otherwise indicated, is my own work
2. This thesis has not been submitted for any degree or examination at any other university
or tertiary institution
3. This thesis does not contain any other person’s data, pictures, graphs, or any other
information unless specifically acknowledged as being sourced from other persons
4. This thesis does not contain other person’s writing unless specifically acknowledged as
being sourced from other researchers. Where other written sources have been quoted,
then:
(a) Their words have been re-written but the general information attributed to them has
been referenced
(b) Where exact words have been used, then their writing has been placed in italics and
inside quotation marks, and referenced
5. This thesis does not contain text, graphics or tables copied and pasted from the internet,
unless specifically acknowledged, and the source being detailed in the thesis and in the
Reference sections
Signed
Letisha Deeplal
v
Conference Contributions
Parts of this work have been presented at conferences and is detailed below:
1. Poster presentation, Catalysis Society of South Africa (CATSA) conference, Port Edward,
RSA, November 2013, titled Copper-Silver bimetallic catalysts for the selective
hydrogenation of octanal in the presence of octene
2. Oral presentation, Particle technology workshop, Cape Town, RSA, November 2014, titled
An understanding of surface characterization for Copper-Silver bimetallic catalysts for
selective hydrogenation: Effect of Impregnation
vi
Acknowledgements
I would like to sincerely acknowledge and extend my gratitude to the following people for their
assistance throughout my Masters study.
I would like to thank the NRF, THRIP and Sasol as this work would not have been possible
without their financial support
To Prof Holger Friedrich, my supervisor, thank you for the guidance and expertise. I will
treasure the knowledge I have gained in my Masters study.
To my mentor, Dr Nico Prinsloo from Sasol, thank you for the valuable advice and
contribution.
To my family, thank you for all the love, support, and strength throughout my academic life.
I am grateful for all the time and effort you all have put it to ensure I succeed.
I express a warm thanks to Phillip and Vishaal, from the EM Unit at UKZN, for the
assistance and help with the electron microscopy instruments. In addition, I would like to
thank the technical staff at UKZN for the assistance and help with the completion of my
research.
Thanks to the following people that assisted with the instrumentation analysis and
interpretation, reactor building and troubleshooting, Dr Abdul. S. Mahomed, Dr Venkat
Dasireddy, Drushan, Jignesh, Mo, Samkelo, Thashini, and Ziyaad.
To the friends I have made throughout my academic career- Chrisanne, Kershen, Mzamo,
Sandeeran, Shirveen, Shivania, Terelle, Veresha, and the Catalysis Research Group at
UKZN– Thanks for the help, be it for assistance with research or just providing good

vii
memories. Your support has helped me to overcome the many setbacks and frustrations that
come with completing a postgrad degree.
Lastly, I would like to thank Triven for being my rock, my sounding board, and my biggest
supporter.

viii
Dedication
To my loved ones: Mum, Dad, Candice, Triven, and the newest addition – Aiden
“And whatever you do, whether in word or deed, do it all in the name of the Lord Jesus Christ,
giving thanks to God the Father through him” – Colossians 3:17
ix
Contents Abstract ............................................................................................................................................ i
Preface............................................................................................................................................ iii
Declaration ..................................................................................................................................... iv
Conference Contributions ............................................................................................................... v
Acknowledgements ........................................................................................................................ vi
Dedication .................................................................................................................................... viii
Abbreviations ............................................................................................................................... xxi
Equations.................................................................................................................................... xxiii
Chapter 1 ......................................................................................................................................... 1
Introduction and Literature Review ................................................................................................ 1
1.1. Catalysis ............................................................................................................................... 1
1.2. Homogeneous catalysis .................................................................................................... 4
1.3. Heterogeneous catalysis ................................................................................................... 5
1.4. Methods of preparation .................................................................................................... 7
1.5. Types of reactors .............................................................................................................. 8
1.6. Hydrogenation ................................................................................................................ 10
1.6.1. History of hydrogenation ........................................................................................ 10
1.7. Catalytic hydrogenation ................................................................................................. 11
1.8. Hydrogenation of alkenes (C=C) ................................................................................... 13
1.9. Possible mechanisms for alkene hydrogenation............................................................. 14
1.9.1. Langmuir-Hinshelwood mechanism ........................................................................... 14
1.9.2. Horiuti-Polanyi mechanism ........................................................................................ 14
1.10. Hydrogenation of aldehydes ....................................................................................... 15
1.11. Catalytic selective hydrogenation ............................................................................... 16
1.11.1. Partial hydrogenation of alkynes to cis-olefins ....................................................... 17
1.11.2. Hydrogenation of furfural to produce furfuryl alcohol ........................................... 18
1.11.3. Hydrogenation of acetylene and diene impurities in alkene feedstocks ................. 19
1.11.4. Selective hydrogenation in the hydroformylation process...................................... 20

x
1.12. Possible reactions from the hydrogenation of octanal in the presence of octene ....... 22
1.12.1. Main reactions ............................................................................................................ 22
1.12.2. Byproducts .................................................................................................................. 23
1.12.3. Hydrogenation of α,β-unsaturated aldehydes ......................................................... 25
1.13. Selective hydrogenation catalysts ............................................................................... 27
1.13.1. Platinum group metals ............................................................................................ 27
1.13.2. Group 11 metals (Cu, Ag, Au) ................................................................................ 28
1.13.2.1. Copper ................................................................................................................. 28
1.13.2.2. Silver ................................................................................................................... 29
1.13.2.3. Gold ..................................................................................................................... 31
1.14. Bimetallic catalyst ...................................................................................................... 31
1.15. Aims and objectives ....................................................................................................... 35
Chapter 2 ....................................................................................................................................... 36
Instrumental Techniques and Reactor Design .............................................................................. 36
2.1. Catalyst synthesis ........................................................................................................... 36
2.2. Chemicals used for testing and analysis ......................................................................... 36
2.3. Instrumentation and preparation..................................................................................... 37
2.3.1. Infrared spectroscopy – attenuated transmission reflectance.................................. 37
2.3.2. Inductively coupled plasma – optical emission spectrometry ................................ 37
2.3.3. X-ray diffractogram ................................................................................................ 38
2.3.4. Nitrogen physisorption............................................................................................ 38
2.3.5. Scanning electron microscopy- energy dispersive X-ray spectroscopy (SEM-EDX) 39
2.3.6. Transmission electron microscopy (TEM) ............................................................. 39
2.3.7. High resolution- transmission electron microscopy - energy dispersive X-ray spectroscopy (HRTEM-EDX) ............................................................................................... 39
2.3.8. Temperature programmed reduction/desorption (TPR/TPD) ................................. 40
2.3.9. Chemisorption ......................................................................................................... 40
2.3.10. Thermal gravimetric analysis – differential scanning calorimetry (TGA-DSC) .... 40
2.4. Gas chromatography ...................................................................................................... 41
2.5. Catalyst synthesis ........................................................................................................... 41
xi
2.5.1. The monometallic catalyst - 5Cu/γ-Al2O3 .................................................................. 41
2.5.2. The bimetallic catalyst - 4.5Cu-0.5Ag/γ-Al2O3 .......................................................... 42
2.6. Reactor set up ................................................................................................................. 43
2.7. Catalytic testing .............................................................................................................. 44
3. Results and Discussion: Characterization ................................................................................. 45
3.1. Infra Red-Attenuated total reflectance (ATR) ............................................................... 45
3.2. Inductively coupled plasma-optical emission spectroscopy (ICP-OES)........................ 48
3.3. X-ray diffraction ............................................................................................................. 48
3.3.1. Powder XRD ........................................................................................................... 48
3.3.2. In situ XRD ............................................................................................................. 51
3.4. Brunauer-Emmet-Teller (BET) analysis ........................................................................ 53
3.5. Chemisorption ................................................................................................................ 55
3.6. Transmission electron microscopy (TEM) ..................................................................... 61
3.7. Scanning transmission electron microscopy (STEM-EDX) .......................................... 63
3.7.1. STEM-EDX mapping ............................................................................................. 63
3.7.2. STEM-EDX line scan ............................................................................................. 65
3.8. Scanning electron microscopy (SEM-EDX) .................................................................. 66
3.8.1. SEM line scan ......................................................................................................... 69
3.9. Temperature programmed reduction (TPR) ................................................................... 72
3.10. Temperature programmed desorption (NH3-TPD) ..................................................... 77
3.11. Thermal gravimetric analysis –differential scanning calorimetry (TGA-DSC) ......... 79
3.12. Summary ..................................................................................................................... 80
4. Catalytic Results and Discussion .............................................................................................. 83
4.1. Optimization of reaction conditions using monometallic copper catalysts.................... 83
4.1.1. Effect of pressure using the 5Cu/γ-Al2O3, .............................................................. 84
4.1.2. Effect of reduction temperature on the 5Cu//γ-Al2O3 ............................................. 85
4.1.3. Effect of temperature on a 15 wt% Cu/γ-Al2O3 catalyst ......................................... 90
4.1.4. Effect of liquid hourly space velocity (LHSV) ....................................................... 92
4.1.5. Effect of octanal: hydrogen ratio ............................................................................ 94
4.2. Copper-silver bimetallic catalysts .................................................................................. 96
4.2.1. Bimetallic catalysts at 15 wt % loading .................................................................. 97
xii
4.2.2. Effect of bimetallic catalyst at 5 wt % loading ..................................................... 100
4.2.3. Effect of silver loading using 4.5Cu0.5Ag/γ-Al2O3 and 4Cu1Ag/γ-Al2O3 .......... 101
4.2.4. Effect of metal impregnation sequence ................................................................. 103
4.2.5. Isoconversion between 5Cu/γ-Al2O3, 4.5Cu-0.5Ag/γ-Al2O3, and 4Cu1Ag/γ-Al2O3 108
4.3. Kinetics......................................................................................................................... 110
4.4. Used catalyst characterization ...................................................................................... 113
4.4.1. Transmission electron microscopy (TEM) on selected catalysts .......................... 114
4.4.2. Infrared spectroscopy ............................................................................................ 114
4.4.4. X-ray diffraction ................................................................................................... 117
4.4.5. Brunauer-emmet-teller (BET) analysis ................................................................. 118
4.4.6. Scanning electron microscopy .............................................................................. 119
4.5. Summary of catalytic results and used catalyst characterization ................................. 124
Chapter 5 ..................................................................................................................................... 126
Conclusions and Future Work .................................................................................................... 126
References ................................................................................................................................... 130
Appendix ..................................................................................................................................... 138
xiii
List of Figures
Page Figure 1.1. Potential energy diagram depicting the reaction pathway comparing a catalyzed vs uncatalyzed reaction
1
Figure 1.2. Illustrating of a reaction on a heterogeneous catalyst. 6
Figure 1.3. Diagram of a batch flow reactor 8
Figure 1.4. Schematic diagram of (a) fixed bed reactor and (b) fluidized bed reactor 9
Figure 1.5. The tendency of transition metals to dissociate a hydrogen bond 11
Figure 1.6. Mechanism of the catalytic hydrogenation of an alkene 13
Figure 1.7. Illustration depicting the Langmuir-Hinshelwood mechanism. 14
Figure 1.8. Illustration of the Horiuti-Polanyi mechanism. 15
Figure 1.9. Possible intermediates for the hydrogenation of an aldehyde. 16
Figure 1.10. Hydrogenation of butyne to possible butene products. 17
Figure 1.11. Reaction scheme for the hydrogenation of 2-butyne-1,4-diol. 18
Figure 1.12. Hydrogenation reaction pathway of furfural. 19
Figure 1.13. The possible products from hydroformylation of 1-hexene. 21
Figure 1.14. Reaction scheme depicting the hydrogenation of octanal to octanol. 22
Figure 1.15. Reaction scheme depicting the hydrogenation of octene to octane. 22
Figure 1.16. Reaction scheme depicting the aldol reaction between two octanal molecules.
23
Figure 1.17. Reaction scheme depicting the formation of 2-hexyl decanol. 23
Figure 1.18. Reaction scheme depicting the formation of octyl octanoate. 24
Figure 1.19. Reaction scheme depicting the formation of octyl ether. 24
Figure 1.20. Reaction scheme depicting the formation of C24 acetal. 25
Figure 1.21. Elementary steps for the hydrogenation of acrolein 26
xiv
Figure 1.22. Possible mixing patterns of bimetallic catalysts. These alloys can be described as (a) core shell, (b) sub-cluster segregated, (c) ordered or random mixing and (d) multi-shell
32
Figure 2.1. Schematic of the reactor set up. 43 Figure 3.1. IR of 5Cu/γ-Al2O3. 46
Figure 3.2. Schematic depicting the two major steps (1) adsorption of H2O on alumina and (2) dissociative chemisorption of H2O.
46
Figure 3.3. X-ray diffractogram for (a) bare γ-Al2O3 (green), and γ-Al2O3 supported with: (b) 5Cu (black), (c) 15Cu (red), (d) 13.5Cu-1.5Ag (blue) catalysts.
49
Figure 3.4. X-ray diffractograms for γ-Al2O3 supported with (a) 4.5Cu0.5Ag (red), (b) S-4.5Cu0.5Ag (green), (c) S-0.5Ag4.5Cu (blue) catalysts.
50
Figure 3.5. X-ray diffractograms for γ-Al2O3 supported with (a) 4Cu1Ag (blue), (b) S-4Cu1Ag (red), (c) S-1Ag4Cu (black) catalysts.
51
Figure 3.6. In situ X-ray diffractogram for 5Cu/γ-Al2O3. 52
Figure 3.7. In situ X-ray diffractogram for (a) 4.5Cu0.5Ag/γ-Al2O3 and (b) 4Cu1Ag/γ-Al2O3 catalysts.
52
Figure 3.8. Hysteresis loops for γ-Al2O3 supported with: (a) 5Cu (Blue), (b) 4.5Cu0.5Ag (Red), (c) 4Cu1Ag (Green), and (d) 15Cu (Black) catalysts.
54
Figure 3.9. CO adsorption confirmation types. 56
Figure 3.10. TEM image of bare γ-Al2O3 61
Figure 3.11. TEM images for γ-Al2O3 supported with (a) 5Cu, (b) 15Cu, (c)13.5Cu1.5Ag, (d) 4.5Cu0.5Ag, (e) S-4.5Cu0.5Ag, (f) S-0.5Ag4.5Cu, (g) 4Cu1Ag, (h) S-4Cu1Ag, (i) S-1Ag4Cu.
62
Figure 3.12. STEM-EDX images for 4.5Cu0.5Ag/γ-Al2O3 showing (a) dark field image, (b) copper map (blue), (c) silver map (red).
63
Figure 3.13. STEM-EDX images for S-4.5Cu0.5Ag/γ-Al2O3 showing (a) dark field image, (b) copper map (red), (c) silver map (green).
64
Figure 3.14. STEM-EDX images for 4Cu1Ag/γ-Al2O3 showing (a) dark field image, (b) copper map (red), (c) silver map (green).
64
Figure 3.15. STEM-EDX images for 4.5Cu0.5Ag/γ-Al2O3 showing (a) line scan image, 65
xv
and (b) line scan spectra for copper (blue), silver (purple), and aluminium (green). Figure 3.16. STEM-EDX images for S-4.5Cu0.5Ag/γ-Al2O3 showing (a) line scan image, and (b) line scan spectra for copper (red), silver (green), and aluminium (blue).
66
Figure 3.17. SEM image for 5Cu/γ-Al2O3 (a) SEM, (b) backscattered image, (c) SEM-EDX, (d) copper mapping (blue).
67
Figure 3.18. Backscattered SEM images of (a) 4.5Cu0.5Ag/γ-Al2O3 and (b) S-4.5Cu0.5Ag/γ-Al2O3 and (c) S-0.5Ag4.5Cu/γ-Al2O3 catalysts.
68
Figure 3.19. SEM-EDX mapping for (a) 4.5u0.5Ag/γ-Al2O3- Cu (blue), Ag (red), (b) S-4.5Cu0.5Ag/γ-Al2O3 - Cu (green), Ag (red), and (c) S-0.5Ag4.5Cu/γ-Al2O3 - Cu (green), Ag (red).
68
Figure 3.20. SEM image with (a) the line scan and the (b) spectra for 4.5Cu0.5Ag/γ-Al2O3 with copper (blue) and silver (dark green).
69
Figure 3.21. SEM image for (a) S-4.5Cu0.5Ag/γ-Al2O3 with (b) line scan spectra of copper (pink) and silver (red).
70
Figure 3.22. SEM image for (a) for S-0.5Ag4.5Cu/γ-Al2O3 line scan spectra of copper (blue) and silver (dark green).
70
Figure 3.23. SEM images for 15Cu/γ-Al2O3 showing (a) backscattered image, (b) EDX mapping with aluminium (blue) and copper (green), (c) copper map (green).
71
Figure 3.24. SEM images of 13.5Cu1.5Ag/γ-Al2O3 (a) SEM image, (b) backscattered image with line scan, (c) spectra obtained from line scan with copper (blue), silver (pink), and aluminium (green).
71
Figure 3.25. SEM images of 13.5Cu1.5Ag/γ-Al2O3 showing (a) EDX mapping, (b) copper (green), (c) silver (red).
72
Figure 3.26. TPR profile for the γ-Al2O3 supported with (a) 5Cu, (b) 15Cu and (c) 13.5Cu-1.5Ag catalysts.
73
Figure 3.27. TPR profile for the (a) S-4.5Cu0.5Ag/γ-Al2O3, (b) S-0.5Ag4.5Cu/γ-Al2O3, and (c) 4.5Cu0.5Ag/γ-Al2O3 catalysts.
75
Figure 3.28. TGA-DSC results of 5Cu/γ-Al2O3 uncalcined catalyst. 79
Figure 3.29. TGA-DSC results for uncalcined (a) 4.5Cu-0.5Ag/γ-Al2O3, (b) 4Cu-1Ag/γ-Al2O3, (c) 13.5Cu-1.5Ag/γ-Al2O3 and (d) 15Cu/γ-Al2O3 catalysts. 80
Figure 4.1. Graphs depicting the effect of pressure at 140 °C in terms of (a) octanal and 84
xvi
octene conversion and selectivity to octanal, and (b) selectivity towards byproducts on the 5Cu/γ-Al2O3, using a 1:2 octanal:hydrogen ratio, and 18h-1 LHSV with 532 h-1 GHSV. The catalyst was reduced at 240 °C. Figure 4.2. Conversion of octanal and octene at temperatures 120, 140, and 160 °C which were reduced at (a) 220, (b) 240, and (c) 260 °C. All reactions were performed at 50 bar, LHSV: 18 h-1, and octanal:hydrogen ratio of 1:2 on the 5Cu/γ-Al2O3 catalyst.
86
Figure 4.3. Selectivity towards octanol is shown at various reduction temperatures. All reactions were performed at 50 bar, LHSV: 18 h-1, and octanal:hydrogen ratio of 1:2 using the 5Cu/γ-Al2O3 catalyst.
88
Figure 4.4. Selectivity towards byproducts is shown at various reduction temperatures and with reaction temperatures (a) 220 °C, (b) 240 °C, and (c) 260 °C. All reactions were performed at 50 bar, LHSV: 18 h-1, and octanal:hydrogen ratio of 1:2 using the 5Cu/γ-Al2O3 catalyst.
89
Figure 4.5. Graphs depicting the effect of temperature on a 15Cu/γ-Al2O3 catalyst in terms of (a) octanal and octene conversion and selectivity to octanol, and (b) selectivity towards byproducts on the 15Cu/γ-Al2O3 using a 1:2 octanal:hydrogen ratio and 18h-1 LHSV under a range of temperatures from 120 – 160 °C.
90
Figure 4.6. Graphs depicting the effect of LHSV at 160 °C at 50 bar in terms of (a) octanol selectivity, octanal and octene conversion, and (b) selectivity towards byproducts over the 15Cu/γ-Al2O3.
93
Figure 4.7. Graphs depicting the effect of octanal: hydrogen ratio at 50 bar showing (a) octanal conversion and (b) octene conversion, over the 15Cu/γ-Al2O3 catalyst.
94
Figure 4.8. Graphs depicting the effect of octanal:hydrogen ratio at 50 bar for selectivity towards (a) octanol and (b) byproducts at 1:1.5 octanal:hydrogen ratio and (c) byproducts at 1:2 octanal:hydrogen ratio over the 15Cu/γ-Al2O3 catalyst.
95
Figure 4.9. Graphs showing results obtained from 120 – 160 °C, conversion of octanal (AL) and octene (ENE) and the selectivity towards octanol (OL) over (a) 15Cu/γ-Al2O3 and (b) 13.5Cu1.5Ag/γ-Al2O3 catalysts.
97
Figure 4.10. Selectivity towards byproducts over the (a) 15Cu and (b) 13.5Cu1.5Ag catalyst.
99
Figure 4.11. Octanol selectivity and the conversion of octanal and octene for catalysts (a) 4.5Cu0.5Ag/γ-Al2O3 and (b) 4Cu1Ag/γ-Al2O3.
101
Figure 4.12. The selectivity towards byproducts for catalysts (a) 4.5Cu0.5Ag/γ-Al2O3 and (b) 4Cu1Ag/γ-Al2O3.
102
xvii
Figure 4.13. Graphs showing the conversion of octanal, and octene, and the selectivity towards octanol for (a) S-4.5Cu0.5Ag/γ-Al2O3, and (b) S-0.5Ag4.5Cu/γ-Al2O3 catalysts.
103
Figure 4.14. Graphs showing the conversion of octanal, octene, and the selectivity towards octanol for (a) S-4Cu1Ag/γ-Al2O3 (b) S-1Ag4Cu/γ-Al2O3.
104
Figure 4.15. Graphs showing the selectivity towards byproducts for (a) S-4.5Cu0.5Ag/γ-Al2O3, and (b) S-0.5Ag4.5Cu/γ-Al2O3.
107
Figure 4.16. Graphs showing the selectivity towards the byproducts over the (a) S-4Cu1Ag/γ-Al2O3, and (b) S-1Ag4Cu/γ-Al2O3 catalysts.
108
Figure 4.17. (a) Isoconversion of octanal and octene over the catalysts and octene and selectivity towards octanol over the catalysts 5Cu/γ-Al2O3, 4.5Cu0.5Ag/γ-Al2O3 and 4Cu1Ag/γ-Al2O3, and (b) Selectivity towards byproducts at 120 °C with a octanal:hydrogen ratio of 1:2.
109
Figure 4.18. Relationship between the catalyst acidity and the catalysts investigated under isoconversion conditions with (a) depicting octanol selectivity vs. Lewis acid site concentration and (b) showing the strong acid site concentration vs. byproduct selectivity
109
Figure 4.19. Graphs depicting the rate constant of (a) octanal and (b) octene hydrogenation vs metal dispersion for the catalysts investigated under isoconversion conditions.
111
Figure 4.20. Graph depicting the TOF values of octanal (TOF AL) and octene (TOF ENE) hydrogenation for the 5Cu/γ-Al2O3, 4.5Cu0.5Ag/γ-Al2O3 and 4Cu1Ag/γ-Al2O3.
112
Figure 4.21. Graph depicting the TON value compared to the octanol selectivity at isoconversion using the 5Cu/γ-Al2O3, 4.5Cu0.5Ag/γ-Al2O3 and 4Cu1Ag/γ-Al2O3 catalysts.
113
Figure 4.22. TEM Images obtained for the 5Cu/γ-Al2O3 catalyst reduced at temperatures (a) 220, (b) 240, and (c) 260 °C
114
Figure 4.23. Infrared spectrum of the used 5Cu/γ-Al2O3 catalyst. 114
Figure 4.24. X-ray diffractogram (a) 15Cu/γ-Al2O3 catalyst: fresh (red) and used (black), and (b) 13.5Cu1.5Ag/γ-Al2O3 catalyst: fresh (red) and used (black). Peaks observed in the diffractograms are attributed to CuO and Cu.
117
Figure 4.25. Used 5Cu/γ-Al2O3 catalyst reduced at 240 °C showing (a) Backscattered, (b) SEM, and (c) Backscattered Map with copper (green).
119
xviii
Figure 4.26. Used 5Cu/γ-Al2O3 catalyst reduced at 260 °C showing (a) Backscattered, (b) SEM, and (c) Backscattered Map with copper (green).
119
Figure 4.27. Line scan of used 5Cu/γ-Al2O3 catalyst reduced at 260 °C showing (a) SEM, and (c) Line scan spectra for copper (pink) and aluminium (blue).
120
Figure 4.28. The used 15Cu/γ-Al2O3 catalyst reduced at 220 °C showing (a) SEM, and (b) Backscattered SEM.
121
Figure 4.29. Used 15Cu/γ-Al2O3 catalyst reduced at 220 °C showing (a) SEM Map for copper and aluminium, (b) Copper (green) and (c) aluminium (blue).
121
Figure 4.30. Used 15Cu/γ-Al2O3 catalyst reduced at 220 °C showing (a) Backscattered, (b) Line scan for aluminium (green) and copper (blue).
122
Figure 4.31. Used 4.5Cu0.5Ag/γ-Al2O3 catalyst reduced at 220 °C showing (a) SEM and (b) Backscattered SEM image.
123
Figure 4.32. Used 4.5Cu0.5Ag/γ-Al2O3 catalyst reduced at 220 °C showing (a) SEM and (b) copper map (green) and (c) silver map (red). 123
Figure A1. IR spectra of γ-Al2O3 supported (a) 15Cu and (b) 13.5Cu1.5Ag catalysts. 144
Figure A2. IR spectra of γ-Al2O3 supported (a) 4.5Cu0.5Ag and (b) 4Cu1Ag catalysts. 144
Figure A3. IR spectra of γ-Al2O3 supported (a) S-4.5Cu0.5Ag and (b) S-0.5Ag4.5Cu catalysts.
144
Figure A4. IR spectra of γ-Al2O3 supported (a) S-4Cu1Ag and (b) S-1Ag4Cu catalysts. 145
Figure A5. IR spectra of γ-Al2O3 supported (a) 5Cu/γ-Al2O3 -220 and (b) 5Cu/γ-Al2O3 -240 catalysts.
145
Figure A6. IR spectra of γ-Al2O3 supported (a) 5Cu/γ-Al2O3 -260 and (b) 15Cu/γ-Al2O3 catalysts.
145
Figure A7. IR spectra of γ-Al2O3 supported (a) 4.5Cu0.5Ag-220 and (b) 4Cu1Ag-220 catalysts.
146
Figure A8. IR spectra of γ-Al2O3 supported (a) S-4.5Cu0.5Ag and (b) S-0.5Ag4.5Cu catalysts.
146
Figure A9. IR spectra of γ-Al2O3 supported (a) S-4Cu1Ag and (b) S-1Ag4Cu catalysts. 146
Figure A10. Images for15Cu/ γ-Al2O3 (a) SEM, (b) SEM-EDX mapping with copper (green), and (c) copper only map (green). 147
xix
Figure A11. Example of a GC chromatogram of the products obtained. 147
Figure A12. GC-MS spectrum of octene. 148
Figure A13. GC-MS spectrum of octane. 148
Figure A14. GC-MS spectrum of octanal. 149
Figure A15. GC-MS spectrum of octanol. 149
Figure A16. GC-MS spectrum of Octyl octanoate. 150
Figure A17. GC-MS spectrum of C16 diol. 150
Figure A18. Image of the reactor. 151
List of Tables
Page Table 1.1. A few notable catalytic advances from 1920's till 1990's. 3
Table 1.2. A few notable catalytic advances in the hydrogenation field. 10
Table 2.1. The selected spectral lines for each of the elements analyzed by ICP-OES.
38
Table 2.2: Mass of components used for the preparation of all catalysts. 42 Table 3.1. Infrared Spectroscopy results for all catalysts. 47
Table 3.2. Weight loadings obtained from ICP-OES analysis for all catalysts. 48
Table 3.3. Surface area measurements for all catalysts. 55
Table 3.4. Atomic weight, cross sectional area, and density for copper and silver. 57
Table 3.5. Summary of results obtained from hydrogen chemisorption for all catalysts.
58
Table 3.6. Results obtained from carbon monoxide chemisorption for all catalysts.
59
Table 3.7. Summary of results obtained from TPR analysis on all catalysts. 76
xx
Table 3.8. Summary of results obtained from NH3-TPD analysis on all catalysts. 78
Table 4.1. Summary of the octanal and octene conversion, and selectivity over the 5Cu/γ-Al2O3 and 15Cu/γ-Al2O3 catalysts at reaction temperatures of 120, 140, and 160°C.
91
Table 4.2. A comparison between the monometallic and bimetallic catalysts. 101
Table 4.3. Summary of results obtained from infrared spectroscopy of used catalysts.
115
Table 4.4. Summary of metal loadings obtained from ICP-OES on the used catalysts.
116
Table 4.5. Surface measurements for all used catalysts. 118
xxi
Abbreviations
% Percent
Å Angstrom
AL Octanal
ATR Attenuated Total Reflectance
BET Brunauer-Emmet-Teller
cm Centimeter
° C Degree Celsius
EDX Energy Dispersive X-ray spectroscopy
ENE Octene
ESCA Energy Spectroscopy for Chemical Analysis
FID Flame Ionization Detector
GC Gas chromatograh
GHSV Gas Hourly Space Velocity
H Hour
HR TEM High Resolution Transmission Electron Microscopy
ICP-OES Inductively Coupled Plasma-Optical Emission Spectroscopy
IR Infrared Spectroscopy
JCPDS Joint committee on powder diffraction
LEISS Low Energy Ion Scattering Spectroscopy
LHSV Liquid Hourly Space Velocity
m2/g Square meter per gram
mg/g milligram per gram
Mass % mass percent
xxii
ml milliliters
ml/min milliliters per minute
mmol millimole
µm micrometer
µmol micromole
Mol % Mole percent
MS Mass spectrometer
OL Octanol
ppm Parts Per Million
s second
SILP Solid ionic liquid phase
SCIL Solid catalyst with ionic layer
SEM Scanning Electron Microscopy
STEM Scanning Transmission Electron Microscopy
TCD Thermal Conductivity Detector
TEM Transmission Electron Microscopy
Td Thermal decomposition
TOF Turn Over Frequency
TON Turn Over Number
TPR Temperature Programmed Reduction
TPD Temperature Programmed Desorption
Wt % Weight percent
XRD X-ray Diffraction
xxiii
Equations
BET equation for specific surface area
W: weight of gas adsorbed
P/Po: relative pressure
Wm: weight of adsorbate as monolayer
C: BET constant
(
)
=
+
(
rk = pore radius
σ = surface tension
Vm = molar volume of gas adsorbed in the pore
Pore radius: rk =
Chemisorption parameters
Vchem (mol g-1): chemisorption volume
MW: supported metal atomic weight
σm (nm2): supported metal cross sectional area
SF: stoichiometry factor
c (wt%): supported metal weight percent
ρ (g cm-3): supported metal density
xxiv
Metal dispersion (%):
x 100
Metal surface area (per catalyst) = Vchem x 6.02 x 10²³ x SF x σm x 10-18
Metal surface area (per supported metal)/ Am =
Mean particle diameter =
X-ray diffraction
dc: average size of crystallite
k: constant
λ: wavelength of x-rays
Θ: Bragg diffraction angle
β: is at full width at half maximum
dc =
Catalytic equations
FRg: Gas flow rate
moles of octanal: ALm (m0: initial moles, m1: moles of octanal after)
moles of octanol: OLm
xxv
Vc: volume of catalyst
GHSV:
LHSV:
Conversion:
x 100
Selectivity:
x 100
Yield = Conversion x selectivity
TOF:
TON:
1
Chapter 1 Introduction and Literature Review
1.1. Catalysis
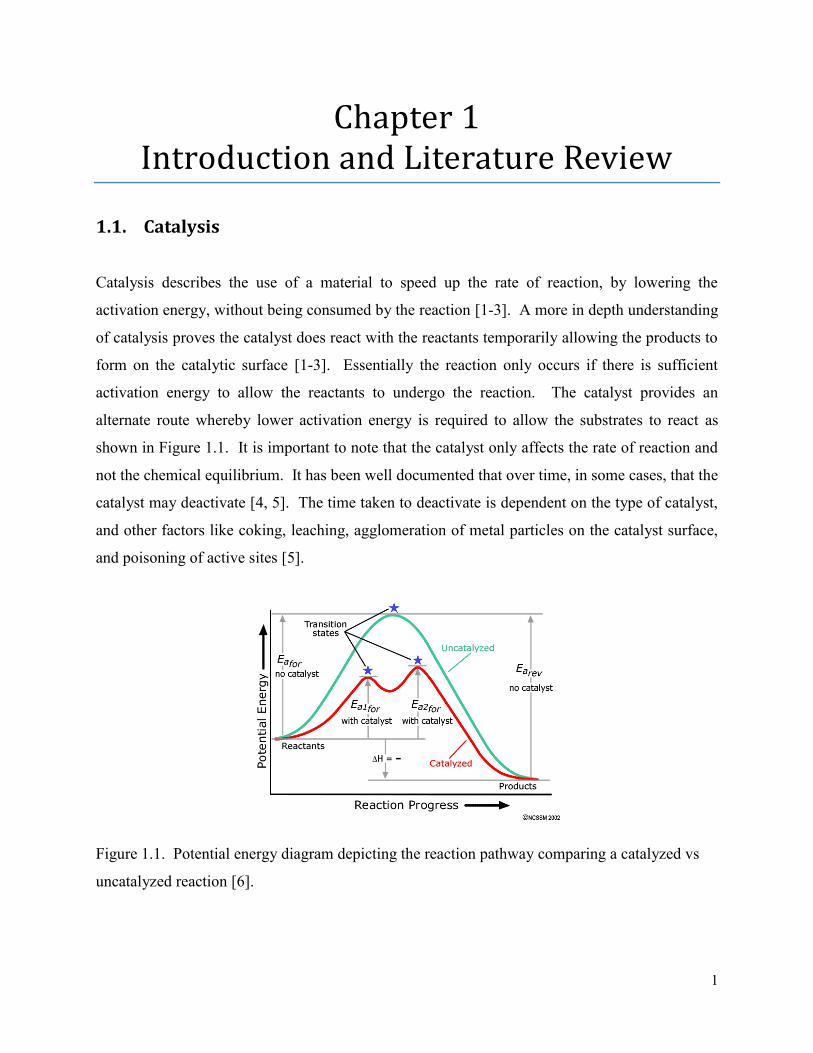
Catalysis describes the use of a material to speed up the rate of reaction, by lowering the
activation energy, without being consumed by the reaction [1-3]. A more in depth understanding
of catalysis proves the catalyst does react with the reactants temporarily allowing the products to
form on the catalytic surface [1-3]. Essentially the reaction only occurs if there is sufficient
activation energy to allow the reactants to undergo the reaction. The catalyst provides an
alternate route whereby lower activation energy is required to allow the substrates to react as
shown in Figure 1.1. It is important to note that the catalyst only affects the rate of reaction and
not the chemical equilibrium. It has been well documented that over time, in some cases, that the
catalyst may deactivate [4, 5]. The time taken to deactivate is dependent on the type of catalyst,
and other factors like coking, leaching, agglomeration of metal particles on the catalyst surface,
and poisoning of active sites [5].
Figure 1.1. Potential energy diagram depicting the reaction pathway comparing a catalyzed vs
uncatalyzed reaction [6].
2
In 1835, Jӧns Jacob Berzelius was the first to coin the term ‘catalysis’ which was used to identify
an entity which was able to speed up the rate of reaction without being consumed in the process
[7]. Catalysis was used as early as 1522 when Valerius Cordus used sulfuric acid to catalyze the
conversion of alcohol to ether [7]. This began the first era of catalysis whereby other notable
discoveries were reported such as: [7-10]
1. The Lead chamber process (1746), describes the production of sulfuric acid, which is one
of the first industrial processes.
2. Kirschoff (1812) reporting on the use of dilute acids to hydrolyze starch to sugar.
3. Humpfry Davy (1817) used heated platinum to assist in the combustion of gases below
their ignition temperature.
4. The oxidation of alcohol to acetic acid using platinum, which was demonstrated by
Edmund Davy in 1820.
5. The deactivation of platinum-based catalysts, which was first observed by Henry in 1825,
in his work regarding the combustion of methane and ethylene.
6. The first commercial process which was developed by Phillips for the oxidation of sulfur
dioxide (1831) over platinum-based catalysts.
The second era marked a greater interest in the understanding of how reactions are influenced by
catalysis. This lead to breakthroughs regarding the rates of reactions by Wilhemy (1850), who
proved the effect of the concentration of reactants, and by Willamson (1851), who showed that
esters could be reversed back to alcohol. In 1877, Lemoine showed that a catalyst can be used to
increase the rate of reaction, speeding up the time it takes for a reaction to reach equilibrium [7,
10].
The third era of catalysis marked the beginning of an industrial chemical revolution. One of the
most notable industrial processes began in 1898 with the ‘contact process’ involving the
production of sulfuric acid using vanadium pentoxide as a catalyst. Other important process
which began in this time period were: [7]
3
1. The Ostwald process, in 1902, allowed for the production of nitric acid from a multi-step
oxidation of ammonia.
2. The Haber process which uses an iron-based catalyst for the production of ammonia on
an industrial scale in 1913
Other major catalytic advances since then are presented in Table 1.1: [7-14]
Table 1.1. A few notable catalytic advances from 1920's till 1990's.
Company/Process Year Description
Standard Oil Company 1920 Isoproponal from petroleum [7]
Fischer-Tropsch 1922 Hydrocarbons from CO and H2 [11]
Dupont 1926 Synthetic methanol production [7]
Eugene Houdry 1936 Catalytic cracking [7]
Karl Zieglar 1953 Ethylene polymerization [7]
Sohio 1960’s Industrial production of acrylonitrile [9, 10]
Monsanto 1966 Carbonylation of methanol [9, 10]
Mobil Oil 1977 Methanol to olefins [12]
Phillips petroleum Co. 1983 Hydroisomerization [7, 10]
Exxon Research and Engineering 1990 Wax isomerization [13]
In recent times, the focus in industry was to innovate and improve existing catalytic processes, in
terms of catalyst lifetime, activity, selectivity, as well as becoming more environmentally
friendly. This led to chemistry fields such as green chemistry and photocatalysis. There are
three main categories of catalysis, which are heterogeneous, homogenous, and biocatalysis.
Biocatalysis or Enzymatic catalysis uses enzymes with processes such as fermentation [1, 2].
Enzymatic catalysis is used in a wide variety of processes and is applied in pharmaceuticals,
paper and pulp production, agriculture and the food industry. Enzymatic catalysis aims to use
enzymes or cells similar to those found in nature; meaning that biocatalysts are active under mild
reaction conditions and well-controlled temperature and pH. These reactions are also preferred
in aqueous media which is in correlation with many ‘green’ and ‘environmentally-friendly’
4
initiatives [15, 16]. Enzymatic catalysis has shown to be effective in enantioselective and
stereospecific reactions [17-19].
Zhang et al. [20] reported on the effectiveness of enone/enoate reductases for the reduction of a
wide variety of substrates including α, β-unsaturated alkenes, ketones, nitriles, and carboxylic
acids. These enzymes showed to have high activity at temperatures below 50 °C; however, it
was also shown that pH plays a major role on the activity, which varies according to the enzyme
used.
Lam et al. [21] reported on trans-esterification of biodiesel using three major fields of catalysis
namely; homogenous, heterogeneous, and enzymatic catalysis. Each of these fields showed to
contribute in different ways toward the overall aim of the study. In the homogeneous system,
catalysts are relatively cheap but a major drawback was the susceptibility to soap formation in
the presence of excess free fatty acids (FFA). Heterogeneous catalysis offered reusability and
recyclability; however leaching lead to contamination of the product feed. Enzymatic catalysts
have high cost but they are also insensitive to FFA and water in the reactant feed. The
advantages and disadvantages for the types of catalysts used and explained in this study could
also be extended into other types of chemical reactions such as alkylation, isomerization,
oxidation and hydrogenation [16].
1.2. Homogeneous catalysis
Homogenous catalysis applies when both reactants and catalyst are in the same phase.
Homogeneous catalysis is used in approximately 25 % of catalytic industrial processes [22].
Homogeneous catalysis, in some cases, proves superior to heterogeneous catalysis due to its
ability to operate in relatively milder conditions and providing high selectivity [22, 23]. The
main drawback from this type of catalysis is the difficulty in separation of the reactants, products
and catalyst. A homogeneous catalyst is mainly comprised of a metal center with ligands. The
interaction between the ligand and metal defines the way the catalyst will behave in terms of
activity and selectivity. The factors which govern the behavior of the catalyst include electronic
and steric effects [24].
5
The most well-known homogeneous catalyst is a rhodium based organometallic complex also
known as the Wilkinson’s catalyst which is a used for the hydrogenation of unsaturated organic
molecules such as alkenes and alkynes [25]. Zakzeski et al. [26] reported on the use of rhodium-
and ruthenium-based catalysts to obtain high yields in hydroformylation. Other metals such as
platinum, when combined with various ligands, have proven to be effective homogeneous
catalysts for hydroformylation, hydrogenation, hydration, oxidation and carbonylation reactions
[27]. Palladium has also been used for functionalizing aryl halides with yields ranging from 40 –
95 % depending on the ligand used [28]. A few well known palladium catalyzed reactions
include the Heck, Buchwald, and Hartwig reactions [28].
Some of the elementary steps in homogeneous catalysis involve ligand association and
dissociation, which allows a vacant site to be produced in which the reactant can interact with the
metal center. Insertion occurs when the reactant bonds to the metal center, in some cases the R-
group on the reactant can migrate to form a single bond with the metal. Types of migration such
as hydride and methyl migration can also be promoted by the other ligands on the metal. β-
elimination, oxidative addition and reductive elimination are all examples of catalytic steps
which occur in homogenous catalysis [29].
1.3. Heterogeneous catalysis
Heterogeneous catalysis comprises of 75 % of the world’s industrial catalytic processes and is
defined as the reactant and catalyst being in different phases i.e. gas-solid, liquid-solid, or gas-
liquid [22]. Heterogeneous catalysis usually consists of a solid catalyst containing a porous
inorganic material as the support and a metal as the active component. The common types of
supports used are; alumina, ceria, silica, manganese oxide, zeolites, and hydrotalcite [30]. The
reaction between the reactant and active metal usually takes place at the interface between the
catalyst surface and molecule which is depicted in Figure 1.2 [31].

6
Figure 1.2. Illustrating of a reaction on a heterogeneous catalyst.
A catalyst is effective in decreasing the activation energy of a reaction. This allows the
thermodynamically favoured reaction to occur at an enhanced rate. This enhanced rate also
increases the formation of by-products via side reactions. It is of great importance to have some
control of the catalyst in terms of the selectivity to the desired products, as well as the activity of
the catalyst, which depends on the catalyst stability. The activity and selectivity in
heterogeneous catalysis is dependent on many factors such as the support, metal, method of
preparation, reaction conditions, etc. The electronic and steric properties of the catalyst can be
modified with the use of promoters, or a secondary metal. These catalysts are able to have a long
life span; however, it does depend on its susceptibility to deactivation caused by poisoning,
leaching, coking, and sintering. It has been noted that a major advantage of heterogeneous
catalysis is the ease of the catalyst to be recycled and regenerated, making this system
economically viable [23].
7
1.4. Methods of preparation
The catalyst preparation technique has a great influence on the behavior of the catalyst.
Catalysts can be modified and fine-tuned, by altering the catalyst preparation procedure. Some
of the factors, which are affected by the preparation technique, include particle size, selectivity,
activity, stability, and mechanical strength. It is for this reason that the effect of catalyst
preparation has been studied in depth to fully understand the contribution of the preparation
techniques and methods [8, 30, 32, 33]. The preparation technique can be altered in a number of
ways e.g. a change in the metal precursor salt, pH, and stirring time and calcination temperature
etc.
It is of commercial importance to produce a catalyst, which has high surface area, uniform pore
size, and high mechanical strength. It is for this reason that there has been continuous
development in improving catalyst preparation procedures [11, 33]. Some of the most common
catalyst preparation procedures include wet impregnation, co-precipitation, deposition-
precipitation, and the sol-gel method.
Wet impregnation involves the addition of the dissolved metal salt added to the support. This
mixture is then stirred for a period of time, followed by drying and calcination [30]. Co-
precipitation requires a more controlled environment in terms of pH. One or more metals are
precipitated together with the support, which undergoes three main stages: Supersaturation,
nucleation and growth. Supersaturation occurs by evaporation of the solvent or an increase in
pH, which allows the metal to deposit onto the support. Growth of the particle size depends on
concentration of metal, pH and time [30]. Deposition precipitation uses the support to provide
for the nucleation sites for the metal precursor. The addition of the base is important as it is a
determining factor to allow for a gentle change in pH [30]. The sol-gel technique involves the
metal precursor dissolving in a solvent, thereafter the addition of acid or base for hydrolysis to
allow for gel formation. This is allowed to age followed by drying to remove excess moisture
[30].
8
1.5. Types of reactors
Apart from the chemistry taking part on the catalytic surface, an important part of the catalytic
process is the type of reactor used for the system. A large amount of research and engineering
goes into designing and optimizing reactors. Common types are the fixed bed, fluidized bed and
slurry bed reactor. However, there are also modified reactors which include bubble tower, spray
tower, and falling liquid film [34].
Reactors are designed to improve and optimize a variety of different catalytic chemical
processes. Many factors must be considered when choosing the type of reactor such as the
catalyst choice, ease of operation, solvent effect, heat control, deactivation studies, economics
and start-up costs. There are three main types of reactors
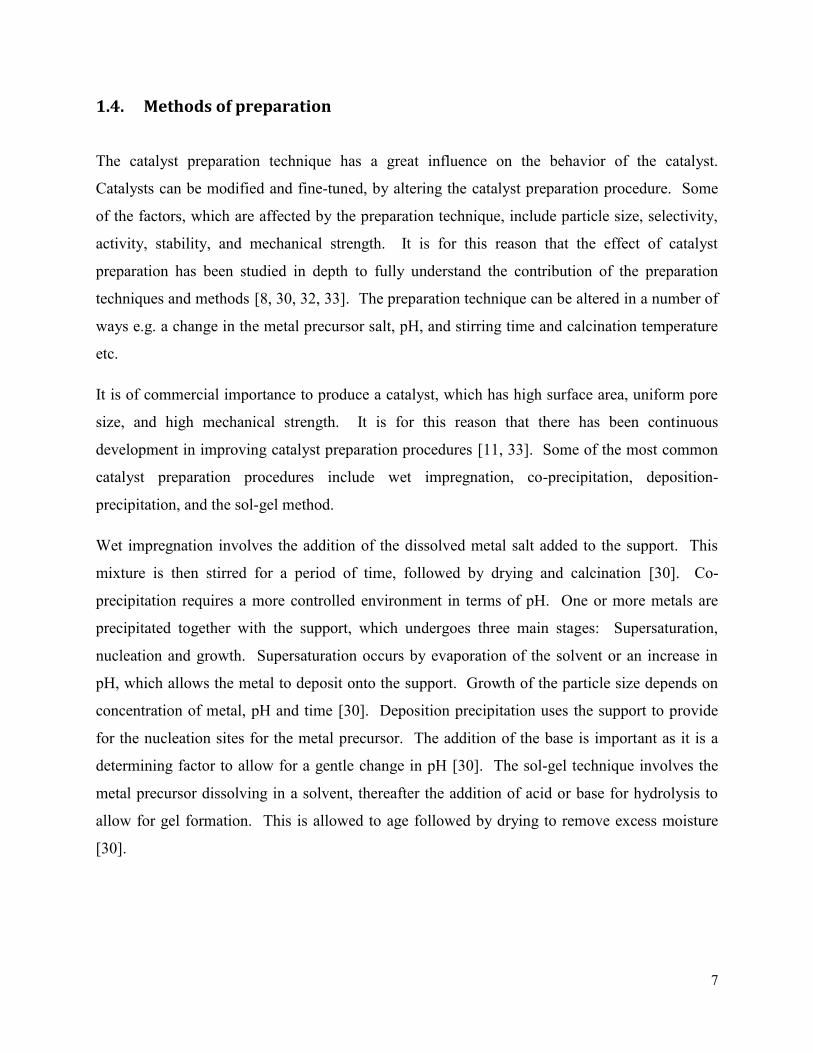
1.5.1. Batch flow reactor
In this set up the reactants are added together and allowed to react for a certain period of time
without interruption. Once the reaction is complete, the products are removed. This allows
excellent contact between the catalyst and reactants. Advantages of this type of reactor are good
temperature control, and they are suitable for long reaction times and small scale production.
These are generally used in the polymer and food industry [34, 35]. Major disadvantages
involve the difficulty of cleaning the reactor, and deactivation of the catalyst, which could occur
when the solvents are emptied out from the reactor [36]. An example of a batch reactor design is
shown in Figure 1.3.
Figure 1.3. Diagram of a batch flow reactor [37].
9
1.5.2. Continuous flow reactor
This type of reactor can be used for gas and liquid phase reactions. They are typically used for
simple reactions. It is economically viable as production costs are lower and products can be
removed during the reaction, as compared to a batch reactor. This set up can be used on a
laboratory scale or an industrial scale. Within this type of reactor, further modification allows
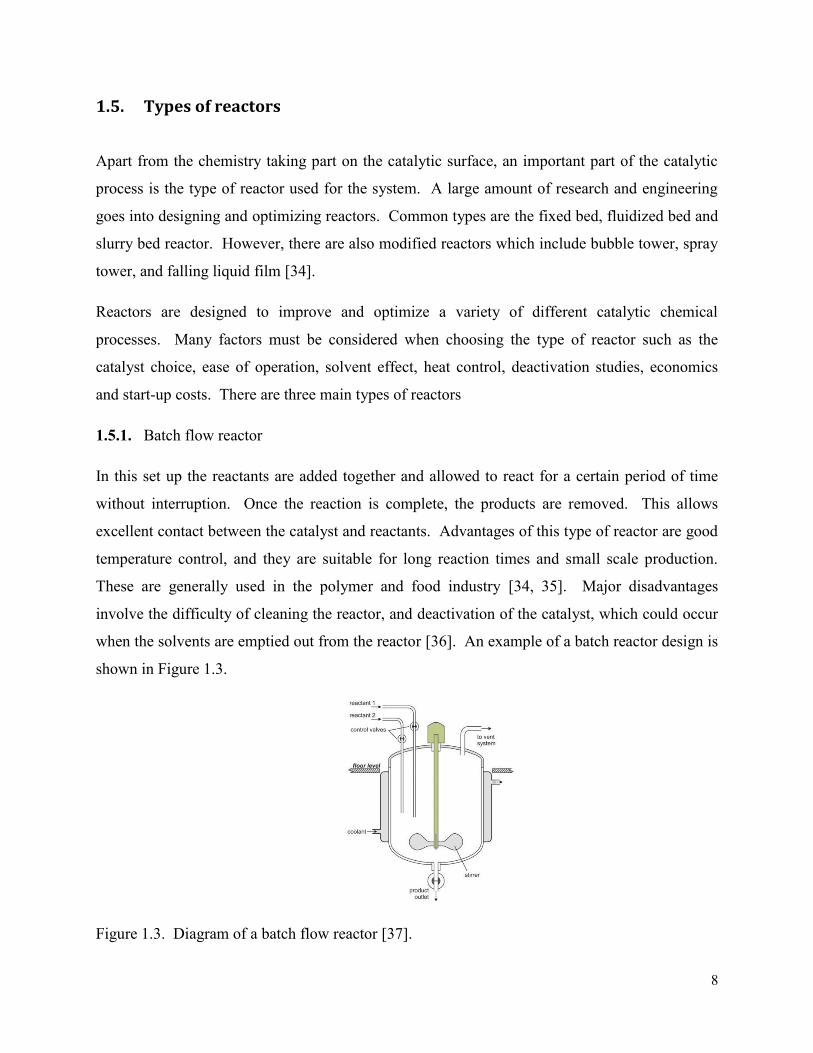
for a fluidized bed reactor or a fixed bed reactor.
In a fixed bed reactor, the reactant (gas/liquid) is fed downstream and is in close contact with the
catalyst bed shown in Figure 1.4. A fluidized bed reactor is known for its heat and mass transfer
control. The reactants and catalysts are usually dispersed with flow entering from the bottom of
the reactor creating a dispersed fluid set up which can be seen in Figure 1.4b. A few important
factors to take into consideration are temperature control, especially with exothermic reactants
and pressure control. Since the catalyst is in a fixed position, there must be sufficient void space
to allow the reactant to pass through without clogging which could cause back pressure or a
pressure drop. The catalyst must be mechanically stable to withstand disintegration. Continuous
reactors have an increased operating efficiency compared to batch reactors as there are fewer
start-up and shut-downs required [34-36, 38-40].
Figure 1.4. Schematic diagram of (a) fixed bed reactor [37] and (b) fluidized bed reactor [41].
1.5.3. Plug flow reactor
One or more fluids can be pumped through the reactor pipes. This set up is commonly used
under high temperature and pressure conditions [34, 35]. In this work, a continuous plug flow
fixed bed reactor was used and will be explained in detail in chapter 2
(a) (b)
10
1.6. Hydrogenation
1.6.1. History of hydrogenation
Hydrogenation describes the addition of hydrogen atoms to an unsaturated molecule and is a
valuable reaction to organic chemistry [42]. James F. Boyce is known for his work in vegetable
oils and fat for the manufacture of soaps and detergents in the late 19th to early 20th century. His
work involving the hydrogenation of cottonseed oil was considered to be a scientific
breakthrough which allowed for further work and applications [43].
French chemist Paul Sabatier is considered to be the father of hydrogenation, for his contribution
in the late 1890’s to work on the hydrogenation of gaseous organic compounds using a trace
amount of nickel as a catalyst [8, 44-46]. The reaction involving the formation of methane and
water from carbon dioxide and hydrogen using a nickel catalyst, called the Sabatier process, was
based on the work done by James. F. Boyce [47]. Wilhelm Norman extended the application of
catalyzed hydrogenation of liquid organic compounds like oleic acid, over a nickel catalyst in the
presence of gaseous hydrogen [47]. Since then, major hydrogenation processes and applications
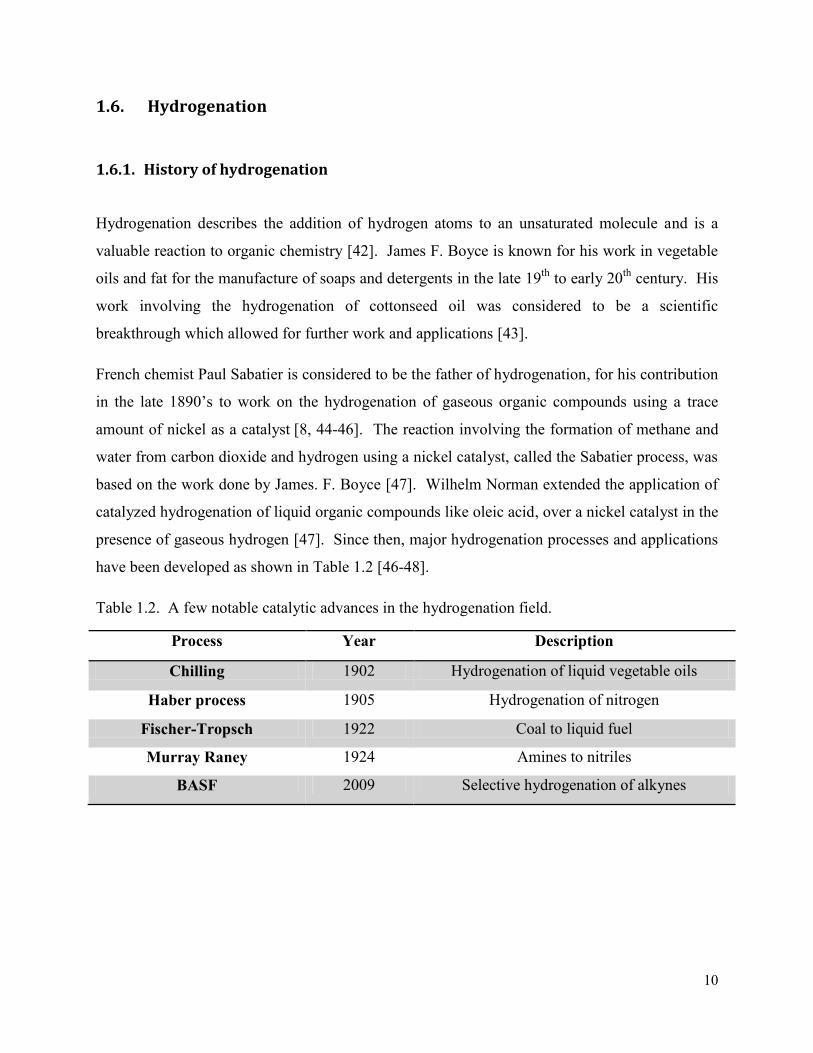
have been developed as shown in Table 1.2 [46-48].
Table 1.2. A few notable catalytic advances in the hydrogenation field.
Process Year Description
Chilling 1902 Hydrogenation of liquid vegetable oils
Haber process 1905 Hydrogenation of nitrogen
Fischer-Tropsch 1922 Coal to liquid fuel
Murray Raney 1924 Amines to nitriles
BASF 2009 Selective hydrogenation of alkynes
11
1.7. Catalytic hydrogenation
Hydrogenation is used in many fields industrially such as the petrochemical industry, polymers,
fine chemicals and pharmaceuticals. Catalytic hydrogenation is one of the most widely used
steps in organic synthesis and is invaluable in both the fine chemicals and pharmaceuticals
industry [32]. The preferred option in industry is using supported metal as the catalysts due to its
ability to diffuse hydrogen on the surface and to allow the reactants to be hydrogenated. The
hydrogen atom can be made to react readily with many functional groups and can be selective in
the right conditions. It is also the most economical method of reducing of unsaturated functional
groups for both laboratory and industrial scale production, and can be used in gas phase or liquid
phase reactions [36].
Some critical parameters of catalytic hydrogenation include the choice of catalyst used e.g. Pd/C,
Ni/Al2O3, operating conditions, and catalyst preparation. The performance of the catalyst
depends on the nature of the active metal as well as the support. As stated by Sabatier, the
adsorption of reactants should neither be too strong or weak for high catalytic activity [49]. A
good balance must be attained between the strength of adsorption between the reactant and
catalyst, as this is a desirable catalytic property, and will be able to desorb the product without
deactivating the catalyst. A weak interaction will not adsorb the reactant sufficiently making an
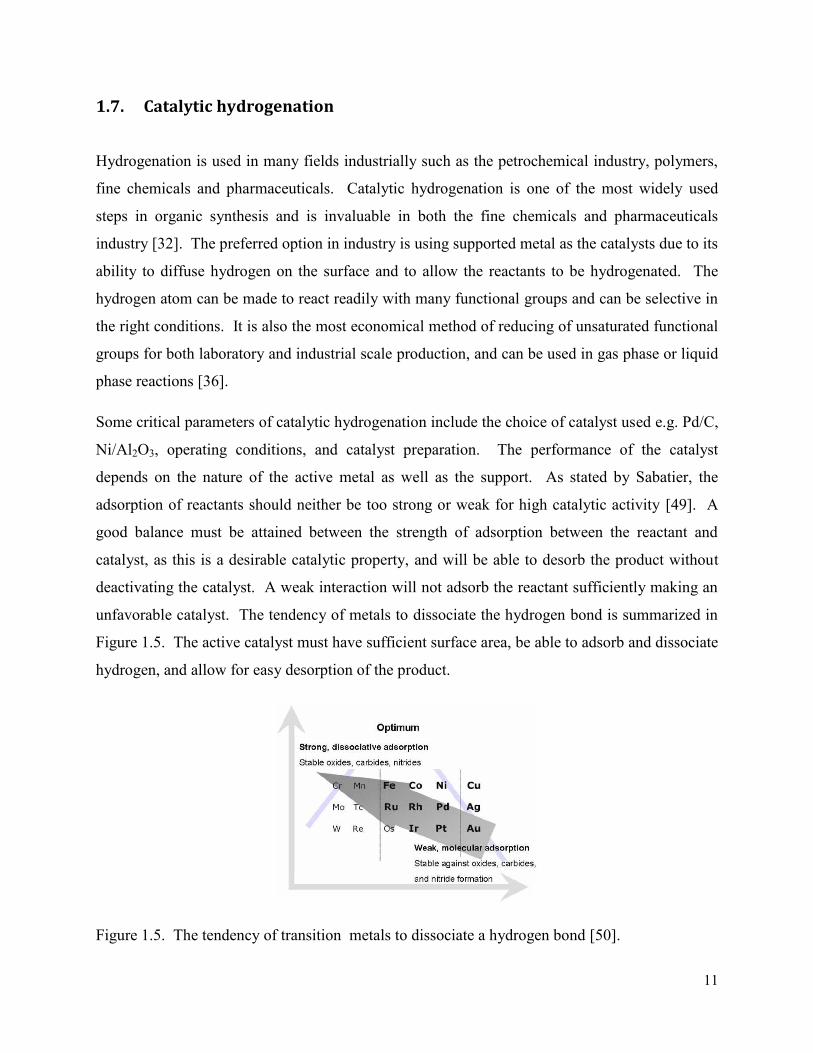
unfavorable catalyst. The tendency of metals to dissociate the hydrogen bond is summarized in
Figure 1.5. The active catalyst must have sufficient surface area, be able to adsorb and dissociate
hydrogen, and allow for easy desorption of the product.
Figure 1.5. The tendency of transition metals to dissociate a hydrogen bond [50].
12
Some of the factors, which influence the hydrogenation ability of the catalyst, are: [8, 32]
The choice of the metal, as this plays a major role towards the catalytic activity. The two main
categories of metal catalysts are precious metals, which include Pt, Pd, Ru, Rh, Os, Ir, Ag and
Au, and base metals, such as Cu, Ni, Co, Fe, which are relatively cheaper than the precious
metals. The type of support plays a significant role in the effectiveness of the catalyst properties
and behaviour. Types of support used can be acidic, basic or amphoteric. Common types of
supports used in hydrogenation are alumina, silica, ceria, titanium dioxide, magnesium oxide nd
zeolites. γ-alumina is a common support due to its high surface area and thermal stability. It has
been reported by Bachiller-Baeza et al. [42], that Rh showed to be effective in the selective
hydrogenation of α,β-unsaturated aldehydes when supported on Mg and Ce. This study was
done in both the gas and liquid phase [42]. Hydrotalcite have also been investigated as a
hydrogenation catalyst for acetone, acetophenone, and phenol compounds [51, 52]. It was also
found effective in selective hydrogenation of α,β-unsaturated aldehydes which includes
crotonaldehyde, cinnamaldehyde, citral, and acrolein [53].
The support plays a role in the metal particle size, the metal-support interaction, as well as the
deactivation rate, thus affecting the overall activity of the catalyst [5, 30, 54]. To further
elaborate, in a paper reported by Mori et al. [55] poisoned Pd/C showed to be effective in
chemoselective hydrogenation for alkenes in the presence of aliphatic and aromatic ketones,
however the catalyst deactivated over time, with recyclability of the catalyst proving difficult.
However, Hong et al. [56] showed that when palladium was supported on titania (Pd/TiO2), the
catalyst proved more stable over time for the selective hydrogenation of acetylene. Apart from
the metal-support interaction, the structure and pore size of the support plays an important role in
activity and selectivity. As a compromise between the most efficient and most economical
catalyst, the loading, type of metal and support is constantly studied to reach an effective
balance.
Hydrogenation can be separated into two distinct groups, which are bulk hydrogenation, which
entails the hydrogenation of in most cases a mono-functional group, and selective hydrogenation
which entails the hydrogenation of one particular functional group in the presence of another
functional group e.g. alkyne in the presence of an alkene.
13
1.8. Hydrogenation of alkenes (C=C)
Carbon-carbon double bonds can readily be hydrogenated to the alkane under mild conditions
[57]. Palladium is the most well-known and common metal for the hydrogenation of alkenes,
however Pt, Ru, and Ni has also been used in the past [36, 58-62]. Steric factors and
substitutions of the alkene determine the hydrogenation of the compound.
A great deal of work has been conducted over the past 40 years to determine the mechanism of
the catalytic hydrogenation of alkenes. The Horiuti-Polanyi mechanism is most well accepted
over a range of different heterogeneous catalyst due to the mechanism being supported by results
obtained regarding stereochemistry, double bond isomerization and deuterium labeling of the
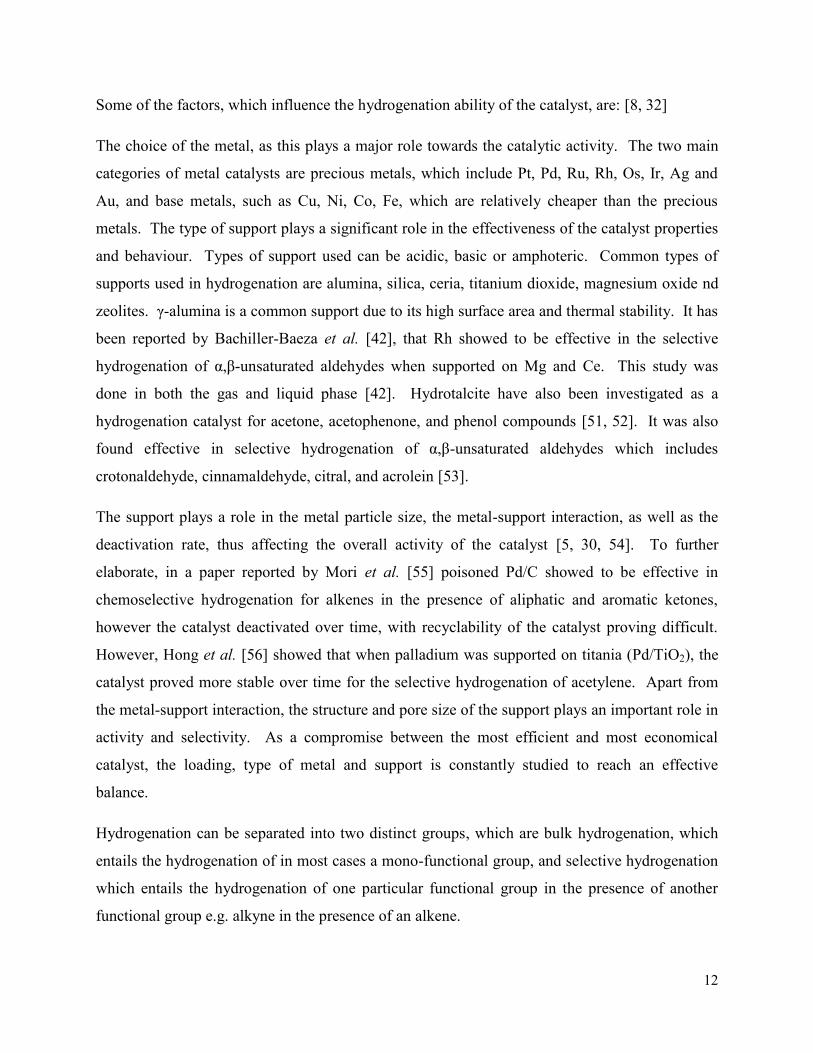
alkene hydrogenation reaction [63]. The mechanism, shown in Figure 1.6, is rather simple with
the diatomic hydrogen dissociated onto the active catalyst surface (1). The reactant is adsorbed
onto the surface via the double bond (2), the hydrogen is allowed to interact with the weakly
adsorbed alkene bond (3), the alkane desorbs from the catalyst while reacting with the second
hydrogen to form the product (4).
Figure 1.6. Mechanism of the catalytic hydrogenation of an alkene [64].
(1) (2)
(3) (4)
14
1.9. Possible mechanisms for alkene hydrogenation
1.9.1. Langmuir-Hinshelwood mechanism
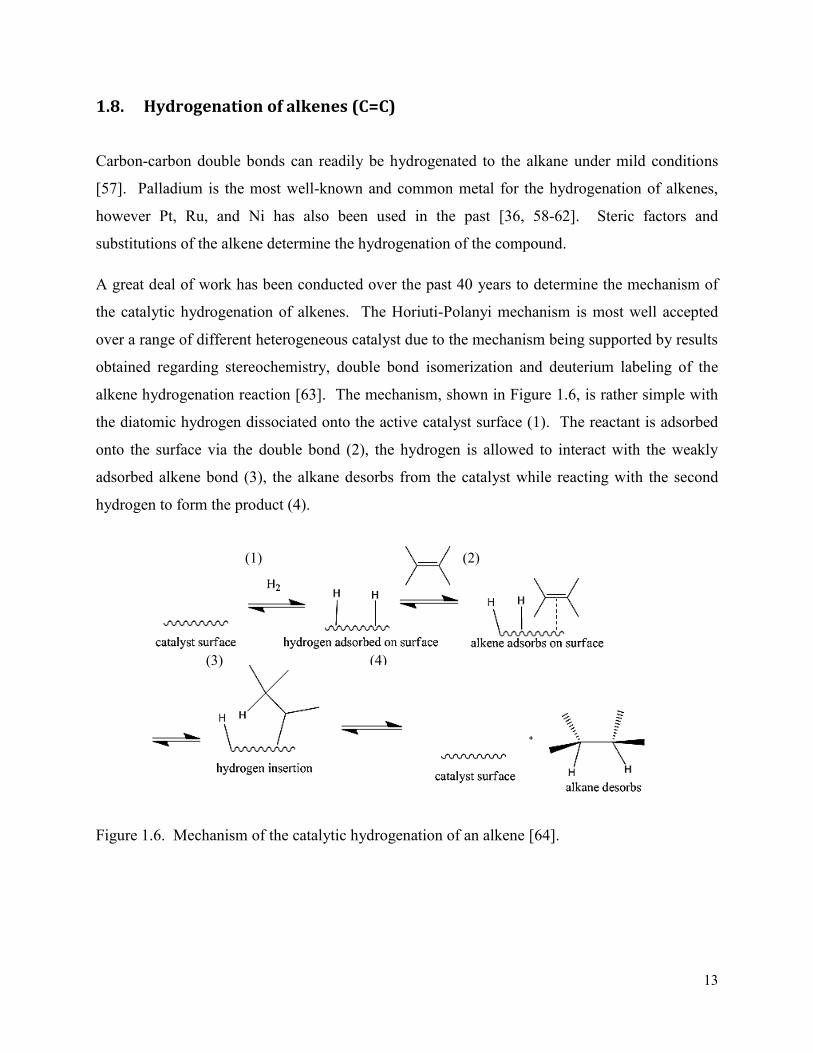
This mechanism involves the dissociative chemisorption of the reactive gas (hydrogen) on the
surface. The hydrogen then migrates across the surface until interaction occurs with the reactant
molecule, which is adsorbed to the catalyst surface. Once the reactive gas and reactant interact,
the product is desorbed from the surface allowing a new reactant molecule and gas to adsorb [65,
66]. Augustine and co-workers [63] have also stated that the rate of reaction depends on the
amount of the chemisorbed species on the surface, which in this study is hydrogen. Considering
that this may be the mechanism, which occurs, in this catalytic system, there are a few possible
products, which could form as explained in this chapter. Figure 1.7 shows a simple illustration
of the Langmuir-Hinshelwood mechanism for a hydrogenation reaction.
Figure 1.7. Illustration depicting the Langmuir-Hinshelwood mechanism.
1.9.2. Horiuti-Polanyi mechanism
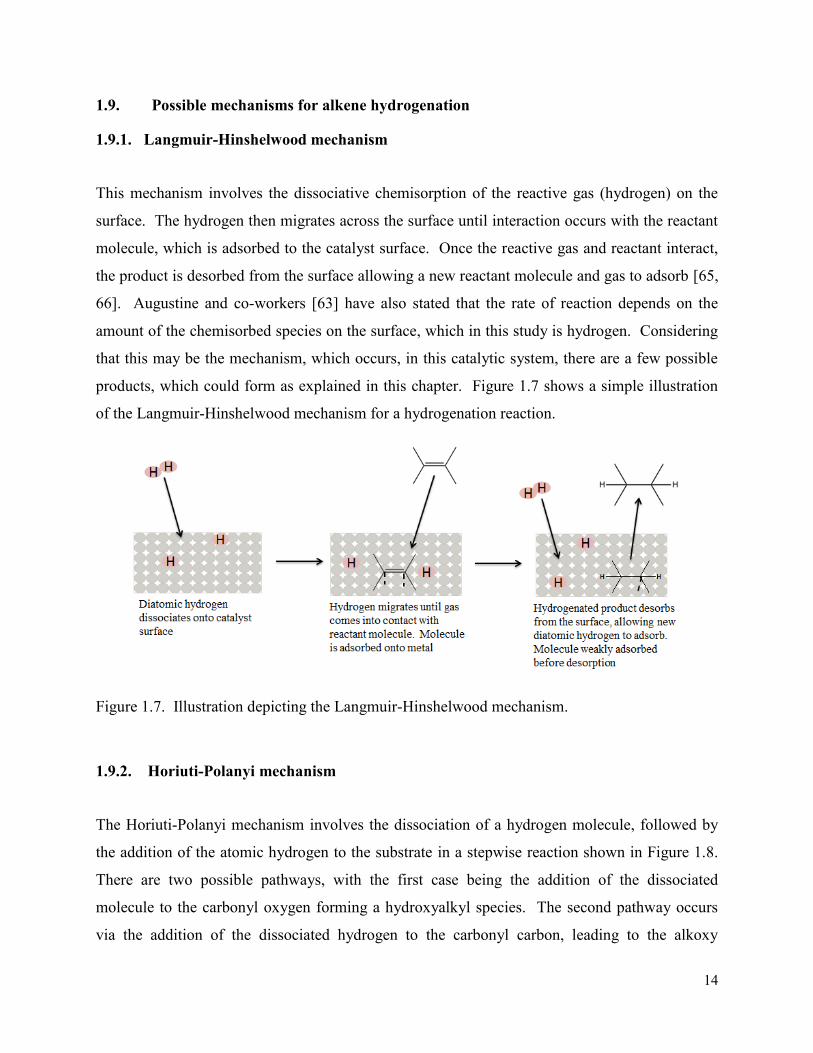
The Horiuti-Polanyi mechanism involves the dissociation of a hydrogen molecule, followed by
the addition of the atomic hydrogen to the substrate in a stepwise reaction shown in Figure 1.8.
There are two possible pathways, with the first case being the addition of the dissociated
molecule to the carbonyl oxygen forming a hydroxyalkyl species. The second pathway occurs
via the addition of the dissociated hydrogen to the carbonyl carbon, leading to the alkoxy
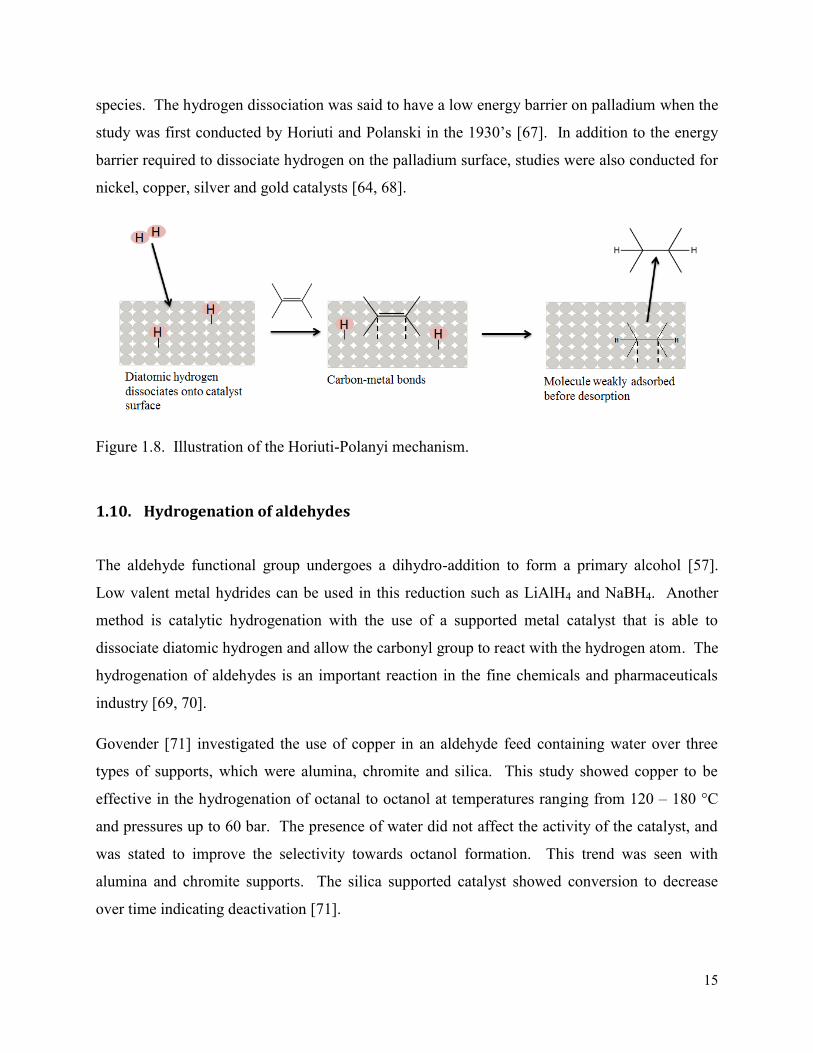
15
species. The hydrogen dissociation was said to have a low energy barrier on palladium when the
study was first conducted by Horiuti and Polanski in the 1930’s [67]. In addition to the energy
barrier required to dissociate hydrogen on the palladium surface, studies were also conducted for
nickel, copper, silver and gold catalysts [64, 68].
Figure 1.8. Illustration of the Horiuti-Polanyi mechanism.
1.10. Hydrogenation of aldehydes
The aldehyde functional group undergoes a dihydro-addition to form a primary alcohol [57].
Low valent metal hydrides can be used in this reduction such as LiAlH4 and NaBH4. Another
method is catalytic hydrogenation with the use of a supported metal catalyst that is able to
dissociate diatomic hydrogen and allow the carbonyl group to react with the hydrogen atom. The
hydrogenation of aldehydes is an important reaction in the fine chemicals and pharmaceuticals
industry [69, 70].
Govender [71] investigated the use of copper in an aldehyde feed containing water over three
types of supports, which were alumina, chromite and silica. This study showed copper to be
effective in the hydrogenation of octanal to octanol at temperatures ranging from 120 – 180 °C
and pressures up to 60 bar. The presence of water did not affect the activity of the catalyst, and
was stated to improve the selectivity towards octanol formation. This trend was seen with
alumina and chromite supports. The silica supported catalyst showed conversion to decrease
over time indicating deactivation [71].
16
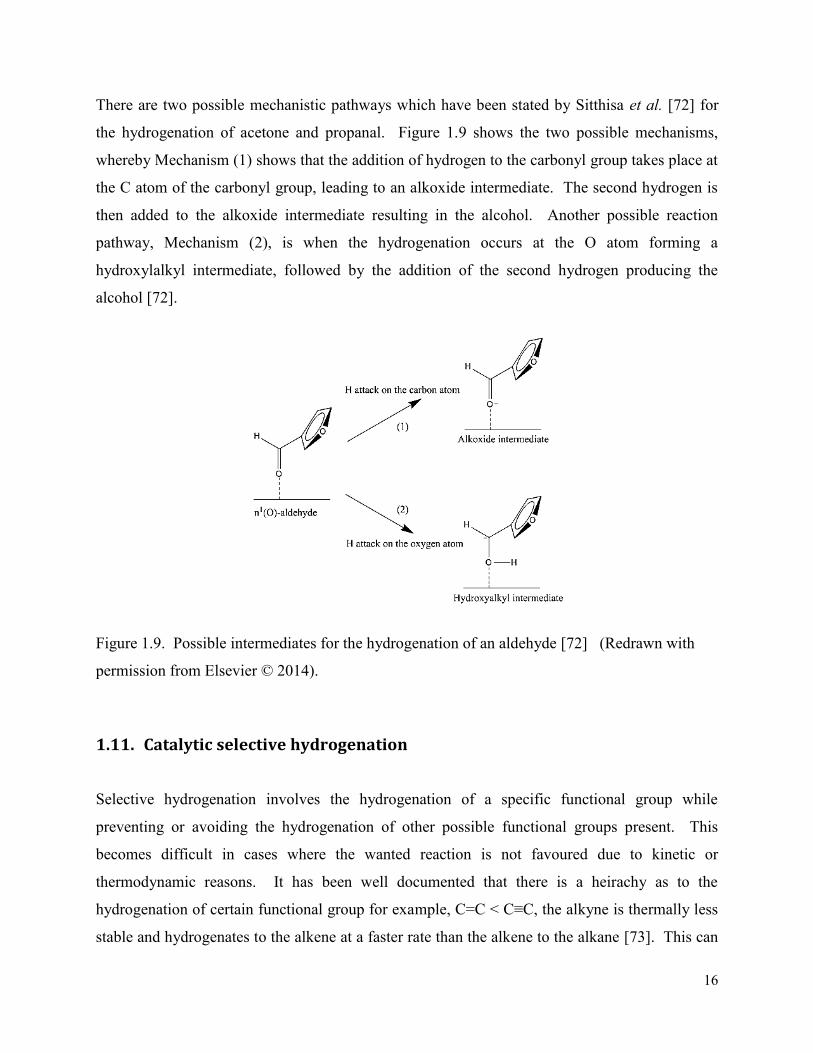
There are two possible mechanistic pathways which have been stated by Sitthisa et al. [72] for
the hydrogenation of acetone and propanal. Figure 1.9 shows the two possible mechanisms,
whereby Mechanism (1) shows that the addition of hydrogen to the carbonyl group takes place at
the C atom of the carbonyl group, leading to an alkoxide intermediate. The second hydrogen is
then added to the alkoxide intermediate resulting in the alcohol. Another possible reaction
pathway, Mechanism (2), is when the hydrogenation occurs at the O atom forming a
hydroxylalkyl intermediate, followed by the addition of the second hydrogen producing the
alcohol [72].
Figure 1.9. Possible intermediates for the hydrogenation of an aldehyde [72] (Redrawn with
permission from Elsevier © 2014).
1.11. Catalytic selective hydrogenation
Selective hydrogenation involves the hydrogenation of a specific functional group while
preventing or avoiding the hydrogenation of other possible functional groups present. This
becomes difficult in cases where the wanted reaction is not favoured due to kinetic or
thermodynamic reasons. It has been well documented that there is a heirachy as to the
hydrogenation of certain functional group for example, C=C < C≡C, the alkyne is thermally less
stable and hydrogenates to the alkene at a faster rate than the alkene to the alkane [73]. This can
17
also be extended to other functional groups such as C≡C > C=C > C=O (aldehyde) > C=O
(ketone), mainly due to higher reactivity of the aldehyde than the ketone which is vulnerable to
steric hindrance as well as electronic effects. With selective hydrogenation being the focus of
this study, an insight into the hydrogenation of a few of these functional groups was warranted.
Early advances in hydrogenation were mainly done for olefin hydrogenation to the paraffin
product, which was further extended to chemo- and regio-selective hydrogenation, namely the
preferential hydrogenation of conjugated olefins over non-conjugated olefins. This was also
extended to carbonyl and nitrile hydrogenation [74].
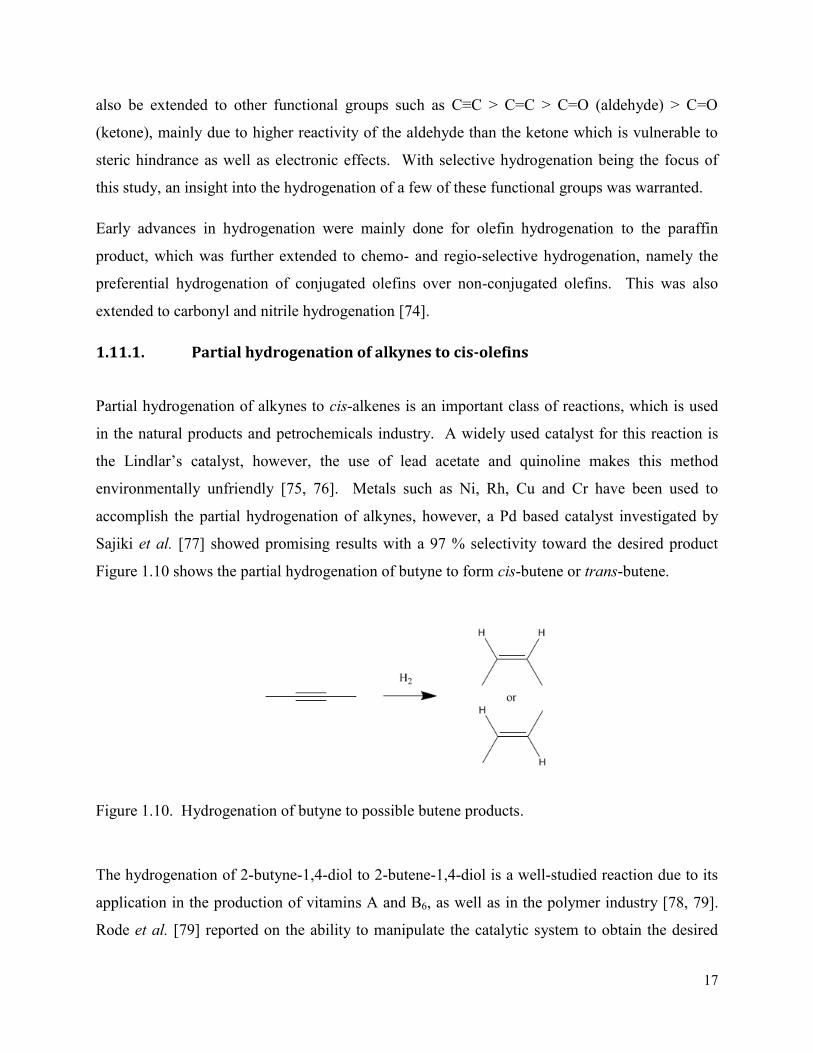
1.11.1. Partial hydrogenation of alkynes to cis-olefins
Partial hydrogenation of alkynes to cis-alkenes is an important class of reactions, which is used
in the natural products and petrochemicals industry. A widely used catalyst for this reaction is
the Lindlar’s catalyst, however, the use of lead acetate and quinoline makes this method
environmentally unfriendly [75, 76]. Metals such as Ni, Rh, Cu and Cr have been used to
accomplish the partial hydrogenation of alkynes, however, a Pd based catalyst investigated by
Sajiki et al. [77] showed promising results with a 97 % selectivity toward the desired product
Figure 1.10 shows the partial hydrogenation of butyne to form cis-butene or trans-butene.
Figure 1.10. Hydrogenation of butyne to possible butene products.
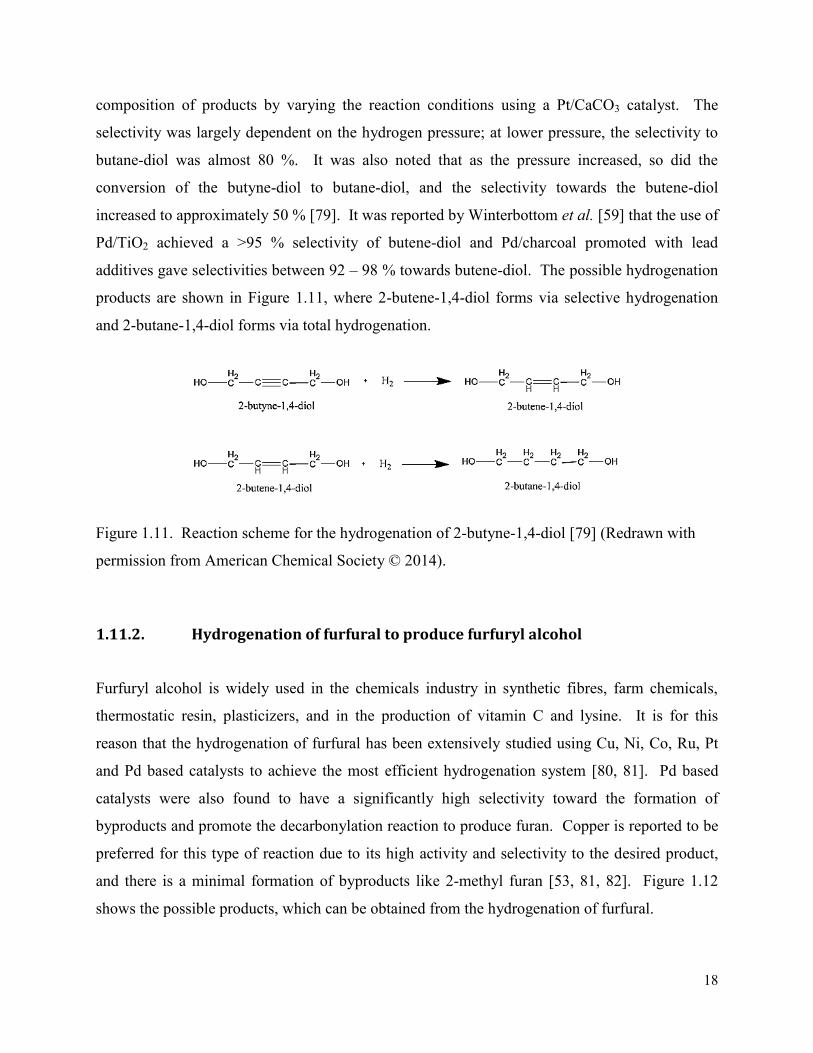
The hydrogenation of 2-butyne-1,4-diol to 2-butene-1,4-diol is a well-studied reaction due to its
application in the production of vitamins A and B6, as well as in the polymer industry [78, 79].
Rode et al. [79] reported on the ability to manipulate the catalytic system to obtain the desired
18
composition of products by varying the reaction conditions using a Pt/CaCO3 catalyst. The
selectivity was largely dependent on the hydrogen pressure; at lower pressure, the selectivity to
butane-diol was almost 80 %. It was also noted that as the pressure increased, so did the
conversion of the butyne-diol to butane-diol, and the selectivity towards the butene-diol
increased to approximately 50 % [79]. It was reported by Winterbottom et al. [59] that the use of
Pd/TiO2 achieved a >95 % selectivity of butene-diol and Pd/charcoal promoted with lead
additives gave selectivities between 92 – 98 % towards butene-diol. The possible hydrogenation
products are shown in Figure 1.11, where 2-butene-1,4-diol forms via selective hydrogenation
and 2-butane-1,4-diol forms via total hydrogenation.
Figure 1.11. Reaction scheme for the hydrogenation of 2-butyne-1,4-diol [79] (Redrawn with
permission from American Chemical Society © 2014).
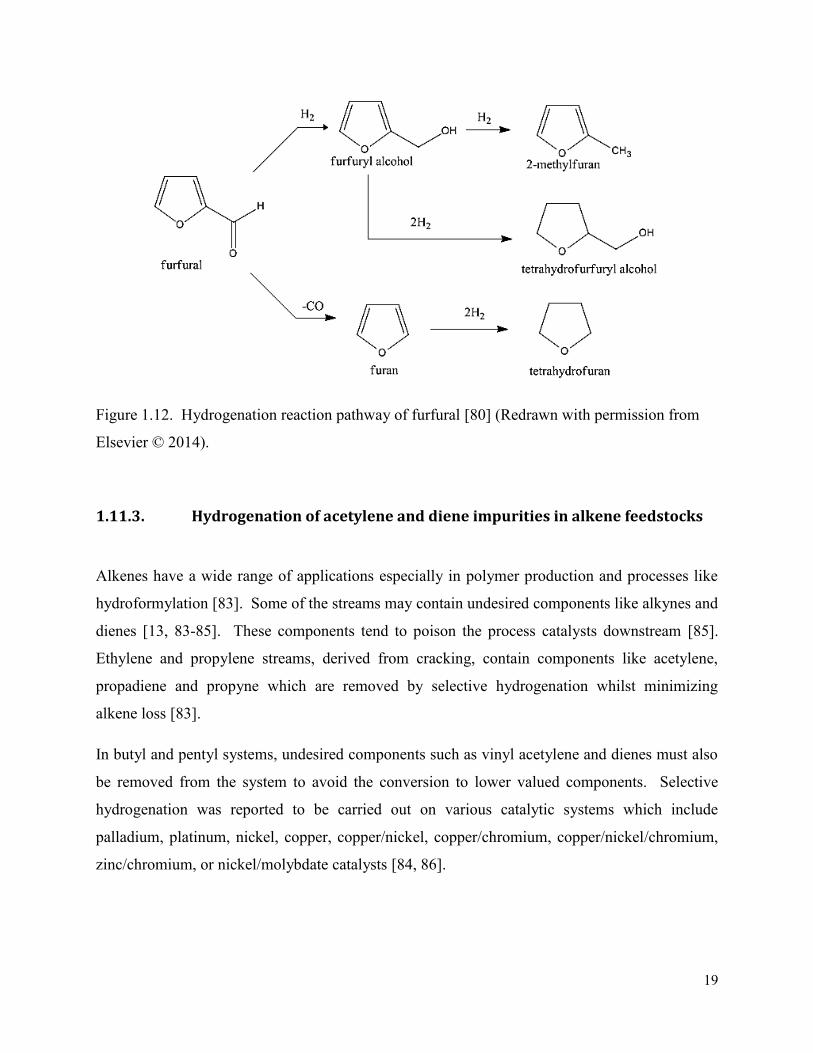
1.11.2. Hydrogenation of furfural to produce furfuryl alcohol
Furfuryl alcohol is widely used in the chemicals industry in synthetic fibres, farm chemicals,
thermostatic resin, plasticizers, and in the production of vitamin C and lysine. It is for this
reason that the hydrogenation of furfural has been extensively studied using Cu, Ni, Co, Ru, Pt
and Pd based catalysts to achieve the most efficient hydrogenation system [80, 81]. Pd based
catalysts were also found to have a significantly high selectivity toward the formation of
byproducts and promote the decarbonylation reaction to produce furan. Copper is reported to be
preferred for this type of reaction due to its high activity and selectivity to the desired product,
and there is a minimal formation of byproducts like 2-methyl furan [53, 81, 82]. Figure 1.12
shows the possible products, which can be obtained from the hydrogenation of furfural.
19
Figure 1.12. Hydrogenation reaction pathway of furfural [80] (Redrawn with permission from
Elsevier © 2014).
1.11.3. Hydrogenation of acetylene and diene impurities in alkene feedstocks
Alkenes have a wide range of applications especially in polymer production and processes like
hydroformylation [83]. Some of the streams may contain undesired components like alkynes and
dienes [13, 83-85]. These components tend to poison the process catalysts downstream [85].
Ethylene and propylene streams, derived from cracking, contain components like acetylene,
propadiene and propyne which are removed by selective hydrogenation whilst minimizing
alkene loss [83].
In butyl and pentyl systems, undesired components such as vinyl acetylene and dienes must also
be removed from the system to avoid the conversion to lower valued components. Selective
hydrogenation was reported to be carried out on various catalytic systems which include
palladium, platinum, nickel, copper, copper/nickel, copper/chromium, copper/nickel/chromium,
zinc/chromium, or nickel/molybdate catalysts [84, 86].
20
1.11.4. Selective hydrogenation in the hydroformylation process
Hydroformylation (also called ‘the oxo process’) of a wide range of olefins (C2- C24) is an
industrially practiced application to obtain aldehydes and alcohols, which act as intermediates for
surfactants, detergents, plasticizers, and the perfume industry. This reaction involves the
addition of a carbon monoxide and hydrogen molecule to an alkene, forming aldehydes.
Commercially a rhodium-phosphine modified complex is often used under mild conditions for
the hydroformylation of small chain alkenes, however this is not used for longer carbon chains as
the rhodium complex decomposes during separation of the reaction mixture [87]. Cobalt was
reported to be better suited for the hydroformylation of higher alkenes under homogeneous
conditions as it is stable against higher temperature, pressure and longer reaction time. There is a
continuous effort into improving these processes by studying the effect of the ligands, synthesis
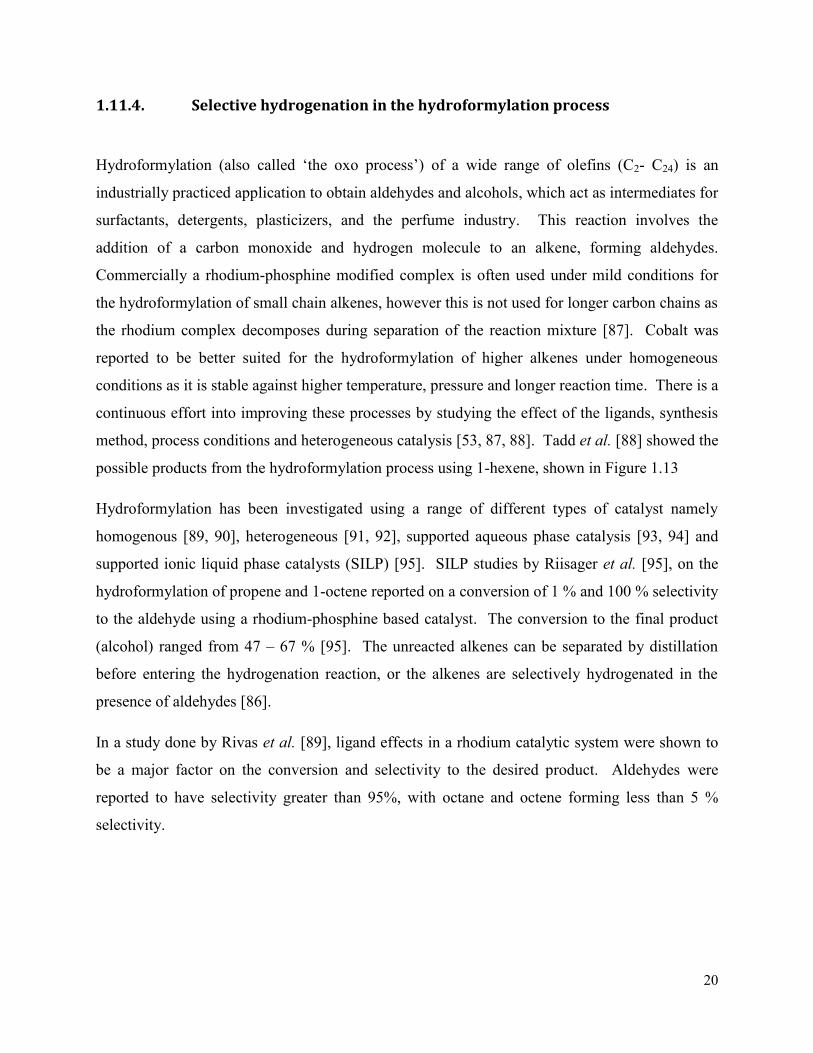
method, process conditions and heterogeneous catalysis [53, 87, 88]. Tadd et al. [88] showed the
possible products from the hydroformylation process using 1-hexene, shown in Figure 1.13
Hydroformylation has been investigated using a range of different types of catalyst namely
homogenous [89, 90], heterogeneous [91, 92], supported aqueous phase catalysis [93, 94] and
supported ionic liquid phase catalysts (SILP) [95]. SILP studies by Riisager et al. [95], on the
hydroformylation of propene and 1-octene reported on a conversion of 1 % and 100 % selectivity
to the aldehyde using a rhodium-phosphine based catalyst. The conversion to the final product
(alcohol) ranged from 47 – 67 % [95]. The unreacted alkenes can be separated by distillation
before entering the hydrogenation reaction, or the alkenes are selectively hydrogenated in the
presence of aldehydes [86].
In a study done by Rivas et al. [89], ligand effects in a rhodium catalytic system were shown to
be a major factor on the conversion and selectivity to the desired product. Aldehydes were
reported to have selectivity greater than 95%, with octane and octene forming less than 5 %
selectivity.
21
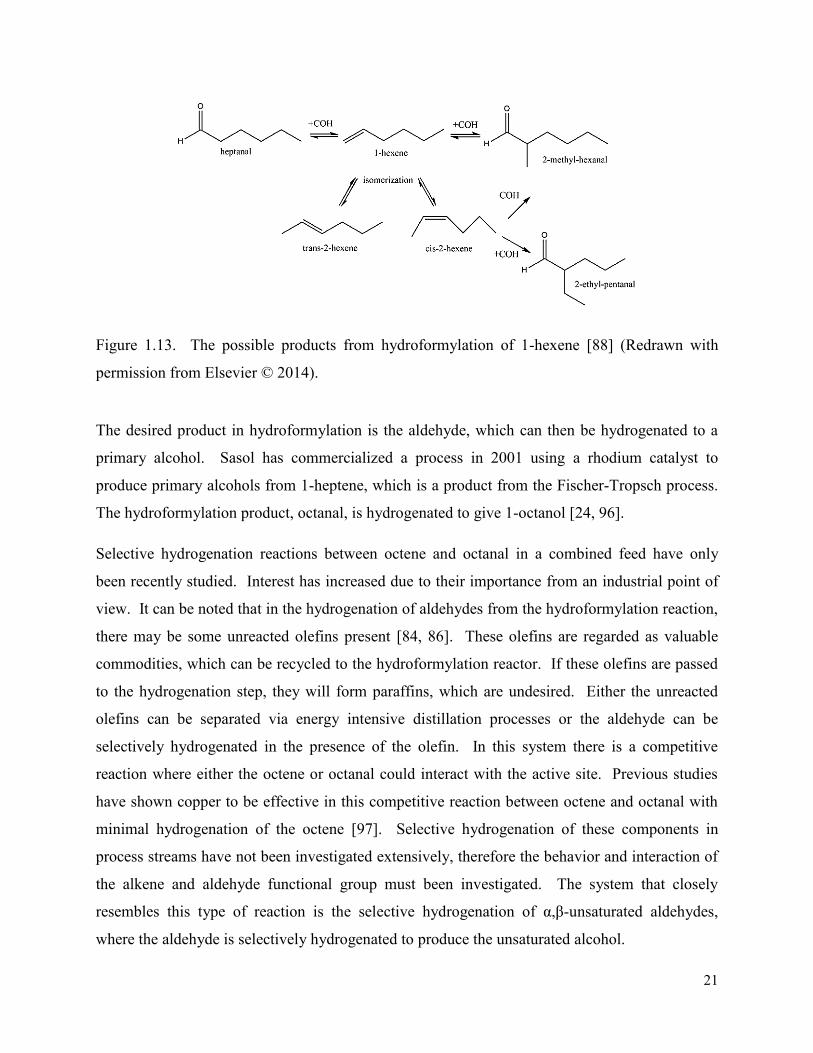
Figure 1.13. The possible products from hydroformylation of 1-hexene [88] (Redrawn with
permission from Elsevier © 2014).
The desired product in hydroformylation is the aldehyde, which can then be hydrogenated to a
primary alcohol. Sasol has commercialized a process in 2001 using a rhodium catalyst to
produce primary alcohols from 1-heptene, which is a product from the Fischer-Tropsch process.
The hydroformylation product, octanal, is hydrogenated to give 1-octanol [24, 96].
Selective hydrogenation reactions between octene and octanal in a combined feed have only
been recently studied. Interest has increased due to their importance from an industrial point of
view. It can be noted that in the hydrogenation of aldehydes from the hydroformylation reaction,
there may be some unreacted olefins present [84, 86]. These olefins are regarded as valuable
commodities, which can be recycled to the hydroformylation reactor. If these olefins are passed
to the hydrogenation step, they will form paraffins, which are undesired. Either the unreacted
olefins can be separated via energy intensive distillation processes or the aldehyde can be
selectively hydrogenated in the presence of the olefin. In this system there is a competitive
reaction where either the octene or octanal could interact with the active site. Previous studies
have shown copper to be effective in this competitive reaction between octene and octanal with
minimal hydrogenation of the octene [97]. Selective hydrogenation of these components in
process streams have not been investigated extensively, therefore the behavior and interaction of
the alkene and aldehyde functional group must been investigated. The system that closely
resembles this type of reaction is the selective hydrogenation of α,β-unsaturated aldehydes,
where the aldehyde is selectively hydrogenated to produce the unsaturated alcohol.
22
1.12. Possible reactions from the hydrogenation of octanal in the presence of octene
1.12.1. Main reactions
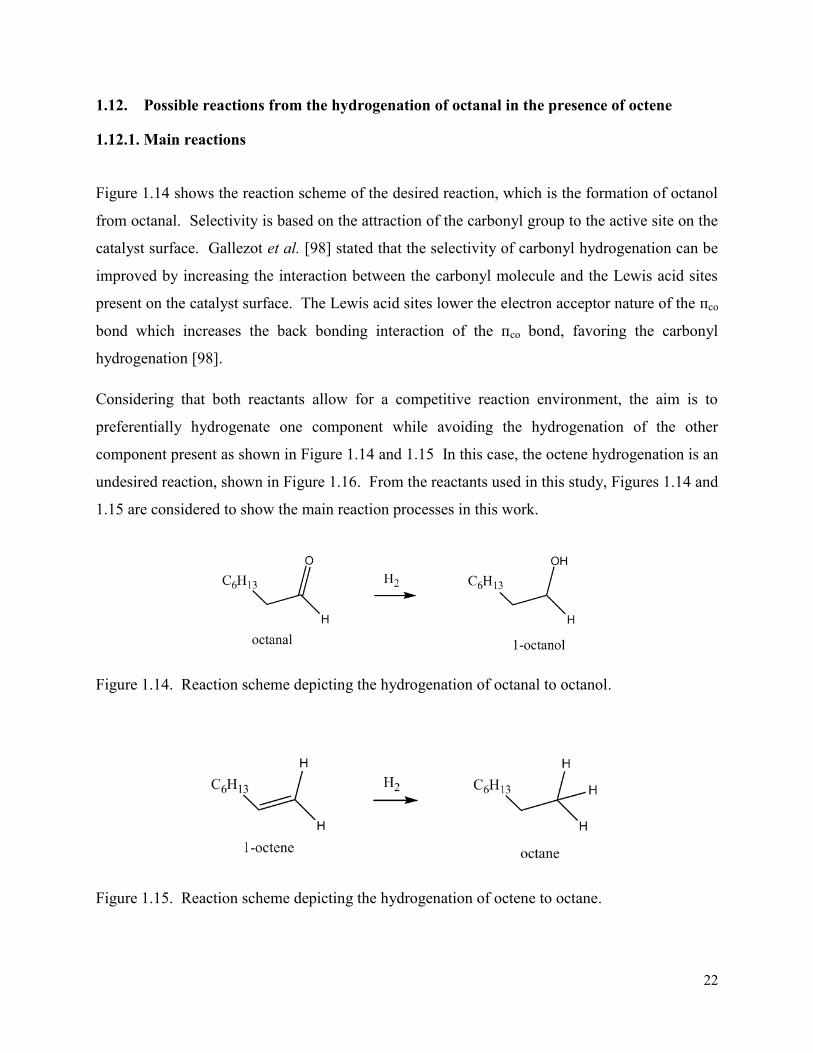
Figure 1.14 shows the reaction scheme of the desired reaction, which is the formation of octanol
from octanal. Selectivity is based on the attraction of the carbonyl group to the active site on the
catalyst surface. Gallezot et al. [98] stated that the selectivity of carbonyl hydrogenation can be
improved by increasing the interaction between the carbonyl molecule and the Lewis acid sites
present on the catalyst surface. The Lewis acid sites lower the electron acceptor nature of the пco
bond which increases the back bonding interaction of the пco bond, favoring the carbonyl
hydrogenation [98].
Considering that both reactants allow for a competitive reaction environment, the aim is to
preferentially hydrogenate one component while avoiding the hydrogenation of the other
component present as shown in Figure 1.14 and 1.15 In this case, the octene hydrogenation is an
undesired reaction, shown in Figure 1.16. From the reactants used in this study, Figures 1.14 and
1.15 are considered to show the main reaction processes in this work.
Figure 1.14. Reaction scheme depicting the hydrogenation of octanal to octanol.
Figure 1.15. Reaction scheme depicting the hydrogenation of octene to octane.
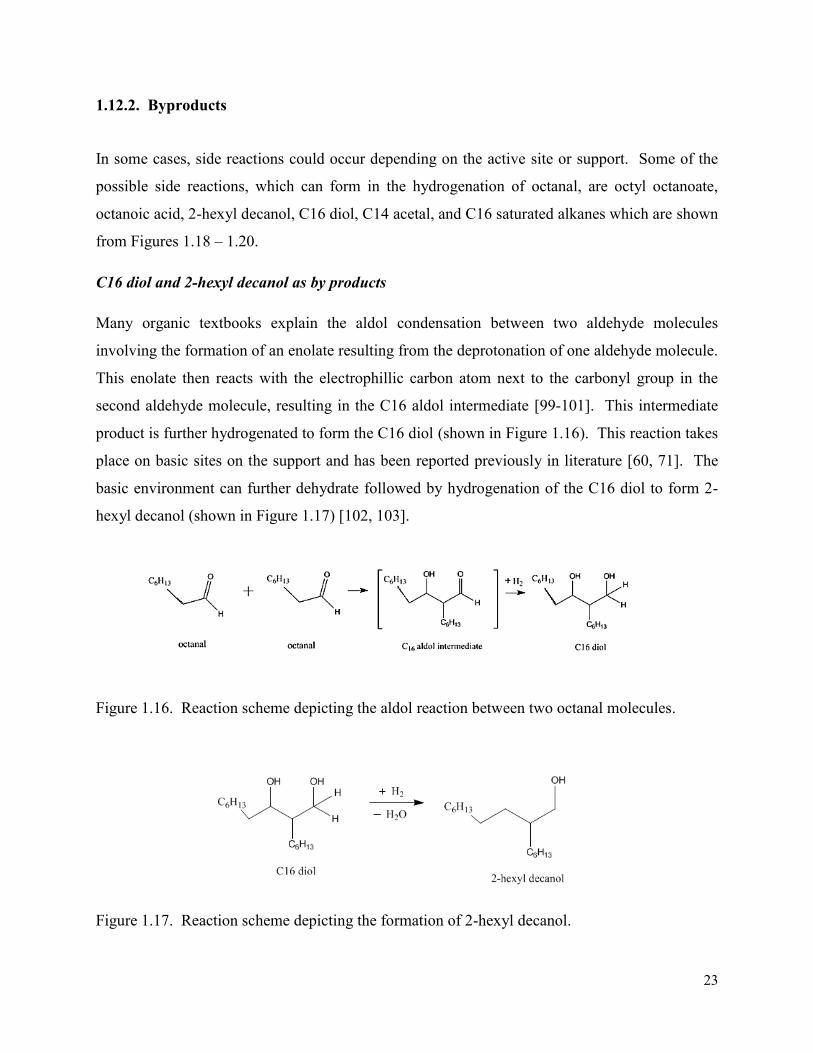
23
1.12.2. Byproducts
In some cases, side reactions could occur depending on the active site or support. Some of the
possible side reactions, which can form in the hydrogenation of octanal, are octyl octanoate,
octanoic acid, 2-hexyl decanol, C16 diol, C14 acetal, and C16 saturated alkanes which are shown
from Figures 1.18 – 1.20.
C16 diol and 2-hexyl decanol as by products
Many organic textbooks explain the aldol condensation between two aldehyde molecules
involving the formation of an enolate resulting from the deprotonation of one aldehyde molecule.
This enolate then reacts with the electrophillic carbon atom next to the carbonyl group in the
second aldehyde molecule, resulting in the C16 aldol intermediate [99-101]. This intermediate
product is further hydrogenated to form the C16 diol (shown in Figure 1.16). This reaction takes
place on basic sites on the support and has been reported previously in literature [60, 71]. The
basic environment can further dehydrate followed by hydrogenation of the C16 diol to form 2-
hexyl decanol (shown in Figure 1.17) [102, 103].
Figure 1.16. Reaction scheme depicting the aldol reaction between two octanal molecules.
Figure 1.17. Reaction scheme depicting the formation of 2-hexyl decanol.
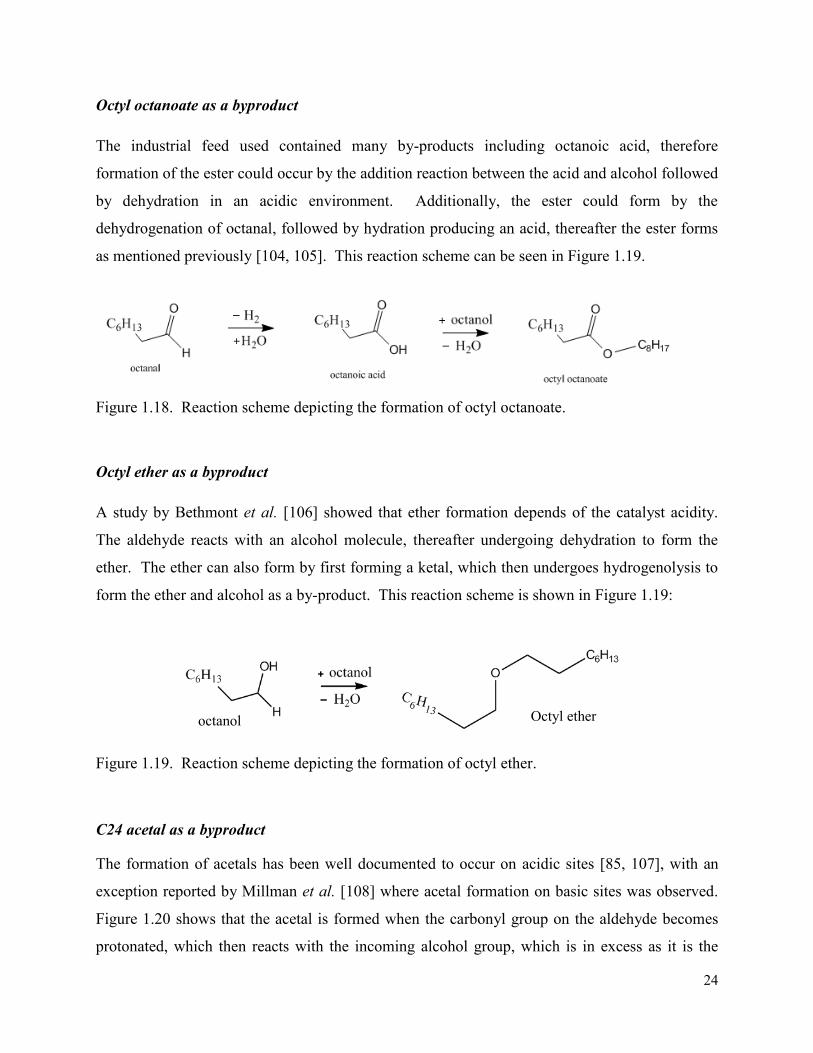
24
Octyl octanoate as a byproduct
The industrial feed used contained many by-products including octanoic acid, therefore
formation of the ester could occur by the addition reaction between the acid and alcohol followed
by dehydration in an acidic environment. Additionally, the ester could form by the
dehydrogenation of octanal, followed by hydration producing an acid, thereafter the ester forms
as mentioned previously [104, 105]. This reaction scheme can be seen in Figure 1.19.
Figure 1.18. Reaction scheme depicting the formation of octyl octanoate.
Octyl ether as a byproduct
A study by Bethmont et al. [106] showed that ether formation depends of the catalyst acidity.
The aldehyde reacts with an alcohol molecule, thereafter undergoing dehydration to form the
ether. The ether can also form by first forming a ketal, which then undergoes hydrogenolysis to
form the ether and alcohol as a by-product. This reaction scheme is shown in Figure 1.19:
Figure 1.19. Reaction scheme depicting the formation of octyl ether.
C24 acetal as a byproduct
The formation of acetals has been well documented to occur on acidic sites [85, 107], with an
exception reported by Millman et al. [108] where acetal formation on basic sites was observed.
Figure 1.20 shows that the acetal is formed when the carbonyl group on the aldehyde becomes
protonated, which then reacts with the incoming alcohol group, which is in excess as it is the
octanol Octyl ether
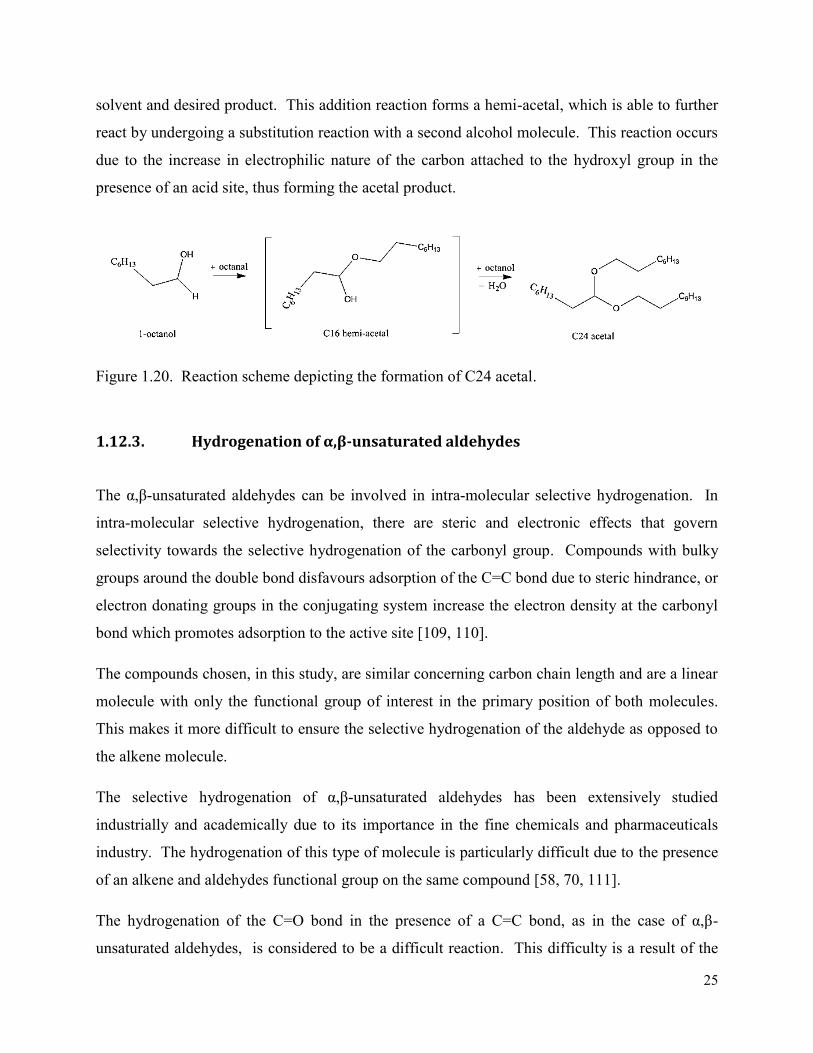
25
solvent and desired product. This addition reaction forms a hemi-acetal, which is able to further
react by undergoing a substitution reaction with a second alcohol molecule. This reaction occurs
due to the increase in electrophilic nature of the carbon attached to the hydroxyl group in the
presence of an acid site, thus forming the acetal product.
Figure 1.20. Reaction scheme depicting the formation of C24 acetal.
1.12.3. Hydrogenation of α,β-unsaturated aldehydes
The α,β-unsaturated aldehydes can be involved in intra-molecular selective hydrogenation. In
intra-molecular selective hydrogenation, there are steric and electronic effects that govern
selectivity towards the selective hydrogenation of the carbonyl group. Compounds with bulky
groups around the double bond disfavours adsorption of the C=C bond due to steric hindrance, or
electron donating groups in the conjugating system increase the electron density at the carbonyl
bond which promotes adsorption to the active site [109, 110].
The compounds chosen, in this study, are similar concerning carbon chain length and are a linear
molecule with only the functional group of interest in the primary position of both molecules.
This makes it more difficult to ensure the selective hydrogenation of the aldehyde as opposed to
the alkene molecule.
The selective hydrogenation of α,β-unsaturated aldehydes has been extensively studied
industrially and academically due to its importance in the fine chemicals and pharmaceuticals
industry. The hydrogenation of this type of molecule is particularly difficult due to the presence
of an alkene and aldehydes functional group on the same compound [58, 70, 111].
The hydrogenation of the C=O bond in the presence of a C=C bond, as in the case of α,β-
unsaturated aldehydes, is considered to be a difficult reaction. This difficulty is a result of the
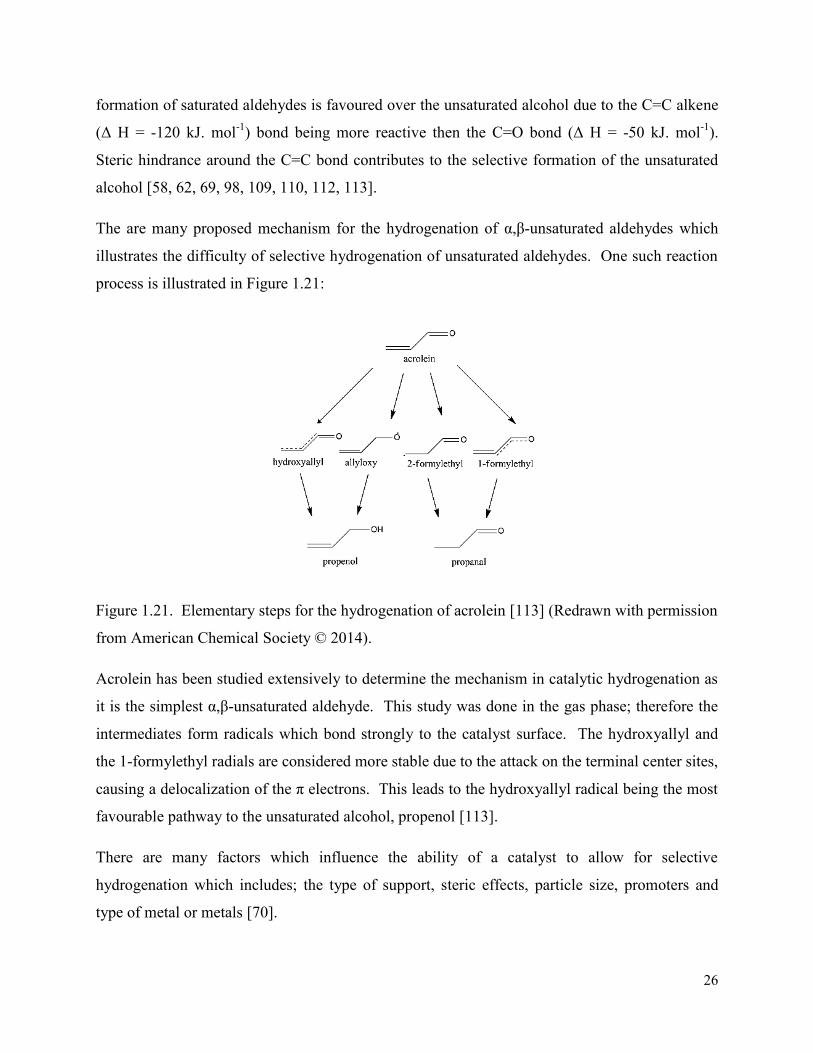
26
formation of saturated aldehydes is favoured over the unsaturated alcohol due to the C=C alkene
(Δ H = -120 kJ. mol-1) bond being more reactive then the C=O bond (Δ H = -50 kJ. mol-1).
Steric hindrance around the C=C bond contributes to the selective formation of the unsaturated
alcohol [58, 62, 69, 98, 109, 110, 112, 113].
The are many proposed mechanism for the hydrogenation of α,β-unsaturated aldehydes which
illustrates the difficulty of selective hydrogenation of unsaturated aldehydes. One such reaction
process is illustrated in Figure 1.21:
Figure 1.21. Elementary steps for the hydrogenation of acrolein [113] (Redrawn with permission
from American Chemical Society © 2014).
Acrolein has been studied extensively to determine the mechanism in catalytic hydrogenation as
it is the simplest α,β-unsaturated aldehyde. This study was done in the gas phase; therefore the
intermediates form radicals which bond strongly to the catalyst surface. The hydroxyallyl and
the 1-formylethyl radials are considered more stable due to the attack on the terminal center sites,
causing a delocalization of the π electrons. This leads to the hydroxyallyl radical being the most
favourable pathway to the unsaturated alcohol, propenol [113].
There are many factors which influence the ability of a catalyst to allow for selective
hydrogenation which includes; the type of support, steric effects, particle size, promoters and
type of metal or metals [70].
27
1.13. Selective hydrogenation catalysts
1.13.1. Platinum group metals
Noble metals have been investigated for the hydrogenation of propanal and acetone in a
competitive reaction environment. As reported by van Druten and Ponec [61], the platinum
group metals hydrogenate both the propanal and acetone with the aldehyde hydrogenating faster
than the ketones in a homogenous catalysis system, and the ketones being hydrogenated faster
than aldehyde hydrogenation using a heterogeneous catalyst [61].
da Silva et al. [54] reported on the use of noble metals for the selective hydrogenation of
cinnamaldehyde, the results showed Pd to be non-selective and iridium being the most selective
to the unsaturated alcohol. The rest of the metals followed the trend Pd < Rh < Ru < Pt < Ir.
They also investigated the effect of promoters such as tin and iron, which gave improved the
activity in the conversion of the aldehyde to the alcohol. This work showed that the Pt-Fe/C
catalyst was approximately 7 times more active than the monometallic Pt/C catalyst and the Pt-
Sn/C catalysts. This was attributed to the metal-metal interaction between the platinum and iron,
as well as the combined metal-support interaction, which was not observed in the Pt-Sn/C
catalyst.
Delbecq and Sautet [109] looked at a theoretical approach, investigating the adsorption of C=O
and C=C functional groups on Pd and Pt surfaces. It was found that the carbonyl group adsorbs
onto the metal surface via back donation of the metal orbital into the пCO orbital. This adsorption
can be further increased by the presence of Lewis acids, which in turn decreases the adsorption
of the C=C bond with the surface [109].
Pd/C is able to convert the C=C bond in α,β unsaturated aldehydes to saturated aldehydes with
high conversion and selectivity under mild conditions. It was reported by Du et al. [110] that the
C=C bond binds to the palladium center, and the C=O bond adsorption is suppressed due to the
high electron density of the Pd/C catalyst. Noble metals (Pt, Pd, Rh) was found to favour the
hydrogenation of the C=C bond over the C=O bond in the absence of a promoter.
28
1.13.2. Group 11 metals (Cu, Ag, Au)
Gold and silver, for many years, was considered inert due to its common applications such as in
jewellery and coins. It was only in the mid-20th century that the significance of silver as a
catalyst was recognized for the oxidation of carbon monoxide (CO), the decomposition of formic
acid and the epoxidation of ethylene. Copper-based catalysts have been used for a number of
processes such as nitrogen oxide removal, amination, oxidation of organic compounds, as well as
selective hydrogenation in the fine chemicals industry. Chetty [97] has investigated the use of
Au/Al2O3 for the selective hydrogenation of octanal in the presence of octene. It was found that
the method of preparation played a vital role in the selectivity to the desired product, e.g. large
gold particles promoted the formation of byproducts, whereas small particles favoured the
selectivity to the desired product, which was octanol.
1.13.2.1. Copper
Non-noble metals (Cu, Ni, Zn) were investigated and it was shown that these metals are able to
preferentially hydrogenate the C=O bond over the C=C bond in α,β-unsaturated aldehydes.
There have also been studies to support the ability of copper to be effective for the selective
hydrogenation of aldehydes and ketones [114, 115].
Copper chromite catalysts used for the hydrogenation of non-conjugated unsaturated aldehydes,
however, were not suitable for the conjugated α, β-unsaturated aldehydes as the C=C bond
reactivity was increased and led to isomerization [116, 117]. It was later discovered by Hubaut
et al. [117, 118] that the steric effects of the substrate played a major role in the selectivity for
the desired product.
A good example is the use of Cu/SiO2 for the selective hydrogenation of cinnamaldehyde to
cinnamyl alcohol. The catalyst activity and selectivity depends on a number of factors, which
has been discussed, however, in this case the high dispersion of the copper was responsible for
the high selectivity, together with the metal-support interaction. It was found that an increase in
dispersion increases conversion with no effect on the selectivity [111]. Chambers et al. [119]
investigated the use of modified copper on silica catalysts for selective hydrogenation of
cinnamaldehyde. This work showed that the active sites were the predominant sites, with less
29
free copper, which were found with larger particles or strong metal support interactions (SMSI)
[98].
Marchi et al. [120] reported on the use of copper-based catalysts for the hydrogenation of
cinnamaldehyde in the liquid phase. This study found that γ-alumina allows for a better
dispersion of copper, as compared to silica. Copper dispersion was shown to increase the
conversion but did not have a significant effect on the selectivity towards the desired product.
1.13.2.2. Silver
Silver has been used in many applications, for example the oxidation of volatile organic
compounds (VOC’s), epoxidation of ethylene and reduction of NOx [121-123]. Silver is not
commonly considered to be a heterogeneous hydrogenation catalyst due to its electron
configuration of 4d105s1 which results in an inability to dissociate a strong bond such as diatomic
hydrogen, nevertheless there have been many reports disproving this by showing the
effectiveness of silver in the selective hydrogenation of α,β-unsaturated aldehydes [50, 121, 124,
125]. This propelled a need for greater understanding and insight to the catalytically active silver
species. There are a few types of species that have been reported: isolated Ag+ ions aggregated
silver particles, silver-aluminate like species, and Ag2O clusters [121, 124, 125]. Silver was
found to have a low heat of adsorption value towards hydrogen, meaning the hydrogen does not
strongly adsorb onto the silver surface. This allows the C=O bond to hydrogenate preferentially,
as opposed to the C=C bond which has been documented to require strongly adsorbed hydrogen
to hydrogenate [50, 126].
Nagase et al. [127], first reported silver as a hydrogenation catalyst in 1983 for the selective
hydrogenation of α, β- unsaturated aldehydes [123, 128]. A great deal of research has been done
by Claus et al. [129], which reported on the chemoselective properties of silver in the study of
α,β-unsaturated aldehydes to their corresponding alcohols. Chen et al. [128] reported on the
hydrogenation of chloronitrobenzenes and the chemoselective properties of supported silver
catalysts. Similarly, chemoselective hydrogenation of synthetic substrates in the presence of the
supported silver catalyst reduces halonitrobenzenes to their respective aniline form as shown by
Crook et al. [123].
30
Acrolein is the simplest α,β-unsaturated aldehyde with a low boiling point and no bulky groups,
increasing its difficulty in undergo selective hydrogenation. Grunert et al. [130] used Ag/TiO2
for gas phase hydrogenation of acrolein. This catalyst was prepared by wet impregnation, which
allowed for strong metal-support interaction, showed high selectivity towards the allyl alcohol
(42%) [130]. Since then, there have been many reports of silver supported catalysts with
supports such as aluminium foil, single crystals, wet impregnation and deposition precipitation
over a wide range of inorganic supports such as titania, zeolites, silica and alumina [124, 130,
131]. A supported silver silica catalyst was found to be effective in selective hydrogenation of
which was attributed to the edges and kinks which favour the formation of the allyl alcohol [125,
132]. Bron et al. [131] tested a range of silver based materials, this study concluded that surface
coverage (or pressure) plays an important role in adsorption of both acrolein and hydrogen, thus
affecting selectivity. The higher pressure promotes the adsorption of acrolein whereby the C=C
bond tilts away from the metal, increasing the activation of the C=O bond, thus favouring allyl
alcohol formation [129, 131, 133]. Bron et al. [131] tested a range of preparation techniques of
Ag/SiO2 which showed sputtered silver to favour the formation of propionaldehyde while
nanocrystalline silver favoured the allyl alcohol formation .
Wei et al. [132] used Ag/SiO2 to investigate the effect of the particle size of silver, on the
acrolein hydrogenation to allyl alcohol, resulting in selectivities ranging from 20-35 %, with a
maximum conversion of 88%. This shows that the higher selectivity was attributed to the larger
particle size. Chen et al. [128] reported on Ag/SiO2 which was also found effective for the
hydrogenation of o-chloronitrobenzene to o-chloroaniline, with a complete conversion and 100
% selectivity.
Claus et al. [134] reported on use of silver supported on SiO2 and TiO2 for the selective
hydrogenation of crotonaldehyde. The silica based catalyst showed an improved selectivity
towards the formation of allyl alcohol compared to the titania based catalyst. Grunert et al. [130]
showed the effect of reduction on Ag/TiO2, with high temperature reduction (500 °C) having a
lower selectivity to the allyl alcohol (27 %) compared to the low temperature reduction (200 °C)
in which a selectivity of 42 % was obtained.
Volckmar et al. [135] showed the influence of support, whereby the highest acrolein conversion
(~90 %) was obtained with the pure supports silica and alumina. Mixed supports comprising of
31
varying ratios of SiO2 and Al2O3 showed conversion to be in the range of 20-60 % with
selectivity reaching a maximum of 40 %.
1.13.2.3. Gold
Gold have been reported to be highly catalytically active, when in the nanoparticle range, but
reduces its catalytic activity as the particle size increase [136]. Catalysts containing gold
nanoparticles have been used for low temperature CO oxidation and hydrogenation [137, 138]
with complete conversions obtained as low as 30 °C on Au/Al2O3 catalysts [139]. Bond and
Sermon [140] were the first to report on the catalytic activity of gold, in the 1970’s, for the
hydrogenation of olefins. Since the 1970’s, a great deal of research was undertaken to explain
the catalytic activity of gold when in the nanoparticle range [141].
Perret et al. [142] reported on the selective hydrogenation of benzaldehyde to benzyl alcohol
using Au/Al2O3, Pd/Al2O3, and Ni/Al2O3 catalysts. The gold catalyst showed a lower activity
initially when compared to the nickel and palladium catalysts; however, the gold catalyst offered
superior stability compared to the other catalysts. In addition, gold catalysts were used in the
oxidation of benzyl alcohol to benzaldehyde as the main product (~80 %) with a maximum
conversion of 20 % [143]. Hugon et al. [144] reported on the effectiveness of gold catalysts for
the selective hydrogenation of 1,3-butadiene in the presence of alkenes, whereby gold offered a
higher selectivity compared to palladium based catalysts.
1.14. Bimetallic catalyst
A surface containing two metals has unique surface properties as opposed to the monometallic
system due to the interaction of the two metals with each other and with the support. This will
modify the surface and alter the behavior of the catalyst. There are two distinctive categories
when it comes to a bimetallic catalyst: [145]
(a) Alloy – is defined when one metal dissolved in another and they cannot be distinguished from
each other. One of the metals would have a lower surface energy causing segregation between
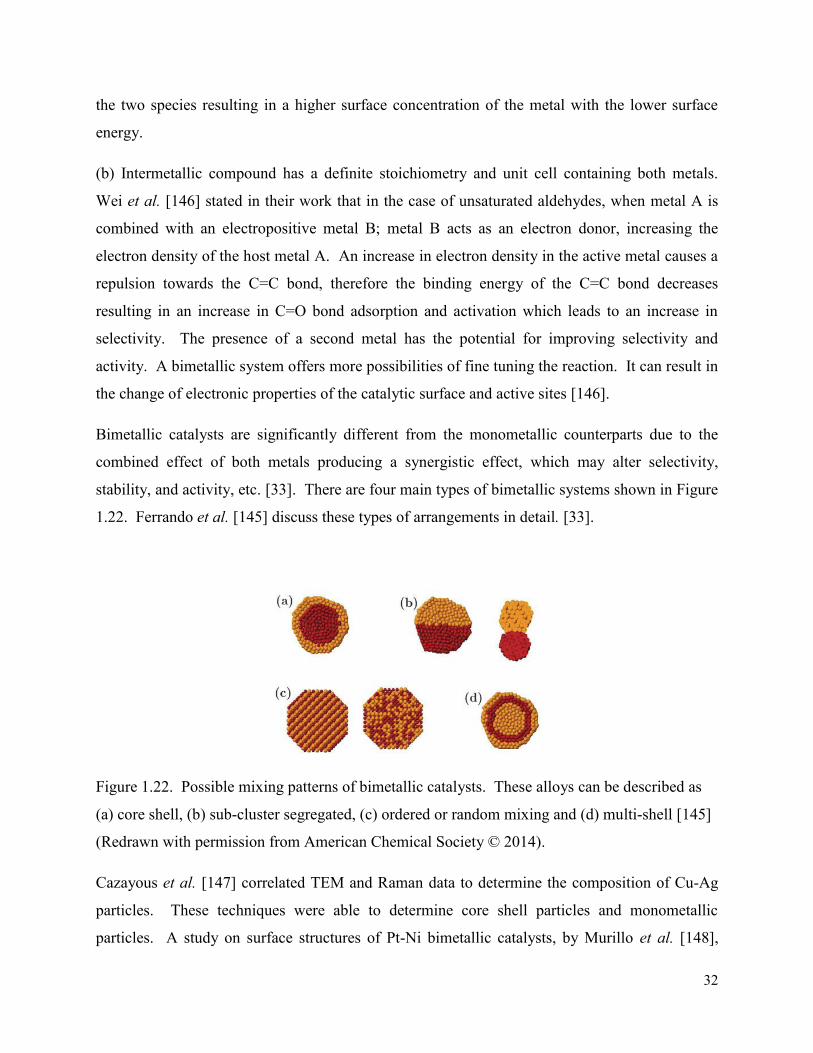
32
the two species resulting in a higher surface concentration of the metal with the lower surface
energy.
(b) Intermetallic compound has a definite stoichiometry and unit cell containing both metals.
Wei et al. [146] stated in their work that in the case of unsaturated aldehydes, when metal A is
combined with an electropositive metal B; metal B acts as an electron donor, increasing the
electron density of the host metal A. An increase in electron density in the active metal causes a
repulsion towards the C=C bond, therefore the binding energy of the C=C bond decreases
resulting in an increase in C=O bond adsorption and activation which leads to an increase in
selectivity. The presence of a second metal has the potential for improving selectivity and
activity. A bimetallic system offers more possibilities of fine tuning the reaction. It can result in
the change of electronic properties of the catalytic surface and active sites [146].
Bimetallic catalysts are significantly different from the monometallic counterparts due to the
combined effect of both metals producing a synergistic effect, which may alter selectivity,
stability, and activity, etc. [33]. There are four main types of bimetallic systems shown in Figure
1.22. Ferrando et al. [145] discuss these types of arrangements in detail. [33].
Figure 1.22. Possible mixing patterns of bimetallic catalysts. These alloys can be described as
(a) core shell, (b) sub-cluster segregated, (c) ordered or random mixing and (d) multi-shell [145]
(Redrawn with permission from American Chemical Society © 2014).
Cazayous et al. [147] correlated TEM and Raman data to determine the composition of Cu-Ag
particles. These techniques were able to determine core shell particles and monometallic
particles. A study on surface structures of Pt-Ni bimetallic catalysts, by Murillo et al. [148],
33
showed that within bimetallic systems the Pt-Ni-Pt(111) structure was more active for acrolein
selective hydrogenation than the Ni-Pt-Pt(111) structure, indicating that characterization is vital
in understanding the catalytic activity of bimetallic catalysts. Simionato et al. [149] showed,
with the use of XRD, TPR, and Raman spectra, that the incorporation of silver on alumina
supported cobalt catalysts aids in the reduction of cobalt, and assists in the formation of Co0 sites
which are considered to be the active sites. Sun et al. [150] reported on the use of CuAg/Al2O3
catalysts for hydrogenolysis of glycerol. As the silver content increased to 5 wt %, on the 55.5
wt % Cu/Al2O3 catalyst, the conversion increased to 100 %, as opposed to when no silver was
present (94 %) and selectivity increased from 70 % to greater than 92 % with silver present
[150]. Zheng et al. [151] showed the use of various characterization techniques for Au-Ag
bimetallic catalysts. TEM and XRD were employed to differentiate Au-Ag alloys versus
monometallic Au and Ag particles, with STEM-EDX and XPS indicating the formation of a
homogeneous Au-Ag alloy as opposed to core-shell structures. The alloy was reported to have
superior performance when compared to its monometallic counterparts.
Zhu et al. [152] showed the effect of the variation of silver ratio on a Pd/SiO2 catalyst. The
acetylene hydrogenation did not show much variation in terms of conversion; however, there
were significant differences with regards to selectivity towards ethylene. It was shown that
ratios 1:1 and 1:5 Pd:Ag showed selectivities of 58 % and 68 % respectively, while a ratio of 1:3
Pd:Ag showed the highest selectivity of 84 % at 150 °C, indicating that the composition of
bimetallic catalysts play an important role in the catalyst activity. Deng et al. [153] showed in
his work the effect of impregnation sequence of CuCo/SiO2 catalysts for higher alcohol
synthesis. The co-impregnated catalyst showed a stronger synergistic effect due to metal-metal
interaction caused by the transfer of electrons from the copper to the cobalt species. The change
in the method of preparation directly affected the conversion and selectivity obtained, with the
co-impregnated showing moderate conversion, with a higher selectivity towards alcohols (51.5
%), while the catalyst with copper impregnated first showed higher conversion and a lower
selectivity towards alcohols (39.9 %) [153]. Similarly, Jongpatiwut et al. [154] reported on the
competitive hydrogenation for poly aromatic compounds showed that the effect of impregnation
of Pd-F catalysts gave a significant difference, in conversion and selectivity towards the desired
products, with respect to preparation methods. The order of impregnation showed that when Pd
was impregnated first a lower CO uptake with a TOF value of 34 was obtained, and when
34
fluoride was impregnated first, the CO uptake was considerably higher and the TOF was
reported to be 85 [154]. This indicates the position of the active metal plays a vital role in the
catalytic activity.
Other notable work done using bimetallic catalysts found that zeolite Y-supported Pt-Ni catalysts
showed better activity and stability as compared to their monometallic counterparts for
acetophenone hydrogenation [155], while tungsten decreased platinum aggregation which was
attributed to strong metal-metal interaction resulting in low toluene selectivity [156]. Bachiller-
Baeza et al. [157] found that the higher selectivity towards the unsaturated alcohol observed in
citral hydrogenation was attributed to the presence of iron, which increased the Lewis acidity in
the ruthenium catalysts. Additionally, copper was shown to improve the silica supported-
ruthenium catalysts metal dispersion, resulting in increased activity and selectivity to crotyl
alcohol in work done by Reyes et al. [158]. There have also been cases whereby bimetallic
catalysts showed an undesired effect, such as in work reported by Ashour et al. [159] for
crotonaldehyde hydrogenation using Pd-Cu/SiO2, where the copper was preferentially poisoned
leaving palladium available to react with both functional groups. Lucas and Claus [160] reported
on the use of silver to assists in the co-ordination of C=O bonds, and allowed for a 70 % yield of
allyl alcohol, in the liquid phase selective hydrogenation of acrolein, when combined with
indium.
In general, literature shows that bimetallic catalysts offer changes in structural, textural, and
electronic properties of the catalyst, and it is this modification that affects the activity and
selectivity [33]. Characterization of these catalysts becomes vital to fully understand the
interaction between the metals and the metal-support interaction, and how this correlates with the
results obtained from catalytic testing. There has been sufficient work done to show the benefits
using bimetallic catalysts over their monometallic counterparts. It has been well documented
that the incorporation of silver in monometallic catalysts systems has improved the catalytic
activity. For this reason, silver was chosen to be incorporated into the γ-alumina supported
copper catalyst, which was investigated in this study.
35
1.15. Aims and objectives
For this project, the effectiveness of γ-alumina supported copper-silver bimetallic catalysts in the
selective hydrogenation of octanal in the presence of octene was investigated.
A range of γ-alumina supported copper catalysts with a variation of the silver loading will
was prepared, characterized, and tested in a continuous liquid phase fixed bed reactor.
Catalytic reaction parameters such as temperature, pressure, hydrogen:octanal, and
Liquid hourly space velocity (LHSV) will be investigated to determine its impact and
contribution to the catalytic activity.
The bimetallic CuAg/γ-Al2O3 catalysts will undergo further investigation to determine
the impact of varying factors such as; the impregnation sequence and the intermetallic
weight loadings of each metal, while maintaining a constant total metal loading.
36
Chapter 2 Instrumental Techniques and Reactor
Design
The syntheses and characterization of the nine catalysts prepared are presented in this chapter.
Wet impregnation was the technique chosen to prepare the monometallic and bimetallic
catalysts. The catalytic reactor design and GC analysis method to identify and quantify the
products are shown here.
2.1. Catalyst synthesis
Reagents for catalyst preparation
Commercial γ-Al2O3, Alfa Aesar
Copper nitrate, Sigma Aldrich
Silver nitrate, Sigma Aldrich
1000 ppm copper ICP standard, DLD Suppliers
1000 ppm silver ICP standard, DLD Suppliers
2.2. Chemicals used for testing and analysis
The feed used for the selective hydrogenation of octanal in the presence of octene was made up
of 2 % octene, 10 % octanal, 88 % octanol, which were supplied by Sasol. Octane, 1-octene,
octanal and 1-octanol with purity >98 % were used for the calibration of the gas chromatograph
instrument for product analysis and were purchased from Sigma Aldrich. Hydrogen, nitrogen
and synthetic air with a purity greater than >98 % was obtained from Afrox. These gases were
used for the analysis by gas chromatography and for catalytic testing.
37
2.3. Instrumentation and preparation
The catalysts prepared were characterized using Infrared Spectroscopy (IR), in situ and powder
X-Ray Diffraction (XRD), Transmission Electron Microscopy (TEM), Scanning Electron
Microscopy (SEM), Nitrogen Physisorption using BET, Inductively Coupled Plasma – Optical
Emission Spectroscopy (ICP-OES), Temperature Programmed Reduction (TPR), Temperature
Programmed Desorption using ammonia (NH3-TPD) and Chemisorption using hydrogen and
carbon monoxide.
2.3.1. Infrared spectroscopy – attenuated transmission reflectance
The infrared spectrometer used was a Perkin Elmer equipped with a Universal Sampling
Accessory with a diamond crystal to reach an adequate force for analysis. The software used
was Spectrum 100, which allowed the spectra obtained to be analyzed and edited. Samples
required no prior preparation and were added to the sample holder, thereafter, the force was
increased to 120 gauge to ensure sufficient contact between the surfaces. The samples were
scanned within the range 350-3500 cm-1.
2.3.2. Inductively coupled plasma – optical emission spectrometry
Quantitative and qualitative analysis of the catalyst were performed on a Perkin Elmer ICP-OES
Optima 5300 DV. The catalysts powders were digested in 10 mL of nitric acid and made up to
100 mL using double distilled water. Multi element standards were prepared in 10 – 100 ppm
concentration for copper and 2- 10 ppm concentration for silver. These standards were used to
determine the accurate metal loading of the copper and silver on the catalyst prepared.
38
Table 2.1. The selected spectral lines for each of the elements analyzed by ICP-OES.
Element Spectral Line /nm
Cu 224
Ag 243
2.3.3. X-ray diffractogram
X-ray diffraction (XRD) was carried out using a Bruker D8 Advance XRD diffractometer using
a Cu Kα radiation (λ = 1.506 Å). Operating conditions were 40 kV and 40 mA with a scan rate
of 0.5 ° min-1, slit (2θ) and divergence slit and scatter slit of 1°. This XRD technique was used to
determine two types of information, (1) crystallite size using the Scherrer equation in powder
XRD, and (2) reduction and oxidation temperatures under in situ conditions. The Scherrer
equation used 0.98 as the constant value (k). The operating conditions of in situ reduction used 5
% H2/N2 at a flow rate of 30 mL/min. The temperature was ramped at 10 °C/min till 600 °C,
thereafter, the sample was cooled to 100 °C at the same rate. The re-oxidation was carried out by
flowing N2 for 2 hours at 100 °C to purge any hydrogen present. Air was used as the oxidant at a
flow rate of 30 mL/min at a temperature ramp at 10 °C until 600 °C, thereafter the sample was
cooled to 100 °C. The in situ XRD was conducted on selected samples.
2.3.4. Nitrogen physisorption
Samples were weighed and analyzed using the Micromeritics TriStar II 3020 surface area and
porosity instrument and software. Sample preparation involved degassing at 90 °C for 1 hour to
remove absorbed moisture, thereafter, the temperature was increased to 200 °C and the sample
was kept under nitrogen flow overnight. The catalyst for which surface area was to be measured
was placed inside a quartz tube and the adsorbate gas passed through while the tube is placed in a
liquid nitrogen bath, where the temperature was maintained at 77.5 K. Nitrogen physisorption
provides information about the surface area, pore size, and pore volume of the catalysts. All
measurements were made in duplicate to ensure reproducibility.
39
2.3.5. Scanning electron microscopy- energy dispersive X-ray spectroscopy (SEM-EDX)
For sample preparation, a piece of two-way carbon tape was placed onto a metal stub. The
catalyst powder was added to the tape and the excess powder was removed by gentle tapping.
The powder was coated with carbon, using the polaron SC sputter coater, to provide an electron
active surface. The samples were analyzed using the Joel JSM 6100 instrument. The energy
dispersion X-ray spectroscopy (EDX) mapping was done using the Bruker EDX detector and
was analyzed with the Espirit 1.8.5 software.
2.3.6. Transmission electron microscopy (TEM)
A small amount of the sample was added to an Eppendorf vial; thereafter a solvent such as
acetone or ethanol was added. This mixture was sonicated for 5 minutes to allow the breakup of
larger particles, which allows good dispersion onto the metal grid coated with holy-carbon. A
copper or nickel grid was immersed into the Eppendorf tube to coat the grid with the mixture.
The grid was placed into the Joel 1010 TEM instrument and analyzed using the Megaview III
soft imaging system at an operating voltage of 100 kV.
2.3.7. High resolution- transmission electron microscopy - energy dispersive X-ray
spectroscopy (HRTEM-EDX)
Samples were prepared in the same way as with TEM. The copper or nickel grid, coated with a
holy-carbon film, containing the sample was placed into the sample holder and analyzed using
the Joel JEM-2100 using the iTEM software for imaging at 200 kV. The microscope used a
Lanthanum hexaboride (LaB6) gun and a Gatan ultrascan camera for imaging. HRTEM was
used for high magnification imaging as well as dark field imaging, mapping and line scan.
HRTEM was conducted on selected catalysts.
40
2.3.8. Temperature programmed reduction/desorption (TPR/TPD)
The calcined catalyst (0.04-0.05 g) was added to a U-shaped quartz tube between two layers of
quartz wool. This was fastened into the Micromeritics AutoChem II chemisorption analyzer.
The catalyst was dried under helium to 400 °C at a rate of 10 °C/min. The sample was cooled to
70 °C, thereafter heated to 600 °C under 5 % H2/Ar for the TPR analysis at a rate of 10 °C/min.
After analysis, the sample was cooled to 40 °C under helium. In the case of TPD, 5 % NH3/Ar
was used instead of hydrogen to determine acid sites. All TPD analysis was conducted
immediately after TPR analysis to ensure the analysis occurs on a fully reduced catalyst.
2.3.9. Chemisorption
The Micromeritics 2920 AutoChem II chemisorption analyzer was used to carry out pulse
chemisorption using hydrogen and carbon monoxide. All calcined samples were degassed under
nitrogen at 90 °C and under vacuum at 200 °C prior to the analysis using the Micromeritics Flow
prep 060 sample degas system. The catalyst (0.03-0.04 g) was sandwiched between two layers
of quartz wool in a U-shaped quartz tube, which was fitted onto the Micromeritics instrument.
The analysis underwent an evacuation step using helium to ensure the sample has no moisture.
The chemisorptive gas (H2 or CO) was then passed through at a set temperature with increasing
pressure; after analysis the sample was flushed with helium to terminate the analysis. All
catalysts were analyzed in duplicate on separate samples to ensure reproducibility, and in
duplicate on the same sample to ensure that the results correlate for both chemisorptive gas
analyses.
2.3.10. Thermal gravimetric analysis – differential scanning calorimetry (TGA-DSC)
The TA SDTQ600 instrument was used for the thermal gravimetric analysis. Samples were
weighed and placed in a sample holder. The analysis involves the sample being heated under air
41
with 50 mL/min flow rate from room temperature to 700 °C at a heating rate of 10 °C/min. This
analysis was also conducted under nitrogen instead of air.
2.4. Gas chromatography
GC using a flame ionization detector (FID) was used for analysis and quantification of the
products obtained from the hydrogenation of octanal in the presence of octene. A volume of 1
µL, using a SGE 1 µL syringe, was injected into the column with an initial temperature of 40 °C
and a spilt ratio of 20. The injector temperature and pressure was 200 °C and 50 psi. The
column temperature program for the Perkin Elmer TotalChrom software was ramped as follows:
an initial temperature of 40 °C was held for 5 minutes, thereafter a set point of 240 °C with a
heating rate of 3 °C/min. Afrox supplied both the carrier gases (He) and the flame gas (H2). Gas
chromatography-mass spectrometer was used to confirm all products using the Perkin Elmer
Clarus 500 GC with a Perkin Elmer 560S mass spectrometer. The samples were analyzed using
the same method as the GC FID. The mass spectrometer used a photo ionization detector with a
positive electron ionization mode. The Turbomass 5.4.2. software was used to analyze the
chromatographs and MS spectra.
2.5. Catalyst synthesis
2.5.1. The monometallic catalyst - 5Cu/γ-Al2O3
Commercial γ-Al2O3 pellets, obtained from Alfa Aesar, were ground into a fine powder using a
mortar and pestle. Copper nitrate (0.250 g) was dissolved in 15 ml of deionized water and added
slowly to a slurry of γ-Al2O3 (4.752 g). This mixture was stirred at room temperature for 6
hours; thereafter it was heated gently for 1 hour to remove the excess water until a thick paste
remained. The paste was oven dried at 120 °C overnight, followed by calcination at 500 °C for 8
hours under a flow of air, with a temperature ramp of 1.6 °C/min.
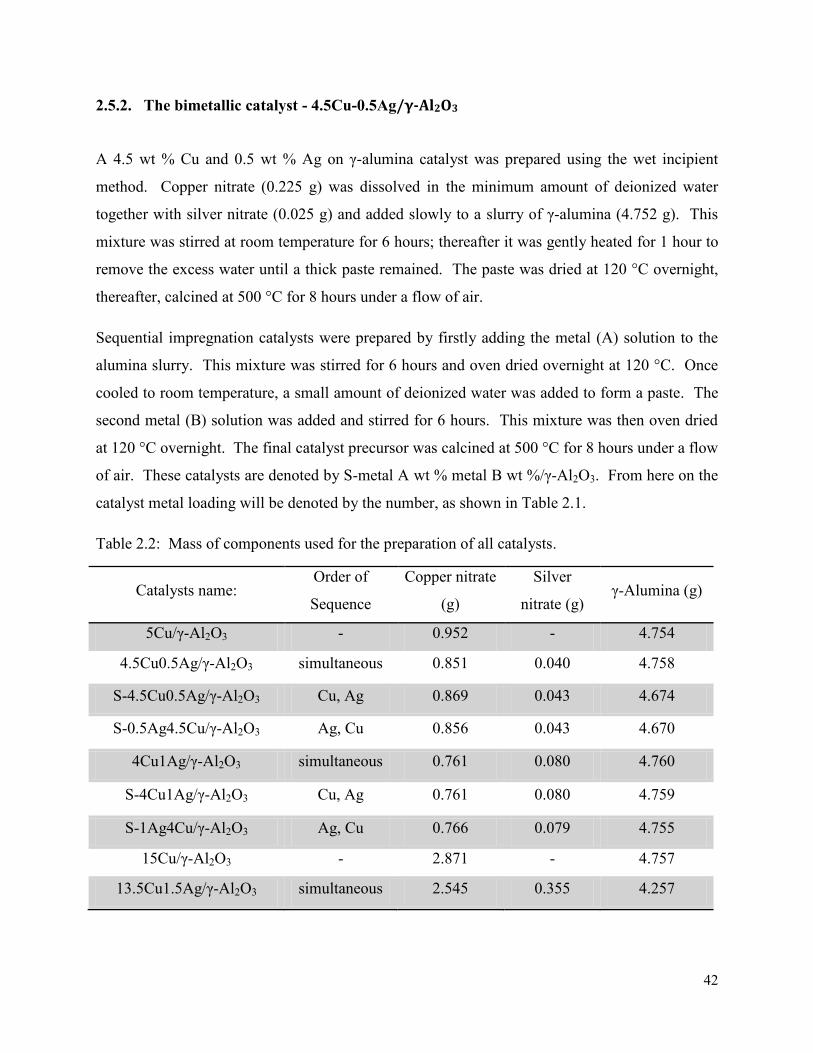
42
2.5.2. The bimetallic catalyst - 4.5Cu-0.5Ag/γ-Al2O3
A 4.5 wt % Cu and 0.5 wt % Ag on γ-alumina catalyst was prepared using the wet incipient
method. Copper nitrate (0.225 g) was dissolved in the minimum amount of deionized water
together with silver nitrate (0.025 g) and added slowly to a slurry of γ-alumina (4.752 g). This
mixture was stirred at room temperature for 6 hours; thereafter it was gently heated for 1 hour to
remove the excess water until a thick paste remained. The paste was dried at 120 °C overnight,
thereafter, calcined at 500 °C for 8 hours under a flow of air.
Sequential impregnation catalysts were prepared by firstly adding the metal (A) solution to the
alumina slurry. This mixture was stirred for 6 hours and oven dried overnight at 120 °C. Once
cooled to room temperature, a small amount of deionized water was added to form a paste. The
second metal (B) solution was added and stirred for 6 hours. This mixture was then oven dried
at 120 °C overnight. The final catalyst precursor was calcined at 500 °C for 8 hours under a flow
of air. These catalysts are denoted by S-metal A wt % metal B wt %/γ-Al2O3. From here on the
catalyst metal loading will be denoted by the number, as shown in Table 2.1.
Table 2.2: Mass of components used for the preparation of all catalysts.
Catalysts name: Order of
Sequence
Copper nitrate
(g)
Silver
nitrate (g) γ-Alumina (g)
5Cu/γ-Al2O3 - 0.952 - 4.754
4.5Cu0.5Ag/γ-Al2O3 simultaneous 0.851 0.040 4.758
S-4.5Cu0.5Ag/γ-Al2O3 Cu, Ag 0.869 0.043 4.674
S-0.5Ag4.5Cu/γ-Al2O3 Ag, Cu 0.856 0.043 4.670
4Cu1Ag/γ-Al2O3 simultaneous 0.761 0.080 4.760
S-4Cu1Ag/γ-Al2O3 Cu, Ag 0.761 0.080 4.759
S-1Ag4Cu/γ-Al2O3 Ag, Cu 0.766 0.079 4.755
15Cu/γ-Al2O3 - 2.871 - 4.757
13.5Cu1.5Ag/γ-Al2O3 simultaneous 2.545 0.355 4.257
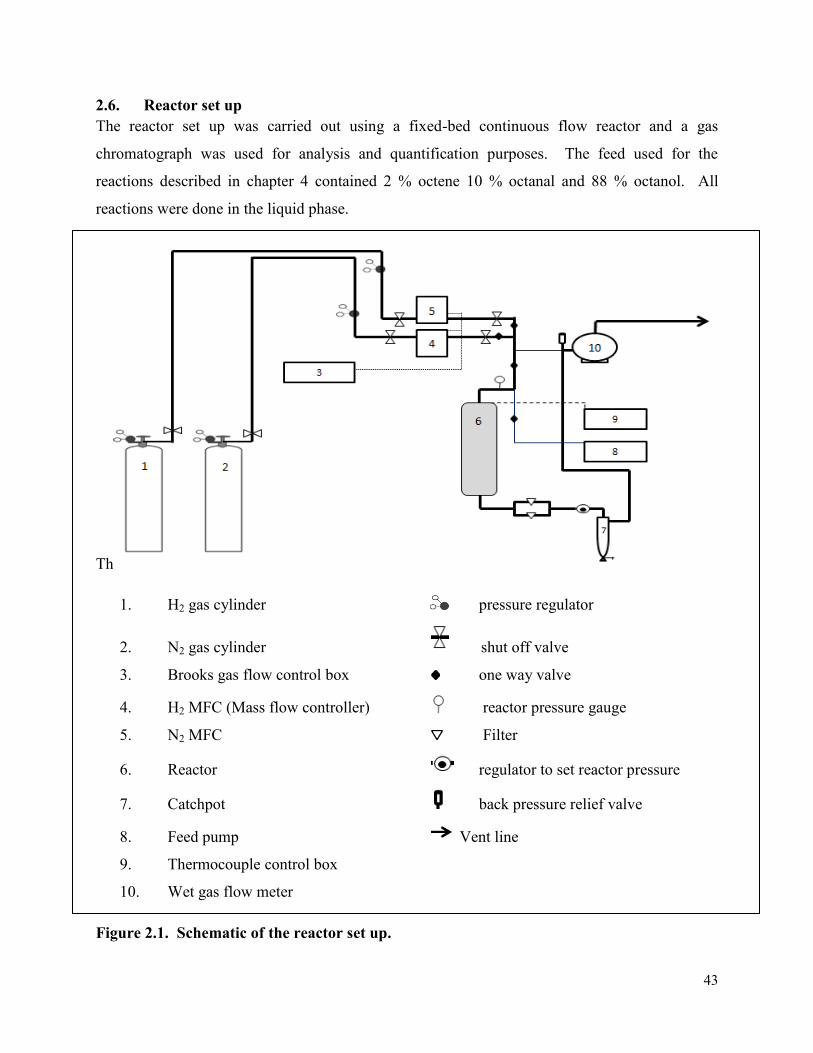
43
2.6. Reactor set up The reactor set up was carried out using a fixed-bed continuous flow reactor and a gas
chromatograph was used for analysis and quantification purposes. The feed used for the
reactions described in chapter 4 contained 2 % octene 10 % octanal and 88 % octanol. All
reactions were done in the liquid phase.
Th
1. H2 gas cylinder pressure regulator
2. N2 gas cylinder shut off valve
3. Brooks gas flow control box one way valve
4. H2 MFC (Mass flow controller) reactor pressure gauge
5. N2 MFC Filter
6. Reactor regulator to set reactor pressure
7. Catchpot back pressure relief valve
8. Feed pump Vent line
9. Thermocouple control box
10. Wet gas flow meter
Figure 2.1. Schematic of the reactor set up.
44
2.7. Catalytic testing
A 300 mm heating jacket was used to supply heat during the hydrogenation of aldehydes in a
mixed feed. The reactor tube had a 7 mm inner diameter and 9 mm outer diameter. The catalyst
bed was made up of approximately 2 mL of catalyst pellets (300-600 µm) diluted in a 1:1 ratio
with 24 grit carborundum in a sandwich of glass wool. This catalyst bed was packed in the
region considered to be the hotspot of a 350 mm 316 stainless steel reactor tube. 24 grit
carborundum was used to pack either side of the catalyst bed, separated by glass wool, to allow
mixing of the feed with gas and to pre-heat the gases before they reach the catalyst bed to allow
for constant temperature. Glass wool was packed on either side of the reactor tube to prevent
particulate matter from entering the product stream. The reactor was secured by bolts which
were tightened by a torque wrench; thereafter a leak test was conducted by holding a high
pressure (50 bar) of nitrogen over a period of time to ensure there were no leaks in the system.
The reactor was covered with an insulating jacket to allow for an isothermal environment. The
temperature was monitored by a thermocouple placed between the heating mantle and reactor
tube to measure the outside temperature, which was controlled with a control panel. The actual
temperature within the reactor tube was controlled by a thermocouple placed inside the reactor
tube. A schematic diagram of the set-up is given in Figure 2.1.
Liquid phase hydrogenation was carried out using a continuous plug flow fixed bed reactor
which operated in a down flow direction. The liquid feed was fed through the 1/8th inch 316
stainless steel tubing feed lines, using a LabAlliance series II isocratic pump. 1/16th 316 stainless
steel product pipes contain a filter leading to the catchpot allowed the products to be collected in
a 500 mL stainless steel catchpot. The hydrogen and nitrogen gas flow was controlled by Brooks
mass flow controllers (MFC’s) with the excess gas exiting through a Ritter Drum Type (TGI-
model 5) wet gas flow meter. The pressure was maintained using a Tescom pressure regulator to
set the reactor pressure, before the sampling catchpot.
The catalyst preparation prior to catalytic testing involved the catalyst drying at 200 °C
overnight, followed by the blending of hydrogen at 160 °C. The catalyst was then reduced using
100 % hydrogen at a flowrate of 12 mL/min overnight at reduction temperatures ranging from
220 – 260 °C.
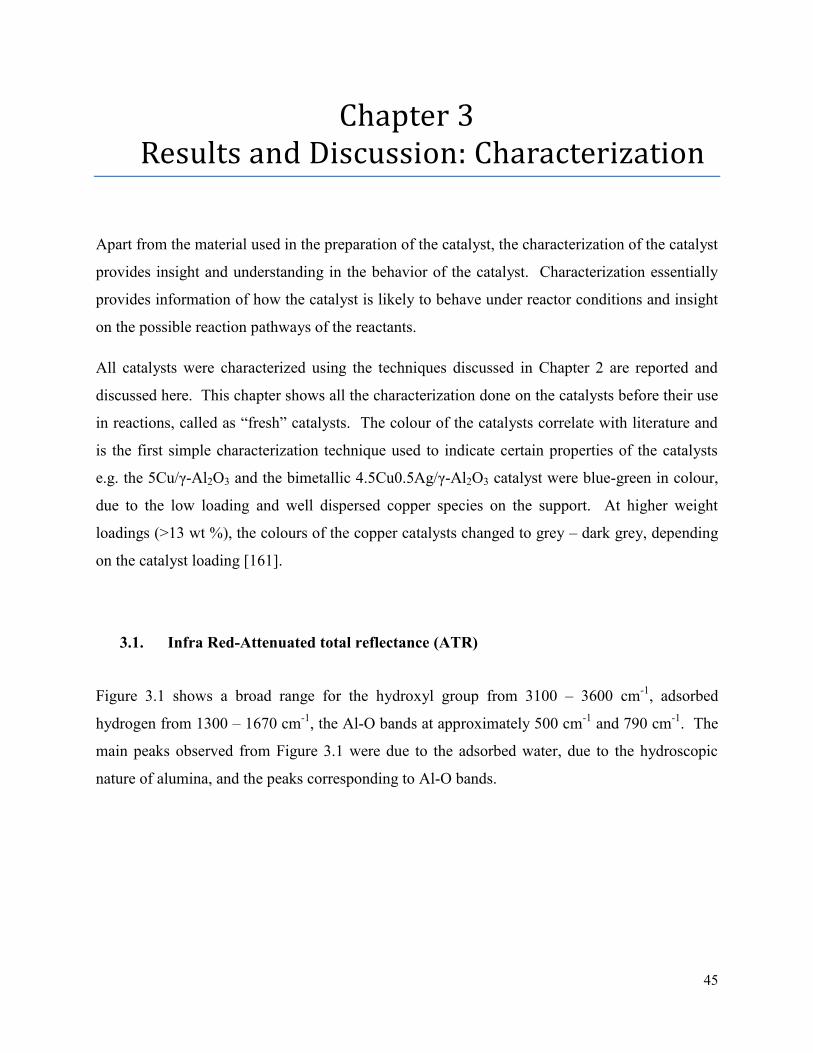
45
Chapter 3 3. Results and Discussion: Characterization
Apart from the material used in the preparation of the catalyst, the characterization of the catalyst
provides insight and understanding in the behavior of the catalyst. Characterization essentially
provides information of how the catalyst is likely to behave under reactor conditions and insight
on the possible reaction pathways of the reactants.
All catalysts were characterized using the techniques discussed in Chapter 2 are reported and
discussed here. This chapter shows all the characterization done on the catalysts before their use
in reactions, called as “fresh” catalysts. The colour of the catalysts correlate with literature and
is the first simple characterization technique used to indicate certain properties of the catalysts
e.g. the 5Cu/γ-Al2O3 and the bimetallic 4.5Cu0.5Ag/γ-Al2O3 catalyst were blue-green in colour,
due to the low loading and well dispersed copper species on the support. At higher weight
loadings (>13 wt %), the colours of the copper catalysts changed to grey – dark grey, depending
on the catalyst loading [161].
3.1. Infra Red-Attenuated total reflectance (ATR)
Figure 3.1 shows a broad range for the hydroxyl group from 3100 – 3600 cm-1, adsorbed
hydrogen from 1300 – 1670 cm-1, the Al-O bands at approximately 500 cm-1 and 790 cm-1. The
main peaks observed from Figure 3.1 were due to the adsorbed water, due to the hydroscopic
nature of alumina, and the peaks corresponding to Al-O bands.
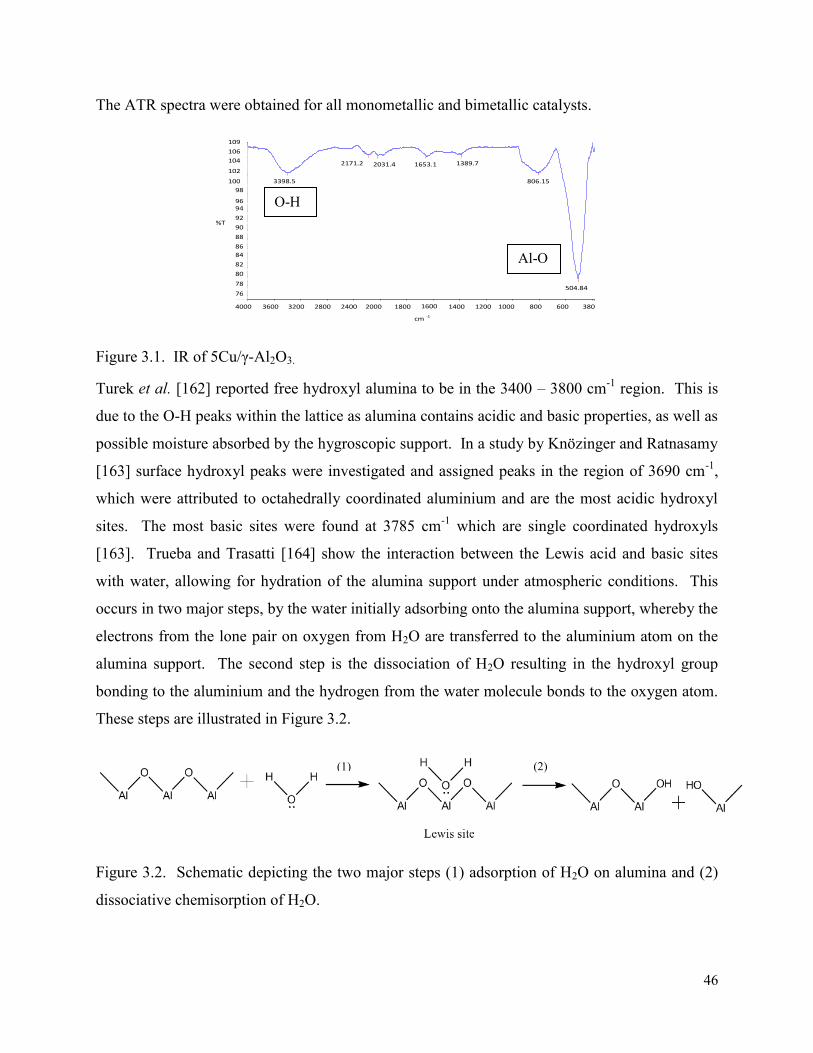
46
The ATR spectra were obtained for all monometallic and bimetallic catalysts.
Figure 3.1. IR of 5Cu/γ-Al2O3.
Turek et al. [162] reported free hydroxyl alumina to be in the 3400 – 3800 cm-1 region. This is
due to the O-H peaks within the lattice as alumina contains acidic and basic properties, as well as
possible moisture absorbed by the hygroscopic support. In a study by Knözinger and Ratnasamy
[163] surface hydroxyl peaks were investigated and assigned peaks in the region of 3690 cm-1,
which were attributed to octahedrally coordinated aluminium and are the most acidic hydroxyl
sites. The most basic sites were found at 3785 cm-1 which are single coordinated hydroxyls
[163]. Trueba and Trasatti [164] show the interaction between the Lewis acid and basic sites
with water, allowing for hydration of the alumina support under atmospheric conditions. This
occurs in two major steps, by the water initially adsorbing onto the alumina support, whereby the
electrons from the lone pair on oxygen from H2O are transferred to the aluminium atom on the
alumina support. The second step is the dissociation of H2O resulting in the hydroxyl group
bonding to the aluminium and the hydrogen from the water molecule bonds to the oxygen atom.
These steps are illustrated in Figure 3.2.
Figure 3.2. Schematic depicting the two major steps (1) adsorption of H2O on alumina and (2)
dissociative chemisorption of H2O.
4000.0 3600 3200 2800 2400 2000 1800 1600 1400 1200 1000 800 600 380.075.0
76
78
80
82
84
86
88
90
92
94
96
98
100
102
104
106
108109.0
cm-1
%T
3398.51
2171.202031.48
1653.18 1389.71
806.15
504.84
4000 1000 800 600 380 1800 1600 1400 1200 3600 3200 2800 2400 2000
109
106
104
102
100
76
82
80
78
90
88
86
84
94
92
98
96
%T
cm -1
3398.5
1
2171.2 2031.4
8 806.15
504.84
1389.7
.
1653.1
8
(1) (2)
Al-O
O-H
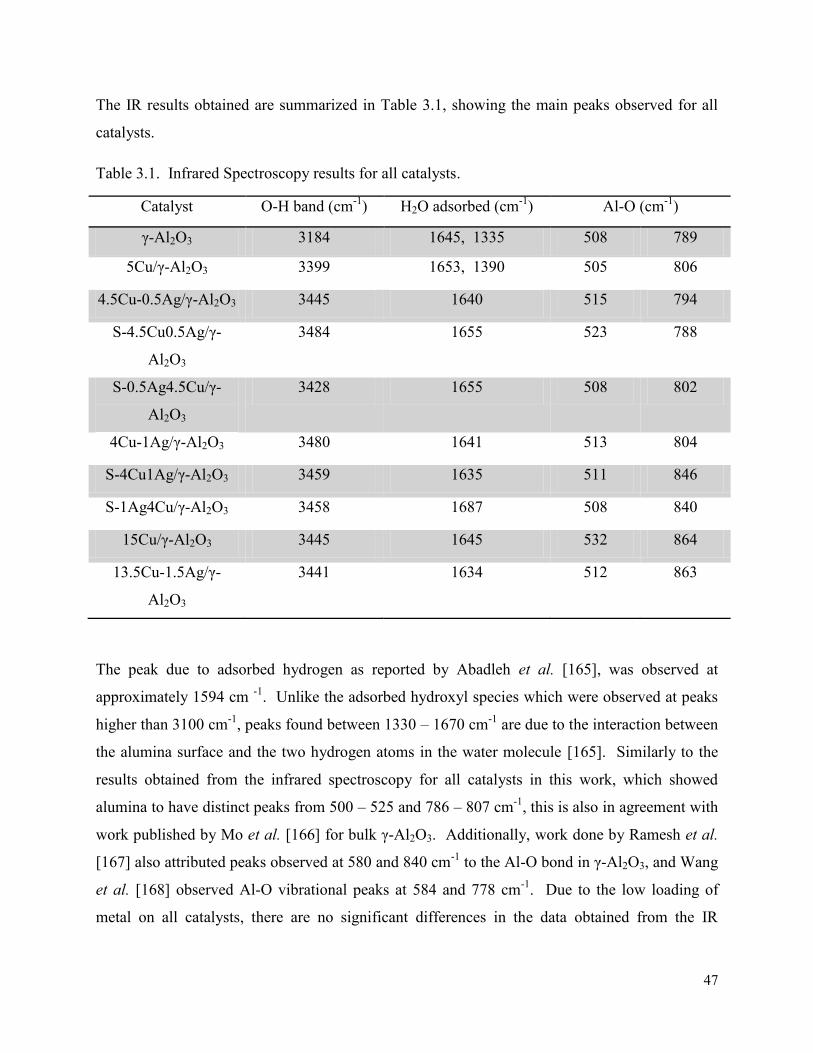
47
The IR results obtained are summarized in Table 3.1, showing the main peaks observed for all
catalysts.
Table 3.1. Infrared Spectroscopy results for all catalysts.
Catalyst O-H band (cm-1) H2O adsorbed (cm-1) Al-O (cm-1)
γ-Al2O3 3184 1645, 1335 508 789
5Cu/γ-Al2O3 3399 1653, 1390 505 806
4.5Cu-0.5Ag/γ-Al2O3 3445 1640 515 794
S-4.5Cu0.5Ag/γ-
Al2O3
3484 1655 523 788
S-0.5Ag4.5Cu/γ-
Al2O3
3428 1655 508 802
4Cu-1Ag/γ-Al2O3 3480 1641 513 804
S-4Cu1Ag/γ-Al2O3 3459 1635 511 846
S-1Ag4Cu/γ-Al2O3 3458 1687 508 840
15Cu/γ-Al2O3 3445 1645 532 864
13.5Cu-1.5Ag/γ-
Al2O3
3441 1634 512 863
The peak due to adsorbed hydrogen as reported by Abadleh et al. [165], was observed at
approximately 1594 cm -1. Unlike the adsorbed hydroxyl species which were observed at peaks
higher than 3100 cm-1, peaks found between 1330 – 1670 cm-1 are due to the interaction between
the alumina surface and the two hydrogen atoms in the water molecule [165]. Similarly to the
results obtained from the infrared spectroscopy for all catalysts in this work, which showed
alumina to have distinct peaks from 500 – 525 and 786 – 807 cm-1, this is also in agreement with
work published by Mo et al. [166] for bulk γ-Al2O3. Additionally, work done by Ramesh et al.
[167] also attributed peaks observed at 580 and 840 cm-1 to the Al-O bond in γ-Al2O3, and Wang
et al. [168] observed Al-O vibrational peaks at 584 and 778 cm-1. Due to the low loading of
metal on all catalysts, there are no significant differences in the data obtained from the IR
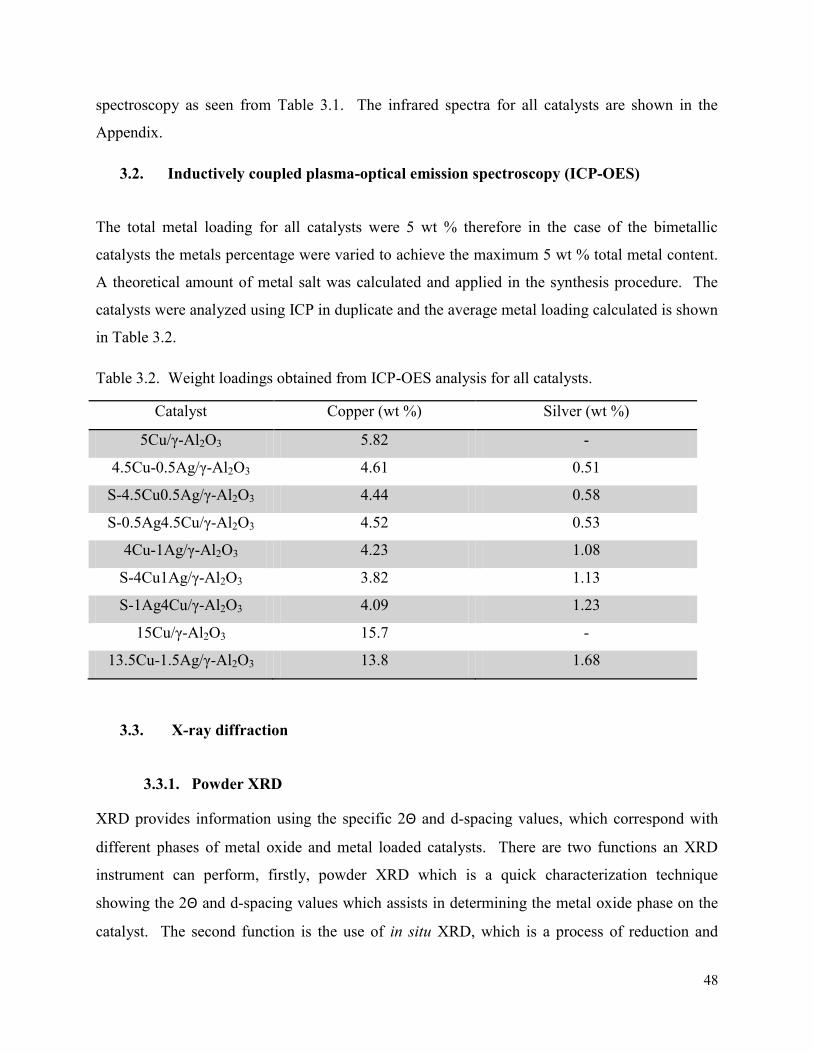
48
spectroscopy as seen from Table 3.1. The infrared spectra for all catalysts are shown in the
Appendix.
3.2. Inductively coupled plasma-optical emission spectroscopy (ICP-OES)
The total metal loading for all catalysts were 5 wt % therefore in the case of the bimetallic
catalysts the metals percentage were varied to achieve the maximum 5 wt % total metal content.
A theoretical amount of metal salt was calculated and applied in the synthesis procedure. The
catalysts were analyzed using ICP in duplicate and the average metal loading calculated is shown
in Table 3.2.
Table 3.2. Weight loadings obtained from ICP-OES analysis for all catalysts.
Catalyst Copper (wt %) Silver (wt %)
5Cu/γ-Al2O3 5.82 -
4.5Cu-0.5Ag/γ-Al2O3 4.61 0.51
S-4.5Cu0.5Ag/γ-Al2O3 4.44 0.58
S-0.5Ag4.5Cu/γ-Al2O3 4.52 0.53
4Cu-1Ag/γ-Al2O3 4.23 1.08
S-4Cu1Ag/γ-Al2O3 3.82 1.13
S-1Ag4Cu/γ-Al2O3 4.09 1.23
15Cu/γ-Al2O3 15.7 -
13.5Cu-1.5Ag/γ-Al2O3 13.8 1.68
3.3. X-ray diffraction
3.3.1. Powder XRD
XRD provides information using the specific 2Θ and d-spacing values, which correspond with
different phases of metal oxide and metal loaded catalysts. There are two functions an XRD
instrument can perform, firstly, powder XRD which is a quick characterization technique
showing the 2Θ and d-spacing values which assists in determining the metal oxide phase on the
catalyst. The second function is the use of in situ XRD, which is a process of reduction and
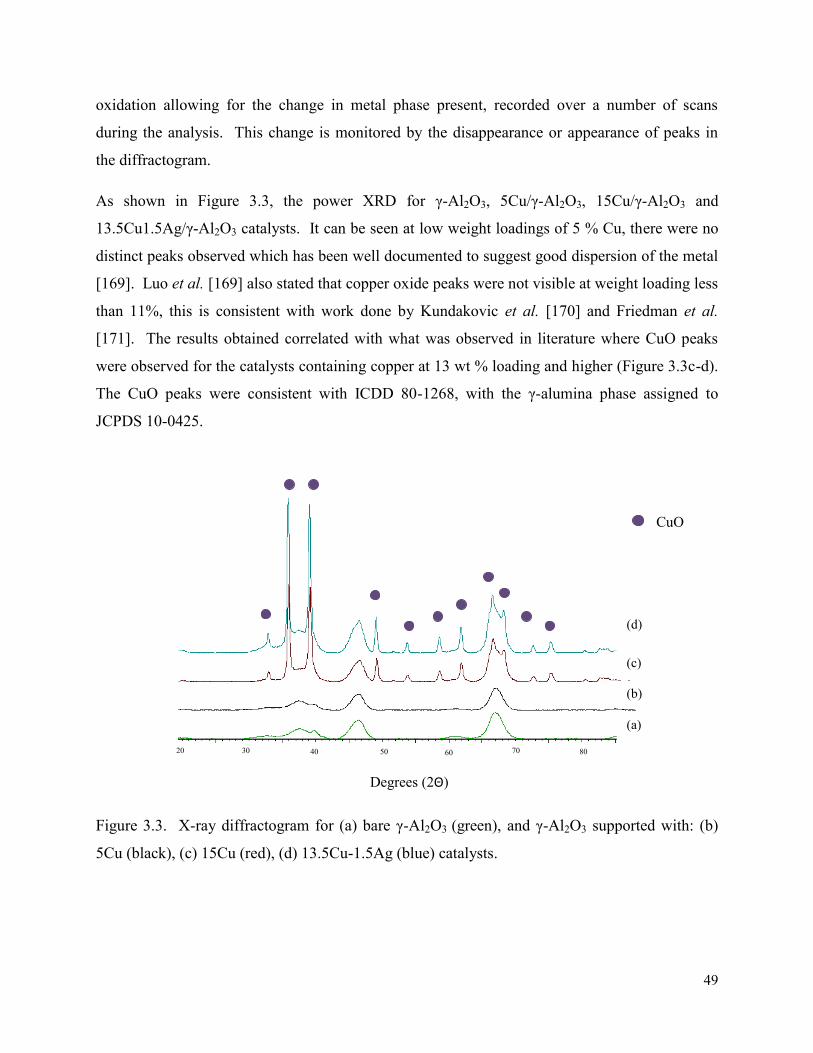
49
oxidation allowing for the change in metal phase present, recorded over a number of scans
during the analysis. This change is monitored by the disappearance or appearance of peaks in
the diffractogram.
As shown in Figure 3.3, the power XRD for γ-Al2O3, 5Cu/γ-Al2O3, 15Cu/γ-Al2O3 and
13.5Cu1.5Ag/γ-Al2O3 catalysts. It can be seen at low weight loadings of 5 % Cu, there were no
distinct peaks observed which has been well documented to suggest good dispersion of the metal
[169]. Luo et al. [169] also stated that copper oxide peaks were not visible at weight loading less
than 11%, this is consistent with work done by Kundakovic et al. [170] and Friedman et al.
[171]. The results obtained correlated with what was observed in literature where CuO peaks
were observed for the catalysts containing copper at 13 wt % loading and higher (Figure 3.3c-d).
The CuO peaks were consistent with ICDD 80-1268, with the γ-alumina phase assigned to
JCPDS 10-0425.
Figure 3.3. X-ray diffractogram for (a) bare γ-Al2O3 (green), and γ-Al2O3 supported with: (b)
5Cu (black), (c) 15Cu (red), (d) 13.5Cu-1.5Ag (blue) catalysts.
Degrees (2Θ)
CuO
(b)
(a)
(d)
(c)
20 30 70 80 50 40 60
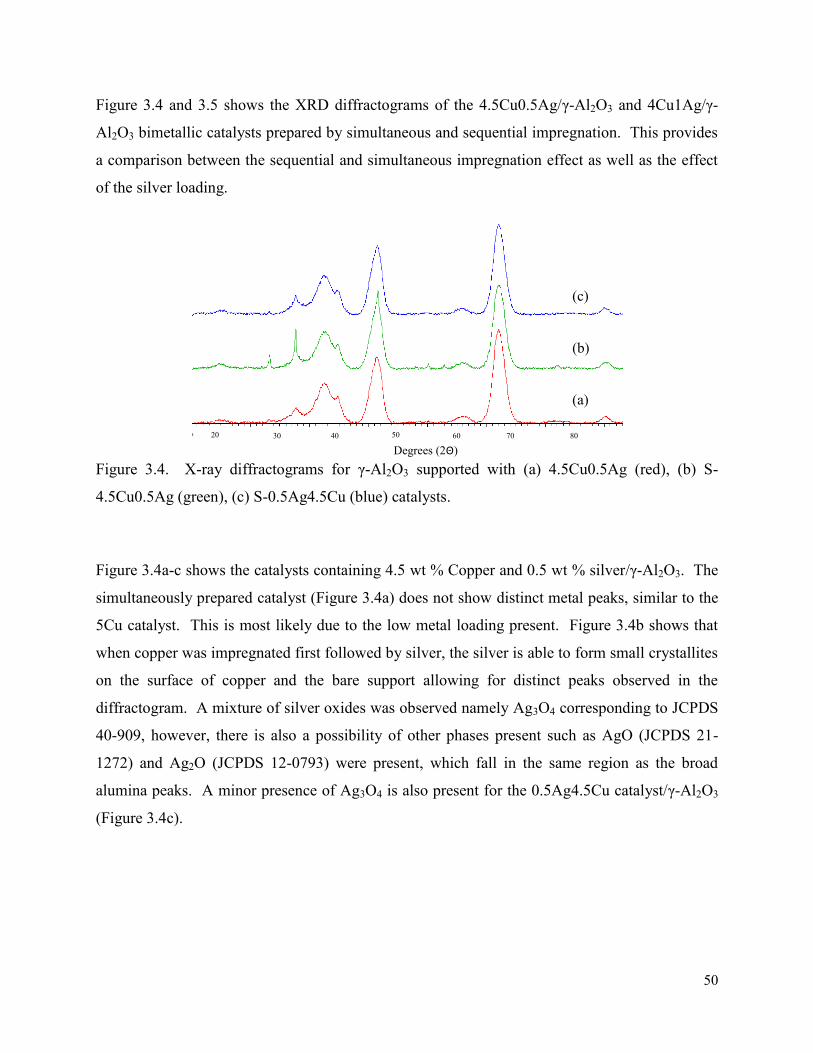
50
Figure 3.4 and 3.5 shows the XRD diffractograms of the 4.5Cu0.5Ag/γ-Al2O3 and 4Cu1Ag/γ-
Al2O3 bimetallic catalysts prepared by simultaneous and sequential impregnation. This provides
a comparison between the sequential and simultaneous impregnation effect as well as the effect
of the silver loading.
Figure 3.4. X-ray diffractograms for γ-Al2O3 supported with (a) 4.5Cu0.5Ag (red), (b) S-
4.5Cu0.5Ag (green), (c) S-0.5Ag4.5Cu (blue) catalysts.
Figure 3.4a-c shows the catalysts containing 4.5 wt % Copper and 0.5 wt % silver/γ-Al2O3. The
simultaneously prepared catalyst (Figure 3.4a) does not show distinct metal peaks, similar to the
5Cu catalyst. This is most likely due to the low metal loading present. Figure 3.4b shows that
when copper was impregnated first followed by silver, the silver is able to form small crystallites
on the surface of copper and the bare support allowing for distinct peaks observed in the
diffractogram. A mixture of silver oxides was observed namely Ag3O4 corresponding to JCPDS
40-909, however, there is also a possibility of other phases present such as AgO (JCPDS 21-
1272) and Ag2O (JCPDS 12-0793) were present, which fall in the same region as the broad
alumina peaks. A minor presence of Ag3O4 is also present for the 0.5Ag4.5Cu catalyst/γ-Al2O3
(Figure 3.4c).
(a)
(b)
(c)
Degrees (2Θ) 20 30 40 50 60 70 80
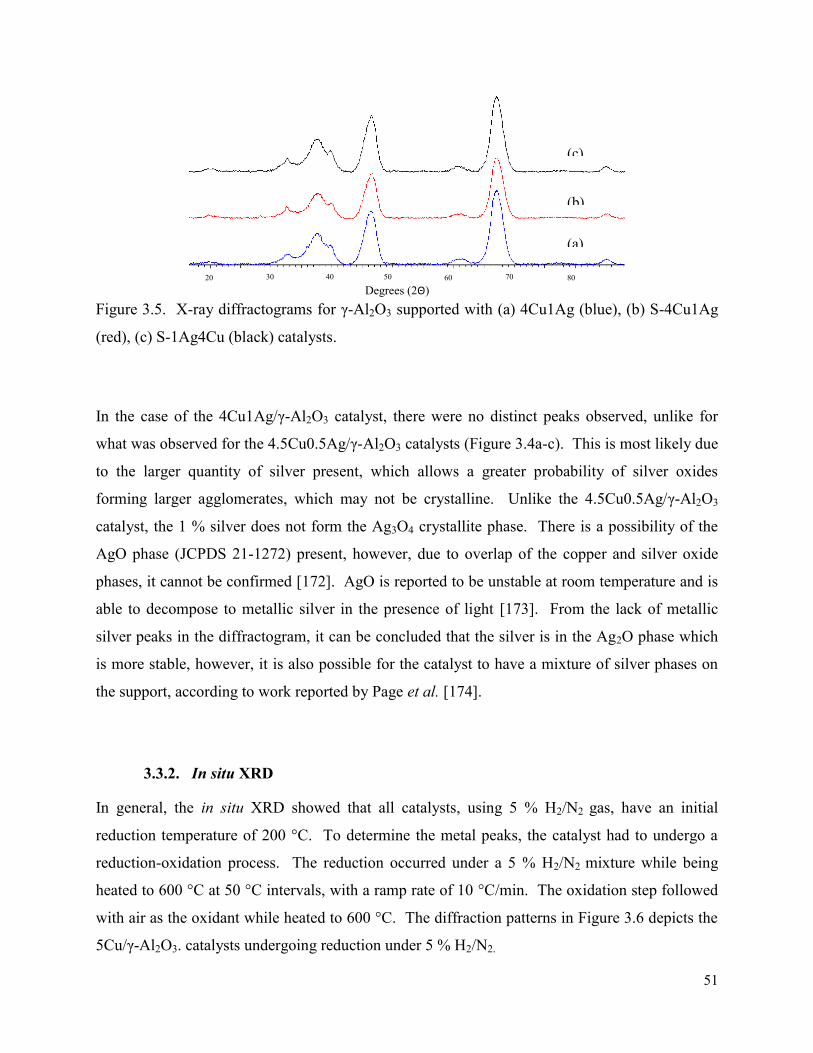
51
Figure 3.5. X-ray diffractograms for γ-Al2O3 supported with (a) 4Cu1Ag (blue), (b) S-4Cu1Ag
(red), (c) S-1Ag4Cu (black) catalysts.
In the case of the 4Cu1Ag/γ-Al2O3 catalyst, there were no distinct peaks observed, unlike for
what was observed for the 4.5Cu0.5Ag/γ-Al2O3 catalysts (Figure 3.4a-c). This is most likely due
to the larger quantity of silver present, which allows a greater probability of silver oxides
forming larger agglomerates, which may not be crystalline. Unlike the 4.5Cu0.5Ag/γ-Al2O3
catalyst, the 1 % silver does not form the Ag3O4 crystallite phase. There is a possibility of the
AgO phase (JCPDS 21-1272) present, however, due to overlap of the copper and silver oxide
phases, it cannot be confirmed [172]. AgO is reported to be unstable at room temperature and is
able to decompose to metallic silver in the presence of light [173]. From the lack of metallic
silver peaks in the diffractogram, it can be concluded that the silver is in the Ag2O phase which
is more stable, however, it is also possible for the catalyst to have a mixture of silver phases on
the support, according to work reported by Page et al. [174].
3.3.2. In situ XRD
In general, the in situ XRD showed that all catalysts, using 5 % H2/N2 gas, have an initial
reduction temperature of 200 °C. To determine the metal peaks, the catalyst had to undergo a
reduction-oxidation process. The reduction occurred under a 5 % H2/N2 mixture while being
heated to 600 °C at 50 °C intervals, with a ramp rate of 10 °C/min. The oxidation step followed
with air as the oxidant while heated to 600 °C. The diffraction patterns in Figure 3.6 depicts the
5Cu/γ-Al2O3. catalysts undergoing reduction under 5 % H2/N2.
(a)
(b)
(c)
20 30 40 50 60 70 80
Degrees (2Θ)
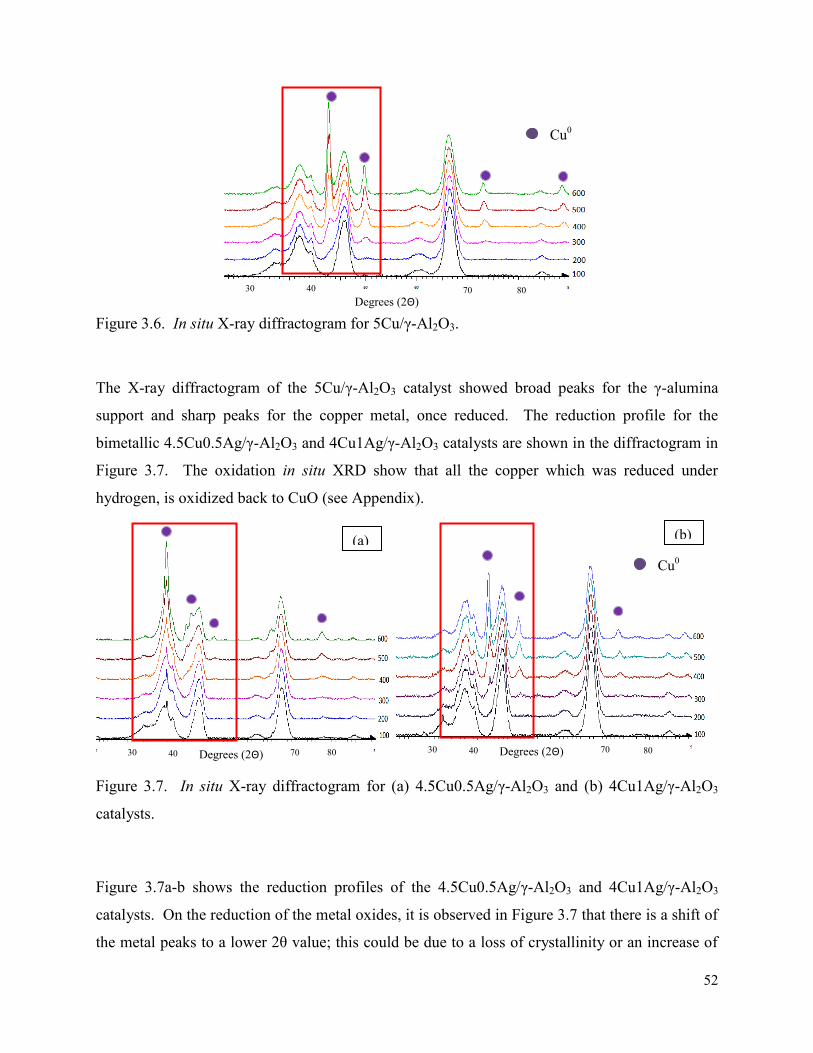
52
Figure 3.6. In situ X-ray diffractogram for 5Cu/γ-Al2O3.
The X-ray diffractogram of the 5Cu/γ-Al2O3 catalyst showed broad peaks for the γ-alumina
support and sharp peaks for the copper metal, once reduced. The reduction profile for the
bimetallic 4.5Cu0.5Ag/γ-Al2O3 and 4Cu1Ag/γ-Al2O3 catalysts are shown in the diffractogram in
Figure 3.7. The oxidation in situ XRD show that all the copper which was reduced under
hydrogen, is oxidized back to CuO (see Appendix).
Figure 3.7. In situ X-ray diffractogram for (a) 4.5Cu0.5Ag/γ-Al2O3 and (b) 4Cu1Ag/γ-Al2O3
catalysts.
Figure 3.7a-b shows the reduction profiles of the 4.5Cu0.5Ag/γ-Al2O3 and 4Cu1Ag/γ-Al2O3
catalysts. On the reduction of the metal oxides, it is observed in Figure 3.7 that there is a shift of
the metal peaks to a lower 2θ value; this could be due to a loss of crystallinity or an increase of
Degrees (2Θ) 40 70 80 30
40 70 30 80 40 300
70 80 Degrees (2Θ) Degrees (2Θ)
(a) (b)
Cu0
Cu0
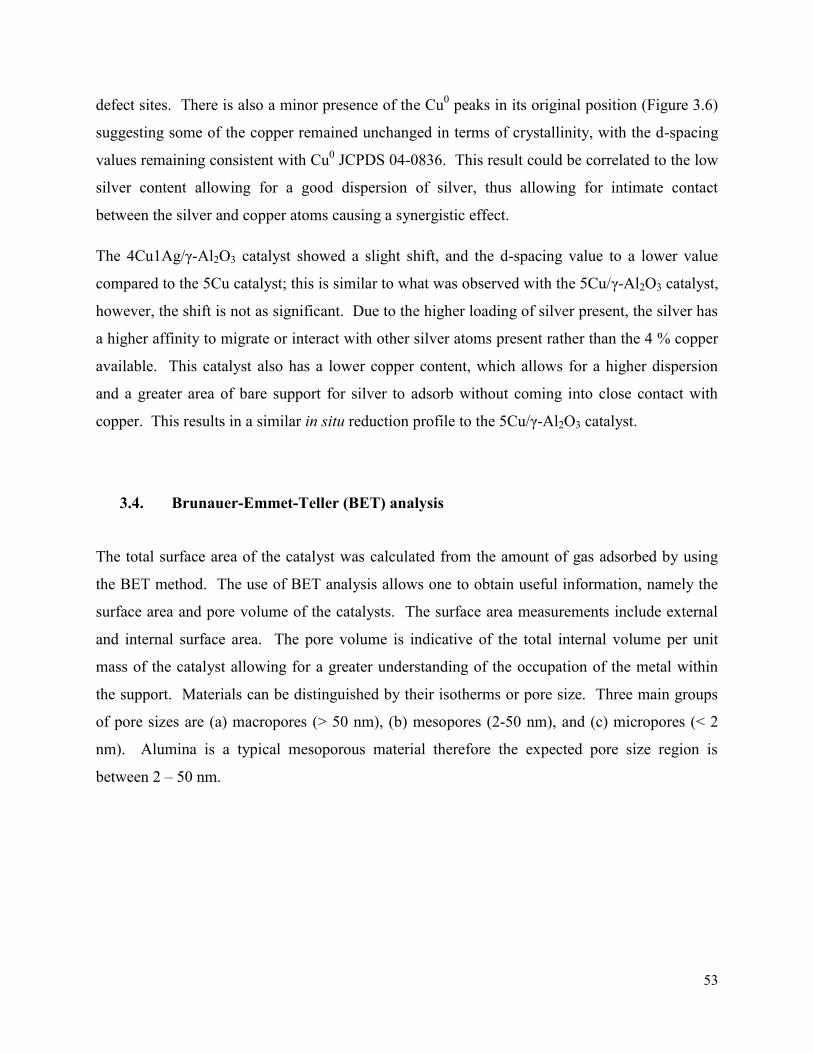
53
defect sites. There is also a minor presence of the Cu0 peaks in its original position (Figure 3.6)
suggesting some of the copper remained unchanged in terms of crystallinity, with the d-spacing
values remaining consistent with Cu0 JCPDS 04-0836. This result could be correlated to the low
silver content allowing for a good dispersion of silver, thus allowing for intimate contact
between the silver and copper atoms causing a synergistic effect.
The 4Cu1Ag/γ-Al2O3 catalyst showed a slight shift, and the d-spacing value to a lower value
compared to the 5Cu catalyst; this is similar to what was observed with the 5Cu/γ-Al2O3 catalyst,
however, the shift is not as significant. Due to the higher loading of silver present, the silver has
a higher affinity to migrate or interact with other silver atoms present rather than the 4 % copper
available. This catalyst also has a lower copper content, which allows for a higher dispersion
and a greater area of bare support for silver to adsorb without coming into close contact with
copper. This results in a similar in situ reduction profile to the 5Cu/γ-Al2O3 catalyst.
3.4. Brunauer-Emmet-Teller (BET) analysis
The total surface area of the catalyst was calculated from the amount of gas adsorbed by using
the BET method. The use of BET analysis allows one to obtain useful information, namely the
surface area and pore volume of the catalysts. The surface area measurements include external
and internal surface area. The pore volume is indicative of the total internal volume per unit
mass of the catalyst allowing for a greater understanding of the occupation of the metal within
the support. Materials can be distinguished by their isotherms or pore size. Three main groups
of pore sizes are (a) macropores (> 50 nm), (b) mesopores (2-50 nm), and (c) micropores (< 2
nm). Alumina is a typical mesoporous material therefore the expected pore size region is
between 2 – 50 nm.
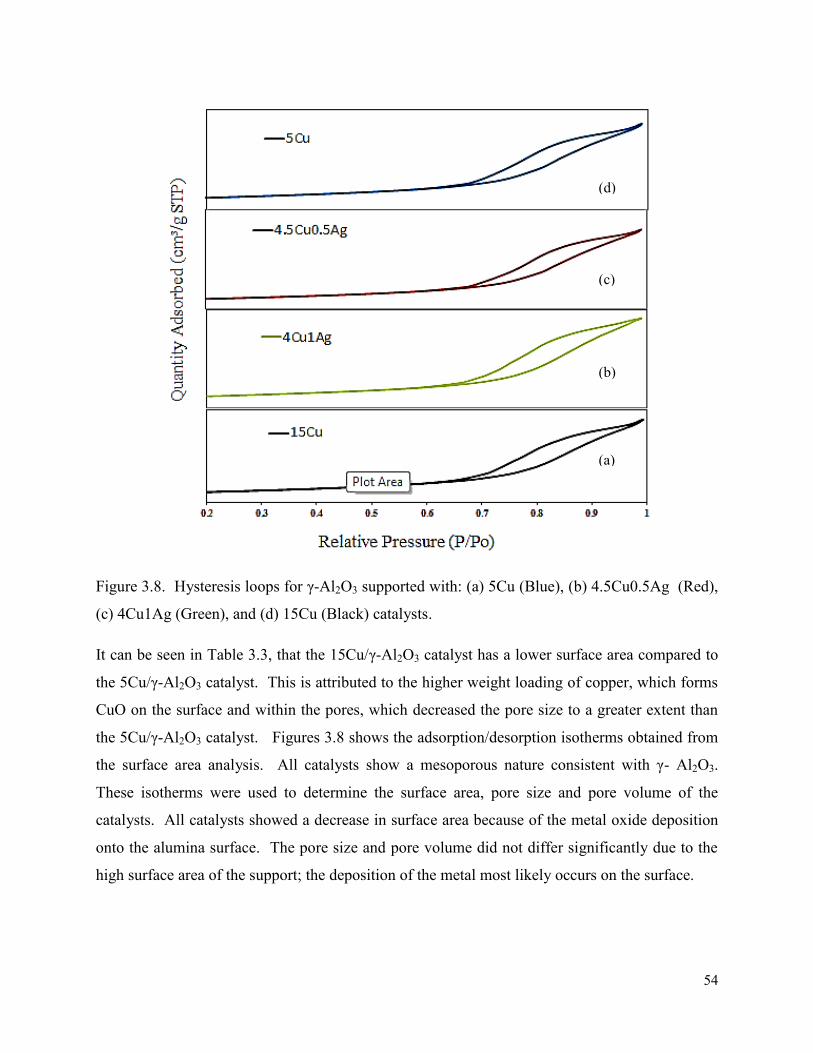
54
Figure 3.8. Hysteresis loops for γ-Al2O3 supported with: (a) 5Cu (Blue), (b) 4.5Cu0.5Ag (Red),
(c) 4Cu1Ag (Green), and (d) 15Cu (Black) catalysts.
It can be seen in Table 3.3, that the 15Cu/γ-Al2O3 catalyst has a lower surface area compared to
the 5Cu/γ-Al2O3 catalyst. This is attributed to the higher weight loading of copper, which forms
CuO on the surface and within the pores, which decreased the pore size to a greater extent than
the 5Cu/γ-Al2O3 catalyst. Figures 3.8 shows the adsorption/desorption isotherms obtained from
the surface area analysis. All catalysts show a mesoporous nature consistent with γ- Al2O3.
These isotherms were used to determine the surface area, pore size and pore volume of the
catalysts. All catalysts showed a decrease in surface area because of the metal oxide deposition
onto the alumina surface. The pore size and pore volume did not differ significantly due to the
high surface area of the support; the deposition of the metal most likely occurs on the surface.
(a)
(b)
(c)
(d)
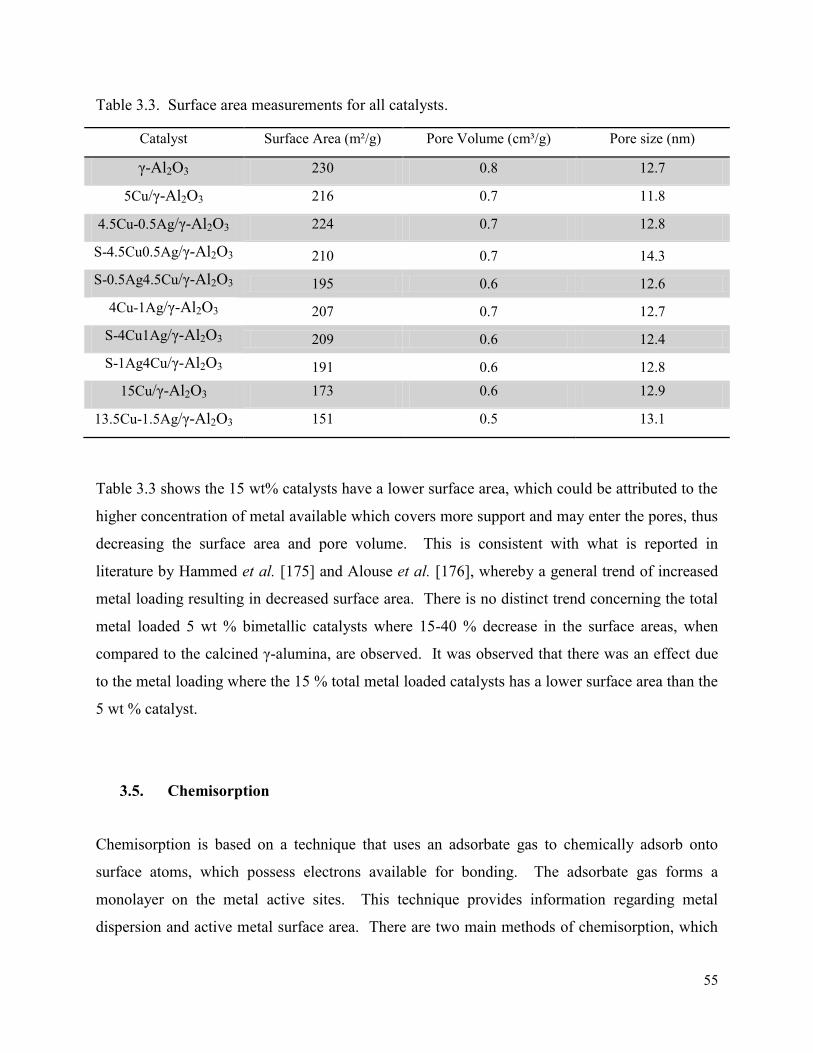
55
Table 3.3. Surface area measurements for all catalysts. Catalyst Surface Area (m²/g) Pore Volume (cm³/g) Pore size (nm)
γ-Al2O3 230 0.8 12.7
5Cu/γ-Al2O3 216 0.7 11.8
4.5Cu-0.5Ag/γ-Al2O3 224 0.7 12.8
S-4.5Cu0.5Ag/γ-Al2O3 210 0.7 14.3 S-0.5Ag4.5Cu/γ-Al2O3 195 0.6 12.6
4Cu-1Ag/γ-Al2O3 207 0.7 12.7 S-4Cu1Ag/γ-Al2O3 209 0.6 12.4 S-1Ag4Cu/γ-Al2O3 191 0.6 12.8
15Cu/γ-Al2O3 173 0.6 12.9
13.5Cu-1.5Ag/γ-Al2O3 151 0.5 13.1
Table 3.3 shows the 15 wt% catalysts have a lower surface area, which could be attributed to the
higher concentration of metal available which covers more support and may enter the pores, thus
decreasing the surface area and pore volume. This is consistent with what is reported in
literature by Hammed et al. [175] and Alouse et al. [176], whereby a general trend of increased
metal loading resulting in decreased surface area. There is no distinct trend concerning the total
metal loaded 5 wt % bimetallic catalysts where 15-40 % decrease in the surface areas, when
compared to the calcined γ-alumina, are observed. It was observed that there was an effect due
to the metal loading where the 15 % total metal loaded catalysts has a lower surface area than the
5 wt % catalyst.
3.5. Chemisorption
Chemisorption is based on a technique that uses an adsorbate gas to chemically adsorb onto
surface atoms, which possess electrons available for bonding. The adsorbate gas forms a
monolayer on the metal active sites. This technique provides information regarding metal
dispersion and active metal surface area. There are two main methods of chemisorption, which
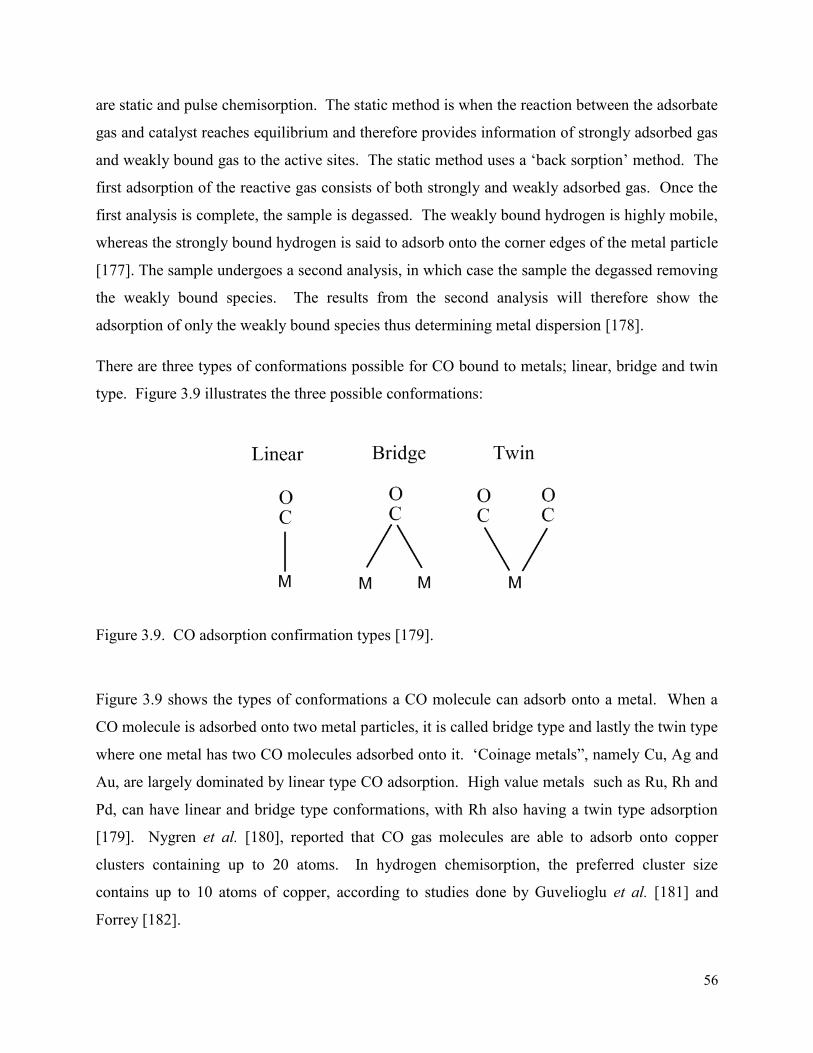
56
are static and pulse chemisorption. The static method is when the reaction between the adsorbate
gas and catalyst reaches equilibrium and therefore provides information of strongly adsorbed gas
and weakly bound gas to the active sites. The static method uses a ‘back sorption’ method. The
first adsorption of the reactive gas consists of both strongly and weakly adsorbed gas. Once the
first analysis is complete, the sample is degassed. The weakly bound hydrogen is highly mobile,
whereas the strongly bound hydrogen is said to adsorb onto the corner edges of the metal particle
[177]. The sample undergoes a second analysis, in which case the sample the degassed removing
the weakly bound species. The results from the second analysis will therefore show the
adsorption of only the weakly bound species thus determining metal dispersion [178].
There are three types of conformations possible for CO bound to metals; linear, bridge and twin
type. Figure 3.9 illustrates the three possible conformations:
Figure 3.9. CO adsorption confirmation types [179].
Figure 3.9 shows the types of conformations a CO molecule can adsorb onto a metal. When a
CO molecule is adsorbed onto two metal particles, it is called bridge type and lastly the twin type
where one metal has two CO molecules adsorbed onto it. ‘Coinage metals”, namely Cu, Ag and
Au, are largely dominated by linear type CO adsorption. High value metals such as Ru, Rh and
Pd, can have linear and bridge type conformations, with Rh also having a twin type adsorption
[179]. Nygren et al. [180], reported that CO gas molecules are able to adsorb onto copper
clusters containing up to 20 atoms. In hydrogen chemisorption, the preferred cluster size
contains up to 10 atoms of copper, according to studies done by Guvelioglu et al. [181] and
Forrey [182].
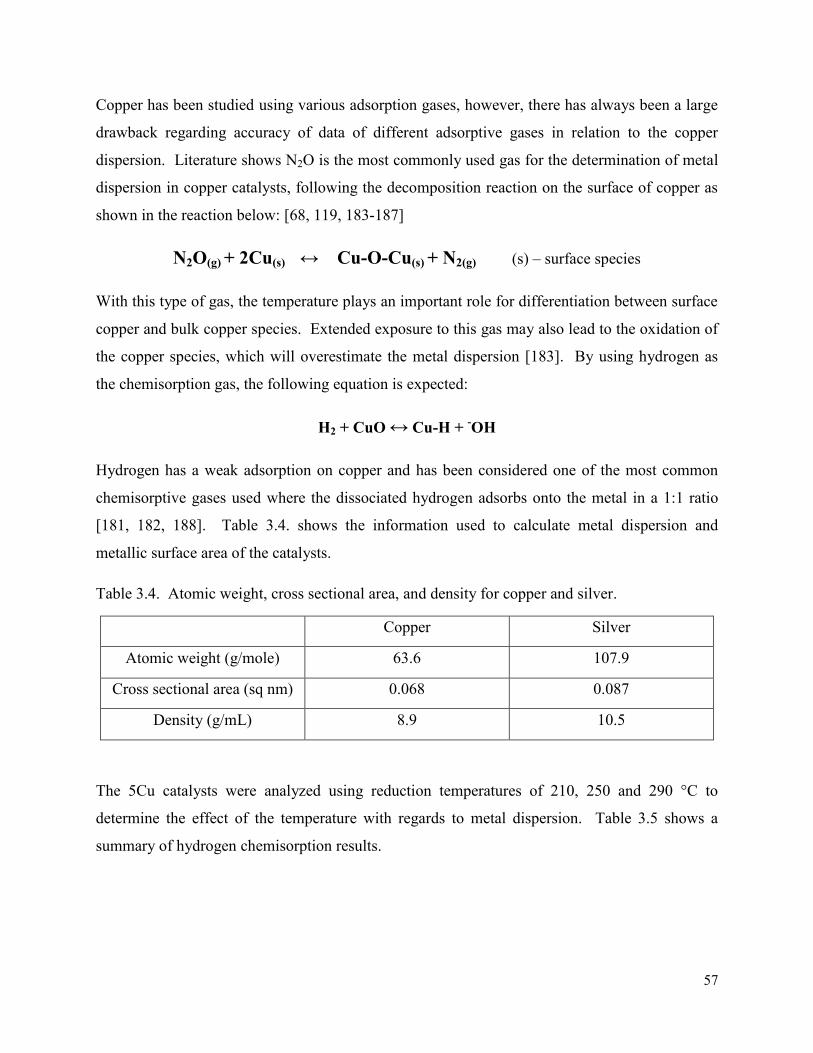
57
Copper has been studied using various adsorption gases, however, there has always been a large
drawback regarding accuracy of data of different adsorptive gases in relation to the copper
dispersion. Literature shows N2O is the most commonly used gas for the determination of metal
dispersion in copper catalysts, following the decomposition reaction on the surface of copper as
shown in the reaction below: [68, 119, 183-187]
N2O(g) + 2Cu(s) ↔ Cu-O-Cu(s) + N2(g) (s) – surface species
With this type of gas, the temperature plays an important role for differentiation between surface
copper and bulk copper species. Extended exposure to this gas may also lead to the oxidation of
the copper species, which will overestimate the metal dispersion [183]. By using hydrogen as
the chemisorption gas, the following equation is expected:
H2 + CuO ↔ Cu-H + -OH
Hydrogen has a weak adsorption on copper and has been considered one of the most common
chemisorptive gases used where the dissociated hydrogen adsorbs onto the metal in a 1:1 ratio
[181, 182, 188]. Table 3.4. shows the information used to calculate metal dispersion and
metallic surface area of the catalysts.
Table 3.4. Atomic weight, cross sectional area, and density for copper and silver.
Copper Silver
Atomic weight (g/mole) 63.6 107.9
Cross sectional area (sq nm) 0.068 0.087
Density (g/mL) 8.9 10.5
The 5Cu catalysts were analyzed using reduction temperatures of 210, 250 and 290 °C to
determine the effect of the temperature with regards to metal dispersion. Table 3.5 shows a
summary of hydrogen chemisorption results.
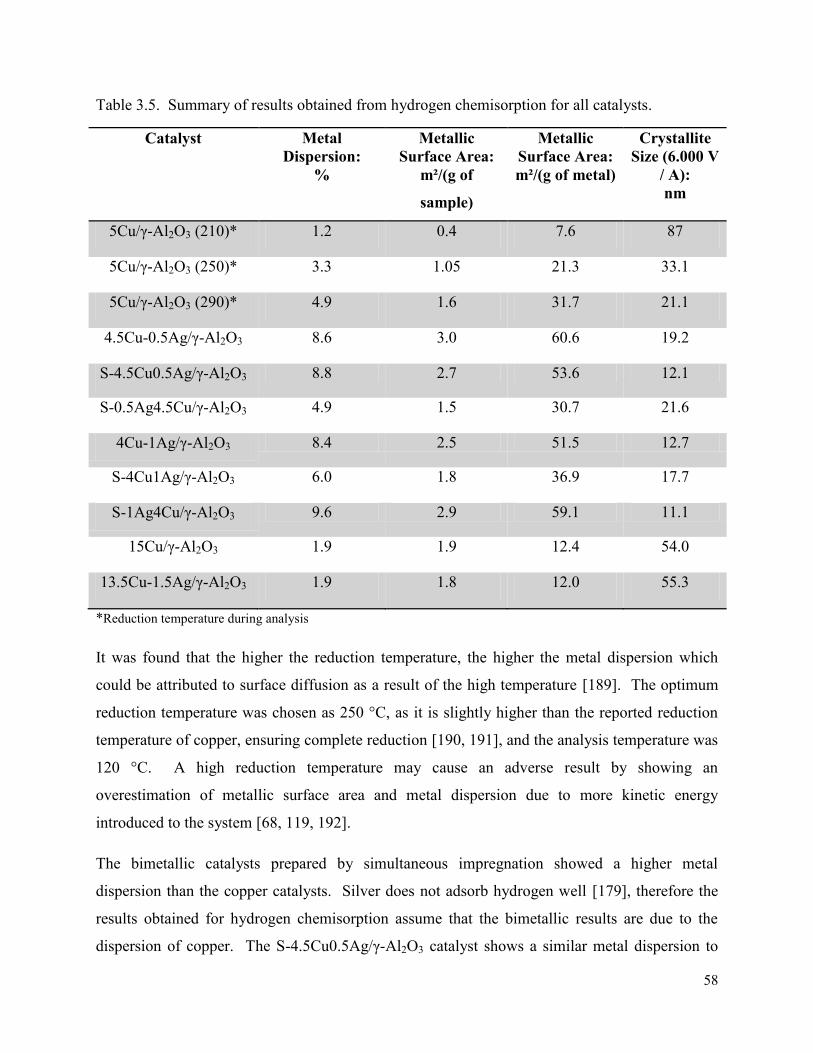
58
Table 3.5. Summary of results obtained from hydrogen chemisorption for all catalysts.
Catalyst Metal Dispersion:
%
Metallic Surface Area:
m²/(g of
sample)
Metallic Surface Area: m²/(g of metal)
Crystallite Size (6.000 V
/ A): nm
5Cu/γ-Al2O3 (210)* 1.2 0.4 7.6 87
5Cu/γ-Al2O3 (250)* 3.3 1.05 21.3 33.1
5Cu/γ-Al2O3 (290)* 4.9 1.6 31.7 21.1
4.5Cu-0.5Ag/γ-Al2O3 8.6 3.0 60.6 19.2
S-4.5Cu0.5Ag/γ-Al2O3 8.8 2.7 53.6 12.1
S-0.5Ag4.5Cu/γ-Al2O3 4.9 1.5 30.7 21.6
4Cu-1Ag/γ-Al2O3 8.4 2.5 51.5 12.7
S-4Cu1Ag/γ-Al2O3 6.0 1.8 36.9 17.7
S-1Ag4Cu/γ-Al2O3 9.6 2.9 59.1 11.1
15Cu/γ-Al2O3 1.9 1.9 12.4 54.0
13.5Cu-1.5Ag/γ-Al2O3 1.9 1.8 12.0 55.3
*Reduction temperature during analysis
It was found that the higher the reduction temperature, the higher the metal dispersion which
could be attributed to surface diffusion as a result of the high temperature [189]. The optimum
reduction temperature was chosen as 250 °C, as it is slightly higher than the reported reduction
temperature of copper, ensuring complete reduction [190, 191], and the analysis temperature was
120 °C. A high reduction temperature may cause an adverse result by showing an
overestimation of metallic surface area and metal dispersion due to more kinetic energy
introduced to the system [68, 119, 192].
The bimetallic catalysts prepared by simultaneous impregnation showed a higher metal
dispersion than the copper catalysts. Silver does not adsorb hydrogen well [179], therefore the
results obtained for hydrogen chemisorption assume that the bimetallic results are due to the
dispersion of copper. The S-4.5Cu0.5Ag/γ-Al2O3 catalyst shows a similar metal dispersion to
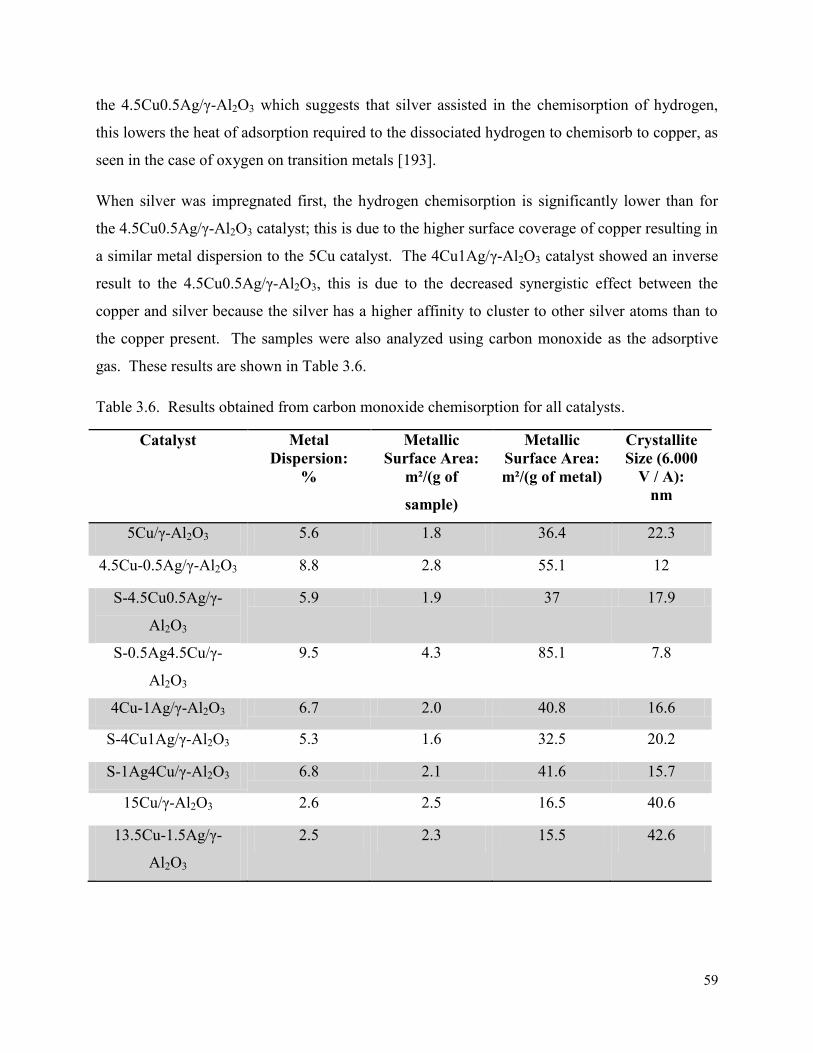
59
the 4.5Cu0.5Ag/γ-Al2O3 which suggests that silver assisted in the chemisorption of hydrogen,
this lowers the heat of adsorption required to the dissociated hydrogen to chemisorb to copper, as
seen in the case of oxygen on transition metals [193].
When silver was impregnated first, the hydrogen chemisorption is significantly lower than for
the 4.5Cu0.5Ag/γ-Al2O3 catalyst; this is due to the higher surface coverage of copper resulting in
a similar metal dispersion to the 5Cu catalyst. The 4Cu1Ag/γ-Al2O3 catalyst showed an inverse
result to the 4.5Cu0.5Ag/γ-Al2O3, this is due to the decreased synergistic effect between the
copper and silver because the silver has a higher affinity to cluster to other silver atoms than to
the copper present. The samples were also analyzed using carbon monoxide as the adsorptive
gas. These results are shown in Table 3.6.
Table 3.6. Results obtained from carbon monoxide chemisorption for all catalysts.
Catalyst Metal Dispersion:
%
Metallic Surface Area:
m²/(g of
sample)
Metallic Surface Area: m²/(g of metal)
Crystallite Size (6.000
V / A): nm
5Cu/γ-Al2O3 5.6 1.8 36.4 22.3
4.5Cu-0.5Ag/γ-Al2O3 8.8 2.8 55.1 12
S-4.5Cu0.5Ag/γ-
Al2O3
5.9 1.9 37 17.9
S-0.5Ag4.5Cu/γ-
Al2O3
9.5 4.3 85.1 7.8
4Cu-1Ag/γ-Al2O3 6.7 2.0 40.8 16.6
S-4Cu1Ag/γ-Al2O3 5.3 1.6 32.5 20.2
S-1Ag4Cu/γ-Al2O3 6.8 2.1 41.6 15.7
15Cu/γ-Al2O3 2.6 2.5 16.5 40.6
13.5Cu-1.5Ag/γ-
Al2O3
2.5 2.3 15.5 42.6
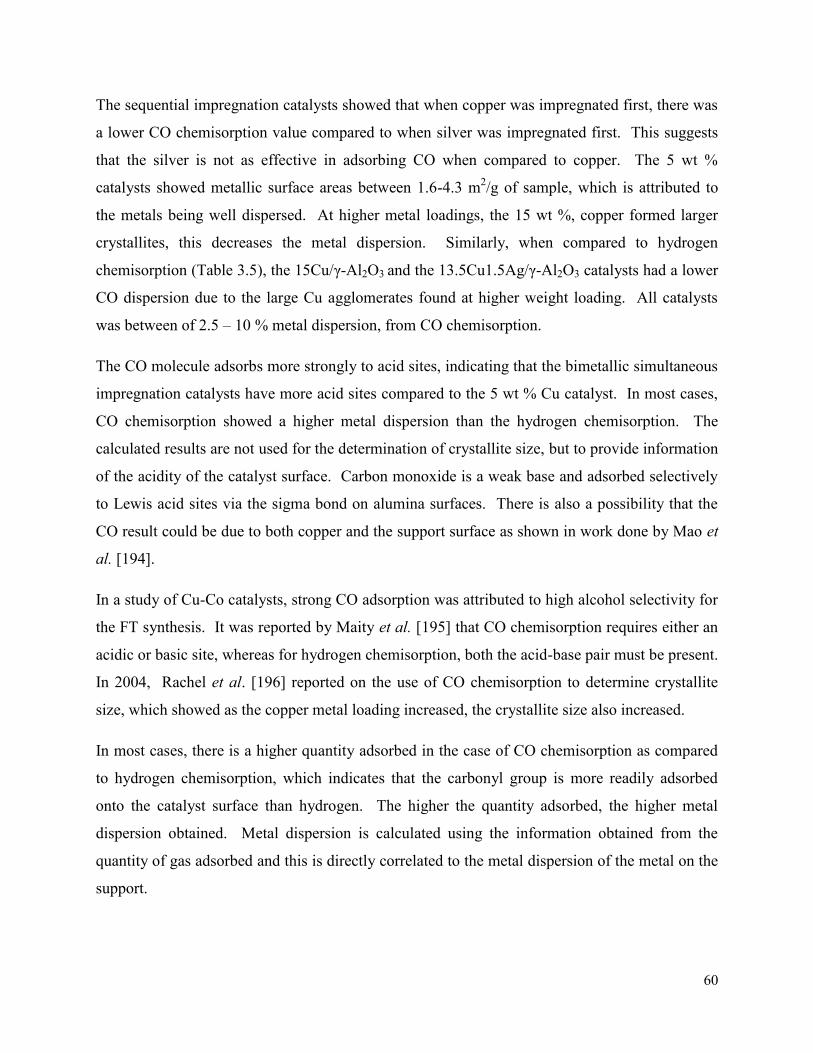
60
The sequential impregnation catalysts showed that when copper was impregnated first, there was
a lower CO chemisorption value compared to when silver was impregnated first. This suggests
that the silver is not as effective in adsorbing CO when compared to copper. The 5 wt %
catalysts showed metallic surface areas between 1.6-4.3 m2/g of sample, which is attributed to
the metals being well dispersed. At higher metal loadings, the 15 wt %, copper formed larger
crystallites, this decreases the metal dispersion. Similarly, when compared to hydrogen
chemisorption (Table 3.5), the 15Cu/γ-Al2O3 and the 13.5Cu1.5Ag/γ-Al2O3 catalysts had a lower
CO dispersion due to the large Cu agglomerates found at higher weight loading. All catalysts
was between of 2.5 – 10 % metal dispersion, from CO chemisorption.
The CO molecule adsorbs more strongly to acid sites, indicating that the bimetallic simultaneous
impregnation catalysts have more acid sites compared to the 5 wt % Cu catalyst. In most cases,
CO chemisorption showed a higher metal dispersion than the hydrogen chemisorption. The
calculated results are not used for the determination of crystallite size, but to provide information
of the acidity of the catalyst surface. Carbon monoxide is a weak base and adsorbed selectively
to Lewis acid sites via the sigma bond on alumina surfaces. There is also a possibility that the
CO result could be due to both copper and the support surface as shown in work done by Mao et
al. [194].
In a study of Cu-Co catalysts, strong CO adsorption was attributed to high alcohol selectivity for
the FT synthesis. It was reported by Maity et al. [195] that CO chemisorption requires either an
acidic or basic site, whereas for hydrogen chemisorption, both the acid-base pair must be present.
In 2004, Rachel et al. [196] reported on the use of CO chemisorption to determine crystallite
size, which showed as the copper metal loading increased, the crystallite size also increased.
In most cases, there is a higher quantity adsorbed in the case of CO chemisorption as compared
to hydrogen chemisorption, which indicates that the carbonyl group is more readily adsorbed
onto the catalyst surface than hydrogen. The higher the quantity adsorbed, the higher metal
dispersion obtained. Metal dispersion is calculated using the information obtained from the
quantity of gas adsorbed and this is directly correlated to the metal dispersion of the metal on the
support.
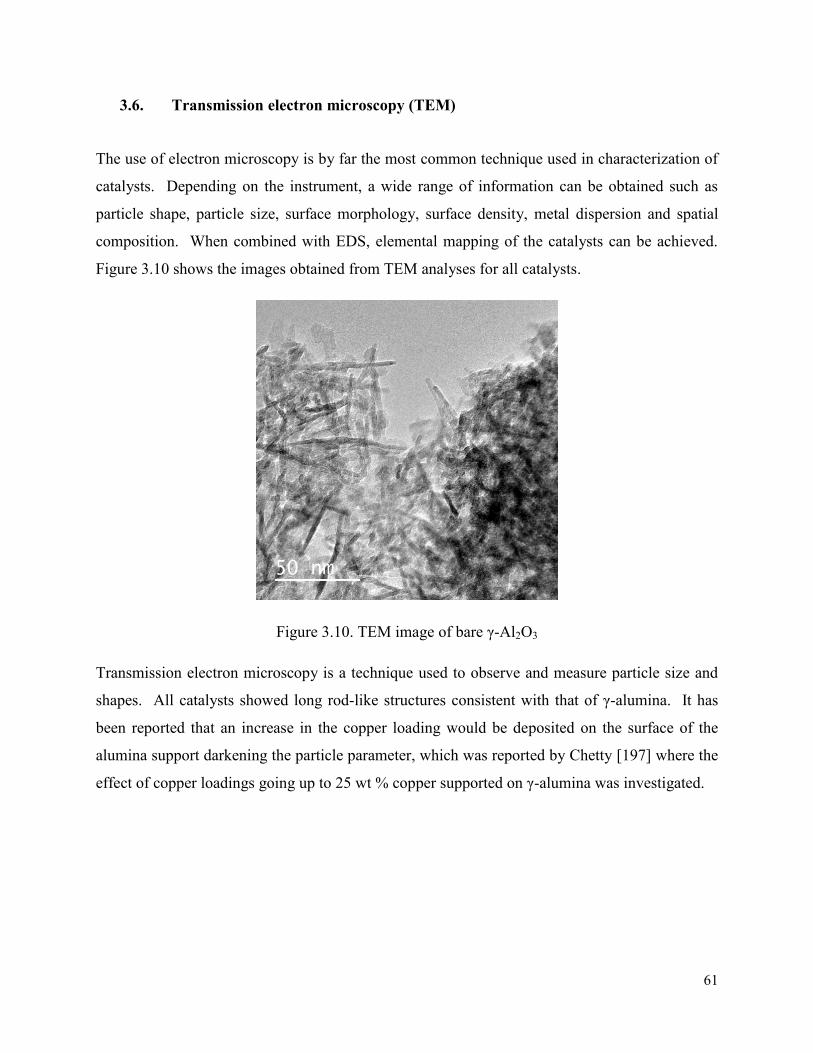
61
3.6. Transmission electron microscopy (TEM)
The use of electron microscopy is by far the most common technique used in characterization of
catalysts. Depending on the instrument, a wide range of information can be obtained such as
particle shape, particle size, surface morphology, surface density, metal dispersion and spatial
composition. When combined with EDS, elemental mapping of the catalysts can be achieved.
Figure 3.10 shows the images obtained from TEM analyses for all catalysts.
Figure 3.10. TEM image of bare γ-Al2O3
Transmission electron microscopy is a technique used to observe and measure particle size and
shapes. All catalysts showed long rod-like structures consistent with that of γ-alumina. It has
been reported that an increase in the copper loading would be deposited on the surface of the
alumina support darkening the particle parameter, which was reported by Chetty [197] where the
effect of copper loadings going up to 25 wt % copper supported on γ-alumina was investigated.
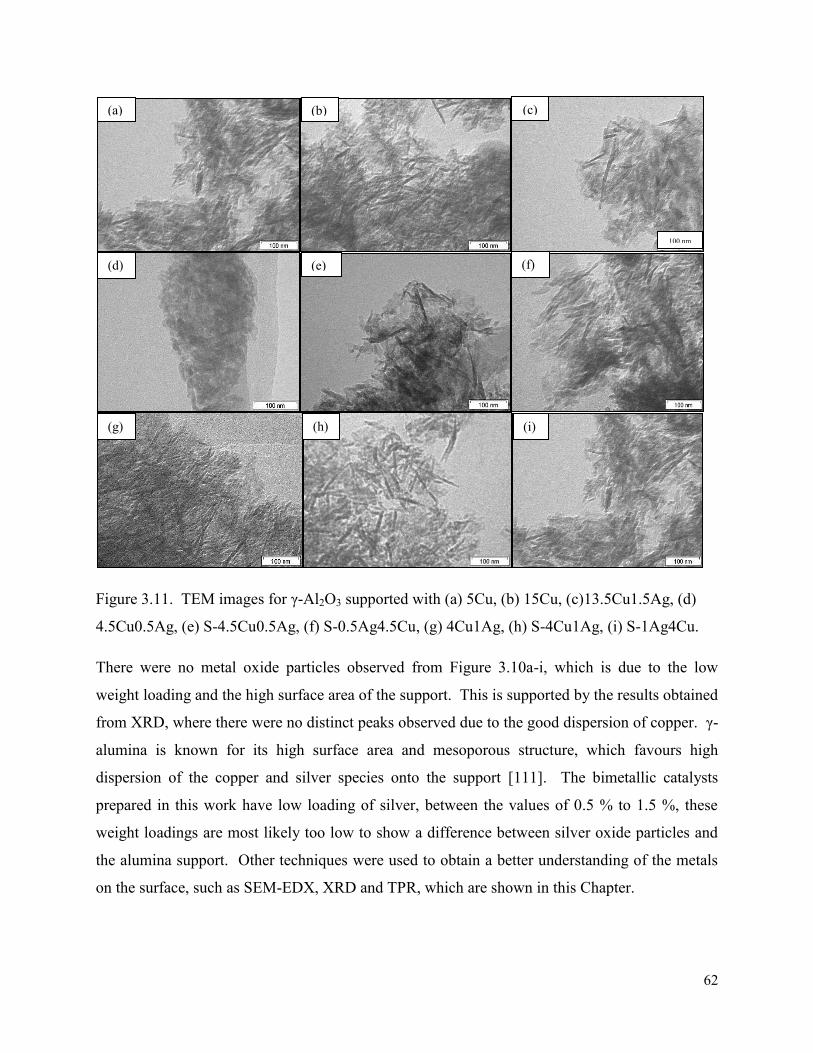
62
Figure 3.11. TEM images for γ-Al2O3 supported with (a) 5Cu, (b) 15Cu, (c)13.5Cu1.5Ag, (d)
4.5Cu0.5Ag, (e) S-4.5Cu0.5Ag, (f) S-0.5Ag4.5Cu, (g) 4Cu1Ag, (h) S-4Cu1Ag, (i) S-1Ag4Cu.
There were no metal oxide particles observed from Figure 3.10a-i, which is due to the low
weight loading and the high surface area of the support. This is supported by the results obtained
from XRD, where there were no distinct peaks observed due to the good dispersion of copper. γ-
alumina is known for its high surface area and mesoporous structure, which favours high
dispersion of the copper and silver species onto the support [111]. The bimetallic catalysts
prepared in this work have low loading of silver, between the values of 0.5 % to 1.5 %, these
weight loadings are most likely too low to show a difference between silver oxide particles and
the alumina support. Other techniques were used to obtain a better understanding of the metals
on the surface, such as SEM-EDX, XRD and TPR, which are shown in this Chapter.
(d)
(a) (b) (c)
(e) (f)
(g) (h) (i)
100 nm
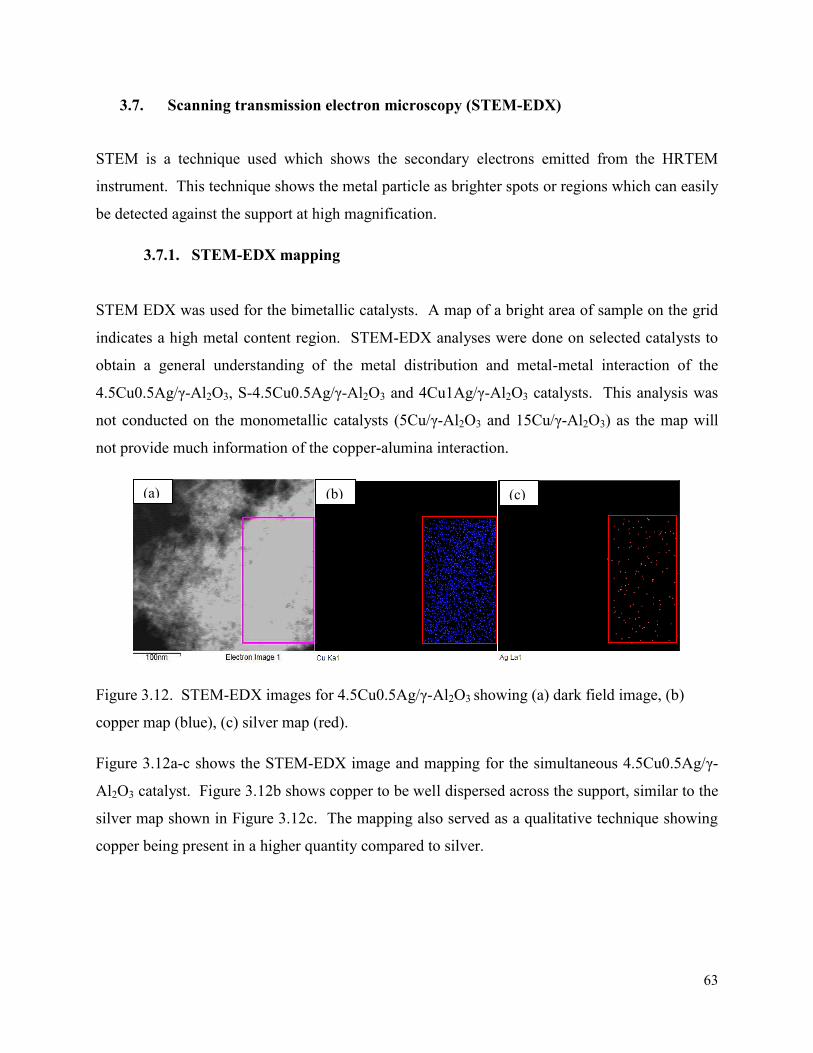
63
3.7. Scanning transmission electron microscopy (STEM-EDX)
STEM is a technique used which shows the secondary electrons emitted from the HRTEM
instrument. This technique shows the metal particle as brighter spots or regions which can easily
be detected against the support at high magnification.
3.7.1. STEM-EDX mapping
STEM EDX was used for the bimetallic catalysts. A map of a bright area of sample on the grid
indicates a high metal content region. STEM-EDX analyses were done on selected catalysts to
obtain a general understanding of the metal distribution and metal-metal interaction of the
4.5Cu0.5Ag/γ-Al2O3, S-4.5Cu0.5Ag/γ-Al2O3 and 4Cu1Ag/γ-Al2O3 catalysts. This analysis was
not conducted on the monometallic catalysts (5Cu/γ-Al2O3 and 15Cu/γ-Al2O3) as the map will
not provide much information of the copper-alumina interaction.
Figure 3.12. STEM-EDX images for 4.5Cu0.5Ag/γ-Al2O3 showing (a) dark field image, (b)
copper map (blue), (c) silver map (red).
Figure 3.12a-c shows the STEM-EDX image and mapping for the simultaneous 4.5Cu0.5Ag/γ-
Al2O3 catalyst. Figure 3.12b shows copper to be well dispersed across the support, similar to the
silver map shown in Figure 3.12c. The mapping also served as a qualitative technique showing
copper being present in a higher quantity compared to silver.
(a) (b) (c)
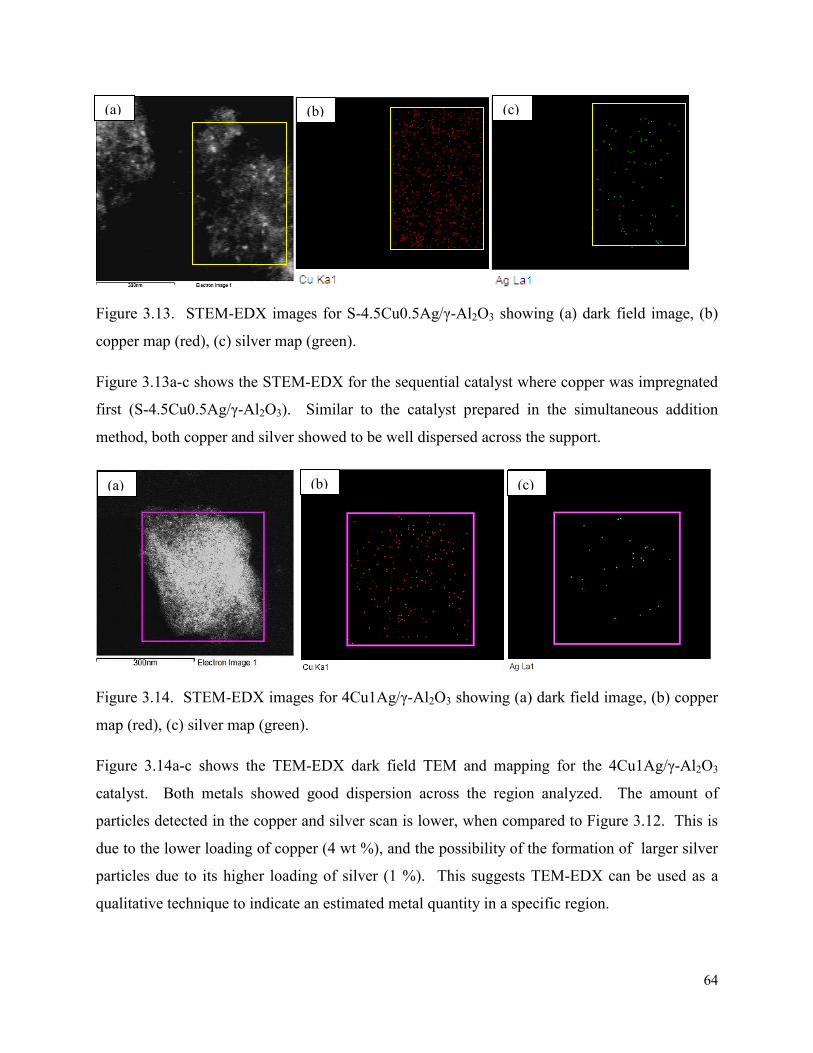
64
Figure 3.13. STEM-EDX images for S-4.5Cu0.5Ag/γ-Al2O3 showing (a) dark field image, (b)
copper map (red), (c) silver map (green).
Figure 3.13a-c shows the STEM-EDX for the sequential catalyst where copper was impregnated
first (S-4.5Cu0.5Ag/γ-Al2O3). Similar to the catalyst prepared in the simultaneous addition
method, both copper and silver showed to be well dispersed across the support.
Figure 3.14. STEM-EDX images for 4Cu1Ag/γ-Al2O3 showing (a) dark field image, (b) copper
map (red), (c) silver map (green).
Figure 3.14a-c shows the TEM-EDX dark field TEM and mapping for the 4Cu1Ag/γ-Al2O3
catalyst. Both metals showed good dispersion across the region analyzed. The amount of
particles detected in the copper and silver scan is lower, when compared to Figure 3.12. This is
due to the lower loading of copper (4 wt %), and the possibility of the formation of larger silver
particles due to its higher loading of silver (1 %). This suggests TEM-EDX can be used as a
qualitative technique to indicate an estimated metal quantity in a specific region.
(a) (b) (c)
(c) (b) (a)
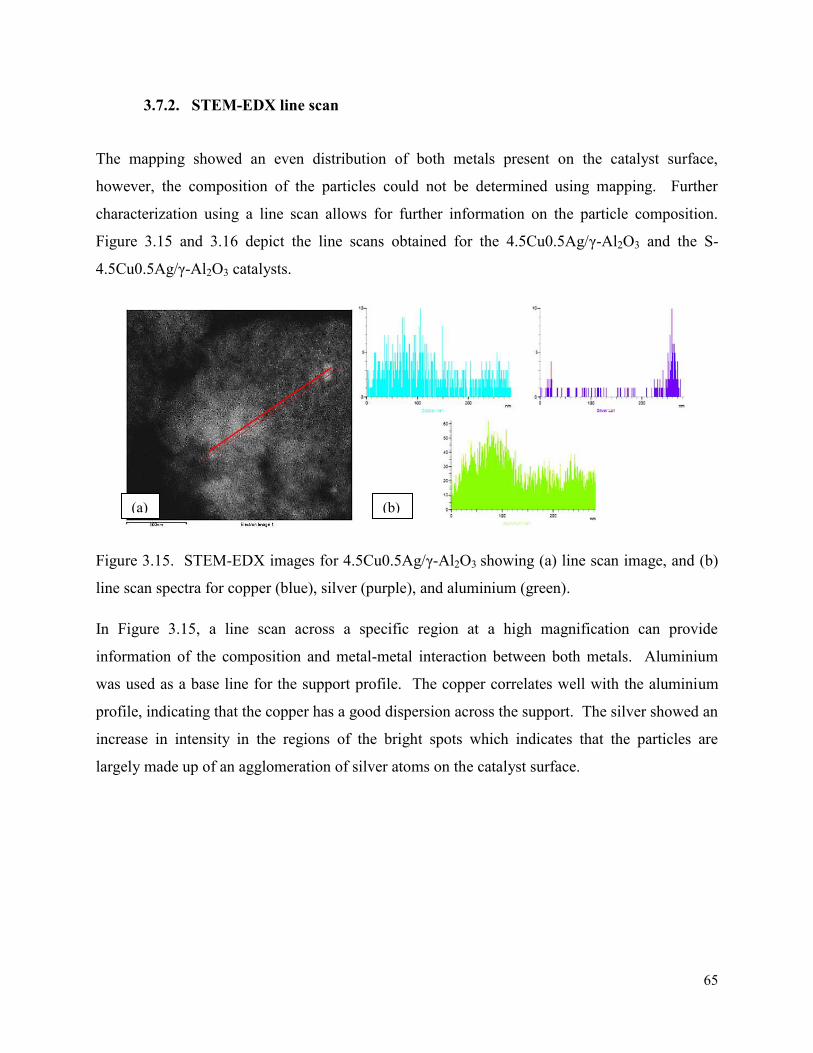
65
3.7.2. STEM-EDX line scan
The mapping showed an even distribution of both metals present on the catalyst surface,
however, the composition of the particles could not be determined using mapping. Further
characterization using a line scan allows for further information on the particle composition.
Figure 3.15 and 3.16 depict the line scans obtained for the 4.5Cu0.5Ag/γ-Al2O3 and the S-
4.5Cu0.5Ag/γ-Al2O3 catalysts.
Figure 3.15. STEM-EDX images for 4.5Cu0.5Ag/γ-Al2O3 showing (a) line scan image, and (b)
line scan spectra for copper (blue), silver (purple), and aluminium (green).
In Figure 3.15, a line scan across a specific region at a high magnification can provide
information of the composition and metal-metal interaction between both metals. Aluminium
was used as a base line for the support profile. The copper correlates well with the aluminium
profile, indicating that the copper has a good dispersion across the support. The silver showed an
increase in intensity in the regions of the bright spots which indicates that the particles are
largely made up of an agglomeration of silver atoms on the catalyst surface.
(b) (a)
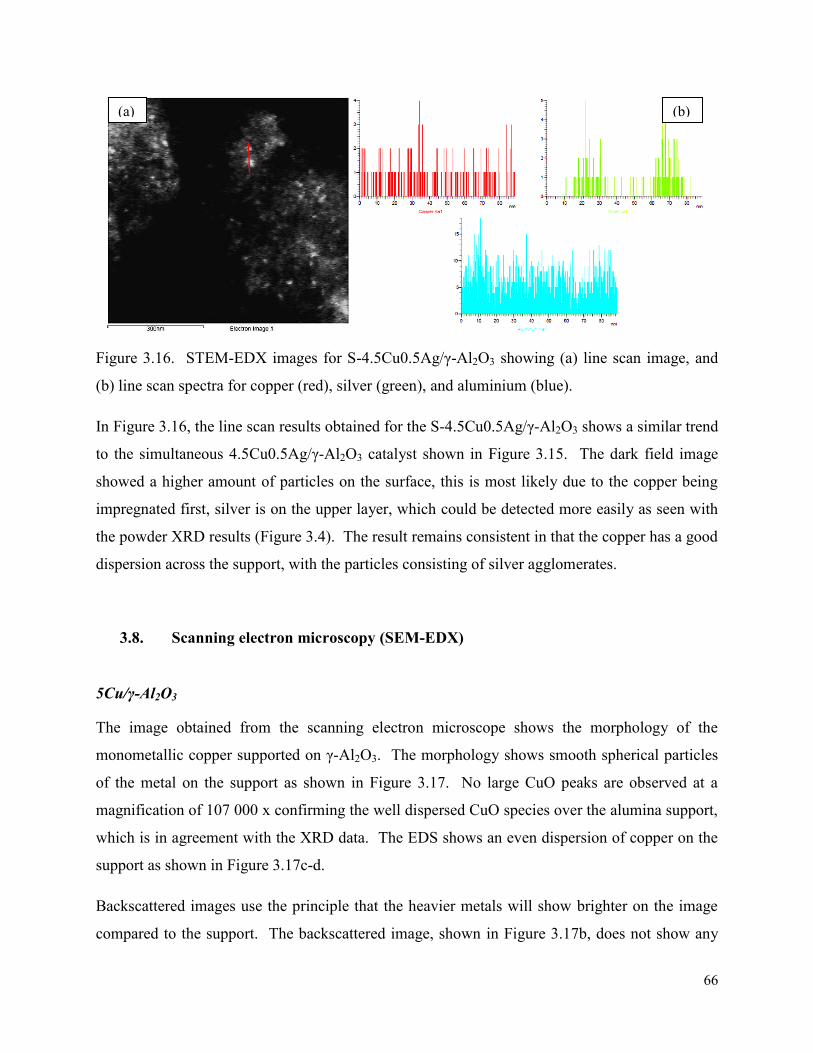
66
Figure 3.16. STEM-EDX images for S-4.5Cu0.5Ag/γ-Al2O3 showing (a) line scan image, and
(b) line scan spectra for copper (red), silver (green), and aluminium (blue).
In Figure 3.16, the line scan results obtained for the S-4.5Cu0.5Ag/γ-Al2O3 shows a similar trend
to the simultaneous 4.5Cu0.5Ag/γ-Al2O3 catalyst shown in Figure 3.15. The dark field image
showed a higher amount of particles on the surface, this is most likely due to the copper being
impregnated first, silver is on the upper layer, which could be detected more easily as seen with
the powder XRD results (Figure 3.4). The result remains consistent in that the copper has a good
dispersion across the support, with the particles consisting of silver agglomerates.
3.8. Scanning electron microscopy (SEM-EDX)
5Cu/γ-Al2O3
The image obtained from the scanning electron microscope shows the morphology of the
monometallic copper supported on γ-Al2O3. The morphology shows smooth spherical particles
of the metal on the support as shown in Figure 3.17. No large CuO peaks are observed at a
magnification of 107 000 x confirming the well dispersed CuO species over the alumina support,
which is in agreement with the XRD data. The EDS shows an even dispersion of copper on the
support as shown in Figure 3.17c-d.
Backscattered images use the principle that the heavier metals will show brighter on the image
compared to the support. The backscattered image, shown in Figure 3.17b, does not show any
(a) (b)
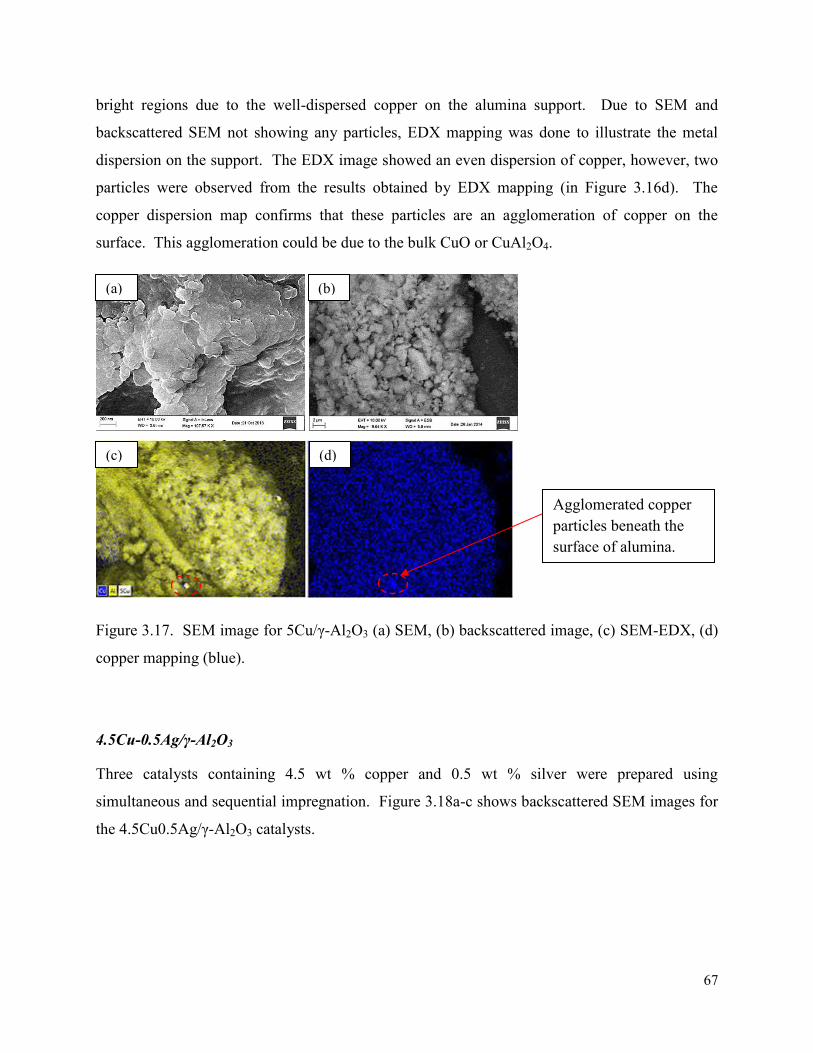
67
bright regions due to the well-dispersed copper on the alumina support. Due to SEM and
backscattered SEM not showing any particles, EDX mapping was done to illustrate the metal
dispersion on the support. The EDX image showed an even dispersion of copper, however, two
particles were observed from the results obtained by EDX mapping (in Figure 3.16d). The
copper dispersion map confirms that these particles are an agglomeration of copper on the
surface. This agglomeration could be due to the bulk CuO or CuAl2O4.
Figure 3.17. SEM image for 5Cu/γ-Al2O3 (a) SEM, (b) backscattered image, (c) SEM-EDX, (d)
copper mapping (blue).
4.5Cu-0.5Ag/γ-Al2O3
Three catalysts containing 4.5 wt % copper and 0.5 wt % silver were prepared using
simultaneous and sequential impregnation. Figure 3.18a-c shows backscattered SEM images for
the 4.5Cu0.5Ag/γ-Al2O3 catalysts.
Agglomerated copper particles beneath the surface of alumina.
(d) (c)
(b) (a)
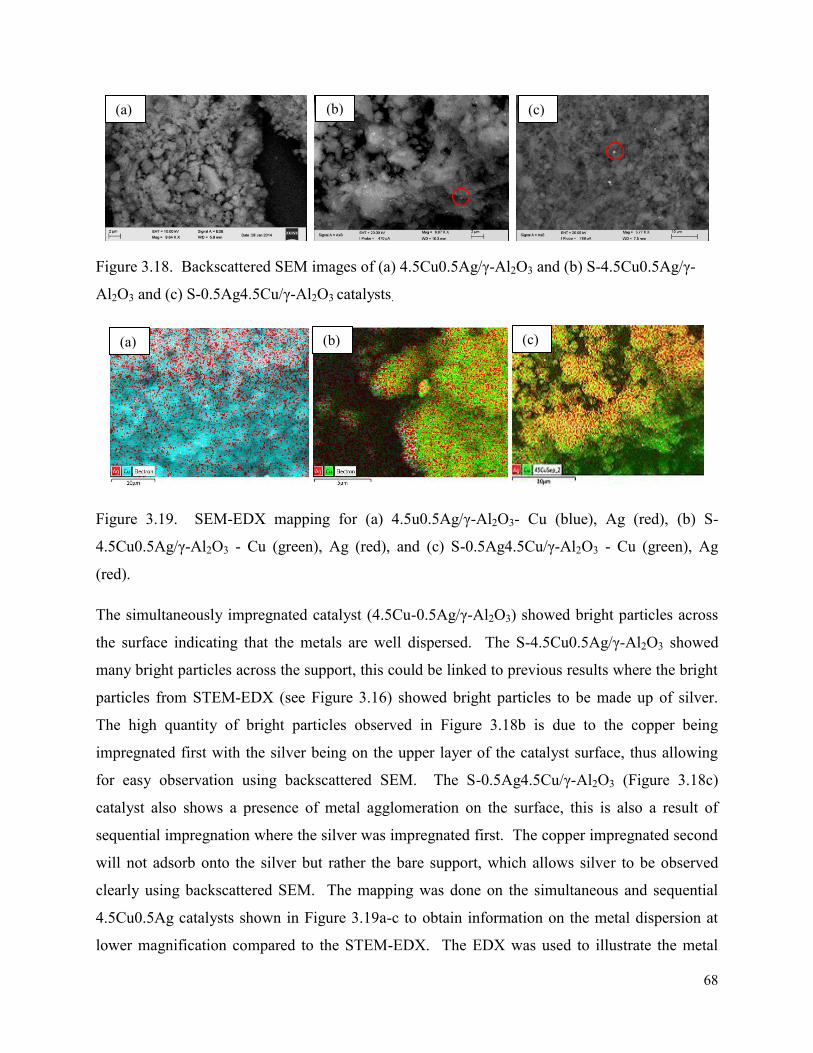
68
Figure 3.18. Backscattered SEM images of (a) 4.5Cu0.5Ag/γ-Al2O3 and (b) S-4.5Cu0.5Ag/γ-
Al2O3 and (c) S-0.5Ag4.5Cu/γ-Al2O3 catalysts.
Figure 3.19. SEM-EDX mapping for (a) 4.5u0.5Ag/γ-Al2O3- Cu (blue), Ag (red), (b) S-
4.5Cu0.5Ag/γ-Al2O3 - Cu (green), Ag (red), and (c) S-0.5Ag4.5Cu/γ-Al2O3 - Cu (green), Ag
(red).
The simultaneously impregnated catalyst (4.5Cu-0.5Ag/γ-Al2O3) showed bright particles across
the surface indicating that the metals are well dispersed. The S-4.5Cu0.5Ag/γ-Al2O3 showed
many bright particles across the support, this could be linked to previous results where the bright
particles from STEM-EDX (see Figure 3.16) showed bright particles to be made up of silver.
The high quantity of bright particles observed in Figure 3.18b is due to the copper being
impregnated first with the silver being on the upper layer of the catalyst surface, thus allowing
for easy observation using backscattered SEM. The S-0.5Ag4.5Cu/γ-Al2O3 (Figure 3.18c)
catalyst also shows a presence of metal agglomeration on the surface, this is also a result of
sequential impregnation where the silver was impregnated first. The copper impregnated second
will not adsorb onto the silver but rather the bare support, which allows silver to be observed
clearly using backscattered SEM. The mapping was done on the simultaneous and sequential
4.5Cu0.5Ag catalysts shown in Figure 3.19a-c to obtain information on the metal dispersion at
lower magnification compared to the STEM-EDX. The EDX was used to illustrate the metal
(b) (a)
(a) (b)
(c)
(c)
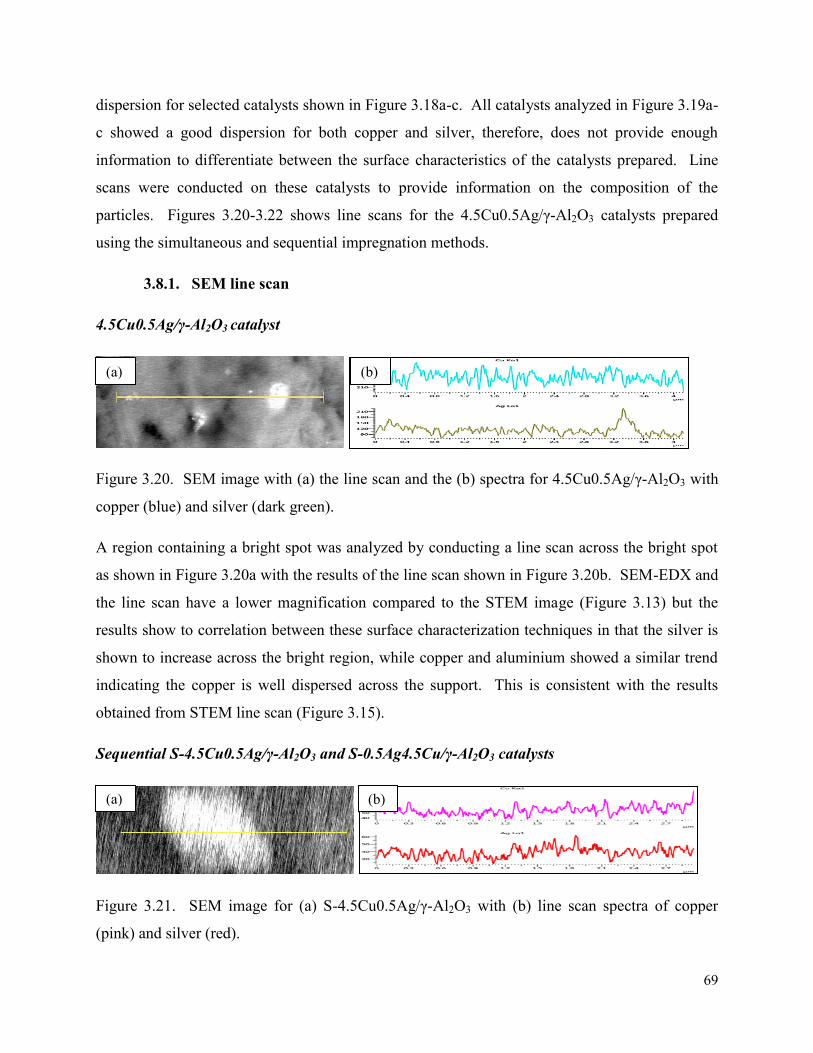
69
dispersion for selected catalysts shown in Figure 3.18a-c. All catalysts analyzed in Figure 3.19a-
c showed a good dispersion for both copper and silver, therefore, does not provide enough
information to differentiate between the surface characteristics of the catalysts prepared. Line
scans were conducted on these catalysts to provide information on the composition of the
particles. Figures 3.20-3.22 shows line scans for the 4.5Cu0.5Ag/γ-Al2O3 catalysts prepared
using the simultaneous and sequential impregnation methods.
3.8.1. SEM line scan
4.5Cu0.5Ag/γ-Al2O3 catalyst
Figure 3.20. SEM image with (a) the line scan and the (b) spectra for 4.5Cu0.5Ag/γ-Al2O3 with
copper (blue) and silver (dark green).
A region containing a bright spot was analyzed by conducting a line scan across the bright spot
as shown in Figure 3.20a with the results of the line scan shown in Figure 3.20b. SEM-EDX and
the line scan have a lower magnification compared to the STEM image (Figure 3.13) but the
results show to correlation between these surface characterization techniques in that the silver is
shown to increase across the bright region, while copper and aluminium showed a similar trend
indicating the copper is well dispersed across the support. This is consistent with the results
obtained from STEM line scan (Figure 3.15).
Sequential S-4.5Cu0.5Ag/γ-Al2O3 and S-0.5Ag4.5Cu/γ-Al2O3 catalysts
Figure 3.21. SEM image for (a) S-4.5Cu0.5Ag/γ-Al2O3 with (b) line scan spectra of copper
(pink) and silver (red).
(a) (b)
(a) (b)
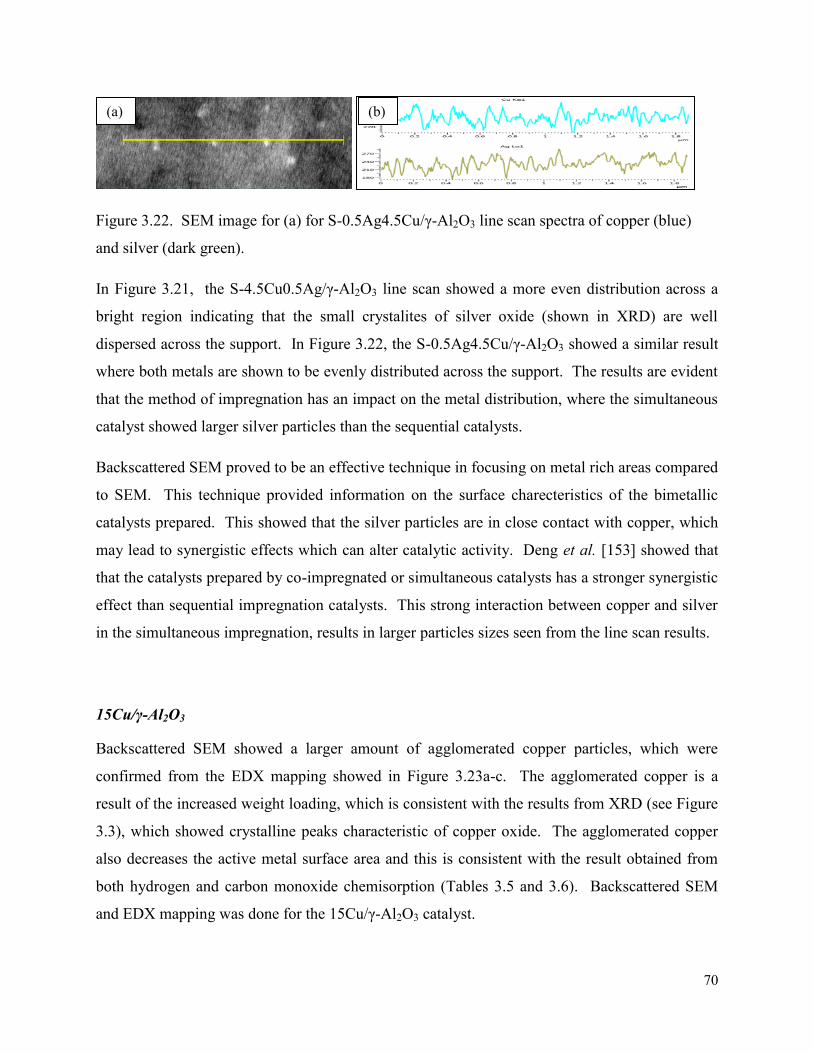
70
Figure 3.22. SEM image for (a) for S-0.5Ag4.5Cu/γ-Al2O3 line scan spectra of copper (blue)
and silver (dark green).
In Figure 3.21, the S-4.5Cu0.5Ag/γ-Al2O3 line scan showed a more even distribution across a
bright region indicating that the small crystalites of silver oxide (shown in XRD) are well
dispersed across the support. In Figure 3.22, the S-0.5Ag4.5Cu/γ-Al2O3 showed a similar result
where both metals are shown to be evenly distributed across the support. The results are evident
that the method of impregnation has an impact on the metal distribution, where the simultaneous
catalyst showed larger silver particles than the sequential catalysts.
Backscattered SEM proved to be an effective technique in focusing on metal rich areas compared
to SEM. This technique provided information on the surface charecteristics of the bimetallic
catalysts prepared. This showed that the silver particles are in close contact with copper, which
may lead to synergistic effects which can alter catalytic activity. Deng et al. [153] showed that
that the catalysts prepared by co-impregnated or simultaneous catalysts has a stronger synergistic
effect than sequential impregnation catalysts. This strong interaction between copper and silver
in the simultaneous impregnation, results in larger particles sizes seen from the line scan results.
15Cu/γ-Al2O3
Backscattered SEM showed a larger amount of agglomerated copper particles, which were
confirmed from the EDX mapping showed in Figure 3.23a-c. The agglomerated copper is a
result of the increased weight loading, which is consistent with the results from XRD (see Figure
3.3), which showed crystalline peaks characteristic of copper oxide. The agglomerated copper
also decreases the active metal surface area and this is consistent with the result obtained from
both hydrogen and carbon monoxide chemisorption (Tables 3.5 and 3.6). Backscattered SEM
and EDX mapping was done for the 15Cu/γ-Al2O3 catalyst.
(b) (a)
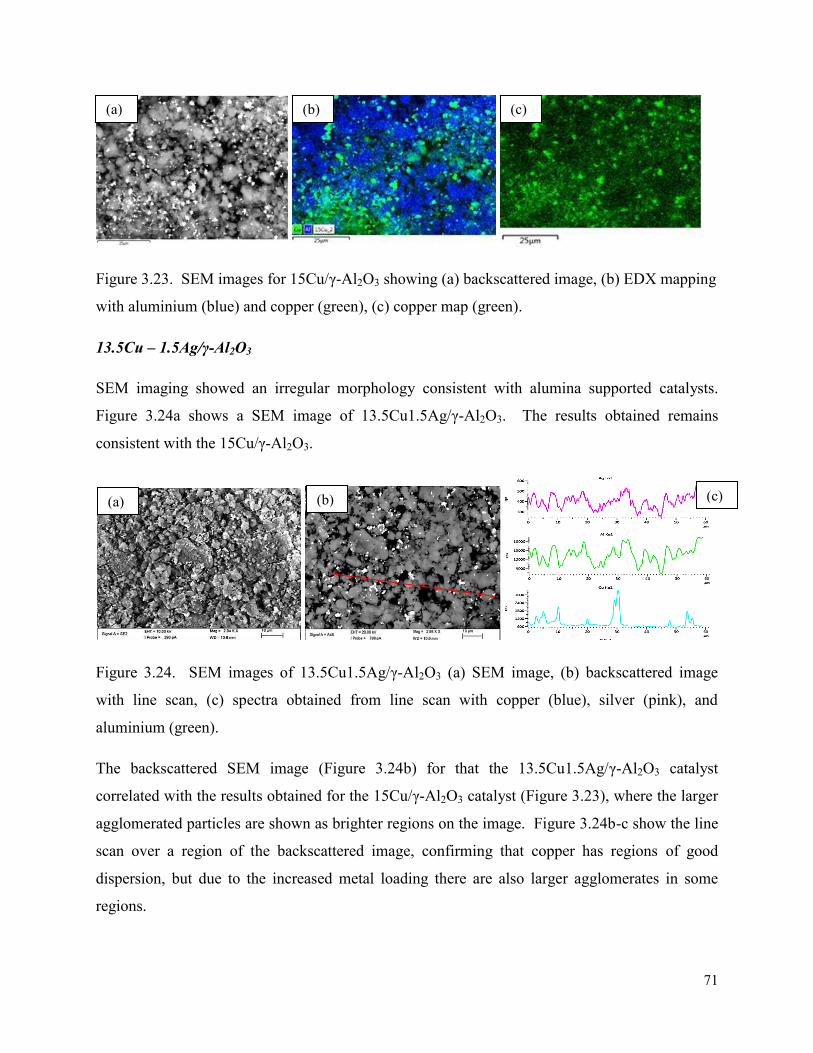
71
Figure 3.23. SEM images for 15Cu/γ-Al2O3 showing (a) backscattered image, (b) EDX mapping
with aluminium (blue) and copper (green), (c) copper map (green).
13.5Cu – 1.5Ag/γ-Al2O3
SEM imaging showed an irregular morphology consistent with alumina supported catalysts.
Figure 3.24a shows a SEM image of 13.5Cu1.5Ag/γ-Al2O3. The results obtained remains
consistent with the 15Cu/γ-Al2O3.
Figure 3.24. SEM images of 13.5Cu1.5Ag/γ-Al2O3 (a) SEM image, (b) backscattered image
with line scan, (c) spectra obtained from line scan with copper (blue), silver (pink), and
aluminium (green).
The backscattered SEM image (Figure 3.24b) for that the 13.5Cu1.5Ag/γ-Al2O3 catalyst
correlated with the results obtained for the 15Cu/γ-Al2O3 catalyst (Figure 3.23), where the larger
agglomerated particles are shown as brighter regions on the image. Figure 3.24b-c show the line
scan over a region of the backscattered image, confirming that copper has regions of good
dispersion, but due to the increased metal loading there are also larger agglomerates in some
regions.
(a) (b) (c)
(a) (c) (b)
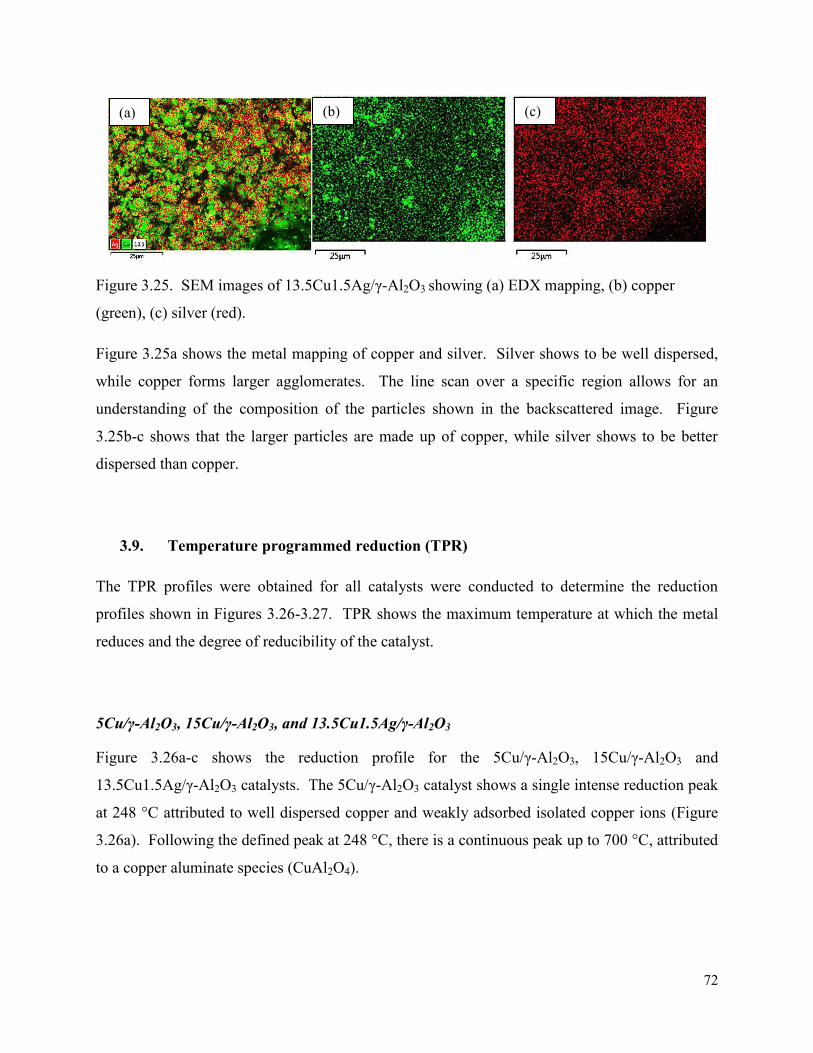
72
Figure 3.25. SEM images of 13.5Cu1.5Ag/γ-Al2O3 showing (a) EDX mapping, (b) copper
(green), (c) silver (red).
Figure 3.25a shows the metal mapping of copper and silver. Silver shows to be well dispersed,
while copper forms larger agglomerates. The line scan over a specific region allows for an
understanding of the composition of the particles shown in the backscattered image. Figure
3.25b-c shows that the larger particles are made up of copper, while silver shows to be better
dispersed than copper.
3.9. Temperature programmed reduction (TPR)
The TPR profiles were obtained for all catalysts were conducted to determine the reduction
profiles shown in Figures 3.26-3.27. TPR shows the maximum temperature at which the metal
reduces and the degree of reducibility of the catalyst.
5Cu/γ-Al2O3, 15Cu/γ-Al2O3, and 13.5Cu1.5Ag/γ-Al2O3
Figure 3.26a-c shows the reduction profile for the 5Cu/γ-Al2O3, 15Cu/γ-Al2O3 and
13.5Cu1.5Ag/γ-Al2O3 catalysts. The 5Cu/γ-Al2O3 catalyst shows a single intense reduction peak
at 248 °C attributed to well dispersed copper and weakly adsorbed isolated copper ions (Figure
3.26a). Following the defined peak at 248 °C, there is a continuous peak up to 700 °C, attributed
to a copper aluminate species (CuAl2O4).
(c) (b) (a)
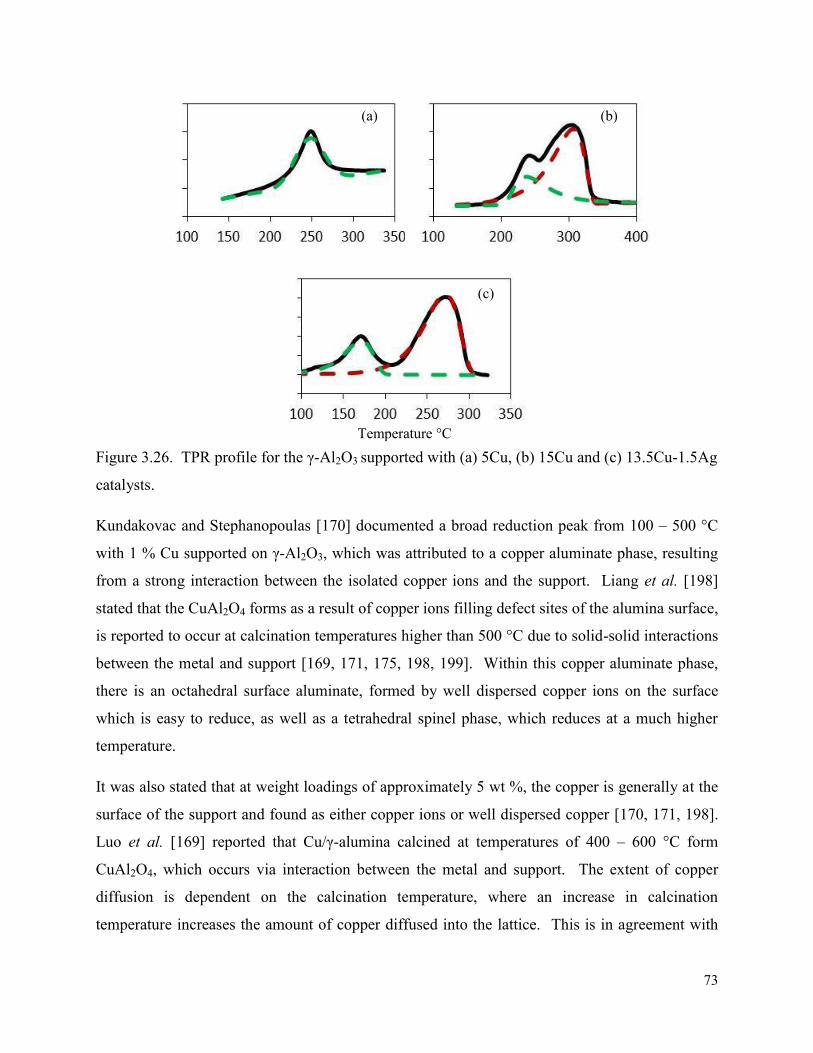
73
Figure 3.26. TPR profile for the γ-Al2O3 supported with (a) 5Cu, (b) 15Cu and (c) 13.5Cu-1.5Ag
catalysts.
Kundakovac and Stephanopoulas [170] documented a broad reduction peak from 100 – 500 °C
with 1 % Cu supported on γ-Al2O3, which was attributed to a copper aluminate phase, resulting
from a strong interaction between the isolated copper ions and the support. Liang et al. [198]
stated that the CuAl2O4 forms as a result of copper ions filling defect sites of the alumina surface,
is reported to occur at calcination temperatures higher than 500 °C due to solid-solid interactions
between the metal and support [169, 171, 175, 198, 199]. Within this copper aluminate phase,
there is an octahedral surface aluminate, formed by well dispersed copper ions on the surface
which is easy to reduce, as well as a tetrahedral spinel phase, which reduces at a much higher
temperature.
It was also stated that at weight loadings of approximately 5 wt %, the copper is generally at the
surface of the support and found as either copper ions or well dispersed copper [170, 171, 198].
Luo et al. [169] reported that Cu/γ-alumina calcined at temperatures of 400 – 600 °C form
CuAl2O4, which occurs via interaction between the metal and support. The extent of copper
diffusion is dependent on the calcination temperature, where an increase in calcination
temperature increases the amount of copper diffused into the lattice. This is in agreement with
(a) (b)
(c)
Temperature °C
74
work done on the characterization of Cu/Al2O3 by Zhu et al. [200] and Friedman and Freeman
[171].
Figure 3.25b shows the reduction profile of 15Cu/γ-Al2O3 where two peaks was observed. The
first peak was attributed to the well dispersed copper, similar to the 5Cu, while the second peak
at a higher reduction temperature was attributed to the bulk CuO. A TPR study done by Dow et
al. [161], reported on two reduction peaks observed for supported CuO catalysts. The low
temperature peak was attributed to the highly dispersed copper and the high temperature peak
due to the bulk CuO species [161], consistent with the results obtained in this study.
Garbowski et al. [201] explained that during the impregnation step, the Cu2+ ions interact with
the hydroxyl groups via hydrogen bonding. When calcined, this interaction was increased
between the metal and support during the removal of water. Considering that the Cu2+ species
requires two –OH groups to adsorb to, this indicated that there is an exchange capacity. For high
copper loadings (> 6 wt %), there are not enough hydroxyl groups to exchange ions with so it is
said to have reached its exchange capacity. Once this exchange capacity has been reached, the
bulk CuO species are formed [201]. The higher temperature needed for this bulk CuO reduction
is needed because there is a smaller reactive surface due to large clusters of CuO.
Figure 3.25c shows that the peaks of the 13.5Cu1.5Ag/γ-Al2O3 catalyst shifted to a lower
reduction temperature for the well dispersed and bulk CuO. There is no silver reduction
observed due to the low weight loading of silver, as well as the low reduction temperature of
silver, reported to be less than 100 °C. Since silver is known to reduce at low temperatures, the
reduced silver species adsorbed hydrogen, which is able to migrate across the silver species, thus
reducing the copper faster. Bachiller-Baeza et al. [157] reported that the bimetallic Ru-Fe
catalyst showed a shift to a lower reduction temperature compared to monometallic iron, this
observation was attributed to the presence of ruthenium. A similar result was observed with Pt-
W/γ-Al2O3 catalysts where the addition of platinum increased the reducibility of tungsten, in
work done by Alexeev et al. [156].
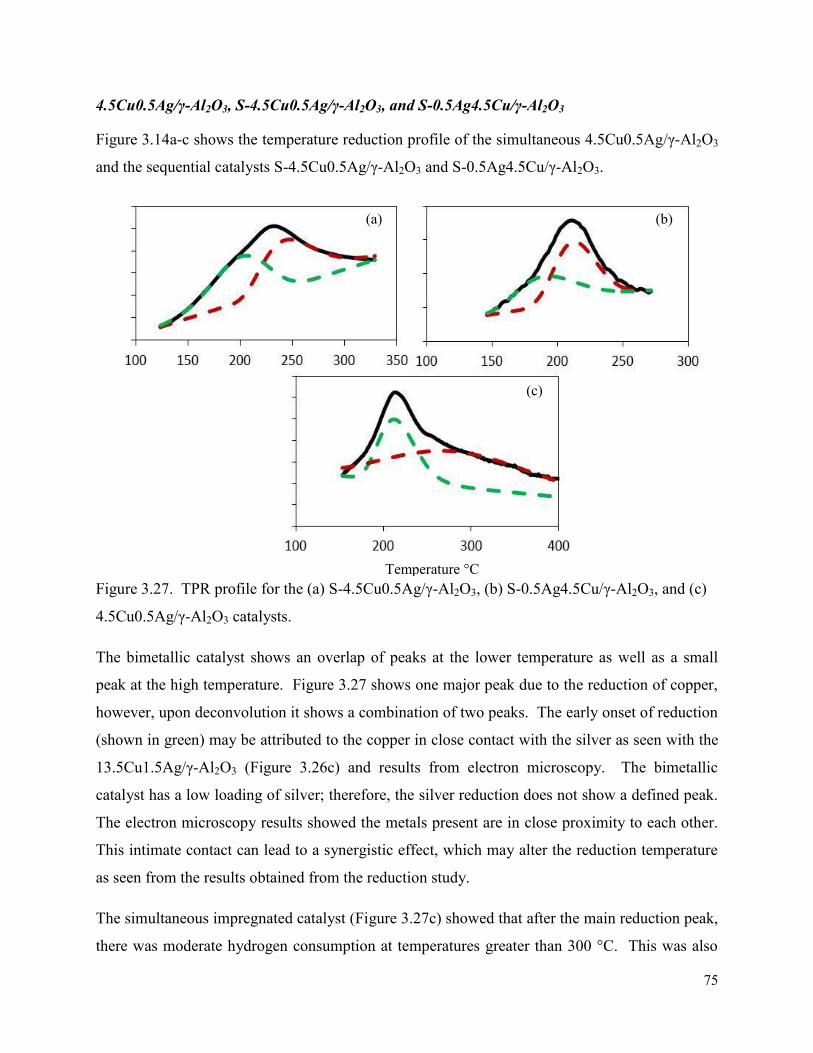
75
4.5Cu0.5Ag/γ-Al2O3, S-4.5Cu0.5Ag/γ-Al2O3, and S-0.5Ag4.5Cu/γ-Al2O3
Figure 3.14a-c shows the temperature reduction profile of the simultaneous 4.5Cu0.5Ag/γ-Al2O3
and the sequential catalysts S-4.5Cu0.5Ag/γ-Al2O3 and S-0.5Ag4.5Cu/γ-Al2O3.
Figure 3.27. TPR profile for the (a) S-4.5Cu0.5Ag/γ-Al2O3, (b) S-0.5Ag4.5Cu/γ-Al2O3, and (c)
4.5Cu0.5Ag/γ-Al2O3 catalysts.
The bimetallic catalyst shows an overlap of peaks at the lower temperature as well as a small
peak at the high temperature. Figure 3.27 shows one major peak due to the reduction of copper,
however, upon deconvolution it shows a combination of two peaks. The early onset of reduction
(shown in green) may be attributed to the copper in close contact with the silver as seen with the
13.5Cu1.5Ag/γ-Al2O3 (Figure 3.26c) and results from electron microscopy. The bimetallic
catalyst has a low loading of silver; therefore, the silver reduction does not show a defined peak.
The electron microscopy results showed the metals present are in close proximity to each other.
This intimate contact can lead to a synergistic effect, which may alter the reduction temperature
as seen from the results obtained from the reduction study.
The simultaneous impregnated catalyst (Figure 3.27c) showed that after the main reduction peak,
there was moderate hydrogen consumption at temperatures greater than 300 °C. This was also
(a) (b)
(c)
Temperature °C
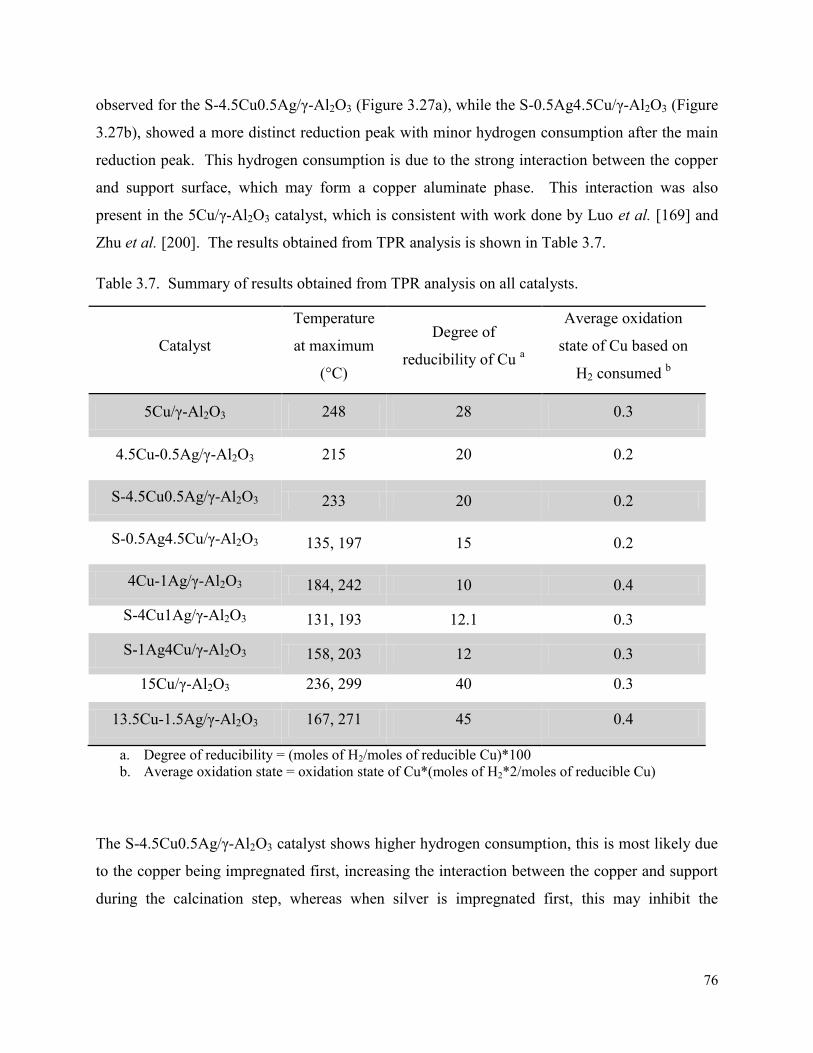
76
observed for the S-4.5Cu0.5Ag/γ-Al2O3 (Figure 3.27a), while the S-0.5Ag4.5Cu/γ-Al2O3 (Figure
3.27b), showed a more distinct reduction peak with minor hydrogen consumption after the main
reduction peak. This hydrogen consumption is due to the strong interaction between the copper
and support surface, which may form a copper aluminate phase. This interaction was also
present in the 5Cu/γ-Al2O3 catalyst, which is consistent with work done by Luo et al. [169] and
Zhu et al. [200]. The results obtained from TPR analysis is shown in Table 3.7.
Table 3.7. Summary of results obtained from TPR analysis on all catalysts.
Catalyst
Temperature
at maximum
(°C)
Degree of
reducibility of Cu a
Average oxidation
state of Cu based on
H2 consumed b
5Cu/γ-Al2O3 248 28 0.3
4.5Cu-0.5Ag/γ-Al2O3 215 20 0.2
S-4.5Cu0.5Ag/γ-Al2O3 233 20 0.2
S-0.5Ag4.5Cu/γ-Al2O3 135, 197 15 0.2
4Cu-1Ag/γ-Al2O3 184, 242 10 0.4
S-4Cu1Ag/γ-Al2O3 131, 193 12.1 0.3
S-1Ag4Cu/γ-Al2O3 158, 203 12 0.3
15Cu/γ-Al2O3 236, 299 40 0.3
13.5Cu-1.5Ag/γ-Al2O3 167, 271 45 0.4
a. Degree of reducibility = (moles of H2/moles of reducible Cu)*100 b. Average oxidation state = oxidation state of Cu*(moles of H2*2/moles of reducible Cu)
The S-4.5Cu0.5Ag/γ-Al2O3 catalyst shows higher hydrogen consumption, this is most likely due
to the copper being impregnated first, increasing the interaction between the copper and support
during the calcination step, whereas when silver is impregnated first, this may inhibit the
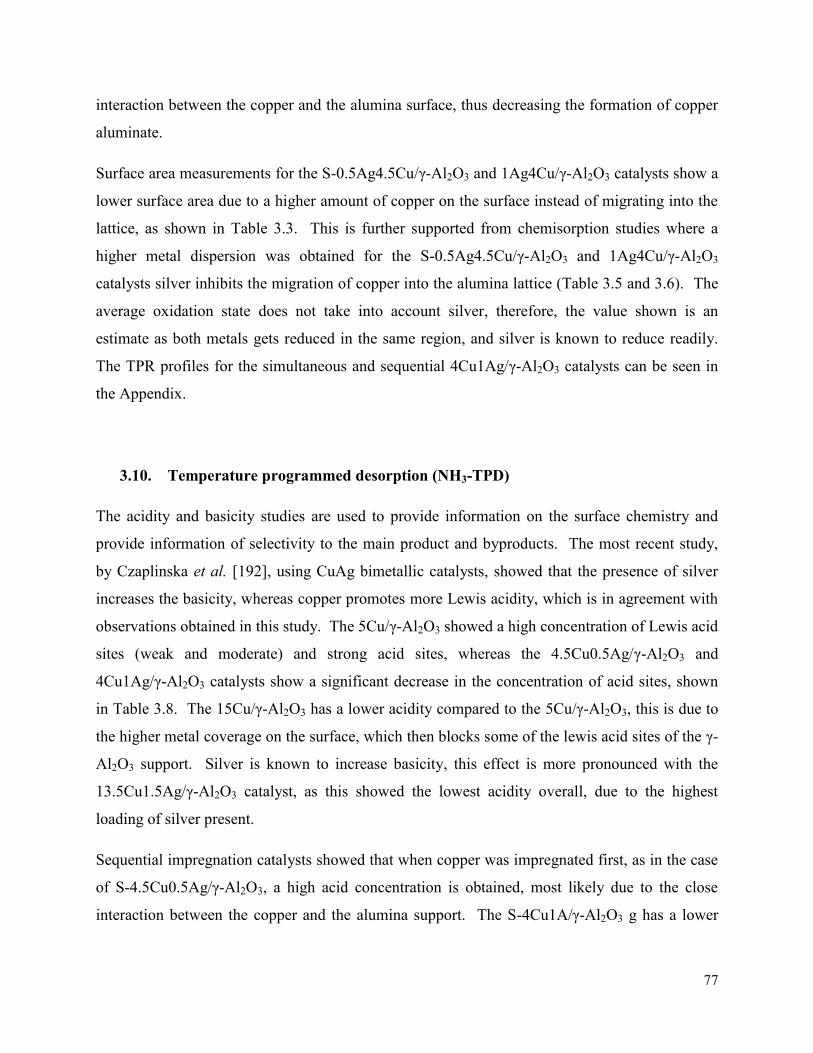
77
interaction between the copper and the alumina surface, thus decreasing the formation of copper
aluminate.
Surface area measurements for the S-0.5Ag4.5Cu/γ-Al2O3 and 1Ag4Cu/γ-Al2O3 catalysts show a
lower surface area due to a higher amount of copper on the surface instead of migrating into the
lattice, as shown in Table 3.3. This is further supported from chemisorption studies where a
higher metal dispersion was obtained for the S-0.5Ag4.5Cu/γ-Al2O3 and 1Ag4Cu/γ-Al2O3
catalysts silver inhibits the migration of copper into the alumina lattice (Table 3.5 and 3.6). The
average oxidation state does not take into account silver, therefore, the value shown is an
estimate as both metals gets reduced in the same region, and silver is known to reduce readily.
The TPR profiles for the simultaneous and sequential 4Cu1Ag/γ-Al2O3 catalysts can be seen in
the Appendix.
3.10. Temperature programmed desorption (NH3-TPD)
The acidity and basicity studies are used to provide information on the surface chemistry and
provide information of selectivity to the main product and byproducts. The most recent study,
by Czaplinska et al. [192], using CuAg bimetallic catalysts, showed that the presence of silver
increases the basicity, whereas copper promotes more Lewis acidity, which is in agreement with
observations obtained in this study. The 5Cu/γ-Al2O3 showed a high concentration of Lewis acid
sites (weak and moderate) and strong acid sites, whereas the 4.5Cu0.5Ag/γ-Al2O3 and
4Cu1Ag/γ-Al2O3 catalysts show a significant decrease in the concentration of acid sites, shown
in Table 3.8. The 15Cu/γ-Al2O3 has a lower acidity compared to the 5Cu/γ-Al2O3, this is due to
the higher metal coverage on the surface, which then blocks some of the lewis acid sites of the γ-
Al2O3 support. Silver is known to increase basicity, this effect is more pronounced with the
13.5Cu1.5Ag/γ-Al2O3 catalyst, as this showed the lowest acidity overall, due to the highest
loading of silver present.
Sequential impregnation catalysts showed that when copper was impregnated first, as in the case
of S-4.5Cu0.5Ag/γ-Al2O3, a high acid concentration is obtained, most likely due to the close
interaction between the copper and the alumina support. The S-4Cu1A/γ-Al2O3 g has a lower
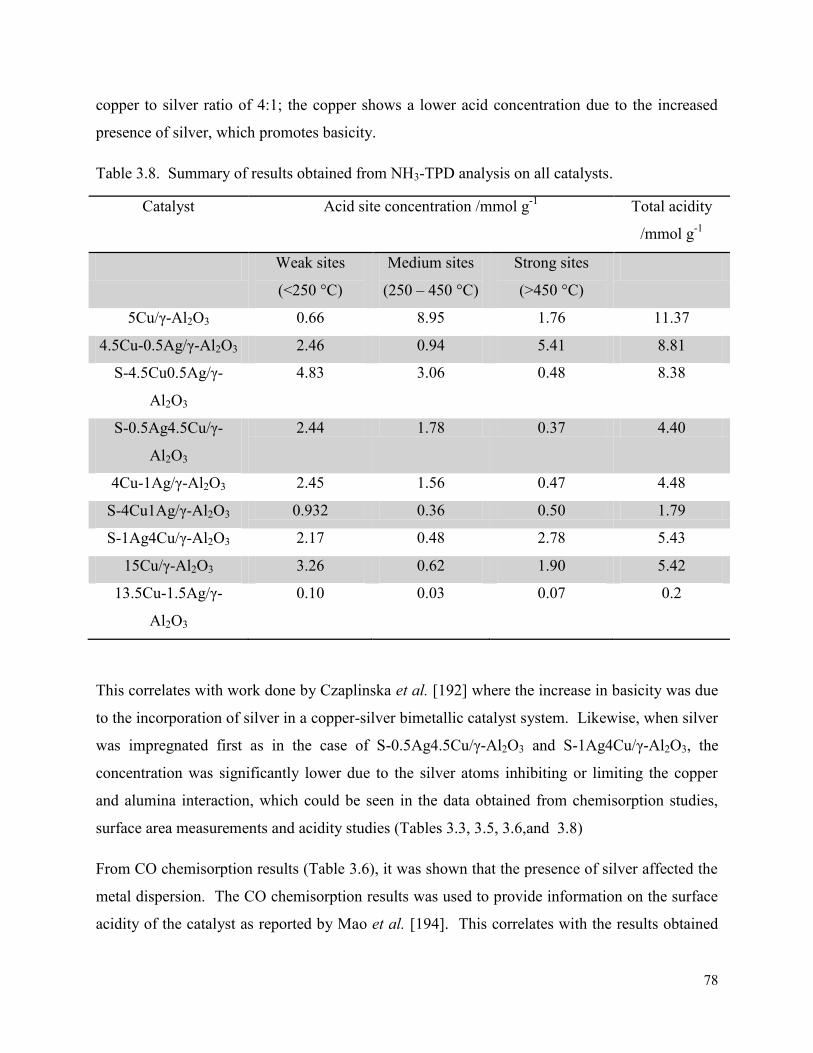
78
copper to silver ratio of 4:1; the copper shows a lower acid concentration due to the increased
presence of silver, which promotes basicity.
Table 3.8. Summary of results obtained from NH3-TPD analysis on all catalysts. Catalyst Acid site concentration /mmol g-1 Total acidity
/mmol g-1
Weak sites
(<250 °C)
Medium sites
(250 – 450 °C)
Strong sites
(>450 °C)
5Cu/γ-Al2O3 0.66 8.95 1.76 11.37
4.5Cu-0.5Ag/γ-Al2O3 2.46 0.94 5.41 8.81
S-4.5Cu0.5Ag/γ-
Al2O3
4.83 3.06 0.48 8.38
S-0.5Ag4.5Cu/γ-
Al2O3
2.44 1.78 0.37 4.40
4Cu-1Ag/γ-Al2O3 2.45 1.56 0.47 4.48
S-4Cu1Ag/γ-Al2O3 0.932 0.36 0.50 1.79
S-1Ag4Cu/γ-Al2O3 2.17 0.48 2.78 5.43
15Cu/γ-Al2O3 3.26 0.62 1.90 5.42
13.5Cu-1.5Ag/γ-
Al2O3
0.10 0.03 0.07 0.2
This correlates with work done by Czaplinska et al. [192] where the increase in basicity was due
to the incorporation of silver in a copper-silver bimetallic catalyst system. Likewise, when silver
was impregnated first as in the case of S-0.5Ag4.5Cu/γ-Al2O3 and S-1Ag4Cu/γ-Al2O3, the
concentration was significantly lower due to the silver atoms inhibiting or limiting the copper
and alumina interaction, which could be seen in the data obtained from chemisorption studies,
surface area measurements and acidity studies (Tables 3.3, 3.5, 3.6,and 3.8)
From CO chemisorption results (Table 3.6), it was shown that the presence of silver affected the
metal dispersion. The CO chemisorption results was used to provide information on the surface
acidity of the catalyst as reported by Mao et al. [194]. This correlates with the results obtained
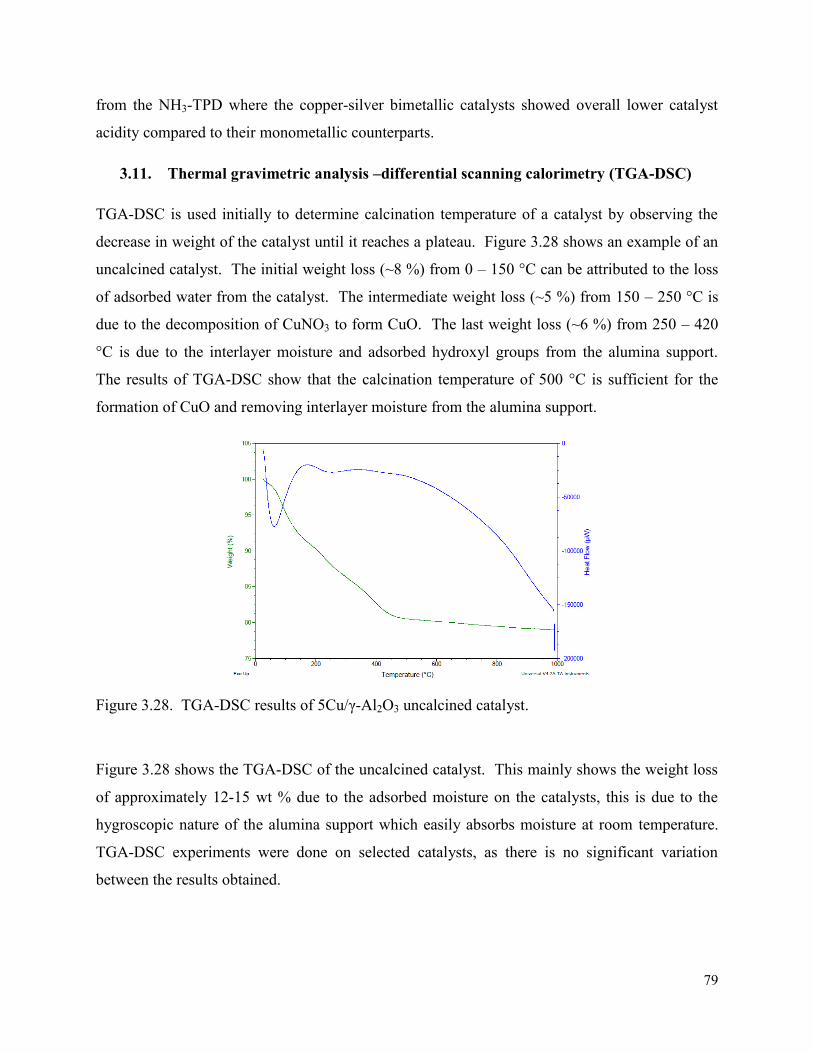
79
from the NH3-TPD where the copper-silver bimetallic catalysts showed overall lower catalyst
acidity compared to their monometallic counterparts.
3.11. Thermal gravimetric analysis –differential scanning calorimetry (TGA-DSC)
TGA-DSC is used initially to determine calcination temperature of a catalyst by observing the
decrease in weight of the catalyst until it reaches a plateau. Figure 3.28 shows an example of an
uncalcined catalyst. The initial weight loss (~8 %) from 0 – 150 °C can be attributed to the loss
of adsorbed water from the catalyst. The intermediate weight loss (~5 %) from 150 – 250 °C is
due to the decomposition of CuNO3 to form CuO. The last weight loss (~6 %) from 250 – 420
°C is due to the interlayer moisture and adsorbed hydroxyl groups from the alumina support.
The results of TGA-DSC show that the calcination temperature of 500 °C is sufficient for the
formation of CuO and removing interlayer moisture from the alumina support.
Figure 3.28. TGA-DSC results of 5Cu/γ-Al2O3 uncalcined catalyst.
Figure 3.28 shows the TGA-DSC of the uncalcined catalyst. This mainly shows the weight loss
of approximately 12-15 wt % due to the adsorbed moisture on the catalysts, this is due to the
hygroscopic nature of the alumina support which easily absorbs moisture at room temperature.
TGA-DSC experiments were done on selected catalysts, as there is no significant variation
between the results obtained.
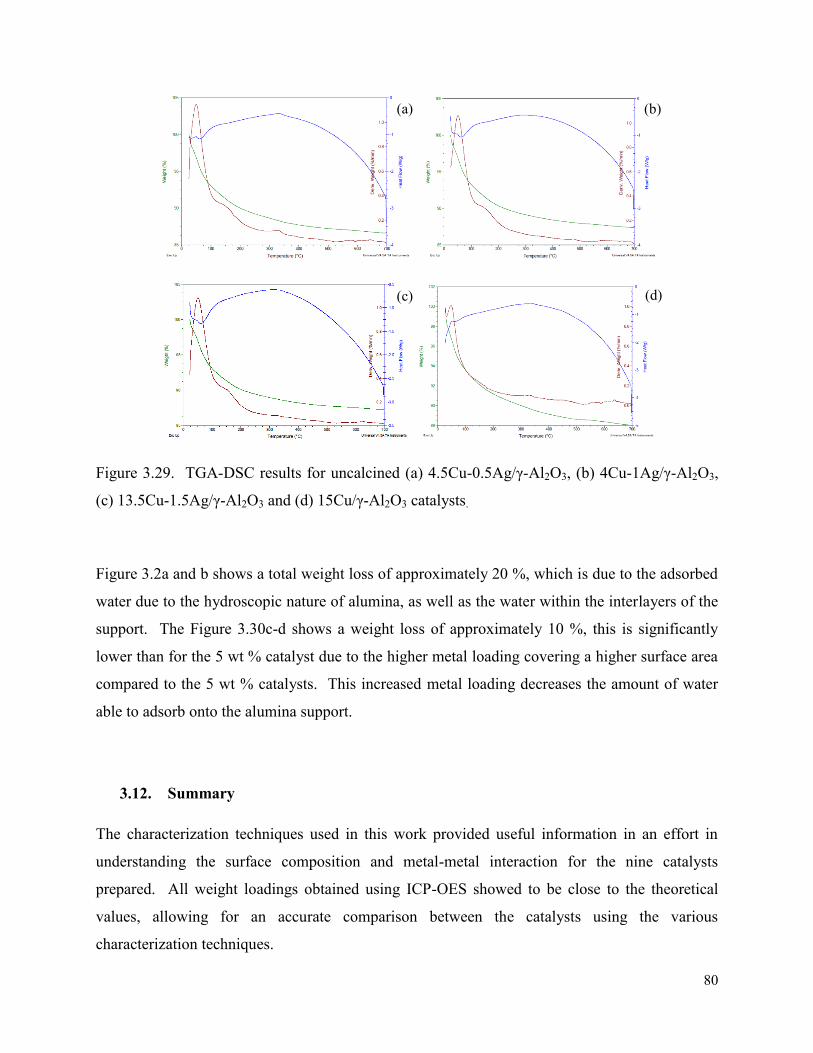
80
Figure 3.29. TGA-DSC results for uncalcined (a) 4.5Cu-0.5Ag/γ-Al2O3, (b) 4Cu-1Ag/γ-Al2O3,
(c) 13.5Cu-1.5Ag/γ-Al2O3 and (d) 15Cu/γ-Al2O3 catalysts.
Figure 3.2a and b shows a total weight loss of approximately 20 %, which is due to the adsorbed
water due to the hydroscopic nature of alumina, as well as the water within the interlayers of the
support. The Figure 3.30c-d shows a weight loss of approximately 10 %, this is significantly
lower than for the 5 wt % catalyst due to the higher metal loading covering a higher surface area
compared to the 5 wt % catalysts. This increased metal loading decreases the amount of water
able to adsorb onto the alumina support.
3.12. Summary
The characterization techniques used in this work provided useful information in an effort in
understanding the surface composition and metal-metal interaction for the nine catalysts
prepared. All weight loadings obtained using ICP-OES showed to be close to the theoretical
values, allowing for an accurate comparison between the catalysts using the various
characterization techniques.
(a)
(c)
(b)
(d)
81
Infrared spectroscopy does not give much insight into the metal-support interaction; however, it
did confirm the hygroscopic nature of alumina due to the presence of the broad hydroxyl peak at
~ 3200 cm-1 and the adsorbed water at 1600 cm-1. X-ray diffraction proved a useful tool to
determine the presence of copper clusters at higher weight loading (>13 wt % Cu). For the 5 wt
% catalysts, XRD has limited use in determining the crystallites for all catalysts, however, the S-
4.5Cu0.5Ag/γ-Al2O3 showed crystalline silver oxide present due to the silver being on the upper
layer resulting in well dispersed silver. A synergistic effect between the copper and silver were
observed under in situ conditions, whereby the presence of silver showed to increase in the d-
spacing values of the copper peaks, suggesting the presence of defect sites in the 4.5Cu0.5Ag/γ-
Al2O3 catalyst. The 4Cu1Ag/γ-Al2O3 catalyst did not show this behavior due to the silver having
a higher affinity to other silver atoms rather than copper atoms.
Surface area measurements showed a decrease in surface area with an increase in metal loading
as well as a decrease in surface area when silver was impregnated first, as shown with the S-
0.5Ag4.5Cu/γ-Al2O3 and S-1Ag4Cu/γ-Al2O3 catalysts. A few key differences were established
depending on the effect of impregnation with the 5 wt % bimetallic catalysts due to the ionic
radius of the metals, which showed to contribute significantly to the surface area measurements
and metal dispersion from chemisorption studies. An example is the S-0.5Ag4.5Cu/γ-Al2O3
catalyst, which showed a higher metal dispersion compared to when copper was impregnated
first. This trend remained consistent for the 4Cu1Ag/γ-Al2O3 catalysts.
Electron microscopy results showed that both the metals were well dispersed in all catalysts,
with copper forming larger agglomerates at higher weight loadings. The line scan proved to be
an effective method in determining distinct differences for particle composition of the sequential
and simultaneous bimetallic catalysts. Simultaneous impregnation showed copper to be evenly
dispersed across the support, with silver forming agglomerates in certain regions in addition to
be fairly dispersed across the support. The S-4.5Cu0.5Ag/γ-Al2O3 and S-0.5Ag4.5Cu/γ-Al2O3
showed that copper was well dispersed with silver forming smaller agglomerates across the
support, which was supported by XRD results.
The monometallic copper results were in correlation with literature, which showed well
dispersed copper particles across the surface of the support. Dispersion also depends on weight
loading with TPR differentiating between bulk CuO (~ 15 wt% Cu loading) and dispersed CuO

82
(~ 5 wt % loading). The TPD results showed acidity to vary with the impregnation sequence and
metal loading. The overall observation was that the presence of silver increased the basicity of
the catalyst as shown by the decreased acid sites concentration. TGA was used to determine the
thermal stability of the catalysts. The TGA results for selected catalysts showed them to be
thermally stable, with the weight loss being due to the removal of water.
83
Chapter 4 4. Catalytic Results and Discussion
The work carried out involved the hydrogenation of octanal in the presence of octene in a
competitive reaction environment. The catalysts used were CuAg/γ-Al2O3 with varied Cu-Ag
ratios. The catalysts were synthesized and characterized was discussed in Chapter 3.
The feed used consisted of 10 % octanal, 2 % octene and 88 % octanol to investigate the ability
of the catalyst to selectively hydrogenate the octanal whilst minimizing or inhibiting the
hydrogenation of the octene. Octanol is used as a diluent and is also the desired product from the
octanal hydrogenation. Studies have shown octanol as a diluent, to have no effect on the overall
result [197]. Due to the exothermic nature of octanal hydrogenation, the octanal quantity in the
feed was kept at 1 0%, with octene at 2 %, as it is a byproduct and serves as a model of an
unwanted component in an industrial feed. It has been reported that in the hydrogenation of
aldehydes, minor byproducts like 2-hexyl decanol, octyl octanoate, C16 diol, and C24 acetal
may form [60]. The undesired reaction forms octane from the hydrogenation of octene.
4.1. Optimization of reaction conditions using monometallic copper catalysts
Characterization showed that Cu/γ-Al2O3 has high surface area, with copper having a good
dispersion as shown from TPR and SEM-EDX studies (sections 3.8 and 3.9). Based on previous
work done on Cu/γ-Al2O3 catalysts, it was shown that this catalyst was stable for at least 28
hours [71], therefore, no time on stream reactions were conducted for the optimization study.
Reactions for this study were conducted over a period of 8 hours, and tested at three
temperatures (120, 140, and 160 °C). Pre-treatment of the catalyst involved drying under
nitrogen at 200 °C, thereafter reduced using 100 % hydrogen. The liquid feed was fed through a
continuous fixed bed reactor as explained in Chapter 2.
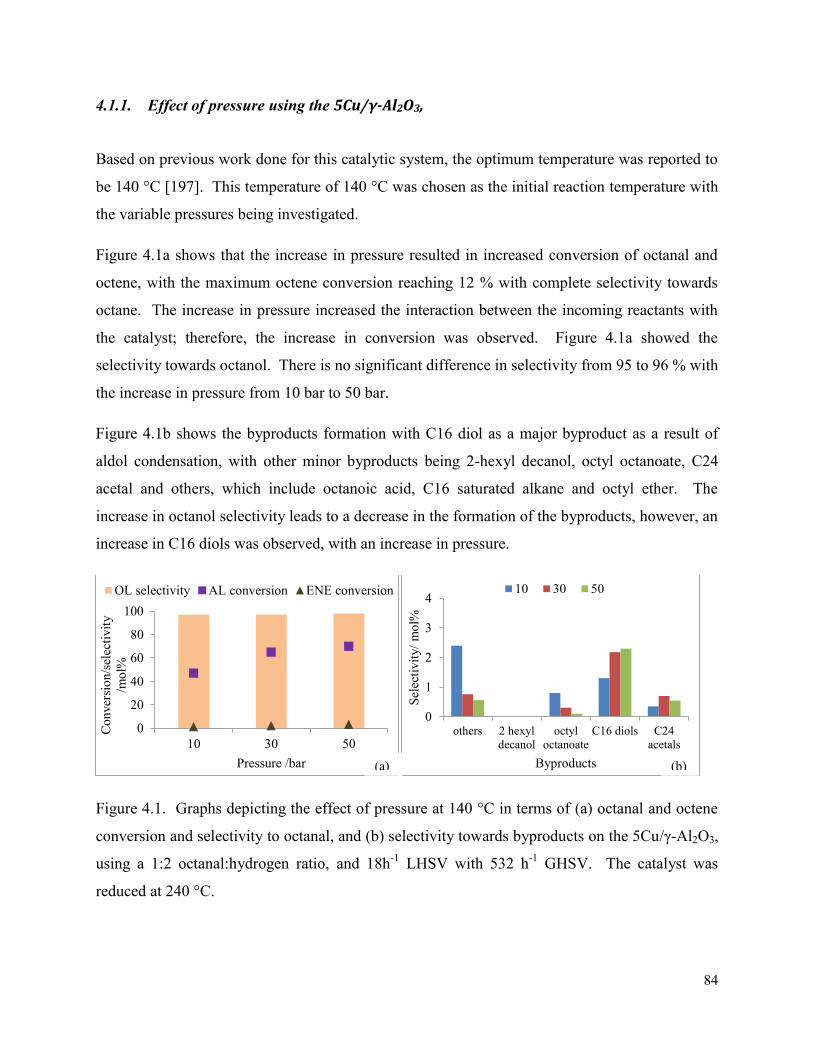
84
4.1.1. Effect of pressure using the 5Cu/γ-Al2O3,
Based on previous work done for this catalytic system, the optimum temperature was reported to
be 140 °C [197]. This temperature of 140 °C was chosen as the initial reaction temperature with
the variable pressures being investigated.
Figure 4.1a shows that the increase in pressure resulted in increased conversion of octanal and
octene, with the maximum octene conversion reaching 12 % with complete selectivity towards
octane. The increase in pressure increased the interaction between the incoming reactants with
the catalyst; therefore, the increase in conversion was observed. Figure 4.1a showed the
selectivity towards octanol. There is no significant difference in selectivity from 95 to 96 % with
the increase in pressure from 10 bar to 50 bar.
Figure 4.1b shows the byproducts formation with C16 diol as a major byproduct as a result of
aldol condensation, with other minor byproducts being 2-hexyl decanol, octyl octanoate, C24
acetal and others, which include octanoic acid, C16 saturated alkane and octyl ether. The
increase in octanol selectivity leads to a decrease in the formation of the byproducts, however, an
increase in C16 diols was observed, with an increase in pressure.
Figure 4.1. Graphs depicting the effect of pressure at 140 °C in terms of (a) octanal and octene
conversion and selectivity to octanal, and (b) selectivity towards byproducts on the 5Cu/γ-Al2O3,
using a 1:2 octanal:hydrogen ratio, and 18h-1 LHSV with 532 h-1 GHSV. The catalyst was
reduced at 240 °C.
0
20
40
60
80
100
10 30 50
Con
vers
ion/
sele
ctiv
ity
/mol
%
Pressure /bar
OL selectivity AL conversion ENE conversion
0
1
2
3
4
others 2 hexyldecanol
octyloctanoate
C16 diols C24acetals
Sele
ctiv
ity/ m
ol%
Byproducts
10 30 50
(a) (b)
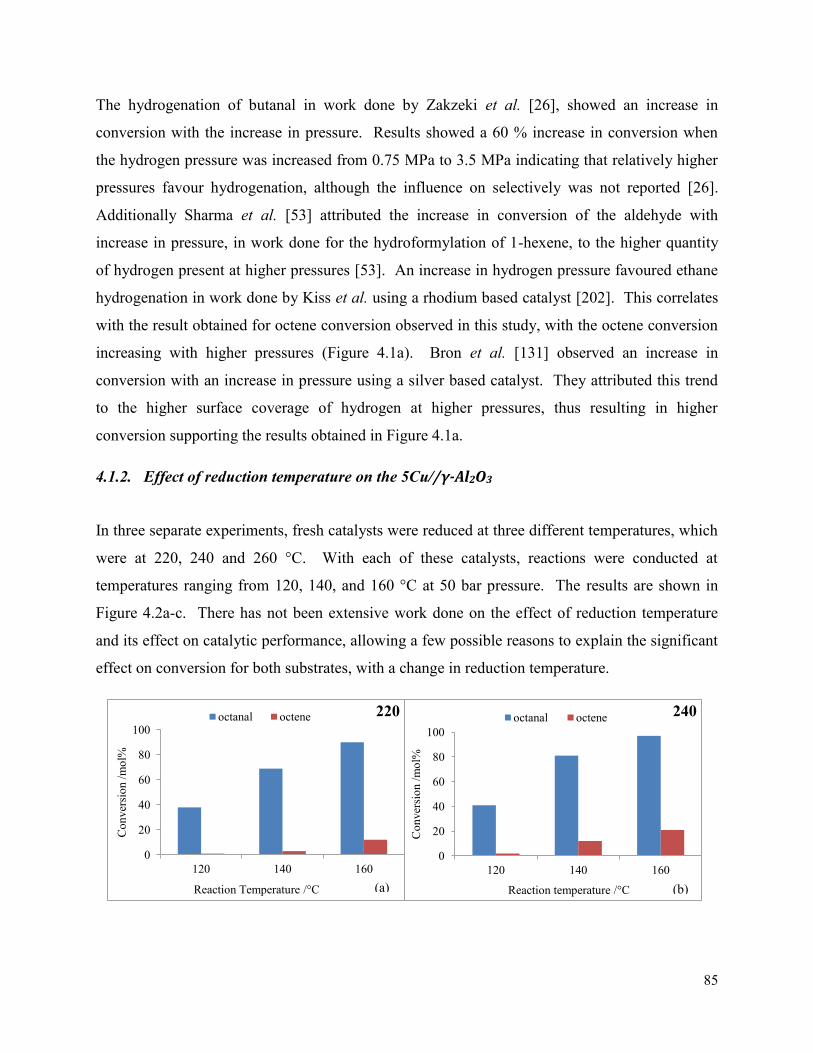
85
The hydrogenation of butanal in work done by Zakzeki et al. [26], showed an increase in
conversion with the increase in pressure. Results showed a 60 % increase in conversion when
the hydrogen pressure was increased from 0.75 MPa to 3.5 MPa indicating that relatively higher
pressures favour hydrogenation, although the influence on selectively was not reported [26].
Additionally Sharma et al. [53] attributed the increase in conversion of the aldehyde with
increase in pressure, in work done for the hydroformylation of 1-hexene, to the higher quantity
of hydrogen present at higher pressures [53]. An increase in hydrogen pressure favoured ethane
hydrogenation in work done by Kiss et al. using a rhodium based catalyst [202]. This correlates
with the result obtained for octene conversion observed in this study, with the octene conversion
increasing with higher pressures (Figure 4.1a). Bron et al. [131] observed an increase in
conversion with an increase in pressure using a silver based catalyst. They attributed this trend
to the higher surface coverage of hydrogen at higher pressures, thus resulting in higher
conversion supporting the results obtained in Figure 4.1a.
4.1.2. Effect of reduction temperature on the 5Cu//γ-Al2O3
In three separate experiments, fresh catalysts were reduced at three different temperatures, which
were at 220, 240 and 260 °C. With each of these catalysts, reactions were conducted at
temperatures ranging from 120, 140, and 160 °C at 50 bar pressure. The results are shown in
Figure 4.2a-c. There has not been extensive work done on the effect of reduction temperature
and its effect on catalytic performance, allowing a few possible reasons to explain the significant
effect on conversion for both substrates, with a change in reduction temperature.
0
20
40
60
80
100
120 140 160
Con
vers
ion
/mol
%
Reaction Temperature /°C
220 octanal octene
0
20
40
60
80
100
120 140 160
Con
vers
ion
/mol
%
Reaction temperature /°C
240 octanal octene
(a) (b)
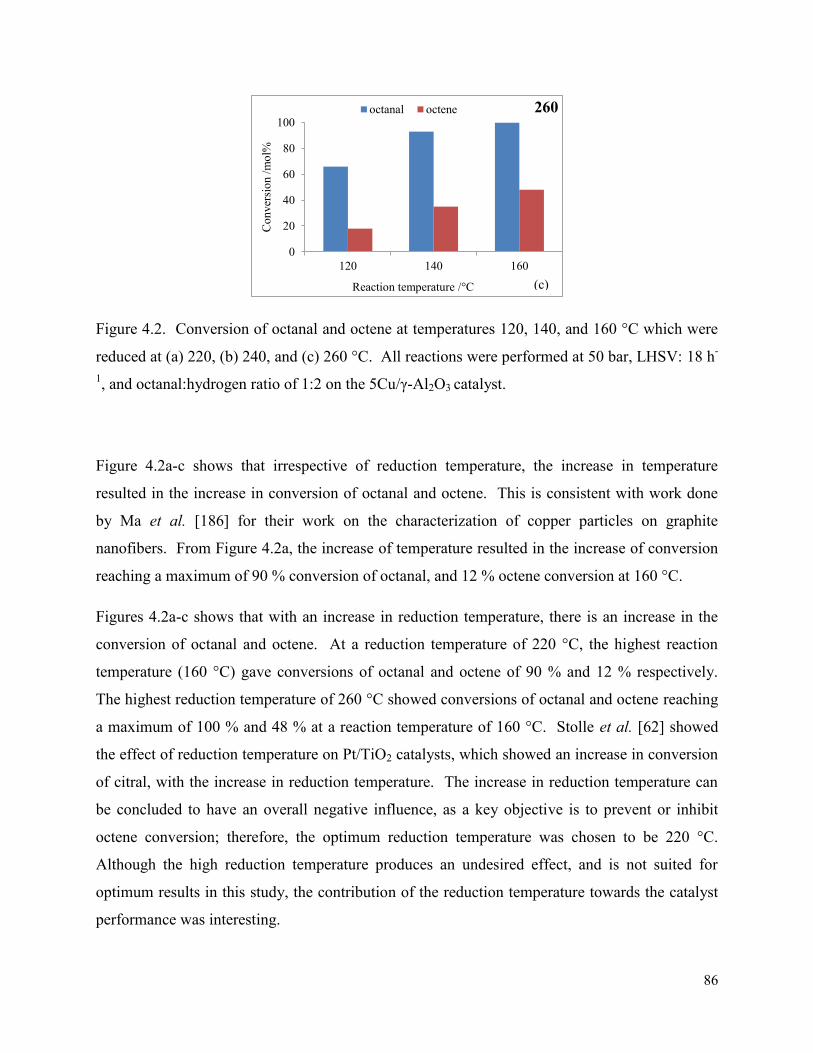
86
Figure 4.2. Conversion of octanal and octene at temperatures 120, 140, and 160 °C which were
reduced at (a) 220, (b) 240, and (c) 260 °C. All reactions were performed at 50 bar, LHSV: 18 h-
1, and octanal:hydrogen ratio of 1:2 on the 5Cu/γ-Al2O3 catalyst.
Figure 4.2a-c shows that irrespective of reduction temperature, the increase in temperature
resulted in the increase in conversion of octanal and octene. This is consistent with work done
by Ma et al. [186] for their work on the characterization of copper particles on graphite
nanofibers. From Figure 4.2a, the increase of temperature resulted in the increase of conversion
reaching a maximum of 90 % conversion of octanal, and 12 % octene conversion at 160 °C.
Figures 4.2a-c shows that with an increase in reduction temperature, there is an increase in the
conversion of octanal and octene. At a reduction temperature of 220 °C, the highest reaction
temperature (160 °C) gave conversions of octanal and octene of 90 % and 12 % respectively.
The highest reduction temperature of 260 °C showed conversions of octanal and octene reaching
a maximum of 100 % and 48 % at a reaction temperature of 160 °C. Stolle et al. [62] showed
the effect of reduction temperature on Pt/TiO2 catalysts, which showed an increase in conversion
of citral, with the increase in reduction temperature. The increase in reduction temperature can
be concluded to have an overall negative influence, as a key objective is to prevent or inhibit
octene conversion; therefore, the optimum reduction temperature was chosen to be 220 °C.
Although the high reduction temperature produces an undesired effect, and is not suited for
optimum results in this study, the contribution of the reduction temperature towards the catalyst
performance was interesting.
0
20
40
60
80
100
120 140 160C
onve
rsio
n /m
ol%
Reaction temperature /°C
260 octanal octene
(c)
87
Literature shows hydrogenation is favoured on certain types of sites, for example carbonyl
groups hydrogenate on large particles and planes, whereas alkene molecules prefer to
hydrogenate on edges and kinks [177]. This does not mean the hydrogenation of a specific
substrate is site exclusive to edges or corners, but merely provides information of the surface
interaction. Menon and Prasad [203] observed a similar result using a Cu-Al2O3-carbon catalyst
applied in dehydrogenation. The exponential increase in metal dispersion with the increase in
reduction temperature observed was attributed to the copper becoming more exposed on the
support surface. A characterization study of copper containing catalyst, by Dandekar and
Vannice [184], show that the increase of reduction temperature shows a lower CO chemisorption
uptake and the crystallite size calculated using XRD showed a minor increase. There are many
possible reasons, which could explain the increased activity, which would require a greater
understanding of the surface characteristics. There has been significant work done to investigate
the role of reduction temperature of copper catalysts, however it can be concluded from these
efforts that in-depth characterization and understanding of the copper metal on the surface are
important. The reasons are listed below:
(a) Sintering occurs when metal atoms become mobile and agglomerate on catalyst surface
[4, 5]. Sintering is favoured at high temperatures for prolonged periods of time, as it
provides sufficient energy for the metals to become mobile. At the highest reduction
temperature (260 °C), the catalyst is reduced under 100 % hydrogen for 12 hours. This
may provide a favorable environment for sintering to occur. Characterization studies
showed copper to be well dispersed at low weight loadings, as well as the possibility of
strong copper-alumina interaction and copper-aluminate phases present, which would
affect the hydrogenation capability of the catalyst. To prove sintering of copper after
reduction, the used catalyst characterization would assists in identifying key differences
between the catalysts reduced at different temperatures.
(b) Migration of copper could occur from the alumina lattice to the surface of the support. It
has been reported in literature that the increase in calcination temperature causes copper
atoms to migrate into the alumina lattice decreasing the amount of copper atoms on the
surface [171]. Calcination is a process where the catalyst is heated under flowing air to
convert the metal salts into metal oxide on the catalyst. Using a similar logic, the
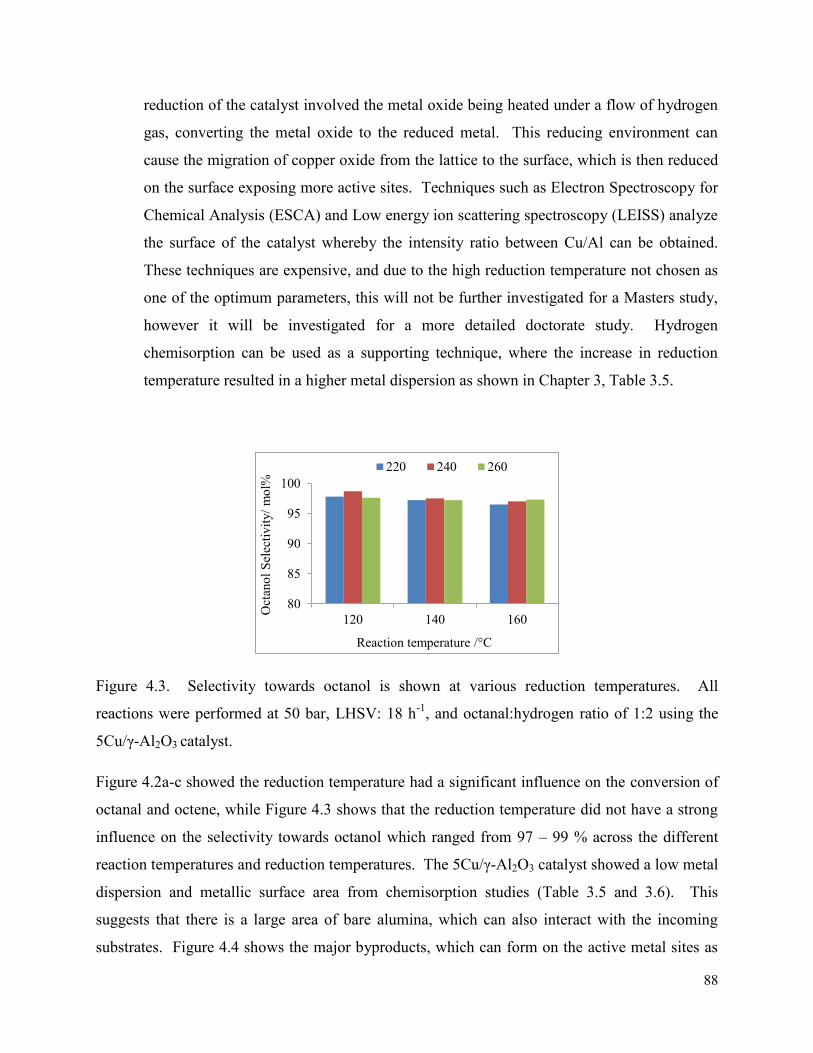
88
reduction of the catalyst involved the metal oxide being heated under a flow of hydrogen
gas, converting the metal oxide to the reduced metal. This reducing environment can
cause the migration of copper oxide from the lattice to the surface, which is then reduced
on the surface exposing more active sites. Techniques such as Electron Spectroscopy for
Chemical Analysis (ESCA) and Low energy ion scattering spectroscopy (LEISS) analyze
the surface of the catalyst whereby the intensity ratio between Cu/Al can be obtained.
These techniques are expensive, and due to the high reduction temperature not chosen as
one of the optimum parameters, this will not be further investigated for a Masters study,
however it will be investigated for a more detailed doctorate study. Hydrogen
chemisorption can be used as a supporting technique, where the increase in reduction
temperature resulted in a higher metal dispersion as shown in Chapter 3, Table 3.5.
Figure 4.3. Selectivity towards octanol is shown at various reduction temperatures. All
reactions were performed at 50 bar, LHSV: 18 h-1, and octanal:hydrogen ratio of 1:2 using the
5Cu/γ-Al2O3 catalyst.
Figure 4.2a-c showed the reduction temperature had a significant influence on the conversion of
octanal and octene, while Figure 4.3 shows that the reduction temperature did not have a strong
influence on the selectivity towards octanol which ranged from 97 – 99 % across the different
reaction temperatures and reduction temperatures. The 5Cu/γ-Al2O3 catalyst showed a low metal
dispersion and metallic surface area from chemisorption studies (Table 3.5 and 3.6). This
suggests that there is a large area of bare alumina, which can also interact with the incoming
substrates. Figure 4.4 shows the major byproducts, which can form on the active metal sites as
80
85
90
95
100
120 140 160Oct
anol
Sel
ectiv
ity/ m
ol%
Reaction temperature /°C
220 240 260
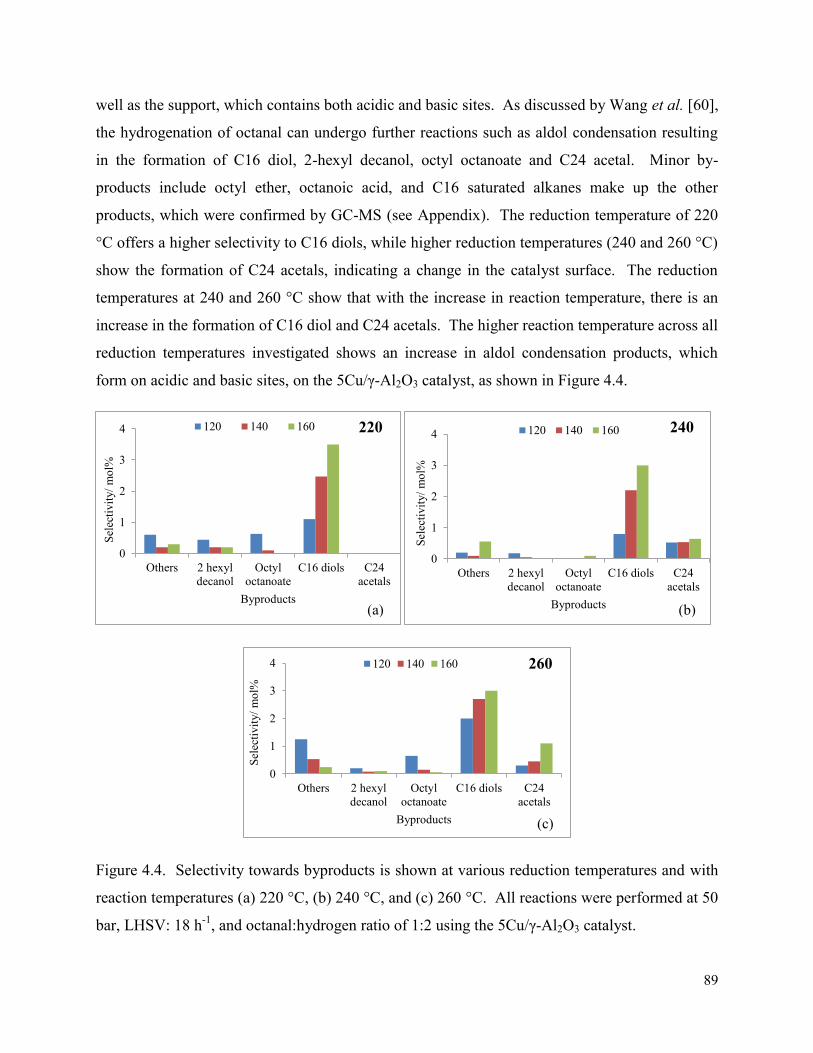
89
well as the support, which contains both acidic and basic sites. As discussed by Wang et al. [60],
the hydrogenation of octanal can undergo further reactions such as aldol condensation resulting
in the formation of C16 diol, 2-hexyl decanol, octyl octanoate and C24 acetal. Minor by-
products include octyl ether, octanoic acid, and C16 saturated alkanes make up the other
products, which were confirmed by GC-MS (see Appendix). The reduction temperature of 220
°C offers a higher selectivity to C16 diols, while higher reduction temperatures (240 and 260 °C)
show the formation of C24 acetals, indicating a change in the catalyst surface. The reduction
temperatures at 240 and 260 °C show that with the increase in reaction temperature, there is an
increase in the formation of C16 diol and C24 acetals. The higher reaction temperature across all
reduction temperatures investigated shows an increase in aldol condensation products, which
form on acidic and basic sites, on the 5Cu/γ-Al2O3 catalyst, as shown in Figure 4.4.
Figure 4.4. Selectivity towards byproducts is shown at various reduction temperatures and with
reaction temperatures (a) 220 °C, (b) 240 °C, and (c) 260 °C. All reactions were performed at 50
bar, LHSV: 18 h-1, and octanal:hydrogen ratio of 1:2 using the 5Cu/γ-Al2O3 catalyst.
0
1
2
3
4
Others 2 hexyldecanol
Octyloctanoate
C16 diols C24acetals
Sele
ctiv
ity/ m
ol%
Byproducts
120 140 160
0
1
2
3
4
Others 2 hexyldecanol
Octyloctanoate
C16 diols C24acetals
Sele
ctiv
ity/ m
ol%
Byproducts
120 140 160
0
1
2
3
4
Others 2 hexyldecanol
Octyloctanoate
C16 diols C24acetals
Sele
ctiv
ity/ m
ol%
Byproducts
120 140 160
220 240
260
(a) (b)
(c)
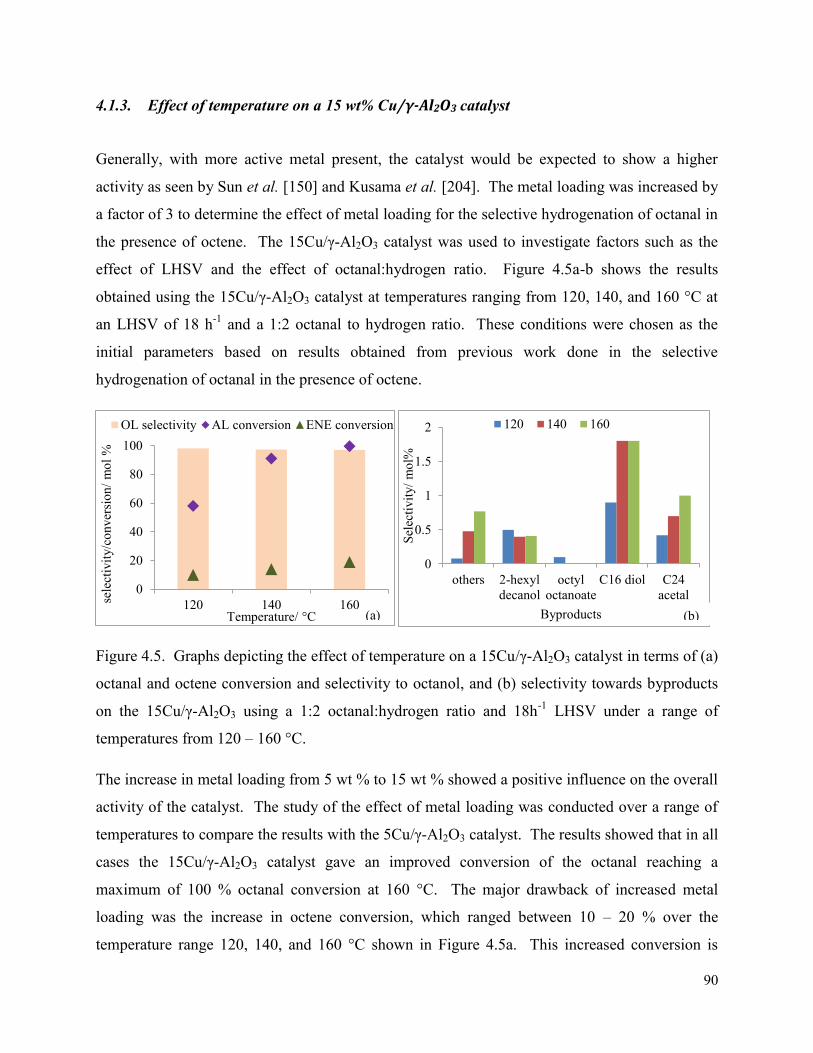
90
4.1.3. Effect of temperature on a 15 wt% Cu/γ-Al2O3 catalyst
Generally, with more active metal present, the catalyst would be expected to show a higher
activity as seen by Sun et al. [150] and Kusama et al. [204]. The metal loading was increased by
a factor of 3 to determine the effect of metal loading for the selective hydrogenation of octanal in
the presence of octene. The 15Cu/γ-Al2O3 catalyst was used to investigate factors such as the
effect of LHSV and the effect of octanal:hydrogen ratio. Figure 4.5a-b shows the results
obtained using the 15Cu/γ-Al2O3 catalyst at temperatures ranging from 120, 140, and 160 °C at
an LHSV of 18 h-1 and a 1:2 octanal to hydrogen ratio. These conditions were chosen as the
initial parameters based on results obtained from previous work done in the selective
hydrogenation of octanal in the presence of octene.
Figure 4.5. Graphs depicting the effect of temperature on a 15Cu/γ-Al2O3 catalyst in terms of (a)
octanal and octene conversion and selectivity to octanol, and (b) selectivity towards byproducts
on the 15Cu/γ-Al2O3 using a 1:2 octanal:hydrogen ratio and 18h-1 LHSV under a range of
temperatures from 120 – 160 °C.
The increase in metal loading from 5 wt % to 15 wt % showed a positive influence on the overall
activity of the catalyst. The study of the effect of metal loading was conducted over a range of
temperatures to compare the results with the 5Cu/γ-Al2O3 catalyst. The results showed that in all
cases the 15Cu/γ-Al2O3 catalyst gave an improved conversion of the octanal reaching a
maximum of 100 % octanal conversion at 160 °C. The major drawback of increased metal
loading was the increase in octene conversion, which ranged between 10 – 20 % over the
temperature range 120, 140, and 160 °C shown in Figure 4.5a. This increased conversion is
0
20
40
60
80
100
120 140 160sele
ctiv
ity/c
onve
rsio
n/ m
ol %
Temperature/ °C
OL selectivity AL conversion ENE conversion
0
0.5
1
1.5
2
others 2-hexyldecanol
octyloctanoate
C16 diol C24acetal
Sele
ctiv
ity/ m
ol%
Byproducts
120 140 160
(a) (b)
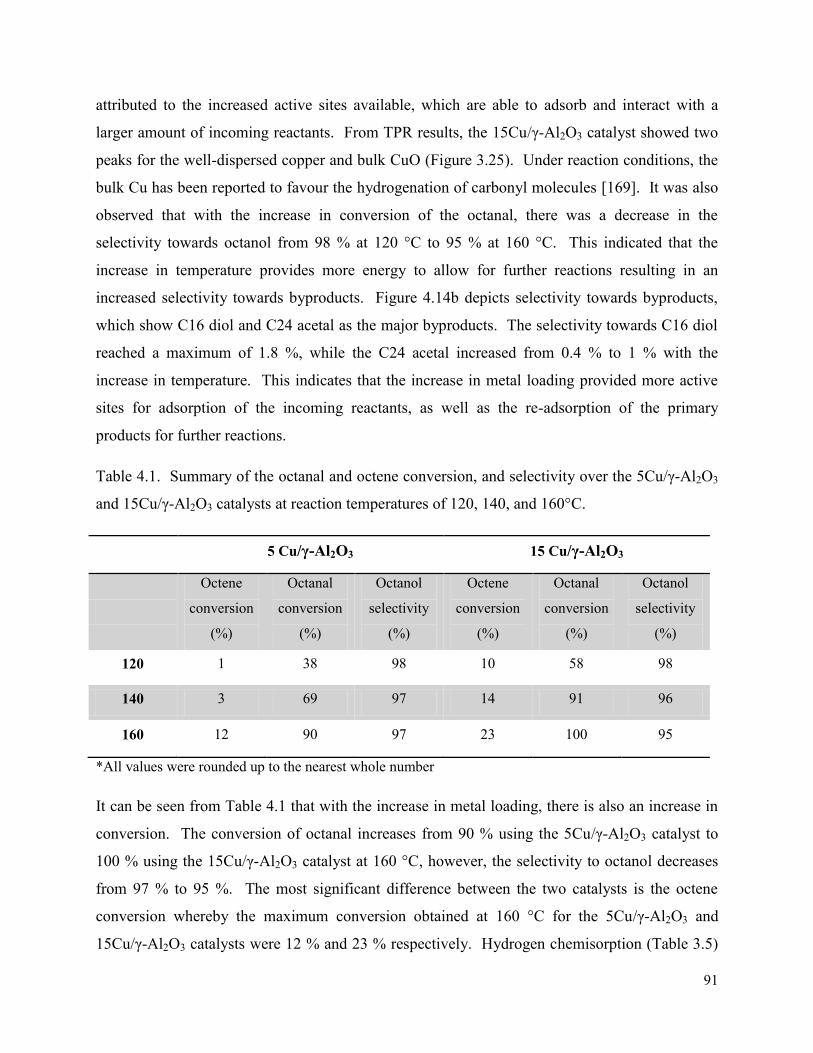
91
attributed to the increased active sites available, which are able to adsorb and interact with a
larger amount of incoming reactants. From TPR results, the 15Cu/γ-Al2O3 catalyst showed two
peaks for the well-dispersed copper and bulk CuO (Figure 3.25). Under reaction conditions, the
bulk Cu has been reported to favour the hydrogenation of carbonyl molecules [169]. It was also
observed that with the increase in conversion of the octanal, there was a decrease in the
selectivity towards octanol from 98 % at 120 °C to 95 % at 160 °C. This indicated that the
increase in temperature provides more energy to allow for further reactions resulting in an
increased selectivity towards byproducts. Figure 4.14b depicts selectivity towards byproducts,
which show C16 diol and C24 acetal as the major byproducts. The selectivity towards C16 diol
reached a maximum of 1.8 %, while the C24 acetal increased from 0.4 % to 1 % with the
increase in temperature. This indicates that the increase in metal loading provided more active
sites for adsorption of the incoming reactants, as well as the re-adsorption of the primary
products for further reactions.
Table 4.1. Summary of the octanal and octene conversion, and selectivity over the 5Cu/γ-Al2O3
and 15Cu/γ-Al2O3 catalysts at reaction temperatures of 120, 140, and 160°C.
5 Cu/γ-Al2O3 15 Cu/γ-Al2O3
Octene
conversion
(%)
Octanal
conversion
(%)
Octanol
selectivity
(%)
Octene
conversion
(%)
Octanal
conversion
(%)
Octanol
selectivity
(%)
120 1 38 98 10 58 98
140 3 69 97 14 91 96
160 12 90 97 23 100 95
*All values were rounded up to the nearest whole number
It can be seen from Table 4.1 that with the increase in metal loading, there is also an increase in
conversion. The conversion of octanal increases from 90 % using the 5Cu/γ-Al2O3 catalyst to
100 % using the 15Cu/γ-Al2O3 catalyst at 160 °C, however, the selectivity to octanol decreases
from 97 % to 95 %. The most significant difference between the two catalysts is the octene
conversion whereby the maximum conversion obtained at 160 °C for the 5Cu/γ-Al2O3 and
15Cu/γ-Al2O3 catalysts were 12 % and 23 % respectively. Hydrogen chemisorption (Table 3.5)
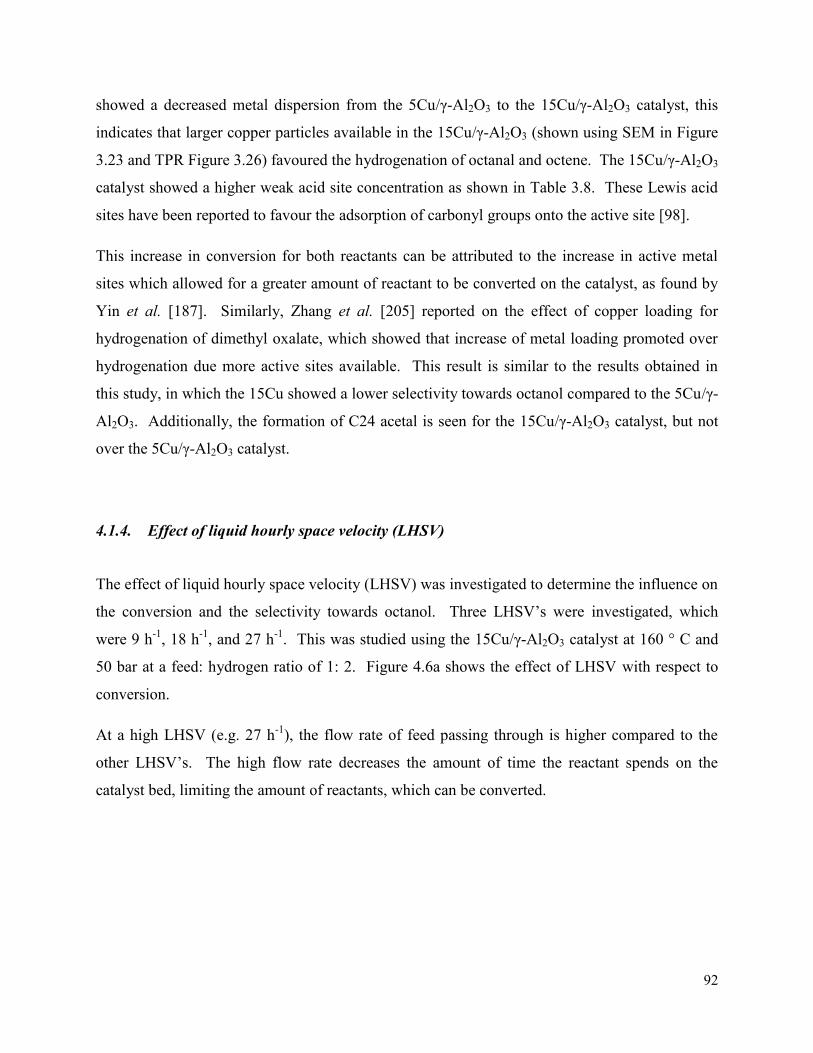
92
showed a decreased metal dispersion from the 5Cu/γ-Al2O3 to the 15Cu/γ-Al2O3 catalyst, this
indicates that larger copper particles available in the 15Cu/γ-Al2O3 (shown using SEM in Figure
3.23 and TPR Figure 3.26) favoured the hydrogenation of octanal and octene. The 15Cu/γ-Al2O3
catalyst showed a higher weak acid site concentration as shown in Table 3.8. These Lewis acid
sites have been reported to favour the adsorption of carbonyl groups onto the active site [98].
This increase in conversion for both reactants can be attributed to the increase in active metal
sites which allowed for a greater amount of reactant to be converted on the catalyst, as found by
Yin et al. [187]. Similarly, Zhang et al. [205] reported on the effect of copper loading for
hydrogenation of dimethyl oxalate, which showed that increase of metal loading promoted over
hydrogenation due more active sites available. This result is similar to the results obtained in
this study, in which the 15Cu showed a lower selectivity towards octanol compared to the 5Cu/γ-
Al2O3. Additionally, the formation of C24 acetal is seen for the 15Cu/γ-Al2O3 catalyst, but not
over the 5Cu/γ-Al2O3 catalyst.
4.1.4. Effect of liquid hourly space velocity (LHSV)
The effect of liquid hourly space velocity (LHSV) was investigated to determine the influence on
the conversion and the selectivity towards octanol. Three LHSV’s were investigated, which
were 9 h-1, 18 h-1, and 27 h-1. This was studied using the 15Cu/γ-Al2O3 catalyst at 160 ° C and
50 bar at a feed: hydrogen ratio of 1: 2. Figure 4.6a shows the effect of LHSV with respect to
conversion.
At a high LHSV (e.g. 27 h-1), the flow rate of feed passing through is higher compared to the
other LHSV’s. The high flow rate decreases the amount of time the reactant spends on the
catalyst bed, limiting the amount of reactants, which can be converted.
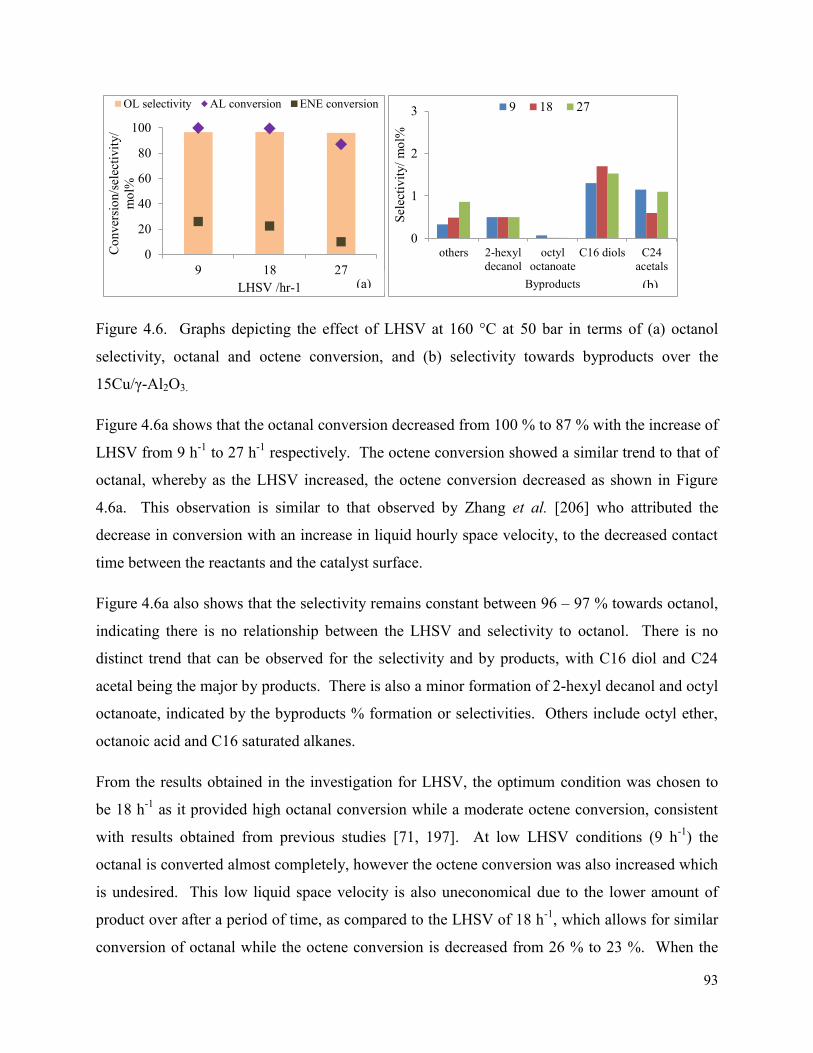
93
Figure 4.6. Graphs depicting the effect of LHSV at 160 °C at 50 bar in terms of (a) octanol
selectivity, octanal and octene conversion, and (b) selectivity towards byproducts over the
15Cu/γ-Al2O3.
Figure 4.6a shows that the octanal conversion decreased from 100 % to 87 % with the increase of
LHSV from 9 h-1 to 27 h-1 respectively. The octene conversion showed a similar trend to that of
octanal, whereby as the LHSV increased, the octene conversion decreased as shown in Figure
4.6a. This observation is similar to that observed by Zhang et al. [206] who attributed the
decrease in conversion with an increase in liquid hourly space velocity, to the decreased contact
time between the reactants and the catalyst surface.
Figure 4.6a also shows that the selectivity remains constant between 96 – 97 % towards octanol,
indicating there is no relationship between the LHSV and selectivity to octanol. There is no
distinct trend that can be observed for the selectivity and by products, with C16 diol and C24
acetal being the major by products. There is also a minor formation of 2-hexyl decanol and octyl
octanoate, indicated by the byproducts % formation or selectivities. Others include octyl ether,
octanoic acid and C16 saturated alkanes.
From the results obtained in the investigation for LHSV, the optimum condition was chosen to
be 18 h-1 as it provided high octanal conversion while a moderate octene conversion, consistent
with results obtained from previous studies [71, 197]. At low LHSV conditions (9 h-1) the
octanal is converted almost completely, however the octene conversion was also increased which
is undesired. This low liquid space velocity is also uneconomical due to the lower amount of
product over after a period of time, as compared to the LHSV of 18 h-1, which allows for similar
conversion of octanal while the octene conversion is decreased from 26 % to 23 %. When the
0
20
40
60
80
100
9 18 27
Con
vers
ion/
sele
ctiv
ity/
mol
%
LHSV /hr-1
OL selectivity AL conversion ENE conversion
0
1
2
3
others 2-hexyldecanol
octyloctanoate
C16 diols C24acetals
Sele
ctiv
ity/ m
ol%
Byproducts
9 18 27
(b) (a)
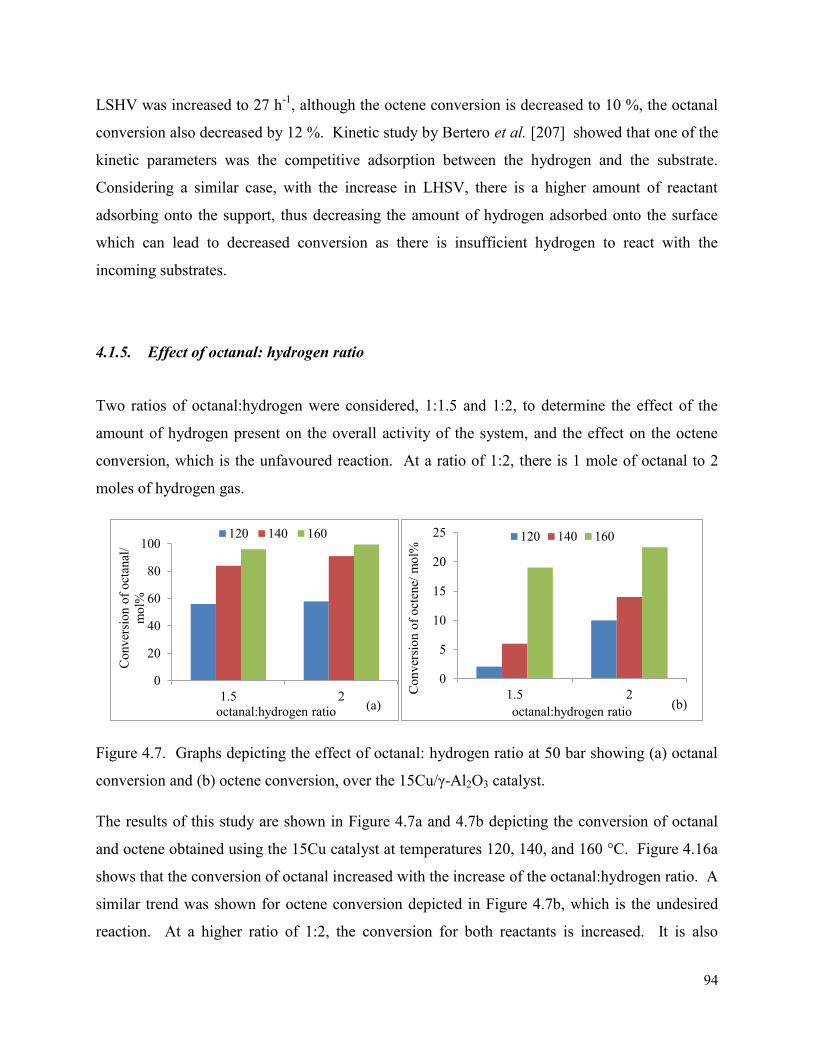
94
LSHV was increased to 27 h-1, although the octene conversion is decreased to 10 %, the octanal
conversion also decreased by 12 %. Kinetic study by Bertero et al. [207] showed that one of the
kinetic parameters was the competitive adsorption between the hydrogen and the substrate.
Considering a similar case, with the increase in LHSV, there is a higher amount of reactant
adsorbing onto the support, thus decreasing the amount of hydrogen adsorbed onto the surface
which can lead to decreased conversion as there is insufficient hydrogen to react with the
incoming substrates.
4.1.5. Effect of octanal: hydrogen ratio
Two ratios of octanal:hydrogen were considered, 1:1.5 and 1:2, to determine the effect of the
amount of hydrogen present on the overall activity of the system, and the effect on the octene
conversion, which is the unfavoured reaction. At a ratio of 1:2, there is 1 mole of octanal to 2
moles of hydrogen gas.
Figure 4.7. Graphs depicting the effect of octanal: hydrogen ratio at 50 bar showing (a) octanal
conversion and (b) octene conversion, over the 15Cu/γ-Al2O3 catalyst.
The results of this study are shown in Figure 4.7a and 4.7b depicting the conversion of octanal
and octene obtained using the 15Cu catalyst at temperatures 120, 140, and 160 °C. Figure 4.16a
shows that the conversion of octanal increased with the increase of the octanal:hydrogen ratio. A
similar trend was shown for octene conversion depicted in Figure 4.7b, which is the undesired
reaction. At a higher ratio of 1:2, the conversion for both reactants is increased. It is also
0
20
40
60
80
100
1.5 2
Con
vers
ion
of o
ctan
al/
mol
%
octanal:hydrogen ratio
120 140 160
0
5
10
15
20
25
1.5 2Con
vers
ion
of o
cten
e/ m
ol%
octanal:hydrogen ratio
120 140 160
(a) (b)
95
observed that with the increase in temperature, the difference in conversion of octene between
the two ratios decreases e.g. at 120 °C the difference in the two octanal:hydrogen ratios is 8%,
whereas, the difference at 160 °C is 4 %.
It is common that the hydrogen is in excess to allow for higher activity, such as in work done in
crotonaldehyde hydrogenation by Ashour et al. [159], who used a 1:14 ratio of subrate:hydrogen
ratio, with Bron et al. [131] using a ratio of 1:20 for the substrate to hydrogen ratio in acrolein
hydrogenation. Bridier et al. [68] showed in their work in the partial hydrogenation of propyne
that with an increase in the hydrogen:substrate ratio, there was an increase in conversion. The
selectivity towards propene showed an initial increase to the propene, thereafter a decrease with
the increase in ratio along with temperature, resulting in a greater formation of the saturated,
undesired product.
Figure 4.8. Graphs depicting the effect of octanal:hydrogen ratio at 50 bar for selectivity
towards (a) octanol and (b) byproducts at 1:1.5 octanal:hydrogen ratio and (c) byproducts at 1:2
octanal:hydrogen ratio over the 15Cu/γ-Al2O3 catalyst.
80
85
90
95
100
120 140 160
Sele
ctiv
ity to
oct
anol
/ m
ol%
Temperature/ °C
1:1.5 1:2
0
0.5
1
1.5
2
others 2 hexyldecanol
octyloctanoate
C16 diol C24acetal
Sele
ctiv
ity/ m
ol%
Byproducts
120 140 160
0
0.5
1
1.5
2
others 2 hexyldecanol
octyloctanoate
C16 diol C24acetal
Sele
ctiv
ity/ m
ol%
Byproducts
120 140 160
(a)
(b) (c)
96
Figure 4.8a shows the selectivity towards octanol at temperatures 120 – 160 °C. At 120 °C, the
selectivities towards octanol are 96 and 98 %, at ratios 1:1.5 and 1:2 respectively, and with the
increase in temperature to 160 °C, the selectivity towards octanol at both ratios is approximately
97 %. This indicates why 160 °C was chosen as the optimum temperature, as it allows for
maximum octanal conversion, while selectivity remains unchanged compared to a lower octanal:
hydrogen ratio.
Figure 4.8b-c showed the selectivity towards byproduct formation where C16 diol and C24
acetal were the major byproducts. The excess hydrogen present allowed for further reactions
with the incoming octanal molecules and the adsorbed hydrogen present. At a ratio of 1:2, there
is an overall lower formation of C24 acetal, which resulted from the increased adsorbed
hydrogen on the surface reducing the re-adsorption of octanal and octanol molecules thus
reducing the C24 acetal formation. Other minor by products included 2-hexyl decanol, octyl
octanoate and others, which are made up of octyl ether, C16 saturated alkanes and octanoic acid.
4.2. Copper-silver bimetallic catalysts
As mentioned in chapter 1, silver was shown to be effective in the selective hydrogenation of
α,β-unsaturated aldehydes [50, 123, 208]. For this reason, silver was chosen to be incorporated
into the Cu/γ-Al2O3 system to improve the catalyst properties or behavior. The effect of silver
was investigated by preparing and testing a range of seven γ-Al2O3 supported CuAg bimetallic
catalysts. A few key factors were established; namely a suitable total weight loading, the weight
loading of silver, and the impregnation technique. As mentioned in Chapter 2, the simultaneous
impregnation involved adding both metals to the γ-Al2O3 at the same time, while sequential
impregnation involved the addition if the first metal which is stirred and dried, followed by the
addition of the second metal, with the final step being calcination.
These CuAg bimetallic catalysts were characterization and discussed in Chapter 3.
Chemisorption studies indicated that the 5 wt % bimetallic catalysts prepared by simultaneous
impregnation improved metal dispersion (Chapter 3, Table 3.5) and showed a decrease in the
onset temperature for copper reduction (Figure 3.27) compared to the 5 wt % monometallic
copper catalyst (Figure 3.26). A substantial amount of work done towards the characterization of
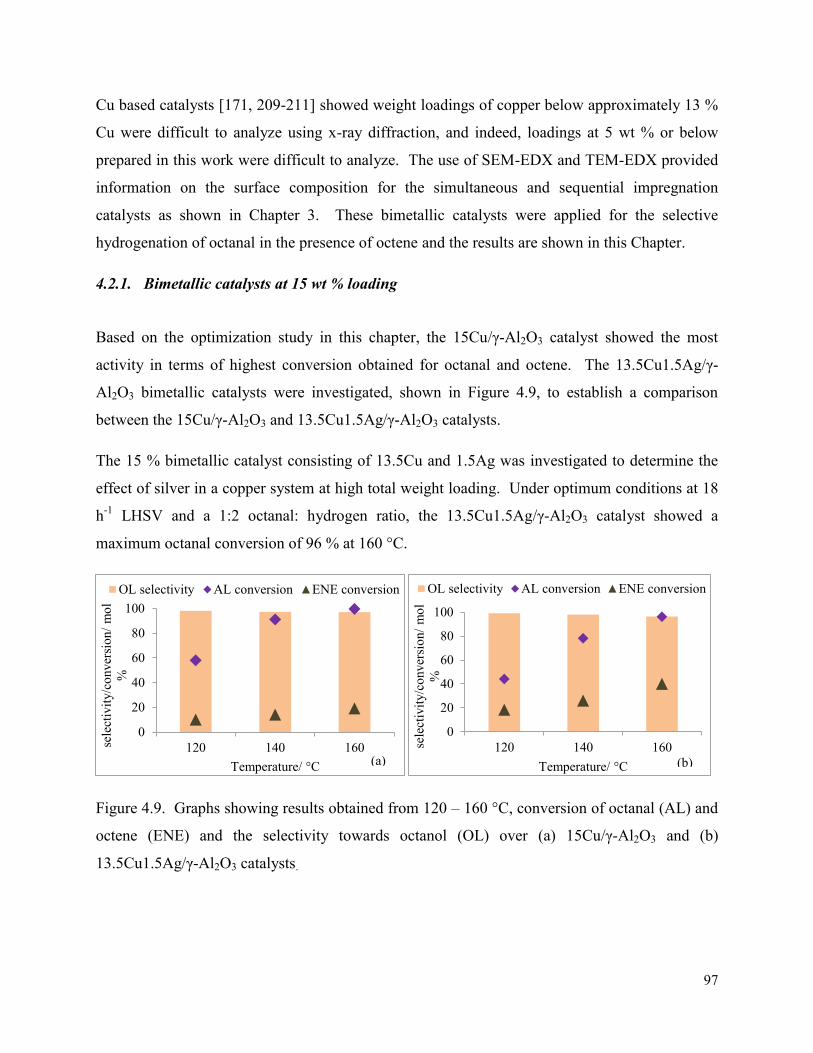
97
Cu based catalysts [171, 209-211] showed weight loadings of copper below approximately 13 %
Cu were difficult to analyze using x-ray diffraction, and indeed, loadings at 5 wt % or below
prepared in this work were difficult to analyze. The use of SEM-EDX and TEM-EDX provided
information on the surface composition for the simultaneous and sequential impregnation
catalysts as shown in Chapter 3. These bimetallic catalysts were applied for the selective
hydrogenation of octanal in the presence of octene and the results are shown in this Chapter.
4.2.1. Bimetallic catalysts at 15 wt % loading
Based on the optimization study in this chapter, the 15Cu/γ-Al2O3 catalyst showed the most
activity in terms of highest conversion obtained for octanal and octene. The 13.5Cu1.5Ag/γ-
Al2O3 bimetallic catalysts were investigated, shown in Figure 4.9, to establish a comparison
between the 15Cu/γ-Al2O3 and 13.5Cu1.5Ag/γ-Al2O3 catalysts.
The 15 % bimetallic catalyst consisting of 13.5Cu and 1.5Ag was investigated to determine the
effect of silver in a copper system at high total weight loading. Under optimum conditions at 18
h-1 LHSV and a 1:2 octanal: hydrogen ratio, the 13.5Cu1.5Ag/γ-Al2O3 catalyst showed a
maximum octanal conversion of 96 % at 160 °C.
Figure 4.9. Graphs showing results obtained from 120 – 160 °C, conversion of octanal (AL) and
octene (ENE) and the selectivity towards octanol (OL) over (a) 15Cu/γ-Al2O3 and (b)
13.5Cu1.5Ag/γ-Al2O3 catalysts.
0
20
40
60
80
100
120 140 160sele
ctiv
ity/c
onve
rsio
n/ m
ol
%
Temperature/ °C
OL selectivity AL conversion ENE conversion
0
20
40
60
80
100
120 140 160sele
ctiv
ity/c
onve
rsio
n/ m
ol
%
Temperature/ °C
OL selectivity AL conversion ENE conversion
(a) (b)
98
Figure 4.9a-b showed the increase in conversion with temperature, for both the octanal and
octene using the 15Cu/γ-Al2O3 and 13.5Cu1.5Ag/γ-Al2O3 catalysts. The octene conversion
obtained for the 13.5Cu1.5Ag/γ-Al2O3 ranged from 18 % to 40 %, over the temperatures 120,
140, and 160 °C. This octene conversion for 13.5Cu1.5Ag/γ-Al2O3 was significantly higher
compared to the conversion over the monometallic 15Cu/γ-Al2O3 catalyst, which showed a
maximum of 22.5 % at 160 °C (Figure 4.9a), thus indicating that the presence of silver had a
negative influence for the selective hydrogenation of octanal. A range of temperatures was
investigated to observe the stability of the bimetallic catalysts, as it is known that silver reduces
below 100 °C [121]. With higher temperatures, this may have caused agglomeration of silver
which may reduce the synergistic effect of the bimetallic catalyst. It was also important to
investigate the mobility of silver in the sequential catalysts, if the impregnation sequence
contributed to the metal dispersion and mobility of the metals under reaction conditions.
The difference in the catalytic results could be explained from the results obtained from SEM-
EDX. The SEM-EDX results (Figure 3.23) shown in chapter 3 showed the 15Cu/γ-Al2O3
catalyst formed small clusters in certain regions, with an overall good dispersion across the
catalyst surface. The close contact between the silver and copper particles for the
13.5Cu1.5Ag/γ-Al2O3 catalyst showed a shift to a lower reduction temperature observed in TPR
analysis, most likely due to the synergistic effect (Figure 3.25). This could result in a more
favourable environment for the adsorption of octene, which has been reported to adsorb onto
more basic sites [124], which could be seen from the decrease in acidity shown in the TPD
results (Table 3.8).
The difference observed between the monometallic and bimetallic 15 wt % catalysts can be
attributed to the synergistic effect between the copper and silver metals resulting in an increased
selectivity towards octanol, where the octanol selectivity at 160 °C for the 15Cu/γ-Al2O3 and
13.5Cu1.5Ag/γ-Al2O3 catalysts are 95 % and 96 % respectively. This synergistic effect also
promoted higher octene conversion, which is an undesired result. This increase in octene
conversion for the 13.5Cu1.5Ag/γ-Al2O3 catalyst could be a result of octene or dissociated
hydrogen on the surface becoming mobile on the silver particles, which increases the interaction
between the reactants and hydrogen available, which resulted in higher octene conversion. The
use of the 13.5Cu1.5Ag/γ-Al2O3 catalyst, although with the increase the octanol selectivity,
99
showed a lower octanal conversion and higher octene conversion. This makes this catalyst less
suitable for selective hydrogenation of octanal in the presence of octene. Sun et al. [150] showed
the effect of silver loading on copper-based catalysts for the hydrogenolysis of glycerol to 1,2-
propanediol. Silver weight loading, catalyst weight and the reaction conditions are the key
parameters for their selectivity towards the desired product, 1,2 propanediol. Under the same
reaction conditions, an increase in the silver weight loading showed to maintain the conversion,
while decreasing selectivity to 1,2 propanediol.
Selectivity towards octanol
Figure 4.9b shows that the 13.5Cu1.5Ag/γ-Al2O3 catalyst has a higher selectivity towards
octanol at temperatures 120 and 140 °C compared to Figure 4.9a. It was also shown that with
the increase in temperature, a general trend for both the 15Cu/γ-Al2O3 and 13.5Cu1.5Ag/γ-Al2O3
showed a decrease in octanol selectivity. This may be due to the higher amount of kinetic energy
in the system which also allows for byproduct formation.
Selectivity towards byproducts
Figure 4.10a-b shows the selectivity towards byproducts for the 15Cu/γ-Al2O3 and
13.5Cu1.5Ag/γ-Al2O3 catalysts. The decrease in selectivity towards octanol resulted in a higher
selectivity towards the byproducts, as shown in Figure 4.10b, with the major byproducts being
the C16 diol and C24 acetal, similar to that observed with the 15Cu catalyst (Figure 4.10a).
These byproducts formed on both acidic and basic sites with the C16 diol forming as a result of
aldol condensation and C24 acetals forming on the Lewis acid sites [71]. These major
byproducts showed to increase significantly with temperature together with a minor formation of
2-hexyl decanol, which is a result of aldol condensation, while a reduction in the formation of
octyl octanoate was observed. “Others” include octanoic acid, and C16 saturated alkanes.
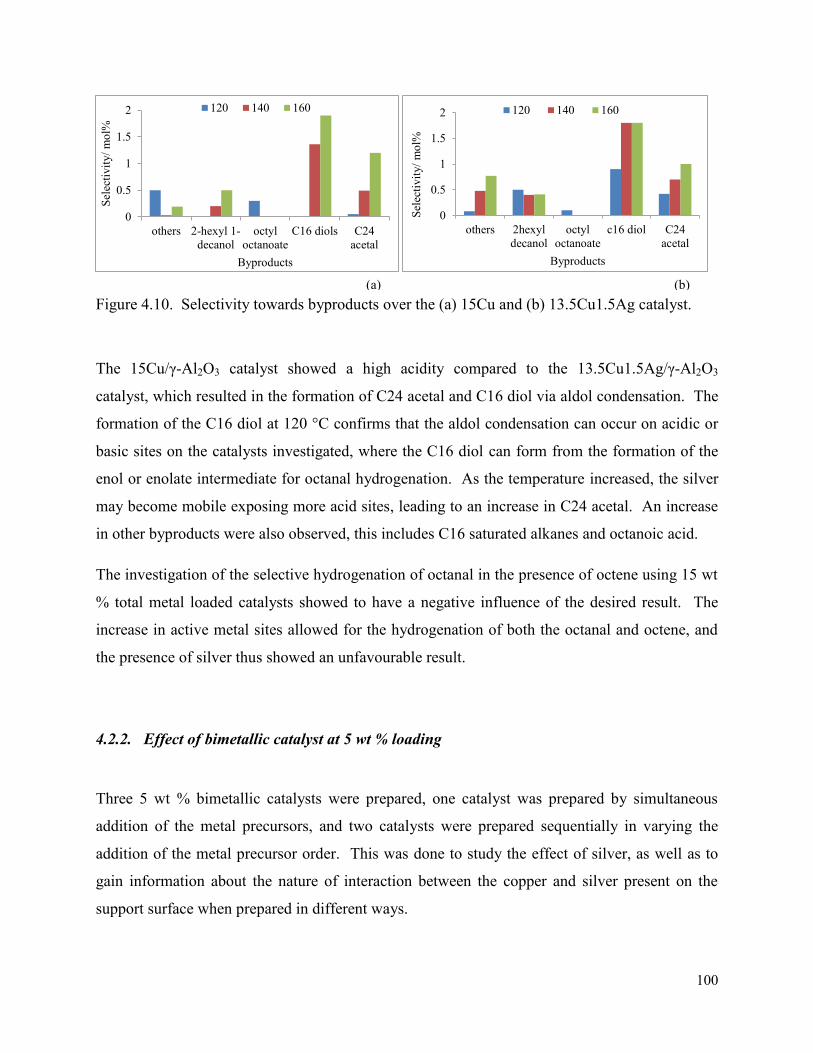
100
Figure 4.10. Selectivity towards byproducts over the (a) 15Cu and (b) 13.5Cu1.5Ag catalyst.
The 15Cu/γ-Al2O3 catalyst showed a high acidity compared to the 13.5Cu1.5Ag/γ-Al2O3
catalyst, which resulted in the formation of C24 acetal and C16 diol via aldol condensation. The
formation of the C16 diol at 120 °C confirms that the aldol condensation can occur on acidic or
basic sites on the catalysts investigated, where the C16 diol can form from the formation of the
enol or enolate intermediate for octanal hydrogenation. As the temperature increased, the silver
may become mobile exposing more acid sites, leading to an increase in C24 acetal. An increase
in other byproducts were also observed, this includes C16 saturated alkanes and octanoic acid.
The investigation of the selective hydrogenation of octanal in the presence of octene using 15 wt
% total metal loaded catalysts showed to have a negative influence of the desired result. The
increase in active metal sites allowed for the hydrogenation of both the octanal and octene, and
the presence of silver thus showed an unfavourable result.
4.2.2. Effect of bimetallic catalyst at 5 wt % loading
Three 5 wt % bimetallic catalysts were prepared, one catalyst was prepared by simultaneous
addition of the metal precursors, and two catalysts were prepared sequentially in varying the
addition of the metal precursor order. This was done to study the effect of silver, as well as to
gain information about the nature of interaction between the copper and silver present on the
support surface when prepared in different ways.
0
0.5
1
1.5
2
others 2-hexyl 1-decanol
octyloctanoate
C16 diols C24acetal
Sele
ctiv
ity/ m
ol%
Byproducts
120 140 160
0
0.5
1
1.5
2
others 2hexyldecanol
octyloctanoate
c16 diol C24acetal
Sele
ctiv
ity/ m
ol%
Byproducts
120 140 160
(a) (b)
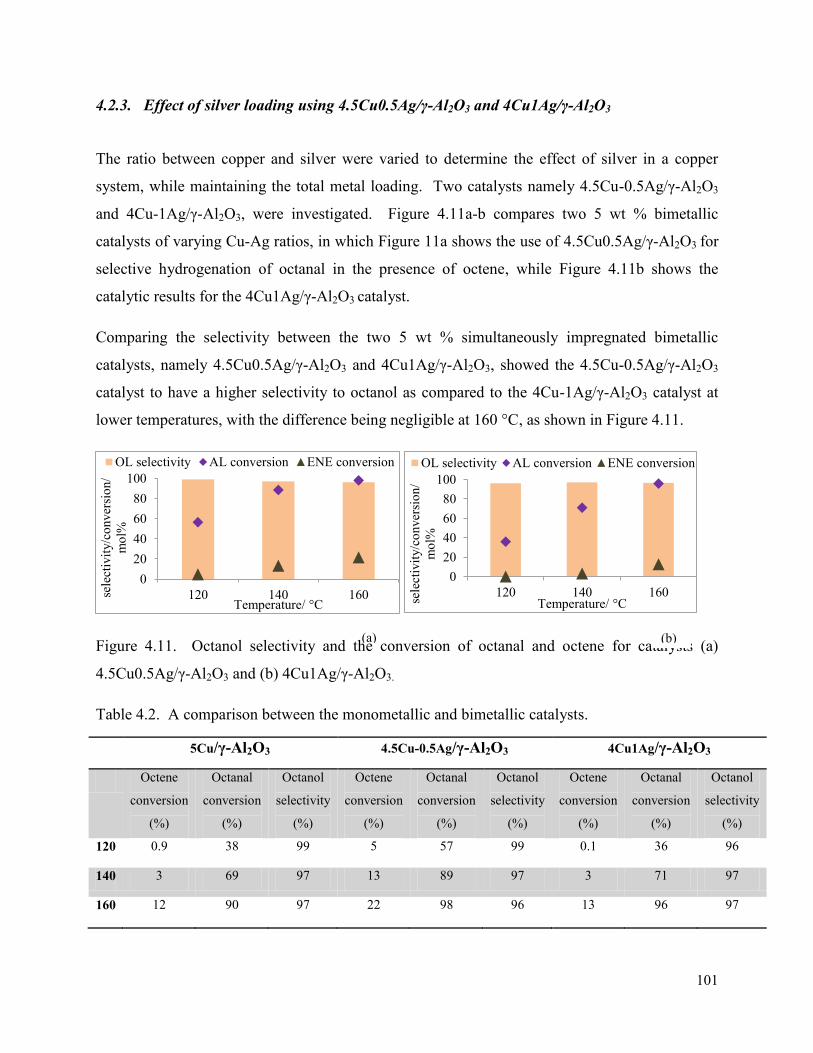
101
4.2.3. Effect of silver loading using 4.5Cu0.5Ag/γ-Al2O3 and 4Cu1Ag/γ-Al2O3
The ratio between copper and silver were varied to determine the effect of silver in a copper
system, while maintaining the total metal loading. Two catalysts namely 4.5Cu-0.5Ag/γ-Al2O3
and 4Cu-1Ag/γ-Al2O3, were investigated. Figure 4.11a-b compares two 5 wt % bimetallic
catalysts of varying Cu-Ag ratios, in which Figure 11a shows the use of 4.5Cu0.5Ag/γ-Al2O3 for
selective hydrogenation of octanal in the presence of octene, while Figure 4.11b shows the
catalytic results for the 4Cu1Ag/γ-Al2O3 catalyst.
Comparing the selectivity between the two 5 wt % simultaneously impregnated bimetallic
catalysts, namely 4.5Cu0.5Ag/γ-Al2O3 and 4Cu1Ag/γ-Al2O3, showed the 4.5Cu-0.5Ag/γ-Al2O3
catalyst to have a higher selectivity to octanol as compared to the 4Cu-1Ag/γ-Al2O3 catalyst at
lower temperatures, with the difference being negligible at 160 °C, as shown in Figure 4.11.
Figure 4.11. Octanol selectivity and the conversion of octanal and octene for catalysts (a)
4.5Cu0.5Ag/γ-Al2O3 and (b) 4Cu1Ag/γ-Al2O3.
Table 4.2. A comparison between the monometallic and bimetallic catalysts. 5Cu/γ-Al2O3 4.5Cu-0.5Ag/γ-Al2O3 4Cu1Ag/γ-Al2O3
Octene
conversion
(%)
Octanal
conversion
(%)
Octanol
selectivity
(%)
Octene
conversion
(%)
Octanal
conversion
(%)
Octanol
selectivity
(%)
Octene
conversion
(%)
Octanal
conversion
(%)
Octanol
selectivity
(%)
120 0.9 38 99 5 57 99 0.1 36 96
140 3 69 97 13 89 97 3 71 97
160 12 90 97 22 98 96 13 96 97
020406080
100
120 140 160sele
ctiv
ity/c
onve
rsio
n/
mol
%
Temperature/ °C
OL selectivity AL conversion ENE conversion
020406080
100
120 140 160sele
ctiv
ity/c
onve
rsio
n/
mol
%
Temperature/ °C
OL selectivity AL conversion ENE conversion
(a) (b)

102
The increase in silver loading showed a decrease in conversion at temperatures 120 and 140 °C,
which is expected due to the slightly lower amount of active metal (copper) on the surface in the
intermetallic ratio of the catalyst prepared in this study. At 160 °C the 4Cu1Ag/γ-Al2O3 catalyst
had approximately 1 % lower conversion, which could be considered negligible, indicating that
higher temperatures allow for a greater synergistic effect between the two metals, which results
in a higher conversion for both bimetallic catalysts compared to the 5Cu/γ-Al2O3 catalyst (refer
to Table 4.3). A major difference between the two 5 wt % bimetallic catalysts is the octene
conversion, whereby the 4.5Cu0.5Ag/γ-Al2O3 shows a significantly higher octene conversion as
compared to the 4Cu1Ag/γ-Al2O3 catalyst. This could be attributed to the low loading of silver
creating more defect sites to allow to an increased possibility of octene adsorption and
hydrogenation. In situ XRD supports this showing a change in the d-spacing values under
reduction conditions (Figure 3.7). The 4Cu1Ag/γ-Al2O3 also showed a slight shift, which results
in a similar octene conversion as the monometallic 5Cu/γ-Al2O3 catalysts (refer to Figure 3.7).
The synergistic effect between the two metals allow for a lower loading of copper while
maintaining the low octene conversion found with the 5Cu/γ-Al2O3 catalyst, as well as providing
an increased conversion of octanal at high temperatures (160 °C).
Figure 4.12. The selectivity towards byproducts for catalysts (a) 4.5Cu0.5Ag/γ-Al2O3 and (b)
4Cu1Ag/γ-Al2O3.
Figure 4.12a-b showed the selectivity towards byproduct formation for the 4.5Cu0.5Ag/γ-Al2O3
and 4Cu1Ag/γ-Al2O3 catalysts. Both catalytic systems showed similar octanol selectivities,
however, the 4.5Cu0.5Ag/γ-Al2O3 showed a higher selectivity to C16 diols and C24 acetal with a
negligible amount of octyl octanoate, while the 4Cu-1Ag/γ-Al2O3 shows a significant amount of
0
1
2
3
others 2-hexyl 1-decanol
octyloctanoate
C16 diols C24 acetal
Sele
ctiv
ity/ m
ol%
Byproducts
120 140 160
0
1
2
3
others 2-hexyl 1-decanol
octyloctanoate
C16 diols C24acetal
Sele
ctiv
ity/ m
ol%
Byproducts
120 140 160
(a)
) (b)
(b)
) (b)
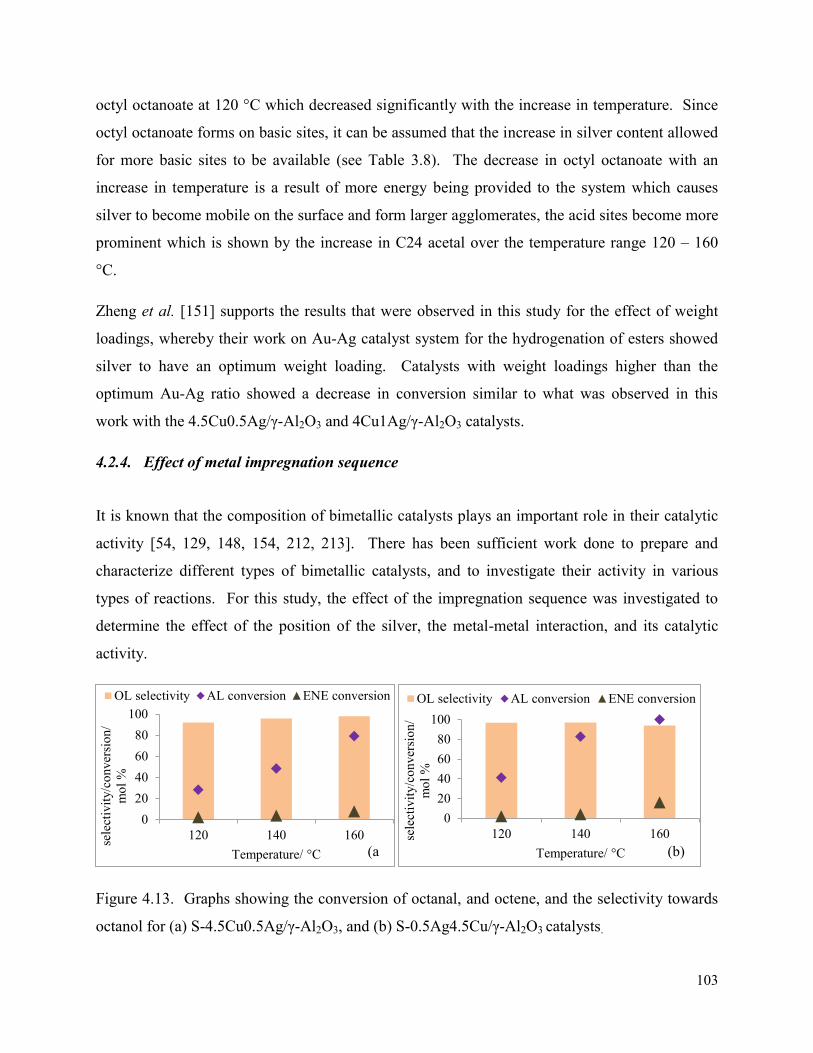
103
octyl octanoate at 120 °C which decreased significantly with the increase in temperature. Since
octyl octanoate forms on basic sites, it can be assumed that the increase in silver content allowed
for more basic sites to be available (see Table 3.8). The decrease in octyl octanoate with an
increase in temperature is a result of more energy being provided to the system which causes
silver to become mobile on the surface and form larger agglomerates, the acid sites become more
prominent which is shown by the increase in C24 acetal over the temperature range 120 – 160
°C.
Zheng et al. [151] supports the results that were observed in this study for the effect of weight
loadings, whereby their work on Au-Ag catalyst system for the hydrogenation of esters showed
silver to have an optimum weight loading. Catalysts with weight loadings higher than the
optimum Au-Ag ratio showed a decrease in conversion similar to what was observed in this
work with the 4.5Cu0.5Ag/γ-Al2O3 and 4Cu1Ag/γ-Al2O3 catalysts.
4.2.4. Effect of metal impregnation sequence
It is known that the composition of bimetallic catalysts plays an important role in their catalytic
activity [54, 129, 148, 154, 212, 213]. There has been sufficient work done to prepare and
characterize different types of bimetallic catalysts, and to investigate their activity in various
types of reactions. For this study, the effect of the impregnation sequence was investigated to
determine the effect of the position of the silver, the metal-metal interaction, and its catalytic
activity.
Figure 4.13. Graphs showing the conversion of octanal, and octene, and the selectivity towards
octanol for (a) S-4.5Cu0.5Ag/γ-Al2O3, and (b) S-0.5Ag4.5Cu/γ-Al2O3 catalysts.
020406080
100
120 140 160sele
ctiv
ity/c
onve
rsio
n/
mol
%
Temperature/ °C
OL selectivity AL conversion ENE conversion
020406080
100
120 140 160sele
ctiv
ity/c
onve
rsio
n/
mol
%
Temperature/ °C
OL selectivity AL conversion ENE conversion
(a)
) (b)
(b)
) (b)
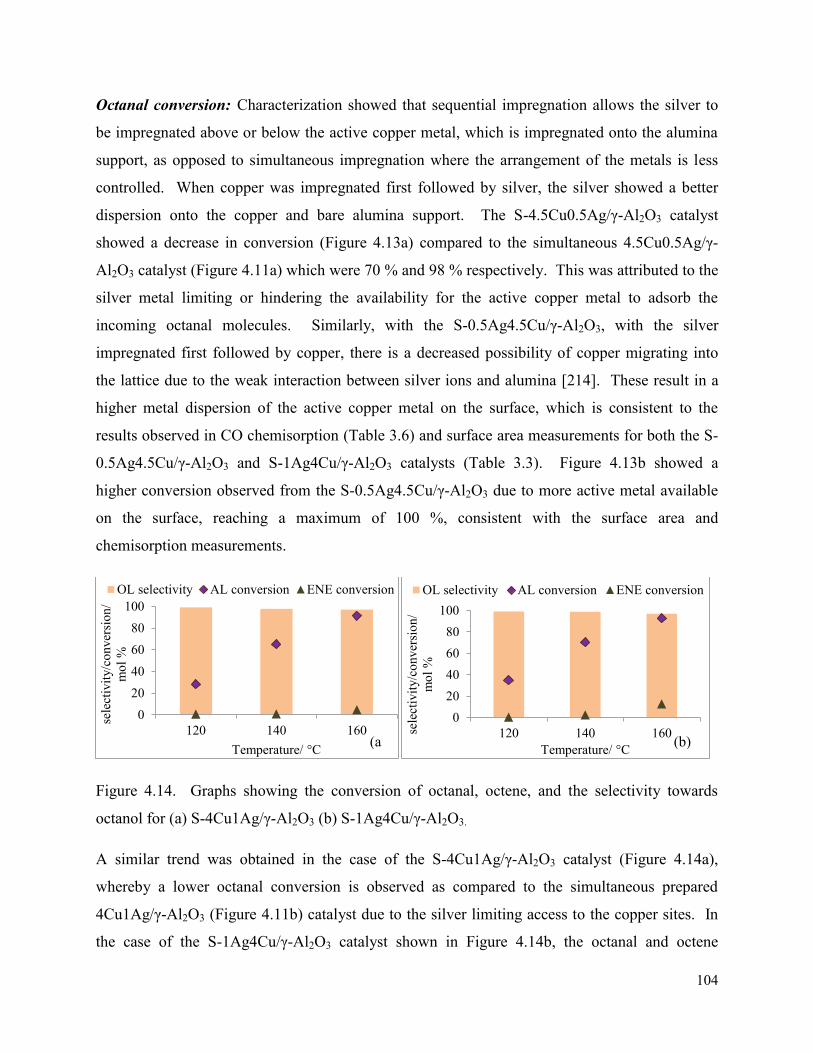
104
Octanal conversion: Characterization showed that sequential impregnation allows the silver to
be impregnated above or below the active copper metal, which is impregnated onto the alumina
support, as opposed to simultaneous impregnation where the arrangement of the metals is less
controlled. When copper was impregnated first followed by silver, the silver showed a better
dispersion onto the copper and bare alumina support. The S-4.5Cu0.5Ag/γ-Al2O3 catalyst
showed a decrease in conversion (Figure 4.13a) compared to the simultaneous 4.5Cu0.5Ag/γ-
Al2O3 catalyst (Figure 4.11a) which were 70 % and 98 % respectively. This was attributed to the
silver metal limiting or hindering the availability for the active copper metal to adsorb the
incoming octanal molecules. Similarly, with the S-0.5Ag4.5Cu/γ-Al2O3, with the silver
impregnated first followed by copper, there is a decreased possibility of copper migrating into
the lattice due to the weak interaction between silver ions and alumina [214]. These result in a
higher metal dispersion of the active copper metal on the surface, which is consistent to the
results observed in CO chemisorption (Table 3.6) and surface area measurements for both the S-
0.5Ag4.5Cu/γ-Al2O3 and S-1Ag4Cu/γ-Al2O3 catalysts (Table 3.3). Figure 4.13b showed a
higher conversion observed from the S-0.5Ag4.5Cu/γ-Al2O3 due to more active metal available
on the surface, reaching a maximum of 100 %, consistent with the surface area and
chemisorption measurements.
Figure 4.14. Graphs showing the conversion of octanal, octene, and the selectivity towards
octanol for (a) S-4Cu1Ag/γ-Al2O3 (b) S-1Ag4Cu/γ-Al2O3.
A similar trend was obtained in the case of the S-4Cu1Ag/γ-Al2O3 catalyst (Figure 4.14a),
whereby a lower octanal conversion is observed as compared to the simultaneous prepared
4Cu1Ag/γ-Al2O3 (Figure 4.11b) catalyst due to the silver limiting access to the copper sites. In
the case of the S-1Ag4Cu/γ-Al2O3 catalyst shown in Figure 4.14b, the octanal and octene
020406080
100
120 140 160
sele
ctiv
ity/c
onve
rsio
n/
mol
%
Temperature/ °C
OL selectivity AL conversion ENE conversion
020406080
100
120 140 160sele
ctiv
ity/c
onve
rsio
n/
mol
%
Temperature/ °C
OL selectivity AL conversion ENE conversion
(a)
) (b)
(b)
) (b)
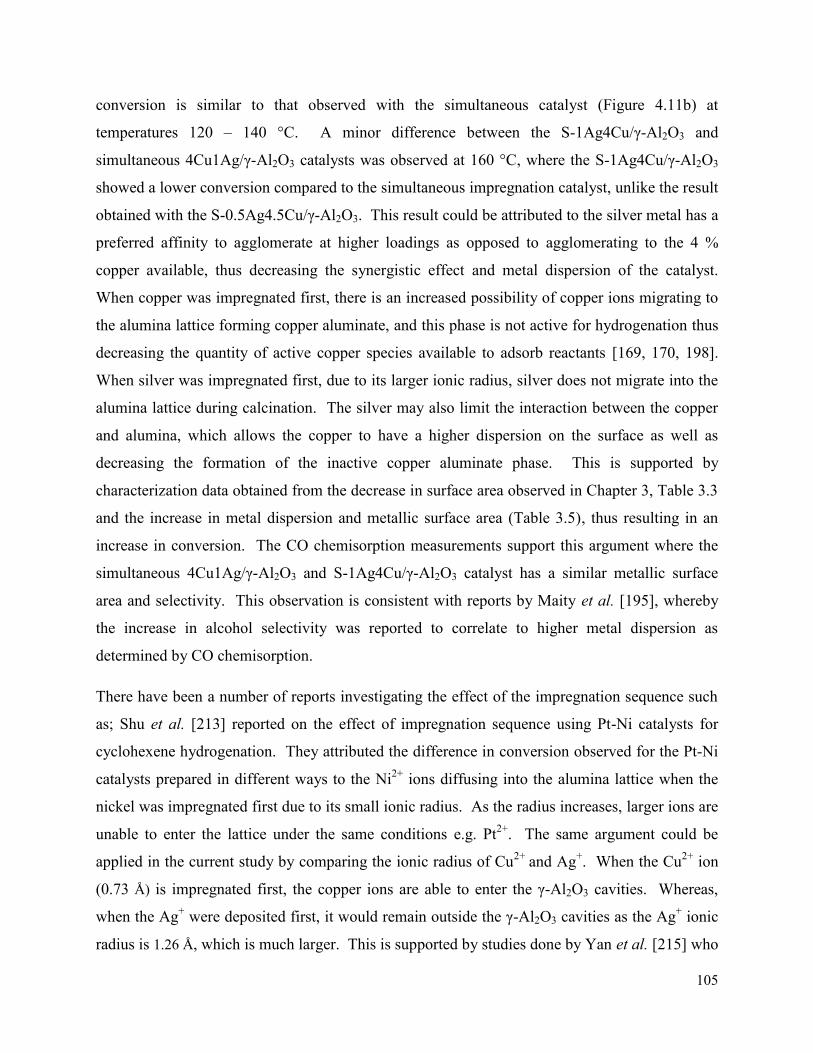
105
conversion is similar to that observed with the simultaneous catalyst (Figure 4.11b) at
temperatures 120 – 140 °C. A minor difference between the S-1Ag4Cu/γ-Al2O3 and
simultaneous 4Cu1Ag/γ-Al2O3 catalysts was observed at 160 °C, where the S-1Ag4Cu/γ-Al2O3
showed a lower conversion compared to the simultaneous impregnation catalyst, unlike the result
obtained with the S-0.5Ag4.5Cu/γ-Al2O3. This result could be attributed to the silver metal has a
preferred affinity to agglomerate at higher loadings as opposed to agglomerating to the 4 %
copper available, thus decreasing the synergistic effect and metal dispersion of the catalyst.
When copper was impregnated first, there is an increased possibility of copper ions migrating to
the alumina lattice forming copper aluminate, and this phase is not active for hydrogenation thus
decreasing the quantity of active copper species available to adsorb reactants [169, 170, 198].
When silver was impregnated first, due to its larger ionic radius, silver does not migrate into the
alumina lattice during calcination. The silver may also limit the interaction between the copper
and alumina, which allows the copper to have a higher dispersion on the surface as well as
decreasing the formation of the inactive copper aluminate phase. This is supported by
characterization data obtained from the decrease in surface area observed in Chapter 3, Table 3.3
and the increase in metal dispersion and metallic surface area (Table 3.5), thus resulting in an
increase in conversion. The CO chemisorption measurements support this argument where the
simultaneous 4Cu1Ag/γ-Al2O3 and S-1Ag4Cu/γ-Al2O3 catalyst has a similar metallic surface
area and selectivity. This observation is consistent with reports by Maity et al. [195], whereby
the increase in alcohol selectivity was reported to correlate to higher metal dispersion as
determined by CO chemisorption.
There have been a number of reports investigating the effect of the impregnation sequence such
as; Shu et al. [213] reported on the effect of impregnation sequence using Pt-Ni catalysts for
cyclohexene hydrogenation. They attributed the difference in conversion observed for the Pt-Ni
catalysts prepared in different ways to the Ni2+ ions diffusing into the alumina lattice when the
nickel was impregnated first due to its small ionic radius. As the radius increases, larger ions are
unable to enter the lattice under the same conditions e.g. Pt2+. The same argument could be
applied in the current study by comparing the ionic radius of Cu2+ and Ag+. When the Cu2+ ion
(0.73 Å) is impregnated first, the copper ions are able to enter the γ-Al2O3 cavities. Whereas,
when the Ag+ were deposited first, it would remain outside the γ-Al2O3 cavities as the Ag+ ionic
radius is 1.26 Å, which is much larger. This is supported by studies done by Yan et al. [215] who
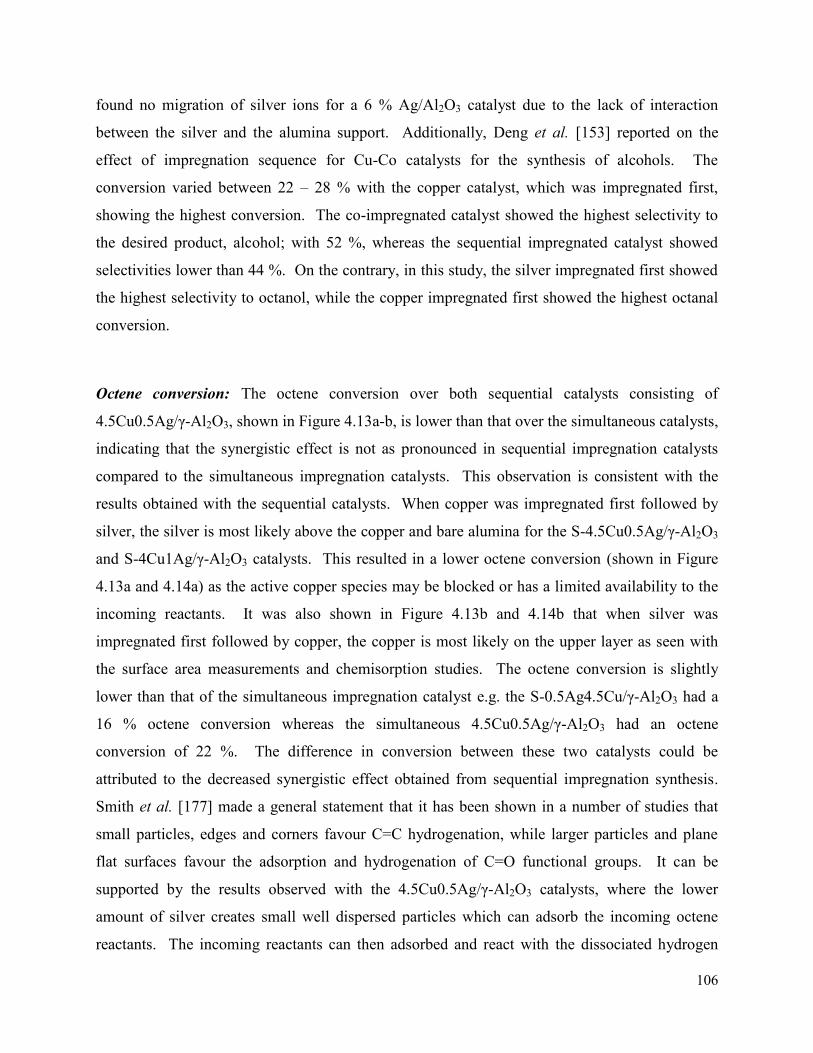
106
found no migration of silver ions for a 6 % Ag/Al2O3 catalyst due to the lack of interaction
between the silver and the alumina support. Additionally, Deng et al. [153] reported on the
effect of impregnation sequence for Cu-Co catalysts for the synthesis of alcohols. The
conversion varied between 22 – 28 % with the copper catalyst, which was impregnated first,
showing the highest conversion. The co-impregnated catalyst showed the highest selectivity to
the desired product, alcohol; with 52 %, whereas the sequential impregnated catalyst showed
selectivities lower than 44 %. On the contrary, in this study, the silver impregnated first showed
the highest selectivity to octanol, while the copper impregnated first showed the highest octanal
conversion.
Octene conversion: The octene conversion over both sequential catalysts consisting of
4.5Cu0.5Ag/γ-Al2O3, shown in Figure 4.13a-b, is lower than that over the simultaneous catalysts,
indicating that the synergistic effect is not as pronounced in sequential impregnation catalysts
compared to the simultaneous impregnation catalysts. This observation is consistent with the
results obtained with the sequential catalysts. When copper was impregnated first followed by
silver, the silver is most likely above the copper and bare alumina for the S-4.5Cu0.5Ag/γ-Al2O3
and S-4Cu1Ag/γ-Al2O3 catalysts. This resulted in a lower octene conversion (shown in Figure
4.13a and 4.14a) as the active copper species may be blocked or has a limited availability to the
incoming reactants. It was also shown in Figure 4.13b and 4.14b that when silver was
impregnated first followed by copper, the copper is most likely on the upper layer as seen with
the surface area measurements and chemisorption studies. The octene conversion is slightly
lower than that of the simultaneous impregnation catalyst e.g. the S-0.5Ag4.5Cu/γ-Al2O3 had a
16 % octene conversion whereas the simultaneous 4.5Cu0.5Ag/γ-Al2O3 had an octene
conversion of 22 %. The difference in conversion between these two catalysts could be
attributed to the decreased synergistic effect obtained from sequential impregnation synthesis.
Smith et al. [177] made a general statement that it has been shown in a number of studies that
small particles, edges and corners favour C=C hydrogenation, while larger particles and plane
flat surfaces favour the adsorption and hydrogenation of C=O functional groups. It can be
supported by the results observed with the 4.5Cu0.5Ag/γ-Al2O3 catalysts, where the lower
amount of silver creates small well dispersed particles which can adsorb the incoming octene
reactants. The incoming reactants can then adsorbed and react with the dissociated hydrogen

107
adsorbed on copper. However, it was also shown from the SEM-EDX line scan (Figure 3.15)
and STEM-EDX (Figure 3.12) that the simultaneous catalysts allowed for both metals to be in
close contact with each other resulting in a higher octene conversion. This could be due to the
synergistic effect of both metals in close contact with each other, which increases the adsorption
of both octanal and octene as seen in work done by Deng et al. [153].
Selectivity towards octanol: S-4.5Cu0.5Ag/γ-Al2O3 showed an increase in selectivity with an
increase in temperature (Figure 4.13a), whereas the S-0.5Ag4.5Cu/γ-Al2O3 catalyst (Figure
4.13b) showed a decrease at higher temperatures. This could be due to the mobility of silver
atoms on the surface, which may increase the synergistic effect at higher temperatures, resulting
in an increased selectivity to octanol in the case of the S-4.5Cu0.5Ag catalyst or the formation of
byproducts as seen with S-0.5Ag4.5Cu/γ-Al2O3. The S-4Cu1Ag/γ-Al2O3 (Figure 4.14a) and S-
1Ag4Cu/γ-Al2O3 (Figure 4.14b) catalysts showed a minor decrease in selectivity to octanol with
increase in temperature. The highest selectivity was obtained at low temperatures of 120 °C with
both catalysts showing the same selectivity at 160 °C, which is 97 %. This is consistent with
work done by Maity et al. [195], where copper was found to increase the alcohol selectivity in
the Fischer-Tropsch synthesis.
Figure 4.15. Graphs showing the selectivity towards byproducts for (a) S-4.5Cu0.5Ag/γ-Al2O3,
and (b) S-0.5Ag4.5Cu/γ-Al2O3.
Selectivity towards byproducts: A significant selectivity towards acid catalyzed byproducts such
as octyl octanoate and C24 acetal was observed for the S-4.5Cu0.5Ag catalyst at 120 °C (Figure
4.15a). This decreased with an increase in temperature to a negligible amount. The S-
0
1
2
3
others 2-hexyl 1-decanol
octyloctanoate
C16 diols C24 acetal
Sele
ctiv
ity/ m
ol%
Byproducts
120 140 160
0
1
2
3
others 2-hexyl 1-decanol
octyloctanoate
C16 diols C24acetal
Sele
ctiv
ity/ m
ol%
Byproducts
120 140 160
(a) (b)
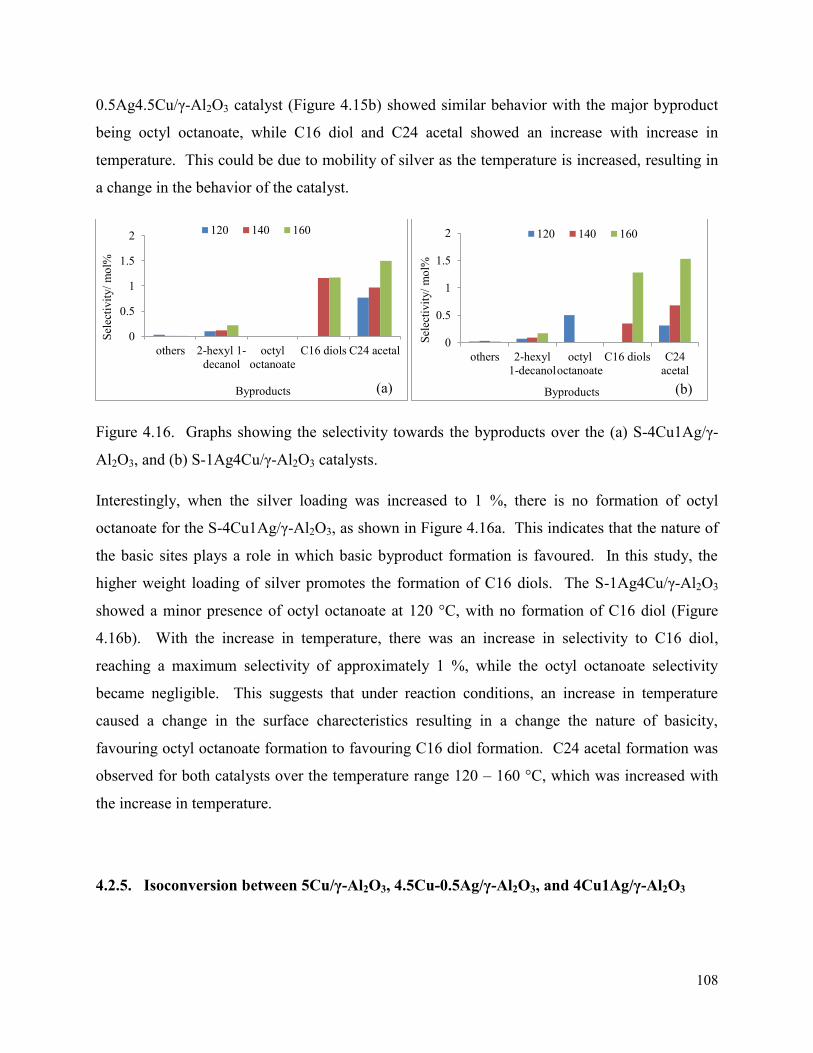
108
0.5Ag4.5Cu/γ-Al2O3 catalyst (Figure 4.15b) showed similar behavior with the major byproduct
being octyl octanoate, while C16 diol and C24 acetal showed an increase with increase in
temperature. This could be due to mobility of silver as the temperature is increased, resulting in
a change in the behavior of the catalyst.
Figure 4.16. Graphs showing the selectivity towards the byproducts over the (a) S-4Cu1Ag/γ-
Al2O3, and (b) S-1Ag4Cu/γ-Al2O3 catalysts.
Interestingly, when the silver loading was increased to 1 %, there is no formation of octyl
octanoate for the S-4Cu1Ag/γ-Al2O3, as shown in Figure 4.16a. This indicates that the nature of
the basic sites plays a role in which basic byproduct formation is favoured. In this study, the
higher weight loading of silver promotes the formation of C16 diols. The S-1Ag4Cu/γ-Al2O3
showed a minor presence of octyl octanoate at 120 °C, with no formation of C16 diol (Figure
4.16b). With the increase in temperature, there was an increase in selectivity to C16 diol,
reaching a maximum selectivity of approximately 1 %, while the octyl octanoate selectivity
became negligible. This suggests that under reaction conditions, an increase in temperature
caused a change in the surface charecteristics resulting in a change the nature of basicity,
favouring octyl octanoate formation to favouring C16 diol formation. C24 acetal formation was
observed for both catalysts over the temperature range 120 – 160 °C, which was increased with
the increase in temperature.
4.2.5. Isoconversion between 5Cu/γ-Al2O3, 4.5Cu-0.5Ag/γ-Al2O3, and 4Cu1Ag/γ-Al2O3
0
0.5
1
1.5
2
others 2-hexyl 1-decanol
octyloctanoate
C16 diols C24 acetal
Sele
ctiv
ity/ m
ol%
Byproducts
120 140 160
0
0.5
1
1.5
2
others 2-hexyl1-decanol
octyloctanoate
C16 diols C24acetal
Sele
ctiv
ity/ m
ol%
Byproducts
120 140 160
(a) (b)
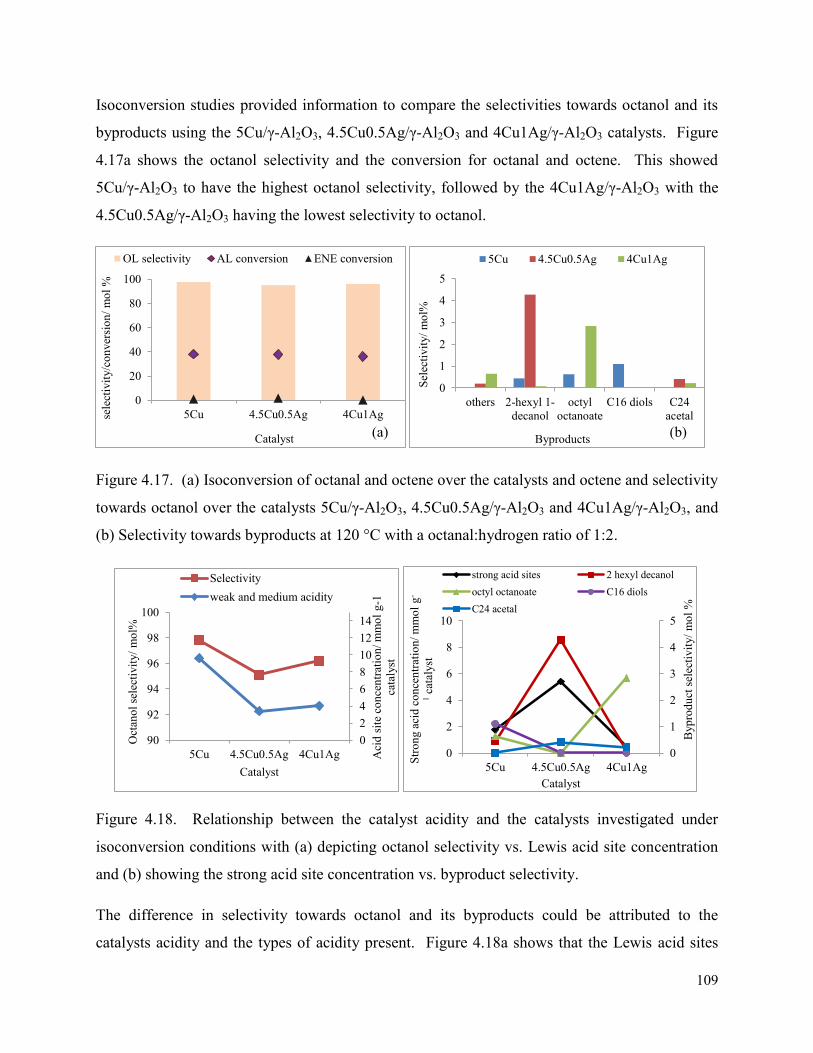
109
Isoconversion studies provided information to compare the selectivities towards octanol and its
byproducts using the 5Cu/γ-Al2O3, 4.5Cu0.5Ag/γ-Al2O3 and 4Cu1Ag/γ-Al2O3 catalysts. Figure
4.17a shows the octanol selectivity and the conversion for octanal and octene. This showed
5Cu/γ-Al2O3 to have the highest octanol selectivity, followed by the 4Cu1Ag/γ-Al2O3 with the
4.5Cu0.5Ag/γ-Al2O3 having the lowest selectivity to octanol.
Figure 4.17. (a) Isoconversion of octanal and octene over the catalysts and octene and selectivity
towards octanol over the catalysts 5Cu/γ-Al2O3, 4.5Cu0.5Ag/γ-Al2O3 and 4Cu1Ag/γ-Al2O3, and
(b) Selectivity towards byproducts at 120 °C with a octanal:hydrogen ratio of 1:2.
Figure 4.18. Relationship between the catalyst acidity and the catalysts investigated under
isoconversion conditions with (a) depicting octanol selectivity vs. Lewis acid site concentration
and (b) showing the strong acid site concentration vs. byproduct selectivity.
The difference in selectivity towards octanol and its byproducts could be attributed to the
catalysts acidity and the types of acidity present. Figure 4.18a shows that the Lewis acid sites
0
20
40
60
80
100
5Cu 4.5Cu0.5Ag 4Cu1Agsele
ctiv
ity/c
onve
rsio
n/ m
ol %
Catalyst
OL selectivity AL conversion ENE conversion
0
1
2
3
4
5
others 2-hexyl 1-decanol
octyloctanoate
C16 diols C24acetalSe
lect
ivity
/ mol
%
Byproducts
5Cu 4.5Cu0.5Ag 4Cu1Ag
02468101214
90
92
94
96
98
100
5Cu 4.5Cu0.5Ag 4Cu1Ag Aci
d si
te c
once
ntra
tion/
mm
ol g
-1
cata
lyst
Oct
anol
sele
ctiv
ity/ m
ol%
Catalyst
Selectivityweak and medium acidity
0
1
2
3
4
5
0
2
4
6
8
10
5Cu 4.5Cu0.5Ag 4Cu1Ag
Byp
rodu
ct se
lect
ivity
/ mol
%
Stro
ng a
cid
conc
entra
tion/
mm
ol g
-
1 cat
alys
t
Catalyst
strong acid sites 2 hexyl decanoloctyl octanoate C16 diolsC24 acetal
(a) (b)
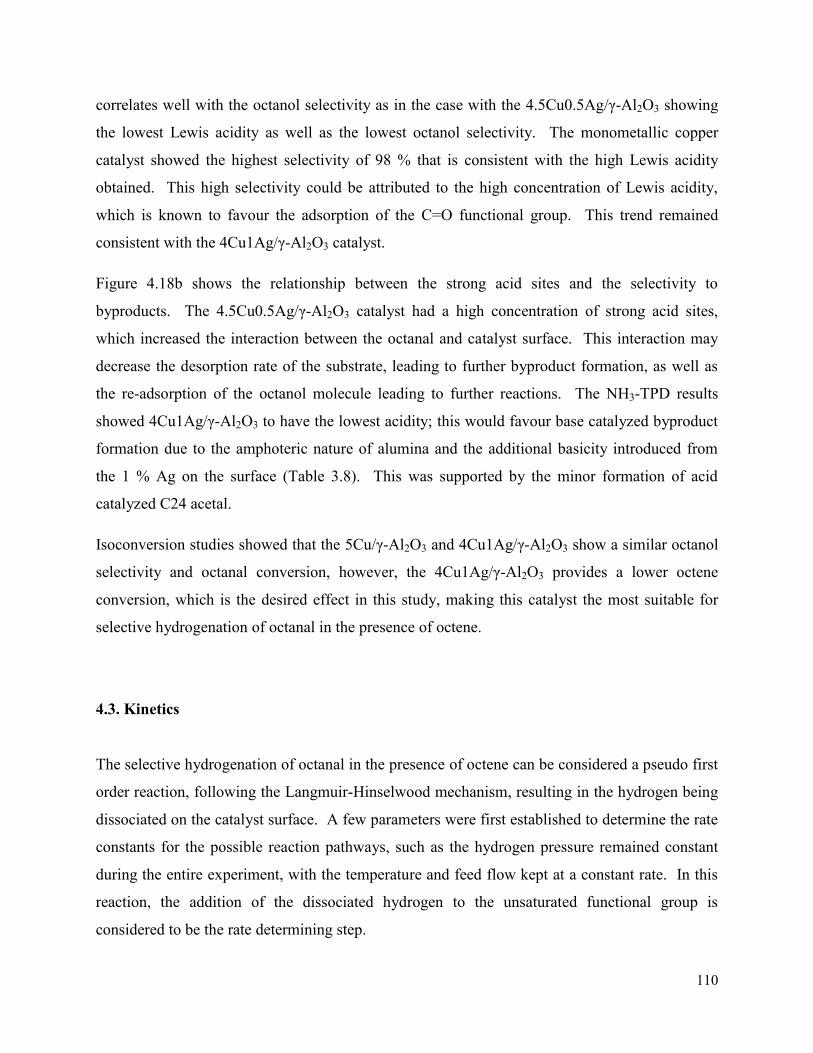
110
correlates well with the octanol selectivity as in the case with the 4.5Cu0.5Ag/γ-Al2O3 showing
the lowest Lewis acidity as well as the lowest octanol selectivity. The monometallic copper
catalyst showed the highest selectivity of 98 % that is consistent with the high Lewis acidity
obtained. This high selectivity could be attributed to the high concentration of Lewis acidity,
which is known to favour the adsorption of the C=O functional group. This trend remained
consistent with the 4Cu1Ag/γ-Al2O3 catalyst.
Figure 4.18b shows the relationship between the strong acid sites and the selectivity to
byproducts. The 4.5Cu0.5Ag/γ-Al2O3 catalyst had a high concentration of strong acid sites,
which increased the interaction between the octanal and catalyst surface. This interaction may
decrease the desorption rate of the substrate, leading to further byproduct formation, as well as
the re-adsorption of the octanol molecule leading to further reactions. The NH3-TPD results
showed 4Cu1Ag/γ-Al2O3 to have the lowest acidity; this would favour base catalyzed byproduct
formation due to the amphoteric nature of alumina and the additional basicity introduced from
the 1 % Ag on the surface (Table 3.8). This was supported by the minor formation of acid
catalyzed C24 acetal.
Isoconversion studies showed that the 5Cu/γ-Al2O3 and 4Cu1Ag/γ-Al2O3 show a similar octanol
selectivity and octanal conversion, however, the 4Cu1Ag/γ-Al2O3 provides a lower octene
conversion, which is the desired effect in this study, making this catalyst the most suitable for
selective hydrogenation of octanal in the presence of octene.
4.3. Kinetics
The selective hydrogenation of octanal in the presence of octene can be considered a pseudo first
order reaction, following the Langmuir-Hinselwood mechanism, resulting in the hydrogen being
dissociated on the catalyst surface. A few parameters were first established to determine the rate
constants for the possible reaction pathways, such as the hydrogen pressure remained constant
during the entire experiment, with the temperature and feed flow kept at a constant rate. In this
reaction, the addition of the dissociated hydrogen to the unsaturated functional group is
considered to be the rate determining step.
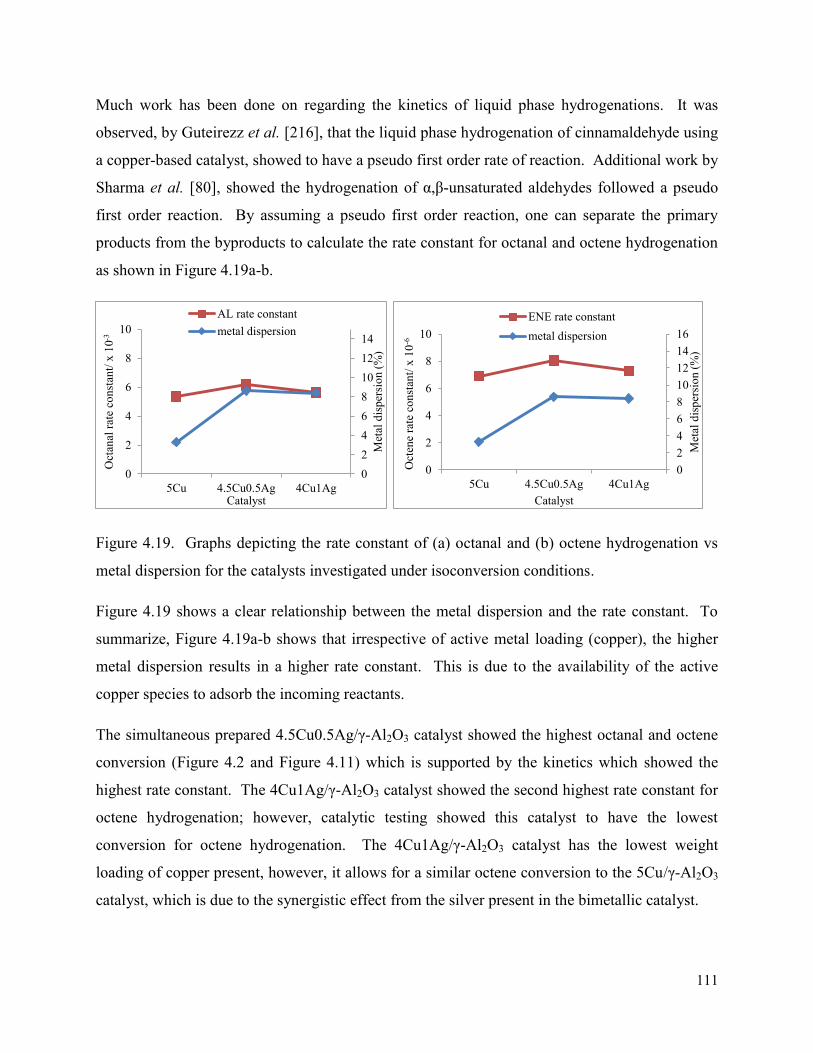
111
Much work has been done on regarding the kinetics of liquid phase hydrogenations. It was
observed, by Guteirezz et al. [216], that the liquid phase hydrogenation of cinnamaldehyde using
a copper-based catalyst, showed to have a pseudo first order rate of reaction. Additional work by
Sharma et al. [80], showed the hydrogenation of α,β-unsaturated aldehydes followed a pseudo
first order reaction. By assuming a pseudo first order reaction, one can separate the primary
products from the byproducts to calculate the rate constant for octanal and octene hydrogenation
as shown in Figure 4.19a-b.
Figure 4.19. Graphs depicting the rate constant of (a) octanal and (b) octene hydrogenation vs
metal dispersion for the catalysts investigated under isoconversion conditions.
Figure 4.19 shows a clear relationship between the metal dispersion and the rate constant. To
summarize, Figure 4.19a-b shows that irrespective of active metal loading (copper), the higher
metal dispersion results in a higher rate constant. This is due to the availability of the active
copper species to adsorb the incoming reactants.
The simultaneous prepared 4.5Cu0.5Ag/γ-Al2O3 catalyst showed the highest octanal and octene
conversion (Figure 4.2 and Figure 4.11) which is supported by the kinetics which showed the
highest rate constant. The 4Cu1Ag/γ-Al2O3 catalyst showed the second highest rate constant for
octene hydrogenation; however, catalytic testing showed this catalyst to have the lowest
conversion for octene hydrogenation. The 4Cu1Ag/γ-Al2O3 catalyst has the lowest weight
loading of copper present, however, it allows for a similar octene conversion to the 5Cu/γ-Al2O3
catalyst, which is due to the synergistic effect from the silver present in the bimetallic catalyst.
02468101214
0
2
4
6
8
10
5Cu 4.5Cu0.5Ag 4Cu1Ag
Met
al d
ispe
rsio
n (%
)
Oct
anal
rate
con
stan
t/ x
10-3
Catalyst
AL rate constantmetal dispersion
0246810121416
0
2
4
6
8
10
5Cu 4.5Cu0.5Ag 4Cu1Ag
Met
al d
ispe
rsio
n (%
)
Oct
ene
rate
con
stan
t/ x
10-6
Catalyst
ENE rate constantmetal dispersion
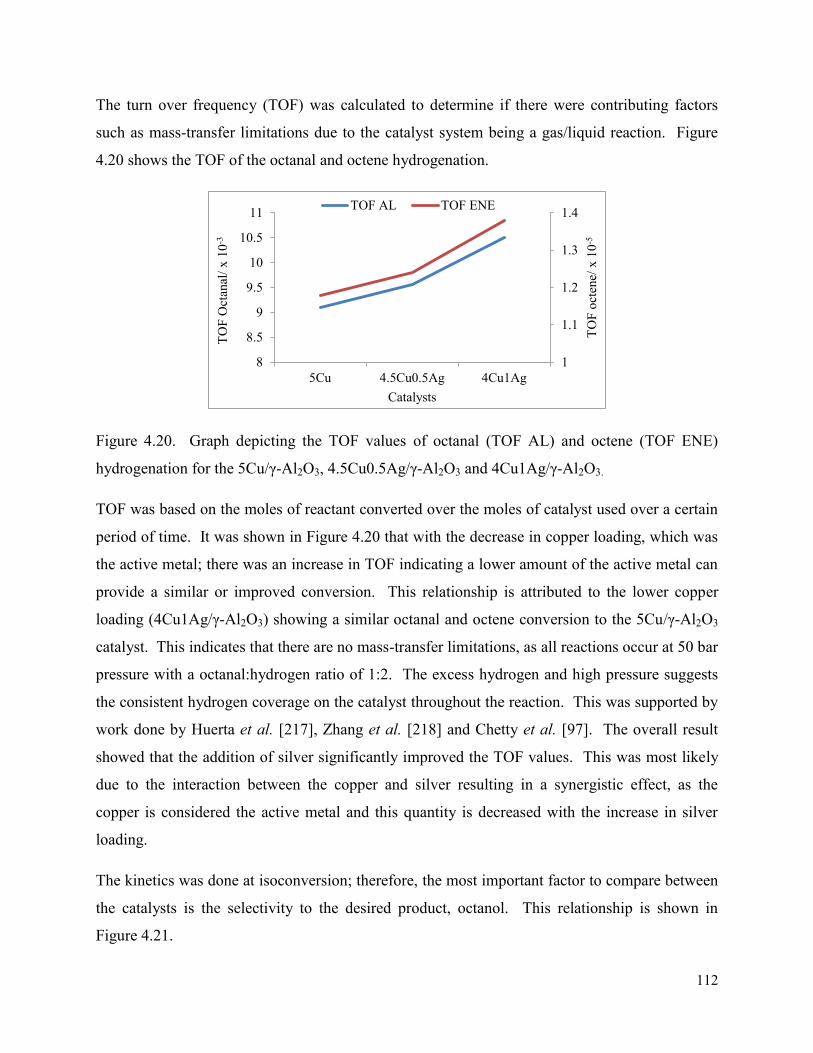
112
The turn over frequency (TOF) was calculated to determine if there were contributing factors
such as mass-transfer limitations due to the catalyst system being a gas/liquid reaction. Figure
4.20 shows the TOF of the octanal and octene hydrogenation.
Figure 4.20. Graph depicting the TOF values of octanal (TOF AL) and octene (TOF ENE)
hydrogenation for the 5Cu/γ-Al2O3, 4.5Cu0.5Ag/γ-Al2O3 and 4Cu1Ag/γ-Al2O3.
TOF was based on the moles of reactant converted over the moles of catalyst used over a certain
period of time. It was shown in Figure 4.20 that with the decrease in copper loading, which was
the active metal; there was an increase in TOF indicating a lower amount of the active metal can
provide a similar or improved conversion. This relationship is attributed to the lower copper
loading (4Cu1Ag/γ-Al2O3) showing a similar octanal and octene conversion to the 5Cu/γ-Al2O3
catalyst. This indicates that there are no mass-transfer limitations, as all reactions occur at 50 bar
pressure with a octanal:hydrogen ratio of 1:2. The excess hydrogen and high pressure suggests
the consistent hydrogen coverage on the catalyst throughout the reaction. This was supported by
work done by Huerta et al. [217], Zhang et al. [218] and Chetty et al. [97]. The overall result
showed that the addition of silver significantly improved the TOF values. This was most likely
due to the interaction between the copper and silver resulting in a synergistic effect, as the
copper is considered the active metal and this quantity is decreased with the increase in silver
loading.
The kinetics was done at isoconversion; therefore, the most important factor to compare between
the catalysts is the selectivity to the desired product, octanol. This relationship is shown in
Figure 4.21.
1
1.1
1.2
1.3
1.4
8
8.5
9
9.5
10
10.5
11
5Cu 4.5Cu0.5Ag 4Cu1Ag
TOF
octe
ne/ x
10-5
TOF
Oct
anal
/ x 1
0-3
Catalysts
TOF AL TOF ENE
113
Figure 4.21. Graph depicting the TON value compared to the octanol selectivity at
isoconversion using the 5Cu/γ-Al2O3, 4.5Cu0.5Ag/γ-Al2O3 and 4Cu1Ag/γ-Al2O3 catalysts.
The turn over number was dependent on the moles of catalyst used to adsorb a certain mole
amount of reactant. The turnover number shows an inverse relationship between the TON and
octanol selectivity. The 4.5Cu0.5Ag/γ-Al2O3 catalyst shows the highest TON value as well as
the lowest octanol selectivity, while the 5Cu/γ-Al2O3 shows the lowest TON value and the
highest octanol selectivity. This implies that the activity of the catalyst did not depend primarily
on the moles of active metal, but rather on the availability and synergistic effects of the
interaction between copper and silver as shown in the catalytic testing.
4.4. Used catalyst characterization
The recovery of the catalyst was obtained by drying the catalyst under 100 % Nitrogen at 200 °C
for 12 hours in the reactor, thereafter the reactor was cooled to room temperature. The glass
wool and carborundum was removed together with the catalyst, which was then sieved to
separate the carborundum from the catalyst pellets. Used catalyst characterization was used to
provide information of the catalyst thermal and mechanical stability, as well as the formation of
coke on the surface. Some of the techniques used to gain insight of the catalyst surface after the
reaction were Transmission Electron Microscopy (TEM), Scanning Electron Microscopy (SEM),
Nitrogen Physisorption (BET), Infrared Spectroscopy (IR), Inductively Coupled Spectroscopy
(ICP), and X-ray Diffraction (XRD).
90
92
94
96
98
100
1.8
1.9
2
2.1
2.2
2.3
5Cu 4.5Cu0.5Ag 4Cu1Ag octa
nol s
elec
tivity
/ mol
%
TON
/ x 1
0-5
Catalysts
TON AL Selectivity
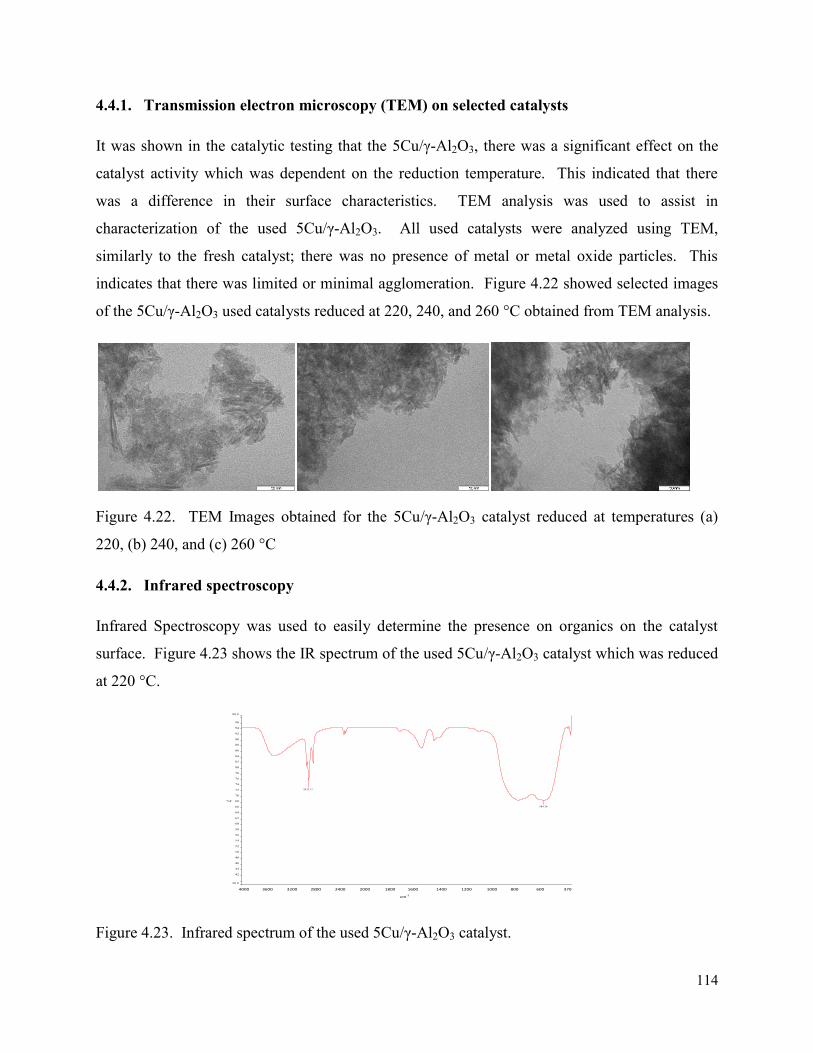
114
4.4.1. Transmission electron microscopy (TEM) on selected catalysts
It was shown in the catalytic testing that the 5Cu/γ-Al2O3, there was a significant effect on the
catalyst activity which was dependent on the reduction temperature. This indicated that there
was a difference in their surface characteristics. TEM analysis was used to assist in
characterization of the used 5Cu/γ-Al2O3. All used catalysts were analyzed using TEM,
similarly to the fresh catalyst; there was no presence of metal or metal oxide particles. This
indicates that there was limited or minimal agglomeration. Figure 4.22 showed selected images
of the 5Cu/γ-Al2O3 used catalysts reduced at 220, 240, and 260 °C obtained from TEM analysis.
Figure 4.22. TEM Images obtained for the 5Cu/γ-Al2O3 catalyst reduced at temperatures (a)
220, (b) 240, and (c) 260 °C
4.4.2. Infrared spectroscopy
Infrared Spectroscopy was used to easily determine the presence on organics on the catalyst
surface. Figure 4.23 shows the IR spectrum of the used 5Cu/γ-Al2O3 catalyst which was reduced
at 220 °C.
Figure 4.23. Infrared spectrum of the used 5Cu/γ-Al2O3 catalyst.
4000.0 3600 3200 2800 2400 2000 1800 1600 1400 1200 1000 800 600 370.038.9
42
44
46
48
50
52
54
56
58
60
62
64
66
68
70
72
74
76
78
80
82
84
86
88
90
92
94
96
98.9
cm-1
%T
2925.17
589.36
4000 1400 1200 1000 800 600 370 2000 1800 1600 3600 3200 2800 2400
cm-1
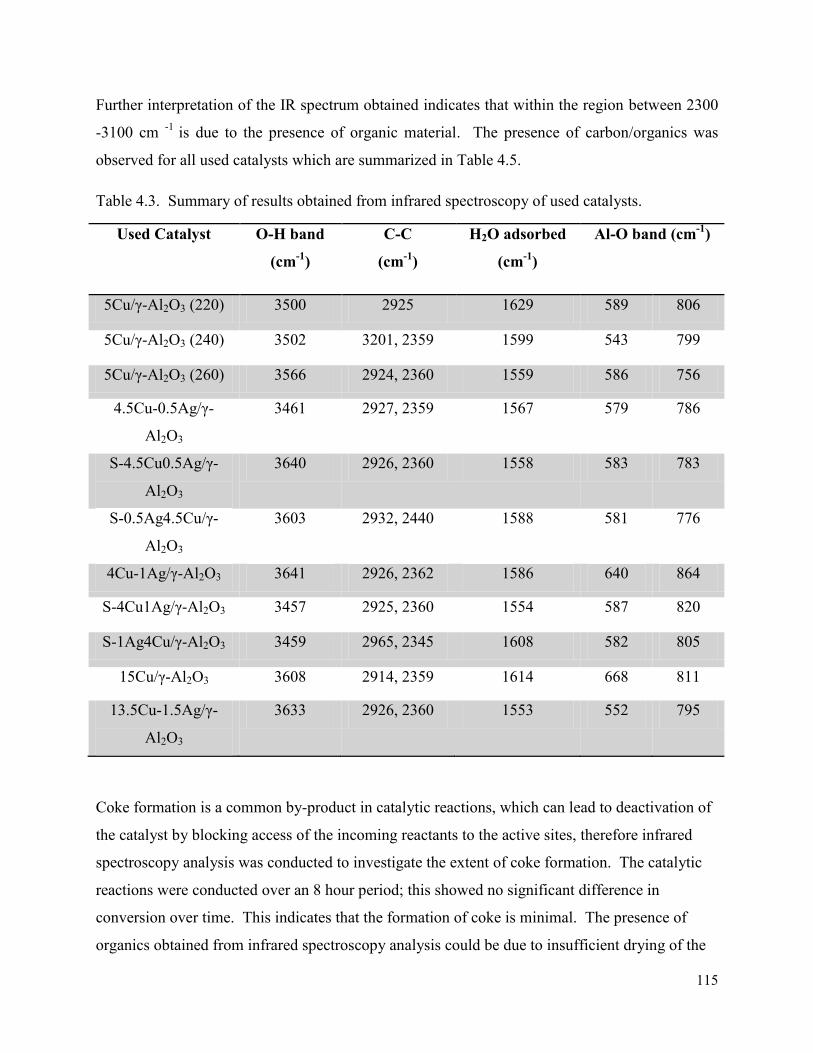
115
Further interpretation of the IR spectrum obtained indicates that within the region between 2300
-3100 cm -1 is due to the presence of organic material. The presence of carbon/organics was
observed for all used catalysts which are summarized in Table 4.5.
Table 4.3. Summary of results obtained from infrared spectroscopy of used catalysts.
Used Catalyst O-H band
(cm-1)
C-C
(cm-1)
H2O adsorbed
(cm-1)
Al-O band (cm-1)
5Cu/γ-Al2O3 (220) 3500 2925 1629 589 806
5Cu/γ-Al2O3 (240) 3502 3201, 2359 1599 543 799
5Cu/γ-Al2O3 (260) 3566 2924, 2360 1559 586 756
4.5Cu-0.5Ag/γ-
Al2O3
3461 2927, 2359 1567 579 786
S-4.5Cu0.5Ag/γ-
Al2O3
3640 2926, 2360 1558 583 783
S-0.5Ag4.5Cu/γ-
Al2O3
3603 2932, 2440 1588 581 776
4Cu-1Ag/γ-Al2O3 3641 2926, 2362 1586 640 864
S-4Cu1Ag/γ-Al2O3 3457 2925, 2360 1554 587 820
S-1Ag4Cu/γ-Al2O3 3459 2965, 2345 1608 582 805
15Cu/γ-Al2O3 3608 2914, 2359 1614 668 811
13.5Cu-1.5Ag/γ-
Al2O3
3633 2926, 2360 1553 552 795
Coke formation is a common by-product in catalytic reactions, which can lead to deactivation of
the catalyst by blocking access of the incoming reactants to the active sites, therefore infrared
spectroscopy analysis was conducted to investigate the extent of coke formation. The catalytic
reactions were conducted over an 8 hour period; this showed no significant difference in
conversion over time. This indicates that the formation of coke is minimal. The presence of
organics obtained from infrared spectroscopy analysis could be due to insufficient drying of the
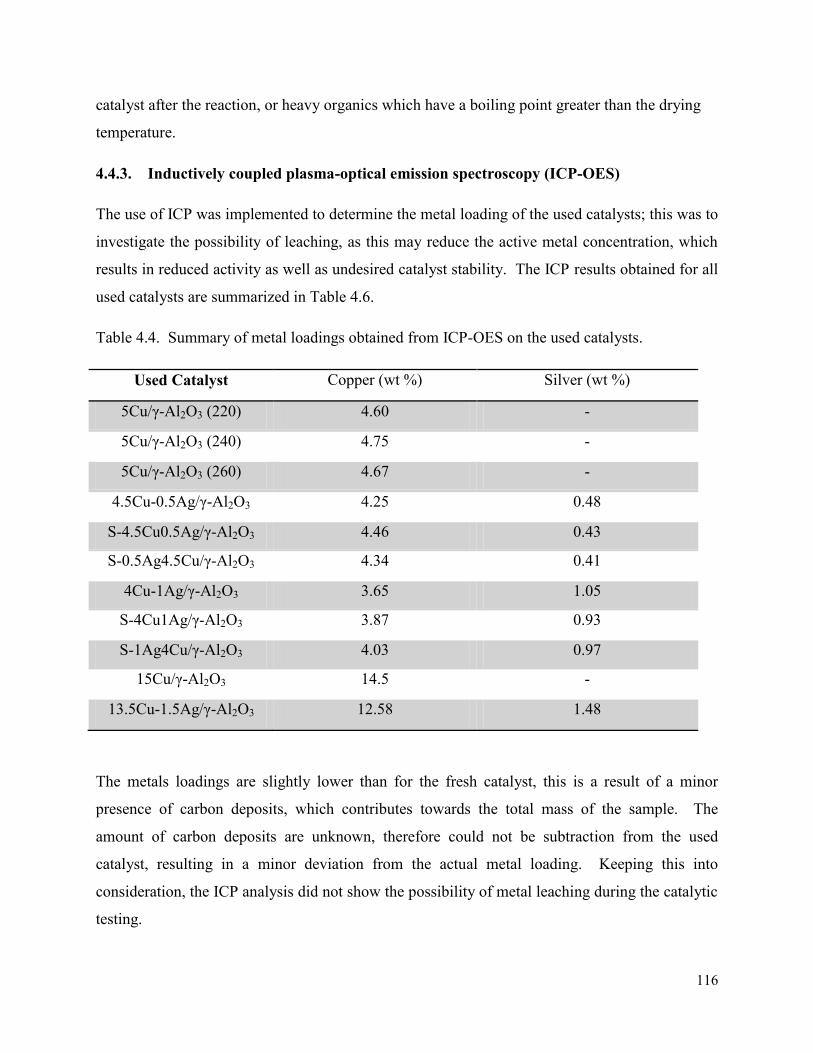
116
catalyst after the reaction, or heavy organics which have a boiling point greater than the drying
temperature.
4.4.3. Inductively coupled plasma-optical emission spectroscopy (ICP-OES)
The use of ICP was implemented to determine the metal loading of the used catalysts; this was to
investigate the possibility of leaching, as this may reduce the active metal concentration, which
results in reduced activity as well as undesired catalyst stability. The ICP results obtained for all
used catalysts are summarized in Table 4.6.
Table 4.4. Summary of metal loadings obtained from ICP-OES on the used catalysts.
Used Catalyst Copper (wt %) Silver (wt %)
5Cu/γ-Al2O3 (220) 4.60 -
5Cu/γ-Al2O3 (240) 4.75 -
5Cu/γ-Al2O3 (260) 4.67 -
4.5Cu-0.5Ag/γ-Al2O3 4.25 0.48
S-4.5Cu0.5Ag/γ-Al2O3 4.46 0.43
S-0.5Ag4.5Cu/γ-Al2O3 4.34 0.41
4Cu-1Ag/γ-Al2O3 3.65 1.05
S-4Cu1Ag/γ-Al2O3 3.87 0.93
S-1Ag4Cu/γ-Al2O3 4.03 0.97
15Cu/γ-Al2O3 14.5 -
13.5Cu-1.5Ag/γ-Al2O3 12.58 1.48
The metals loadings are slightly lower than for the fresh catalyst, this is a result of a minor
presence of carbon deposits, which contributes towards the total mass of the sample. The
amount of carbon deposits are unknown, therefore could not be subtraction from the used
catalyst, resulting in a minor deviation from the actual metal loading. Keeping this into
consideration, the ICP analysis did not show the possibility of metal leaching during the catalytic
testing.
117
4.4.4. X-ray diffraction
Chapter 3 showed that due to the low weight loading of copper and silver, there were no metal
oxide peaks observed for the catalysts with a total 5 wt % metal loading, metal oxides peaks
were only observed with the catalysts containing a total metal loading of 15 wt %. For this
reason, the used catalyst characterization was conducted for the 15Cu/γ-Al2O3 and the
13.5Cu1.5Ag/γ-Al2O3 catalysts as shown in Figure 4.24.
Figure 4.24. X-ray diffractogram (a) 15Cu/γ-Al2O3 catalyst: fresh (red) and used (black), and (b)
13.5Cu1.5Ag/γ-Al2O3 catalyst: fresh (red) and used (black). Peaks observed in the
diffractograms are attributed to CuO ( ) and Cu ( ).
Both used 15Cu/γ-Al2O3 and the 13.5Cu1.5Ag/γ-Al2O3 catalysts did not show metal oxide peaks
on the diffractogram. Since copper is known to readily oxidize, while silver is stable in its metal
state, suggests that the presence of carbon on the surface can minimize or inhibit the re-oxidation
of copper. The CuO phase is consistent with that of ICDD 80-1268 and the used catalyst showed
Cu0 peaks consistent with JCPDS 04-0836.catalysts did not show metal oxide peaks suggesting
that the presence of carbon on the surface can prevent or inhibit the re-oxidation of copper. The
CuO phase is consistent with that of ICDD 80-1268 and the used catalyst showed Cu0 peaks
consistent with JCPDS 04-0836.
(a) (b)
30 40 80 70 60 50 40 30 70 60 50 80
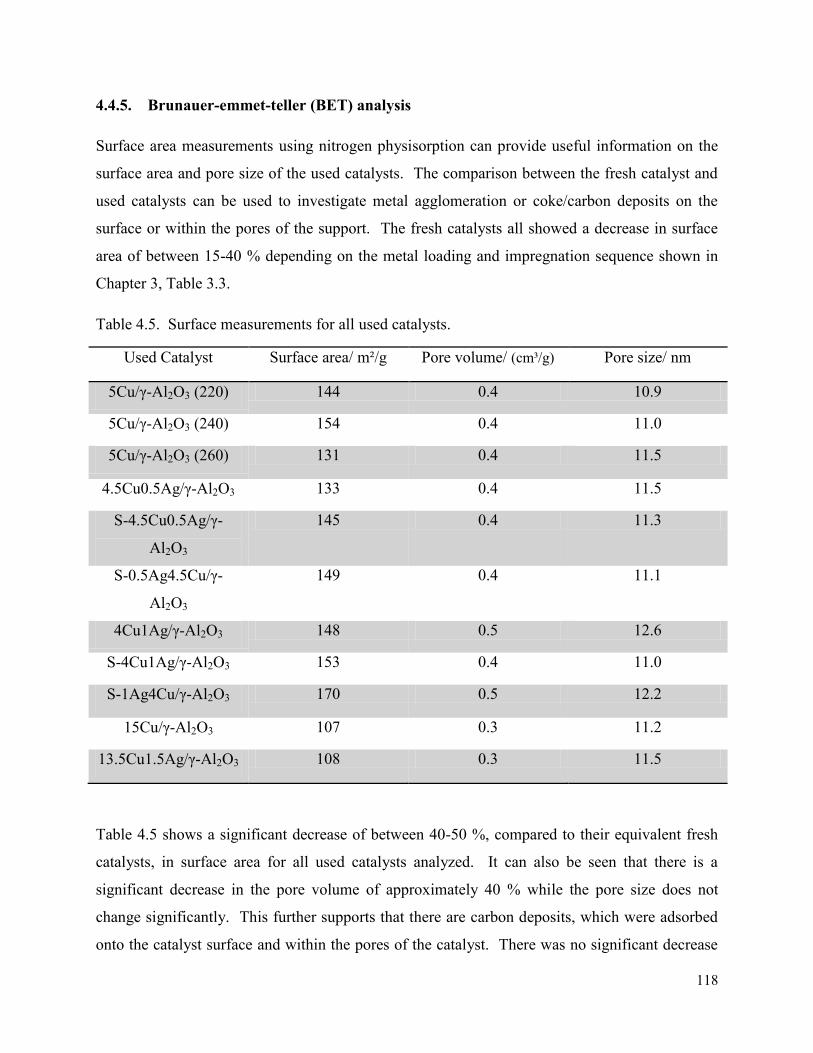
118
4.4.5. Brunauer-emmet-teller (BET) analysis
Surface area measurements using nitrogen physisorption can provide useful information on the
surface area and pore size of the used catalysts. The comparison between the fresh catalyst and
used catalysts can be used to investigate metal agglomeration or coke/carbon deposits on the
surface or within the pores of the support. The fresh catalysts all showed a decrease in surface
area of between 15-40 % depending on the metal loading and impregnation sequence shown in
Chapter 3, Table 3.3.
Table 4.5. Surface measurements for all used catalysts.
Used Catalyst Surface area/ m²/g Pore volume/ (cm³/g) Pore size/ nm
5Cu/γ-Al2O3 (220) 144 0.4 10.9
5Cu/γ-Al2O3 (240) 154 0.4 11.0
5Cu/γ-Al2O3 (260) 131 0.4 11.5
4.5Cu0.5Ag/γ-Al2O3 133 0.4 11.5
S-4.5Cu0.5Ag/γ-
Al2O3
145 0.4 11.3
S-0.5Ag4.5Cu/γ-
Al2O3
149 0.4 11.1
4Cu1Ag/γ-Al2O3 148 0.5 12.6
S-4Cu1Ag/γ-Al2O3 153 0.4 11.0
S-1Ag4Cu/γ-Al2O3 170 0.5 12.2
15Cu/γ-Al2O3 107 0.3 11.2
13.5Cu1.5Ag/γ-Al2O3 108 0.3 11.5
Table 4.5 shows a significant decrease of between 40-50 %, compared to their equivalent fresh
catalysts, in surface area for all used catalysts analyzed. It can also be seen that there is a
significant decrease in the pore volume of approximately 40 % while the pore size does not
change significantly. This further supports that there are carbon deposits, which were adsorbed
onto the catalyst surface and within the pores of the catalyst. There was no significant decrease
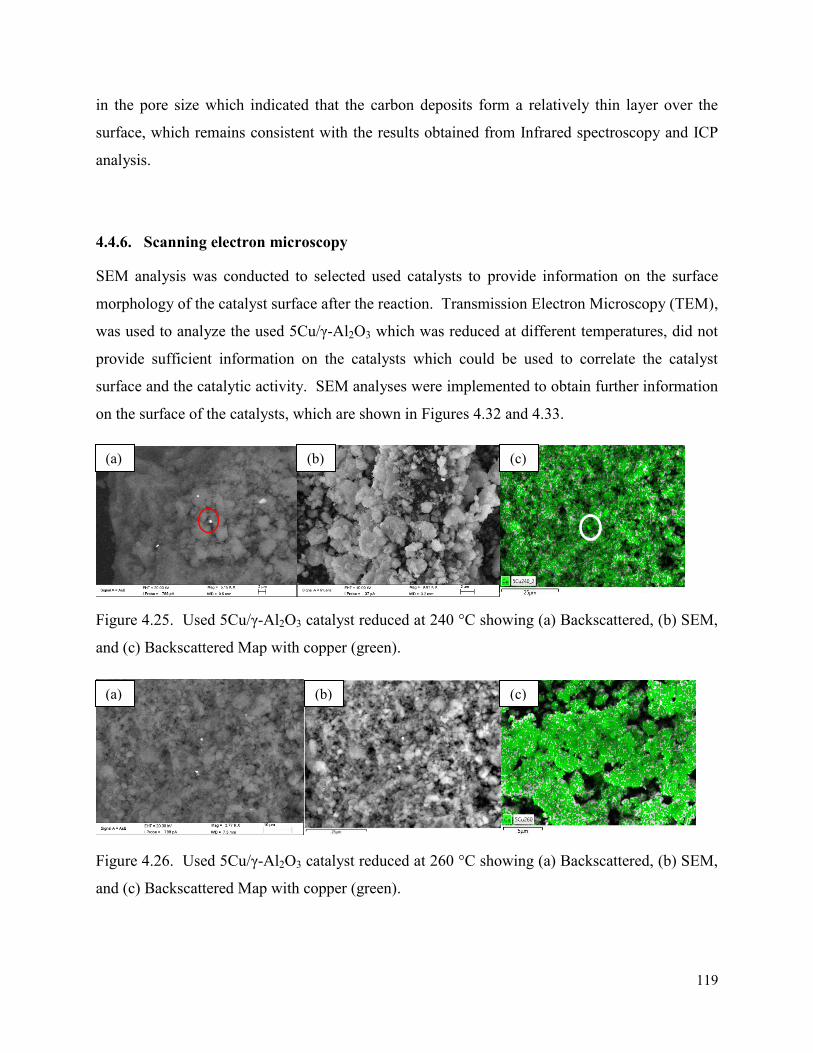
119
in the pore size which indicated that the carbon deposits form a relatively thin layer over the
surface, which remains consistent with the results obtained from Infrared spectroscopy and ICP
analysis.
4.4.6. Scanning electron microscopy
SEM analysis was conducted to selected used catalysts to provide information on the surface
morphology of the catalyst surface after the reaction. Transmission Electron Microscopy (TEM),
was used to analyze the used 5Cu/γ-Al2O3 which was reduced at different temperatures, did not
provide sufficient information on the catalysts which could be used to correlate the catalyst
surface and the catalytic activity. SEM analyses were implemented to obtain further information
on the surface of the catalysts, which are shown in Figures 4.32 and 4.33.
Figure 4.25. Used 5Cu/γ-Al2O3 catalyst reduced at 240 °C showing (a) Backscattered, (b) SEM,
and (c) Backscattered Map with copper (green).
Figure 4.26. Used 5Cu/γ-Al2O3 catalyst reduced at 260 °C showing (a) Backscattered, (b) SEM,
and (c) Backscattered Map with copper (green).
(a) (b) (c)
(a) (b) (c)
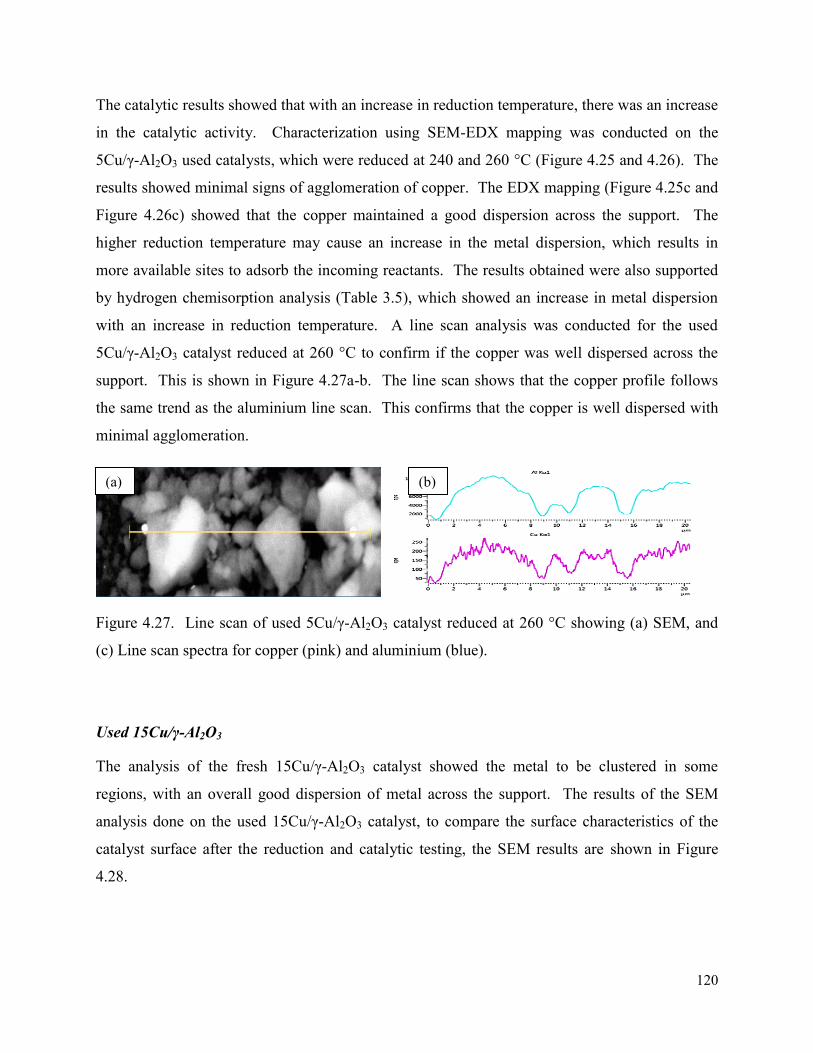
120
The catalytic results showed that with an increase in reduction temperature, there was an increase
in the catalytic activity. Characterization using SEM-EDX mapping was conducted on the
5Cu/γ-Al2O3 used catalysts, which were reduced at 240 and 260 °C (Figure 4.25 and 4.26). The
results showed minimal signs of agglomeration of copper. The EDX mapping (Figure 4.25c and
Figure 4.26c) showed that the copper maintained a good dispersion across the support. The
higher reduction temperature may cause an increase in the metal dispersion, which results in
more available sites to adsorb the incoming reactants. The results obtained were also supported
by hydrogen chemisorption analysis (Table 3.5), which showed an increase in metal dispersion
with an increase in reduction temperature. A line scan analysis was conducted for the used
5Cu/γ-Al2O3 catalyst reduced at 260 °C to confirm if the copper was well dispersed across the
support. This is shown in Figure 4.27a-b. The line scan shows that the copper profile follows
the same trend as the aluminium line scan. This confirms that the copper is well dispersed with
minimal agglomeration.
Figure 4.27. Line scan of used 5Cu/γ-Al2O3 catalyst reduced at 260 °C showing (a) SEM, and
(c) Line scan spectra for copper (pink) and aluminium (blue).
Used 15Cu/γ-Al2O3
The analysis of the fresh 15Cu/γ-Al2O3 catalyst showed the metal to be clustered in some
regions, with an overall good dispersion of metal across the support. The results of the SEM
analysis done on the used 15Cu/γ-Al2O3 catalyst, to compare the surface characteristics of the
catalyst surface after the reduction and catalytic testing, the SEM results are shown in Figure
4.28.
(a) (b)
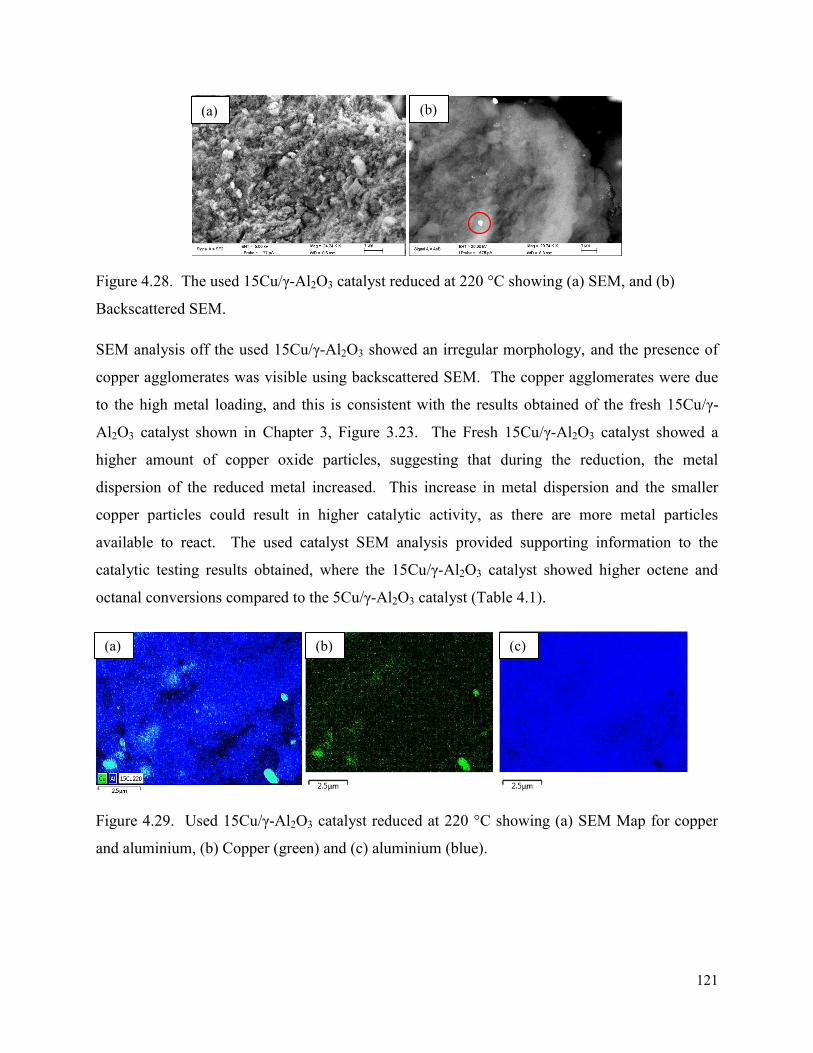
121
Figure 4.28. The used 15Cu/γ-Al2O3 catalyst reduced at 220 °C showing (a) SEM, and (b)
Backscattered SEM.
SEM analysis off the used 15Cu/γ-Al2O3 showed an irregular morphology, and the presence of
copper agglomerates was visible using backscattered SEM. The copper agglomerates were due
to the high metal loading, and this is consistent with the results obtained of the fresh 15Cu/γ-
Al2O3 catalyst shown in Chapter 3, Figure 3.23. The Fresh 15Cu/γ-Al2O3 catalyst showed a
higher amount of copper oxide particles, suggesting that during the reduction, the metal
dispersion of the reduced metal increased. This increase in metal dispersion and the smaller
copper particles could result in higher catalytic activity, as there are more metal particles
available to react. The used catalyst SEM analysis provided supporting information to the
catalytic testing results obtained, where the 15Cu/γ-Al2O3 catalyst showed higher octene and
octanal conversions compared to the 5Cu/γ-Al2O3 catalyst (Table 4.1).
Figure 4.29. Used 15Cu/γ-Al2O3 catalyst reduced at 220 °C showing (a) SEM Map for copper
and aluminium, (b) Copper (green) and (c) aluminium (blue).
(a) (b)
(a) (b) (c)
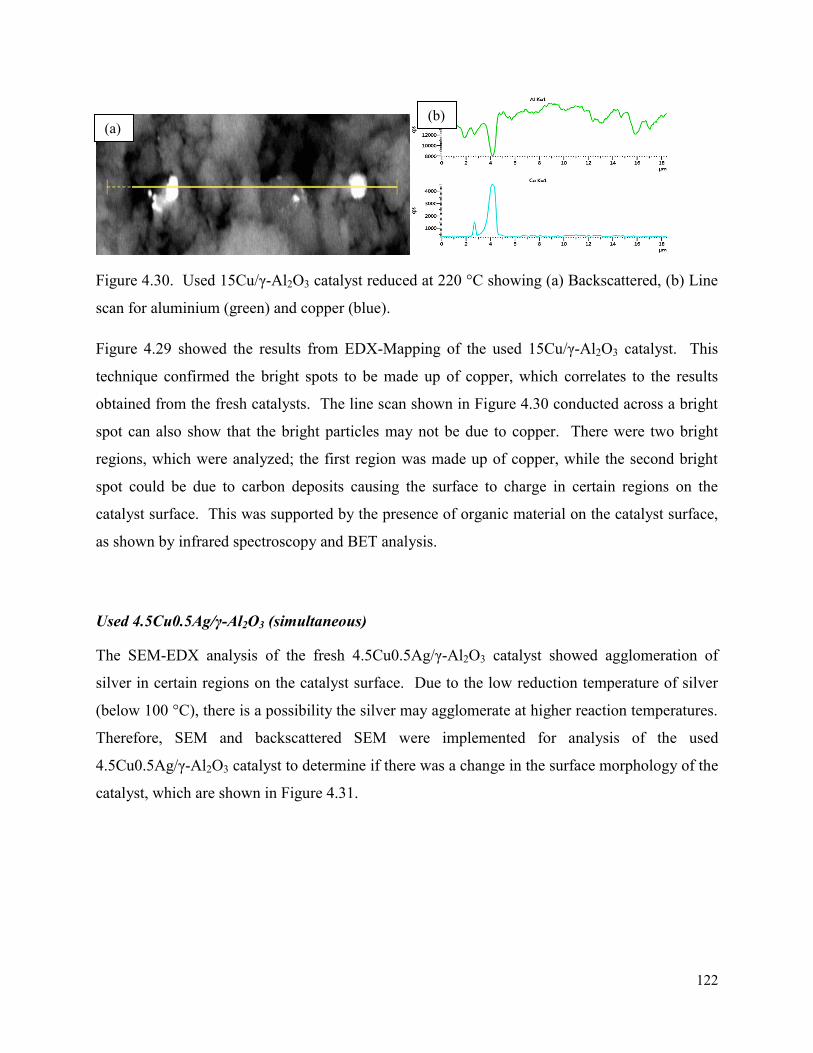
122
Figure 4.30. Used 15Cu/γ-Al2O3 catalyst reduced at 220 °C showing (a) Backscattered, (b) Line
scan for aluminium (green) and copper (blue).
Figure 4.29 showed the results from EDX-Mapping of the used 15Cu/γ-Al2O3 catalyst. This
technique confirmed the bright spots to be made up of copper, which correlates to the results
obtained from the fresh catalysts. The line scan shown in Figure 4.30 conducted across a bright
spot can also show that the bright particles may not be due to copper. There were two bright
regions, which were analyzed; the first region was made up of copper, while the second bright
spot could be due to carbon deposits causing the surface to charge in certain regions on the
catalyst surface. This was supported by the presence of organic material on the catalyst surface,
as shown by infrared spectroscopy and BET analysis.
Used 4.5Cu0.5Ag/γ-Al2O3 (simultaneous)
The SEM-EDX analysis of the fresh 4.5Cu0.5Ag/γ-Al2O3 catalyst showed agglomeration of
silver in certain regions on the catalyst surface. Due to the low reduction temperature of silver
(below 100 °C), there is a possibility the silver may agglomerate at higher reaction temperatures.
Therefore, SEM and backscattered SEM were implemented for analysis of the used
4.5Cu0.5Ag/γ-Al2O3 catalyst to determine if there was a change in the surface morphology of the
catalyst, which are shown in Figure 4.31.
(a) (b)
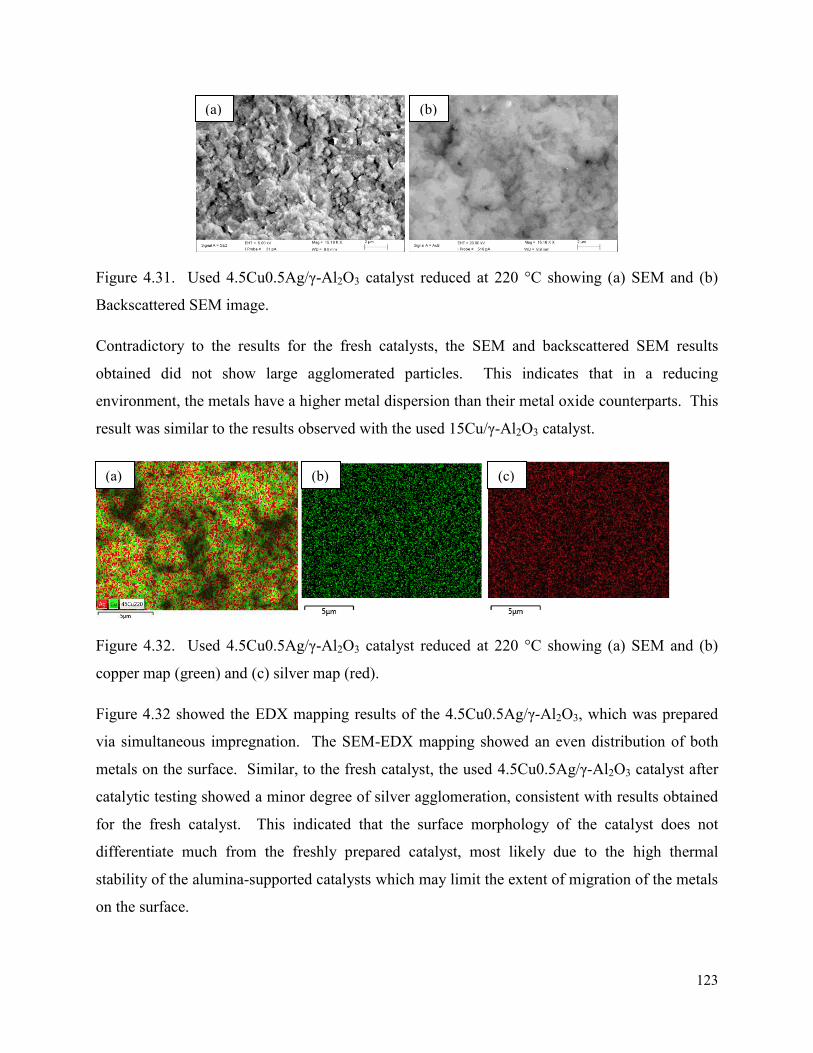
123
Figure 4.31. Used 4.5Cu0.5Ag/γ-Al2O3 catalyst reduced at 220 °C showing (a) SEM and (b)
Backscattered SEM image.
Contradictory to the results for the fresh catalysts, the SEM and backscattered SEM results
obtained did not show large agglomerated particles. This indicates that in a reducing
environment, the metals have a higher metal dispersion than their metal oxide counterparts. This
result was similar to the results observed with the used 15Cu/γ-Al2O3 catalyst.
Figure 4.32. Used 4.5Cu0.5Ag/γ-Al2O3 catalyst reduced at 220 °C showing (a) SEM and (b)
copper map (green) and (c) silver map (red).
Figure 4.32 showed the EDX mapping results of the 4.5Cu0.5Ag/γ-Al2O3, which was prepared
via simultaneous impregnation. The SEM-EDX mapping showed an even distribution of both
metals on the surface. Similar, to the fresh catalyst, the used 4.5Cu0.5Ag/γ-Al2O3 catalyst after
catalytic testing showed a minor degree of silver agglomeration, consistent with results obtained
for the fresh catalyst. This indicated that the surface morphology of the catalyst does not
differentiate much from the freshly prepared catalyst, most likely due to the high thermal
stability of the alumina-supported catalysts which may limit the extent of migration of the metals
on the surface.
(a) (b)
(a) (b) (c)
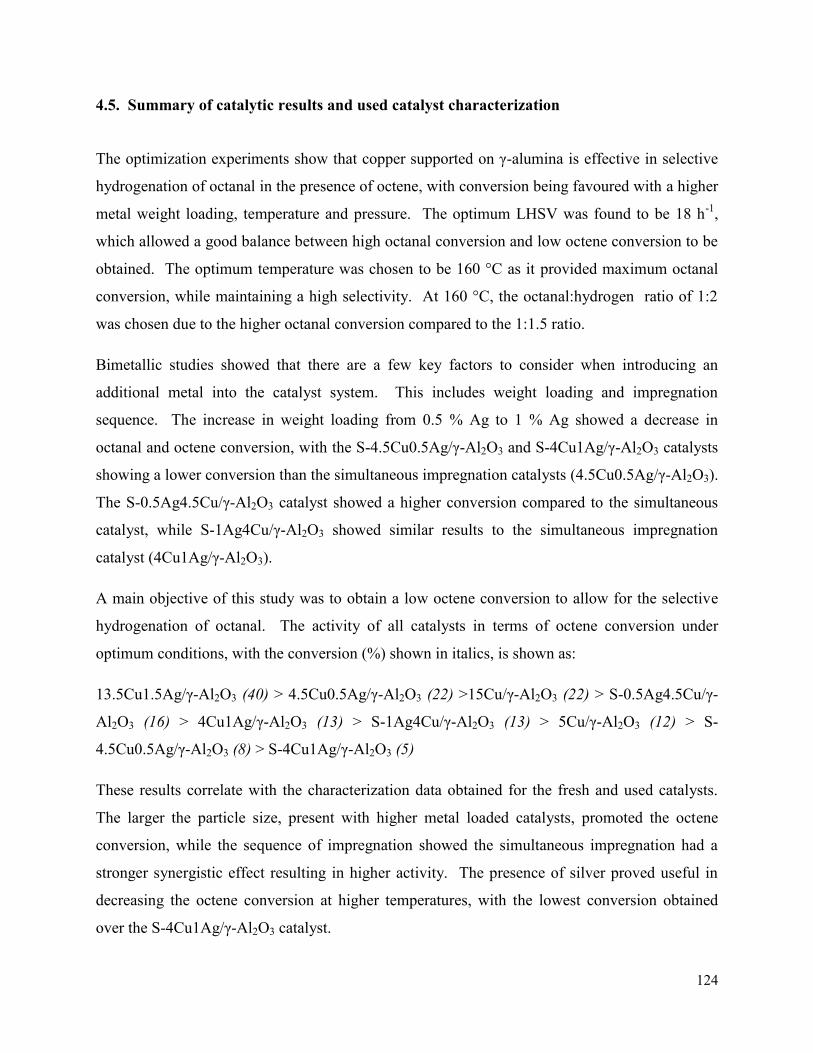
124
4.5. Summary of catalytic results and used catalyst characterization
The optimization experiments show that copper supported on γ-alumina is effective in selective
hydrogenation of octanal in the presence of octene, with conversion being favoured with a higher
metal weight loading, temperature and pressure. The optimum LHSV was found to be 18 h-1,
which allowed a good balance between high octanal conversion and low octene conversion to be
obtained. The optimum temperature was chosen to be 160 °C as it provided maximum octanal
conversion, while maintaining a high selectivity. At 160 °C, the octanal:hydrogen ratio of 1:2
was chosen due to the higher octanal conversion compared to the 1:1.5 ratio.
Bimetallic studies showed that there are a few key factors to consider when introducing an
additional metal into the catalyst system. This includes weight loading and impregnation
sequence. The increase in weight loading from 0.5 % Ag to 1 % Ag showed a decrease in
octanal and octene conversion, with the S-4.5Cu0.5Ag/γ-Al2O3 and S-4Cu1Ag/γ-Al2O3 catalysts
showing a lower conversion than the simultaneous impregnation catalysts (4.5Cu0.5Ag/γ-Al2O3).
The S-0.5Ag4.5Cu/γ-Al2O3 catalyst showed a higher conversion compared to the simultaneous
catalyst, while S-1Ag4Cu/γ-Al2O3 showed similar results to the simultaneous impregnation
catalyst (4Cu1Ag/γ-Al2O3).
A main objective of this study was to obtain a low octene conversion to allow for the selective
hydrogenation of octanal. The activity of all catalysts in terms of octene conversion under
optimum conditions, with the conversion (%) shown in italics, is shown as:
13.5Cu1.5Ag/γ-Al2O3 (40) > 4.5Cu0.5Ag/γ-Al2O3 (22) >15Cu/γ-Al2O3 (22) > S-0.5Ag4.5Cu/γ-
Al2O3 (16) > 4Cu1Ag/γ-Al2O3 (13) > S-1Ag4Cu/γ-Al2O3 (13) > 5Cu/γ-Al2O3 (12) > S-
4.5Cu0.5Ag/γ-Al2O3 (8) > S-4Cu1Ag/γ-Al2O3 (5)
These results correlate with the characterization data obtained for the fresh and used catalysts.
The larger the particle size, present with higher metal loaded catalysts, promoted the octene
conversion, while the sequence of impregnation showed the simultaneous impregnation had a
stronger synergistic effect resulting in higher activity. The presence of silver proved useful in
decreasing the octene conversion at higher temperatures, with the lowest conversion obtained
over the S-4Cu1Ag/γ-Al2O3 catalyst.
125
A summary of the octanal conversion under optimum conditions, shown in italics, showed the
following trend.
S-0.5Ag4.5Cu/γ-Al2O3 (100) > 15Cu/γ-Al2O3 (100) > 4.5Cu0.5Ag/γ-Al2O3 (98) >
13.5Cu1.5Ag/γ-Al2O3 (96) > 4Cu1Ag/γ-Al2O3 (96) > S-1Ag4Cu/γ-Al2O3 (93) > S-4Cu1Ag/γ-
Al2O3 g (91) > 5Cu/γ-Al2O3 (90) > S-4.5Cu0.5Ag/γ-Al2O3 (79)
This was consistent with results obtained from chemisorption studies where the higher metal
dispersion had more available active sites for adsorption and hydrogenation of the incoming
octanal and octene reactants. With the sequential catalysts, when copper was impregnated first,
the silver on the upper layer minimized or inhibited the access and availability of the active
copper sites, which decreased conversion of both reactants. The S-4.5Cu0.5Ag/γ-Al2O3 showed
the lowest octanal conversion due to the silver on the upper layer having a higher dispersion over
the copper compared to the S-4Cu1Ag/γ-Al2O3, where silver would tend to agglomerate to other
silver atoms, exposing more copper.
All catalysts showed selectivities greater than 95 % towards octanol. It was shown that when
silver was impregnated first, the copper migration into the alumina lattice was inhibited, thus
increasing the copper dispersion allowing for a higher amount of available active sites. The most
suitable catalyst was concluded to be the S-4Cu1Ag catalyst, as this catalyst showed the lowest
octene conversion, while maintaining a good conversion of octanal of approximately 91 % and a
high selectivity towards octanol.
Used catalysts were characterized using IR, ICP, BET, XRD, SEM, and TEM analysis. These
techniques showed a minor presence of carbon deposits/organics on the surface, with no signs of
metal leaching, and no significant changes in morphology indicating that all catalysts were
thermal stable and recyclable.
126
Chapter 5 Conclusions and Future Work
Conclusions
Selective hydrogenation of C=O functional groups in the presence of C=C functional groups has
been considered difficult due to the C=C bond being more thermodynamically favoured to
hydrogenate. Extensive studies have been conducted over a wide range of catalytic systems, and
new catalysts, are constantly investigated to determine the most efficient system for this reaction.
Copper has been established in previous work to be active in the selective hydrogenation for
unsaturated carbonyl molecules. This research effort showed γ-Al2O3 supported CuAg catalysts,
which were used for the selective hydrogenation of octanal in the presence of octene in a
competitive reaction environment. The optimum conditions were chosen to be 160 °C, 50 bar
pressure, 18 h-1 LHSV, and 1:2 octanal:hydrogen ratio.
Nine catalysts were prepared using wet impregnation and were characterized using various
techniques to obtain an insight into the surface composition and interaction between the copper
and silver impregnated on the alumina support. SEM-EDX, TPR and H2/CO chemisorption
studies showed key differences between the simultaneous and sequential impregnation catalysts.
This was used to understand and correlate the results, obtained from catalytic testing. Notable
difference showed with the 5 % Cu and 15 % Cu catalysts was that an increase in weight loading
resulted in clustering and agglomeration of the copper oxide on the surface in the higher loaded
catalyst. This was confirmed using XRD, SEM-EDX and TPR. TPR also showed a decrease in
reduction temperature for the bimetallic catalysts, with the copper and silver having a good
dispersion on the support. STEM-EDX provided useful information in determining the surface
composition and metal-metal interaction. Other techniques such as BET, TGA, and TPD all
served as supporting techniques in establishing surface characteristics.
The 5 wt % catalysts were further investigated for the effect of silver and impregnation sequence,
this resulted in the higher loading of silver increasing the selectivity towards octanal conversion,
127
while allowing for minimal octene conversion making a suitable catalyst. It was observed that a
low loading of silver (0.5 % Ag) causes an increase in defect sites, resulting in a strong
synergistic effect. At a silver loading of 1 %, the silver has a higher preference to agglomerate
with other silver particles present rather than the copper particles, therefore the synergistic effect
between these two metals were not as strong as with the 4.5Cu0.5Ag/γ-Al2O3 catalysts.
The effect of silver was established by preparing and testing a wide range of 5 wt % bimetallic
catalyst. A few key factors were established; namely a suitable total weight loading, the weight
loading of silver, and the impregnation technique. Catalytic results showed, with monometallic
catalysts, a higher weight loading showed higher activity, which in some cases may not be a
desired result due to the increased octene conversion. Under optimum conditions, the higher
weight loadings of the bimetallic catalysts showed the formation of silver agglomerates which
resulted in a decrease the activity.
The results obtained indicated a lower weight loading of 5 % for bimetallic catalyst system was
more suitable compared to the 15 wt % catalysts. The 5 wt % bimetallic catalysts provided low
octene conversion and high octanal conversion under optimum conditions. The octanol
selectivity across all catalysts was higher than 95%, with the major byproducts being octyl
octanoate, C16 diol and C24 acetal, which varied depending on the acidity of the catalysts and
the temperature of the reaction. From the seven 5 wt % bimetallic catalysts investigated, the S-
4Cu1Ag showed a lowest octene conversion of 5 % under optimum conditions, indicating that
this catalyst system was most suitable, while maintaining a good conversion and octanol
selectivity comparable to that of a monometallic copper catalyst system.
This work showed that within bimetallic systems investigated, their activity was dependent on a
few key factors such as total weight loading of the catalyst, intermetallic weight loading and the
impregnation sequence (simultaneous and sequential). It can be concluded that the presence of
silver proved beneficial for the selective hydrogenation of octanal in the presence of octene,
which allowed for minimal octene conversion while maintaining high octanal conversion and
octanol selectivity as in the case of the 4Cu1Ag/γ-Al2O3 catalyst.
128
Kinetic calculations was implemented understand the rates of reaction towards the octanol
formation and relates the surface characteristics (acidity and metal dispersion) contribution
towards the selectivity of the desired and undesired products and byproducts.
Future work
The results obtained in this study provided sufficient information for a strong foundation into the
use of copper-silver bimetallic catalysts for selective hydrogenation. Further investigation of
these bimetallic catalysts must be extended to establish their effectiveness in selective
hydrogenation with reactant feeds containing a higher concentration of octene in the presence of
octanal. The application of these catalysts can also be extended into different mixed feeds such
as an alkyne:alkene system, as this is a well-known industrial process which requires selective
hydrogenation of alkyne to alkenes.
It was stated in this work that the alumina support contributed to the by-product formation and
the migration of copper into the lattice forming a copper aluminate phase which was inactive for
hydrogenation. It is important to change the support to provide supporting information on
observations presented in this work. It is expected that the change in support would vary the
metal-support interaction and its contribution towards byproduct formation, however, the extent
of the support effect must be established to prove that the copper and silver are the active
components responsible for selective hydrogenation. This can further be extended by looking at
the effect of the impregnation sequence, as shown in this study, as this showed significant effect
on the catalyst activity.
Lastly, a general overview on the results obtained in this work showed that the bimetallic
catalysts showed a changed catalytic behavior due to metal-metal interaction. In this work,
copper was presented as the active metal, while silver allowed for synergistic effects and a
change in the metal dispersion. Therefore, a different second metal could be added to the
copper/alumina system to determine the preferred or most efficient bimetallic system.
Additionally, a monometallic silver/alumina catalyst must also be investigated to provide further
information on the contribution to silver in the bimetallic catalyst system. The incorporation of

129
additional promoters or additives can be introduced to the catalytic system, such as ionic liquids,
which will alter the surface properties, thus changing the behavior of the catalyst.
130
References
1. D. Astruc, Introduction to catalysis, in Organometallic chemistry and catalysis J. Perez, Editor. 2007.Springer Berlin Heidelberg,14. p. 351-355.
2. I. Chorkendorff and J. W. Niemantsverdriet, Introduction to catalysis, in Concepts of modern catalysis and kinetics, VCH-Wiley, Editor. 2003. Germany,1. p. 1-12.
3. J. H. Sinfelt,AIChE Journal,(1979).25(4):p. 734-734. 4. M. V. Twigg and M. S. Spencer,App. Cat.A: Gen.,(2001).212(1–2):p. 161-174. 5. J. A. Moulijn, A. E. van Diepen, and F. Kapteijn,App.Cat. A: Gen.,(2001).212(1–2):p. 3-16. 6. D. P. Secondary.Collision theory.2013 [cited 2013 14 Jan]; Available from:
http://duch.sd57.bc.ca/~rmcleod/Chemists_Corner/PE_Diagram_Multi.html. 7. J. N. Armor,Catal. Today,(2011).163(1):p. 3-9. 8. F. E. Kühn, Catalysis. From principles to applications. , in Angewandte chemie international
edition, Matthias Beller, Albert Renken, and Rutger A. van Santen, Editors. 2013.WILEY-VCH Verlag,1. p. 2650-2680.
9. B. Lindström and L. Pettersson,CATTECH,(2003).7(4):p. 130-138. 10. A. J. B. Robertson,Platinum Metals Rev.,(1975).19(2):p. 64-69. 11. H. Schulz,App. Cat. A: Gen.,(1999).186(1–2):p. 3-12. 12. A. V. Sapre, Conversion of methanol to olefins in a tubular reactor with light olefin co-feeding,
1986, Google Patents. 13. I. A. Cody, d. Glen P. Hamner, W. H. Sawyer, and J. J. Schorfheide, Method for producing a wax
isomerization catalyst, 1990, Google Patents. 14. W. S. Frederick and W. R. Frank, Hydrocarbon conversion by contact with active catalyst and
inert solid heat carryingmaterial, 1948, Google Patents. 15. K. E. Holt,ChemInform,(2005).36(42):p. 1-3. 16. T. Johannes, M. R. Simurdiak, and H. Zhao, Biocatalysis, in Encyclopedia of chemical
processing. 2006. 101-110. 17. P. Wanner and R. Tressl,Eur. J.Biochem.,(1998).255(1):p. 271-278. 18. M. A. Swiderska and J. D. Stewart,J.Mol. Catal.B: Enzym.,(2006).42(1–2):p. 52-54. 19. T. Hirata, A. Matsushima, Y. Sato, T. Iwasaki, H. Nomura, T. Watanabe, S. Toyoda, and S.
Izumi,J Mol Catal B Enzym,(2009).59(1-3):p. 5-5. 20. H. Zhang, X. Gao, J. Ren, J. Feng, T. Zhang, Q. Wu, and D. Zhu,J.Mol. Catal. B:
Enzym.,(2014).105(0):p. 118-125. 21. M. K. Lam, K. T. Lee, and A. R. Mohamed,Biotechnology Adv.,(2010).28(4):p. 500-518. 22. B. Cornils and W. A. Herrmann,J.Catal.,(2003).216(1–2):p. 23-31. 23. D. Morzin and T. Salmi, Catalysis, in Catalytic kinetics, Elsevier B. V, Editor. 2005. The
Netherlands,2. p. 27-43. 24. Introduction to hydroformylation, in Rhodium catalyzed hydroformylation, P. W. N. M. van
Leeuvan and Carmen Claver, Editors. 2001.Kluwer Academic Publishers: The Netherlands,1. p. 1-13.
25. I. Choinopoulos, I. Papageorgiou, S. Coco, E. Simandiras, and S. Koinis,Polyhedron,(2012).45(1):p. 255-261.
26. J. Zakzeski, H. R. Lee, Y. L. Leung, and A. T. Bell,App. Cat. A: Gen.,(2010).374:p. 201-212. 27. M. L. Clarke,Polyhedron,(2001).20(3–4):p. 151-164.
131
28. M. Beller, Homogeneous catalysis for fine chemical synthesiss — new trends and perspectives —, in Heterogeneous catalysis and fine chemicals iv, H.U. Blaser, A. Baiker, and R. Prins, Editors. 1997.Elsevier,1. p. 1-16.
29. P. W. N. M. van Leeuwen, Introduction, in Homogeneous catalysis: Understanding the art, Kluwer Academic Publishers, Editor. 2006. The Netherlands,1. p. 1-10.
30. C. Perego and P. Villa,Catalysis Today,(1997).34(3–4):p. 281-305. 31. K. W. Kolaninski, Surface science, foundation of catalysis and surface science, John Wiley &
sons, Editor. 2012. West Sussex, United Kingdom,1. p. 3-10. 32. S. Nishimura, Hydrogenation of aldehydes and ketones, in Handbook of heterogeneous catalytic
hydrogenation for organic synthesis, John Wiley & Sons, Editor. 2001. United States of America,5. p. 170-218.
33. M. Sankar, N. Dimitratos, P. J. Miedziak, P. P. Wells, C. J. Kiely, and G. J. Hutchings,Chem. Soc. Rev.,(2012).41(24):p. 8099-8139.
34. S. Nanda.Reactors and fundamentals of reactors design for chemical design,Maharshi Dayanand University,Delhi,PhD,p.2-22
35. V. K. Jayaraman and B. D. Kulkarni, Catalytic reactors: A review, in Encyclopedia of Life Support Systems: India. p. 1-9.
36. K. R. Westerterp, E. J. Molga, and K. B. van Gelder,Chem. Eng. and Processing: Process Intensification,(1997).36(1):p. 17-27.
37. T. E. C. Industry.Chemical reactors.2013 26 March]; Available from: http://www.essentialchemicalindustry.org/processes/chemical-reactors.html.
38. G. Biardi and G. Baldi,Catal. Today,(1999).52(2–3):p. 223-234. 39. D. Mousko.Heterogeneous catalysis in the different reactor types on the examples of ethyl
benzene to styrene, methane dehydroaromatization, and propylene carbonate/methanol transesterification,Rhine Westphalia University of Technology,Aachen,PhD,p.3-14
40. N. Gounden.The oxidative activation of n-octane over titania supported cobalt,University of KwaZulu-Natal,South Africa,MSc,p.1-10
41. F. A. N. Fernandes and L. M. F. Lona,Brazilian J.Chem.Eng.,(2000).17:p. 163-170. 42. B. Bachiller-Baeza, I. Rodr guez-Ramos, and A. Guerrero-Ruiz,App. Cat. A: Gen.,(2001).205(1–
2):p. 227-237. 43. Wikipedia.James. F. Boyce, sr.2014 [cited 2014 7 Jan]; Available from:
http://en.wikipedia.org/wiki/James_F._Boyce,_Sr. 44. V. Ponec,App. Cat. A: Gen.,(1997).149(1):p. 27-48. 45. Sanfilippo. D, Catalytic industrial process, in Catalysis2009, EOLSS. p. 1-9. 46. G. Scrinis,World Nutrition,(2014).5(1). 47. Reactions, in Hydrogen: An overview, E.P.Muljadi, Editor. 1979.CRC Press,3. p. 72-82. 48. BASF.Make the right move with nanoselect catalysts.2009 [cited 2014 1 August]; Available
from: https://www.basf.de/basf2/img/pharma/2009-01/BASF_NanoSelect.pdf. 49. B. Yang, R. Burch, C. Hardacre, G. Headdock, and P. Hu,ACS Catal.,(2013).4(1):p. 182-186. 50. A. Andoni and R. A. van Santen,Chem. Eng. Trans.,(2013).34:p. 19-24. 51. M. Lenarda, M. Casagrande, E. Moretti, L. Storaro, R. Frattini, and S. Polizzi,Catal.
Letters,(2007).114(1-2):p. 79-84. 52. A. A. Nikolopoulos, B. W. L. Jang, and J. J. Spivey,App. Cat. A: Gen,(2005).296(1):p. 128-136. 53. S. K. Sharma, P. A. Parikh, and R. V. Jasra,J.Mol.Catal. A: Chem.,(2010).316(1–2):p. 153-162. 54. A. B. da Silva, E. Jordão, M. J. Mendes, and P. Fouilloux,App. Cat. A: Gen.,(1997).148(2):p.
253-264. 55. A. Mori, T. Mizusaki, Y. Miyakawa, E. Ohashi, T. Haga, T. Maegawa, Y. Monguchi, and H.
Sajiki,Tetrahedron,(2006).62(51):p. 11925-11932. 56. J. Hong, W. Chu, M. Chen, X. Wang, and T. Zhang,Catal.Comm.,(2007).8(3):p. 593-597.
132
57. M. B. Smith and March. J, March's advanced organic chemistry: Reactions, mechanisms and structure, , Inc Wiley & Sons, Editor. 2007.Wiley & Sons, Inc, : Hoboken, New Jersey,15. p. 1792-1793.
58. B. Wu, H. Huang, J. Yang, N. Zheng, and G. Fu,Ang. Chem. Int. Ed.,(2012).51(14):p. 3440-3443.
59. J. M. Winterbottom, H. Marwan, J. Viladevall, S. Sharma, and S. Raymahasay, Selective catalytic hydrogenation of 2-butyne-1,4-diol to cis-2-butene-1,4-diol in mass transfer efficient slurry reactors, in Heterogeneous catalysis and fine chemicals iv, A. Baiker H.U. Blaser and R. Prins, Editors. 1997.Elsevier: The Netherlands,7. p. 59-66.
60. X. Wang, R. Y. Saleh, and U. S. Ozkan,J.Catal.,(2005).231(1):p. 20-32. 61. G. M. R. van Druten and V. Ponec,App.Cat. A: Gen.,(2000).191(1–2):p. 153-162. 62. A. Stolle, T. Gallert, C. Schmoger, and B. Ondruschka,RSC Adv.,(2013).3(7):p. 2112-2153. 63. R. L. Augustine and J. V. Peppen,Annals of the New York Academy of Sciences,(1969).158(2):p.
482-491. 64. B. Mattson, W. Foster, J. Greimann, T. Hoette, N. Le, A. Mirich, S. Wankum, A. Cabri, C.
Reichenbacher, and E. Schwanke,J.Chem. Ed.,(2013).90(5):p. 613-619. 65. R. J. Baxter and P. Hu, J.Chem. Phys.,(2002).116(11):p. 4379-4381. 66. E. E. Gonzo, J. C. Gottifredi, and L. C. Romero,Chem. Eng. Sci.,(1988).43(6):p. 1410-1413. 67. B. Yang, X.-Q. Gong, H.-F. Wang, X.-M. Cao, J. J. Rooney, and P. Hu,J.Am.Chem.
Soc.,(2013).135(40):p. 15244-15250. 68. B. Bridier, N. López, and J. Pérez-Ramírez,J.Catal.,(2010).269(1):p. 80-92. 69. C. Ando, H. Kurokawa, and H. Miura,App.Cat. A: Gen.,(1999).185(2):p. L181-L183. 70. P. Gallezot and D. Richard,Catal.Revi.sci. and Eng.,(1998).40(1-2):p. 81-126. 71. A. Govender.Supported copper oxide catalysts for octanal hydrogenation: The influence of
water,University of KwaZulu-Natal,South Africa,MSc,p.1-162 72. S. Sitthisa, T. Sooknoi, Y. Ma, P. B. Balbuena, and D. E. Resasco,J. Catal.,(2011).277(1):p. 1-13. 73. J. D. Roberts and M. C. Caserio, Alkenes and alkynes ii. Oxidation and reduction reaction,
acidity or alkynes in Basic principles of organic chemistry, W. A. Benjamin, Editor. 1977. Canada,16. p. 405-437.
74. C. S. Karaiskos, D. Matiadis, O. Igglessi-Markopoulou, and J. Markopoulos, Homogeneous chemoselective hydrogenation of heterocyclic compounds – the case of 1,4 addition on conjugated c-c and c-o double bonds of arylidene tetramic acids, in Hydrogenation, Iyad Karame, Editor. 2012.InTech,4. p. 91-120.
75. A. K. Ghosh and K. Krishnan,Tetrahedron Letters,(1998).39(9):p. 947-948. 76. H. Donkervoot,Focus on Catalysts,(2009).2009(5):p. 6. 77. H. Sajiki, S. Mori, T. Ohkubo, T. Ikawa, A. Kume, T. Maegawa, and Y. Monguchi,Chemistry –
A Eur. Journal,(2008).14(17):p. 5109-5111. 78. I. T. Duncanson, I. W. Sutherland, B. Cullen, S. D. Jackson, and D. Lennon,Catal.
Letters,(2005).103:p. 3-4. 79. C. V. Rode, P. R. Tayae, J. M. Nadgeri, R. Jaganathan, and R. V. Chaudari,Org. Process
Research and Development,(2006).10:p. 278-284. 80. R. V. Sharma, U. Das, R. Sammynaiken, and A. K. Dalai,App. Cat.A: Gen.,(2013).454(0):p. 127-
136. 81. M. M. Villaverde, N. M. Bertero, T. F. Garetto, and A. J. Marchi,Catal. Today,(2013).213(0):p.
87-92. 82. P. Sangeetha, B. M. Nagaraja, K. Shanthi, K. S. Rama Rao, and S. Narayanan,Bulletin of the
Catalyis Society of India,(2009).8:p. 52-63. 83. J. P. Dath, F. Genin, K. Hortmann, and G. Vulpescu,Catalyst and process for hydrogenation of
hydrocarbon feedstocks,(2010),Total Petrochemicals Research Feluy,EP20080172308 84. S. J. Stanley and C. Sumner,Catalytic distillation and hydrogenation of heavy unsaturates in an
olefins plant,(1999),US 08/914,712
133
85. R. R. Whetstone,Preparation of acrolein acetal,(1953),US2626283 86. M. Foral, L. Satek, and D. Ventura,Process for recovery of diene-free feedstocks from olefinic
process streams,(2003),BP Corp North America Inc.,PCT/US2002/034929 87. B. M. Bhanage, S. S. Divekar, R. M. Deshpande, and R. V. Chaudhari,J.Mol.Catal. A:
Chem.,(1997).115(2):p. 247-257. 88. A. R. Tadd, A. Marteel, M. R. Mason, J. A. Davies, and M. A. Abraham, J.Supercritical
Fluids,(2003).25(2):p. 183-196. 89. A. B. Rivas, J. J. Pérez-Torrente, A. J. Pardey, A. M. Masdeu-Bultó, M. Diéguez, and L. A.
Oro,J.Mol.Catal. A: Chem.,(2009).300(1–2):p. 121-131. 90. L. c. Ropartz, R. E. Morris, D. F. Foster, and D. J. Cole-Hamilton,J.Mol.Catal. A:
Chem.(2002).182–183(0):p. 99-105. 91. J. Qiu, H. Zhang, X. Wang, and B. Yin,Preprints of Papers-Am.Chem.Soc., Division of Fuels and
Chemicals,(2004).49(2):p. 940-941. 92. S.-Y. Yun, M. J. Seong, J.-H. Yim, Y. S. Ko, Y.-K. Park, and J.-K. Jeon,Rev. Adv. Materials
Science,(2011).28(2):p. 154-157. 93. M. Benaissa, U. J. Jáuregui-Haza, I. Nikov, A. M. Wilhelm, and H. Delmas,Catal.
Today,(2003).79–80(0):p. 419-425. 94. U. J. Jáuregui-Haza, E. Pardillo-Fontdevila, P. Kalck, A. M. Wilhelm, and H. Delmas,Catal.
Today,(2003).79–80(0):p. 409-417. 95. A. Riisager, K. M. Eriksen, P. Wasserscheid, and R. Fehrmann,Catal. Letters,(2003).90(3-4):p.
149-153. 96. D. T. Johnson Mattey.Sasol heptene to 1-octanol.2014 [cited 2014 16 Jan ]; Available from:
http://www.davyprotech.com/default.aspx?cid=500. 97. T. Chetty, H. B. Friedrich, V. D. B. C. Dasireddy, A. Govender, P. J. Mohlala, and W.
Barnard,ChemCatChem,(2014).6(8):p. 2384-2393. 98. P. Gallezot and D. Richard,Catal. Reviews,(1998).40(1-2):p. 81-126. 99. R. Bruckner, Additions of heteroatom nucleophiles to carbonyl compounds and subsequent
reactions—condensations of heteroatom nucleophiles with carbonyl compounds, in Organic mechanisms: Reactions, stereochemistry and synthesis, Micheal Harmata, Editor. 2010.Springer,6. p. 359-395.
100. A. Burrows, J. Holman, A. Parsons, G. Pilling, and G. Price, Aldehydes and ketones,: Nucleophillic addition and α--substitution reactions, in Chemistry: Introducing inorganic, organic and physical chemistry, OUP Oxford, Editor. 2013. United States,23. p. 1050-1088.
101. K. G. Bothara, Nucleophilic addition of a carbonyl function, in Organic pharmaceutical chemistry, Nirali Prakashan, Editor. 2008. Pune,9. p. 119-132.
102. S. Veibel and J. I. Nielsen,Tetrahedron,(1967).23(4):p. 1723-1733. 103. M. N. Dvornikoff and M. W. Farrar, J.Org.Chem.,(1957).22(5):p. 540-542. 104. B. C. Gates and F. C. Jentoft, Advances in catalysis, ed. Elsevier Science. Vol. 56. 2013, USA. 105. B. A. Tschaen, J. R. Schmink, and G. A. Molander,Org.Letters,(2013).15(3):p. 500-503. 106. V. Bethmont, C. Montassier, and P. Marecot,J. Mol.Catal.A: Chem.,(2000).152(1–2):p. 133-140. 107. J. M. Bell, D. G. Kubler, P. Sartwell, and R. G. Zepp, J. Org. Chem.,(1965).30(12):p. 4284-4292. 108. W. S. Millman and G. V. Smith, Role of acetal formation in metal catalyzed hydrogenation and
exchange of cinnamaldehyde in Catalysis in organic syntheses 1977, Gerard V. Smith, Editor. 1977.Academic Press: United States of America,1. p. 33-65.
109. F. Delbecq and P. Sautet,J.Catal.,(1995).152(2):p. 217-236. 110. W. Q. Du, Z. M. Rong, Y. Liang, Y. Wang, X. Y. Lu, Y. F. Wang, and L. H. Lu,Chinese Chem.
Letters,(2012).23(7):p. 773-776. 111. S. Valange, A. Derouault, J. Barrault, and Z. Gabelica,J. Mol.Catal.A: Chem.,(2005).228(1–2):p.
255-266. 112. J. Joubert and F. Delbecq,Organometallics,( 2006).25:p. 854-861.
134
113. K. H. Lim, A. B. Mohammad, I. V. Yudanov, K. M. Neyman, M. Bron, P. Claus, and N. R sc h,The Journal of Physical Chemistry C,(2009).113(30):p. 13231-13240.
114. V. N. Ipatieff and V. Haensel,J.Am. Chem.Soc.,(1942).64(3):p. 520-521. 115. F. Zaccheria, N. Ravasio, R. Psaro, and A. Fusi,Tetrahedron Letters,(2005).46(21):p. 3695-3697. 116. R. Hubaut, M. Daage, and J. P. Bonnelle,App. Cat.,(1986).22(2):p. 243-255. 117. R. Hubaut, M. Daage, and J. P. Bonnelle,App.Cat.,(1986).22(2):p. 231-241. 118. R. Hubaut, M. Daage, and J. P. Bonnelle, Role of electronic effects and steric hindrance in
hydrogenation of unsaturated compounds on copper chromite catalysts, in Studies in surface science and catalysis, J. Barrault C. Bouchoule D. Duprez C. Montassier M. Guisnet and G. Pérot, Editors. 1988.Elsevier,3. p. 131-138.
119. A. Chambers, S. David Jackson, D. Stirling, and G. Webb,J.Catal.,(1997).168(2):p. 301-314. 120. A. J. Marchi, D. A. Gordo, A. F. Trasarti, and C. R. Apestegu a,App.Cat. A:
Gen.,(2003).249(1):p. 53-67. 121. E. Sayah, C. La Fontaine, V. Briois, D. Brouri, and P. Massiani,Catal. Today,(2012).189(1):p. 55-
59. 122. N. Bogdanchikova, F. C. Meunier, M. Avalos-Borja, J. P. Breen, and A. Pestryakov,App. Cat. B:
Environ.,(2002).36(4):p. 287-297. 123. R. Crook, J. Deering, S. J. Fussell, A. M. Happe, and S. Mulvihill,Tetrahedron
Letters,(2010).51(39):p. 5181-5184. 124. M. Bron, D. Teschner, A. Knop-Gericke, F. C. Jentoft, J. Krohnert, J. Hohmeyer, C. Volckmar,
B. Steinhauer, R. Schlogl, and P. Claus,Phys. Chem.Chem. Phys.,(2007).9(27):p. 3559-3569. 125. K. Brandt, M. E. Chiu, D. J. Watson, M. S. Tikhov, and R. M. Lambert,J.Am.
Chem.Soc.,(2009).131(47):p. 17286-17290. 126. D. Diesing, G. Kritzler, and A. Otto. Electron and ion transfer in condensed media: Theoretical
physics for reaction kinectics. 1997. Italy: World Scientific. 127. Y. Nagase, H. Hattori, and K. Tanabe,Chem.Letters,(1983).12(10):p. 1615-1618. 128. Y. Chen, C. Wang, H. Liu, J. Qiu, and X. Bao,Chem.Communications,(2005)(42):p. 5298-5300. 129. P. Claus, P. Kraak, and R. Schödel,Studies in Sur. Sci.Catal.,(1997).108:p. 281-288. 130. W. Grünert, A. Brückner, H. Hofmeister, and P. Claus,J.Phys.Chem. B,(2004).108(18):p. 5709-
5717. 131. M. Bron, D. Teschner, A. Knop-Gericke, B. Steinhauer, A. Scheybal, M. Hävecker, D. Wang, R.
Födisch, D. Hönicke, A. Wootsch, R. Schlögl, and P. Claus,J.Catal.,(2005).234(1):p. 37-47. 132. H. Wei, C. Gomez, J. Liu, N. Guo, T. Wu, R. Lobo-Lapidus, C. L. Marshall, J. T. Miller, and R.
J. Meyer,J.Catal.,(2013).298(0):p. 18-26. 133. R. Ferullo, M. M. Branda, and F. Illas,J.Phys.Chem.Letters,(2010).1(17):p. 2546-2549. 134. P. Claus and H. Hofmeister, J.Phys.Chem.B,(1999).103(14):p. 2766-2775. 135. C. E. Volckmar, M. Bron, U. Bentrup, A. Martin, and P. Claus,J. Catal.,(2009).261(1):p. 1-8. 136. C. Baatz, N. Decker, and U. Prüße,J.Catal.,(2008).258(1):p. 165-169. 137. S. Ivanova, V. Pitchon, Y. Zimmermann, and C. Petit,App. Cat. A: Gen.,(2006).298(0):p. 57-64. 138. M. Bowker, A. Nuhu, and J. Soares,Catal. Today,(2007).122(3–4):p. 245-247. 139. A.-F. An, A.-H. Lu, Q. Sun, J. Wang, and W.-C. Li,Gold Bulletin,(2011).44(4):p. 217-222. 140. G. C. Bond and P. A. Sermon,Gold Bulletin,(1973).6(4):p. 102-105. 141. A. Sanchez, S. Abbet, U. Heiz, W. D. Schneider, H. Häkkinen, R. N. Barnett, and U. Landman,J
Phys.Chem.A,(1999).103(48):p. 9573-9578. 142. N. Perret, F. Cárdenas-Lizana, and M. A. Keane,Catal.Comm.,(2011).16(1):p. 159-164. 143. V. R. Choudhary, P. A. Chaudhari, and V. S. Narkhede,Catal. Comm.,(2003).4(4):p. 171-175. 144. A. Hugon, L. Delannoy, J.-M. Krafft, and C. Louis, J.Phys. Chem. C,(2010).114(24):p. 10823-
10835. 145. R. Ferrando, J. Jellinek, and R. Johnston,Chem. Rev.,(2008).108(3):p. 845-910. 146. H. Wei.Selective hydrogenation of acrolein over supported silver and silver alloy
catalysts,University of Illinois,Chicago, Illinois,PhD,p.7-15
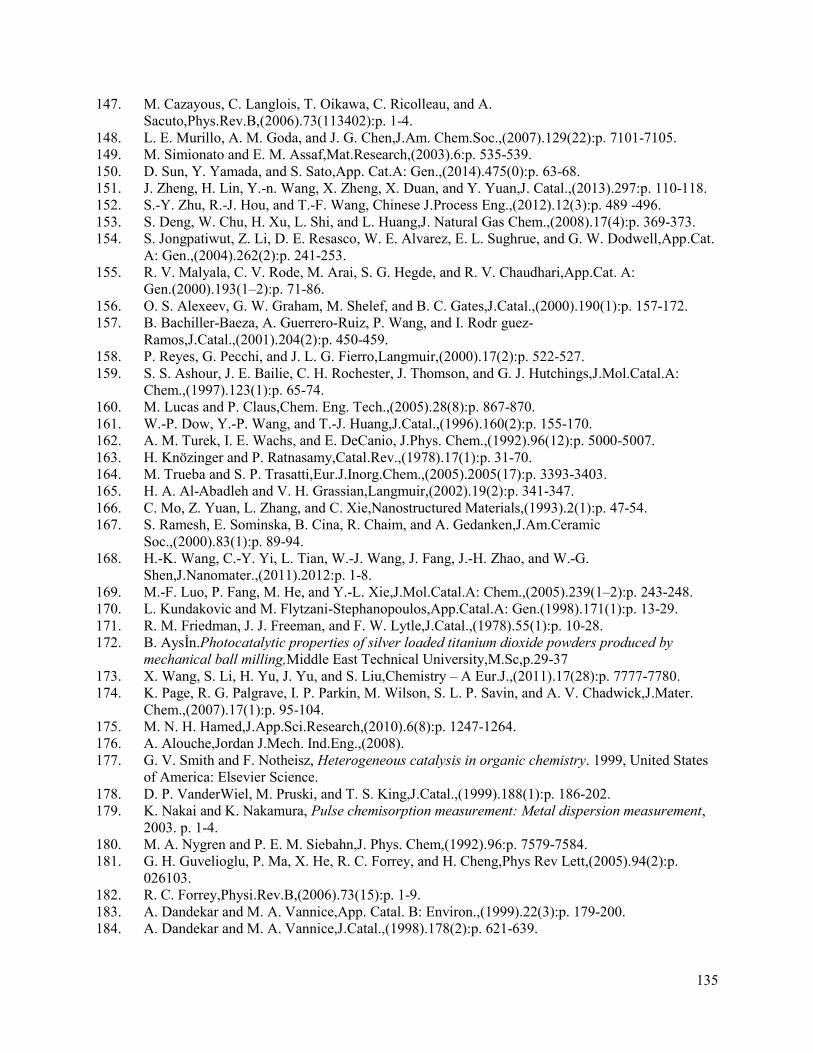
135
147. M. Cazayous, C. Langlois, T. Oikawa, C. Ricolleau, and A. Sacuto,Phys.Rev.B,(2006).73(113402):p. 1-4.
148. L. E. Murillo, A. M. Goda, and J. G. Chen,J.Am. Chem.Soc.,(2007).129(22):p. 7101-7105. 149. M. Simionato and E. M. Assaf,Mat.Research,(2003).6:p. 535-539. 150. D. Sun, Y. Yamada, and S. Sato,App. Cat.A: Gen.,(2014).475(0):p. 63-68. 151. J. Zheng, H. Lin, Y.-n. Wang, X. Zheng, X. Duan, and Y. Yuan,J. Catal.,(2013).297:p. 110-118. 152. S.-Y. Zhu, R.-J. Hou, and T.-F. Wang, Chinese J.Process Eng.,(2012).12(3):p. 489 -496. 153. S. Deng, W. Chu, H. Xu, L. Shi, and L. Huang,J. Natural Gas Chem.,(2008).17(4):p. 369-373. 154. S. Jongpatiwut, Z. Li, D. E. Resasco, W. E. Alvarez, E. L. Sughrue, and G. W. Dodwell,App.Cat.
A: Gen.,(2004).262(2):p. 241-253. 155. R. V. Malyala, C. V. Rode, M. Arai, S. G. Hegde, and R. V. Chaudhari,App.Cat. A:
Gen.(2000).193(1–2):p. 71-86. 156. O. S. Alexeev, G. W. Graham, M. Shelef, and B. C. Gates,J.Catal.,(2000).190(1):p. 157-172. 157. B. Bachiller-Baeza, A. Guerrero-Ruiz, P. Wang, and I. Rodr guez-
Ramos,J.Catal.,(2001).204(2):p. 450-459. 158. P. Reyes, G. Pecchi, and J. L. G. Fierro,Langmuir,(2000).17(2):p. 522-527. 159. S. S. Ashour, J. E. Bailie, C. H. Rochester, J. Thomson, and G. J. Hutchings,J.Mol.Catal.A:
Chem.,(1997).123(1):p. 65-74. 160. M. Lucas and P. Claus,Chem. Eng. Tech.,(2005).28(8):p. 867-870. 161. W.-P. Dow, Y.-P. Wang, and T.-J. Huang,J.Catal.,(1996).160(2):p. 155-170. 162. A. M. Turek, I. E. Wachs, and E. DeCanio, J.Phys. Chem.,(1992).96(12):p. 5000-5007. 163. H. Knözinger and P. Ratnasamy,Catal.Rev.,(1978).17(1):p. 31-70. 164. M. Trueba and S. P. Trasatti,Eur.J.Inorg.Chem.,(2005).2005(17):p. 3393-3403. 165. H. A. Al-Abadleh and V. H. Grassian,Langmuir,(2002).19(2):p. 341-347. 166. C. Mo, Z. Yuan, L. Zhang, and C. Xie,Nanostructured Materials,(1993).2(1):p. 47-54. 167. S. Ramesh, E. Sominska, B. Cina, R. Chaim, and A. Gedanken,J.Am.Ceramic
Soc.,(2000).83(1):p. 89-94. 168. H.-K. Wang, C.-Y. Yi, L. Tian, W.-J. Wang, J. Fang, J.-H. Zhao, and W.-G.
Shen,J.Nanomater.,(2011).2012:p. 1-8. 169. M.-F. Luo, P. Fang, M. He, and Y.-L. Xie,J.Mol.Catal.A: Chem.,(2005).239(1–2):p. 243-248. 170. L. Kundakovic and M. Flytzani-Stephanopoulos,App.Catal.A: Gen.(1998).171(1):p. 13-29. 171. R. M. Friedman, J. J. Freeman, and F. W. Lytle,J.Catal.,(1978).55(1):p. 10-28. 172. B. Aysİn.Photocatalytic properties of silver loaded titanium dioxide powders produced by
mechanical ball milling,Middle East Technical University,M.Sc,p.29-37 173. X. Wang, S. Li, H. Yu, J. Yu, and S. Liu,Chemistry – A Eur.J.,(2011).17(28):p. 7777-7780. 174. K. Page, R. G. Palgrave, I. P. Parkin, M. Wilson, S. L. P. Savin, and A. V. Chadwick,J.Mater.
Chem.,(2007).17(1):p. 95-104. 175. M. N. H. Hamed,J.App.Sci.Research,(2010).6(8):p. 1247-1264. 176. A. Alouche,Jordan J.Mech. Ind.Eng.,(2008). 177. G. V. Smith and F. Notheisz, Heterogeneous catalysis in organic chemistry. 1999, United States
of America: Elsevier Science. 178. D. P. VanderWiel, M. Pruski, and T. S. King,J.Catal.,(1999).188(1):p. 186-202. 179. K. Nakai and K. Nakamura, Pulse chemisorption measurement: Metal dispersion measurement,
2003. p. 1-4. 180. M. A. Nygren and P. E. M. Siebahn,J. Phys. Chem,(1992).96:p. 7579-7584. 181. G. H. Guvelioglu, P. Ma, X. He, R. C. Forrey, and H. Cheng,Phys Rev Lett,(2005).94(2):p.
026103. 182. R. C. Forrey,Physi.Rev.B,(2006).73(15):p. 1-9. 183. A. Dandekar and M. A. Vannice,App. Catal. B: Environ.,(1999).22(3):p. 179-200. 184. A. Dandekar and M. A. Vannice,J.Catal.,(1998).178(2):p. 621-639.
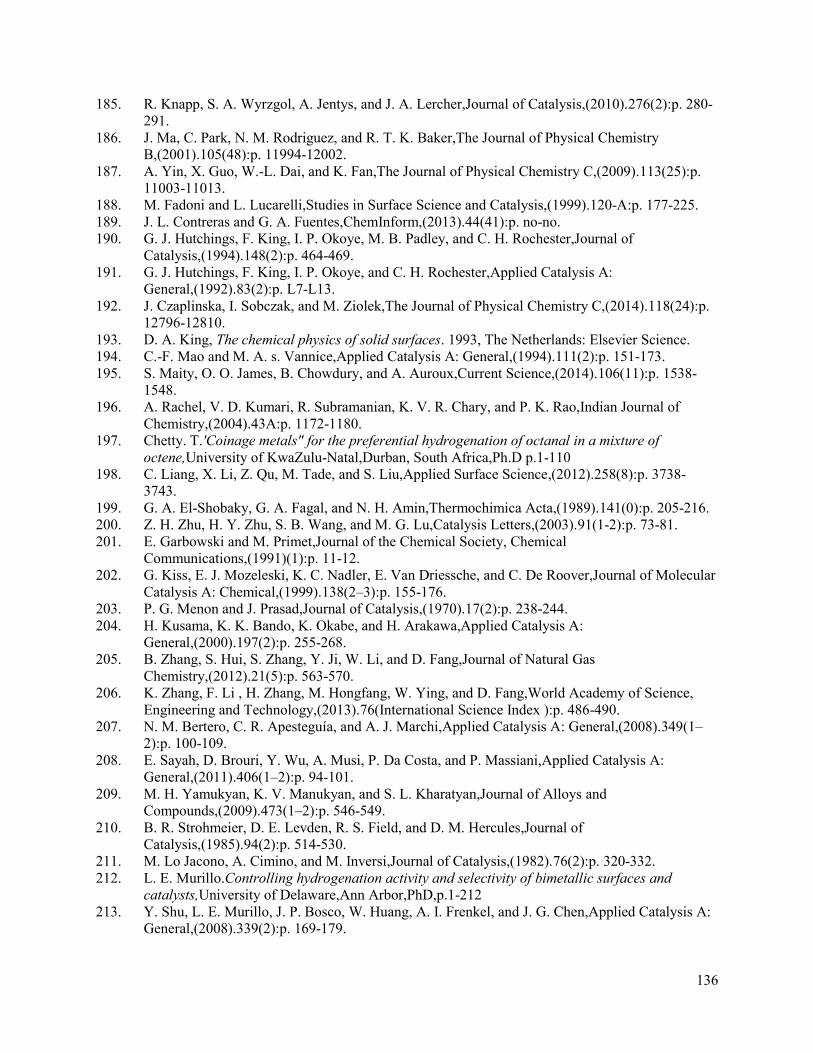
136
185. R. Knapp, S. A. Wyrzgol, A. Jentys, and J. A. Lercher,Journal of Catalysis,(2010).276(2):p. 280-291.
186. J. Ma, C. Park, N. M. Rodriguez, and R. T. K. Baker,The Journal of Physical Chemistry B,(2001).105(48):p. 11994-12002.
187. A. Yin, X. Guo, W.-L. Dai, and K. Fan,The Journal of Physical Chemistry C,(2009).113(25):p. 11003-11013.
188. M. Fadoni and L. Lucarelli,Studies in Surface Science and Catalysis,(1999).120-A:p. 177-225. 189. J. L. Contreras and G. A. Fuentes,ChemInform,(2013).44(41):p. no-no. 190. G. J. Hutchings, F. King, I. P. Okoye, M. B. Padley, and C. H. Rochester,Journal of
Catalysis,(1994).148(2):p. 464-469. 191. G. J. Hutchings, F. King, I. P. Okoye, and C. H. Rochester,Applied Catalysis A:
General,(1992).83(2):p. L7-L13. 192. J. Czaplinska, I. Sobczak, and M. Ziolek,The Journal of Physical Chemistry C,(2014).118(24):p.
12796-12810. 193. D. A. King, The chemical physics of solid surfaces. 1993, The Netherlands: Elsevier Science. 194. C.-F. Mao and M. A. s. Vannice,Applied Catalysis A: General,(1994).111(2):p. 151-173. 195. S. Maity, O. O. James, B. Chowdury, and A. Auroux,Current Science,(2014).106(11):p. 1538-
1548. 196. A. Rachel, V. D. Kumari, R. Subramanian, K. V. R. Chary, and P. K. Rao,Indian Journal of
Chemistry,(2004).43A:p. 1172-1180. 197. Chetty. T.'Coinage metals" for the preferential hydrogenation of octanal in a mixture of
octene,University of KwaZulu-Natal,Durban, South Africa,Ph.D p.1-110 198. C. Liang, X. Li, Z. Qu, M. Tade, and S. Liu,Applied Surface Science,(2012).258(8):p. 3738-
3743. 199. G. A. El-Shobaky, G. A. Fagal, and N. H. Amin,Thermochimica Acta,(1989).141(0):p. 205-216. 200. Z. H. Zhu, H. Y. Zhu, S. B. Wang, and M. G. Lu,Catalysis Letters,(2003).91(1-2):p. 73-81. 201. E. Garbowski and M. Primet,Journal of the Chemical Society, Chemical
Communications,(1991)(1):p. 11-12. 202. G. Kiss, E. J. Mozeleski, K. C. Nadler, E. Van Driessche, and C. De Roover,Journal of Molecular
Catalysis A: Chemical,(1999).138(2–3):p. 155-176. 203. P. G. Menon and J. Prasad,Journal of Catalysis,(1970).17(2):p. 238-244. 204. H. Kusama, K. K. Bando, K. Okabe, and H. Arakawa,Applied Catalysis A:
General,(2000).197(2):p. 255-268. 205. B. Zhang, S. Hui, S. Zhang, Y. Ji, W. Li, and D. Fang,Journal of Natural Gas
Chemistry,(2012).21(5):p. 563-570. 206. K. Zhang, F. Li , H. Zhang, M. Hongfang, W. Ying, and D. Fang,World Academy of Science,
Engineering and Technology,(2013).76(International Science Index ):p. 486-490. 207. N. M. Bertero, C. R. Apesteguía, and A. J. Marchi,Applied Catalysis A: General,(2008).349(1–
2):p. 100-109. 208. E. Sayah, D. Brouri, Y. Wu, A. Musi, P. Da Costa, and P. Massiani,Applied Catalysis A:
General,(2011).406(1–2):p. 94-101. 209. M. H. Yamukyan, K. V. Manukyan, and S. L. Kharatyan,Journal of Alloys and
Compounds,(2009).473(1–2):p. 546-549. 210. B. R. Strohmeier, D. E. Levden, R. S. Field, and D. M. Hercules,Journal of
Catalysis,(1985).94(2):p. 514-530. 211. M. Lo Jacono, A. Cimino, and M. Inversi,Journal of Catalysis,(1982).76(2):p. 320-332. 212. L. E. Murillo.Controlling hydrogenation activity and selectivity of bimetallic surfaces and
catalysts,University of Delaware,Ann Arbor,PhD,p.1-212 213. Y. Shu, L. E. Murillo, J. P. Bosco, W. Huang, A. I. Frenkel, and J. G. Chen,Applied Catalysis A:
General,(2008).339(2):p. 169-179.
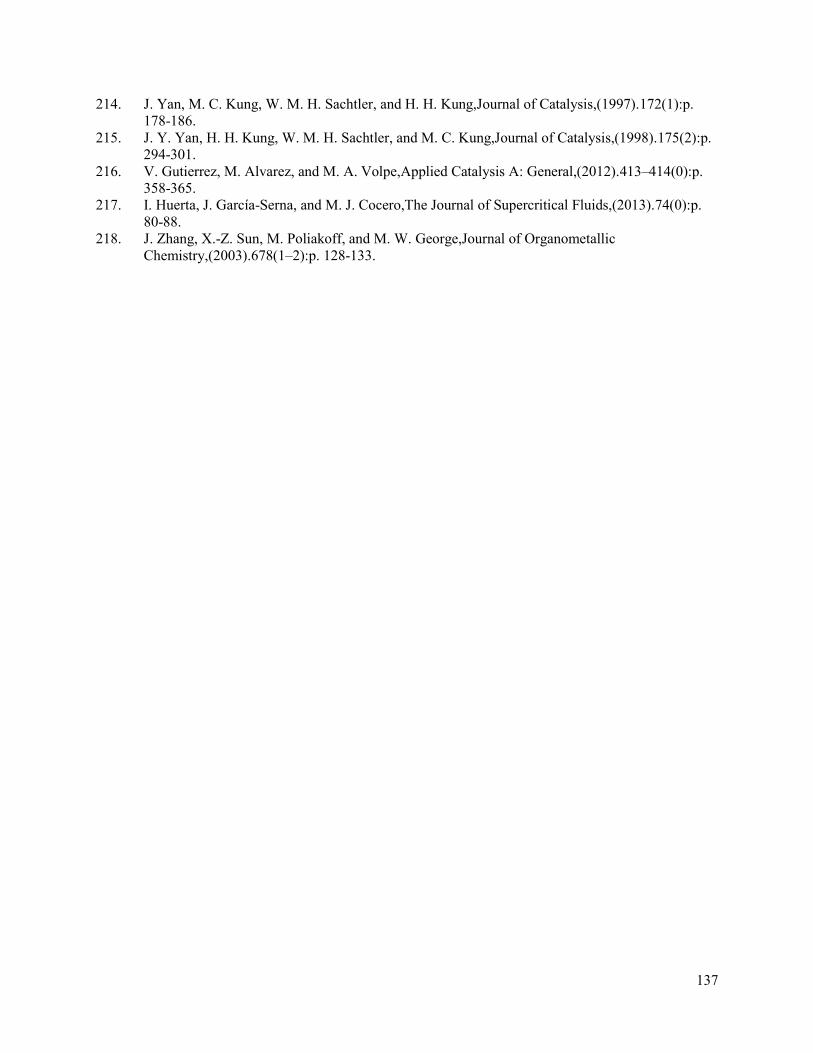
137
214. J. Yan, M. C. Kung, W. M. H. Sachtler, and H. H. Kung,Journal of Catalysis,(1997).172(1):p. 178-186.
215. J. Y. Yan, H. H. Kung, W. M. H. Sachtler, and M. C. Kung,Journal of Catalysis,(1998).175(2):p. 294-301.
216. V. Gutierrez, M. Alvarez, and M. A. Volpe,Applied Catalysis A: General,(2012).413–414(0):p. 358-365.
217. I. Huerta, J. García-Serna, and M. J. Cocero,The Journal of Supercritical Fluids,(2013).74(0):p. 80-88.
218. J. Zhang, X.-Z. Sun, M. Poliakoff, and M. W. George,Journal of Organometallic Chemistry,(2003).678(1–2):p. 128-133.
138
Appendix
1. Infrared Spectroscopy
1.1. Fresh catalysts
Figure A1. IR spectra of γ-Al2O3 supported (a) 15Cu and (b) 13.5Cu1.5Ag catalysts.
Figure A2. IR spectra of γ-Al2O3 supported (a) 4.5Cu0.5Ag and (b) 4Cu1Ag catalysts.
Figure A3. IR spectra of γ-Al2O3 supported (a) S-4.5Cu0.5Ag and (b) S-0.5Ag4.5Cu catalysts.
4000.0 3600 3200 2800 2400 2000 1800 1600 1400 1200 1000 800 600 400.00.0
5
10
15
20
25
30
35
40
45
50
55
60
65
70
75
80
85
90
95
100.0
cm-1
%T
3445.02
2359.171634.85
863.87
4000.0 3600 3200 2800 2400 2000 1800 1600 1400 1200 1000 800 600 400.00.0
5
10
15
20
25
30
35
40
45
50
55
60
65
70
75
80
85.7
cm-1
%T
3441.30
2360.201634.89
862.93
4000.0 3600 3200 2800 2400 2000 1800 1600 1400 1200 1000 800 600 380.075.5
78
80
82
84
86
88
90
92
94
96
98
100.6
cm-1
%T
4000.0 3600 3200 2800 2400 2000 1800 1600 1400 1200 1000 800 600 380.080.0
82
84
86
88
90
92
94
96
98
100
102
104
106106.8
cm-1
%T
3371.86
2159.40 1645.111401.02
794.55
513.78 504.39
412.11
4000.0 3600 3200 2800 2400 2000 1800 1600 1400 1200 1000 800 600 380.075.0
76
78
80
82
84
86
88
90
92
94
96
98
100
102
104
106
108109.3
cm-1
%T
3483.66 2160.272035.10
1654.61
788.29
522.86506.86
415.95
4000.0 3600 3200 2800 2400 2000 1800 1600 1400 1200 1000 800 600 400.020.0
25
30
35
40
45
50
55
60
65
70
75
80
85
90
95
100
105
110
115
120
125
130.0
cm-1
%T
3457.28
2360.01
1635.05
837.38
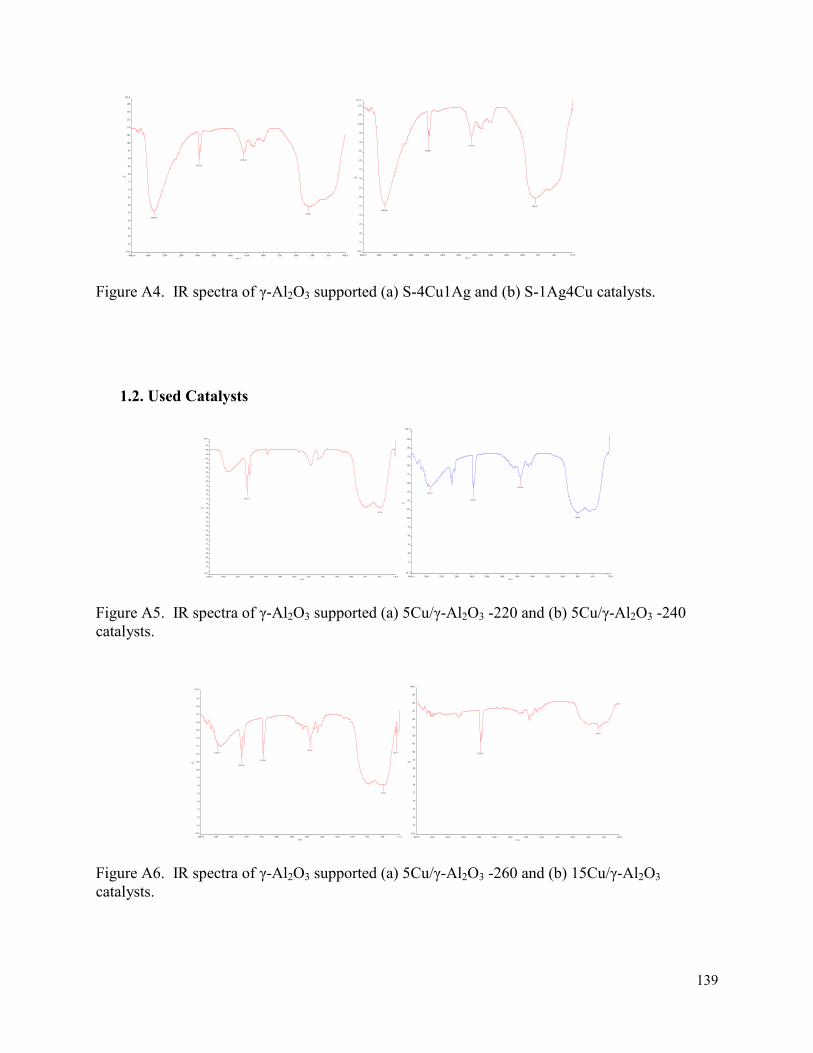
139
Figure A4. IR spectra of γ-Al2O3 supported (a) S-4Cu1Ag and (b) S-1Ag4Cu catalysts.
1.2. Used Catalysts
Figure A5. IR spectra of γ-Al2O3 supported (a) 5Cu/γ-Al2O3 -220 and (b) 5Cu/γ-Al2O3 -240 catalysts.
Figure A6. IR spectra of γ-Al2O3 supported (a) 5Cu/γ-Al2O3 -260 and (b) 15Cu/γ-Al2O3 catalysts.
4000.0 3600 3200 2800 2400 2000 1800 1600 1400 1200 1000 800 600 400.030.0
35
40
45
50
55
60
65
70
75
80
85
90
95
100
105
110
115
120
125
129.4
cm-1
%T
3458.90
2360.24
1635.06
845.91
4000.0 3600 3200 2800 2400 2000 1800 1600 1400 1200 1000 800 600 373.030.0
35
40
45
50
55
60
65
70
75
80
85
90
95
100
105
110
113.1
cm-1
%T
3458.04
2360.01
1635.06
840.20
4000.0 3600 3200 2800 2400 2000 1800 1600 1400 1200 1000 800 600 370.038.9
42
44
46
48
50
52
54
56
58
60
62
64
66
68
70
72
74
76
78
80
82
84
86
88
90
92
94
96
98.9
cm-1
%T
2925.17
589.36
4000.0 3600 3200 2800 2400 2000 1800 1600 1400 1200 1000 800 600 370.068.7
75
80
85
90
95
100
105
110
115
120
125
130
135
140
145
150.8
cm-1
%T
3501.93
2359.95
1558.60
798.86
4000.0 3600 3200 2800 2400 2000 1800 1600 1400 1200 1000 800 600 373.060.0
65
70
75
80
85
90
95
100
105
110
115
120
125
130
135
140
145
150.8
cm-1
%T
3566.25
2924.34
2359.98
1558.62
585.76
420.17
4000.0 3600 3200 2800 2400 2000 1800 1600 1400 1200 1000 800 600 400.050.0
55
60
65
70
75
80
85
90
95
100
105
110
115
120
125
130
135
140.0
cm-1
%T
2359.98
668.23
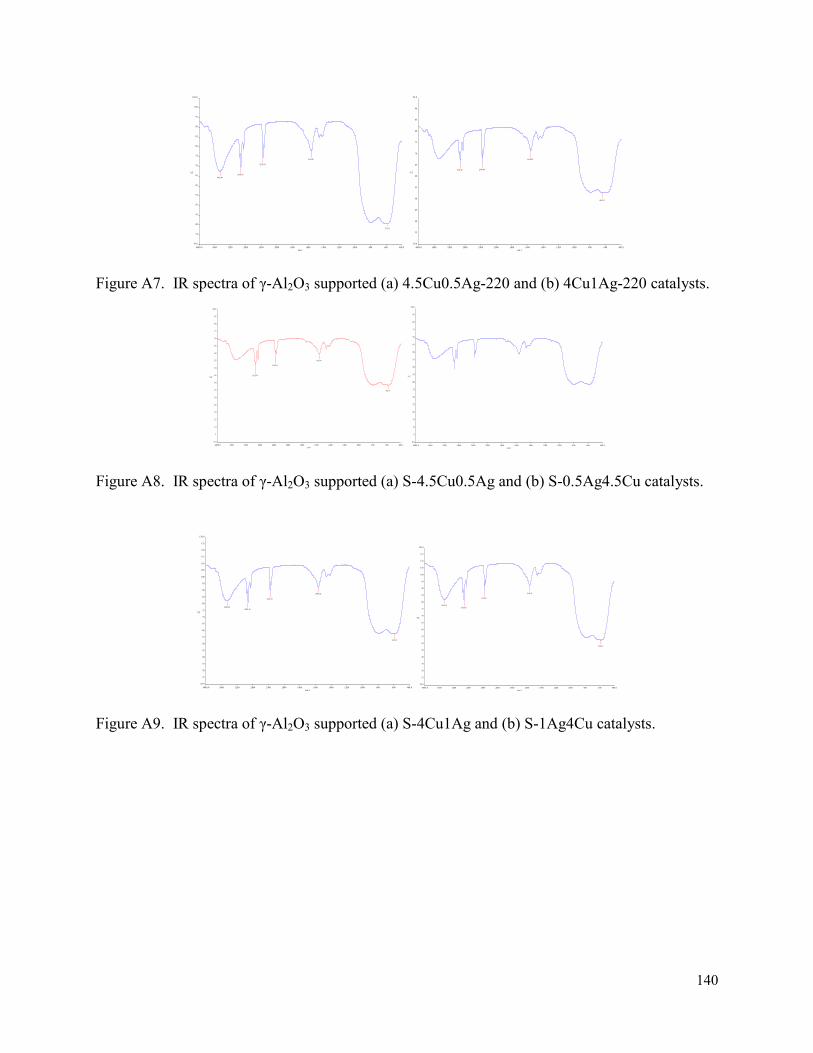
140
Figure A7. IR spectra of γ-Al2O3 supported (a) 4.5Cu0.5Ag-220 and (b) 4Cu1Ag-220 catalysts.
Figure A8. IR spectra of γ-Al2O3 supported (a) S-4.5Cu0.5Ag and (b) S-0.5Ag4.5Cu catalysts.
Figure A9. IR spectra of γ-Al2O3 supported (a) S-4Cu1Ag and (b) S-1Ag4Cu catalysts.
4000.0 3600 3200 2800 2400 2000 1800 1600 1400 1200 1000 800 600 400.030.0
35
40
45
50
55
60
65
70
75
80
85
90
95
100
105.0
cm-1
%T
3461.402926.93
2359.94
1559.07
579.13
4000.0 3600 3200 2800 2400 2000 1800 1600 1400 1200 1000 800 600 400.030.0
35
40
45
50
55
60
65
70
75
80
85
90
95.0
cm-1
%T 2926.01 2360.46
1558.83
640.02
4000.0 3600 3200 2800 2400 2000 1800 1600 1400 1200 1000 800 600 400.00.0
5
10
15
20
25
30
35
40
45
50
55
60
65
70
75
80
85
90.0
cm-1
%T 2925.78
2360.18
1558.97
582.67
4000.0 3600 3200 2800 2400 2000 1800 1600 1400 1200 1000 800 600 400.00.0
5
10
15
20
25
30
35
40
45
50
55
60
65
70
75
80
85
90.0
cm-1
%T
4000.0 3600 3200 2800 2400 2000 1800 1600 1400 1200 1000 800 600 400.020.0
25
30
35
40
45
50
55
60
65
70
75
80
85
90
95
100
105
110
115
120
125
130.0
cm-1
%T
3456.692925.45
2360.15
1559.24
587.07
4000.0 3600 3200 2800 2400 2000 1800 1600 1400 1200 1000 800 600 400.020.0
25
30
35
40
45
50
55
60
65
70
75
80
85
90
95
100
105
110
115
120.0
cm-1
%T
3458.792924.92
2360.21
1559.28
584.16
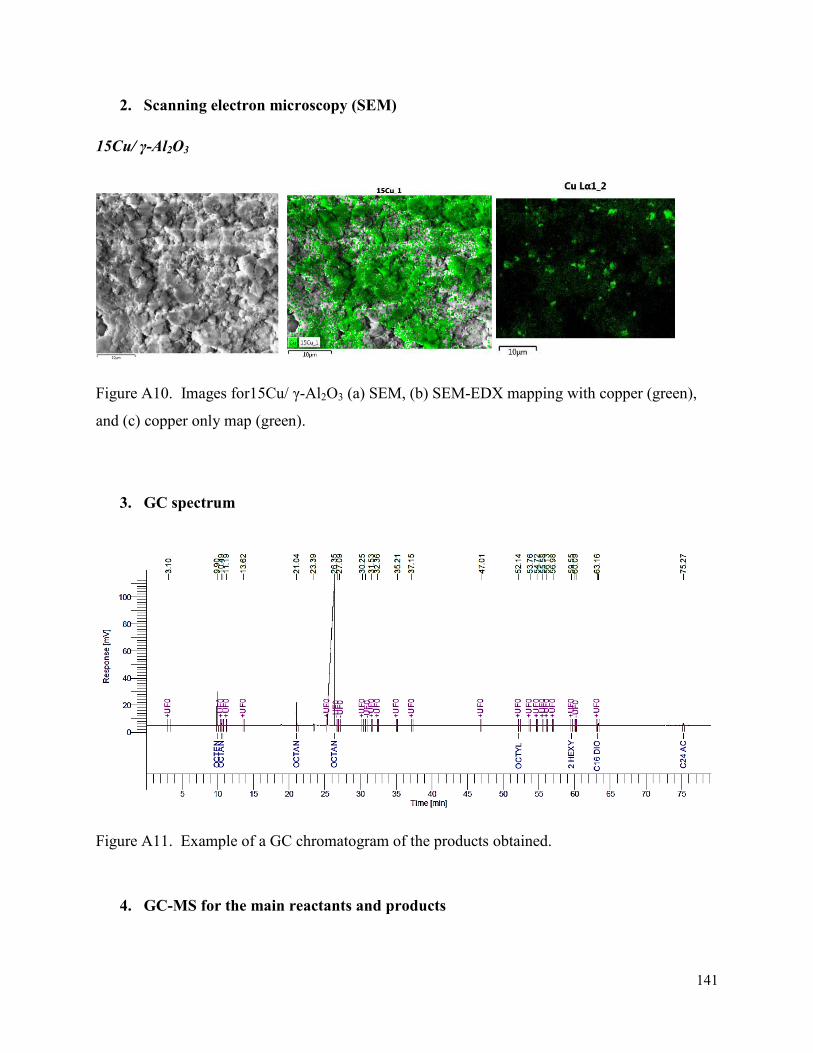
141
2. Scanning electron microscopy (SEM)
15Cu/ γ-Al2O3
Figure A10. Images for15Cu/ γ-Al2O3 (a) SEM, (b) SEM-EDX mapping with copper (green),
and (c) copper only map (green).
3. GC spectrum
Figure A11. Example of a GC chromatogram of the products obtained.
4. GC-MS for the main reactants and products
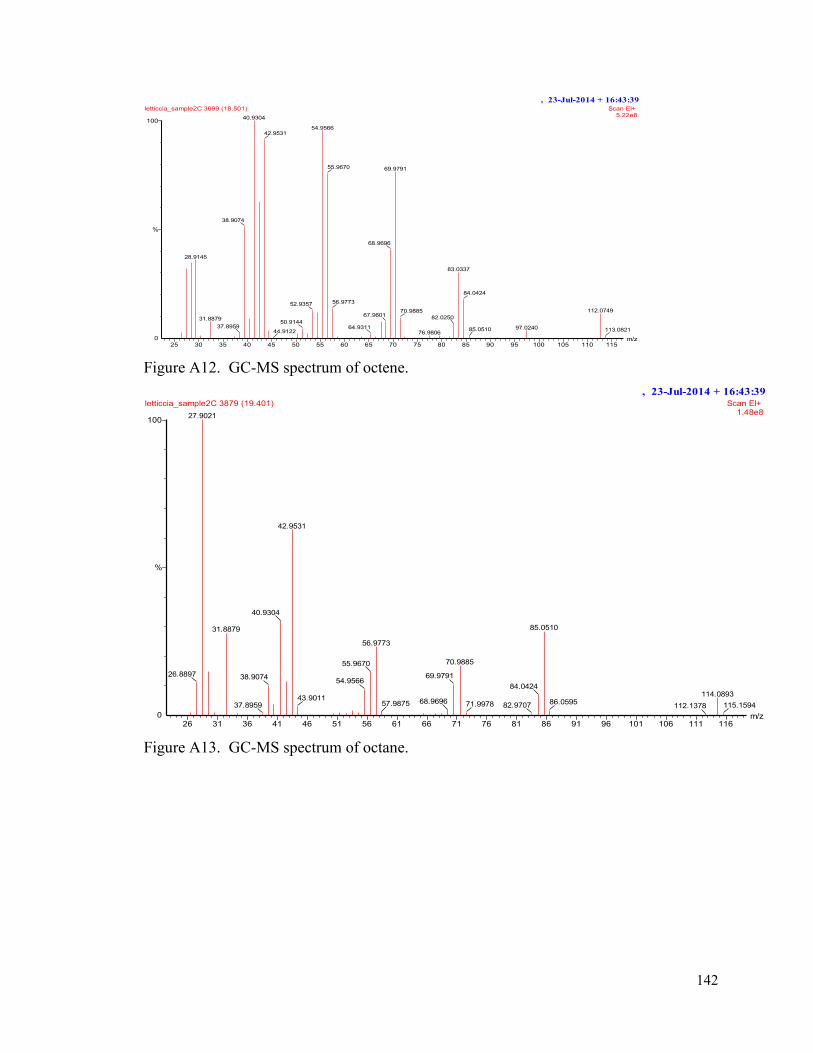
142
Figure A12. GC-MS spectrum of octene.
Figure A13. GC-MS spectrum of octane.
, 23-Jul-2014 + 16:43:39
25 30 35 40 45 50 55 60 65 70 75 80 85 90 95 100 105 110 115m/z0
100
%
letticcia_sample2C 3699 (18.501) Scan EI+ 5.22e840.9304
38.9074
28.9145
31.887937.8959
54.956642.9531
52.9357
50.9144
44.9122
69.979155.9670
68.9696
56.9773
67.9601
64.9311
83.0337
70.988582.0250
76.9806
84.0424
112.0749
97.024085.0510 113.0821
, 23-Jul-2014 + 16:43:39
26 31 36 41 46 51 56 61 66 71 76 81 86 91 96 101 106 111 116m/z0
100
%
letticcia_sample2C 3879 (19.401) Scan EI+ 1.48e827.9021
26.8897
42.9531
40.9304
31.8879
38.9074
37.8959
85.0510
56.9773
55.9670
54.9566
43.9011
70.9885
69.9791
68.969657.9875
84.0424
71.9978 82.9707114.0893
86.0595 112.1378 115.1594
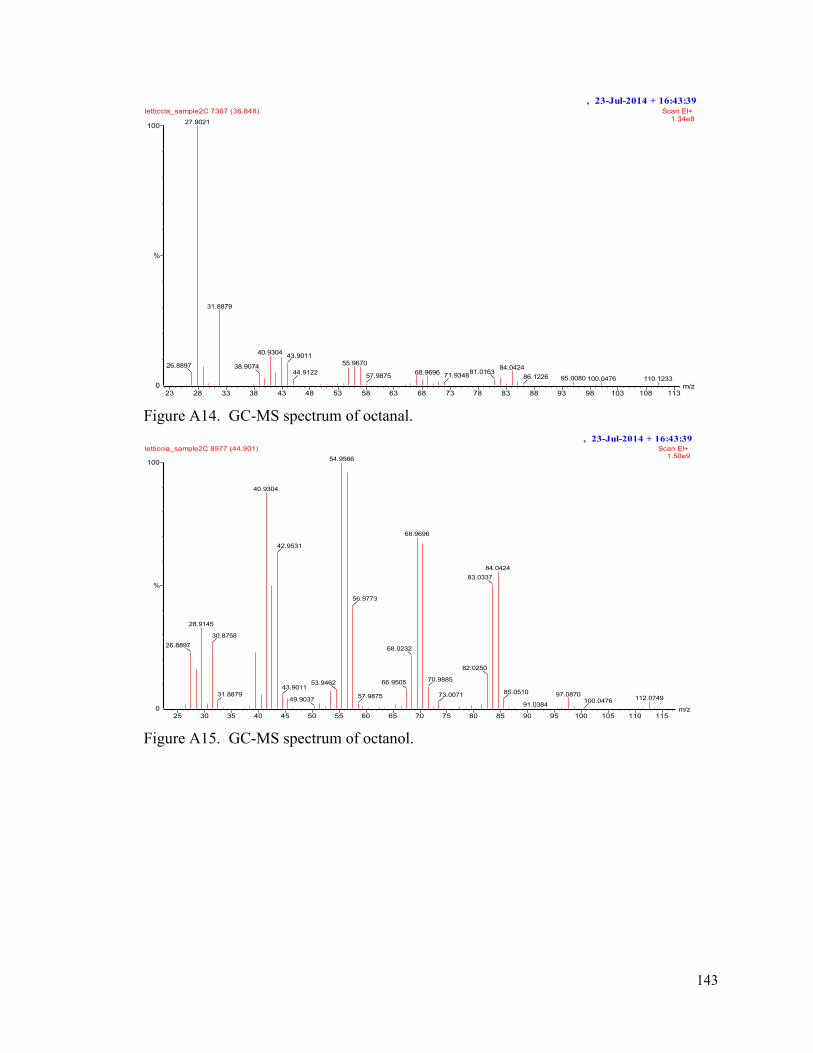
143
Figure A14. GC-MS spectrum of octanal.
Figure A15. GC-MS spectrum of octanol.
, 23-Jul-2014 + 16:43:39
23 28 33 38 43 48 53 58 63 68 73 78 83 88 93 98 103 108 113m/z0
100
%
letticcia_sample2C 7367 (36.848) Scan EI+ 1.34e827.9021
26.8897
31.8879
40.9304
38.9074
43.901155.9670
44.912284.0424
68.969657.9875 81.016371.9348 95.008086.1226 100.0476 110.1233
, 23-Jul-2014 + 16:43:39
25 30 35 40 45 50 55 60 65 70 75 80 85 90 95 100 105 110 115m/z0
100
%
letticcia_sample2C 8977 (44.901) Scan EI+ 1.50e954.9566
40.9304
28.9145
26.889730.8758
31.8879
42.9531
53.946243.9011
49.9037
68.9696
56.9773
68.0232
66.9505
57.9875
84.042483.0337
82.0250
70.9885
73.0071 97.087085.0510
91.0384112.0749100.0476
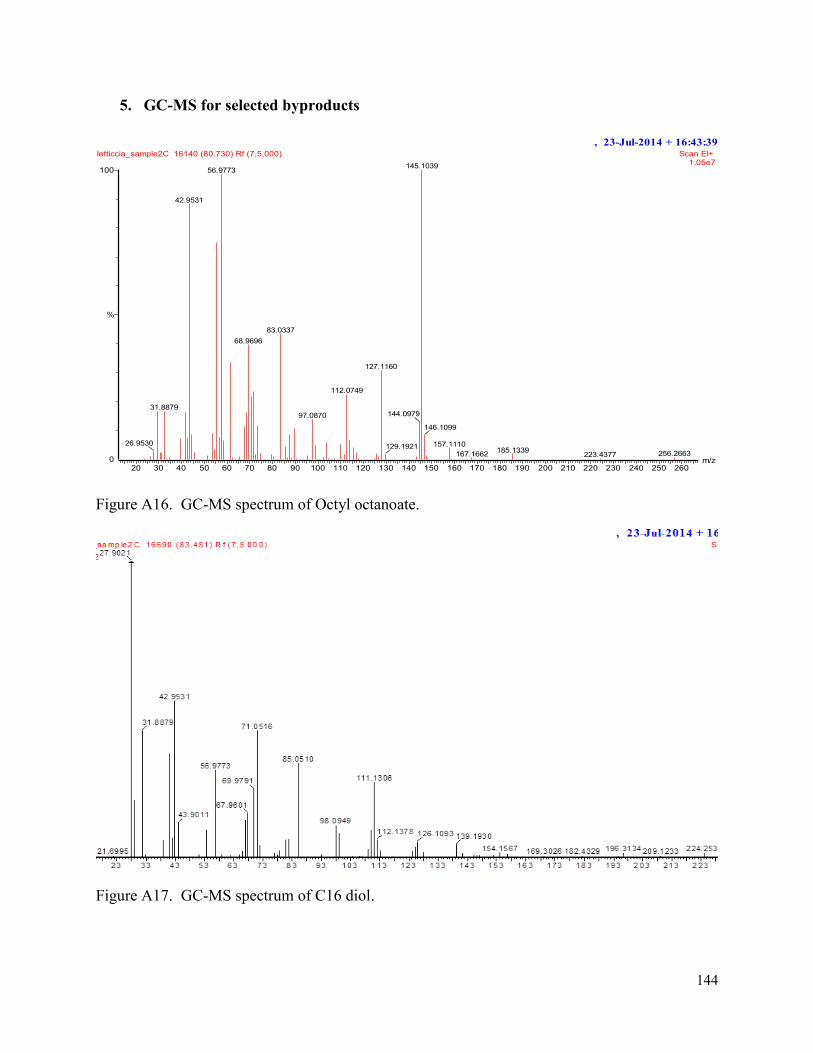
144
5. GC-MS for selected byproducts
Figure A16. GC-MS spectrum of Octyl octanoate.
Figure A17. GC-MS spectrum of C16 diol.
, 23-Jul-2014 + 16:43:39
20 30 40 50 60 70 80 90 100 110 120 130 140 150 160 170 180 190 200 210 220 230 240 250 260m/z0
100
%
letticcia_sample2C 16140 (80.730) Rf (7,5.000) Scan EI+ 1.05e7145.103956.9773
42.9531
31.8879
26.9530
83.033768.9696
127.1160
112.0749
97.0870 144.0979
129.1921
146.1099
157.1110185.1339167.1662 256.2663223.4377
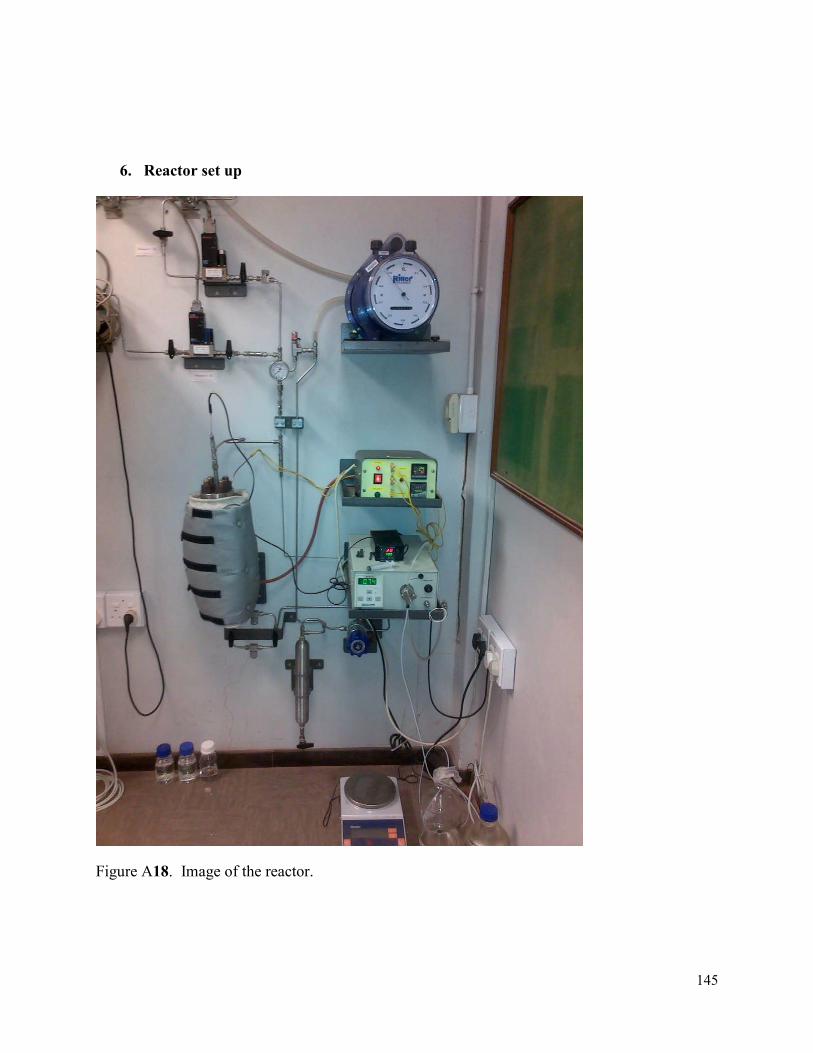
145
6. Reactor set up
Figure A18. Image of the reactor.


![INDEX [] · S1 Supporting information for Zirconium–MOF catalysed selective synthesis of α- hydroxyamide via transfer hydrogenation of α-ketoamide Ashish A. Mishra† and Bhalchandra](https://static.fdocument.org/doc/165x107/602b5ab73fe4e62cda6bca69/index-s1-supporting-information-for-zirconiumamof-catalysed-selective-synthesis.jpg)