Effects of the infusion of non-selective -, and selective ... · tive p-agonist (j3-A)...
13
Original article Effects of the infusion of non-selective β-, and selective β1- or β2-adrenergic agonists, on body fat mobilisation in underfed or overfed non-pregnant heifers Anne Ferlay Yves Chilliard Laboratoire sous-nutrition des ruminants, Inra, Theix, 63122 Saint-Genès-Champanelle, France (Received 28 January 1999; accepted 25 May 1999) Abstract The aim of this study was to analyse the effects of the intravenous infusion of a non-selec- tive p-agonist (j3-A) (isoproterenol, ISO), and selective j31-A (dobutamine, D) or p2-A (terbutaline, T) on body fat mobilisation in non-pregnant heifers, in a 2 x 2 crossover design with two treatments (underfeeding or overfeeding) and two periods. The effect of the duration of submission to each energy level on basal and ISO-induced fat mobilisation was also studied. ISO had a high and significant lipolytic effect whatever the energy level. Nevertheless, the response area of non-esterified fatty acids (NEFA) to ISO in underfed cows was 1.7 times greater than that in overfed cows. T had a slight but significant lipolytic effect on NEFA plasma response in the underfed group. D had no lipolytic effect. Basal and ISO-stimulated plasma NEFA levels were similar after 1 or 4 weeks of under- feeding. © Inra/Elsevier, Paris. heifers / isoproterenol / 1 31- and p2-agonists / non-esterified fatty acids Résumé ― Effets de l’infusion d’un agoniste (3-adrénergique non sélectif, d’un agoniste sélec- tif 131 ou d’un agoniste sélectif p2 sur la mobilisation des réserves lipidiques corporelles chez des génisses non gravides sous-nutries ou suralimentées. Les effets sur la mobilisation des réserves lipidiques corporelles d’un agoniste 13 (P-A)-adrénergique non sélectif (isoproterenol, ISO), d’un !1- A (dobutamine, D) ou d’un fi2-A (terbutaline, T) sélectifs, infusés par voie intraveineuse, sont analysés chez des génisses non-gravides, selon un schéma croisé 2 x 2 avec deux traitements (sous-nutrition ou suralimentation) et deux périodes. L’effet de la durée pendant laquelle est appliqué chaque niveau énergétique sur la lipomobilisation basale ou stimulée par l’ISO est aussi étudié. L’ISO induit un effet lipolytique important et significatif quel que soit le niveau énergétique. Néanmoins, la surface de réponse des acides gras non-estérifiés (AGNE) à l’ISO, chez les vaches sous-nutries, est 1,7 fois plus élevée que celle obtenue chez les vaches suralimentées. T augmente légèrement, mais de manière significative, a réponse plasmatique des AGNE dans le groupe sous-nutri. D n’a pas d’effet significatif. Les teneurs, basale et stimulée par l’ISO, en AGNE plasmatiques sont similaires après une sous- nutrition d’une ou de quatre semaines. © Inra/Elsevier, Paris. génisses / isoprotérénol / agonistes pi- et fi2-adrénergiques / acides gras non-estérifiés * Corresponding author E-mail: [email protected]
Transcript of Effects of the infusion of non-selective -, and selective ... · tive p-agonist (j3-A)...
Original article
Effects of the infusion of non-selective β-,and selective β1- or β2-adrenergic agonists,
on body fat mobilisation in underfed or overfednon-pregnant heifers
Anne Ferlay Yves Chilliard
Laboratoire sous-nutrition des ruminants, Inra, Theix, 63122 Saint-Genès-Champanelle, France
(Received 28 January 1999; accepted 25 May 1999)
Abstract - The aim of this study was to analyse the effects of the intravenous infusion of a non-selec-tive p-agonist (j3-A) (isoproterenol, ISO), and selective j31-A (dobutamine, D) or p2-A (terbutaline, T)on body fat mobilisation in non-pregnant heifers, in a 2 x 2 crossover design with two treatments(underfeeding or overfeeding) and two periods. The effect of the duration of submission to eachenergy level on basal and ISO-induced fat mobilisation was also studied. ISO had a high and significantlipolytic effect whatever the energy level. Nevertheless, the response area of non-esterified fattyacids (NEFA) to ISO in underfed cows was 1.7 times greater than that in overfed cows. T had aslight but significant lipolytic effect on NEFA plasma response in the underfed group. D had nolipolytic effect. Basal and ISO-stimulated plasma NEFA levels were similar after 1 or 4 weeks of under-feeding. © Inra/Elsevier, Paris.
heifers / isoproterenol / 131- and p2-agonists / non-esterified fatty acids
Résumé ― Effets de l’infusion d’un agoniste (3-adrénergique non sélectif, d’un agoniste sélec-tif 131 ou d’un agoniste sélectif p2 sur la mobilisation des réserves lipidiques corporelles chez desgénisses non gravides sous-nutries ou suralimentées. Les effets sur la mobilisation des réserveslipidiques corporelles d’un agoniste 13 (P-A)-adrénergique non sélectif (isoproterenol, ISO), d’un !1-A (dobutamine, D) ou d’un fi2-A (terbutaline, T) sélectifs, infusés par voie intraveineuse, sont analyséschez des génisses non-gravides, selon un schéma croisé 2 x 2 avec deux traitements (sous-nutritionou suralimentation) et deux périodes. L’effet de la durée pendant laquelle est appliqué chaque niveauénergétique sur la lipomobilisation basale ou stimulée par l’ISO est aussi étudié. L’ISO induit un effetlipolytique important et significatif quel que soit le niveau énergétique. Néanmoins, la surface deréponse des acides gras non-estérifiés (AGNE) à l’ISO, chez les vaches sous-nutries, est 1,7 foisplus élevée que celle obtenue chez les vaches suralimentées. T augmente légèrement, mais de manièresignificative, a réponse plasmatique des AGNE dans le groupe sous-nutri. D n’a pas d’effet significatif.Les teneurs, basale et stimulée par l’ISO, en AGNE plasmatiques sont similaires après une sous-nutrition d’une ou de quatre semaines. © Inra/Elsevier, Paris.
génisses / isoprotérénol / agonistes pi- et fi2-adrénergiques / acides gras non-estérifiés
* Corresponding authorE-mail: [email protected]
1. INTRODUCTION
Animals mobilise their body reserves asfuel for other tissues during underfeeding.Adipose tissue (AT) is the major energyreserve of the body, and the mobilisation ofAT triacylglycerols plays an important rolein adapting to energy restrictions [15]. Thisis made possible by an increase in lipoly-sis, which depends mainly on catechola-mines. Relative actions of catecholamines
through the systemic circulation or the sym-pathetic nervous system are not fullyresolved. The stimulation of (3-adrenoceptors((3-AR) or a2-AR by catecholaminesenhances or inhibits (respectively) the hor-mone-sensitive lipase, the enzyme whichcatalyses the breakdown of triglycerides intofatty acids and glycerol.
There are discrepancies in the literatureabout the expression of different sub-typesof P-AR in bovine AT. The mRNA levels ofp2- and p3- and predominantly (31-AR sub-classes are expressed in calf perirenal AT[11]. Data from binding studies indicate thepresence of [31- and p2-AR in calf subcu-taneous AT, although a high concentrationof CGP12177, a selective p3-agonist ((33-A),had no lipolytic effect [43]. Nevertheless,it now seems that this compound is an inad-equate tool for demonstrating the presenceof p3-AR [23]. According to the results ofanother binding study [41], perirenaladipocyte membranes from heifers have p2-,but not (31-AR. In this study, however, thepartial inhibition, by (31- as well as fi2-antag-onists, of the increase in cAMP after iso-proterenol (ISO, a non-selective (3-A) stim-ulation, suggests a role for both ø 1- andp2-AR. Futhermore, there was no measure-ment of in vivo or in vitro lipolytic responsesin the majority of the studies on (3-AR.
In a preliminary trial [19], we establishedthe dose-response curves for the lipolyticeffects of ø-, ø 1- and p2-A on plasma NEFAconcentration in underfed cows, showing aselective stimulation by R2-A, but not by(31-A or only at high doses.
It is well established that the fasting [7,22] or underfeeding [16, 21] of cattleincreases the response of body fat mobili-sation to catecholamines or non-selective
(3-A (ISO). In contrast, there is no publisheddata on the effects of underfeeding or over-feeding on the in vivo responses to (31- or(32-A in ruminants. Moreover, the adapta-tion of basal or stimulated fat mobilisationcan vary with the length of the underfeedingperiod in ruminants. In the medium term(several weeks), underfeeding rapidly enhan-ces the basal plasma NEFA levels up to aplateau [15]. This plateauing may be due toa mechanism aimed at saving body lipids(making it possible to prolong the survival ofthe animal) and/or limit the toxic effects ofhigh NEFA concentrations [14]. There is,however, no data on the time-scale of theadaptation of fat mobilisation response tocatecholamines in ruminants.
The two main aims of the present trialwere to confirm our preliminary results con-cerning the effects of (3-, (31- or p2-A on fatmobilisation, and to analyse the adaptationof ø 1- and (32-adrenergic lipolytic responsesaccording to changes in energy levels(underfeeding versus overfeeding). The thirdobjective was to analyse the time-scale ofthe adaptation of the (3-adrenergic lipolyticresponse for a period of 4 weeks after achange in the food energy level.We simultaneously monitored changes
in plasma metabolites (glucose, lactate and3-hydroxybutyrate ((3-OH)) and insulin,since variations in their concentrations couldinteract with the lipolytic response.
2. MATERIALS AND METHODS
2.1. Animals and diets
Four non-pregnant non-lactating Holstein xFriesian heifers (body weight 571 ± 33 kg, bodycondition score 3.8 ± 0.4 on a 0-5 scale, and30-34 months old) were used in a 2 x 2 crossoverexperimental design with two treatments (under-feeding or overfeeding, at 58 % (low) or 135 %(high) of maintenance energy requirements,
MER) and two time periods. Treatment periodswere for 28 days, preceded by a 15-day pre-experimental period and followed by a 15-daypost-experimental period. During pre- and post-experimental periods, animals were fed 85 %(medium) of MER. The diets were calculated[27] from body weight at the beginning of theexperiment so that the cumulative energy sup-ply approximately covered (92 %) the mainte-nance requirement during both the pre-experi-mental and post-experimental periods. Animalswere housed in tie stalls under a 12-h lightregime.
The diet for the underfed animals consistedof 58 % hay, 13 % pelleted barley and 29 % soy-bean meal. The diet for the overfed animals con-sisted of 40 % hay and 60 % pelleted barley. Themedium diet consisted of 55 % hay, 38 % pel-leted barley and 7 % soybean meal. Water wasprovided ad libitum. All heifers received 100 g ofa mineral-vitamin premix daily. All rations werecalculated [27] so that protein intake was similarand covered 123-124 % of the requirement(assumed to be 3.25 g of PDI.kg-I of bodyweighto.75) of digestible protein in the intestine(PDI). The total mixed diet was offered at 11.30hours. Feed refusals were determined daily dur-ing the experimental periods. Digestibility coef-ficients of organic matter, neutral detergent fibreand acid detergent fibre were determined for eachheifer from 5-day pooled samples (total collectionof faeces) during days 24-28 of each experi-mental period. The net energy (NE) intake wasestimated according to Inra [27]. The energyrequirement for maintenance was assumed to be0.32 Mcal NE-kg-I of body weighto.75. NE bal-ance was calculated by subtracting the mainte-nance requirement from the intake.
2.2. Adrenergic challenges
2.2.1. Injection of a non-selective/3-adrenergic agonist
ISO (Isuprel, Sanofi Winthrop Industrie,France, 4 nmol-kg-I body weight) was injectedvia the jugular vein on day 1 I of the pre-exper-imental period, on days 4, 1 and 25 of the exper-imental period and on days 4 and 11 of the post-experimental period. Each challenge wasadministered at 10.00 hours. Blood samples werecollected at -5 and +10 min from the time of
injection.
2.2.2. Infusion of non-selective,8-, andselective /31- or /32-adrenergic agonists
Adrenergic infusions were administered ondays 18-21 of each experimental period. Thesequences of the four 60-min daily infusionswere randomised across periods and groups, withone (3-A (or placebo) per day. Catheters wereimplanted in the two jugular veins on the eveningbefore the start of the 4-day infusion periods.Catheters were kept functional by flushing with2 mL of sterile heparinised (1 %) saline. Chal-lenges consisted of 60-min infusions of ISO(0.067 nmol-kg-I body weight’min’’), dobutamine(D, a selective j31-A, Dobutrex, Lilly France SA,France, 1.5 nmol!kg-’ body weight’min’’), terbu-taline (T, a selective p2-A, Bricanyl, LaboratoiresAstra, France, 0.067 nmol.kg-I body weight-niirr-1) ’)or placebo (40-mL sterile saline) at a rate of0.67 mL!mir1 ’.
D was chosen for its selectivity of 01-AR andfor its lipolytic effect in rats and humans [8]. Theother available j31-A, T-0509, is not used in bio-logical assays because the antagonism of itslipolytic effects suggests that it activates lipoly-sis via an additional non-(3-adrenergic pathway[8]. Moreover, xamoterol, another j31-A, isknown to be only partially j31-selective [24]. Thedose of D was chosen because a previous trialshowed that plasma NEFA did not respond to Dinfusion below 1.0-1.5 nmol.kg-1 bodyweight-min-’ in the underfed cows [19].
Although clenbuterol had lipolytic effects inruminants [3,6], it was not used because its selec-tivity for p2-AR is still being debated [31]. ].T was chosen for its (32-selectivity and for itslipolytic action in humans [1]. ISO and T wereinfused (or injected, ISO) at equimolar doses,chosen according to [19, 20].
Each agonist was dissolved immediatelybefore infusion in sterile 0.9 % NaCI. Infusionsstarted at 09.30 hours each day. Blood samples(10 mL) were obtained from the contralateralvein at -20, -10, -5, 10, 20, 30, 45, 60, 80, 100and 120 min from the start of the 60-min infusion.Blood samples were collected in tubes containingEDTA (2.1 mg.mL-l) and centrifuged at 3 000 gfor 20 min at 4 °C. Plasma samples were frozenat -20 °C until analysis for insulin, NEFA, glyc-erol, glucose, L-lactate and j3-0H using a multi-analyser (Elan, Merck-Clevenot, Nogent-sur-Marne, France). Insulin was measured only inblood samples collected at -20, +20, +45 and+80 min from the start of infusion. Insulin wasdetermined by RIA (Insik-1 M kit, Oris Industry,
Gif-sur-Yvette, France) with a sensitivity of20 pmol!L-’. The intra- and inter-assay CV were9 and 13 %, respectively.
The intra-assay coefficient of variation (CV)for each metabolite determination was calculated
using duplicate determinations on 570 samplestaken from our trial. The inter-assay CV valuesfor metabolite determinations were calculatedfrom repeated measurements made on two con-trol plasmas. These plasmas were taken fromthree dry non-pregnant adult cows that wereeither well-fed (F control) or restricted to 17 % ofmaintenance energy requirements for 7 days.Blood was taken from restricted cows 10 minafter an injection of ISO (4 nmol-kg-1 bodyweight) (RI control). The inter-assay CV(n = 12) was calculated from the mean values ofsix replicated determinations from 12 differentdays on F and RI control plasmas. The mean val-ues of control plasmas were used to correct theexperimental plasmas for inter-assay variations.
The NEFA concentration was determined
using an enzymatic kit (C-test Wako, Unipath,Dardilly, France), previously calibrated byChilliard et al. [12]. The intra-assay CV forNEFA was 0.5 % (SD = 0.003 mmol-L-B The
inter-assay CV for NEFA was 7 % (pooledSD = 0.057 mmol-L-1, the means and SD of Fand RI controls were 0.058 ± 0.009 and 1.676 ±0.079 mmol-L-1, respectively).
Free glycerol was determined according tothe glycerol kinase method [34] and a com-mercial kit (Sigma, France, reference 37-A).The intra-assay CV for glycerol was 1.7 % (SD= 1.26 /lmo1.L-1) and the inter-assay CV was4 % (pooled SD = 3.79 /lmo1/L, the means of Fand RI controls were 4.97 ± 1.25 and 197.64 ±5.21 /lmol.L-1, respectively).
Glucose concentration was determined
according to the glucose dehydrogenase method[5] and a commercial kit (Merck-Clevenot,Nogent-sur-Marne, France, reference 12193).The intra-assay CV for glucose was 0.5 % (SD =0.021 mmol.L-1) and the inter-assay CV was 2 %(pooled SD = 0.087 mmol.L-1, the means of Fand RI controls were 3.912 ± 0.092 and 4.200 ±0.108 mmol!L-’, respectively).
The L-lactate concentration was assayed withthe lactate oxidase method [40] and a commercialkit (BioMerieux, Marcy-1’Etoile, France, refer-ence 61192). The intra-assay CV for L-lactatewas 0.5 % (SD = 0.004 mmol-L-1 ) and the inter-assay CV was 8 % (pooled SD = 0.124 mmo1-L-1,the means of F and RI controls were 0.745 ±0.173 and 2.389 ± 0.025 mmol!L-’, respectively).
The j3-0H concentration was determinedaccording to Barnouin et al. [4]. The intra-assayCV for j3-0H was 4.1 % (SD = 0.013 nunol-L-1)and the inter-assay CV was 4 % (pooled SD =0.021 1 mmol.L!! , the means of F and RI controlswere 0.426 ± 0.023 and 0.557 ± 0.018 mmo1-L-1,respectively).
2.3. Calculationsand statistical analysis
The overall change in blood metabolites dur-ing the 60-min infusions was estimated by cal-culating the area under the response curve andabove the baseline (summation of the areabetween successive pairs of concentration-timecoordinates). The baseline concentration was theconcentration at -5 min from the start of the infu-sion.
Data are expressed as means ± SD and wereanalysed using the SAS GLM procedure [39].For the data resulting from infusion protocols,the effects of the experimental period, the dayof challenge nested within period and the cowwere considered as random effects, whereas theeffects of the animal group, and drug and energylevels were considered as fixed effects. The fol-
lowing model was used:
Yijklmn = !l + Pi + (P x D)¡j + Ok + (C x O)kl + Em+ (P x C x E)ilm + drugn + (drug x E)! + eijljm,where p was the overall mean and the other terms
were, respectively: period effect (1 df), day ofchallenge effect nested within period (3 df), groupeffect (1 df), cow effect nested within group(2 df), energy level effect ( 1 df), period x cow xenergy level interaction (2 df, error 1), drug effect(3 df), drug x energy level interaction (3 df) andthe residual error (12 df). The effect of energylevels was tested against error 1. All the otherterms were tested against the residual error. Dif-ferences between energy levels (low versus high)and drugs (placebo, ISO, D or T) were analysedusing the least-square mean procedure [39]. Sig-nificance was declared at P < 0.05.
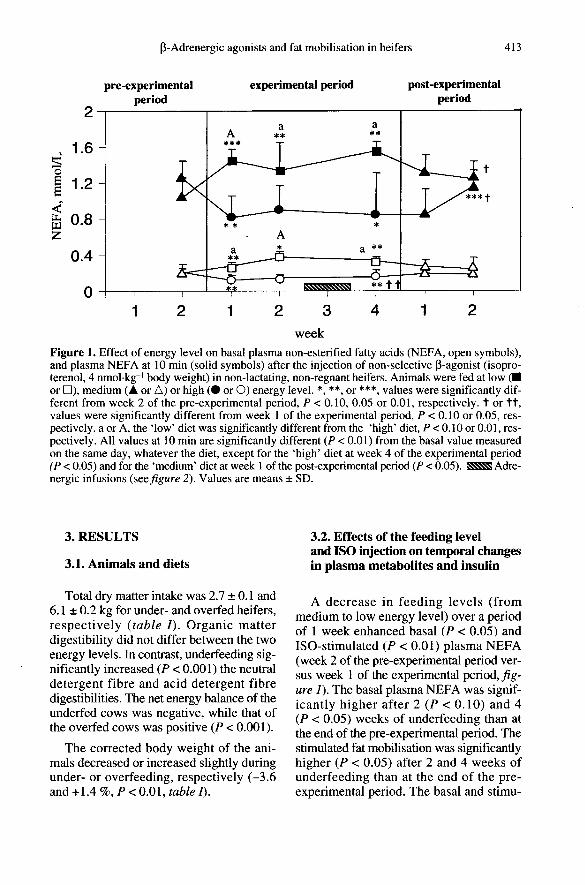
To analyse the short- and medium-term effectsof energy levels on plasma NEFA ( figure I dataresulting from injection protocols on day 11 ofthe pre-experimental period, on days 4, 11 and25 of the experimental period, and on days 4 and11 of the post-experimental period were com-pared within or between low, medium and highenergy levels, using the within-cow pairwise Stu-dent’s t-test with a probability of 0.01, 0.05 or0.10.
3. RESULTS
3.1. Animals and diets
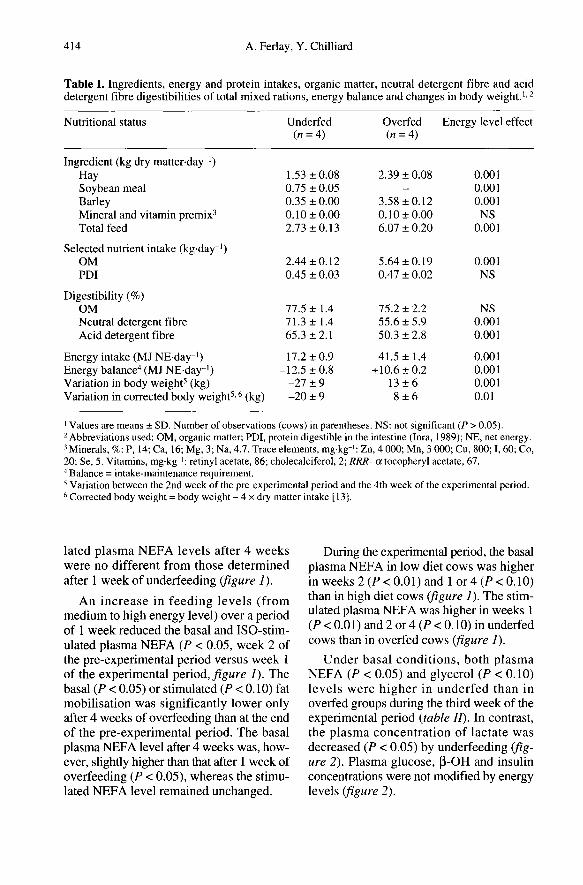
Total dry matter intake was 2.7 ± 0.1 and6.1 ± 0.2 kg for under- and overfed heifers,respectively (table I). Organic matterdigestibility did not differ between the twoenergy levels. In contrast, underfeeding sig-nificantly increased (P < 0.001) the neutraldetergent fibre and acid detergent fibredigestibilities. The net energy balance of theunderfed cows was negative, while that ofthe overfed cows was positive (P < 0.001).
The corrected body weight of the ani-mals decreased or increased slightly duringunder- or overfeeding, respectively (-3.6and +1.4 %, P < 0.01, table o.
3.2. Effects of the feeding leveland ISO injection on temporal changesin plasma metabolites and insulin
A decrease in feeding levels (frommedium to low energy level) over a periodof 1 week enhanced basal (P < 0.05) andISO-stimulated (P < 0.01) plasma NEFA(week 2 of the pre-experimental period ver-sus week 1 of the experimental period, fig-ure 1). The basal plasma NEFA was signif-icantly higher after 2 (P < 0.10) and 4(P < 0.05) weeks of underfeeding than atthe end of the pre-experimental period. Thestimulated fat mobilisation was significantlyhigher (P < 0.05) after 2 and 4 weeks ofunderfeeding than at the end of the pre-experimental period. The basal and stimu-
lated plasma NEFA levels after 4 weekswere no different from those determinedafter 1 week of underfeeding (figure 1 ).An increase in feeding levels (from
medium to high energy level) over a periodof 1 week reduced the basal and ISO-stim-ulated plasma NEFA (P < 0.05, week 2 ofthe pre-experimental period versus week 1of the experimental period, figure I ). Thebasal (P < 0.05) or stimulated (P < 0.10) fatmobilisation was significantly lower onlyafter 4 weeks of overfeeding than at the endof the pre-experimental period. The basalplasma NEFA level after 4 weeks was, how-ever, slightly higher than that after 1 week ofoverfeeding (P < 0.05), whereas the stimu-lated NEFA level remained unchanged.
During the experimental period, the basalplasma NEFA in low diet cows was higherin weeks 2 (P < 0.01) and 1 or 4 (P < 0.10)than in high diet cows (figure 1 ). The stim-ulated plasma NEFA was higher in weeks 1(P < 0.01) and 2 or 4 (P < 0.10) in underfedcows than in overfed cows (figure 1).
Under basal conditions, both plasmaNEFA (P < 0.05) and glycerol (P < 0.10)levels were higher in underfed than inoverfed groups during the third week of theexperimental period (table In. In contrast,the plasma concentration of lactate wasdecreased (P < 0.05) by underfeeding !g-ure 2). Plasma glucose, P-OH and insulinconcentrations were not modified by energylevels (figure 2).
3.3. Effects of the infusionof non-selective adrenergic [3-agonist,and selective (31- and p2-adrenergicagonists, on plasma metabolitesand insulin
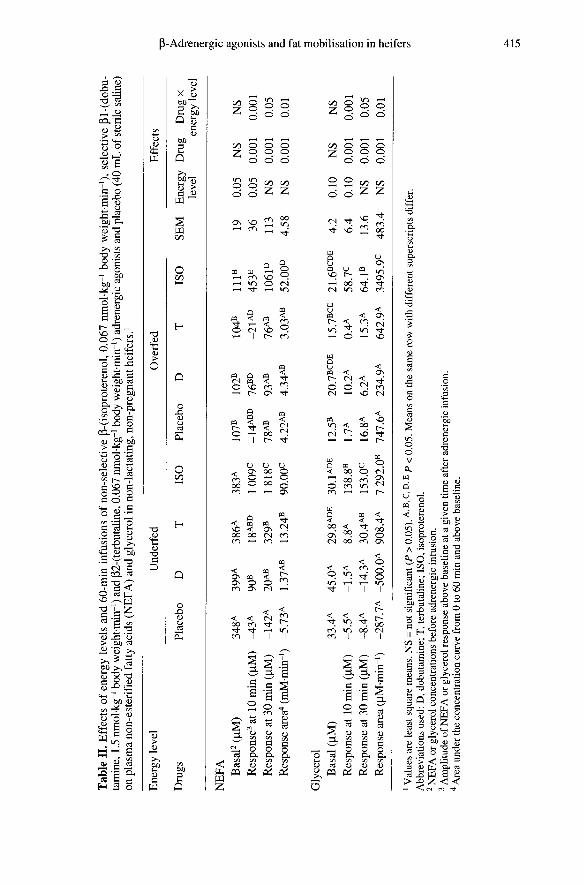
The overall effects of the treatments are
reported in table II. Both plasma NEFA andglycerol responses after 10 min of the druginfusions were significantly higher in under-
fed than in overfed groups (table I<). Drugeffects were significant (P < 0.001) onplasma NEFA and glycerol responses at10 and 30 min, and on NEFA and glycerolresponse areas (P < 0.001 The interactionsbetween drugs and energy level were sig-nificant for all variables (table I!.
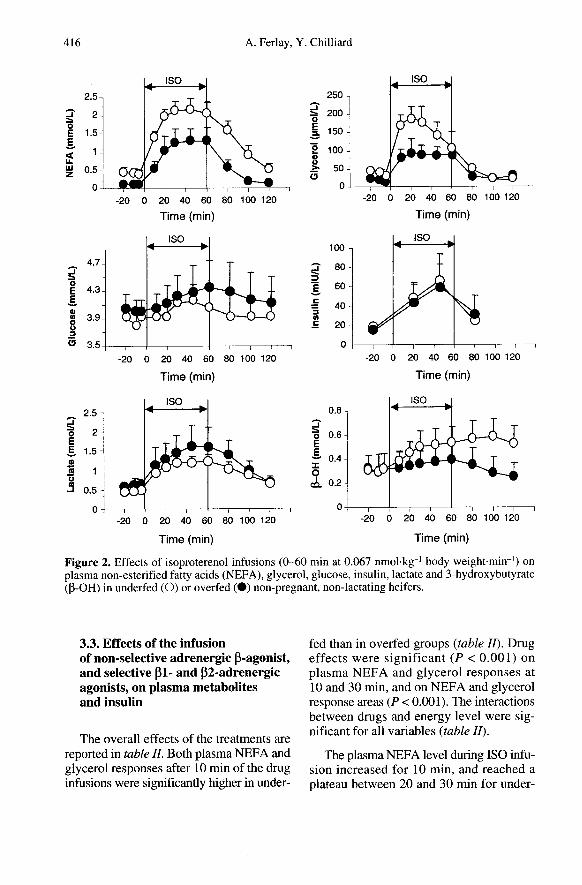
The plasma NEFA level during ISO infu-sion increased for 10 min, and reached aplateau between 20 and 30 min for under-
and overfed groups. The maximal NEFAconcentrations at 45 and 60 min were 2.17 7and 1.31 1 mmol.L- (P < 0.001), for underfedand overfed groups, respectively (figure 2).The glycerol level increased for 10 min forboth groups, and peaked at 30 and 20 min, at189 and 94 !tmol-L-1 (P < 0.01), for under-fed and overfed groups, respectively. Theconcentrations of NEFA and glycerolreturned to baseline values within 60 and20 min after the end of ISO infusion, respec-tively (figure 2).
The T had a slight but significant effect onthe plasma NEFA response at 30 min afterthe start of infusion in the underfed group(P < 0.05, table Io. The D had no lipolyticeffect, except for the plasma NEFA responseat 10 min in underfed cows (P < 0.05). ISOinfusion induced the same trends in plasmaNEFA and glycerol responses, but theresponse area of glycerol to (3-A wasmarkedly lower (approximately 12-15 times)than that of NEFA.
ISO infusion enhanced glycaemia andinsulinaemia (P < 0.05) whatever the diet(figure 2). Plasma glucose levels peaked at45 and 60 min during ISO infusion forunderfed and overfed cows, respectively.The maximal glucose concentrations tendedto be lower (P < 0.10) in underfed cows thanin overfed cows (4.15 versus 4.34 mmol!Lw,respectively, figure 2). Glucose concentra-tions returned to the baseline within 20 min
post-infusion in the underfed group, but notin the overfed group (figure 2). Plasmainsulin peaked at 45 min for under- andoverfed cows (66.4 versus 61.6 mlU.L-1,respectively, figure 2). ISO sharply increasedplasma lactate in underfed and overfed cows(P < 0.01, figure 2). The maximal concen-tration of plasma lactate tended to be lower(P < 0.10) in underfed cows than in overfedcows (1.200 versus 1.627 mmol-L -1, respec-tively, figure 2). The lactate levels declinedbut did not return to the baseline after theend of ISO infusion. ISO increased plasmaP-OH only in underfed cows (P < 0.05, fig-ure 2) and this effect lasted for at least
60 min after the end of the ISO infusion. Tand D infusions did not modify any metabo-lite or insulin concentration, and the inter-actions between drug and energy levels werenot significant (data not shown).
4. DISCUSSION
4.1. Role of (31- and P2-adrenergicagents in body fat mobilisation
The absence of a lipolytic effect of D,whatever the energy level, corresponds toour previous data on underfed cows [ 19],showing a very small change in NEFA con-centrations in animals infused with similarD doses. Both results seem to contradict the
relatively high proportion of J31-AR in theP-AR population of bovine AT (29 %) [43].D is probably not very efficient as a P I -A, aswas shown in the pig [35]. In humans andrats [32], the presence and role of (31-ARwere shown by binding studies and in vitroor in situ measurements of lipolytic responsesstimulated by ISO and inhibited by selec-tive pi-antagonists (i.e. CGP120712) [1, 30,33]. Further in vivo experiments using thesetools will be necessary to better clarify therole of J31-AR in fat mobilisation of cattle.
ISO caused significant lipolytic effectsas compared to the slight effects of T. Thisresult is surprising, but confirms in part ourprevious data [ 19]. At the same infused dose(0.07 nmol.kg-I body weight.min-l), theresponse area to T was only 49 % of theresponse area to ISO in the previous study,and 15 % of that in the present study. Sim-ilarly, the dialysate glycerol response areato T, perfused in situ at 10! or 10-5 M inunderfed ewes, represented only 38 or 49 %,respectively, of the response to ISO [21].
In ruminants, only indirect comparisonscan be made between the effects of T andother p2-A. Clenbuterol infusing [3] at0.04 nmol.kg-I body weight-min-’ for60 min (half the dose of that of T used inour study) in lactating well-fed cowsincreased the plasma NEFA up to levels
similar to those obtained with T in our study.In contrast, T infusing at 0.03 nmol.kg-Ibody weight-min-’ had no lipolytic effectin underfed cows [19]. Thus, clenbuterolseems to be more potent than T, but less sothan ISO, and this may be due in part to thefact that clenbuterol could interact with other
(3-AR (e.g. (31-AR) [31].The weak effect of T could not be
explained by a low number of p2-AR in cat-tle AT, which is about 70 % of the sum of
(31-, p2- and p3-AR [43]. Our result couldbe due to a higher affinity or maximal activ-ity of ISO than T for the p2-AR. Indeed,the in vitro ED50 of ISO and T in humanswas approximately 3.10-9 and 10-! M,respectively [1]. The in vitro maximal activ-ity of T was 40 and 69 % of the activity ofISO, in pigs [35] and in humans [1], respec-tively.
The high lipolytic effect of ISO couldalso be due to its interaction with other (3-AR, such as (33- or p4-AR. Nevertheless,the in situ perfusion of a selective fi3-A insubcutaneous AT of underfed ewes had no
lipolytic effect [21]. Galitzky et al. [23] sug-gested the existence of p4-AR in humansubcutaneous AT, but no data on putativep4-AR in ruminants are available.The ISO infusion increased plasma
(3-OH and lactate concentrations (figure 2).The increase in plasma (3-OH by a (3-A, inthe monogastric species, was shown to bedue to an increase in the production ofketone bodies by the liver, combined with anincrease in the plasma NEFA concentration[45]. (3-OH may be antilipolytic in vivo incattle [36], but this seems to be unlikely inour study because the maximal concentra-tions of (3-OH (0.34-0.44 mmot-L-1) weremuch lower than those (2-4 mmol-L-1)required for an antilipolytic effect.
The increase in plasma lactate during ISOinfusion was probably caused essentially bymuscle glycogenolysis resulting from theactivation of p2-AR [41]. Lactate could havean antilipolytic effect under basal condi-tions in vitro in the dog [17] or on ISO-
induced lipolysis in human fat cells at veryhigh concentrations (16 mmol-L-1 of lactate
[18]). The highest plasma lactate concen-tration in our study was, however, no morethan 1.63 mmol!L-!. On the other hand,ISO increased plasma glucose and insulin(figure 2), which may inhibit NEFA releaseby AT [44], since the plasma antilipolyticconcentrations of glucose and insulin insheep were above 3.5 mmol-L-1 [9] and4.5 mlU.L-1 [37], respectively. Thus, thenet lipolytic effect of ISO would be evengreater than that observed, and the real dif-ference between the effects of ISO, D and Ton fat mobilisation could be greater thanthose suggested by our results.
4.2. Effect of the feeding levelon body fat mobilisation
Underfeeding increased basal plasmaNEFA in ruminants, as previously described[7, 15, 22]. This increase in fat mobilisa-tion was not due to a decrease in the
antilipolytic effects of basal (preprandial)plasma insulin and glucose [44], becausethese two factors were not modified in our
study (figure 2). However, post-prandialplasma insulin could have been modifiedby energy level [ 14].
Basal or ISO-stimulated plasma NEFAlevels obtained with the medium diet were inbetween the levels obtained with the lowand high diets (figure 1). This confirms therelationship that exists between basal NEFAor NEFA response to a (3-adrenergic chal-lenge, and energy balance in ruminants [ 1, 6,20]. This increase seems to be due in partto an increase in p2-AR stimulation, withoutchanges in the (31-adrenergic response. Thisresult contrasts with that of Barbe et al. [2]who reported that the in situ lipolyticresponse to (31-A (dobutamine) was higherthan the response to fi2-A (terbutaline) aftera hypocaloric diet in obese humans. More-over, the in vitro maximal lipolytic responsesto D and T were not modified after a
hypocaloric diet in obese women [25]. The
increases in the (3- and (32-adrenergicresponses after underfeeding in our studycould be due to an increase in the number or
affinity of (31- and/or (32-AR. It has beenshown that, in lactating cows, fasting for3 days increased affinity, but decreased thenumber of AT (3-AR [26]. Another possi-bility is that underfeeding increases the cou-pling efficiency between the (3-AR andadenylyl cyclase or changes other elementsof the lipolytic cascade, since there was adecrease in the antilipolytic effect of adeno-sine in lactating cows fasting over a periodof 3 days [26].
Another explanation could be that under-feeding induces an insulin resistance orincreases the concentration of other plasmahormones (e.g. growth hormone, glucocor-ticoids or thyroid hormones), changes whichcan increase lipolysis and/or potentiate theeffects of catecholamines [10, 14, 15]. Glu-cocorticoids enhance (32-AR expression,whereas they strongly suppress (31- andp3-AR in murine 3T3-F442A cells [42].Therefore, glucocorticoids could be partlyresponsible for the increase in (3- and [32-adrenergic lipolysis in our study.
Basal fat mobilisation was unchanged bymedium-term (4 weeks) undemutrition afterthe initial increase within week 1. A similarresult was observed in ewes that were under-fed for 4 weeks [15]. This contrasts, how-ever, with Reid and Hinks’ [38] and Jacksonand Winkler’s [28] data on sheep. Indeedthese authors observed that plasma NEFAtended to decrease after 3 weeks of under-
feeding or fasting.To our knowledge, there are no published
data on the effects of 4-week underfeedingon fat mobilisation response to a (3-A stim-ulation in ruminants or monogastrics.Plasma NEFA levels after ISO injectionwere similar after 1 or 4 weeks of under-
feeding (figure 1), suggesting that the cattleAT response to (3-adrenergic hormones doesnot change, and that there is no desensiti-sation during medium-term underfeeding.It was observed in humans that the sensi-
tivity of adipocytes to the antilipolytic effectof adenosine does not change during4 weeks of energy restriction [29].
This study suggests that lipomobilisationis not coupled with (31-AR in cattle, con-trary to several other species. Underfeed-ing rapidly increases the in vivo lipolyticresponse to (3-A (within 1 week) until itreaches a constant value for at least 4 weeks,and this response is due in part to (32-ARstimulation. Additional in vivo and in vitrostudies using ISO and selective (31- and (32-antagonists are required in order to betterunderstand the effect of changes in feedinglevels on the different (3-AR subtypes thatregulate lipolysis in cattle.
ACKNOWLEDGEMENTS
The authors thank M. Berlan and J. Galitzkyfor their helpful discussions on the experimentalprotocol, A. Ollier and J.P. Pezant for the man-agement of the animals, D. Thomas, E. Girardand G. Sauvage for blood sample collection,R. Lefaivre and M. Tourret for technical assis-tance, C. Durier for help in the statistical analy-sis, P. Béraud and Y. Fournier for help in prepar-ing the manuscript and A.-M. Wall for revisingthe manuscript. This work was supported by agrant from the Auvergne Region (’Physiologi-cal adaptation of animals to harsh environmentalconditions’ Programme).
REFERENCES
[1] ] Barbe P., Millet L., Galitzky J., Lafontan M.,Berlan M., In situ assessment of the role of thep I-, P2- and p3-adrenoceptors in the control oflipolysis and nutritive blood flow in human sub-cutaneous adipose tissue, Br. J. Pharmacol. 117 7(1996)907-913.
[2] Barbe P., Stich V., Galitzky J., Kunesova M.,Hainer V., Lafontan M., In vivo increase inadrenergic lipolytic response in subcutaneousadipose tissue of obese subjects submitted to ahypocaloric diet, J. Clin. Endocrin. Metabol. 82(1997) 63-69.
[3] Bareille N., Faverdin P., Lipid metabolism andintake behavior of dairy cows: effects of intra-venous lipid and (3-adrenergic supplementation,J. Dairy Sci. 79 (1996) 1209-1220.
[4] Barnouin J., El Idilbi N., Chilliard Y., Chaco-rnac J.P., Lefaivre R., Micro-dosage automa-tis6 sans d6prot6nisation du 3-hydroxy-butyrateplasmatique chez les bovins, Ann. Rech. V6t.17 (1986) 129-139.
[5] ] Bergmeyer H.U., Methods of Enzymatic Anal-ysis, 2nd English ed., Translated from the 3rdGerman ed., Verlag chimie, Weinheim, Ger-many, 1974.
[6] Blum J.W., Flueckiger N., Early metabolic andendocrine effects of perorally administered beta-adrenoceptor agonists in calves, Eur. J. Phar-macol. 151 (1988) 177-187.
[7] Blum J.W., Fr6hli D.M., Kunz P., Effects ofcatecholamines on plasma free fatty acids in fedand fasted cattle, Endocrinology 110 (1982)452-456.
[8] Bousquet-M61ou A., Galitzky J., Moreno M.C., .,
Berlan M., Lafontan M., Desensitization ofP-adrenergic responses in adipocytes involvesreceptor subtypes and cAMP phosphodiesterase,Eur. J. Pharmacol. 289 (1995) 235-247.
[9] Brockman R.P., Effect of glycemic changes onlipolysis in sheep in vivo, Metabolism 33 (1984)329-331. 1 .
[10] Brockman R.P., Laarveld B., Hormonal regu-lation of metabolism in ruminants: a review,Livestock Prod. Sci. 14 (1986) 313-334.
[ 11 ] Casteilla L., Muzzin P., Revelli J.P., Ricquier D.,Giacobino J.P., Expression of (31- and (33-adren-ergic-receptor messages and adenylate cyclase(3-adrenergic response in bovine perirenal adi-pose tissue during its transformation from browninto white fat, Biochem. J. 297 (1994) 93-97.
[12] Chilliard Y., Bauchart D., Barnouin J., Deter-mination of plasma non esterified fatty acids inherbivores and man: a comparison of valuesobtained by manual or automatic chromato-graphic, titrimetric, colorimetric and enzymaticmethods, Reprod. Nutr. Dev. 24 (1984)469-482.
[13] Chilliard Y., Remond B., Agabriel J., Robelin J.,Verite R., Variations du contenu digestif et desreserves corporelles au cours du cycle gesta-tion-lactation, Bull. Tech. C.R.Z.V. Theix 70(1987) 117-131. 1 .
[14] Chilliard Y., Doreau M., Bocquier F.,Lobley G.E., Digestive and metabolic adapta-tions of ruminants to variations in food supply,in: Journet M., Grenet E., Farce M.H., Thériez M.,Demarquilly C. (Ed.), Recent Developments inthe Nutrition of Herbivores, Proceedings of theIVth International Symposium on the Nutritionof Herbivores, Inra, Paris, 1995, pp. 329-360.
[15] Chilliard Y., Bocquier F., Doreau M., Diges-tive and metabolic adaptations of ruminants toundernutrition, and consequences on reproduc-tion, Reprod. Nutr. Dev. 38 (1998) 131-152.
[16] Chilliard Y., Ferlay A., Despres L., Bocquier F.,Plasma non-esterified fatty acid response to a(3-adrenergic challenge in underfed or overfed,
dry or lactating cows, before or after feeding,Anim. Sci. 67 (1998) 213-223.
[ 17] Coppack S.W., Jensen M.D., Miles J.M., In vivoregulation of lipolysis in humans, J. Lipid Res.35 (1994) 177-193.
[18] De Pergola G., Cignarelli M., Nardelli G.,Garruti G., Corso M., Di Paolo S., Cardone F.,Giorgino R., Influence of lactate on isopro-terenol-induced, lipolysis and (3-adrenoceptorsdistribution in human fat cells, Horm. Metabol.Res. 21 (1989) 210-213.
[19] Ferlay A., Chilliard Y., Effects of (3-, (31-, and(32 adrenoceptor agonist infusion on plasma non-esterified fatty acids in non-pregnant, non-lac-tating, underfed cows, Ann. Zootech. 44 (1995)299.
[20] Ferlay A., Chilliard Y., Sala A.M., Durier C.,Bocquier F., Somatotropin treatment does notaffect non-esterified fatty acid response to adren-ergic injections in underfed or overfed nonlac-tating cows, J. Nutr. 126 (1996) 945-954.
[21] Ferlay A., Charret C., Galitzky J., Berlan M.,Chilliard Y., Effects of the infusion of P-, (32- orP3-adrenergic agonists or epinephrine on in situlipolysis in ewe subcutaneous adipose tissue,Reprod. Nutr. Dev. 38 (1998) 196-197.
[22] Frohli D.M., Blum J.W., Non-esterified fattyacids and glucose in lactating dairy cows: diur-nal variations and changes in responsivenessduring fasting to epinephrine and effects of beta-adrenergic blockade, J. Dairy Sci. 71 (1988)1170-1177.
[23] Galitzky J., Langin D., Verwaerde P., Montas-truc J.L., Lafontan M., Berlan M., Lipolyticeffects of conventional #3-adrenoceptor ago-nists and of CGP 12,177 in rat and human fatcells: preliminary pharmacological evidence fora putative (34-adrenoceptor, Br. J. Pharmacol.122 (1997) 1244-1250.
[24] Germack R., Starzec A.B., Vassy R., Perret G.Y.,(3-adrenoceptor subtype expression and func-tion in rat white adipocytes, Br. J. Pharmacol.120 (1997) 201-210.
[25] Helistrbm L., Reynisdottir S., Langin D., R6ss-ner S., Arner P., Regulation of lipolysis in fatcells of obese women during long-termhypocaloric diet, Int. J. Obesity 20 (1996)745-752.
[26] Houseknecht K.L., Bauman D.E., Carey G.B.,Mersmann H.J., Effect of bovine somatotropinand food deprivation on (3-adrenergic and Aladenosine receptor binding in adipose tissue oflactating cows, Domest. Anim. Endocrinol. 12(1995)325-336.
[27] Institut national de la recherche agronomique(Inra), Jarrige R. (Ed.), Ruminant Nutrition.Recommended Allowances and Feed Tables,John Libbey Eurotext, London, UK, Paris, 1989.
[28] Jackson H.D., Winkler V.W., Effects of starva-tion on the fatty acid composition of adiposetissue and plasma lipids of sheep, J. Nutr. 100(1970)201-207.
[29] Kather H., Wieland E., Fisher B., Schlierf G.,Antilipolytic effects of N6-phenylisopropy-ladenosine and prostaglandin E2 in fat-cells ofobese volunteers before and during energyrestriction, Biochem. J. 231 (1985) 531-535.
[30] Lafontan M., Differential recruitment and dif-ferential regulation by physiological amines offat cell pl, (32 et (33-adrenergic receptorsexpressed in nature fat cells and in transfectedcell lines, Cell. Signal. 6 (1994) 363-392.
[31] Lafontan M., Berlan M., Prud’hon M., Les ago-nistes b!ta-adr6nergiques. M6canismes d’action:lipomobilisation et anabolisme, Reprod. Nutr.Dev. 28 (1988) 61-84.
[32] Lafontan M., Bousquet-M61ou A., Galitzky J.,Barbe P., Carp6n6 C., Langin D., Berlan M.,Valet P., Castan I., Bouloumid A., Saulnier-Blache J.S., Adrenergic receptors and fat cells:differential recruitment by physiological aminesand homologous regulation, Obesity Res. 3(1995) 5075-514S.
[33] Mauri6ge P., De Pergola G., Berlan M., Lafon-tan M., Human fat cell beta-adrenergic recep-tors: beta-agonist-dependent lipolytic responsesand characterization of beta-adrenergic bindingsites on human fat cell membranes with highlyselective beta, -antagonists, J. Lipid Res. 29(1988)587-b01.
[34] McGowan M.V., Artiss J.D., Strandbergh D.R.,Zak B., A peroxidase-coupled method for thecolorimetric determination of serum triglyc-erides, Clin. Chem. 29 (1983) 538-542.
[35] Mersmann H.J., Specificity of (3-adrenergic con-trol of lipolysis in swine adipose tissue, Comp.Biochem. Physiol. 77C (1984) 39-42.
[36] Metz S.H.M., Van de Bergh S.G., Effects ofvolatile fatty acids, ketone bodies, glucose andinsulin on lipolysis in bovine adipose tissue,FEBS Lett. 21 (1972) 203-206.
[37] Petterson J.A., Slepetid R., Ehrhardt R.A., Dun-shea F.R., Bell A.W., Pregnancy but not mod-erate undemutrition attenuates insulin suppres-sion of fat mobilization in sheep, J. Nutr. 124(1994)2431-2436.
[38] Reid R.L., Hinks N.T., Studies on the carbohy-drate metabolism of sheep. XIX The metabolismof glucose, free fatty acids, and ketones bodiesafter feeding and during fasting or undernour-ishment of non-pregnant, pregnant, and lactatingewes, Aust. J. Agric. Res. 13 (1962) 1124-1136.
[39] SAS User’s Guide: Statistics, Version 6 Edi-tion, Statistical Analysis Systems Institute, Inc.,Cary, NC, USA. 1987.
[40] Shimojo N., Naka K., Nakajima C., Yoshikawa C.,Okuda K., Okada K., Test-strip method for mea-suring lactate in whole blood, Clin. Chem. 35(1989)1992-1994.
[41] Sillence M.N., Matthews M.L., Classical andatypical binding sites for (3-adrenoceptor lig-ands and activation of adenylyl cyclase in bovineskeletal muscle and adipose tissue membranes,Br. J. Pharmacol. 111 (1994) 866-872.
[42] Strosberg A.D., Structure and function of the(33 adrenergic receptor, Annu. Rev. Pharmacol.Toxicol. 37 (1997) 421-450.
[43] Van Liefde I., Van Ermen A., Van WitzenburgFraeyman A., Vauquelin G., Species and strain-related differences in the expression and func-tionality of (3-adrenoceptor subtypes in adiposetissue, Arch. lnt. Pharmacol. Th6rapie 327(i994)69-86.
[44] Vernon R.G., Effects of diet on lipolysis and itsregulation, Proc. Nutr. Soc. 51 (1992) 397-408.
[45] Webber J., McDonald I.A., Metabolic actionsof catecholamines in man, Bailli6res Clin.Endocrinol. Metab. 7 (1993) 393!13.

![Investigation of perovskite oxide SrFe0. 8Cu0. 1Nb0. 1O3-δ ... · tive fuel cells, especially in solid oxide fuel cells [25e28]. Perovskite oxides have been widely used as both cathode](https://static.fdocument.org/doc/165x107/5ed225ea5e0ec842bd789c96/investigation-of-perovskite-oxide-srfe0-8cu0-1nb0-1o3-tive-fuel-cells.jpg)