THE ROLE OF THE ARYL HYDROCARBON RECEPTOR IN …
182
THE ROLE OF THE ARYL HYDROCARBON RECEPTOR IN 2,3,7,8- TETRACHLORODIBENZO-ρ-DIOXIN-INDUCED MITOCHONDRIAL DYSFUNCTION IN MOUSE HEPATOMA CELLS By Hye Jin Hwang A DISSERTATION Submitted to Michigan State University in partial fulfillment of the requirements for the degree of Biochemistry and Molecular Biology - Doctor of Philosophy 2015
Transcript of THE ROLE OF THE ARYL HYDROCARBON RECEPTOR IN …
THE ROLE OF THE ARYL HYDROCARBON RECEPTOR IN 2,3,7,8-
TETRACHLORODIBENZO-ρ-DIOXIN-INDUCED MITOCHONDRIAL DYSFUNCTION IN MOUSE HEPATOMA CELLS
By
Hye Jin Hwang
A DISSERTATION
Submitted to Michigan State University
in partial fulfillment of the requirements for the degree of
Biochemistry and Molecular Biology - Doctor of Philosophy
2015
ABSTRACT
THE ROLE OF THE ARYL HYDROCARBON RECEPTOR IN 2,3,7,8-TETRACHLORODIBENZO-ρ-DIOXIN-INDUCED MITOCHONDRIAL DYSFUNCTION IN
MOUSE HEPATOMA CELLS
By
Hye Jin Hwang
The aryl hydrocarbon receptor (AHR) is a Per-Arnt-Sim (PAS) domain family protein and
ligand-activated transcription factor. The AHR directly regulates the expression of a large
number of genes, including many that encode Phase I and Phase II drug metabolizing enzymes.
Environmental contaminants such as polycyclic aromatic hydrocarbon or halogenated aryl
hydrocarbon act as AHR ligands. The most potent AHR ligand, 2,3,7,8-tetrachlorodibenzo-ρ-
dioxin (TCDD), causes various deleterious physiological effects, such as tumor promotion,
chloracne, wasting syndrome, and hepatic steatosis. Over the last several decades, the AHR
has been the focus of extensive research. Even with this depth of inquiry, there is a lack of
understanding to the mechanism of action for AHR-mediated toxicity. Several possibilities have
been proposed. For example, since the AHR is a transcription factor, it has been proposed that
one, or more, of the genes that is regulated by the AHR leads to toxicity. The cytochrome P450
monooxygenases (CYPs) and TCDD-inducible poly (ADP-ribose) polymerase (TiPARP) are
primary targets of AHR-regulated expression and are capable of promoting oxidative stress. In
addition, the AHR can participate in crosstalk with other signaling pathways related to
proliferation, development, differentiation, immune suppression, lipid metabolism and apoptosis.
Several of these pathways are also involved in mediating the cellular response to oxidative
stress. Given that oxidative stress is central to multiple pathways involved in AHR-mediated
TCDD-induced toxicity and that the mitochondria, which consume most of cellular oxygen, are
the main site generating oxidative stress, the role of the mitochondria in AHR signaling and
toxicity was explored.
Using the protease protection assay with digitonin extraction, the AHR was localized to
the inter-membrane space (IMS) of the mitochondria. TCDD exposure induced a degradation of
mitochondrial AHR similar to that of cytosolic AHR. Using siRNA in mouse hepatoma
hepa1c1c7 cells, TOM20 and AHR-interacting protein (AIP) knockdown revealed that these two
proteins are involved in the import of AHR into the mitochondria. The inhibition of heat shock
protein-90kDa (HSP90) activity using an ATPase inhibitor, geldanamycin, also suggested that
activity of HSP90 decided the level of mitochondrial AHR. TCDD altered the metabolic rate of
cells in an AHR-dependent manner as measured by oxygen consumption rate (OCR) using the
XF24 Extracellular Flux Analyzer. 30 nM TCDD exposure in hepa1c1c7 cells caused a
significant AHR-dependent decrease in the OCR, but no change in the respiratory control ratio
and the enzyme activities in ETC and ATP synthase. On the other hand, 30 nM TCDD
exposure in AHR-deficient hepac12 cells caused no significant changes but the increased the
respiratory control ratio and the activity of complex I. The mitochondria proteome was
investigated using stable isotope labeling by amino acids in cell culture (SILAC). SILAC
identified a battery of proteins that were influenced by TCDD in an AHR-dependent manner.
The proteomic data suggested TCDD-induced AHR-mediated regulation in heme metabolism,
lipid metabolism, redox potential, and mitochondrial biogenesis.
Collectively, the data suggest the model 1) mitochondrial AHR in the IMS binds to
components in the inner-membrane (IM), 2) TCDD induces the loss of interaction of AHR
between a component in the IM, possibly causing an alteration in respiratory machinery, 3) AHR
might help maintain homeostasis in respiratory efficiency against TCDD via regulating complex I
or complex IV activity, and 4) AHR regulates the expression of genes that encode proteins that
are important for various mitochondrial metabolic pathway and this regulation can be a result of
mitochondrial retrograde signaling. This model supports a role for the mitochondria and
possibly mitochondrial localized AHR in TCDD-induced toxicity, including metabolic dysfunction,
wasting syndrome and hepatic steatosis.

iv
ACKNOWLEDGEMENTS
The graduate school life in the MSU brought me wonderful memories within my life.
Those couldn’t have been made without people whom I have had known, and I would never
have achieved a PhD without them.
First, I would like to thank Dr. John LaPres, my PI, for his consistent support,
encouragement, and patience. He is a good model of scientist. He has taught me how and
what a scientist must think and consider. He was always accessible and provided valuable
advice. His guidance made me get through tough challenges from experiments and endless
learning.
Next, I would like to thank my committee members, for their precious time and
supportive advice, Drs. Shelagh Ferguson-Miller, Kathy Gallo, Bill Henry, and Jeff MacKeigan.
In every committee meeting, I got valuable guidance and insightful comments. I would
especially like to thank Dr. Ferguson-Miller for providing a wealth of knowledge and
collaboration regarding mitochondria and experimental techniques.
Also, I had luck to work with wonderful people, the members of LaPres lab. I thank Drs.
Scott Lynn, Dorothy Tappenden, and Ajith Vengellur for being exceptional colleagues, scientific
mentors, and friends. I also thank Dr. Steve Proper for help and friendship. Finally, I want to
thank the current members, Peter Dornbos and Michelle Steidemann, and the past graduate
rotation students and undergraduate students, Taylor, Sarah, Mike, Larissa, Kai, for their huge
efforts and help in the project.
I would like to thank the Biochemistry & Molecular Biology program, and RTSF facility for
their assistance. In addition, I also want to thank Dr. Laurie Kaguni for giving me the opportunity
to attend the mitochondria summer schools.
Lastly, I would like to thank my family for their love, supports and being there. Without
you, I could not have done all of mine here. I love you and thank you.
v
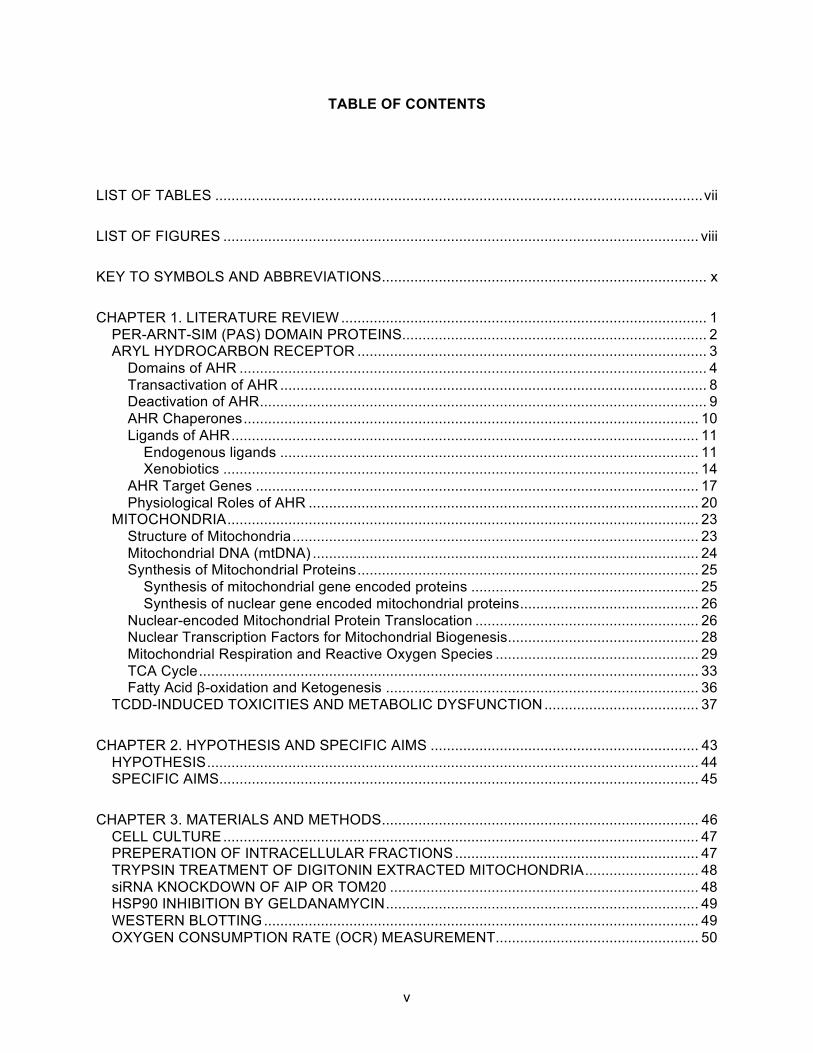
TABLE OF CONTENTS
LIST OF TABLES ........................................................................................................................ vii!
LIST OF FIGURES ..................................................................................................................... viii!
KEY TO SYMBOLS AND ABBREVIATIONS ................................................................................ x!
CHAPTER 1. LITERATURE REVIEW .......................................................................................... 1!PER-ARNT-SIM (PAS) DOMAIN PROTEINS ........................................................................... 2!ARYL HYDROCARBON RECEPTOR ...................................................................................... 3!
Domains of AHR ................................................................................................................... 4!Transactivation of AHR ......................................................................................................... 8!Deactivation of AHR .............................................................................................................. 9!AHR Chaperones ................................................................................................................ 10!Ligands of AHR ................................................................................................................... 11!
Endogenous ligands ....................................................................................................... 11!Xenobiotics ..................................................................................................................... 14!
AHR Target Genes ............................................................................................................. 17!Physiological Roles of AHR ................................................................................................ 20!
MITOCHONDRIA .................................................................................................................... 23!Structure of Mitochondria .................................................................................................... 23!Mitochondrial DNA (mtDNA) ............................................................................................... 24!Synthesis of Mitochondrial Proteins .................................................................................... 25!
Synthesis of mitochondrial gene encoded proteins ........................................................ 25!Synthesis of nuclear gene encoded mitochondrial proteins ............................................ 26!
Nuclear-encoded Mitochondrial Protein Translocation ....................................................... 26!Nuclear Transcription Factors for Mitochondrial Biogenesis ............................................... 28!Mitochondrial Respiration and Reactive Oxygen Species .................................................. 29!TCA Cycle ........................................................................................................................... 33!Fatty Acid β-oxidation and Ketogenesis ............................................................................. 36!
TCDD-INDUCED TOXICITIES AND METABOLIC DYSFUNCTION ...................................... 37!
CHAPTER 2. HYPOTHESIS AND SPECIFIC AIMS .................................................................. 43!HYPOTHESIS ......................................................................................................................... 44!SPECIFIC AIMS ...................................................................................................................... 45!
CHAPTER 3. MATERIALS AND METHODS .............................................................................. 46!CELL CULTURE ..................................................................................................................... 47!PREPERATION OF INTRACELLULAR FRACTIONS ............................................................ 47!TRYPSIN TREATMENT OF DIGITONIN EXTRACTED MITOCHONDRIA ............................ 48!siRNA KNOCKDOWN OF AIP OR TOM20 ............................................................................ 48!HSP90 INHIBITION BY GELDANAMYCIN ............................................................................. 49!WESTERN BLOTTING ........................................................................................................... 49!OXYGEN CONSUMPTION RATE (OCR) MEASUREMENT .................................................. 50!
vi
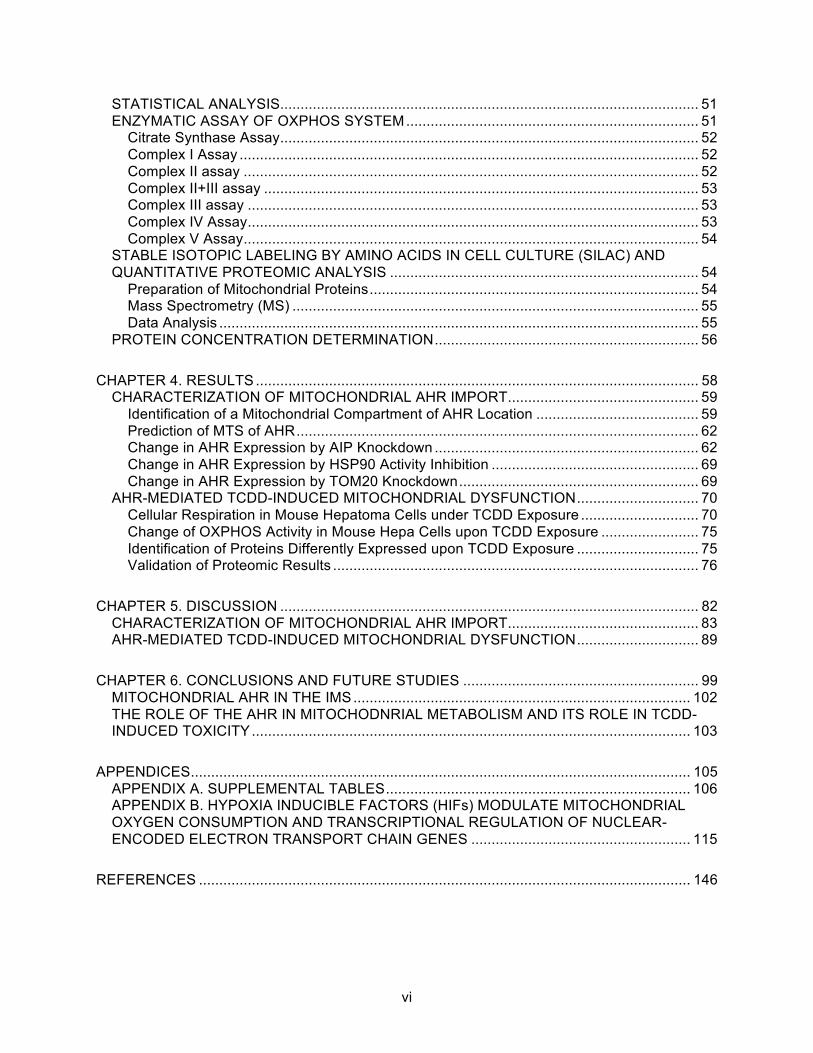
STATISTICAL ANALYSIS....................................................................................................... 51!ENZYMATIC ASSAY OF OXPHOS SYSTEM ........................................................................ 51!
Citrate Synthase Assay ....................................................................................................... 52!Complex I Assay ................................................................................................................. 52!Complex II assay ................................................................................................................ 52!Complex II+III assay ........................................................................................................... 53!Complex III assay ............................................................................................................... 53!Complex IV Assay ............................................................................................................... 53!Complex V Assay ................................................................................................................ 54!
STABLE ISOTOPIC LABELING BY AMINO ACIDS IN CELL CULTURE (SILAC) AND QUANTITATIVE PROTEOMIC ANALYSIS ............................................................................ 54!
Preparation of Mitochondrial Proteins ................................................................................. 54!Mass Spectrometry (MS) .................................................................................................... 55!Data Analysis ...................................................................................................................... 55!
PROTEIN CONCENTRATION DETERMINATION ................................................................. 56!
CHAPTER 4. RESULTS ............................................................................................................. 58!CHARACTERIZATION OF MITOCHONDRIAL AHR IMPORT ............................................... 59!
Identification of a Mitochondrial Compartment of AHR Location ........................................ 59!Prediction of MTS of AHR ................................................................................................... 62!Change in AHR Expression by AIP Knockdown ................................................................. 62!Change in AHR Expression by HSP90 Activity Inhibition ................................................... 69!Change in AHR Expression by TOM20 Knockdown ........................................................... 69!
AHR-MEDIATED TCDD-INDUCED MITOCHONDRIAL DYSFUNCTION .............................. 70!Cellular Respiration in Mouse Hepatoma Cells under TCDD Exposure ............................. 70!Change of OXPHOS Activity in Mouse Hepa Cells upon TCDD Exposure ........................ 75!Identification of Proteins Differently Expressed upon TCDD Exposure .............................. 75!Validation of Proteomic Results .......................................................................................... 76!
CHAPTER 5. DISCUSSION ....................................................................................................... 82!CHARACTERIZATION OF MITOCHONDRIAL AHR IMPORT ............................................... 83!AHR-MEDIATED TCDD-INDUCED MITOCHONDRIAL DYSFUNCTION .............................. 89!
CHAPTER 6. CONCLUSIONS AND FUTURE STUDIES .......................................................... 99!MITOCHONDRIAL AHR IN THE IMS ................................................................................... 102!THE ROLE OF THE AHR IN MITOCHODNRIAL METABOLISM AND ITS ROLE IN TCDD-INDUCED TOXICITY ............................................................................................................ 103!
APPENDICES ........................................................................................................................... 105!APPENDIX A. SUPPLEMENTAL TABLES ........................................................................... 106!APPENDIX B. HYPOXIA INDUCIBLE FACTORS (HIFs) MODULATE MITOCHONDRIAL OXYGEN CONSUMPTION AND TRANSCRIPTIONAL REGULATION OF NUCLEAR-ENCODED ELECTRON TRANSPORT CHAIN GENES ...................................................... 115!
REFERENCES ......................................................................................................................... 146!
vii
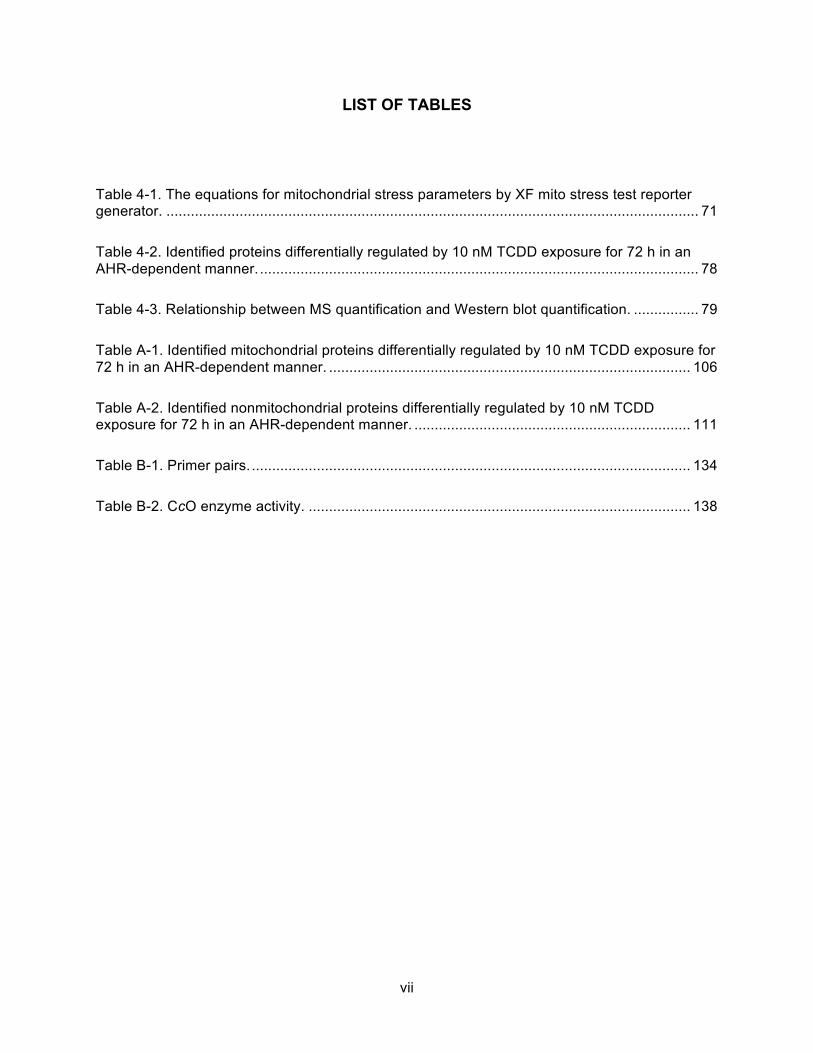
LIST OF TABLES
Table 4-1. The equations for mitochondrial stress parameters by XF mito stress test reporter generator. ................................................................................................................................... 71!
Table 4-2. Identified proteins differentially regulated by 10 nM TCDD exposure for 72 h in an AHR-dependent manner. ............................................................................................................ 78!
Table 4-3. Relationship between MS quantification and Western blot quantification. ................ 79!
Table A-1. Identified mitochondrial proteins differentially regulated by 10 nM TCDD exposure for 72 h in an AHR-dependent manner. ......................................................................................... 106!
Table A-2. Identified nonmitochondrial proteins differentially regulated by 10 nM TCDD exposure for 72 h in an AHR-dependent manner. .................................................................... 111!
Table B-1. Primer pairs. ............................................................................................................ 134!
Table B-2. CcO enzyme activity. .............................................................................................. 138!
viii
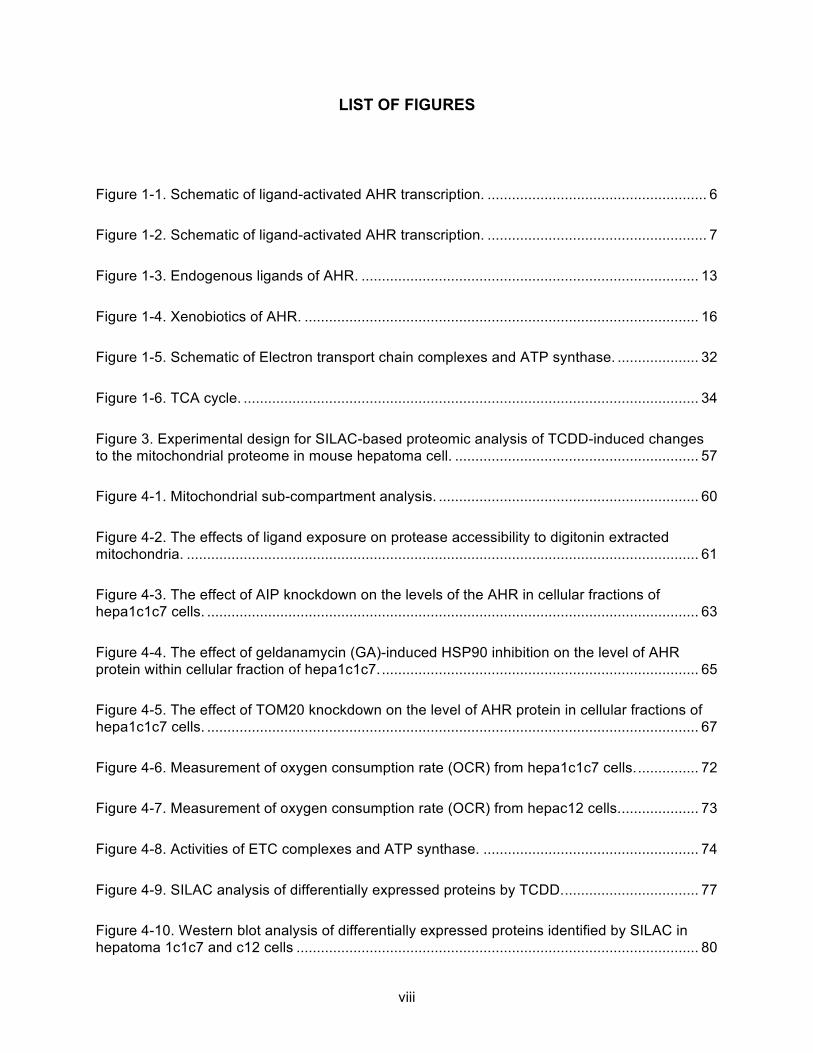
LIST OF FIGURES
Figure 1-1. Schematic of ligand-activated AHR transcription. ...................................................... 6!
Figure 1-2. Schematic of ligand-activated AHR transcription. ...................................................... 7!
Figure 1-3. Endogenous ligands of AHR. ................................................................................... 13!
Figure 1-4. Xenobiotics of AHR. ................................................................................................. 16!
Figure 1-5. Schematic of Electron transport chain complexes and ATP synthase. .................... 32!
Figure 1-6. TCA cycle. ................................................................................................................ 34!
Figure 3. Experimental design for SILAC-based proteomic analysis of TCDD-induced changes to the mitochondrial proteome in mouse hepatoma cell. ............................................................ 57!
Figure 4-1. Mitochondrial sub-compartment analysis. ................................................................ 60!
Figure 4-2. The effects of ligand exposure on protease accessibility to digitonin extracted mitochondria. .............................................................................................................................. 61!
Figure 4-3. The effect of AIP knockdown on the levels of the AHR in cellular fractions of hepa1c1c7 cells. ......................................................................................................................... 63!
Figure 4-4. The effect of geldanamycin (GA)-induced HSP90 inhibition on the level of AHR protein within cellular fraction of hepa1c1c7. .............................................................................. 65!
Figure 4-5. The effect of TOM20 knockdown on the level of AHR protein in cellular fractions of hepa1c1c7 cells. ......................................................................................................................... 67!
Figure 4-6. Measurement of oxygen consumption rate (OCR) from hepa1c1c7 cells. ............... 72!
Figure 4-7. Measurement of oxygen consumption rate (OCR) from hepac12 cells. ................... 73!
Figure 4-8. Activities of ETC complexes and ATP synthase. ..................................................... 74!
Figure 4-9. SILAC analysis of differentially expressed proteins by TCDD. ................................. 77!
Figure 4-10. Western blot analysis of differentially expressed proteins identified by SILAC in hepatoma 1c1c7 and c12 cells ................................................................................................... 80!
ix
Figure 5-1. Suggested role of mitochondrial AHR. ..................................................................... 88!
Figure 5-2. AHR-mediated TCDD-induced regulation of protein expression in metabolic pathways. .................................................................................................................................... 98!
Figure 6. Summary of AHR-mediated TCDD-induced mitochondrial dysfunction. ................... 101!
Figure B-1. Genotype and protein comparisons of Hif1α WT and null cells. ........................... 139!
Figure B-2. Measurement of oxygen consumption rate (OCR) from Hif1α WT and null cells. . 140!
Figure B-3A. Dendrograms. ...................................................................................................... 141!
Figure B-3B. Dendrograms. ...................................................................................................... 142!
Figure B-4. Gene expression of control and select mitochondrial genes. ................................ 143!
Figure B-5. Comparative amino acid sequences for COX7A1 and COX7A2 isoforms and a 3D representation of the COX monodimer. .................................................................................... 145!
x
KEY TO SYMBOLS AND ABBREVIATIONS
ACOT2 acyl-CoA thioesterase 2
AHR aryl hydrocarbon receptor
AIP AHR-interacting protein
AHRR AHR represssor
ARE antioxidant response elements
ARNT aryl hydrocarbon receptor nuclear translocator
ATP adenosine triphosphate
BaP benzo[a]pyrene
bHLH basic helix-loop-helix
BSA bovine serum albumin
CcO cytochrome c oxidase
CO2 carbon dioxide
COX-2 cyclooxygenase-2
COX4 cytochrome c oxidase subunit 4
CoQ1 coenzyme Q1
CPOX coproporphyrinogen-III oxidase
CYB5 cytochrome b5
CYP cytochrome P450-dependent monooxygenase
cAMP cyclic AMP
CCCP carbonyl cyanide m-chlorophenyl hydrazone
DCPIP 2,6-Dichlorophenol Indophenol
DMEM Dulbecco's modified Eagle’s Medium
DMSO dimethyl sulfoxide
xi
DRE dioxin-responsive element
DTNB 5,5'-dithiobis-(2-nitrobenzoic acid)
ε extinction coefficient
EDTA ethylenediaminetetraacetic acid
EGTA ethylene glycol tetraacetic acid
ENTPD2 ectonucleoside triphosphate diphosphohydrolase 2
ER endoplasmic reticulum
ETC electron transport chain
FAD flavin adenine dinucleotide
FCCP carbonyl cyanide-4-(trifluoromethoxy)phenylhydrazone
FDR false discovery rate
FICZ 6-formylindolo(3,2-b)carbazole
GABP nuclear respiratory factor 2
GST glutathione S-transferase
H6PD hexose-6-Phosphate Dehydrogenase
HAH halogenated aromatic hydrocarbon
HEPES 2-[4-(2-hydroxyethyl)piperazin-1-yl] ethanesulfonic acid
HSP90 heat shock protein of 90 kDa
HDAC histone deacetylase
HIF hypoxia-inducible factor
HRE hypoxia response element
HTP qPCR high-throughput quantitative real-time polymerase chain reaction
IL interleukin
IM inner-membrane
IMS inter-membrane space
KCl potassium chloride
xii
KCN potassium cyanide
KPO4 potassium phosphate
MAPK mitogen-activated protein kinase
MEF mouse embryonic fibroblast
MgCl2 magnesium chloride
MPTP mitochondrial permeability transition pore
MS mass spectrometry
MTS mitochondrial targeting signal
MRP mitochondrial ribosomal protein
NaCl sodium chloride
NAD nicotinamide adenine dinucleotide
NES nuclear export signal
NLS nuclear localization signal
NRF1 nuclear respiratory factor 1
NRF2 NF-E2 p45-related factor 2
NQO1 NAD(P)H:quinone oxidoreductase 1
OCR oxygen consumption rate
OM outer-membrane
OXPHOS oxidative phosphorylation
PAH polycyclic aromatic hydrocarbon
PAS Per-Arnt-Sim
PBS phosphate buffered saline
PCB polychlorinated biphenyl
PCB126 3,3’,4,4’,5-pentachlorobiphenyl
PDH pyruvate dehydrogenase complex
PDK pyruvate dehydrogenase kinase
xiii
PEPCK phosphoenolpyruvate carboxykinase
PGC-1α peroxisome proliferator-activated receptor-γ coactivator-1α
PHD prolyl hydroxylase domain-containing proteins
PMSF phenylmethanesulfonylfluoride
POLRMT bacteriophage-related mtRNA polymerase
PPAR peroxisome proliferator-activated receptor
QPCR quantitative real-time polymerase chain reaction
ROS reactive oxygen species
Scd1 stearoyl-CoA desaturase 1
SDS-PAGE sodium dodecyl sulfate-polyacrylamide gel electrophoresis
SILAC stable isotope labeling by amino acids in cell culture
SOD superoxide dismutase
SULT sulfotransferase
TAD transcriptional activation domain
TCA tricarboxylic acid
TCDD 2,3,7,8-tetrachlorodibenzo-ρ-dioxin
TIM translocase of the inner membrane
TiPARP TCDD-inducible poly (ADP-ribose) polymerase
TGF-β transforming growth factor-β
TNF-α tumor necrosis factor-α
TOM translocase of the outer membrane
UGT UDP-glucuronosyl transferase
VDAC voltage-dependent anion channel
WT wild-type
XAP2 hepatitis B viral X-protein interacting protein

1
!!
CHAPTER 1. LITERATURE REVIEW
2
PER-ARNT-SIM (PAS) DOMAIN PROTEINS
Adaptation to environmental changes is important to maintain homeostasis of a living
system. The Per-Arnt-Sim (PAS) domain family proteins are environmental sensors, which
regulate physiological adaptive responses against stimuli such as xenobiotics, hypoxia, and
light/dark cycles.1, 2 The PAS domain proteins use different mechanisms to sense these stimuli
and interact with partner proteins in order to regulate transcription. This transcriptional
regulation is primarily geared towards coping with changing environment. For instance, in
response to environmental toxicants, the aryl hydrocarbon receptor (AHR) regulates xenobiotic
metabolic enzymes. Hypoxia, a state of decrease in available oxygen, which contributes to a
development of physiological or pathological conditions such as angiogenesis, embryonic
development and tumors, induces the hypoxia-inducible factors (HIFs) signaling pathway. Also,
change in light cycling stimulates a circadian clock signal transduction, which is distributed
throughout a whole organism, via activation of transcription factors such as CLOCK and BMAL1
and their repressors PER and CRYs.
The name, PAS, comes from three proteins, the clock gene period (Per), aryl
hydrocarbon receptor nuclear translocator (Arnt), and single-minded (Sim). PAS domain
proteins share three distinguished structural domains, PAS domain, basic helix-loop-helix
(bHLH) domain, and transactivation domain (TAD). PAS domains consist of two subdomains,
PAS-A and PAS-B and their role is interacting between partner proteins. The protein:protein
interaction of PAS-A domain is homotypic while that of PAS-B is heterotypic. The bHLH resides
in the N-terminal to the PAS domain. The bHLH domain interacts with partner proteins as well
as a DNA target sequence. The N-terminal region of the PAS family proteins, containing bHLH
and PAS domains, has highly conserved sequences through evolution. In contrast, the C-
terminal region of the PAS proteins containing TAD has little sequence homology. As a
3
transcription factor, the PAS family protein recruits and binds transcription coactivators through
TAD.
The most well-studied PAS family protein signaling pathways in higher eukaryotes also
share common features in regulation mechanisms of those. Hypoxia and xenobiotic signaling
have cytoplasmic regulation in the absence of stimuli. The levels of the HIFα isoforms are
regulated by post-translational modification under normoxic state, and the AHR resides as a
complex with chaperones in cytoplasm without ligand activation. The CLOCK and BMAL1 are
translocated in nucleus constitutively, but nuclear translocation of their repressors is regulated
by cytoplasmic proteasomal degradation. On the other hand, the response mechanisms
mediated by these PAS family proteins are also required for developing organisms. Many
studies indicate that AHR signaling pathways trigger physiological processes involved in
proliferation, differentiation, inflammation, and endocrine disrupt. HIF signaling pathways also
contribute to angiogenesis, proliferation, development and metabolic switches. Finally,
circadian clock signaling pathways control not only sleeping time but also physiological rhythm
such as temperature control, blood pressure, heart rate, and metabolic control through a whole
body.
ARYL HYDROCARBON RECEPTOR
Many industrial processes produce different kinds of persistent organic pollutants that
accumulate in the environment.3, 4 These pollutants can be biologically amplified as they are
passed up the food chain. Among these, polycyclic aromatic hydrocarbons (PAHs) and
halogenated aromatic hydrocarbons (HAHs) are present in many different areas of the United
States and in many different kinds of animals. The hydrophobic nature of these makes them
stored in fat tissues and readily bioaccumulated. Mammals exposed to PAHs or HAHs show
pathological effects, such as endocrine disruption, aberrant neuronal development, hepatic
4
steatosis, immunosuppression, and tumor promotion. The environmental pollutant-induced
toxicity is primarily mediated by the AHR, one of the PAS domain family members. The AHR is
a ligand-activated transcription factor that mediates the toxic response to several prominent
environmental pollutants, including halogenated biphenols, benzopyrenes and dioxins, such as
2,3,7,8-tetrachlorodibenzo-ρ-dioxin (TCDD). About 40 years have passed since Dr. Poland
identified the AHR that has a high affinity of binding for TCDD.5 Since then, many researchers
have investigated properties of the AHR as a transcription factor. Previous studies provided
evidence that AHR-mediated gene induction requires TCDD-AHR:ARNT complexes in the
nucleus.6, 7 The ligand-activated nuclear AHR heterodimerizes with the ARNT and forms a
functional transcription factor. The AHR:ARNT heterodimer binds a specific nucleotide
sequence in regulatory regions of DNA and the core sequence is now called as dioxin-
responsive element (DRE) or xenobiotic-responsive element (XRE).8, 9 Additional interacting
partners of the AHR have also been identified, such as the heat shock protein of 90 kDa
(HSP90) and the immunophilin-like protein, AHR-interacting protein (AIP, also known as ARA,
or XAP2).10-12 Since these initial characterizations, researches have revealed biochemical
properties of the AHR, endogenous AHR-mediated physiological effects, as well as AHR-
mediated environmental toxicity, upon exposure to ligands, such as TCDD.1, 13
Domains of AHR
The domain structure of mouse AHR protein (mAHR) has been described in many
review articles (Figure 1-1).1, 14-16 The N-terminus contains a nuclear localization signal (NLS),
which has positively charged amino acids, and a basic helix-loop-helix (bHLH), which has two
amphipathic α-helices with conserved amino acids.2, 14 The bHLH domain is the site for DNA
binding, ARNT dimerization, and HSP90 binding.14 Helix2 of the bHLH domain also has the
leucine-rich nuclear export signal (NES) similar to other proteins.17 The PAS domain is in the
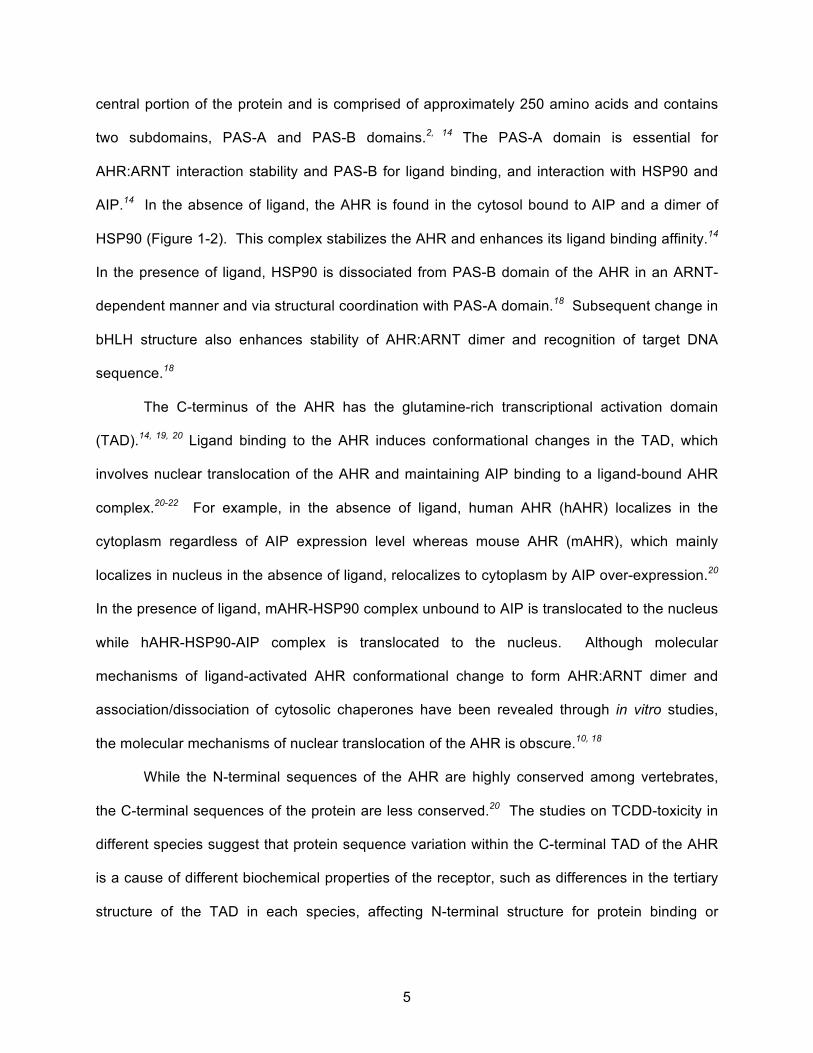
5
central portion of the protein and is comprised of approximately 250 amino acids and contains
two subdomains, PAS-A and PAS-B domains.2, 14 The PAS-A domain is essential for
AHR:ARNT interaction stability and PAS-B for ligand binding, and interaction with HSP90 and
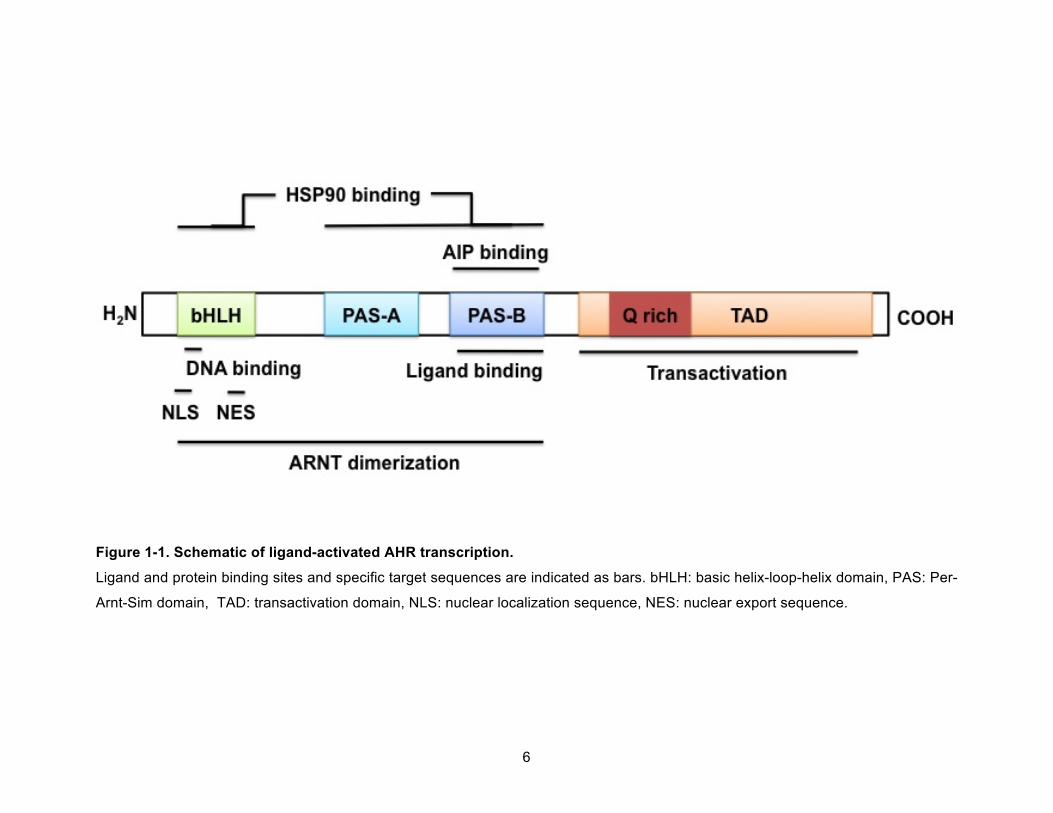
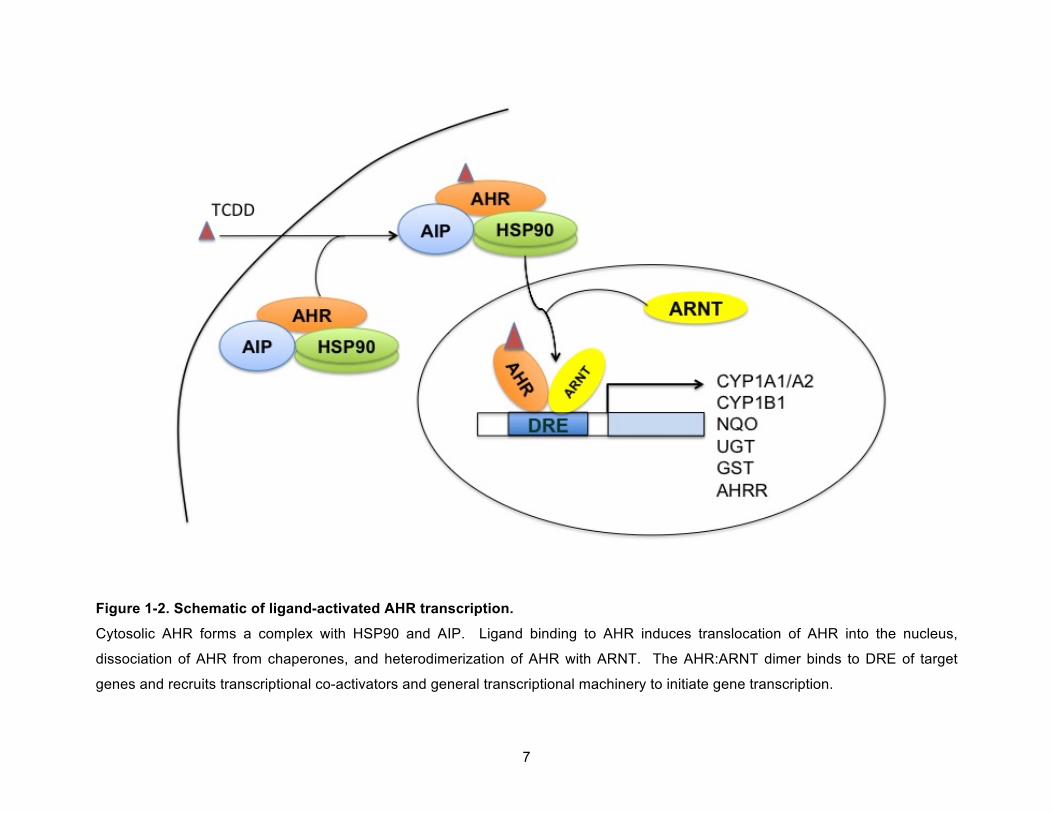
AIP.14 In the absence of ligand, the AHR is found in the cytosol bound to AIP and a dimer of
HSP90 (Figure 1-2). This complex stabilizes the AHR and enhances its ligand binding affinity.14
In the presence of ligand, HSP90 is dissociated from PAS-B domain of the AHR in an ARNT-
dependent manner and via structural coordination with PAS-A domain.18 Subsequent change in
bHLH structure also enhances stability of AHR:ARNT dimer and recognition of target DNA
sequence.18
The C-terminus of the AHR has the glutamine-rich transcriptional activation domain
(TAD).14, 19, 20 Ligand binding to the AHR induces conformational changes in the TAD, which
involves nuclear translocation of the AHR and maintaining AIP binding to a ligand-bound AHR
complex.20-22 For example, in the absence of ligand, human AHR (hAHR) localizes in the
cytoplasm regardless of AIP expression level whereas mouse AHR (mAHR), which mainly
localizes in nucleus in the absence of ligand, relocalizes to cytoplasm by AIP over-expression.20
In the presence of ligand, mAHR-HSP90 complex unbound to AIP is translocated to the nucleus
while hAHR-HSP90-AIP complex is translocated to the nucleus. Although molecular
mechanisms of ligand-activated AHR conformational change to form AHR:ARNT dimer and
association/dissociation of cytosolic chaperones have been revealed through in vitro studies,
the molecular mechanisms of nuclear translocation of the AHR is obscure.10, 18
While the N-terminal sequences of the AHR are highly conserved among vertebrates,
the C-terminal sequences of the protein are less conserved.20 The studies on TCDD-toxicity in
different species suggest that protein sequence variation within the C-terminal TAD of the AHR
is a cause of different biochemical properties of the receptor, such as differences in the tertiary
structure of the TAD in each species, affecting N-terminal structure for protein binding or
6
Figure 1-1. Schematic of ligand-activated AHR transcription.
Ligand and protein binding sites and specific target sequences are indicated as bars. bHLH: basic helix-loop-helix domain, PAS: Per-
Arnt-Sim domain, TAD: transactivation domain, NLS: nuclear localization sequence, NES: nuclear export sequence.
7
Figure 1-2. Schematic of ligand-activated AHR transcription.
Cytosolic AHR forms a complex with HSP90 and AIP. Ligand binding to AHR induces translocation of AHR into the nucleus,
dissociation of AHR from chaperones, and heterodimerization of AHR with ARNT. The AHR:ARNT dimer binds to DRE of target
genes and recruits transcriptional co-activators and general transcriptional machinery to initiate gene transcription.
8
NLS/NES exposure by ligand activation.20, 23 Thus, diverse sequences of the TAD can be
reflected in different sensitivity to TCDD-induced toxicity.23
Transactivation of AHR
Activation of the AHR depends on ligand-structure, tissue/cell specific contexts, and
tissue/cell specific expression of nuclear cofactors.24 The interaction of the ligand-bound
AHR:ARNT dimer with a DRE, having a core sequence of 5’-T/GNGCGTG-3’, accompanies
chromatin remodeling complex, SWI/SNF, histone modifiers such as SRC-1, CARM-1, BRG-1,
and HAT, and transcriptional coactivators, NCOA1-3 and p300/CBP, to target gene
promoters.13, 14, 25, 26 AHR:ARNT dimers also interact with general transcription factors, TATA-
binding protein, TFIIB and TFIIF, which are required for RNA polymerase II reaction.19, 25
Comparison study with several AHR ligands suggests that structurally diverse chemicals
are selective AHR modulators, inducing different surface topology of ligand-activated AHR
complex.27, 28 This selective receptor modulation may result in recruitments of different types of
coactivators or repressors to DREs in a gene-, cell-, tissue-specific manner.27 Also, different
AHR structures between species can cause differential TCDD toxicity.29 Analysis of multiple
sequence alignment of AHRs in mammals reveals that ligand binding domain and TAD domain
impact AHR function.29, 30 For example, amino acid substitutions in the ligand binding domain of
the AHR decreased the TCDD sensitivity in the DBA/2 mouse strain compared to C57BL/6 via
steric effect.4 As mentioned in the previous section, the low conservation in glutamine-rich
portion of TAD of the AHR also impacts the median lethal doses of TCDD, leading to a
decrease in sensitivity in the Han/Wistar (Kuopio) rat strain, which has alternative splicing in the
TAD domain.4, 29
9
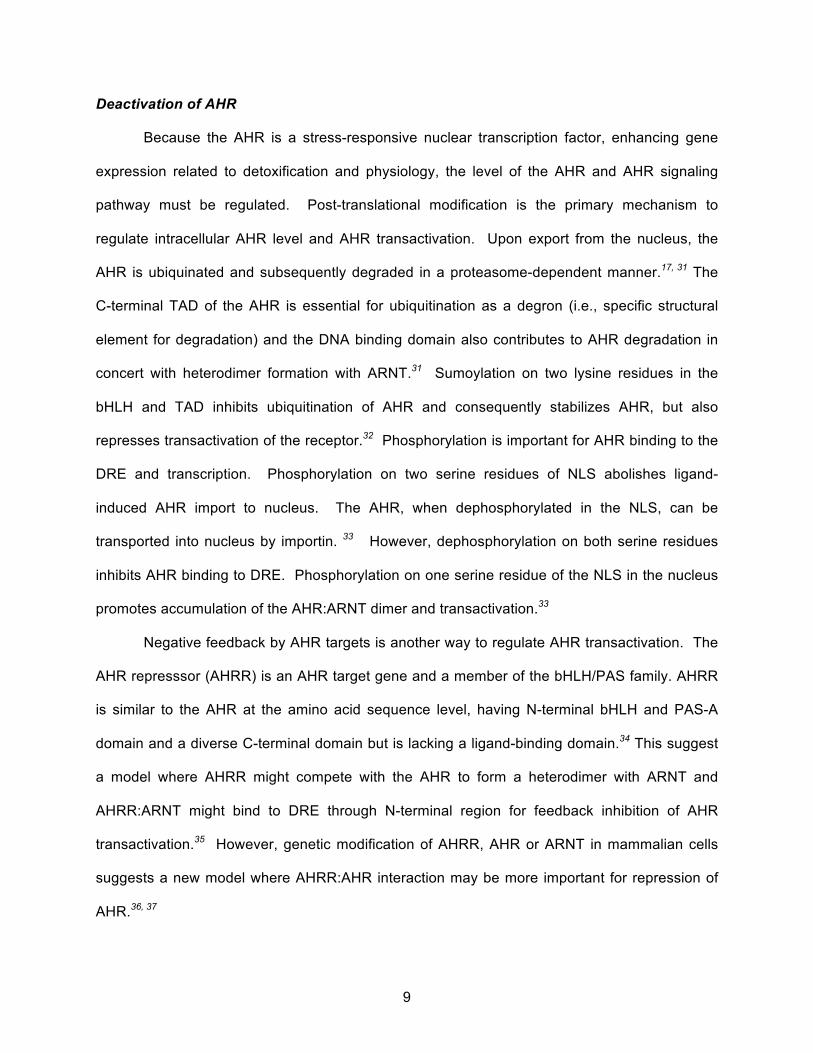
Deactivation of AHR
Because the AHR is a stress-responsive nuclear transcription factor, enhancing gene
expression related to detoxification and physiology, the level of the AHR and AHR signaling
pathway must be regulated. Post-translational modification is the primary mechanism to
regulate intracellular AHR level and AHR transactivation. Upon export from the nucleus, the
AHR is ubiquinated and subsequently degraded in a proteasome-dependent manner.17, 31 The
C-terminal TAD of the AHR is essential for ubiquitination as a degron (i.e., specific structural
element for degradation) and the DNA binding domain also contributes to AHR degradation in
concert with heterodimer formation with ARNT.31 Sumoylation on two lysine residues in the
bHLH and TAD inhibits ubiquitination of AHR and consequently stabilizes AHR, but also
represses transactivation of the receptor.32 Phosphorylation is important for AHR binding to the
DRE and transcription. Phosphorylation on two serine residues of NLS abolishes ligand-
induced AHR import to nucleus. The AHR, when dephosphorylated in the NLS, can be
transported into nucleus by importin. 33 However, dephosphorylation on both serine residues
inhibits AHR binding to DRE. Phosphorylation on one serine residue of the NLS in the nucleus
promotes accumulation of the AHR:ARNT dimer and transactivation.33
Negative feedback by AHR targets is another way to regulate AHR transactivation. The
AHR represssor (AHRR) is an AHR target gene and a member of the bHLH/PAS family. AHRR
is similar to the AHR at the amino acid sequence level, having N-terminal bHLH and PAS-A
domain and a diverse C-terminal domain but is lacking a ligand-binding domain.34 This suggest
a model where AHRR might compete with the AHR to form a heterodimer with ARNT and
AHRR:ARNT might bind to DRE through N-terminal region for feedback inhibition of AHR
transactivation.35 However, genetic modification of AHRR, AHR or ARNT in mammalian cells
suggests a new model where AHRR:AHR interaction may be more important for repression of
AHR.36, 37
10
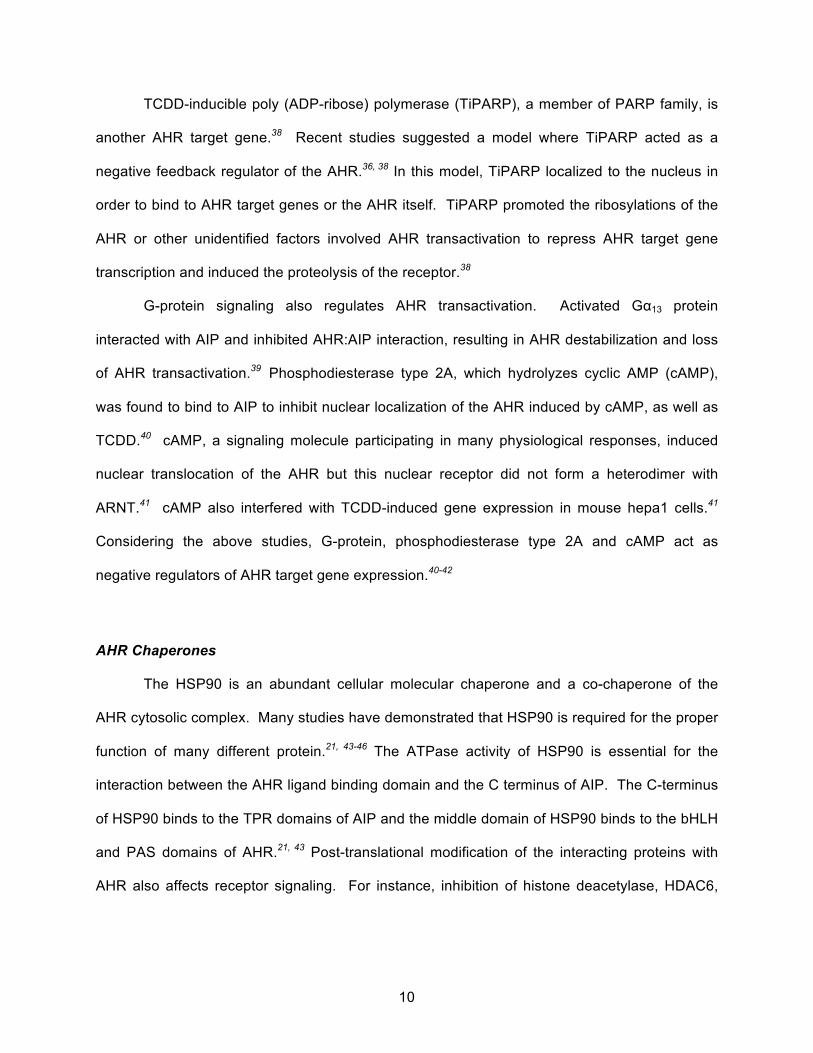
TCDD-inducible poly (ADP-ribose) polymerase (TiPARP), a member of PARP family, is
another AHR target gene.38 Recent studies suggested a model where TiPARP acted as a
negative feedback regulator of the AHR.36, 38 In this model, TiPARP localized to the nucleus in
order to bind to AHR target genes or the AHR itself. TiPARP promoted the ribosylations of the
AHR or other unidentified factors involved AHR transactivation to repress AHR target gene
transcription and induced the proteolysis of the receptor.38
G-protein signaling also regulates AHR transactivation. Activated Gα13 protein
interacted with AIP and inhibited AHR:AIP interaction, resulting in AHR destabilization and loss
of AHR transactivation.39 Phosphodiesterase type 2A, which hydrolyzes cyclic AMP (cAMP),
was found to bind to AIP to inhibit nuclear localization of the AHR induced by cAMP, as well as
TCDD.40 cAMP, a signaling molecule participating in many physiological responses, induced
nuclear translocation of the AHR but this nuclear receptor did not form a heterodimer with
ARNT.41 cAMP also interfered with TCDD-induced gene expression in mouse hepa1 cells.41
Considering the above studies, G-protein, phosphodiesterase type 2A and cAMP act as
negative regulators of AHR target gene expression.40-42
AHR Chaperones
The HSP90 is an abundant cellular molecular chaperone and a co-chaperone of the
AHR cytosolic complex. Many studies have demonstrated that HSP90 is required for the proper
function of many different protein.21, 43-46 The ATPase activity of HSP90 is essential for the
interaction between the AHR ligand binding domain and the C terminus of AIP. The C-terminus
of HSP90 binds to the TPR domains of AIP and the middle domain of HSP90 binds to the bHLH
and PAS domains of AHR.21, 43 Post-translational modification of the interacting proteins with
AHR also affects receptor signaling. For instance, inhibition of histone deacetylase, HDAC6,
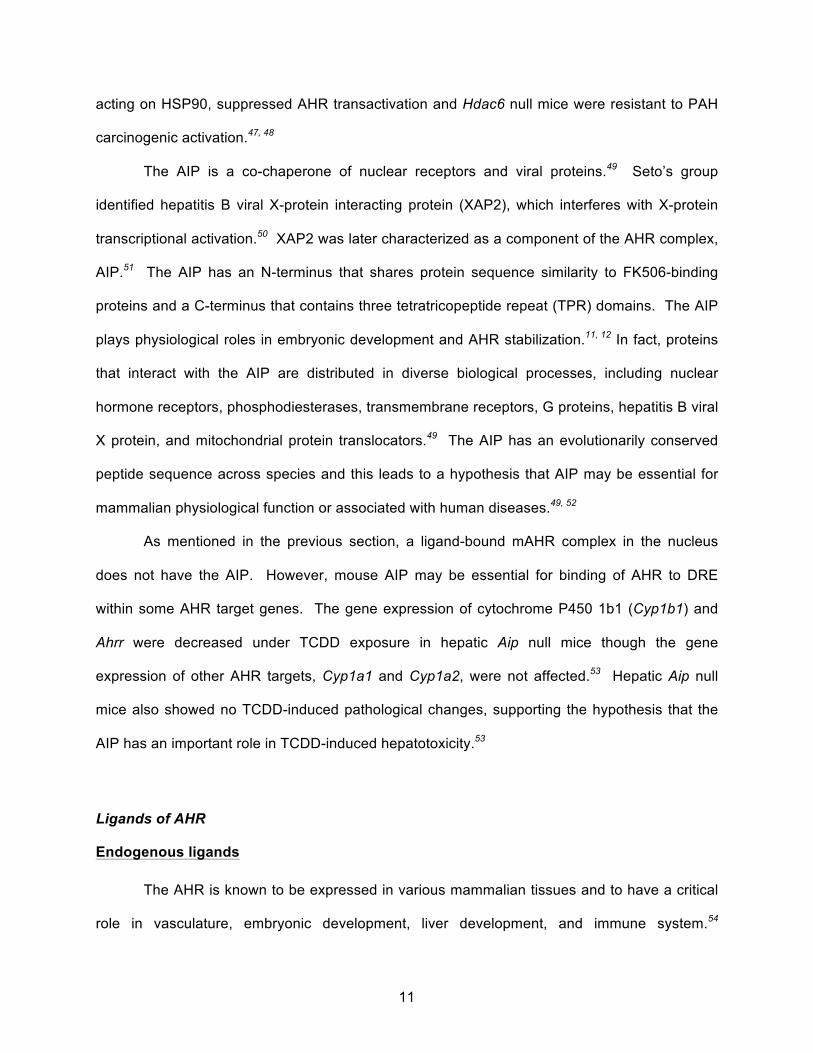
11
acting on HSP90, suppressed AHR transactivation and Hdac6 null mice were resistant to PAH
carcinogenic activation.47, 48
The AIP is a co-chaperone of nuclear receptors and viral proteins.49 Seto’s group
identified hepatitis B viral X-protein interacting protein (XAP2), which interferes with X-protein
transcriptional activation.50 XAP2 was later characterized as a component of the AHR complex,
AIP.51 The AIP has an N-terminus that shares protein sequence similarity to FK506-binding
proteins and a C-terminus that contains three tetratricopeptide repeat (TPR) domains. The AIP
plays physiological roles in embryonic development and AHR stabilization.11, 12 In fact, proteins
that interact with the AIP are distributed in diverse biological processes, including nuclear
hormone receptors, phosphodiesterases, transmembrane receptors, G proteins, hepatitis B viral
X protein, and mitochondrial protein translocators.49 The AIP has an evolutionarily conserved
peptide sequence across species and this leads to a hypothesis that AIP may be essential for
mammalian physiological function or associated with human diseases.49, 52
As mentioned in the previous section, a ligand-bound mAHR complex in the nucleus
does not have the AIP. However, mouse AIP may be essential for binding of AHR to DRE
within some AHR target genes. The gene expression of cytochrome P450 1b1 (Cyp1b1) and
Ahrr were decreased under TCDD exposure in hepatic Aip null mice though the gene
expression of other AHR targets, Cyp1a1 and Cyp1a2, were not affected.53 Hepatic Aip null
mice also showed no TCDD-induced pathological changes, supporting the hypothesis that the
AIP has an important role in TCDD-induced hepatotoxicity.53
Ligands of AHR
Endogenous ligands
The AHR is known to be expressed in various mammalian tissues and to have a critical
role in vasculature, embryonic development, liver development, and immune system.54
12
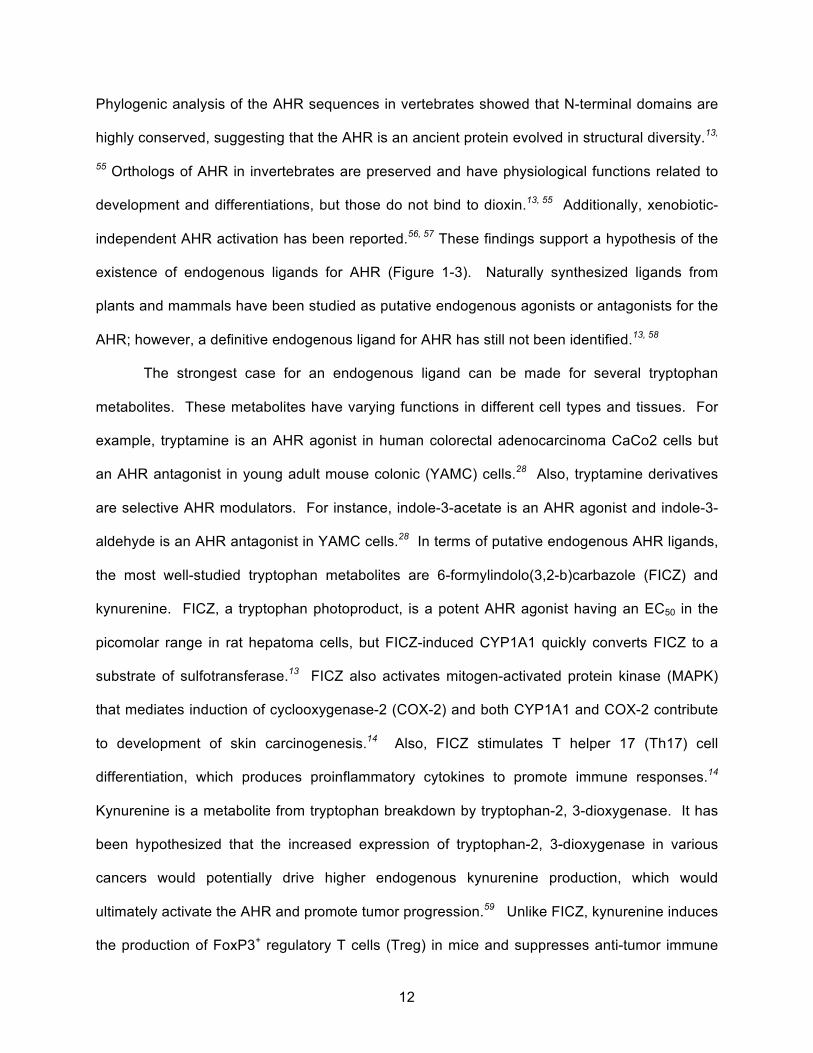
Phylogenic analysis of the AHR sequences in vertebrates showed that N-terminal domains are
highly conserved, suggesting that the AHR is an ancient protein evolved in structural diversity.13,
55 Orthologs of AHR in invertebrates are preserved and have physiological functions related to
development and differentiations, but those do not bind to dioxin.13, 55 Additionally, xenobiotic-
independent AHR activation has been reported.56, 57 These findings support a hypothesis of the
existence of endogenous ligands for AHR (Figure 1-3). Naturally synthesized ligands from
plants and mammals have been studied as putative endogenous agonists or antagonists for the
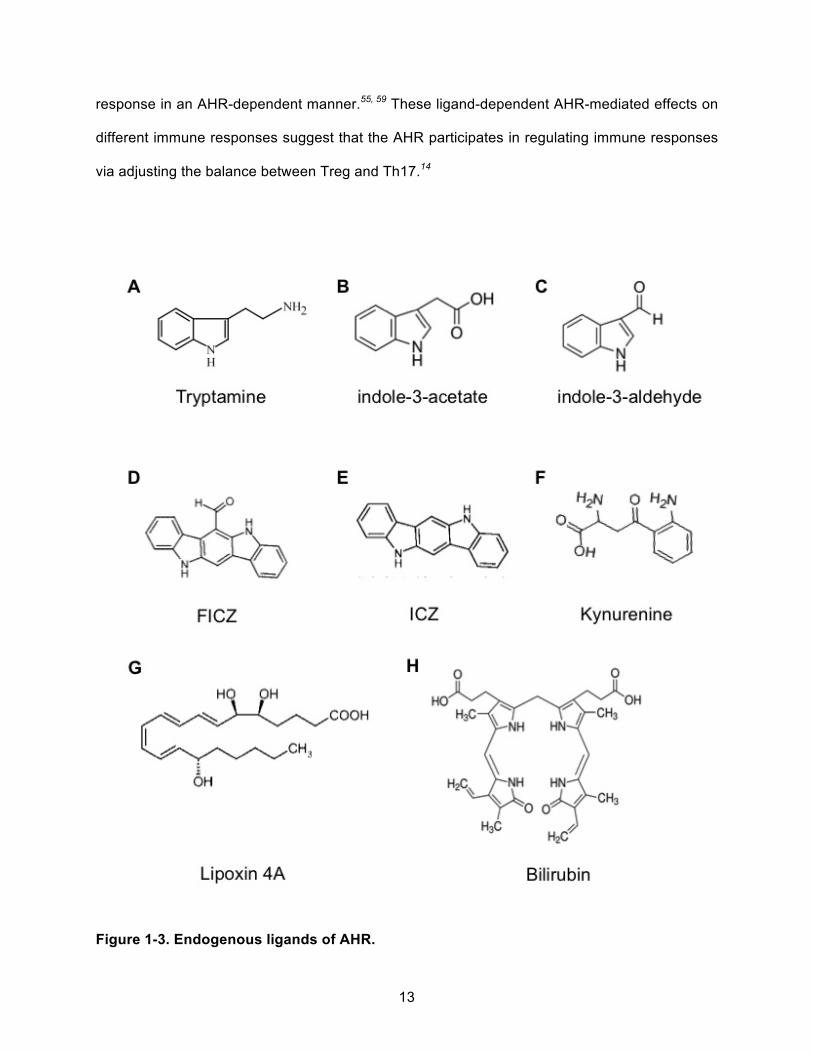
AHR; however, a definitive endogenous ligand for AHR has still not been identified.13, 58
The strongest case for an endogenous ligand can be made for several tryptophan
metabolites. These metabolites have varying functions in different cell types and tissues. For
example, tryptamine is an AHR agonist in human colorectal adenocarcinoma CaCo2 cells but
an AHR antagonist in young adult mouse colonic (YAMC) cells.28 Also, tryptamine derivatives
are selective AHR modulators. For instance, indole-3-acetate is an AHR agonist and indole-3-
aldehyde is an AHR antagonist in YAMC cells.28 In terms of putative endogenous AHR ligands,
the most well-studied tryptophan metabolites are 6-formylindolo(3,2-b)carbazole (FICZ) and
kynurenine. FICZ, a tryptophan photoproduct, is a potent AHR agonist having an EC50 in the
picomolar range in rat hepatoma cells, but FICZ-induced CYP1A1 quickly converts FICZ to a
substrate of sulfotransferase.13 FICZ also activates mitogen-activated protein kinase (MAPK)
that mediates induction of cyclooxygenase-2 (COX-2) and both CYP1A1 and COX-2 contribute
to development of skin carcinogenesis.14 Also, FICZ stimulates T helper 17 (Th17) cell
differentiation, which produces proinflammatory cytokines to promote immune responses.14
Kynurenine is a metabolite from tryptophan breakdown by tryptophan-2, 3-dioxygenase. It has
been hypothesized that the increased expression of tryptophan-2, 3-dioxygenase in various
cancers would potentially drive higher endogenous kynurenine production, which would
ultimately activate the AHR and promote tumor progression.59 Unlike FICZ, kynurenine induces
the production of FoxP3+ regulatory T cells (Treg) in mice and suppresses anti-tumor immune
13
response in an AHR-dependent manner.55, 59 These ligand-dependent AHR-mediated effects on
different immune responses suggest that the AHR participates in regulating immune responses
via adjusting the balance between Treg and Th17.14
Figure 1-3. Endogenous ligands of AHR.
14
Arachidonic acid is a polyunsaturated fatty acid that is abundant in liver, brain, and
muscle. Prostaglandin B2, D2, F3a, G2, H1 and H2, and lipoxin 4A, metabolites of arachidonic
acid, activate AHR and induce CYP1A enzymatic activity and inflammatory signals in a mouse
hepatoma cell line.13, 60 Lipoxin 4A has an EC50 in the nanomolar range. In contrast,
prostaglandins are weak ligands of AHR, having EC50 in the micromolar range.13 In addition,
liver and lungs from C57BL/6 mice treated with TCDD had higher levels of epoxides of
arachidonic acid, linolenic acid, eicosapentaenoic acid, and docasahexaenoic acid for anti-
inflammatory response.60, 61 Considering the above studies, therefore, arachidonic acid
metabolism may be potentially linked to AHR signaling.13
Bilirubin, a breakdown product from the oxidation of heme, has also been suggested as
a possible endogenous ligand of AHR.62 The AHR has been shown to be involved in bilirubin-
induced apoptosis. Given that apoptosis is a mitochondrial-dependent pathway, the
involvement of the AHR in intrinsic (mitochondrial) apoptotic pathway may not be related to AHR
transcriptional activity.62-64 Biliverdin, a precursor of bilirubin and product of heme oxygenase,
has also been suggested to be an AHR agonist, competing with TCDD in vivo and in vitro.13
A recent study suggested a new role of the AHR as a pattern recognition receptor that
recognizes bacterial pigmented virulence factors.65 This new type of AHR ligand, which is a
structural analogue of the polycyclic aromatic hydrocarbon, activated the gene expression of
AHR target genes and proinflammatory cytokine and chemokine genes.65 Thus, another role of
the AHR was explored, as a regulator of antibacterial defense.
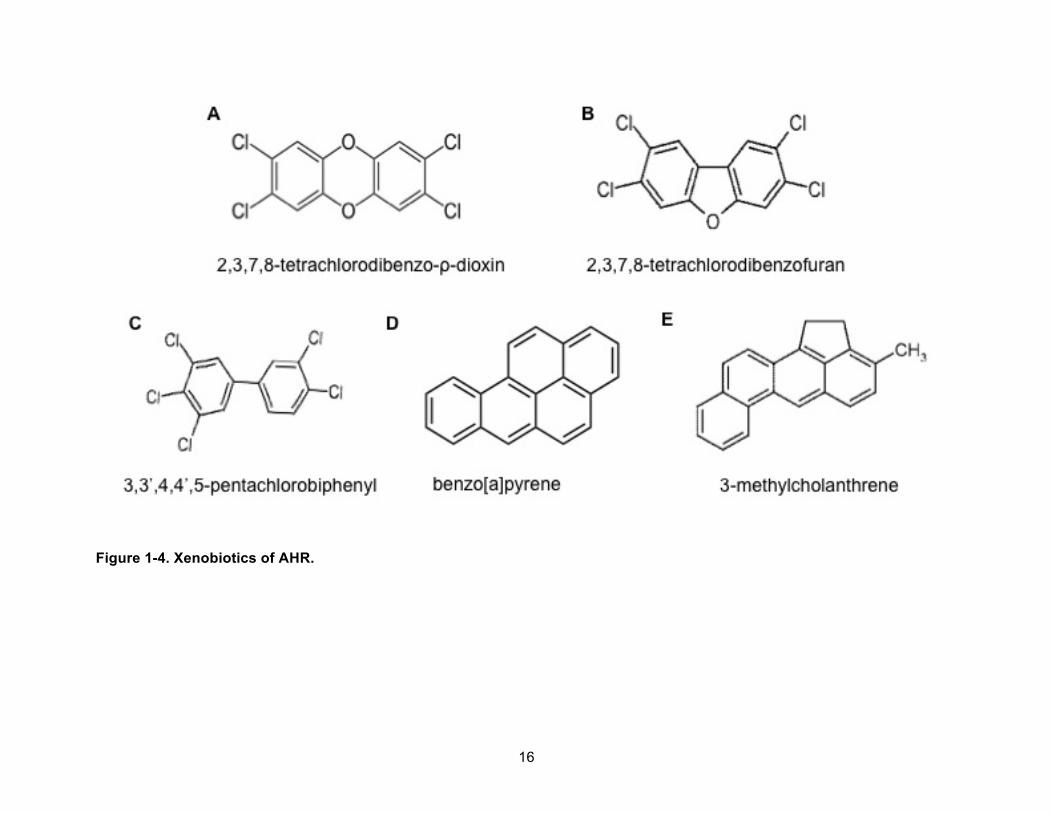
Xenobiotics
Known xenobiotic ligands of the AHR are divided into two structural groups, PAHs and
HAHs (Figure 1-4).13 PAHs are released from many different processes including the burning of
coal, charbroiling food and smoking of cigarettes. The most studied PAHs, in terms of AHR
15
biology, are benzo[a]pyrene (BaP) and 3-methylcholanthrene.13 BaP induces AHR signaling
and is metabolized by Phase I and Phase II xenobiotic metabolizing enzymes.26 Metabolized
product epoxides are highly reactive with DNA and proteins.26 BaP and 3-methylcholanthrene
can also activate MAPK signaling, and this implies that AHR signaling may participate in
crosstalk with many molecular pathways for physiological functions.15
HAHs include halogenated dibenzo-ρ-dioxin, dibenzofurans, polychlorinated biphenyls
and naphthalenes. HAHs, like PAHs, are produced as byproducts of many industrial processes
and are products of hydrocarbon incineration.14 To be potent AHR agonists, these HAHs, must
be planar in structure. HAHs with no halogen substitutions in the ortho-positions to the C-C
bridge of inter-ring are potent compounds. Among HAHs, TCDD is the most potent AHR
agonist. TCDD is a by-product of fungicides and herbicides synthesis, incineration, electronic
recycling, and paper bleaching. TCDD is stable, poorly metabolized, and bioaccumulative.
TCDD responses vary among tissue types, strains, and species.3 Across species, AHR-
mediated, TCDD-induced toxicity has a broad range of sensitivities and responses, including
differences in median lethal dose (LD50), gene expression and metabolite profiles, related to
multiple signaling pathways. These pathways include immune response pathways, sexual
hormone regulation, cell cycle regulation, developmental signaling, mitochondrial functions, as
well as xenobiotic metabolism.66-69 Researchers have tried to understand TCDD-induced
toxicity by studying transcriptomes, proteomics, metabolomes and pathological responses using
TCDD-sensitive and TCDD- resistant animal models, such as C57BL/6J mouse (sensitive) vs.
DBA/2J mouse (resistant), L-E rat (sensitive) vs. H/W rats (resistant) or mutant cell lines, such
as hepa-1 cells vs. mutant hepa-1 derivatives.66, 69-72
Polychlorinated biphenyls (PCBs) are stable components of many commercial products
such as polymeric implants, flame retardants, insulators, and adhesives.13 The most potent
PCB, in terms of AHR activation, is 3,3’,4,4’,5-pentachlorobiphenyl (PCB 126). Treatment of
PCB126 to C57BL/6 mouse and mouse hepatoma cell line showed similar toxicity of TCDD.13, 27
16
Figure 1-4. Xenobiotics of AHR.
17
For example, PCB126-mediated AHR activation caused suppressed phosphoenolpyruvate
carboxykinase (PEPCK) induction and gluconeogenesis in mouse primary hepatocytes.73
Female rats exposed to PCB126 via polymeric implants accumulated PCB126 in liver and
mammary tissues resulting in induction of CYP1A enzymes, antioxidant enzyme transcripts and
DNA adducts.74
AHR Target Genes
PAH or HAH exposure induces a wide battery of detoxification genes involved in
xenobiotic metabolism, such as cytochrome P450-dependent monooxygenases (CYPs), UDP-
glucuronosyl transferase (UGTs), and glutathione S-transferase (GSTs).13, 75 These drug
detoxification genes encode proteins that can be categorized as either Phase I or Phase II
enzymes.14, 26 13 genes (Ahrr, Aldh3a1, Cyp1a1, Cyp1a2, Cyp1b1, Cyp2a1, Cyp2s1, Fmo1,
Inmt, Nfe2l2, Nqo1, Tiparp and Ugt1a1) have been explored as AHR-regulated genes for their
potential role in causing AHR-mediated toxicity in many studies with TCDD sensitive and
resistant rats.66 Analysis of time- and dose-dependent gene expression identified that 7 of
these genes (Aldh3a1, Cyp1a2, Cyp1b1, Cyp2a1, Fmo1, Nfe2l2 and Nqo1) have inter-strain
differences in expression and several of the genes (Ahrr, Aldh3a1, Cyp1b1, Nfe2l2 and Nqo1)
have biphasic responses. Among these genes, Cyp1a1, Cyp1a2 and Cyp1b1 are representative
genes that have very low basal expression in rodent liver and are highly induced upon TCDD
exposure in time-dependent manner.66
Phase I enzymes, such as CYPs, are expressed at the early stage of dioxin-toxicity.
CYPs include, CYP1A1, CYP1A2, and CYP1B1, and each of these contain functional DREs in
their enhancer region. CYP1A1 is the best-studied AHR target gene. The human CYP1A1 and
CYP1A2 genes are on the chromosome 15 and their transcription start sites are separated from
each other by 20 kb. This intergenic region has multiple DREs and acts bidirectionally for both
18
genes.26 CYP1A1 is located in the endoplasmic reticulum (ER) and mitochondrial inner
membrane and the amount of CYP1A1 in each organelle depends on species, tissues, age, and
type of inducer.76, 77 Using knock-in gene techniques, it has been shown that only CYP1A1 in
the ER participated in detoxification of BaP and the absence of CYP1A1 localized in the ER
induced the upregulation of the expression of both CYP1A2 and CYP1B1 to compensate for the
loss of CYP enzymatic activity in ER.77 However, the role of mitochondrial CYP1A1 induced by
BaP is still not clear. CYP1B1, another AHR-regulated CYP1 enzyme, is highly expressed in
hormone-mediated cancers.78 PAHs challenged mice developed tumors slowly in Cyp1b1
knockout mice compared to wild-type (WT) mice.79 However, CYP1B1 induction is expressed
approximately 100 fold less than Cyp1A1 in the liver. In contrast, CYP1B1 is highly expressed
in the lung and uterus, approximately 30 ~ 70 times more than that in liver.80 PAH exposure to
mammalian cells caused CYP1B1 targeting to both ER and mitochondria and lung mitochondrial
CYP1B1 was more relative to PAH-mediated mitochondrial dysfunction than the microsomal
enzyme.78
NAD(P)H:quinone oxidoreductase 1 (NQO1), UGTs, such as UGT1A1 and UGT1A6,
aldehyde dehydrogenase (ALDH3A1), glutathione S-transferases (GSTs) and sulfotransferases
(SULTs) belong to the Phase II class of enzymes. NQO1 is a flavoprotein that detoxifies
quinones to quinols without generating reactive semiquinones.26 Recent studies have shown
that NQO1 is possibly localized in the mitochondria and ER, as well as the cytosol.80 Quinols
are conjugated by UGTs or SULTs and excreted via transporters such as multidrug resistance-
associated proteins and breast cancer resistance protein.26 The Human UGT1 gene encodes 9
UGT1 enzyme members, all of which are induced by AHR agonists. Among these, UGT1A1
and 1A6 are the most well-studied.14, 26 UGT1A1 is mainly expressed in the liver and intestine.
Functional DREs have also been identified in the human UGT1A1 gene, but not in murine gene.
UGT1A1 catalyzes glucuronidation of bilirubin and β-estradiol. UGT1A6 conjugates a variety of
planar phenols such as the neurotransmitter serotonin, 1-naphthol, acetaminophen and PAHs.26
19
ALDH3A1 oxidizes aldehydes, end products of lipid peroxidation, to ketones and carboxylic
acids for detoxification. ALDH3A1 can block oxidative stress and affect the cell cycle.81
Dysregulation of ALDH3A1, therefore, is associated with tumorigenesis.66 The action of GST is
coupled with glutathione synthesis. There are both cytosolic and mitochondrial GSTs. GSTs
are multifunctional enzymes detoxifying many epoxide carcinogens.26
Phase II enzymes have antioxidant response elements (AREs), as well as DREs in their
enhancer region.14, 26 NF-E2 p45-related factor 2 (NRF2) is a basic leucine zipper domain (bZIP)
nuclear transcription factor and main regulator of antioxidant defense. NRF2 binds to AREs as
a complex with small MAFs.82 This nuclear transcription factor is necessary for the expression
of AHR-regulated drug metabolizing enzymes such as NQO1, UGTs, and GSTs.14, 26, 82 AHR
and NRF2 display crosstalk in multiple levels. Identification of DRE-like sequence upstream of
Nrf2 and AHR binding upstream of Nrf2 in mouse liver cells suggests that TCDD-induced AHR
activation increases Nrf2 expression and consequently induces NRF2-target and Phase II
enzymes.82 NRF2 is considered to be a tightly regulated gene, being activated only in the
presence of reactive oxygen species (ROS).26, 82 The human NQO1 gene contains a functional
ARE but not a DRE-like element and the human GSTA2 gene has no functional ARE or DRE.
These results suggest that TCDD-induced CYP1 enzymes generate ROS, which directly or
indirectly activates NRF2 target gene expression.26 However, a recent study showed that the
AHR- and NRF2-dependent expression of Nqo1 could occur in the absence of oxidative stress
in mouse hepatoma 1c1c7 cells.83 The same study also suggested that TCDD-induced nuclear
AHR physically interacted with NRF2 and KEAP1, a regulator of NRF2 degradation, with a
sequentially delayed binding kinetics for target gene elements.83 This suggested a crosstalk
between AHR and NRF2 signaling via a direct formation of multi-protein complex.83
The role of NRF2 in TCDD-induced hapatic toxicity was revealed in the study using Nrf2
knockout mice.84 TCDD-exposed Nrf2 null mice showed alterations in the expression of genes
that encode proteins involved in inflammation, fibrogenesis, proliferation/apoptosis, lipid
20
metabolism, oxidative stress and DNA repair. TCDD-induced impaired adipogenesis was
shown in Nrf2 null mice and this was most likely caused by the downregulation of peroxisome
proliferator-activated receptor (PPAR)-γ. Thus, NRF2 has a protective role against TCDD-
induced oxidative stress, DNA damage and impaired adipogenesis causing hepatic steatosis. 84
Physiological Roles of AHR
Physiological stimuli can activate AHR in the absence of ligand. For example, cell
density can regulate intracellular AHR localization and transactivation in human keratinocytes
through post-translational modification in the form of phosphorylation on serine within the NES
by p38-MAPK.57 Sparse cell density resulting in loss of cell-to-cell contact induced nuclear AHR
accumulation and transcription of AHR target genes. Human or rat blood vessel endothelial
cells exposed to high glucose-containing media, caused AHR activation. Activated AHR did not
bind to DREs but formed a complex with several other transcription factors at the
thrombospondin-1 gene promoter.85 Moreover, activation of AHR exposed to carotenoids and
benzimidazole derivatives induced CYP1A1 as well as heavy metals did in human and mouse
hepatocytes.4 However, these compounds did not act as AHR ligands in terms of AHR:ARNT
dimer formation.
AHR can also participate in crosstalk with other signaling pathways that might also play
an important role in AHR-mediated physiological processes. These physiological effects include
proliferation, endocrine disruption, differentiation, inflammation, apoptosis and proteolysis.14
First, AHR can promote or inhibit cellular proliferation depending on types of cells and species.
NF-κB is a pleiotropic transcription factor, consisting of a p65/RelA and a p50/NF-κB-1. In
human breast cancer MCF7 cells, AHR interacted with p65/RelA, resulting in the transactivation
of c-myc, a proto-oncogene.56 Human lung A549 also increased proliferation rate via
overexpression of AHR.
21
The AHR can also influence steroid signaling pathways within a cell at multiple levels.
For example, the ligand-activated AHR:ARNT dimer associates with estrogen receptor-α and –β,
binds to estrogen responsive elements and recruits co-activator p300 to induce estrogen
receptor target genes without a ligand of the estrogen receptor.86 Induction of cathepsin D, a
protease and breast cancer marker, by 17β-estradiol could be inhibited by TCDD-induced AHR
activation in mammary tumor cells.14 Estron could be metabolized to estradiol by 17β-
hydroxysteroid dehydrogenase.87 Estradiol was further metabolized to genotoxic 4-hydroxylated
estrogen by ICZ-activated AHR-induced CYP1B1, and 4-hydroxylated catecholestrogen induced
estrogen-mediated carcinogensis by being oxidized.87, 88 Inversely, human CYP1B1 gene was
an estrogen receptor-α target gene expressed differently depending on a phase of menstrual
cycle in endometrial glandular epithelial cells.89 Finally, the ligand-activated AHR mediated
ubiquitin-mediated degradation of the estrogen receptor-α (see below).90 Thus, AHR signaling
affects estrogen signaling by sharing its target gene and vice versa.
Next, hierarchical clustering of gene expression profiles in human hematopoietic cells
suggests a possible role of AHR in differentiation of blood cells.91 This suggested role of the
AHR was demonstrated using a potent endogenous AHR ligand, FICZ. FICZ-induced AHR
activation induced pluripotent stem cells to become hematopoietic progenitor cells and also
contributed to further differentiation into erythroid-lineage cells. In contrast, the inhibition of the
AHR by AHRR at the differentiation stage to erythroid-lineage cells stimulated megakaryocyte
specification.91 The expression of AHR and CYP1A1 increased in human keratinocyte under
differentiation-promoting culture condition to induce gene expression involving in skin
differentiation.92 TCDD exposure in utero stimulated the formation of the fetal epidermal barrier.
This suggests that endogenous ligands of the AHR may activate AHR signaling to support skin
barrier formation.
In mouse adipocytes, somewhat differently, TCDD blocks adipocyte differentiation via
inflammatory response.93 TCDD induced the expression of COX-2 via induction of NF-κB, and
22
the subsequent increase in interleukin (IL)-8 and tumor necrosis factor-α (TNF-α) secretion.
This ultimately led to the reduction of lipid storage and lipoprotein lipase. In human primary
hepatocytes, TNF-α and IL-1β induced NF-κB and suppressed CYP1A1 and 1A2. Similar
results were observed in UVB-sensitive NF-κB in human hepatoma cells.14 In mouse hepatoma
1c1c7 cells, TNF-α-induced NF-κB and ligand-activated AHR reciprocally suppressed each
other’s transcriptional activity through protein:protein interaction.94 Ligand-activated AHR may
enhance apoptotic stimuli, contributing to TCDD-induced immune suppression by NF-κB
repression.94 AHR-knockout mice also showed slow growth, a decrease in liver weight,
abnormal vascular development in the liver and eyes, abnormal development and function in the
prostate and ovaries, and reduced differentiation and immaturity in blood cells compared to
WT.4, 95 Finally, transforming growth factor-β (TGF-β) was expressed in the liver of AHR-
knockout mice, which would contribute to fibrosis and lower proliferation.4, 56
Activation of protein kinase signaling mediated AHR-dependent but ARNT-independent
inflammatory responses. Human breast MCF10A cells exposed to TCDD caused AHR-
dependent but ARNT-independent 1) increase in intracellular calcium concentration, 2)
activation of cytosolic phospholipase A2 to release arachidonic acid and activation of COX-2 to
synthesize prostaglandins, and 3) subsequent activation of protein kinases, such as calcium
stimulated protein kinase C, arachidonic acid induced Src kinase and prostaglandin-dependent
protein kinase A activation without induction of CYP1A1.93
Lastly, ligand-activated AHR is the adaptor component of E3-ubiquitin ligase for for
estrogen receptor-α.90 Steroid hormone receptors such as estrogen receptor-α and β, and
androgen receptor are degraded by the ubiquitin-mediated proteasome system. Similarily, β-
catenin is degraded by an E3 ubiquitin ligase complex, which has AHR as a component.96
Wnt/β-catenin signaling induces the mitochondrial apoptotic pathway as well as proliferation
depending on cell types.97 These studies suggest that AHR is capable of functioning as a
nongenomic mediator of cellular pathways, as well as a ligand-activated transcription.
23
MITOCHONDRIA
Mitochondria are considered to have originated as endosymbionts from the engulfment
of α-proteobacterium by a primitive eukaryotic cell.98 Mitochondria, therefore, have their own
DNA, RNA and protein synthesis systems. Mitochondrial structure and function vary depending
on cellular- and tissue-specific needs.99 Mitochondria are double membrane bound organelles,
which produce 90% of cellular energy by oxidation of chemical fuels coupled to the production
of high energy intermediates (i.e., ATP). The carbon metabolic pathways of these chemical
fuels, such as tricarboxylic acid (TCA) cycle and fatty acid oxidation, are at the junction of
biomolecular metabolism, anabolism and catabolism. Mitochondria occupy a considerable
volume of cytoplasm and have evolved to integrate multiple metabolic and signaling pathways.98
Because of the central role of the mitochondria in metabolism, they are also linked to normal
cellular processes, such as aging, differentiation and cell death. This also means that
mitochondrial defects can result in diseases such as encephalopathy, neurodegenerative
diseases, metabolic diseases and cancer.100
Structure of Mitochondria
The shape of mitochondria is flexible and can range from spherical to rod-like shape.
Mitochondria have a double-layered membrane structure. The two membranes, the outer-
membrane (OM) and inner-membrane (IM), separate the organelle into distinct compartments,
including the matrix space and inter-membrane space (IMS). The OM is ion permeable
membrane.101 Like bacterial OM, the mitochondrial OM has a porin, an aqueous channel which
is permeable to less than 5 kDa molecules. Because of this permeability, chemical composition
of the IMS is similar to the cytosol regarding small molecules. The OM also has the
mitochondrial transport machinery for delivery of proteins targeted to IMS, IM, and matrix space.
On the other hand, the IM is a highly selective layer that is folded, forming cristae that serve to
24
further compartmentalize the organelle and increase the total amount of the IM. The IM
contains the enzymes for the electron transport chain (ETC), ATP synthesis and specific
transport systems for matrix proteins and metabolites.101 Mitochondria cannot replicate on their
own. Fusion and fission mechanisms and the import of synthesized macromolecules like
proteins and lipids maintain orientation and distribution of mitochondria according to cell types
and cellular status.102
Mitochondrial DNA (mtDNA)
A mitochondrion contains 2-10 copies of its DNA and there can be as many as 1000
mitochondria per cell. Many genes from the endosymbionts were transferred to nuclear
chromosomes. It is estimated that approximately 1500 genes are scattered throughout the
chromosomal DNA.98 Human mtDNA is 16.6kb of a closed circular double strand molecule.
mtDNA has no introns and little of no intergenic regions between genes.103 The genes for 13
polypeptides, 22 tRNAs, and 2 small rRNAs are included in mtDNA. The 13 polypeptides are
components of the ETC and ATP synthase complexes, including ND1, 2, 3, 4L, 4, 5, and 6
(subunits of complex I), cytochrome b (subunit of complex III), CO1, 2, and 3 (subunits of
complex IV), and ATP6 and 8 (subunits of complex V).103 mtDNA is maternally inherited and
has regional genetic variances. Because mitochondria have multiple copies of their genome, an
individual may be heteroplasmic (i.e., having more than one sequence of organellar genome
within an individual).
In yeast, mtDNA nucleoids are associated with proteins in four functional groups: (I)
mtDNA maintenance and gene expression; (II) protein import and mitochondrial biogenesis; (III)
energy metabolism; and (IV) amino acid metabolism.104 For example, aconitase, a TCA cycle
enzyme, can replace ABF2, a mtDNA packaging protein.104 LON protease is also identified as a
component of the mitochondrial nucleoids, though LON protein level may not be essential for
25
mtDNA function.105 The factors discussed in other sections, such as mitochondrial translation
related factors, SLS1 and mitochondrial ribosomal protein L12 (MRPL12), or mitochondrial
chaperones, mtHSP70, are also associated with mtDNA nucleoids.104 Thus, mitochondria seem
to utilize the pools of proteins diversely to maintain their own integrity.
Synthesis of Mitochondrial Proteins
Among identified ~1500 nuclear genes that encode mitochondrial proteins, a portion of
these genes are thought to have been transferred from endosymbionts to the nucleus and the
other part would have arisen during the evolutionary process.98 To maintain mitochondrial
function and morphology, mitochondria need nuclear-encoded proteins.100 Analysis of
Saccharomyces cerevisiae mitochondrial proteome assigned functional classification of the
proteins; 12% of the proteins are involved directly in mitochondrial genome maintenance and
mitochondrial gene expression, 15% in energy metabolism, such as respiratory chain
complexes and TCA cycle, 25% in proteostasis, and 25% in other known functions such as lipid
metabolism, iron metabolism, amino acids metabolism, redox regulation, signaling, and
morphology. Still, the function of 20% of the proteins has not been assigned.98
Synthesis of mitochondrial gene encoded proteins
Mitochondrial ribosomes are bound to the IM for co-translational protein assembly.
Three yeast IM proteins, OXA1, MBA1 and Mdm38p, bind to large mitochondrial ribosome
subunits and function to promote mitochondrial protein export via their translocase/insertase
activity. Mitochondrial transcription occurs near the IM and mRNAs can be channeled to
mitochondrial translation machinery. Rpo41p, yeast RNA polymerase, interacts with NAM1
through N-terminus and delivers mRNA to NAM1. NAM1 delivers mRNA to the activator,
Pet309 or Pet111, in the IM surface, which binds mRNA 5’-UTR and mitochondrial ribosomes,
26
with membrane-associated proteins, SLS1 and Rmd9p.101 Newly synthesized components of
the respiratory chain form pre-assembly intermediates with a help of assembly factors in the
IM.101, 106
Synthesis of nuclear gene encoded mitochondrial proteins
There are two modes of nuclear gene encoded mitochondrial protein synthesis, protein
synthesis machinery (polysomes) bound to the OM of the mitochondria and free polysomes in
the cytosol.101 In yeast, 3’-untranslated regions (3’-UTRs) of mRNA and N-terminal sequences
of precursors act as signals for mitochondrial membrane binding of polysomes.107 Puf3p, an
RNA binding protein that induces deadenylation and degradation of mRNA, binds to the 3’-
UTRs and guides the mRNA at the mitochondrial surface near sites associated with ER.101, 107
The role of Puf3p and existence of other factors involved in mRNA stabilization or localization at
the surface of mitochondria is not completely clear. It is expected, however, that a regulatory
mechanism that maintains the ratio of protein synthesis at mitochondria bound polysome vs.
free polysomes exists. The co-translational protein import into mitochondria does not seem to
be the only purpose of translation at the mitochondrial surface because fully synthesized
precursors were detected at the OM of the mitochondria. It is not clear whether attenuated
import of precursors at the OM is destined to degradation or import.101
Nuclear-encoded Mitochondrial Protein Translocation
After being synthesized in the cytosol, nuclear-encoded mitochondrial protein precursors
are imported via a mitochondrial targeting signal (MTS). These MTSs usually contain positively
charged amphipathic helices. Mitochondrial protein import machinery has four major
complexes; the translocase of the outer membrane (TOM), the translocase of the inner
membrane (TIM), the presequence translocase-associated motor (PAM), and the outer
27
membrane sorting and assembly machinery (SAM). The translocases have multiple channels.
Though a role of multiple channels is not clearly identified, it is suggest that they may increase
transport efficiency or may recruit target proteins as well as regulatory factors.108
The translocation of proteins into the mitochondria begins with the interaction between a
target protein and the TOM complex.46, 108 TOM has two recognition receptors outside of the
mitochondria, TOM20 and TOM70. TOM20 binds to the N-terminal MTS and TOM70 binds to
hydrophobic internal sequences of transmembrane proteins. Mitochondrial precursors
recognized by TOM20 or TOM70 are transferred to the common TOM22/TOM40 translocation
pore. In mammals, cytosolic HSP90 and HSP70 interact to TOM70 in order to transfer
mitochondrial preproteins to TOM70 core domain.46, 109 Mitochondrial proteins targeting to
TOM20 are also transferred by cytosolic chaperones such as HSP90 and AIP.45, 110, 111 A
Recent model suggested another role of TOM20. In this model, TOM20 displaces
HSP90/HSP70 bound to TOM70 when ATP hydrolysis by HSP90/HSP70 occurs and the
displacement would facilitate a release of the target protein from TOM70 and a delivery to
common translocation pore.112
According to the destination of target proteins, SAM sorts pore-forming β-barrel proteins
to the OM. MIM1, interacting with SAM, identifies and inserts α-helical proteins to the OM.
TIM23 sorts matrix proteins by coordinating with PAM or IM proteins with the help of TIM21, and
TIM22 sorts IMS proteins delivered from TOM.98, 108 Mitochondrial membrane potential that is
coupled with ATP production and mitochondrial matrix HSP70 (mtHSP70) drives further
processsing of protein import into matrix from TIM23.113 mtHSP70 translocates matrix protein
precursors from TIM23 to the matrix.108 Matrix targeting signals are cleaved by mitochondrial-
processing peptidase upon entering the matrix. TIM21, a subunit of TIM23 complex, facilitates
protein localization into the IM.108, 113 In vitro studies using yeast and Escherichia coli cells
showed that TIM21 reduced the regional mitochondrial membrane potential by interacting with
subunits of complex III and IV in the respiratory chain.113 However, there is no clear mechanism
28
identified to explain a relationship between membrane potential and protein import to the inner
membrane.108
Some precursors destined for the IMS have a “bipartite presequence consisting of a
positively charged matrix targeting signal and a hydrophobic sorting signal”.98 Mitochondrial-
processing peptidase removes the matrix targeting signal and the inner membrane peptidase
cleaves a hydrophobic sorting signal, subsequently the mature protein is released from the IM
into the IMS.98 Small TIM family members deliver precursors targeted to the IM from TOM
complex to TIM22 across the IMS. One proposed transport mechanism for small proteins into
the IMS is a folding mechanism involving disulfide-bond formation within a protein, maintaining a
complex structure. Mia40 (TIM40) and Erv1 are known IM proteins that utilize disulfide-bond
formation in their mitochondrial IMS import and assembly (MIA) pathway.108, 114
Nuclear Transcription Factors for Mitochondrial Biogenesis
Several transcription factors are important for the expression of nuclear genes that
encode proteins destined for the mitochondria. For example, nuclear respiratory factor 1
(NRF1) regulates gene expressions of mtDNA replication and maintenance factors.115 NRF1 is
a transcription factor that binds to DNA as a homodimer, specifically at the promoter of
cytochrome c, mitochondrial transcription factor A (TFAM), and mtTFB, as well as other genes
involved in oxidative phosphorylation (OXPHOS), heme synthesis, ion channel synthesis,
mitochondrial protein import, assembly, and shuttling.103 NRF1 target genes are not only
involved in mitochondrial function but also related to metabolic enzymes and growth regulatory
E2F target genes.103 Nuclear respiratory factor 2 (GABP), binding to DNA as a heterotetramer,
activates transcription of subunits of cytochrome c oxidase.116 Both NRF1 and GABP regulate
gene expression of all 4 subunits of succinate dehydrogenase.103, 117 PPAR-γ coactivator-1α
(PGC-1α) is a coactivator and binds several nuclear hormone receptors, NRF1, GABP, and
29
PPAR-α and -γ. NRF1 and GABP genes have hormone responsive elements and are also
target genes of PGC-1α.103, 118 PGC-1α is well studied with regard to mitochondrial biogenesis
and function.119-122 PGC-1α associates with various nuclear transcription factors, as well as
induces expression of nuclear transcription factors in response to extracellular signals.103, 119, 122
Steroid/thyroid hormone receptors, such as glucocorticoid, estrogen, androgen and thyroid
receptors are localized in both nucleus and mitochondrial matrix and induce transcription of
OXPHOS genes and mitochondrial transcription factors in liver, heart, skeletal muscle, kidney,
and brain.118 Estrogen-related receptor, an orphan receptor, and PPAR-α and –γ, regulate fatty
acid oxidation.103 Also, mitochondrial glucocorticoid receptor induces apoptotic pathways in
immune cells. In contrast, mitochondrial estrogen receptor induces anti-apoptotic effects in
breast cancer cells. Finally, Sp1, CREB, p53, NF-κB, AP-1, and c-MYC have also been
investigated as regulators of mitochondrial function.103, 118
Mitochondrial Respiration and Reactive Oxygen Species
Aerobic respiration is the main process by which the mitochondria produce energy.
Aerobic respiration involves three distinct phases: oxidation of substrates (e.g., glucose, fatty
acid), electron transport, and ATP synthesis. In this process, reducing equivalents, primarily
derived from the TCA cycle, are transferred to the ETC and ultimately to O2. The energetically
favorable movement of electrons within the ETC is coupled to the production of an
electrochemical gradient across the IM of the mitochondria, which is used to drive ATP
synthesis (Figure 1-5). The respiratory chain in the IM contains four enzyme complexes (I, II, III
and IV) through which electrons pass on their way to reducing O2 to water. Complex I is
referred to as NADH dehydrogenase consisting of 46 polypeptides and reduces ubiquinone at
the expense of NADH, resulting in the net transfer of four protons across the IM. Complex II,
also known as succinate dehydrogenase, consists of only four peptides and is thus the simplest
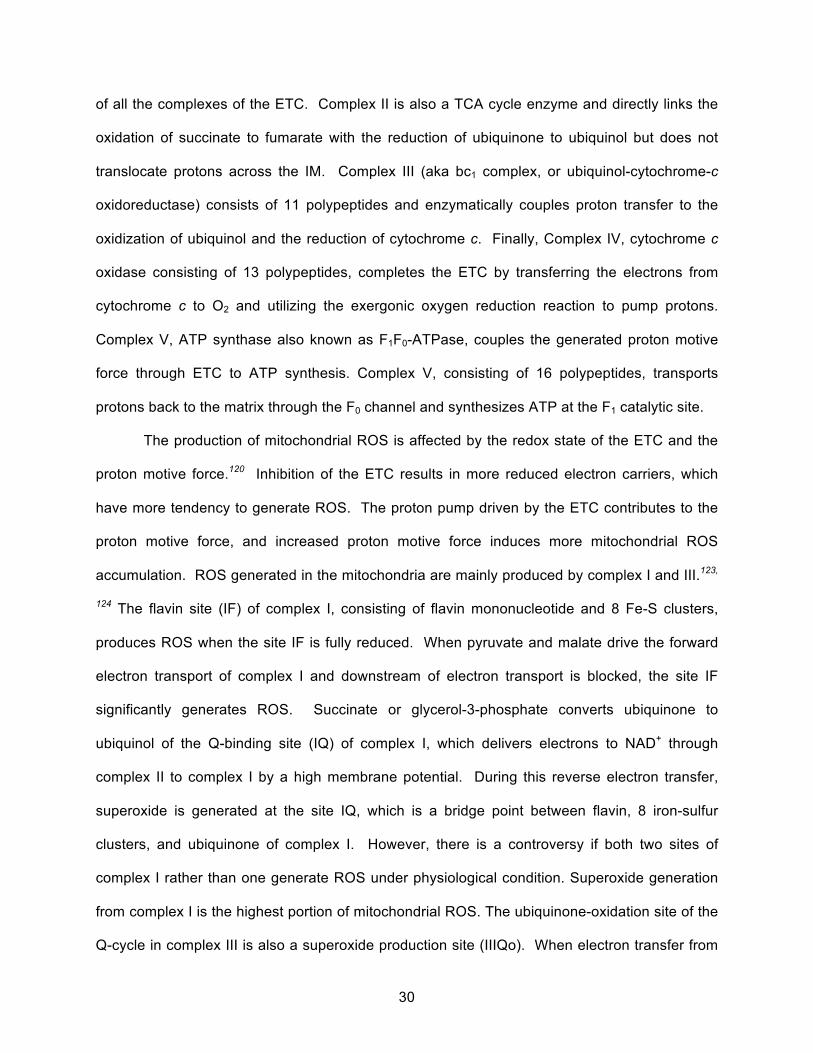
30
of all the complexes of the ETC. Complex II is also a TCA cycle enzyme and directly links the
oxidation of succinate to fumarate with the reduction of ubiquinone to ubiquinol but does not
translocate protons across the IM. Complex III (aka bc1 complex, or ubiquinol-cytochrome-c
oxidoreductase) consists of 11 polypeptides and enzymatically couples proton transfer to the
oxidization of ubiquinol and the reduction of cytochrome c. Finally, Complex IV, cytochrome c
oxidase consisting of 13 polypeptides, completes the ETC by transferring the electrons from
cytochrome c to O2 and utilizing the exergonic oxygen reduction reaction to pump protons.
Complex V, ATP synthase also known as F1F0-ATPase, couples the generated proton motive
force through ETC to ATP synthesis. Complex V, consisting of 16 polypeptides, transports
protons back to the matrix through the F0 channel and synthesizes ATP at the F1 catalytic site.
The production of mitochondrial ROS is affected by the redox state of the ETC and the
proton motive force.120 Inhibition of the ETC results in more reduced electron carriers, which
have more tendency to generate ROS. The proton pump driven by the ETC contributes to the
proton motive force, and increased proton motive force induces more mitochondrial ROS
accumulation. ROS generated in the mitochondria are mainly produced by complex I and III.123,
124 The flavin site (IF) of complex I, consisting of flavin mononucleotide and 8 Fe-S clusters,
produces ROS when the site IF is fully reduced. When pyruvate and malate drive the forward
electron transport of complex I and downstream of electron transport is blocked, the site IF
significantly generates ROS. Succinate or glycerol-3-phosphate converts ubiquinone to
ubiquinol of the Q-binding site (IQ) of complex I, which delivers electrons to NAD+ through
complex II to complex I by a high membrane potential. During this reverse electron transfer,
superoxide is generated at the site IQ, which is a bridge point between flavin, 8 iron-sulfur
clusters, and ubiquinone of complex I. However, there is a controversy if both two sites of
complex I rather than one generate ROS under physiological condition. Superoxide generation
from complex I is the highest portion of mitochondrial ROS. The ubiquinone-oxidation site of the
Q-cycle in complex III is also a superoxide production site (IIIQo). When electron transfer from
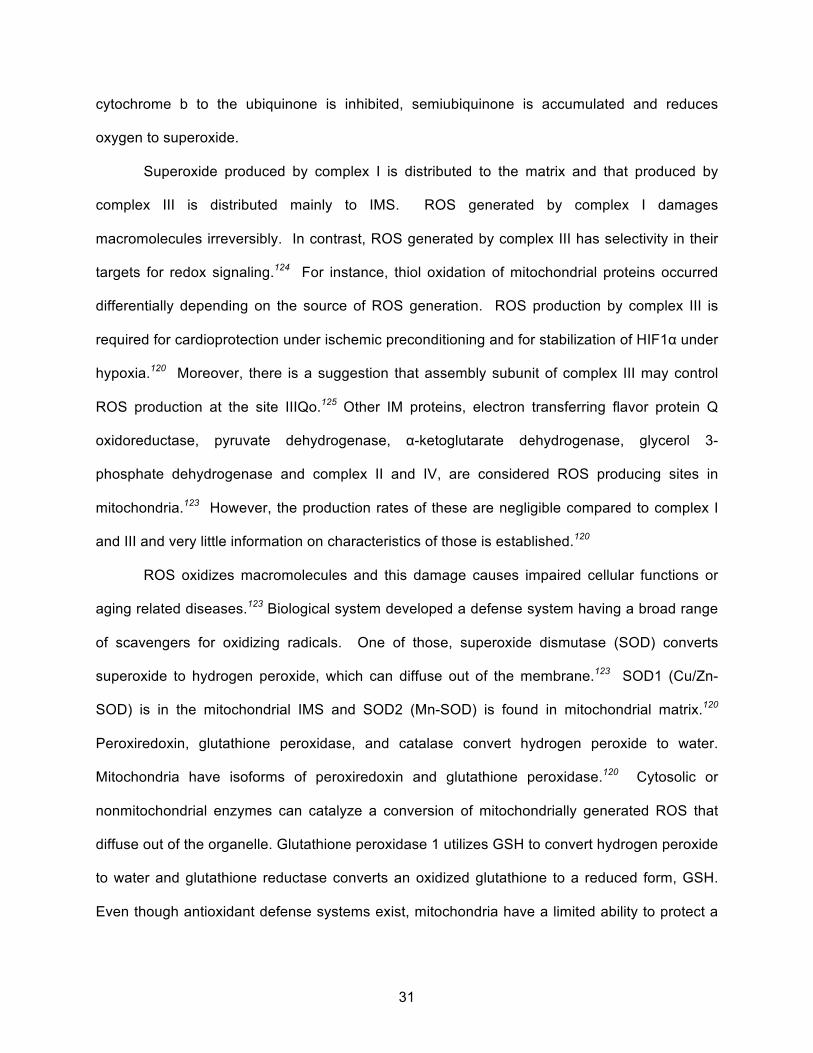
31
cytochrome b to the ubiquinone is inhibited, semiubiquinone is accumulated and reduces
oxygen to superoxide.
Superoxide produced by complex I is distributed to the matrix and that produced by
complex III is distributed mainly to IMS. ROS generated by complex I damages
macromolecules irreversibly. In contrast, ROS generated by complex III has selectivity in their
targets for redox signaling.124 For instance, thiol oxidation of mitochondrial proteins occurred
differentially depending on the source of ROS generation. ROS production by complex III is
required for cardioprotection under ischemic preconditioning and for stabilization of HIF1α under
hypoxia.120 Moreover, there is a suggestion that assembly subunit of complex III may control
ROS production at the site IIIQo.125 Other IM proteins, electron transferring flavor protein Q
oxidoreductase, pyruvate dehydrogenase, α-ketoglutarate dehydrogenase, glycerol 3-
phosphate dehydrogenase and complex II and IV, are considered ROS producing sites in
mitochondria.123 However, the production rates of these are negligible compared to complex I
and III and very little information on characteristics of those is established.120
ROS oxidizes macromolecules and this damage causes impaired cellular functions or
aging related diseases.123 Biological system developed a defense system having a broad range
of scavengers for oxidizing radicals. One of those, superoxide dismutase (SOD) converts
superoxide to hydrogen peroxide, which can diffuse out of the membrane.123 SOD1 (Cu/Zn-
SOD) is in the mitochondrial IMS and SOD2 (Mn-SOD) is found in mitochondrial matrix.120
Peroxiredoxin, glutathione peroxidase, and catalase convert hydrogen peroxide to water.
Mitochondria have isoforms of peroxiredoxin and glutathione peroxidase.120 Cytosolic or
nonmitochondrial enzymes can catalyze a conversion of mitochondrially generated ROS that
diffuse out of the organelle. Glutathione peroxidase 1 utilizes GSH to convert hydrogen peroxide
to water and glutathione reductase converts an oxidized glutathione to a reduced form, GSH.
Even though antioxidant defense systems exist, mitochondria have a limited ability to protect a
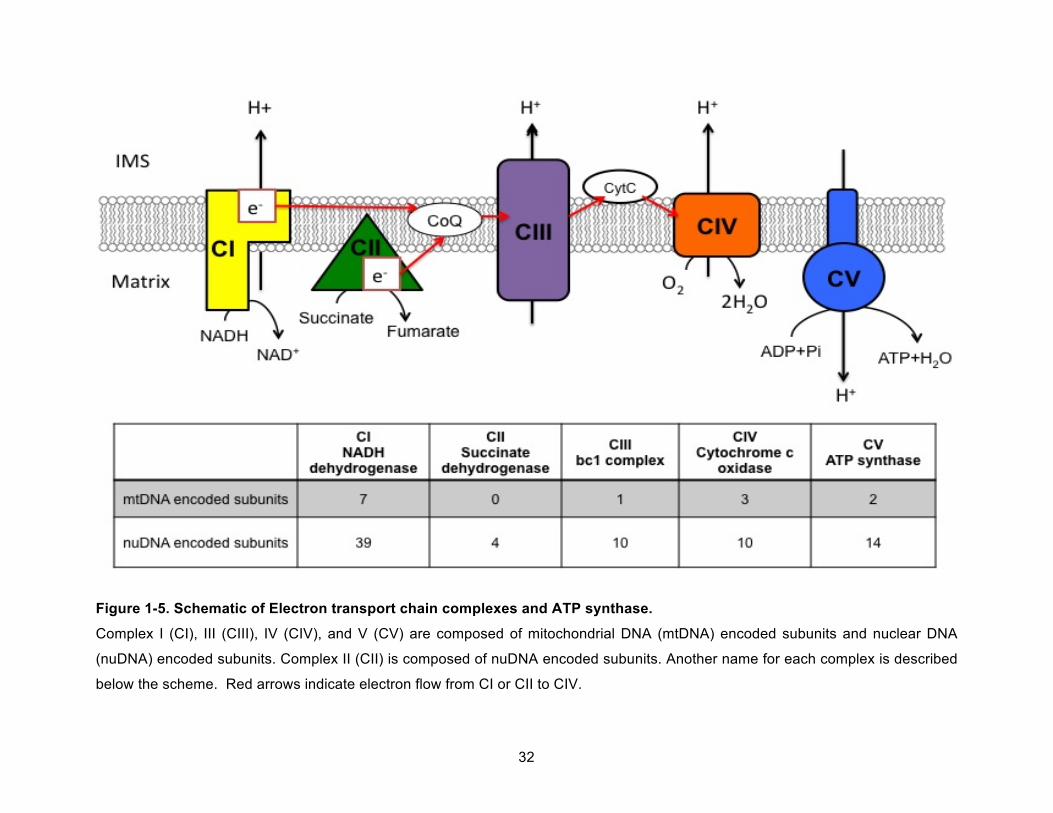
32
Figure 1-5. Schematic of Electron transport chain complexes and ATP synthase.
Complex I (CI), III (CIII), IV (CIV), and V (CV) are composed of mitochondrial DNA (mtDNA) encoded subunits and nuclear DNA
(nuDNA) encoded subunits. Complex II (CII) is composed of nuDNA encoded subunits. Another name for each complex is described
below the scheme. Red arrows indicate electron flow from CI or CII to CIV.
33
cell from oxidative damage. Recent research has reported that low levels of ROS, which might
be residual after detoxification by ROS scavengers, might function as a signaling molecule to
adapt to stress by crosstalk with other cellular pathways such as autophagy, hypoxia,
differentiation and immune response.120 Therefore, both defense system against oxidative
stress and regulations of cellular processes by ROS are important to maintain mitochondrial
integrity and function.121
TCA Cycle
The tricarboxylic acid (TCA) cycle (also known as Krebs cycle or citric acid cycle) in the
mitochondria is the major site that provides biomolecular precursors and reducing equivalents
that can be used by the ETC to conserves energy for ATP generation (Figure1-6).126 The TCA
cycle oxidizes acetyl-CoA to two CO2 through the reactions of 8 enzymes and generates 3
moles of NADH, 1 mole of FADH2, 1 GTP molecule and intermediates for other metabolic
pathways. Liver cells, for example, utilize the electron carriers, NADH and FADH2 in the ETC
and intermediates of the TCA cycle in the part of synthesis of glucose, fatty acids, cholesterol,
amino acids and porphyrins. The cytosolic isoforms of some enzymes in the TCA cycle and
active carriers for metabolites in mitochondrial IM create an interconnection between the TCA
cycle and other metabolic pathways. Oxaloacetate, the substrate of citrate synthase, can be
converted to phosphoenolpyruvate for gluconeogenesis. Acetyl-CoA, another substrate of
citrate synthase, can be utilized for fatty acid and cholesterol synthesis. α-ketoglutarate,
succinyl-CoA, fumarate and oxaloacetate are converted from amino acids and α-ketoglutarate
and oxaloacetate can also be converted to amino acids. Because of these amphibolic
characteristics, the TCA cycle is an important metabolic hub.
The flux of the TCA cycle is modulated by cellular metabolic demand. The TCA cycle is
regulated by availability of substrates and enzymatic activities and this is related to hormone
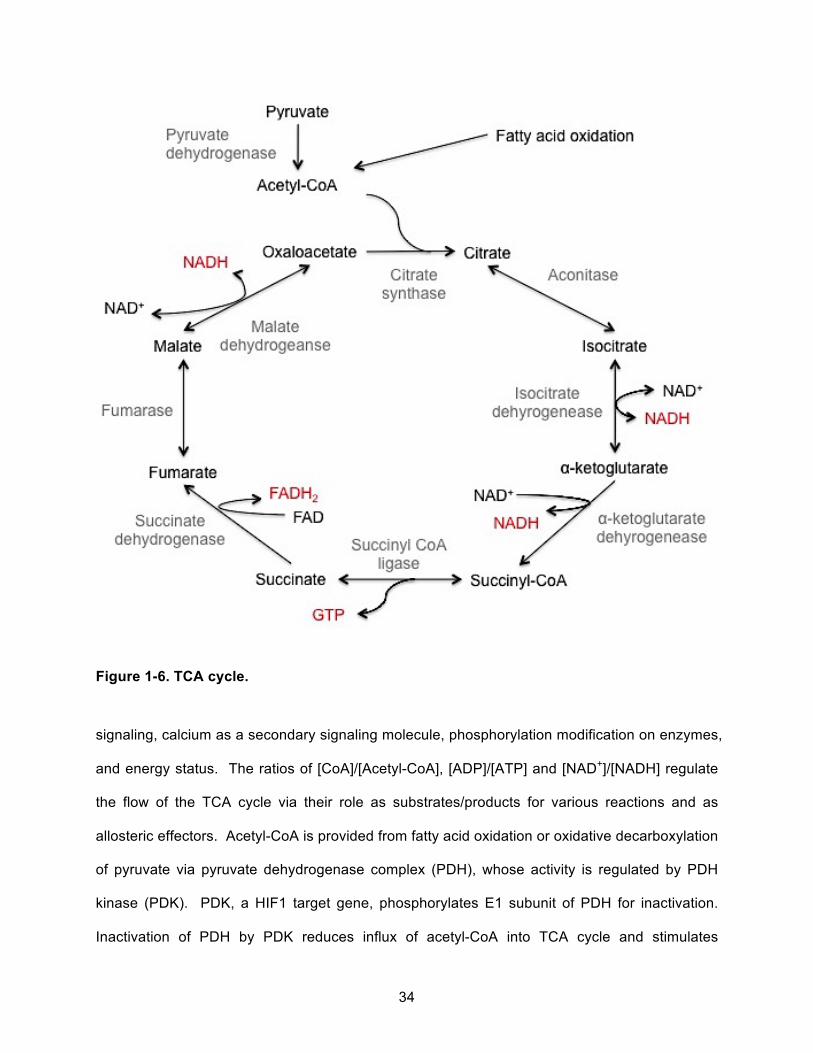
34
Figure 1-6. TCA cycle.
signaling, calcium as a secondary signaling molecule, phosphorylation modification on enzymes,
and energy status. The ratios of [CoA]/[Acetyl-CoA], [ADP]/[ATP] and [NAD+]/[NADH] regulate
the flow of the TCA cycle via their role as substrates/products for various reactions and as
allosteric effectors. Acetyl-CoA is provided from fatty acid oxidation or oxidative decarboxylation
of pyruvate via pyruvate dehydrogenase complex (PDH), whose activity is regulated by PDH
kinase (PDK). PDK, a HIF1 target gene, phosphorylates E1 subunit of PDH for inactivation.
Inactivation of PDH by PDK reduces influx of acetyl-CoA into TCA cycle and stimulates
35
glycolysis under specific circumstances such as hypoxic stress or in cancer.127 On the other
hand, high glucose concentration in blood stimulates insulin secretion and calcium release, and
activates PDH phosphatase to activate PDH.
Caenorhabditis elegans exposed to α-ketogluarate displays an extended life span.128
This was thought to be caused by ATP synthase inhibition upon a-ketoglutarate binding of ATP
synthase β subunit, resulting in decreased respiration and activity of the target of rapamycin
(TOR) and inducing autophagy.128 Endogenous levels of α-ketoglutarate under dietary
restriction can be increased through activation of gluconeogenesis. This suggests that α-
ketoglutarate may be a key metabolite that can be a target for aging or therapeutics for aging-
related disease. Mutant isocitrate dehydrogenase catalyzes the conversion of α-ketoglutarate
to 2-hydroxyglutarate, a competitive inhibitor of α-ketoglutarate utilizing enzymes such as α-
ketoglutarate dehydrogenase and α-ketoglutarate-dependent dioxygenase.129, 130 The enzymes
inhibited by accumulated 2-hydroxyglutarate are related to regulation of histone and DNA
methylation and HIF1α stabilization, which may promote tumorigenesis.130 Structural analogs of
α-ketoglutarate in the TCA cycle, such as fumarate, succinate and citrate, are competitive
inhibitors of prolyl hydroxylase domain proteins.131 Treatment of cell lines with derivatives of
fumarate and succinate induced HIF1α stabilization and expressions of HIF1 target genes.
Fumarase and succinate dehydrogenase are considered to be tumor suppressors.132 Mutations
in subunits of succinate dehydrogenase (B, C, and D) developed paraganglioma or
phaeochromocytoma and mutations in fumarase developed leiomyoma, leiomyosarcoma or
renal cell carcinoma.132 Mutation or deficiency of fumarase and succinate dehydrogenase
cause accumulation of fumarate and succinate in mitochondria, and consequently these
metabolites are leaked into cytosol and react with other enzymes.
A new role of metabolites of the TCA cycle has been discovered as substrates of post-
translational modification.133 Proteomic analysis with human liver tissues showed that all of the
enzymes participating in the TCA cycle and fatty acid oxidation are targets for acetyl
36
modification.134 Sirtuin (SIRT), an NAD-dependent protein deacetylase, is involved in many
cellular metabolic processes. Deacetylation on lysine residues by SIRT3-5 is a representative
example for post-translational modification of mitochondrial proteins.133 Human SIRT3
deacetylates and activates glutamate dehydrogenase and isocitrate dehydrogenase. Mouse
SIRT5 localized in the IMS deacetylates cytochrome c, which regulates respiration and
apoptosis.135 Succinylation on lysine residues or succination on cysteine residues is also
related to tumor formation.133 Succinylation on lysine residue of SOD1 in the IMS has a positive
relationship with tumor cell growth.136 Renal cell cancer syndrome associated with germ line
mutations in the fumarase gene is associated with aberrant succinated cysteine-containing
proteins.133 Post-translational modification by metabolites of the TCA cycle also occurs in
nonmitochondrial sites. Succination on KEAP1, a regulator of NRF2 stabilization, induce NRF2
signaling against stress.133 Hydroxylation on proline residues of HIFα by α-ketoglutarate-
dependent dioxygenase induced degradation of HIFα subunits.137
Fatty Acid β-oxidation and Ketogenesis
Fatty acid β-oxidation is another metabolic pathway that occurs within the mitochondrial
matrix and generates acetyl-CoA, NADH and FADH2.138 Fatty acid in cytosol must be primed
with CoA by thiokinase in an energy dependent process. The acyl-CoA is then transferred to
mitochondria by forming acyl-carnitine and being transported by the carnitine carrier protein. In
the oxidation process, thiolysis at the β-carbon of acyl group releases the 2 units of carbon
component as an acetyl-CoA. Propionyl-CoA is the end product of odd-chain fatty acid
oxidation. Propionyl-CoA can be carboxylated to succinyl-CoA, which can be further
metabolized for other metabolic pathways. Acetyl-CoA can be utilized in TCA cycle or ketone
body formation and electron carriers can be utilized in ETC and ATP synthase. Skeletal muscle
and heart utilize fatty acids as their primary energy source. The liver utilizes fatty acids for
37
energy production when there are low levels of blood glucose, such as during starvation.
Accumulated acetyl-CoA in liver mitochondria is converted to ketone bodies,
acetoacetate and β-hydroxybutyrate, important fuels for extrahepatic organs under starvation or
glucose depletion. It is important to note that acidosis can occur if the blood levels of ketone
bodies get higher than the demand of peripheral tissue. Hormonal regulation stimulated by
nutrient state activates transcriptional regulators such as sterol regulatory element-binding
protein 1c and carbohydrate responsive element-binding protein (i.e., by insulin), and PPAR-α
(i.e., by glucagon) to regulate de novo lipogenesis, fatty acid oxidation and ketogenesis. Insulin
resistance in white adipose tissue and muscle causes lysis of triacylglycerol and increases
translocation of nonesterified fatty acid into the liver.139 Insulin resistance also activates sterol
regulatory element-binding protein 1c. Hyperglycemia during type 2-diabetes activates
carbohydrate responsive element-binding protein and contributes to fatty liver. Hyperglycemia
and ketoacidosis that can also occur during type-2 diabetes increases CYP2E1 expression and
promotes ROS production within the liver causing lipotoxicity.139 Deletion of SIRT1 in liver
impairs PPAR-α signaling, which results in decrease in fatty acid β-oxidation and
ketogenesis.138 Deacetylation of PGC-1α, another co-activator for transcription, by SIRT1 and
phosphorylation by p38MAPK activates PGC-1α.138 Liver-specific deletion of PGC-1α in mice
causes hepatic steatosis and overexpression of PGC-1α in liver induces increase in fatty acid β-
oxidation through regulation of mitochondrial contents and function.138 Mitochondrial SIRT3 also
regulates fatty acid β-oxidation as well as SOD2 activation.138
TCDD-INDUCED TOXICITIES AND METABOLIC DYSFUNCTION
The various deleterious physiological effects by TCDD exposure are tumor promotion,
chloracne, wasting syndrome, and hepatic steatosis.140 In 1997, the International Agency for
Research on Cancer (IARC) defined TCDD as a human carcinogen.141 The studies about the
38
cohort in Soveso, Italy related to the accident in 1976, dioxin exposure from a chemical
production plant operated by Roche group, revealed high mortality in lung cancer, lymphopoietic
neoplasms and rectal cancer in men, and increased incidence of breast cancer and liver cancer
in women.141 Dioxin influences the thyroid hormone metabolism as an endocrine disruptor.140
Thyroid hormone is essential for brain development and a low level of thyroid hormone in early
pregnancy is related to low children’s intellectual ability.140 Chloracne, a noninflammatory skin
disorder characterized by metaplasia and hyperkeratosis, is a representative human dioxin-
induced toxicity.140 Women exposed to high doses of TCDD in their workplace in Vienna in
1997 suffered from severe chloracne.4 In 2004, Ukrainian presidential candidate, Viktor
Yushchenko, was poisoned with TCDD and suffered from severe chloracne.4 The mechanism
of developing chloracne is not clear. The suggested mechanism is that keratinocyte terminal
differentiation is accelerated via expression of filaggrin, a differentiation-specific protein
produced in keratinocytes by AHR activation.60
Interestingly, overexpression of constitutively active AHR in keratinocytes leads to
dermatitis, skin inflammation that is phenotypically different from dioxin-induced chloracne.60
Moreover, AHR-null mice showed hyperkeratosis and dermal fibrosis. Why hyperkeratosis
happens in both sustained AHR activation and lack of AHR is not understood. AHR-null mice
also display accelerated skin-wound healing than WT mice potentially caused by increased
epithelial cell migration rate. Interestingly, migration rate of endothelial cells and fibroblasts
were decreased.92 This is considered to be due to reduced inflammation. This suggests that
AHR has an important role in tightly controlling cytokine secretion from skin immune cells, which
protects the organism against extracellular invade.60
The severe loss of body weight, wasting syndrome, accompanies hyperlipidemia in
serum, accumulation of fat in the liver, decrease in the adipose tissue weight, downregulation of
PEPCK in liver and loss of appetite.93, 142, 143 Epidermal growth factor receptor (EGFR) signaling
is related to TCDD-induced symptoms. EGFR signaling can be activated by protein kinases,
39
including Src. Src-null mice are less susceptible to TCDD-induced wasting syndrome than WT
mice. In addition, AHR target genes that regulate metabolism can also be mediators of wasting
syndrome.68, 142, 144-146
TCDD-induced hepatotoxicity related to metabolic pathways is mediated by the direct
regulation of gene expression of key enzymes or secondary signaling by metabolites.143 TCDD
exposure to C57BL/6 mice downregulates gene expressions of enzymes involved in cholesterol
biosynthesis, fatty acid synthesis and glucose metabolism in liver depending on AHR
expression.147 The study using human hapatoma cells suggested that this AHR-dependent
repression of cholesterol biosynthesis might be a result from nongenomic AHR activation.148
TCDD also induces increased levels of unsaturated fatty acid in liver and decreased levels of
serum cholesterol and lipoproteins, and this suggests that dietary lipids cause the AHR-
mediated hepatic steatosis rather than lipid de novo synthesis.149 Steatosis is defined as an
abnormal accumulation of lipids within a cell. During TCDD-elicited steatosis, hepatocytes
display increased triglycerides, free fatty acids, alterations in fatty acid composition, lipid
metabolizing enzymes and transporters, vacuolization and inflammation.143, 146, 149 Many of these
changes are dependent upon Stearoyl-CoA desaturase 1 (Scd1) gene expression, which is the
rate-limiting step in monounsaturated fatty acid biosynthesis.146 TiPARP, another AHR target
gene, suppresses gluconeogenesis by regulation of posttranslational modification of PGC-1α
and PEPCK.142, 145 Decreased gluconeogenesis is a dioxin-induced response, which can lead to
hypoglycemia.81 TiPARP induction depletes NAD+, deactivates SIRT3, decreases SOD2
activity, and, consequently, induces oxidative stress that triggers liver injury with lipid
accumulation.150 Another TCDD-induced metabolic dysfunction is disruption in tryptophan
homeostasis.151 TCDD causes inhibition of liver tryptophan pyrrolase and, conversely, increase
of free tryptophan levels in blood plasma in TCDD-susceptible Long-Evans rat strain. It should
also be noted that tryptophan metabolites have been proposed to be endogenous ligands for
the AHR (see Ligands of AHR).
40
Many studies have been reported that oxidative stress is a main dioxin-induced
response.84, 152-154 CYP1A1 and CYP1B1 produce reactive oxygenate metabolites and this can
cause oxidative stress, which consequently would elevate protein amounts and enzymatic
activities of SOD and GSH and NADPH producing enzymes.61, 81 Upregulation of Phase II
detoxification enzyme by the AHR and NRF2 is also a response of oxidative stress.84 UGT1-
knockout rats have elevated CYP1A1 and CYP1A2 and GSTM1-knockout also caused
increases in Cyp1a1 transcript.81 Antioxidant treatment attenuates NF-κB activation, which may
induce TCDD toxicity.154 The relationship between oxidative stress and cytokine production has
been studied in several metabolic dysfunctions and metal toxic responses.155-157 Reactive
oxidative metabolites can activate transcription factors, such as NF-κB and AP-1, which induce
gene expression of cytokines, such as ILs, TNF-α and TGF-β. As mentioned previously, gene
expression of CYP1A1 and 1A2 are also regulated by cytokines, which induce NF-κB in human
and mouse primary hepatocytes.14, 94 Recent studies using human dendritic cells and mouse
thymus revealed that RelA, a subunit of NF-kB, is critical to regulate TCDD-induced AHR
signaling or to enhance AHR induction when stimulated with both TCDD and inflammatory
stimuli like LPS.158
Mitochondria are also considerable sites for oxidative stress induced by TCDD. Livers
from C57BL/6 mice exposed to dioxin produced succinate-dependent mitochondrial ROS at
complex II and III in a mitochondrial respiration-dependent manner, by decreasing complex IV
activity and ATP production.159 Mitochondrial antioxidant protein, SOD2 does not change in
protein levels or enzymatic activities in C57BL/6 mice liver exposed to TCDD.160 Rather,
enzyme activities of mitochondrial glutathione reductase and glutathione peroxidase and the
ratio of mitochondrial GSH/GSSG were increased upon TCDD exposure. Interestingly, TCDD
caused an AHR-mediated increase in the ratio of mitochondrial GSH/GSSG and a decrease in
cytosolic GSH/GSSG ratio due to increased ROS in C57BL6J.152 Thus, TCDD-induced
mitochondrial ROS production and glutathione redox state were AHR-dependent.152, 159, 160
41
Additionally, the study using knockout mice revealed that TCDD-induced mitochondrial oxidative
stress in liver is AHR-dependent, but does not require CYP1A1 or CYP1A2.160 These previous
researches led researchers to propose the “TCDD-induced mitochondrial thiol oxidative stress”
to explain TCDD-mediated pathologies.152 This model considers the mitochondrial reduction
potential by glutathione as a primary driving force for ROS production. The ratio of GSH/GSSG
acts as a switch to open/close the mitochondrial permeability transition pore (MPTP) through
glutathione reduction potential. More negative reduction potential (i.e., high GSH/GSSG ratio)
closes MPTP and causes mitochondrial hyperpolarization resulting in more electron flow in Q
cycle in complex III and reverse electron flow in complex I, which generates more superoxides.
Activities of antioxidative enzymes, SOD, catalase, glutathione peroxidase and
glutathione reductase, were decreased in a time-dependent and TCDD dose-dependent manner
in rat hepatocytes.161 Corresponding to the enzyme activities, superoxide production and lipid
peroxidation were increased with decreased enzyme activities of complex II and IV of ETC and
mitochondrial membrane potential.161 The recent study with C57BL/6 mice lung showed that
induction of CYP1B1 by TCDD exposure increased mitochondrial ROS production and
suppressed complex I and IV activities and these changes were accompanied by mitochondrial
DNA loss.78 In addition, cigarette smoke extract exposure for 6 h to lung fibroblast and epithelial
cells showed that AHR protected cells from apoptotic cell death by regulating the expression of
SOD rather than other antioxidant proteins such as GSH, heme oxygenase 1 and NRF2.162 As
shown in these several studies, AHR-mediated oxidative stress upon TCDD exposure can be
mediated by different molecular mechanisms depending on tissue types.
TCDD is considered to be a nongenotoxic carcinogen, but loss of functional NRF2
causes severe oxidative stress resulting in DNA damage in C57BL/6 mice liver.84 In addition,
previous reports have shown that TCDD-induced oxidative stress can also cause both nuclear
and mitochondrial DNA damage in C57BL/6 mouse liver.152 In fact, a higher degree of
mitochondrial DNA damage was observed compared to that of nuclear DNA damage following
42
TCDD exposure and this occurred together with increased GSH/GSSG ratio and mitochondrial
membrane hyperpolarization.152
It should also be noted that some of the TCDD-induced mitochondrial toxicities might be
independent of AHR-mediated transcription. ARNT knockdown in mouse skeletal myoblast
C2C12 cells, which causes a lack TCDD-induced AHR-mediated transcription, showed TCDD-
induced disruption of mitochondrial membrane potential, reduction in mtDNA gene expression,
induction in nuclear Cox4i1 gene expression, stimulation of calcium-dependent phosphatase-
mediated NF-κB pathway and increase of invasiveness.163 These responses were related to
mitochondrial stress signals and inhibition of mitochondrial transcription. Therefore, TCDD may
cause tumor progression through blocking mitochondrial transcription and inducing
mitochondrial stress signals.
43
CHAPTER 2. HYPOTHESIS AND SPECIFIC AIMS
44
TCDD-induced metabolic disorders such as hepatic steatosis and wasting syndrome
suggest that AHR-mediated pathology involves mitochondrial dysfunction. To support this
hypothesis, recent studies using high-throughput quantitative real-time PCR have shown that
TCDD induces changes in the expression of nuclear genes that encode subunits of the ETC
and ATP synthase complexes.164 Another study demonstrated that the AHR can induce
changes in metabolic flux independent of transcription.165 TCDD exposure for 6 hrs caused
AHR-dependent, but transcription-independent, hyperpolarization of the inner membrane of the
mitochondria without a change in ATP production. This suggests the possibility that the ATP
synthase becomes less efficient following TCDD exposure and requires a higher membrane
polarization to maintain ATP levels. In addition, the high-throughput proteomic analysis showed
an interaction between the AHR and ATP5α1, an ATP synthase subunit, and between the AHR
and MRPL40, a mitochondrial ribosomal protein. Interestingly, these interactions were lost upon
exposure to TCDD.165, 166 The cytosolic binding partners of the AHR (i.e., AIP and HSP90) can
bind the mitochondrial translocase complex, TOM, and facilitate mitochondrial import of proteins
lacking classic MTS, such as the AHR. Moreover, AIP can also interact with other
mitochondrial-targeted proteins such as survivin, preornithine transcarbamylase, preaspartate
aminotransferase, preserine:pyruvate aminotransferase, and enoyl-CoA hydratase 1.111, 167
Given this preliminary data and literature documenting a link between TCDD exposure and
metabolic dysfunction, this study has focused on elucidating a mechanism of AHR import into
mitochondria and evaluation of TCDD-induced AHR-dependent effects on mitochondrial
dysfunction.
HYPOTHESIS
The AHR can impact mitochondrial function via direct interaction with the mitochondrial
respiratory system and transcriptional regulation of genes that involves in key metabolic
pathways. To test this hypothesis, three specific aims have been proposed:
45
SPECIFIC AIMS
Specific Aim 1. Characterize the mechanism by which the AHR translocates into the
mitochondria and determine it localization within the organelle.
Specific Aim 2. Determine AHR-mediated TCDD-induced changes in respiratory efficiency.
Specific Aim 3. Determine the role of AHR in TCDD-induced mitochondrial dysfunction through
quantitative analysis of mitochondrial proteomics.

46
CHAPTER 3. MATERIALS AND METHODS

47
CELL CULTURE
Mouse hepatoma cell line, hepa1c1c7, were grown in Dulbecco's modified Eagle’s
Medium (DMEM) (#11965, Gibco, Life Technologies, Grand Island, NY) supplemented with 10%
cosmic calf serum (Hyclones, GE, Logan, UT), 1 mM sodium pyruvate (#11360, Gibco), 100
U/mL penicillin and 100 µg/mL streptomycin (#15140, Gibco). Mouse hepatoma cell line, C12,
were grown in DMEM (#11965, Gibco) supplemented with 10% cosmic calf serum (Hyclones)
and 1 mM sodium pyruvate (#11360, Gibco). All cell culture work was performed under
standard cell culture conditions (5% CO2, 35% humidity and 37 °C) in a NAPCO 7000 incubator
(NAPCO, Winchester, VA) unless specified.
PREPERATION OF INTRACELLULAR FRACTIONS
Nuclear, cytosolic, and mitochondrial fractions were isolated using protocols adapted
from previous reports.168-170 Cells were washed with cold PBS (4 °C) and removed from the
plate surface by being scraped in mitochondrial buffer A (250 mM sucrose, 20 mM HEPES, 1
mM EDTA, 1 mM EGTA, 1 mM dithiothreitol, and 0.1 mM PMSF). Each sample was then
homogenized with 100 strokes in a dounce homogenizer on ice. A 50 µL aliquot was saved and
represents a whole cell lysate. Insoluble material was removed by centrifugation (400 x g for 10
min at 4 °C), and the pellet was collected for further preparation of a nuclear fraction (see
below). The supernatant was cleared by centrifugation (10000g for 10 min at 4 °C). The
subsequent supernatant was collected as a cytosolic fraction, and the pellet was resuspended
in mitochondrial buffer A. The remaining insoluble material was removed by centrifugation (400
x g for 10 min at 4 °C). The supernatant was further cleared by centrifugation (10000g for 10
min at 4 °C) and aspirated, and the mitochondrial pellet was obtained for further analysis. The
nuclear pellet was suspended with nuclear extraction buffer [10 mM Tris (pH 7.5), 1.5 mM
48
MgCl2, 10 mM KCl, 2 mM dithiothreitol, 1 mM sodium orthovanadate, and 0.4 mM PMSF and
Complete-mini EDTA-free protease inhibitor (Roche Applied Science, Indianapolis, IN)],
incubated for 30 min at 4 °C, and, then, cleared by centrifugation (17000g for 30 min at 4 °C).
The supernatant was collected for nuclear fraction. Each intracellular fraction was stored at -
80°C until appropriate assays were performed.
TRYPSIN TREATMENT OF DIGITONIN EXTRACTED MITOCHONDRIA
Protease protection in combination with digitonin extraction of mitochondria was adapted
from the previous report.171 Briefly, purified mitochondria, which were washed with
mitochondrial buffer A without dithiothreitol and PMSF and diluted to 1 µg/µL, were treated with
different concentrations of digitonin (final concentration = 0, 0.2, 0.4, 0.6, 1.0, 1.5, 2.0 mg
digitonin/mg protein) and 100 µg trypsin/mL. Samples were rotated in a cold room for 30 min
and digestion was stopped with the addition of 266 µL of cold 20% trichloroacetic acid for 400µg
of mitochondria. After vortexing immediately, samples were incubated at 65 °C for 5 min, and
then on ice for 1 h. Samples were pelleted by centrifugation (17000g for 10 min) and washed
with 1 mL of cold acetone. After centrifugation at 17000g for 5 min, pellets were dried on ice for
10 min and dissolved in 80 µL of 1X Laemmli sample buffer. 1 µL of 1 M Tris was added to
adjust sample pH and 35 µL of each sample was loaded on 4~12% NuPAGE gel (Invitrogen,
Life Technologies) for Western blot analysis.
siRNA KNOCKDOWN OF AIP OR TOM20
Hepa1c1c7 cells were grown in 15 cm plates. When cells were 50% confluent, the
siRNAs specific for AIP (Ambion s62179 (siAIP1) and s62181 (siAIP2), Life Technologies) and
the Silencer® Select Negative Control no. 1 siRNA (Ambion) were transfected into hepa1c1c7
49
cells using Lipofectamine 2000 (Invitrogen) following the manufacturer’s protocol. For TOM20
knockdown, the siRNA for TOM20 proteins (Tom20 ON-TARGET plus, SMARTpool L-006487-
01-0005, Dharmacon, GE) and the nontargeting siRNA (Dharmacon, GE) were transfected into
hepa1c1c7 cells. After a 72 h incubation, cells were harvested with 1 mL of mitochondrial buffer
A per 15 cm plate after being washed with cold PBS (4 °C) three times. Cells were stored at -80
°C until purification of nuclear, cytosolic, and mitochondrial fractions was performed.
HSP90 INHIBITION BY GELDANAMYCIN
Hepa1c1c7 cells were grown in 15 cm plates. When cells were 50% confluent, they were
treated with geldanamycin (GA, 32 nM or 100 nM) or DMSO. After incubation (72 h), cells were
harvested with 1 mL of mitochondrial buffer A per 15 cm plate after being washed with cold PBS
(4 °C) three times. Cells were stored at -80 °C until purification of nuclear, cytosolic, and
mitochondrial fractions was performed.
WESTERN BLOTTING
The same amount of protein from each sample was separated by sodium dodecyl
sulfate-polyacrylamide gel electrophoresis (SDS-PAGE) and transferred to a nitrocellulose
membrane. The nitrocellulose membrane was probed with one of the following antibodies:
rabbit polyclonal anti-AHR BEAR3 (generous gift from Dr. Christopher Bradfield, University of
Wisconsin-Madison) for the samples from AIP and TOM20 knockdown, HSP90 inhibition and
digitonin/trypsin treatment to hepa1c1c7 cells, rabbit anti-AHR (BML-SA210, Enzo Life Sciences
Inc., Farmingdale, NY) for digitonin/trypsin treatment to hepa1c1c7 cells exposed to TCDD, goat
polyclonal anti-AIP (#115588, Abcam, Cambridge, MA), rabbit polyclonal anti-LDH (a generous
gift from Dr. John Wang, Michigan State University), rabbit anti-histone H3 (ab1791, Abcam),
50
mouse monoclonal anti-ATP5α (ab14748, Abcam), rabbit polyclonal anti-HSP90 (ab19021,
Abcam), mouse monoclonal anti-COX4 (A21348, Invitrogen), mouse monoclonal α-tubulin
(ab28439, Abcam), rabbit polyclonal anti-TOM20 (sc-11415, Santa Cruz Biotechnology, Dallas,
TX), mouse monoclonal anti-SMAC (NB500-213, Novus Biologicals, Inc., Littleton, CO), rabbit
polyclonal anti-ENTPD2 (ABIN1385820, Antibodies-online, Inc., Atlanta, GA), rabbit polyclonal
anti-ACOT2 (ABIN405459, Antibodies-online Inc.), rabbit polyclonal anti-H6PD (ab170895,
Abcam), rabbit polyclonal anti-CPOX (ab102938, Abcam), rabbit polyclonal anti-COX4I1
(ABIN310391, Antibodies-online Inc.), rabbit polyclonal anti-CYB5A (ABIN1529444, Antibodies-
online Inc.), horseradish peroxidase-conjugated donkey anti-goat IgG (sc-2033, Santa Cruz
Biotechnology), goat anti-rabbit IgG (sc-2004, Santa Cruz Biotechnology), or goat anti-mouse
IgG (sc-2005, Santa Cruz Biotechnology). The western blot was visualized with an ECL
Western blot system (Pierce).
OXYGEN CONSUMPTION RATE (OCR) MEASUREMENT
OCR was measured using an XF24 Extracellular Flux Analyzer (Seahorse Bioscience,
Billerica, MA) as described in the manufacturer’s instruction. Briefly, hepa1c1c7 cells were
plated in growth medium at 20000 cells/well and c12 cells at 40000 cells/well. After 24 h, the
culture medium was then replaced with specific XF24 assay medium containing TCDD (10 nM
or 30 nM) or 0.03% DMSO (vehicle control). XF24 assay medium consisted of DMEM base
(#D5030, Sigma-Aldrich, St. Louis, MO) supplemented with 25 mM glucose, 31 mM NaCl, 1 mM
sodium pyruvate (#11360, Gibco), 2 mM GlutaMAX (#35050, Gibco), and 15 mg/L phenol red
(#P3532, Sigma-Aldrich). Measurement of OCR was started 90 min after switching to XF24
assay medium containing TCDD or DMSO and the inhibitors of ETC and OXPHOS system were
injected in the following order: oligomycin A (0.5 µM), FCCP (1.0 µM for 1c1c7 and 0.5 µM for
c12 cells), and antimycin A (0.5 µM). The concentrations of inhibitors for each cell line were
51
optimized by measuring OCR in XF24 assay medium. The OCR (picomoles per minute) was
divided by the number of cells plated for each well and parameters related to mitochondrial
function were calculated by the manufacture’s software, XF Mito Stress Test Report Generator,
and the equation in the previous study.172
STATISTICAL ANALYSIS
The result of respiratory parameters was analyzed for significant differences by analysis
of variance (ANOVA) followed by Tukey’s post hoc test.
ENZYMATIC ASSAY OF OXPHOS SYSTEM
The activities of the individual ETC complexes, ATP synthase and citrate synthase were
determined as previously described with slight modifications.173, 174 Hepa1c1c7 and c12 cells
were exposed to 30 nM TCDD or 0.01% DMSO as a vehicle control for 6 or 24 h when cells had
reached 70% confluency. Cells were washed with cold PBS (4 °C) and removed from the plate
surface by being scraped in mitochondrial buffer A. Mitochondria were prepared from each
treated cells as described above. Each enzyme solution was prepared by suspension of
mitochondrial pellets either in a hypotonic buffer [25 mM KPO4 (pH 7.4) and 5 mM MgCl2] for
citrate synthase, complex I, complex II, complex IV, and complex V or in mitochondrial buffer A
for complex II+III and complex III. After three cycles of freezing/thawing, protein concentrations
were determined. The enzyme activities were determined at 37 °C for complex I and V and at
30 °C for the other ETC complexes and citrate synthase. The enzyme activity was calculated
by
(ΔAbs/min)×(total assay volume)/[ε×(mitochondrial volume)×(mitochondrial concentration)]
52
with units of micromoles per min per milligram (ε: extinction coefficient). The enzymatic activity
was calculated as a ratio, dividing each activity in micromoles per min per milligram protein by
the citrate synthase activity. The absorbance for each enzymatic activity was measured using a
SpectraMax M2 spectrophotometer (Molecular Devices, Sunnyvale, CA). Cytochrome c was
bovine heart cytochrome c.
Citrate Synthase Assay
5 µg of each enzyme solution was incubated with citrate synthase buffer [50 mM KPO4
(pH 7.4), and 0.1 mM DTNB] containing 100 µM acetyl CoA, in a cuvette for 5 min. The change
of absorbance was measured at 412 nm for 2 min for reference. After addition of 100 µM
oxaloacetate, the change in absorbance at 412 nm was recorded for 3 min. Enzyme activity
was calculated with ε for the thionitrobenzoate anion (13.6 mM-1cm-1).
Complex I Assay
50 µg of each enzyme solution was mixed with complex I buffer [50 mM KPO4 (pH 7.4),
140 µM NADH, 1 mM KCN, 10 µM antimycin A, 0.1% BSA, and 50 µM DCPIP] with 1% ethanol
and 50 µM Coenzyme Q1 (CoQ1) in a cuvette. The change in absorbance at 340 nm was
recorded for 3 min. Reference was measured in the presence of 2.5 µM rotenone (dissolved in
ethanol). Enzyme activity was calculated with ε for the NADH (6.22 mM-1cm-1).
Complex II assay
10 µg of each enzyme solution was incubated with complex II buffer [50 mM KPO4 (pH
7.4), 10 mM succinate, 1 mM KCN, 2.5 µM rotenone, and 10 µM antimycin A] for 10 min in a
cuvette. After addition of 50 µM DCPIP, the change in absorbance at 600 nm was recorded for 2
53
min for reference. The change in absorbance at 600 nm was then recorded for 3min in the
presence of 50 µM CoQ1. Enzyme activity was calculated with ε for the DCPIP (19.1 mM-1cm-1).
Complex II+III assay
10 µg of each enzyme solution was incubated with complex II+III buffer [50 mM KPO4
(pH 7.4), 10 mM succinate, 1 mM KCN, 2.5 µM rotenone, 0.1% BSA, 0.075% EDTA, and 1 mM
ATP] in a cuvette for 5 min. Upon addition of 32 µM cytochrome c, absorbance at 550 nm was
recorded for 5 min. The reference was measured in the absence of cytochrome c. Enzyme
activity was calculated with ε for the reduced cytochrome c (19.6 mM-1cm-1).
Complex III assay
5 µg of each enzyme solution was mixed with complex III buffer [50 mM KPO4 (pH 7.4),
1 mM n-dodecyl maltoside, 1 mM KCN, 2.5 µM rotenone, and 0.1% BSA] with 100 µM
decylbenzolquinol and 30 µM cytochrome c in a cuvette. The change in absorbance at 550 nm
was recorded for 3 min. Cytochrome c was fully reduced at the end of the measurement with
dithionite. The reference was measured without enzyme solution. Enzyme activity was
calculated with ε for the reduced cytochrome c (19.6 mM-1cm-1).
Complex IV Assay
Reduced cytochrome c was prepared using sodium dithionite. 10 µg of each enzyme
solution was mixed with complex IV buffer [40 mM KPO4 buffer (pH 6.8), 0.5% Tween 80, and
0.4 mg/mL reduced cytochrome c] in a cuvette. The change in absorbance at 550 nm was
recorded for 2 min. 5 mM potassium ferricyanide was added to fully oxidized cytochrome c at
the end of the measurement. The reference was measured without enzyme solution. Enzyme
activity was calculated with ε for the reduced cytochrome c (19.6 mM-1cm-1).
54
Complex V Assay
Complex V buffer [40 mM Tris-HCO3 (pH 8.0), 1 mM EGTA, 5 mM MgCl2, 0.2 mM
NADH, 2.5 mM phosphoenolpyruvate, 0.5 µM antimycin A, 15 µM CCCP, 50 µg/mL lactate
dehydrogenase, and 50 µg/mL pyruvate kinase] was incubated with 2.5 mM ATP for 2 min in a
cuvette. After 10 µg of each enzyme solution was added to the above mixture, the change in
absorbance at 340 nm was recorded for 5 min. The reference was measured in the presence of
2 µM oligomycin for 5min. Enzyme activity was calculated with ε for the NADH (6.22 mM-1cm-1).
STABLE ISOTOPIC LABELING BY AMINO ACIDS IN CELL CULTURE (SILAC) AND
QUANTITATIVE PROTEOMIC ANALYSIS
Preparation of Mitochondrial Proteins
Cells were grown in SILACTM-DMEM supplemented with 10% dialyzed fetal bovine
serum, 1 mM sodium pyruvate, 2 mM L-glutamine, 100 µg/mL L-arginine, and 100 µg/mL L-
lysine (light L-lysine HCl/L-arginine, medium 13C6L-lysine HCl/15N4-L-arginin, or heavy 13C615N2L-
lysine HCl/13C615N4L-arginine (SILACTM media kit, Invitrogen and Cambridge Isotope
Laboratories)) for 5 cell doublings to insure full incorporation of labeled amino acids into cellular
proteins. Cells were then treated with 10 nM TCDD or 0.01% DMSO (vehicle control) for 72 h
as described in Figure 3. Each treated cells were harvested and mitochondrial fractions were
isolated as described above. After protein quantification, equal amount of proteins (35µg)
labeled with light, medium, or heavy amino acids within one experimental set were combined.
When samples from the four independent experimental were collected, proteins were separated
by SDS-PAGE.
55
Mass Spectrometry (MS)
SDS-PAGE gels were divided into 10 equal slices, and each slice was digested with
trypsin by in-gel digestion according to Shevchenko, et al. with modifications.175 Peptides were
extracted from the gel and dissolved in 2% acetonitrile/0.1% trifluoroacetic acid. Peptides were
automatically injected by a Thermo EASYnLC 1000 onto a Thermo Acclaim PepMap RSLC
0.075mm x 250mm C18 column (Buffer A = 99.9% Water/0.1% Formic Acid, Buffer B = 99.9%
Acetonitrile/0.1% Formic Acid) and eluted over 90 min with a gradient of 2%B to 30%B in 79
min, ramping to 100%B at 80 min and held at 100%B for the duration of the run. Eluted
peptides were sprayed into a ThermoFisher Q-Exactive mass spectrometer using a FlexSpray
spray ion source. Survey scans were taken in the Orbi trap (70000 resolution, determined at
m/z 200) and the top ten ions in each survey scan were then subjected to automatic higher
energy collision induced dissociation (HCD) with fragment spectra acquired at 17500 resolution.
Data Analysis
The resulting MS/MS spectra were converted to peak lists using MaxQuant, v1.4.1.2
(www.maxquant.org), and searched against a database containing Uniprot Mouse protein
sequences (www.uniprot.org) and appended with common laboratory contaminants using the
Andromeda search algorithm, a part of the MaxQuant environment.176, 177 Assignments
validated using the MaxQuant maximum 1% false discovery rate (FDR) confidence filter are
considered true. Andromeda parameters for all databases were as follows: quantification triple
SILAC labeling: light (Arg0, Lys0), medium (Arg4, Lys6), heavy (Arg10, Lys8); allowing
maximum 2 missed trypsin sites, fixed modification of carbamidomethyl cysteine, variable
modification of oxidation of methionine; peptide tolerance of +/- 5ppm, fragment ion tolerance of
0.3 Da and FDR calculated using randomized database search. From each quantified SILAC
labeling, three isotope ratios were calculated in each independent experiment. To ensure that
56
each independent set provided similar results, ratios from identical treatments and the same cell
lines between each independent set were compared with a Pearson’s Correlation Coefficient (r).
Briefly, the ratios of an identical protein were matched from two independent sets for the same
cell type, 1c1c7 or c12, exposed to the same treatment and undetected proteins in both
independent sets were removed prior to correlation analysis. Data from the matched
independent sets were log-transformed and checked with a histogram and QQ plot prior to
correlation to ensure comparison of normal distributions. Pearson’s Correlation Coefficients
were ≥ 0.5 in comparing each identical treatment between the 4 independent samples sets.
Subsequently, data were combined and averaged across all independent sets to obtain triplicate
for each treatment and each cell type. The triplicate ratios were averaged to obtain mean fold
changes for all detected proteins and mean |fold changes| ≥ 2 were considered significant.
Significant mean fold changes of identical proteins from differing treatments were matched and,
subsequently, compared with a Student’s t-test with the Benjamini-Hochberg multiple
comparison correction to assess type I error. Adjusted p-values ≤ 0.05 were considered
significant. Python version 2.7.6 was used for all data processing and R version 3.1.2 was used
for all statistical analyses.
PROTEIN CONCENTRATION DETERMINATION
Protein concentrations for samples used for the SILAC experiments were determined
using PierceTM BCA protein assay kit (Thermo Scientific, Waltham, MA). Protein concentrations
for samples used for all other experiments were determined using Bio-Rad (Hercules, CA)
Bradford assay kit and BSA standards.178

57
Figure 3. Experimental design for SILAC-based proteomic analysis of TCDD-induced
changes to the mitochondrial proteome in mouse hepatoma cell.

58
CHAPTER 4. RESULTS
59
CHARACTERIZATION OF MITOCHONDRIAL AHR IMPORT
Identification of a Mitochondrial Compartment of AHR Location
To examine the sub-compartmental localization of AHR within the mitochondria,
protease protection and digitonin extraction assays were performed. Mitochondria from
hepa1c1c7 cells were treated with trypsin in the absence and presence of increasing
concentrations of digitonin, and Western blot analysis was performed to detect proteins that
remained in mitochondrial pellets (Figure 4-1). In the presence of trypsin alone, the OM protein
TOM20 was lost from the mitochondrial pellet, while AHR remained, suggesting that the AHR is
not bound to the mitochondria nonspecifically. Upon the addition of increasing amounts of
digitonin, the AHR was lost from the pellet in a similar pattern as the IMS marker, SMAC,
suggesting that most of the AHR is found within this compartment.
To further explore the mitochondrial localization of the AHR, hepa1c1c7 cells were
treated with DMSO (vehicle control) or TCDD (10 nM). In the presence of DMSO, the AHR was
localized to the IMS, confirming the results from naïve cells (Figure 4-2). TCDD exposure for 6
h decreased the level of AHR within the IMS compared to the DMSO-treated controls,
suggesting that AHR ligands can impact the mitochondrial localization of the receptor. Similar
results were observed following 24 h of TCDD exposure (Figure 4-2). In addition, the overall
level of AHR within the mitochondria was also decreased by TCDD exposure (compare lane 1
and 4, Figure 4-2). This corresponded to the decreased level of cellular AHR isolated from the
same cells exposed to TCDD (compare lane 7 and 8, Figure 4-2)). Thus, TCDD exposure
induced both cytosolic and mitochondrial proteolysis of the AHR.
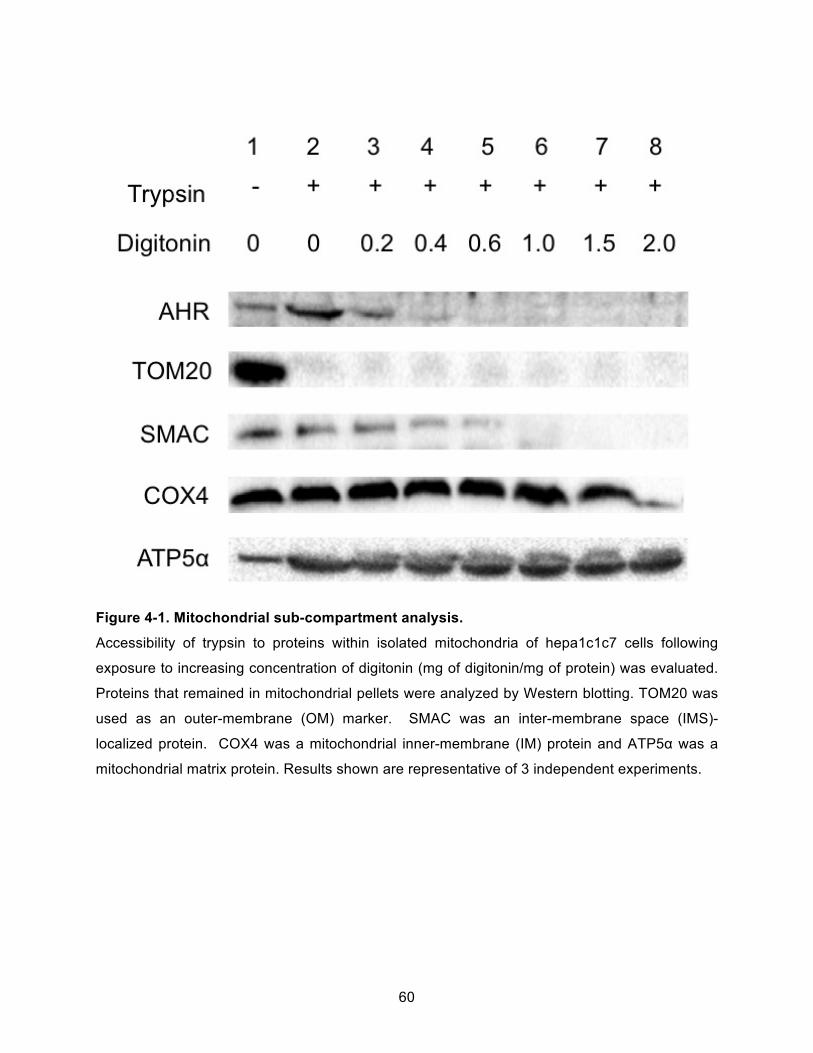
60
Figure 4-1. Mitochondrial sub-compartment analysis.
Accessibility of trypsin to proteins within isolated mitochondria of hepa1c1c7 cells following
exposure to increasing concentration of digitonin (mg of digitonin/mg of protein) was evaluated.
Proteins that remained in mitochondrial pellets were analyzed by Western blotting. TOM20 was
used as an outer-membrane (OM) marker. SMAC was an inter-membrane space (IMS)-
localized protein. COX4 was a mitochondrial inner-membrane (IM) protein and ATP5α was a
mitochondrial matrix protein. Results shown are representative of 3 independent experiments.
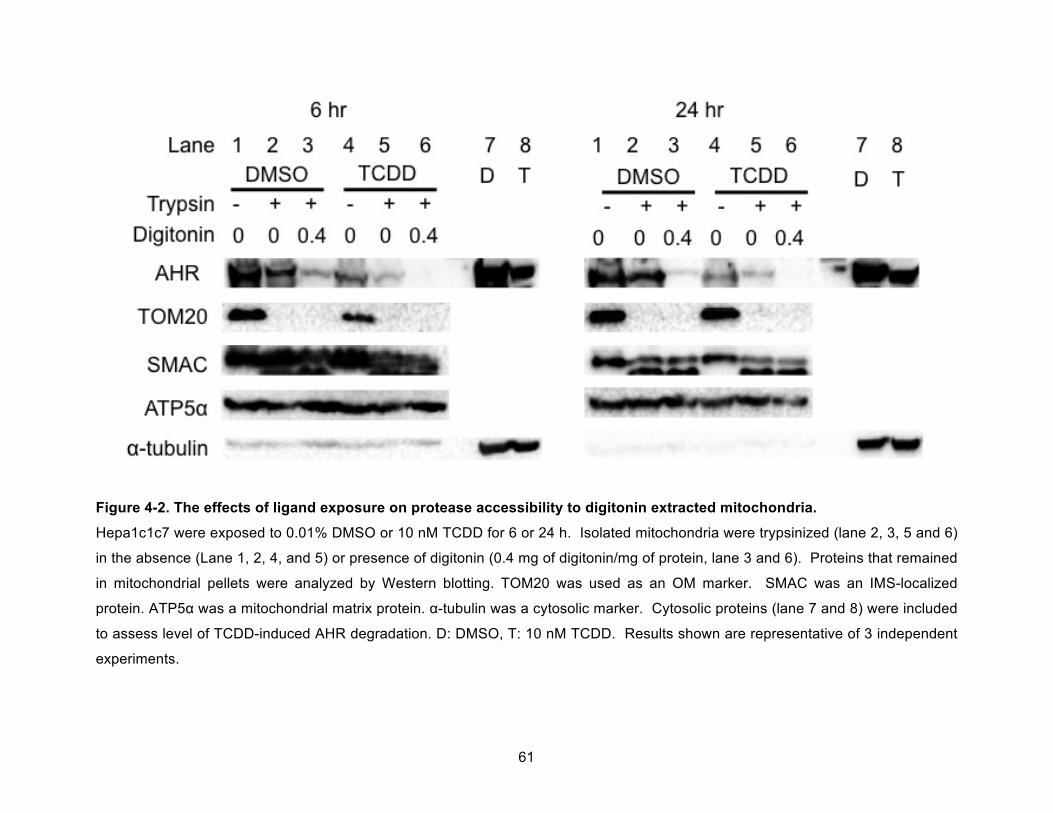
61
Figure 4-2. The effects of ligand exposure on protease accessibility to digitonin extracted mitochondria.
Hepa1c1c7 were exposed to 0.01% DMSO or 10 nM TCDD for 6 or 24 h. Isolated mitochondria were trypsinized (lane 2, 3, 5 and 6)
in the absence (Lane 1, 2, 4, and 5) or presence of digitonin (0.4 mg of digitonin/mg of protein, lane 3 and 6). Proteins that remained
in mitochondrial pellets were analyzed by Western blotting. TOM20 was used as an OM marker. SMAC was an IMS-localized
protein. ATP5α was a mitochondrial matrix protein. α-tubulin was a cytosolic marker. Cytosolic proteins (lane 7 and 8) were included
to assess level of TCDD-induced AHR degradation. D: DMSO, T: 10 nM TCDD. Results shown are representative of 3 independent
experiments.
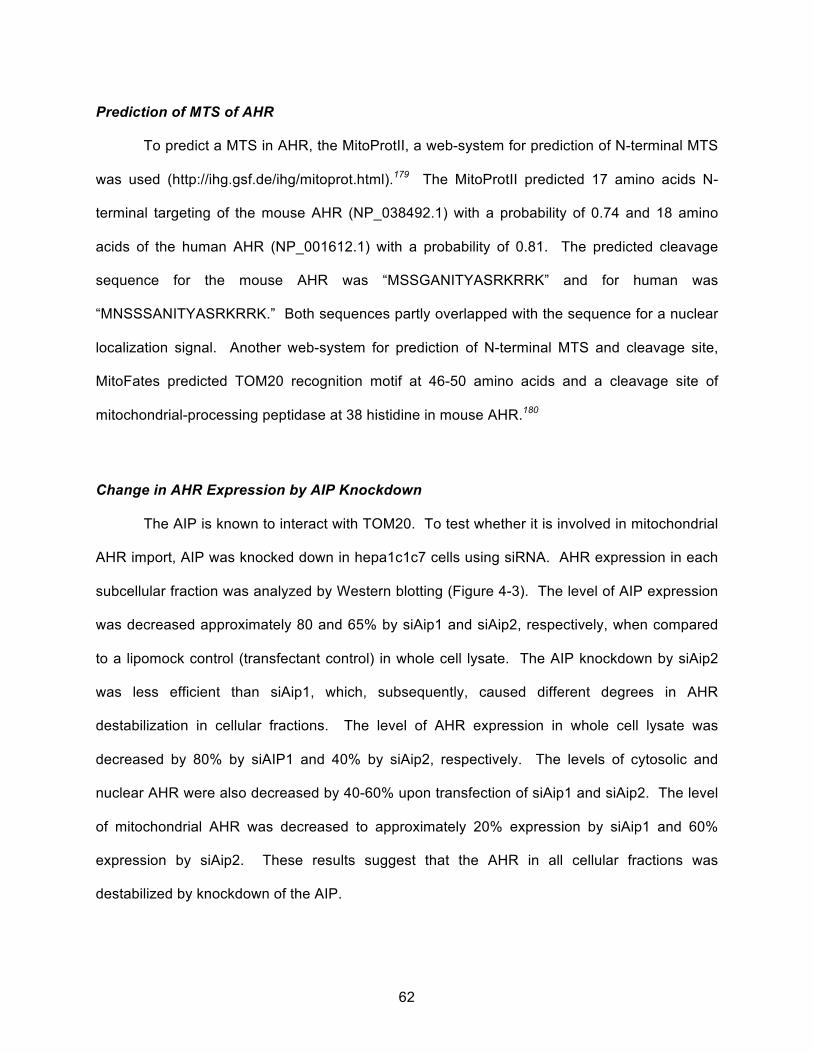
62
Prediction of MTS of AHR
To predict a MTS in AHR, the MitoProtII, a web-system for prediction of N-terminal MTS
was used (http://ihg.gsf.de/ihg/mitoprot.html).179 The MitoProtII predicted 17 amino acids N-
terminal targeting of the mouse AHR (NP_038492.1) with a probability of 0.74 and 18 amino
acids of the human AHR (NP_001612.1) with a probability of 0.81. The predicted cleavage
sequence for the mouse AHR was “MSSGANITYASRKRRK” and for human was
“MNSSSANITYASRKRRK.” Both sequences partly overlapped with the sequence for a nuclear
localization signal. Another web-system for prediction of N-terminal MTS and cleavage site,
MitoFates predicted TOM20 recognition motif at 46-50 amino acids and a cleavage site of
mitochondrial-processing peptidase at 38 histidine in mouse AHR.180
Change in AHR Expression by AIP Knockdown
The AIP is known to interact with TOM20. To test whether it is involved in mitochondrial
AHR import, AIP was knocked down in hepa1c1c7 cells using siRNA. AHR expression in each
subcellular fraction was analyzed by Western blotting (Figure 4-3). The level of AIP expression
was decreased approximately 80 and 65% by siAip1 and siAip2, respectively, when compared
to a lipomock control (transfectant control) in whole cell lysate. The AIP knockdown by siAip2
was less efficient than siAip1, which, subsequently, caused different degrees in AHR
destabilization in cellular fractions. The level of AHR expression in whole cell lysate was
decreased by 80% by siAIP1 and 40% by siAip2, respectively. The levels of cytosolic and
nuclear AHR were also decreased by 40-60% upon transfection of siAip1 and siAip2. The level
of mitochondrial AHR was decreased to approximately 20% expression by siAip1 and 60%
expression by siAip2. These results suggest that the AHR in all cellular fractions was
destabilized by knockdown of the AIP.
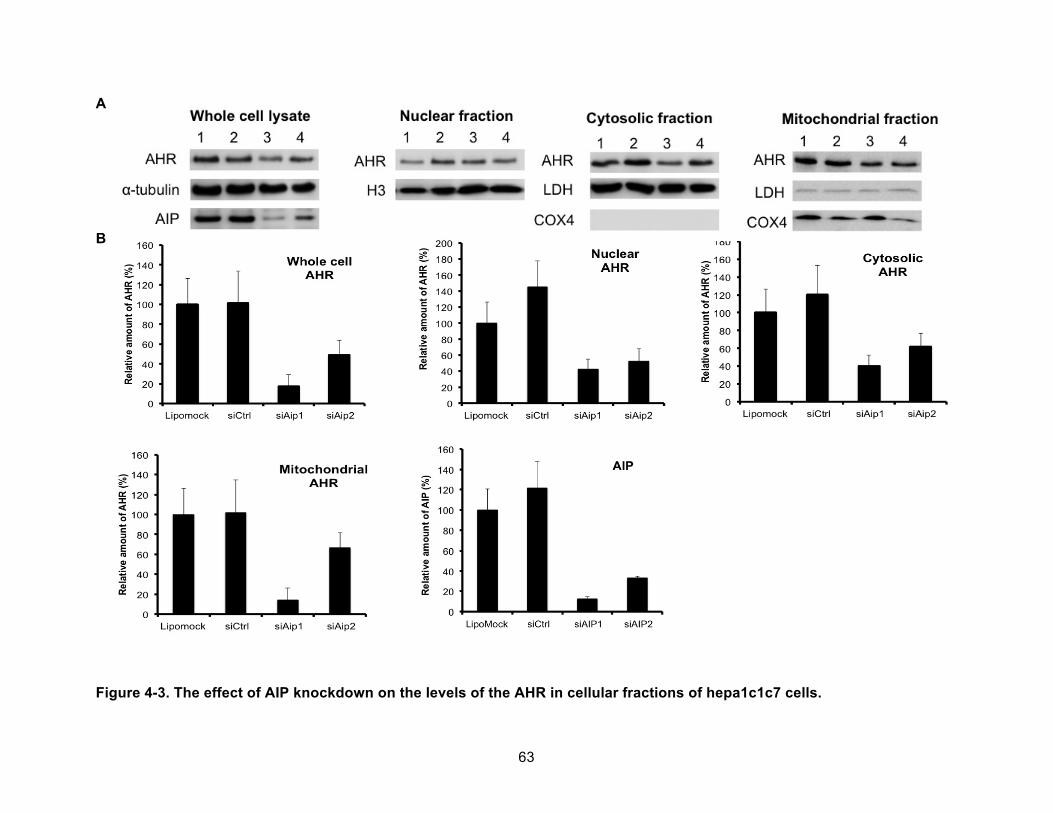
63
A
B
Figure 4-3. The effect of AIP knockdown on the levels of the AHR in cellular fractions of hepa1c1c7 cells.
64
Figure 4-3. (cont’d) siRNA was used to knockdown AIP in Hepa1c1c7 cells. Western blot analysis for AIP and AHR expression was
performed from whole cell lysate, and nuclear, cytosolic, and mitochondrial fractions. α-tubulin was used as a loading control for the
whole cell lysate, histone H3 (H3) was a loading control for the nuclear fraction, lactate dehydrogenase (LDH) was a loading control
for the cytosolic fraction, and cytochrome c oxidase subunit IV (COX4) was a loading control for the mitochondrial fraction. (A)
Results shown are representative of 3 independent experiments. Lane 1: lipofectamine treatment (Lipomock), lane 2: 10 nM
Silencer® Select Negative Control #1 siRNA (siCtrl), lane 3: 10 nM siRNA1 for AIP (siAIP1), lane4: 10 nM siRNA2 for AIP (siAIP2).
(B) Densitometry was determined with a Fuji Image analyzer. The levels of expressions of AIP and AHR protein were normalized to
each loading control. The normalized protein expression levels were compared with each other by re-normalization with the protein
expression from which cells were affected by lipofectamine only (Lipomock). The bars represent mean ± the standard errors (n=3).
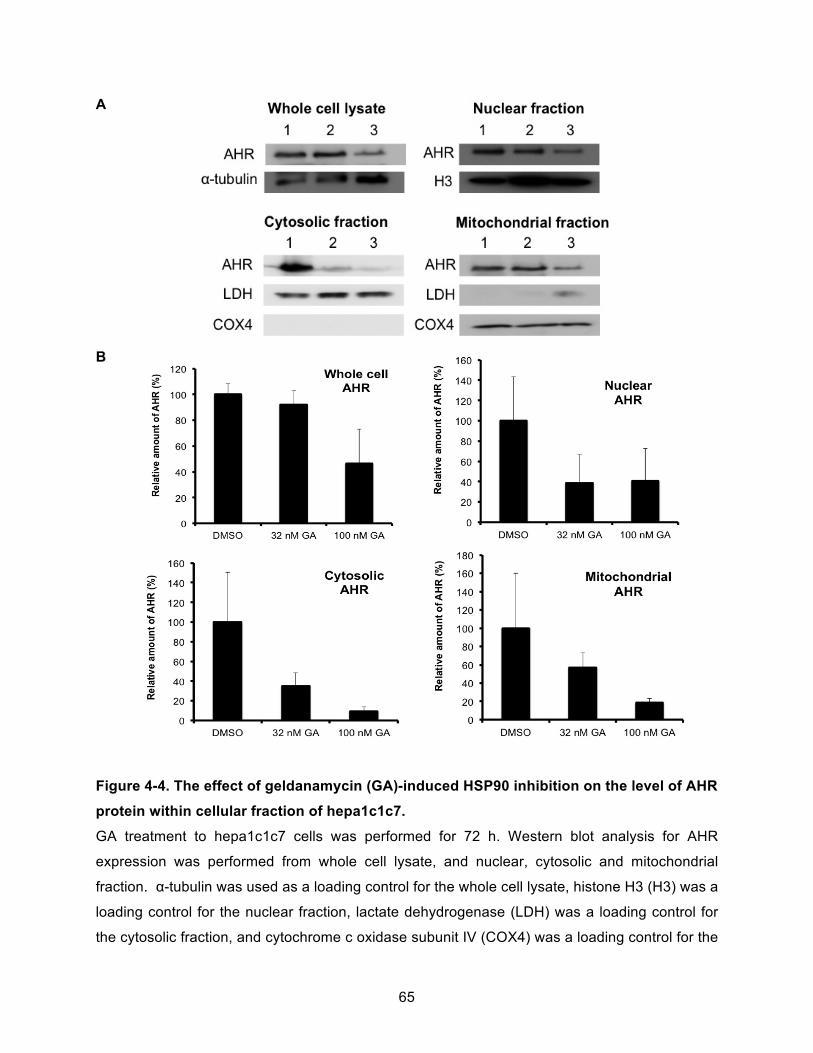
65
A
B
Figure 4-4. The effect of geldanamycin (GA)-induced HSP90 inhibition on the level of AHR
protein within cellular fraction of hepa1c1c7.
GA treatment to hepa1c1c7 cells was performed for 72 h. Western blot analysis for AHR
expression was performed from whole cell lysate, and nuclear, cytosolic and mitochondrial
fraction. α-tubulin was used as a loading control for the whole cell lysate, histone H3 (H3) was a
loading control for the nuclear fraction, lactate dehydrogenase (LDH) was a loading control for
the cytosolic fraction, and cytochrome c oxidase subunit IV (COX4) was a loading control for the
66
Figure 4-4. (cont’d) mitochondrial fractions. (A) Results shown are representative of 3
independent experiments. Lane 1: DMSO treated (DMSO), lane 2: 32 nM GA treated, lane 3:
100 nM GA treated. (B) Densitometry was determined with a Fuji Image analyzer. AIP and
AHR protein expression was normalized to each loading control. The normalized protein
expression levels were compared each other by re-normalization with the protein expression
from which cells were affected by DMSO. The bars represent mean ± the standard errors (n=3).
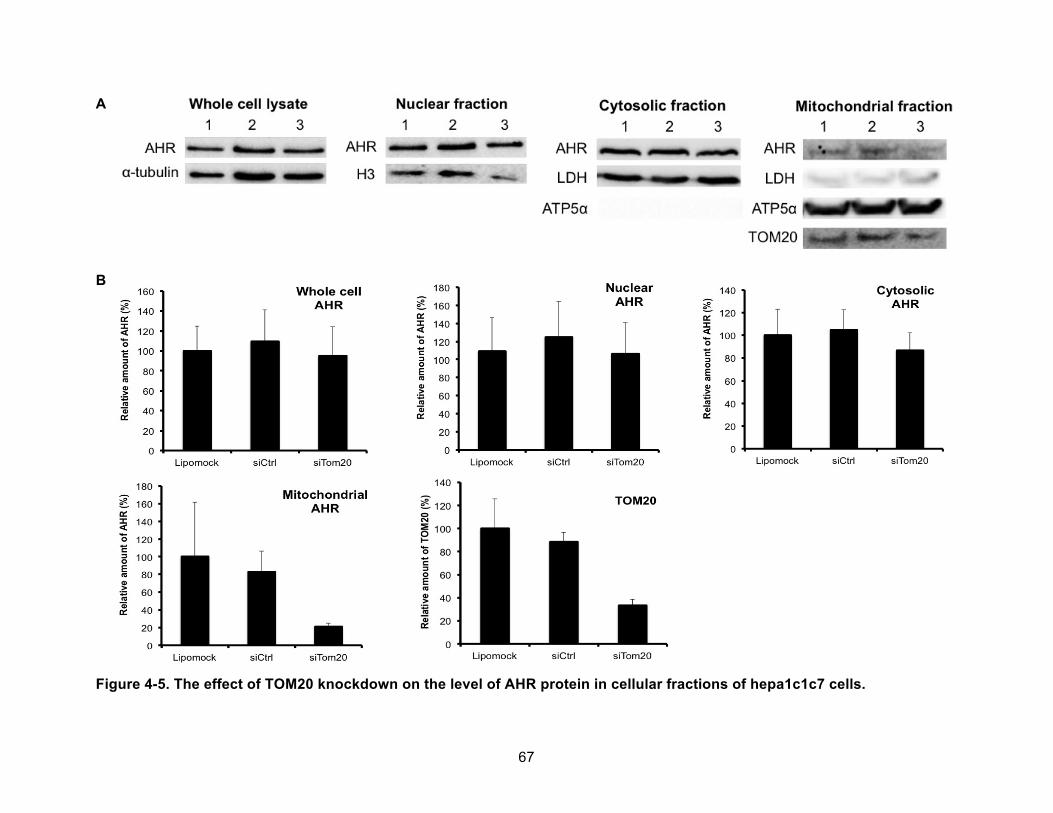
67
A
B
Figure 4-5. The effect of TOM20 knockdown on the level of AHR protein in cellular fractions of hepa1c1c7 cells.
68
Figure 4-5. (cont’d) siRNA was used to knockdown TOM20 in Hepa1c1c7 cells. Western blot analysis for TOM20 and AHR
expression was performed from whole cell lysate, and nuclear, cytosolic and mitochondrial fractions. α-tubulin was used as a loading
control for the whole cell lysate, histone H3 (H3) was a loading control for the nuclear fraction, lactate dehydrogenase (LDH) was a
loading control for the cytosolic fraction and ATP5α was a loading control for the mitochondrial fraction. (A) Results shown are
representative of 3 independent experiments. Lane 1: lipofectamine treatment (Lipomock), lane 2: 10 nM nontargeting siRNA (siCtrl),
lane 3: 10 nM siRNA for TOM20 (siTOM20). (B) Densitometry was determined with a Fuji Image analyzer. The expressions of
TOM20 and AHR protein were normalized to each loading control. The normalized protein expression levels were compared each
other by re-normalization with the protein expression from which cells were affected by lipofectamine only (Lipomock). The bars
represent mean ± the standard errors (n=3).
69
Change in AHR Expression by HSP90 Activity Inhibition
HSP90 is involved in the trafficking of proteins into the mitochondria, especially those
that lack a classic MTS. To test whether HSP90, one of the cytosolic co-chaperone of AHR, is
involved in AHR translocation into the mitochondria, the ATPase activity of HSP90 in hepa1c1c7
cells was inhibited by geldanamycin. The level of AHR expression in each cellular fraction
except the whole cell lysate was decreased with 40~60% expression by 32 nM geldanamycin
treatment compared to that of DMSO control. 90% of AHR expression was observed in a whole
cell lysate treated with 32 nM geldanamycin compared to that in cells treated with DMSO.
However, Inhibition of HSP90 ATPase by 100 nM geldanamycin decreased the level of AHR
expression by 50% in whole cell lysate compared to that of DMSO control. The levels of
cytosolic and mitochondrial AHR protein were also decreased by 100 nM geldanamycin,
showing 9% AHR expression in cytosol and 18% in mitochondria compared to that of DMSO
control. However, the nuclear AHR expression of cells treated with 100 nM geldanamycin
(41%) was the same as that of 30 nM geldanamycin (38%) (Figure 4-4).
Change in AHR Expression by TOM20 Knockdown
To test whether TOM20 is involved in import of the AHR into the mitochondria, it was
knocked down in hepa1c1c7 cells using siRNA. Following knockdown, the level of expression
of AHR in each subcellular fraction was examined by Western blot analysis. The level of
TOM20 expression in the mitochondria was decreased by approximately 70% in the siTom20-
transfected cells compared to a lipomock control (transfectant control) (Figure 4-5). The amount
of AHR found within the mitochondria was also decreased by approximately 70% following
siTOM20 transfection compared to a lipomock control (Figure 4-5B). In contrast, there was no
change in the level of AHR in the cytosol or nuclear fractions or whole cell lysate, following
70
knockdown of TOM20. These results suggest that TOM20 is involved in mitochondrial AHR
localization.
AHR-MEDIATED TCDD-INDUCED MITOCHONDRIAL DYSFUNCTION
Cellular Respiration in Mouse Hepatoma Cells under TCDD Exposure
The results presented suggest that a fraction of intracellular AHR can be found within the
mitochondria and probably within the IMS. Previous published research has demonstrated that
AHR ligands can impact mitochondrial function. To further explore the role of the AHR and AHR
ligands in mitochondrial homeostasis, the oxygen consumption rates (OCRs) of two mouse
hepatoma cell lines, 1c1c7 (AHR-expressing) and c12 (AHR-deficient), under TCDD exposure
were measured. The two cell lines were treated with TCDD (10 or 30 nM) or DMSO (0.01%,
vehicle control), and OCR was monitored in the presence of ATP synthase inhibitor, oligomycin
A (A), and ETC inhibitors, FCCP (B) and antimycin A (C) (Figure 4-6A and 7A). The key
parameters of mitochondrial function, basal respiration, maximal respiration, spare respiratory
capacity, and respiratory control ratio were calculated as described in table 4-1. Hepa1c1c7
displayed a TCDD-dose-dependent decrease in basal and maximal respiration that reached
significance at 30 nM (Figure 4-6). The hepac12 cells displayed no difference in basal
respiration rates following TCDD exposure (Figure 4-7). The hepac12 cells exposed to 10 nM
or 30 nM TCDD showed a slight increase in maximal respiration rates following TCDD
exposure, but these were not significant when compared to that of the DMSO-treated cells.
This induced a significant increase in respiratory control ratio at 30 nM TCDD exposure to
hepac12 cells (Figure 4-7). There was no significant difference in spare respiratory capacity in
either cell line exposed to TCDD (data not shown).
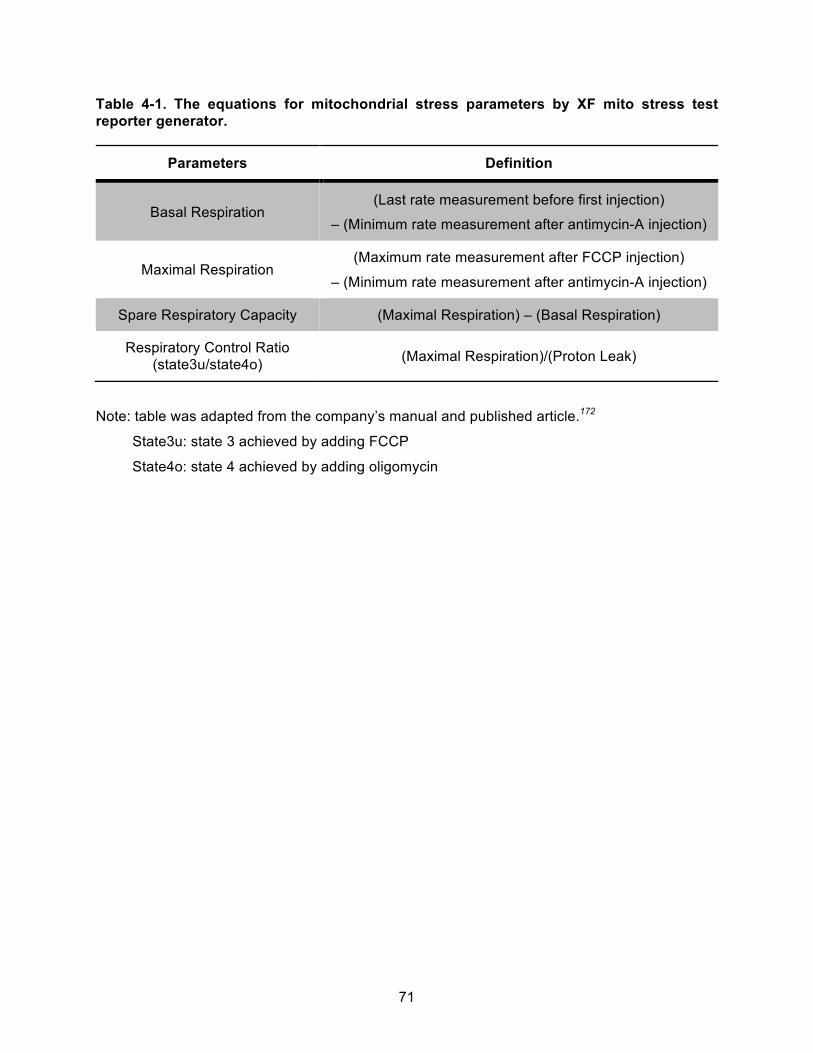
71
Table 4-1. The equations for mitochondrial stress parameters by XF mito stress test reporter generator.
Parameters Definition
Basal Respiration (Last rate measurement before first injection)
– (Minimum rate measurement after antimycin-A injection)
Maximal Respiration (Maximum rate measurement after FCCP injection)
– (Minimum rate measurement after antimycin-A injection)
Spare Respiratory Capacity (Maximal Respiration) – (Basal Respiration)
Respiratory Control Ratio (state3u/state4o) (Maximal Respiration)/(Proton Leak)
Note: table was adapted from the company’s manual and published article.172
State3u: state 3 achieved by adding FCCP
State4o: state 4 achieved by adding oligomycin
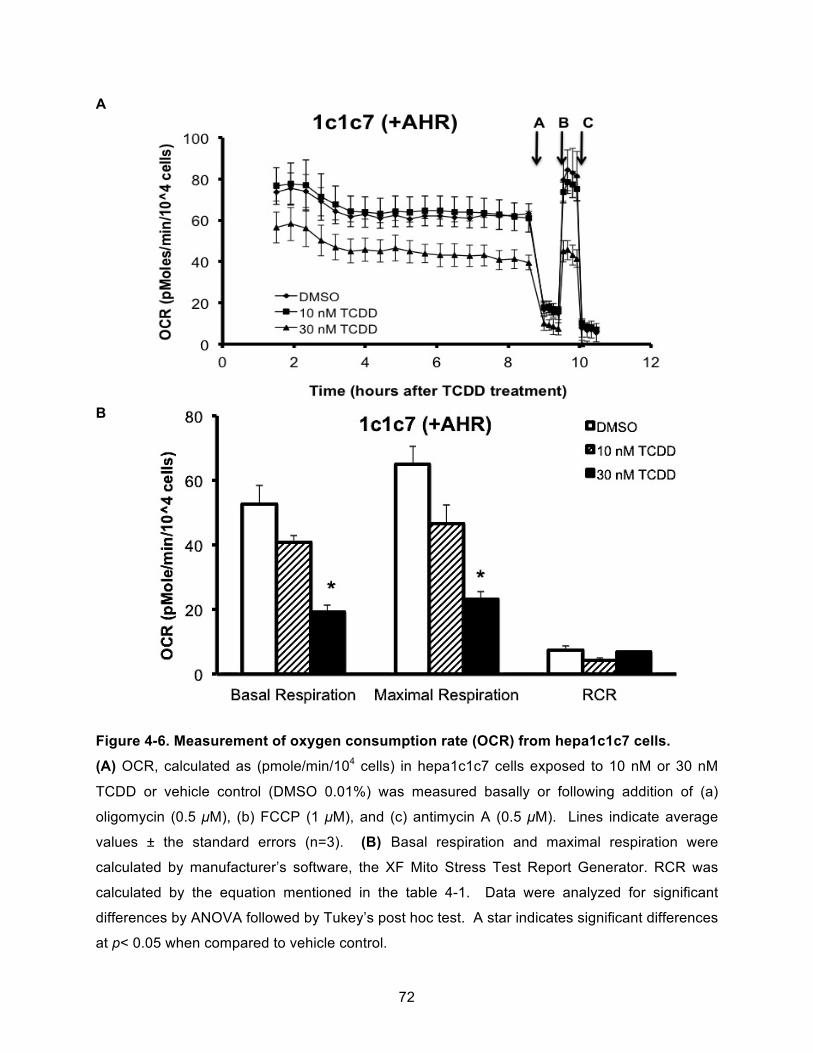
72
A
B
Figure 4-6. Measurement of oxygen consumption rate (OCR) from hepa1c1c7 cells.
(A) OCR, calculated as (pmole/min/104 cells) in hepa1c1c7 cells exposed to 10 nM or 30 nM
TCDD or vehicle control (DMSO 0.01%) was measured basally or following addition of (a)
oligomycin (0.5 µM), (b) FCCP (1 µM), and (c) antimycin A (0.5 µM). Lines indicate average
values ± the standard errors (n=3). (B) Basal respiration and maximal respiration were
calculated by manufacturer’s software, the XF Mito Stress Test Report Generator. RCR was
calculated by the equation mentioned in the table 4-1. Data were analyzed for significant
differences by ANOVA followed by Tukey’s post hoc test. A star indicates significant differences
at p< 0.05 when compared to vehicle control.
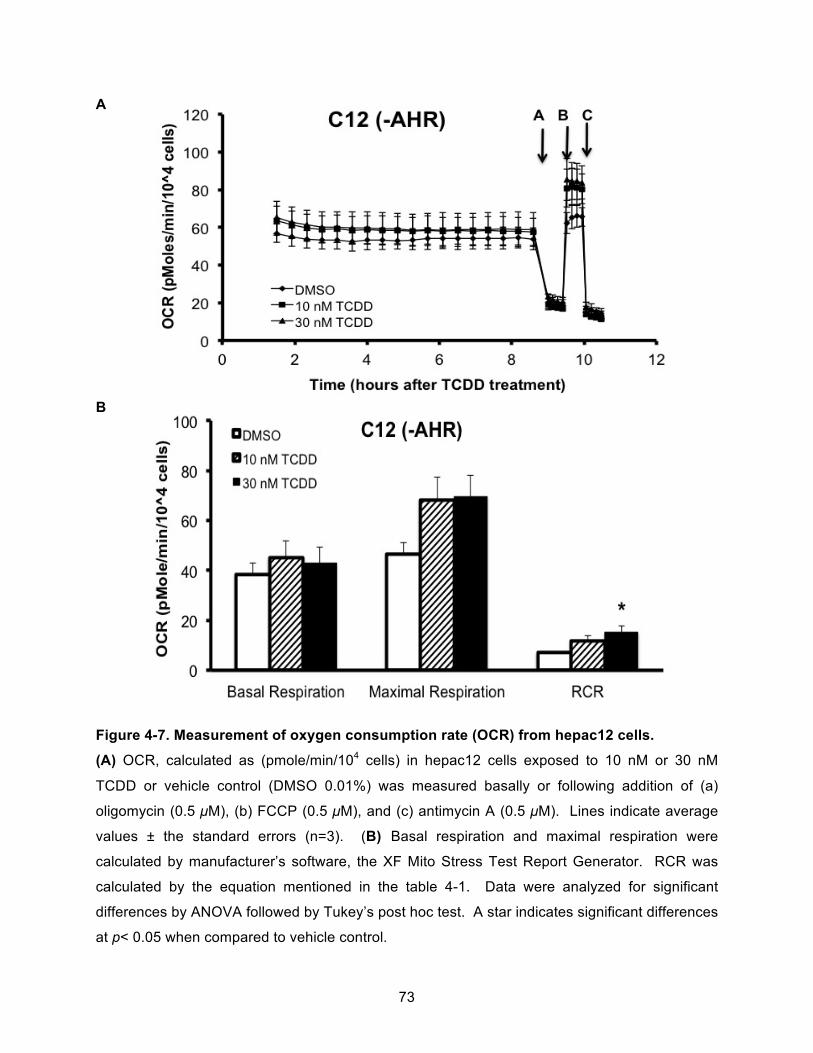
73
A
B
Figure 4-7. Measurement of oxygen consumption rate (OCR) from hepac12 cells.
(A) OCR, calculated as (pmole/min/104 cells) in hepac12 cells exposed to 10 nM or 30 nM
TCDD or vehicle control (DMSO 0.01%) was measured basally or following addition of (a)
oligomycin (0.5 µM), (b) FCCP (0.5 µM), and (c) antimycin A (0.5 µM). Lines indicate average
values ± the standard errors (n=3). (B) Basal respiration and maximal respiration were
calculated by manufacturer’s software, the XF Mito Stress Test Report Generator. RCR was
calculated by the equation mentioned in the table 4-1. Data were analyzed for significant
differences by ANOVA followed by Tukey’s post hoc test. A star indicates significant differences
at p< 0.05 when compared to vehicle control.
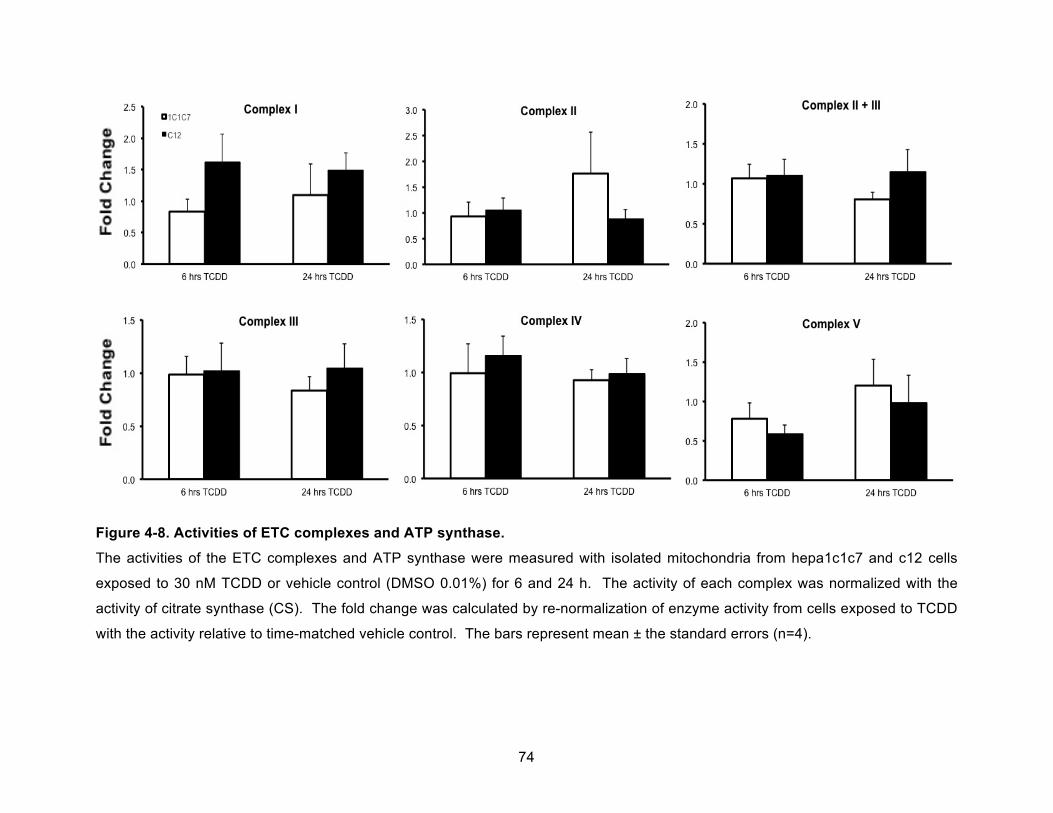
74
Figure 4-8. Activities of ETC complexes and ATP synthase.
The activities of the ETC complexes and ATP synthase were measured with isolated mitochondria from hepa1c1c7 and c12 cells
exposed to 30 nM TCDD or vehicle control (DMSO 0.01%) for 6 and 24 h. The activity of each complex was normalized with the
activity of citrate synthase (CS). The fold change was calculated by re-normalization of enzyme activity from cells exposed to TCDD
with the activity relative to time-matched vehicle control. The bars represent mean ± the standard errors (n=4).
75
Change of OXPHOS Activity in Mouse Hepa Cells upon TCDD Exposure
Change in TCDD-induced enzyme activity was calculated as a fold change via
comparison to the activity relative to time-matched vehicle control (Figure 4-8). The enzyme
activity of each ETC complex and ATP synthase was normalized with citrate synthase activity,
which represents an assessment of mitochondrial amount and integrity of each sample. TCDD
exposure did not change in the activity of complex I from hepa1c1c7 cells, but caused a change
in the activity of complex I from hepac12 cells showing over 1.5 fold changes for both 6 h (fold
change=1.6) and 24 h (fold change=1.5) though these values were not significant. TCDD
exposure for 24 h to hepa1c1c7 cells caused an approximate 2-fold increase in complex II
activity. TCDD exposure for 6 h caused a slight decrease in complex V activity in both cells and
this decrease was recovered at 24 h exposures. However, the changes in TCDD-induced
enzyme activity mentioned above were not significant. TCDD did not cause any changes in
activities of the complex III, (II + III), and IV.
Identification of Proteins Differently Expressed upon TCDD Exposure
Previous reports and the OCR and ETC complex results presented above suggest that
the AHR can impact mitochondrial function directly. To determine the role of the AHR in
modulating mitochondrial function, a stable isotope labeling by amino acids in cell culture
(SILAC) experiment was performed. SILAC-labeled hepa1c1c7 cells and c12 cells that had
been exposed to DMSO (0.01%, vehicle control) or TCDD (10 nM) for 72 h were fractionated to
isolate mitochondria. Proteins from these purified mitochondria were resolved by 4-12%
gradient SDS-PAGE and MS analysis was performed on gel slices as described in the Materials
and methods. MaxQuant analysis identified approximately 2,500 proteins. Comparison
between hepa1c1c7 TCDD/1c1c7 DMSO (C7T/C7D) and C12 TCDD/C12 DMSO (C12T/C12D)
identified about 1,200 proteins. Of these, 164 proteins were differentially regulated (Benjamini-
76
Hochberg corrected p ≤ 0.05). 95 were established mitochondrial proteins, 69 were previously
assigned to different organelles (Figure 4-9 and table A-1 and A-2). This ratio of mitochondrial
proteins versus other organelles’ is similar to previous published reports looking at the yeast
mitochondrial proteome.181 The identification of these proteins from other cellular compartments
was attributed to various reasons, including misrepresentation due to overexpression,
homologous proteins from different organelles, dual localization, and contamination of the
mitochondrial preparation. To further prioritize the data, proteins with a mean fold change equal
to or above 2 in hepa1c1c7 cells were considered (|fold change|≥2). 17 proteins met this
criterion for the comparison between 1c1c7TCDD/1c1c7DMSO (C7T/C7D) and
c12TCDD/c12DMSO (C12T/C12D) (Table 4-2). Of these differentially expressed proteins, 9
proteins were upregulated and 8 proteins in hepa1c1c7 were downregulated. The upregulated
proteins included those involved in metabolic pathways (e.g., H6PD, CPOX and CYB5) and the
downregulated proteins included those involved in mitochondrial biogenesis (e.g., WARS2 and
MRPS28).
Validation of Proteomic Results
To verify the SILAC-based proteomic quantification, 6 proteins were measured by
Western blot analysis (Figure 4-10). Four upregulated proteins (i.e., H6PD, CPOX and CYB5,
ENTPD2), which were identified by (|fold change|≥2) cut-offs, were tested (Table 4-2). In
addition, two other proteins were assessed (ACOT2and COX4I1). These proteins were chosen
because of their identification in mRNA expression studies and for their potential role in TCDD-
induced changes in mitochondrial function (COX4I1) and dyslipidemia (ACOT2).164
Density of each western signal was measured and normalized to the density of the
control, VDAC1. Western blot analysis was performed three times independently. The density
measured for H6PD, CPOX, CYB5, COX4I1 and ACOT2 expression corresponded to the
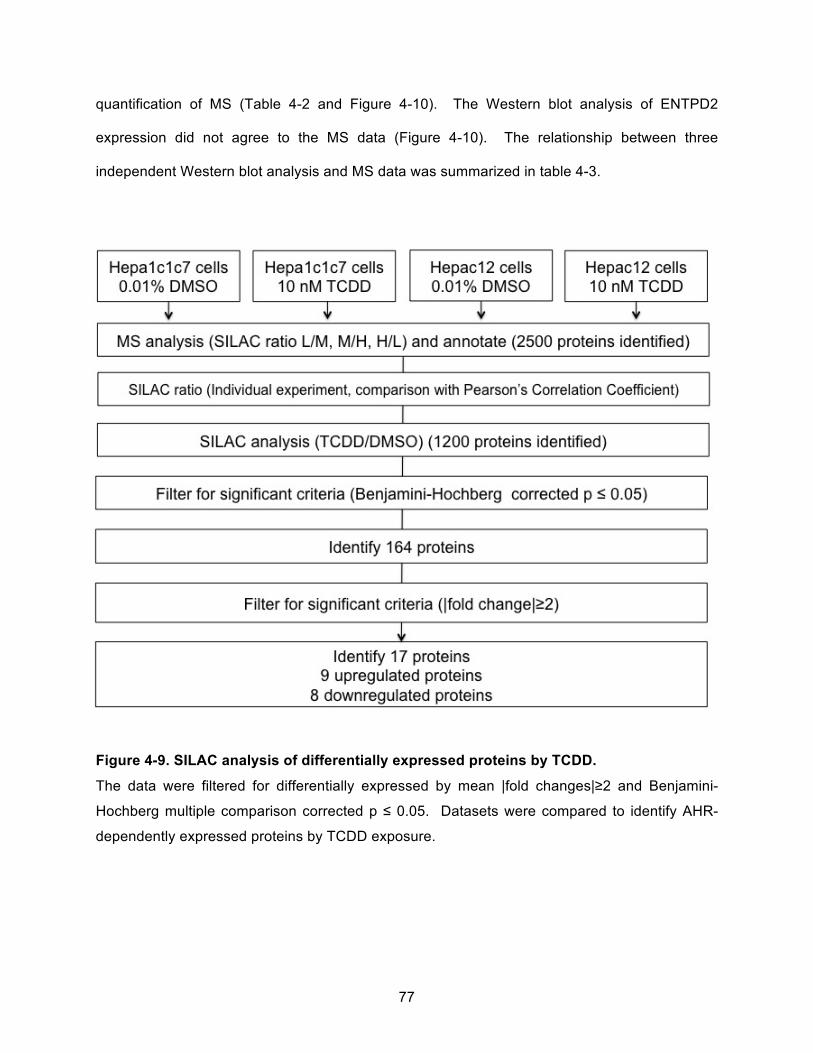
77
quantification of MS (Table 4-2 and Figure 4-10). The Western blot analysis of ENTPD2
expression did not agree to the MS data (Figure 4-10). The relationship between three
independent Western blot analysis and MS data was summarized in table 4-3.
Figure 4-9. SILAC analysis of differentially expressed proteins by TCDD.
The data were filtered for differentially expressed by mean |fold changes|≥2 and Benjamini-
Hochberg multiple comparison corrected p ≤ 0.05. Datasets were compared to identify AHR-
dependently expressed proteins by TCDD exposure.
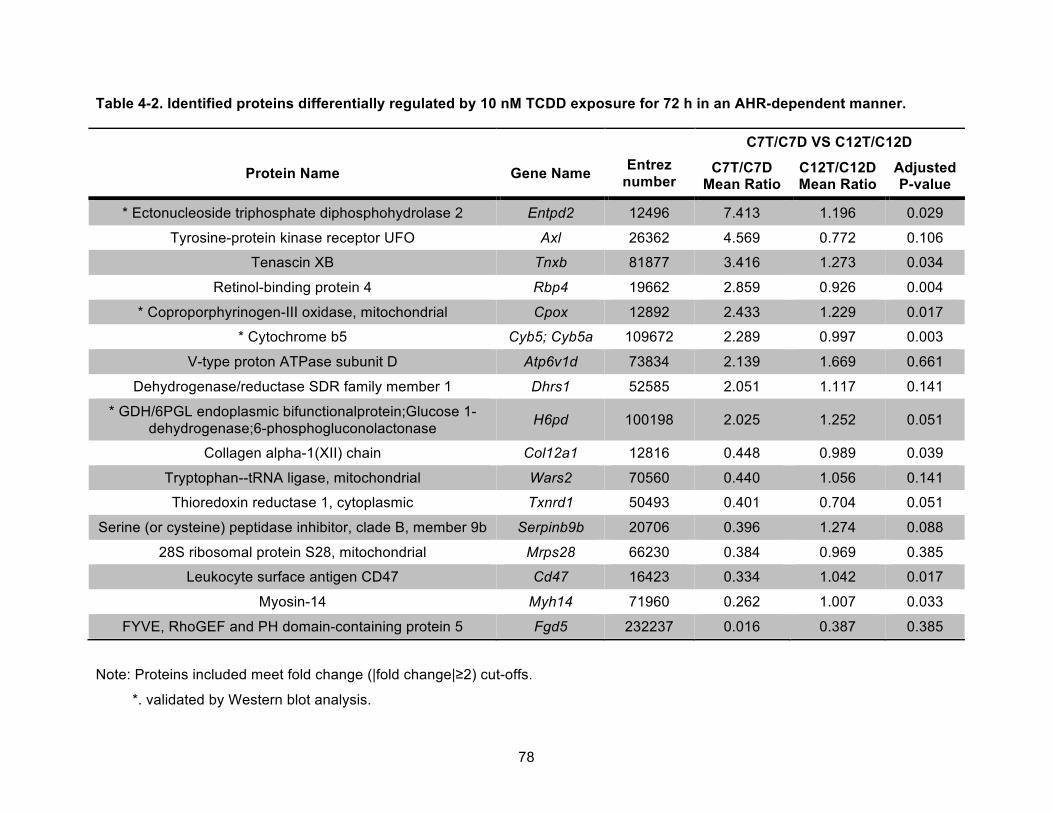
78
Table 4-2. Identified proteins differentially regulated by 10 nM TCDD exposure for 72 h in an AHR-dependent manner.
Protein Name
Gene Name
Entrez
number
C7T/C7D VS C12T/C12D
C7T/C7D Mean Ratio
C12T/C12D Mean Ratio
Adjusted P-value
* Ectonucleoside triphosphate diphosphohydrolase 2 Entpd2 12496 7.413 1.196 0.029
Tyrosine-protein kinase receptor UFO Axl 26362 4.569 0.772 0.106
Tenascin XB Tnxb 81877 3.416 1.273 0.034
Retinol-binding protein 4 Rbp4 19662 2.859 0.926 0.004
* Coproporphyrinogen-III oxidase, mitochondrial Cpox 12892 2.433 1.229 0.017
* Cytochrome b5 Cyb5; Cyb5a 109672 2.289 0.997 0.003
V-type proton ATPase subunit D Atp6v1d 73834 2.139 1.669 0.661
Dehydrogenase/reductase SDR family member 1 Dhrs1 52585 2.051 1.117 0.141
* GDH/6PGL endoplasmic bifunctionalprotein;Glucose 1-dehydrogenase;6-phosphogluconolactonase H6pd 100198 2.025 1.252 0.051
Collagen alpha-1(XII) chain Col12a1 12816 0.448 0.989 0.039
Tryptophan--tRNA ligase, mitochondrial Wars2 70560 0.440 1.056 0.141
Thioredoxin reductase 1, cytoplasmic Txnrd1 50493 0.401 0.704 0.051
Serine (or cysteine) peptidase inhibitor, clade B, member 9b Serpinb9b 20706 0.396 1.274 0.088
28S ribosomal protein S28, mitochondrial Mrps28 66230 0.384 0.969 0.385
Leukocyte surface antigen CD47 Cd47 16423 0.334 1.042 0.017
Myosin-14 Myh14 71960 0.262 1.007 0.033
FYVE, RhoGEF and PH domain-containing protein 5 Fgd5 232237 0.016 0.387 0.385
Note: Proteins included meet fold change (|fold change|≥2) cut-offs.
*. validated by Western blot analysis.
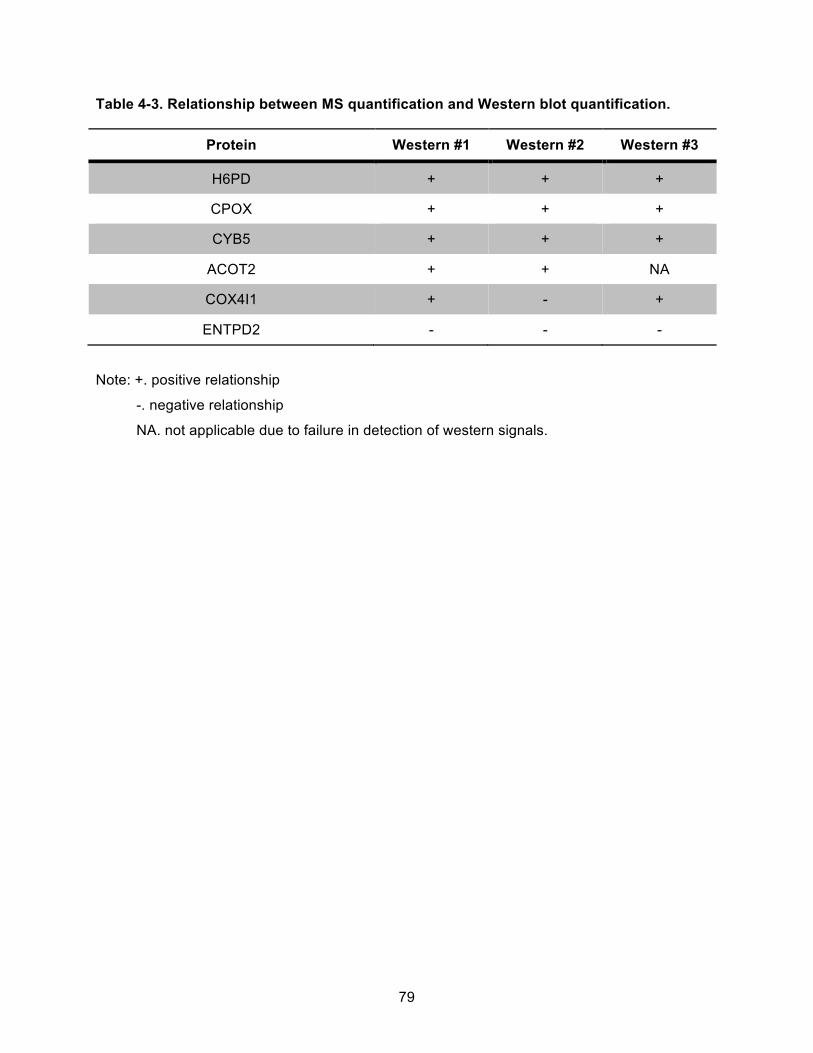
79
Table 4-3. Relationship between MS quantification and Western blot quantification.
Protein Western #1 Western #2 Western #3
H6PD + + +
CPOX + + +
CYB5 + + +
ACOT2 + + NA
COX4I1 + - +
ENTPD2 - - -
Note: +. positive relationship
-. negative relationship
NA. not applicable due to failure in detection of western signals.
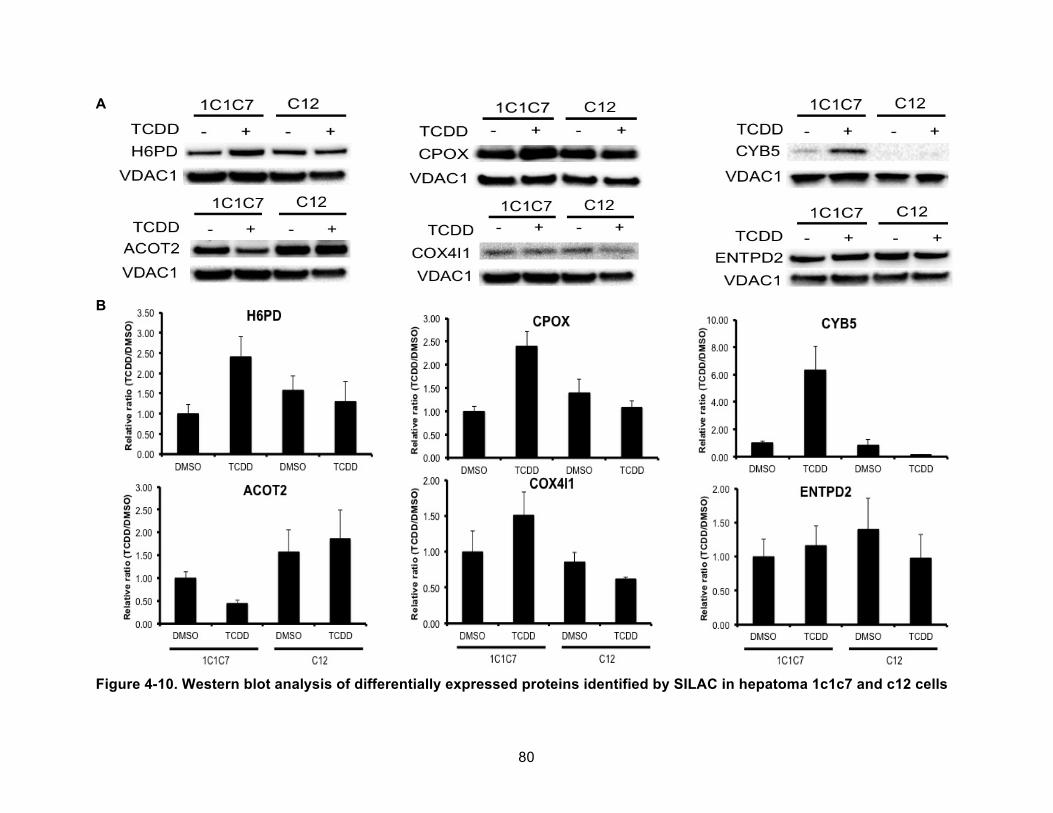
80
A
B
Figure 4-10. Western blot analysis of differentially expressed proteins identified by SILAC in hepatoma 1c1c7 and c12 cells
81
Figure 4-10 (cont’d) exposed to DMSO or TCDD.
Western blot was performed on mitochondrial fractions prepared from the two cell lines following exposure to DMSO (0.01%) or
TCDD (10 nM). VDAC1 was used as a loading control. (A) Results shown are representative of 3 independent experiments. (B)
Densitometry was determined with a Bio-Rad ChemiDoc MP SystemImage analyzer. Each protein expression was normalized to the
loading control. The normalized protein expression levels were compared with each other by re-normalization with the protein
expression from hepa1c1c7 cells exposed to DMSO. The bars represent mean ± the standard errors (n=3).

82
CHAPTER 5. DISCUSSION
83
CHARACTERIZATION OF MITOCHONDRIAL AHR IMPORT
AHR is a transcription factor, which resides as a complex with molecular chaperones in
the cytosol in the absence of ligand. In the presence of ligand, AHR is translocated into the
nucleus and activates its target gene expressions including CYPs and TiPARP. Because CYPs
stimulate ROS production during their xenobiotic metabolizing reactions and TiPARP does
through downstream targets, TCDD-induced oxidative stress such as lipid peroxidation,
regulation of antioxidant enzymes, DNA damage, and control of glutathione levels has been
investigated as a potential mechanism for TCDD-induced toxicity.145, 152 Accumulated research
data have suggested that AHR-dependent oxidative stress would be from not only transcription
activation but also nontranscriptional responses and TCDD-induced oxidative stress happened
through not only microsomal superoxide molecules or nuclear damage but also mitochondrial
superoxide or mitochondrial DNA damages.152, 153 In addition, because mitochondria are the
amphibolic sites having the TCA cycle and main sites for energy production, researches have
targeted TCDD-induced mitochondrial dysfunction as a potential player in TCDD-induced toxic
symptoms.77, 80, 161 Thus, herein it was investigated how the AHR impacts mitochondrial function
and AHR-mediated mitochondrial changes affect TCDD-toxicity.
Previous studies from our lab identified that the AHR could be localized in mitochondria,
as well as interacting with mitochondrial matrix proteins, ATP5α1 and MRPL40.165, 166 The
probability of mitochondrial localization of the AHR was further supported by MTS prediction
programs such as MitoProtII and MitoFates.179, 180 Finally, and most convincingly, the
mitochondrial localization of the AHR was supported by protease protection assay for
mitochondrial compartments. These experiments clearly demonstrate that the AHR is localized
in the IMS of the mitochondria (Figure 4-1). A combination of protease treatment and digitonin
extraction of mitochondrial protein provided a more clear view for a location of mitochondrial
AHR.
84
The previous study utilized confocal microscopy and co-immunoprecipitation to detect
mitochondrial AHR.165 Considering the size of mitochondria (0.5 - 1 µm), the structure of
mitochondrial IM, which is baffled, therefore, not easily separating the IMS from the matrix, and
the resolution of the confocal microscropy (400 nm), distinguishing the mitochondrial
compartments would be ambiguous. Also, considering the experimental condition for the co-
immunoprecipitation, such as utilizing the whole cell lysate rather than the mitochondrial fraction
for protein solution and utilizing the mitochondrial buffer without detergent dissolving membrane
components, the interaction between AHR and matrix proteins might not occur under a
physiological environment. Another possibility is that the AHR interacts indirectly with matrix
proteins in vivo. In this case, the AHR would be bound to proteins within the IM that are directly
bound to ATP5α1 or MRPL40. Finally, it is possible that, like the AHR, a pool of these proteins
can be found within the IM.
Cytochrome c heme lyase is known as an IMS protein, where it is bound to the outer
surface of the IM.182 The translocation of heme lyase into mitochondria is a distinct feature
compared to other internal proteins because it is independent of TIM complex, mitochondrial
membrane potential and ATP availability. In addition, this protein has no N-terminal MTS but 60
amino acids length of MTS in third quarter of the sequence, which is amphiphilic and conserved
through species. When AHR sequence is compared to the MTS of heme lyase using the SIM, a
protein sequence alignment tool, a possibility was suggested that AHR might have the internal
sequence for mitochondrial localization (data not shown).183
Protease protection assay also confirmed that mitochondrial AHR is also a target for the
AHR degradation pathway activated by TCDD, which means that mitochondrial AHR may also
be involved in TCDD-induced toxicity signaling. The AHR localized in the IMS was decreased
by TCDD, similar to the TCDD-induced cytosolic AHR decrease (Figure 4-2). One of the
negative feedbacks that regulate AHR signaling is dioxin-induced receptor proteolysis. Thus,
TCDD exposure may induce a proteolysis mechanism for both cytosolic and mitochondrial AHR
85
or trigger mitochondrial AHR export to the cytosol for proteolysis. The half-life of the unliganded
and cytoplasmic AHR in hepa1c1c7 cells is 28 h, but that of TCDD-activated AHR is 3 h.31
TCDD-induced AHR degradation by ubiquitin-mediated proteasome system is a fast reaction.
The study using hepa1c1c7 cells showed that a majority of cytosolic AHR was transferred to the
nucleus within 1 h after ligand exposure and over 80% of intracellular AHR was degraded within
4 h. It should be noted that the 20% of remaining AHR resided in cells even more than 24 h
after ligand exposure.184 Another study also showed that a small portion of AHR was resistant
to ligand-activated degradation.23 Our measurement of AHR amount in a cell after TCDD
exposure to compare to that in the mitochondrial fraction was performed only in the cytosolic
fraction, which neglected a comparison of nuclear AHR amount between the treatments, TCDD
and vehicle control, DMSO. In these experiments, the intracellular AHR distribution under
normal condition was cytosolic, 94%, nuclear, 5%, and mitochondrial, 1% (data not shown).
Because of the abundance of AHR in the cytosol of hepa1c1c7 cells in our system, a change in
the level of AHR expression in cytosol would reflects a representative amount for remained AHR
after proteolysis in cells.
Because the AIP contributes to mitochondrial protein localization via interacting with
TOM20 and TOM20 is known to recognize N-terminal target sequences of mitochondrial
proteins,111, 167 the probability of an N-terminal MTS and TOM20 recognition site in the AHR
based on computer prediction suggested that the AIP might have a role in mitochondrial AHR
import. In addition, Hsp90 has a documented role in assisting the translocations of proteins into
the mitochondria. The decreased expression of mitochondrial AHR by AIP knockdown and
inhibition of HSP90 activity suggest that stability of the AHR, both cytosolic and mitochondrial,
depends on the amount and activity of both cytosolic chaperones. As previously mentioned,
AIP status in cells is critical for stabilization of cytosolic AHR in mice.23, 185 HSP90 is one of
major cellular chaperones involved in protein folding, degradation, transport into organelles and
cell signaling.21, 47, 109 Considering together other studies and our data here, AIP and HSP90 are
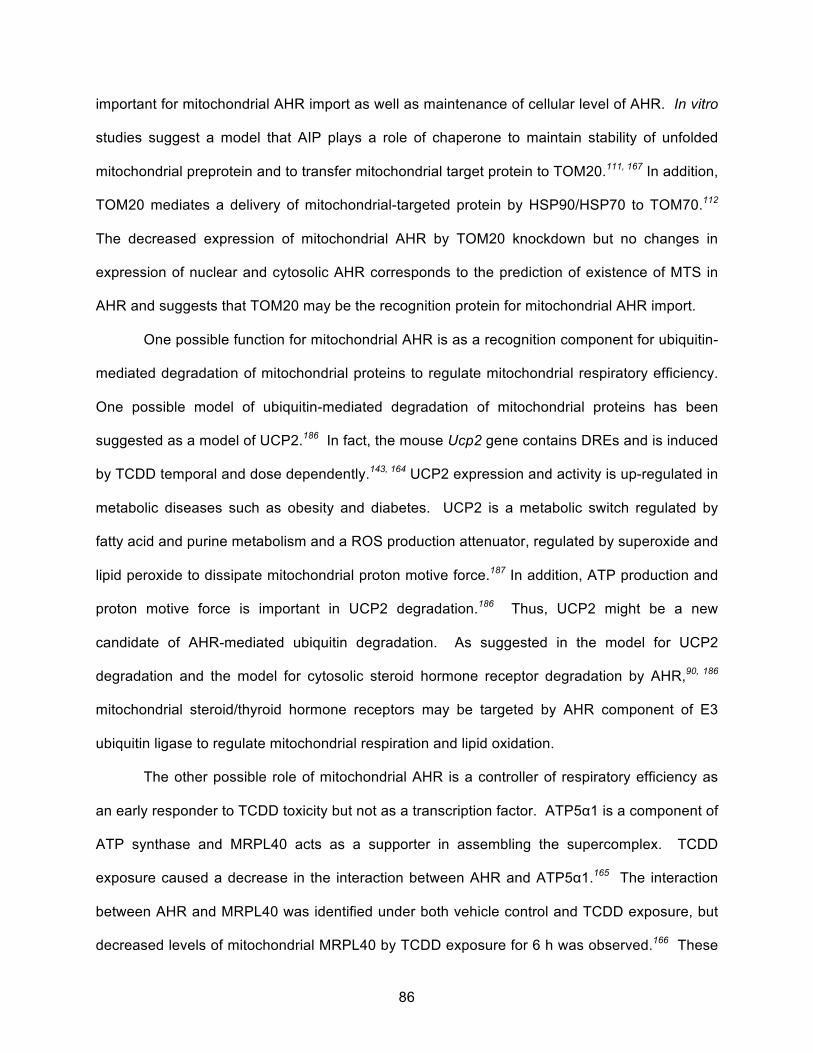
86
important for mitochondrial AHR import as well as maintenance of cellular level of AHR. In vitro
studies suggest a model that AIP plays a role of chaperone to maintain stability of unfolded
mitochondrial preprotein and to transfer mitochondrial target protein to TOM20.111, 167 In addition,
TOM20 mediates a delivery of mitochondrial-targeted protein by HSP90/HSP70 to TOM70.112
The decreased expression of mitochondrial AHR by TOM20 knockdown but no changes in
expression of nuclear and cytosolic AHR corresponds to the prediction of existence of MTS in
AHR and suggests that TOM20 may be the recognition protein for mitochondrial AHR import.
One possible function for mitochondrial AHR is as a recognition component for ubiquitin-
mediated degradation of mitochondrial proteins to regulate mitochondrial respiratory efficiency.
One possible model of ubiquitin-mediated degradation of mitochondrial proteins has been
suggested as a model of UCP2.186 In fact, the mouse Ucp2 gene contains DREs and is induced
by TCDD temporal and dose dependently.143, 164 UCP2 expression and activity is up-regulated in
metabolic diseases such as obesity and diabetes. UCP2 is a metabolic switch regulated by
fatty acid and purine metabolism and a ROS production attenuator, regulated by superoxide and
lipid peroxide to dissipate mitochondrial proton motive force.187 In addition, ATP production and
proton motive force is important in UCP2 degradation.186 Thus, UCP2 might be a new
candidate of AHR-mediated ubiquitin degradation. As suggested in the model for UCP2
degradation and the model for cytosolic steroid hormone receptor degradation by AHR,90, 186
mitochondrial steroid/thyroid hormone receptors may be targeted by AHR component of E3
ubiquitin ligase to regulate mitochondrial respiration and lipid oxidation.
The other possible role of mitochondrial AHR is a controller of respiratory efficiency as
an early responder to TCDD toxicity but not as a transcription factor. ATP5α1 is a component of
ATP synthase and MRPL40 acts as a supporter in assembling the supercomplex. TCDD
exposure caused a decrease in the interaction between AHR and ATP5α1.165 The interaction
between AHR and MRPL40 was identified under both vehicle control and TCDD exposure, but
decreased levels of mitochondrial MRPL40 by TCDD exposure for 6 h was observed.166 These
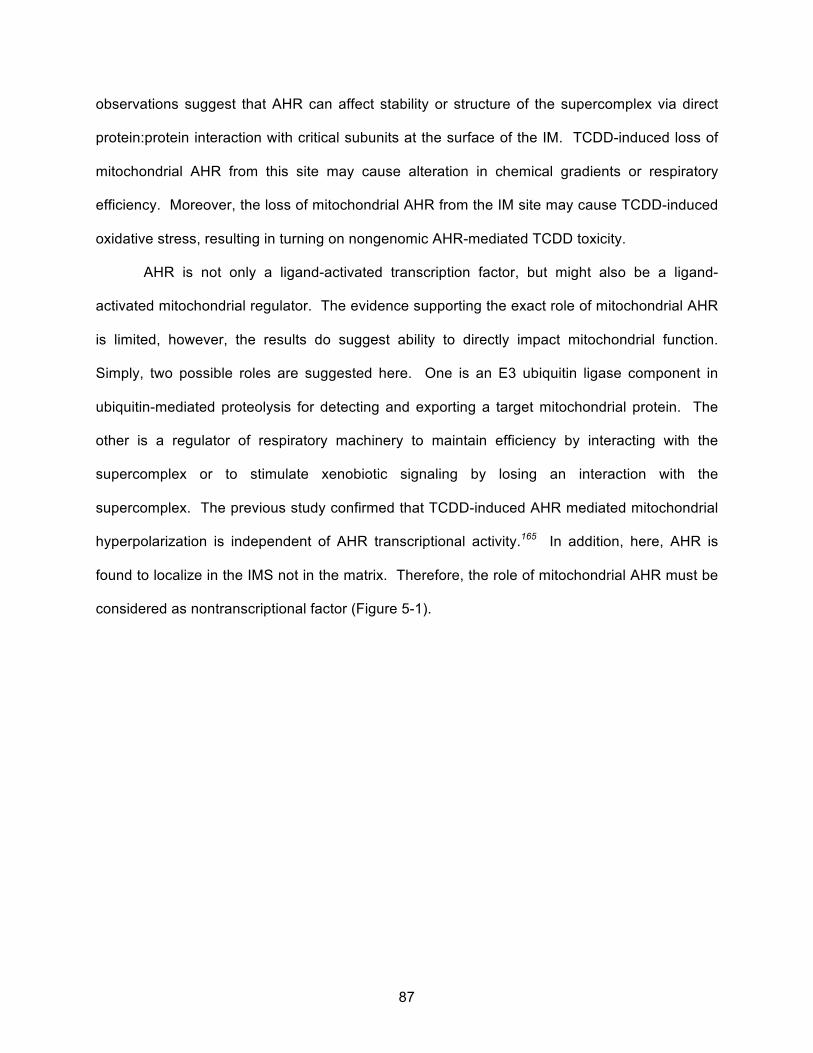
87
observations suggest that AHR can affect stability or structure of the supercomplex via direct
protein:protein interaction with critical subunits at the surface of the IM. TCDD-induced loss of
mitochondrial AHR from this site may cause alteration in chemical gradients or respiratory
efficiency. Moreover, the loss of mitochondrial AHR from the IM site may cause TCDD-induced
oxidative stress, resulting in turning on nongenomic AHR-mediated TCDD toxicity.
AHR is not only a ligand-activated transcription factor, but might also be a ligand-
activated mitochondrial regulator. The evidence supporting the exact role of mitochondrial AHR
is limited, however, the results do suggest ability to directly impact mitochondrial function.
Simply, two possible roles are suggested here. One is an E3 ubiquitin ligase component in
ubiquitin-mediated proteolysis for detecting and exporting a target mitochondrial protein. The
other is a regulator of respiratory machinery to maintain efficiency by interacting with the
supercomplex or to stimulate xenobiotic signaling by losing an interaction with the
supercomplex. The previous study confirmed that TCDD-induced AHR mediated mitochondrial
hyperpolarization is independent of AHR transcriptional activity.165 In addition, here, AHR is
found to localize in the IMS not in the matrix. Therefore, the role of mitochondrial AHR must be
considered as nontranscriptional factor (Figure 5-1).
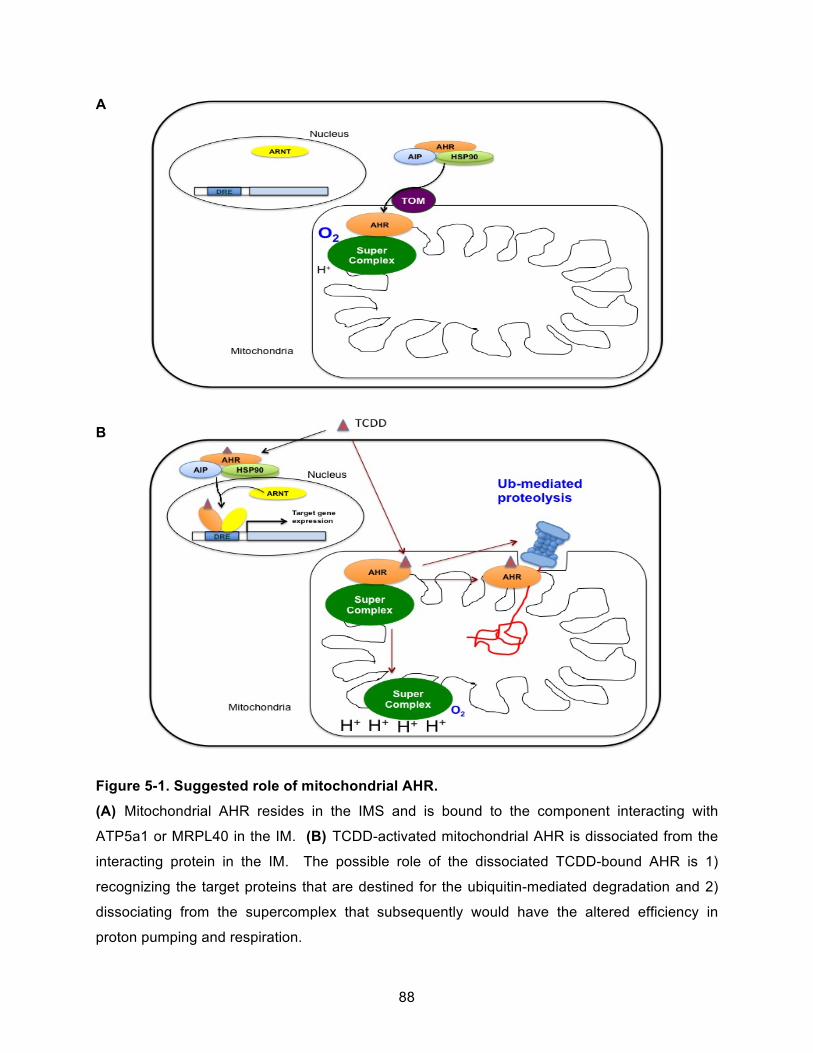
88
A
B
Figure 5-1. Suggested role of mitochondrial AHR.
(A) Mitochondrial AHR resides in the IMS and is bound to the component interacting with
ATP5a1 or MRPL40 in the IM. (B) TCDD-activated mitochondrial AHR is dissociated from the
interacting protein in the IM. The possible role of the dissociated TCDD-bound AHR is 1)
recognizing the target proteins that are destined for the ubiquitin-mediated degradation and 2)
dissociating from the supercomplex that subsequently would have the altered efficiency in
proton pumping and respiration.
89
AHR-MEDIATED TCDD-INDUCED MITOCHONDRIAL DYSFUNCTION
TCDD-induced oxidative stress has been extensively studied.81, 84, 146, 150, 152, 159, 160, 163
Considering that mitochondria are the organelles that utilize most of the cellular oxygen and
main source of ROS, it is tempting to hypothesize that AHR-mediated TCDD-induced toxicity
involves mitochondrial dysfunction. TCDD-induced mitochondrial hyperpolarization and changes
in enzyme activity of ETC complexes were observed in several studies, but those studies did
not investigate whether the TCDD-induced mitochondrial respiratory change were AHR-
dependent.152, 161, 188 The previous study from our lab showed that the TCDD-induced
hyperpolarization across the mitochondrial IM and caused no corresponding change in cellular
ATP levels in murine hepatoma and B cell lines expressing AHR.165 Also, TCDD caused
differential expression of nuclear-encoded ETC genes in C57BL/6 mice.164 In addition, TCDD-
induced changes in OCR and activities of ETC and ATP synthase complexes were determined.
30 nM TCDD exposure to hepa1c1c7 cells caused a significant decrease in basal respiration
and maximal respiration whereas no change in hepac12 cells was observed (Figure 4-6B and 4-
7B). This led us to speculate that cytochrome c oxidase, CIV, may have a decreased efficiency
under TCDD exposure and this might be caused by AHR-mediated TCDD-induced oxidative
stress. Interestingly, 30 nM TCDD exposure to hepa1c1c7 cells did not significantly alter the
activities of ETC complexes or ATP synthase though several trended towards modulation
(Figure 4-8). This suggests that decreased cellular OCR in hepa1c1c7 cells by TCDD may not
be caused by lack of efficiency in complex IV or other individual component of the ETC and ATP
synthase.
In vitro assays of ETC complex and ATP synthase were performed under sufficient
amount of substrates and cofactors for each enzyme complex to evaluate an individual enzyme
activity. However, a real-time measurement of cellular OCR was performed under nutrients
similar to cell culture, which would have more complicated supply and demand requirements for
90
the reactions that compromise the ETC and ATP synthase. In addition, the interaction of these
components and the cytosol would remain intact. Discrepancies between the individual
complex data and the OCR might be caused by changes in the regulation in supply of electron
carriers in cells or a disruption of the normal cellular signaling between these two cellular
compartments. The main source of electron carriers for the ETC is fatty acid oxidation and TCA
cycle. As discussed earlier, TCDD upregulated lipid biosynthesis and fatty acid β-oxidation in
liver and skeletal muscle in both AHR responsive and nonresponsive mice, and irregular lipid
and fatty acid uptake are signs of TCDD-induced metabolic perturbation in skeletal muscle in
C57BL/6 mice.71 TCDD also led to an increase in fatty acid uptake and downreugulated de
novo lipogenesis and gluconeogenesis in C57BL/6 mice liver.68, 143, 146 Analysis of AHR-
mediated TCDD-induced gene expressions changes indicated alterations in the expression of
genes that encode mitochondrial metabolic enzymes involved in the generation of electron
carriers including the TCA cycle.27, 143, 146, 189 Considering that TCA cycle is stimulated by acetyl-
CoA from fatty acid β-oxidation and TCDD decreases TCA cycle activity, mitochondrial fatty acid
oxidation might not be completed or not efficient enough to provide the necessary acetyl CoA
for TCA cycle and subsequently reducing equivalents for OXPHOS. Drug metabolizing
enzymes, CYPs, are highly expressed in both mitochondria and ER by TCDD-activated AHR,
and produce oxidative stress, which affects cellular redox potential. These may cause AHR-
mediated TCDD-induced lack of reducing equivalents in mitochondria, which can be one of
contributors for the changes observed in OCR, OXPHOS activity and mitochondrial membrane
potential.
Studies analyzing succinate-stimulated mitochondrial hyperpolarization showed AHR-
dependent increased mitochondrial thiol redox potential. This increased thiol redox potential
can cause mitochondrial hyperpolarization by closing MPTP and generate more superoxides
through Q cycle in complex III and reverse electron flow in complex I.152 TCDD treated
C57BL/6J mice had enhanced succinate level in the liver.71 Similar to this, glutamine in
91
hepatoma cell culture media might also elevate succinate levels via the reactions of the TCA
cycle and this could accelerate the electron flow through complex II, succinate dehydrogenase,
and create mitochondrial hyperpolarization and ROS that can ultimately inhibit respiration
efficiency.
Spare respiratory capacity was not affected by TCDD exposure in either hepa1c1c7 or
hepaC12. However, respiratory control ratio achieved by addition of uncoupler and complex V
inhibitor, oligomycin was increased in the hepaC12 cells following 30 nM TCDD exposure.
Interestingly, respiratory control ratio was not changed by TCDD in either WT and AHR
knockout mice in a previous study.160 Considering that cellular ATP levels was not changed in
AHR expressing cells in the previous study and that respiratory control ratio was not changed by
TCDD exposure to hepa1c1c7, a cell line that expresses AHR, the efficiency of mitochondrial
ETC complex and ATP production may be maintained by AHR for a certain amount of time until
TCDD-induced oxidative stress is accumulated enough to damage cellular context.
On the other hand, TCDD exposure to hepac12 cells caused no changes in activities of
ETC and ATP synthase except in complex I and V though these changes were not significant
(Figure 4-8). This AHR-independent enzyme activity changes and increased respiratory control
ratio by 30 nM TCDD in hepac12 cells may support the above idea that the decreased OCR and
mitochondrial hyperpolarization in hepa1c1c7 may have a link to AHR-dependent homeostasis
in the regulation of respiratory control ratio, (e.g., mitochondrial coupling efficiency). This
means that AHR might have a role in cellular ability to cope with TCDD-induced lack of electron
carriers via regulation of ETC. Because ETC complexes consist of multiple nuclear- and
mitochondrial-encoded subunits, it is hard to define whether the regulation of ETC is AHR-
mediated TCDD-induced regulation of gene expression or indirect regulation via allosteric
regulation of enzymes. However, considering that the pools of electron carriers are generated
in the metabolic pathways regulated by AHR and cellular redox potential homeostasis was
dependent on AHR expression,152 it cannot be ruled out that AHR may be a regulator of the
92
influx of electrons into ETC to maintain cellular respiration capacity.
Given the observed AHR-dependent TCDD-induced changes in mitochondrial
respiration, the role of the AHR in modulating mitochondrial function was investigated further
using the proteomic analysis. Proteomic analysis with adult zebrafish heart exposed to TCDD
revealed that TCDD caused significantly different protein expression related to calcium
handling, energy metabolism and the cellular redox state.190 Proteomic analysis with 5L
hepatoma rat cells exposed to TCDD revealed that TCDD upregulated voltage-dependent anion
channel-selective protein 2 (VDAC2) as an adaptive response to TCDD-induced oxidative stress
to inhibit the mitochondrial apoptotic pathway.191 Phosphoprotein quantification using SILAC
with 5L rat hepatoma cells identified TCDD-induced alteration in phosphorylation modification in
the ARNT, transcriptional coregulators, small GTPase regulators and oncoproteins.192 The
above studies utilized short (1 to 8 h) TCDD exposure. Considering the effect of retrograde
signaling (mitochondria-to-nuclear stress signaling), the SILAC-based proteomic analysis was
performed with TCDD exposure for 72 h to identify novel TCDD-induced changes in the
mitochondrial proteome and to develop our understanding of AHR signaling for toxic effects.
We identified 17 proteins with a mean |fold change|≥2 (Table 2), and proteins involved in
metabolic pathways were further investigated (Figure 4-10).
H6PD, CPOX, and CYB5 were induced with 2.0-2.5 fold by TCDD exposure in
hepa1c1c7 cells but not in hepac12 cells. All these proteins are involved in anabolic pathways
and H6PD and CYB5 are involved in the regulation of reducing equivalents. H6PD is a
bifunctional enzyme, which has glucose 1-dehydrogenase and 6-phosphogluconolactonase
activity. H6PD isoforms reside in different intracellular and extracellular locations. H6PD in the
ER performs the first reaction, a rate-limiting step in the pentose phosphate pathway. H6PD
produces NADPH as a by-product that can be utilized to maintain cellular redox state via
glutathione levels under oxidative stress. Because the pentose phosphate pathway is a main
source of NADPH in cells, cellular oxidative stress may affect H6PD enzymatic activity and
93
protein expression.193 It was observed in mouse embryo fibroblast derived from extrahepatic
tissue that TCDD induced cytosolic H6PD and glycerol-3-phosphate dehydrogenase, and also
induced Acyl-CoA oxidase that performs the first step of the peroxisomal β-oxidation.144
Because NADH produced from the proxisomal β-oxidation is usually utilized in lipids oxidation
and fatty acid synthesis, not in mitochondrial ATP production, it is suggested that TCDD-
induced proxisomal β-oxidation might contribute to the wasting syndrome.144 Recently, H6PD
was found to localize in mitochondrial matrix and its suggested role is to produce NADPH pool
for antioxidant defense or for a possible conversion between NADH/NADPH.194 Another
suggested role of H6PD in the mitochondria is interaction with hexokinase at the mitochondrial
OM to manage glucose-6 phosphate, which can increase ROS level and apoptosis. This
suggestion is supported by the observation that the level of mitochondrial H6PD was regulated
by nutrient status.194 TCDD-induced restricted mitochondrial respiration may affect upregulation
of both cytosolic and mitochondrial H6PD to produce reducing power against oxidative stress
and corresponding to demand for lipid metabolism.
Coproporphyrinogen-III oxidase (CPOX) found in the IMS of mitochondria is the key
enzyme in heme biosynthesis. It catalyzes oxidative decarboxylation of coproporphyrinogen III
to protoporphyrinogen IX, a precursor of heme.195 Heme is essential for many biological
reactions such as oxygen transport, energy metabolism, and drug metabolism. CYP families
and cytochromes have a heme group as a cofactor. When xenobiotics induce CYP1 family
members, heme biosynthesis would also be accelerated to generate functional CYPs. The rate-
limiting steps of heme biosynthesis are a reaction of 5-aminolevulinic acid (ALA) synthase,
which catalyzes condensation of glycine and succinyl-CoA to produce ALA and a transport of
CPOX substrate from cytosol to mitochondria.196 The substrate of CPOX, coproporphyrinogen III,
is synthesized in the cytosol and transported into the mitochondria by the mitochondrial ATP
binding cassette transporter, ABCB6, which is also an AHR target gene.196 In addition to that
AHR Global Chip-Chip analysis identified AHR enrichment region in the Cpox gene,197
94
increased protein expression of CPOX and ABCB6 would be required by CYP1 family induction
and other electron transfer reactions that utilize cytochromes. TCDD-elicited CPOX induction
might also contribute to hepatocarcinoma development in a similar manner of that of ABCB6.196
TCDD-inducible CYPs accumulates porphyrins, which may cause hepatic fibrosis resulting in
malignant tumor.198 High dose of TCDD exposure to mice is known to cause porphyria,
inducing CYP1A enzymes oxidizing porphyrinogens and aberrant iron metabolism.199 Heme
oxidase, another heme metabolizing enzyme, which is up-regulated by other transcription
factors, such as NRF2, AP-1, and NFκB, is generally induced by TCDD, converts heme to
bilirubin and induces mitochondrial-dependent apoptosis although HO-1 regulation by TCDD
was not clearly observed here.62, 200
Cytochrome b5 (CYB5) is an ER membrane bound heme protein, which functions as an
electron carrier for several membrane bound oxygenases, such as NADH-cytochrome b5
reductase (CYB5R). CYB5R reduces methemoglobin to normal hemoglobin. During the
reaction, electrons are transferred from electron carriers to CYB5, and these electrons are
utilized in desaturation of fatty acids by SCD1. TCDD-elicited steatosis depends on AHR-
mediated Scd1 and Tiparp induction, which result in the accumulation of lipids, and increases in
oxidative stress, fibrosis and inflammation in liver.146, 150
Acyl-CoA thioesterase 2 (ACOT2) catalyzes the hydrolysis of long-chain acyl-CoA to the
free fatty acid and coenzyme A to facilitate fatty acid β-oxidation.201 This protein did not meet
the cut-off for the 2-fold change in the MS data, but its expression was reduced by 1.7-fold by
TCDD exposure in hepa1c1c7 cells but not in hepac12 cells (data not shown), and this was
confirmed by Western blot analysis (Figure 4-10). Accelerated ACOT2 activity accumulates and
release free fatty acid from mitochondria. Returning free fatty acid to the mitochondria to utilize
for fatty acid oxidation promotes proton back and subsequent proton leak occurs.201 This
phenomenon uncouples respiration and may drive lipid consumption for energy
compensation.201 TCDD suppressed ACOT2 expression in an AHR-dependent manner. Lower
95
activity of fatty acid β-oxidation would result in decreased supply of reducing equivalents for
ETC complex and ATP synthase, and this may result in reduced respiration and ATP
production.
ENTPD2, ecto-nucleoside triphosphate diphosphohydrolase, is a plasma membrane
protein and hydrolyzes nucleoside triphosphates and nucleoside diphosphates in the presence
of divalent cofactors, Mg2+ or Ca2+. ENTPD2 is involved in physiological pathways that use ATP
as an intracellular signal, such as eye and brain development, taste bud function.202, 203 ENTPD2
is also involved in the inflammatory response and IL-6, a marker of biliary cirrhosis,
downregulated Entpd2 gene expression.204, 205 TCDD activated ENTPD2 expression in mouse
hepa1c1c7 cells.206, 207 SILAC analysis showed 7.4-fold induction of ENTPD2, but this induction
was not detected by Western blot analysis, which might be due to a lack of proper antibodies
detecting a molecule residing in intracellular organelles (Table 2 and Figure 4-10). So far,
ENTPD2 localized in intracellular organelles was confirmed in only human species.205 While
human ENTPD2 alpha is an active enzyme and found in plasma membranes, ENTPD2 beta
and gamma have no catalytic activity and are found in the ER membrane. The beta and
gamma isoforms are alternative splicing variants having partial loss of exon 8, which has a
critical Cys residue for disulfide bond, and are not being fully glycosylated. The study of human
ENTPD2 cloning suggested that loss of disulfide bond sites and lacking full glycosylation in the
alternative splice variants might inhibit correct folding and oligomerization that are critical for
enzyme function.205 The authors also suggested that ENTPD2 beta/gamma would have a role
in purinergic signaling termination by formation of hetero-oligomer with the alpha form.205 On
the other hand, rat ENTPD2 also has alternative splice variants, but both are active enzymes
and the subcellular localization of these isoforms, except for the plasma membrane, has not
been confirmed.208 The isoforms of ENTPD2 in human and rat and unknown functions of these
isoforms raises a question about the intracellular localization and the role of ENTPD2 induced
by TCDD. Because ENTPD2 regulates liver cell growth and IL-6, which is important in liver
96
fibrosis, downregulates ENTPD2 expression, TCDD-induced ENTPD2 expression might be a
response against liver fibrosis.204
Cox4i1 was induced by TCDD-exposure in C57BL/6 mice liver.164 However, other
studies analyzing gene expression using microarray did not show upregulated Cox4i1.27, 206
Here, MS data did not show any changes in COX4I1 proteins expression by TCDD exposure.
Two Western blot analysis agreed to MS data while one Western blot analysis showed the
increased level of COX4I1 in hepa1c1c7 cells exposed to TCDD. Considering that Cox4i1 is
regulated by hypoxia, TCDD-induced COX4I1 expression might be temporal and dose-
dependent, ultimately relying on oxidative stress signaling.209, 210
WARS2 is the mitochondrial tryptophan-tRNA ligase, which was decreased 2-fold by
TCDD exposure in hepa1c1c7 cells (Table 2). TCDD caused the downregulation in the
expression of genes that encode proteins related to amino acid metabolism and purine
metabolism was observed.27, 143 Metabolomic analysis using C57BL/6J, AHR-responsive and
DBA/2J, AHR-nonresponsive mice exposed to TCDD showed decreased levels of amino acids
including tryptophan and purines, as well as decreased TCA cycle activities.71 MRPS28, which
was decreased more than 2-fold in the expression by TCDD exposure in hepa1c1c7 cells, was
previously named as MRPS35. MRP consists of MRPS28 and MRPL39. Given the published
metabolomic data, the decreased WARS2 and MRPS28 protein levels observed in the MS of
our study suggest a TCDD-mediated suppression of mitochondrial biogenesis.
Collectively, the mitochondrial proteins identified with significant AHR-mediated changes
in expression following TCDD challenge are related to redox potential regulation (H6PD), redox
related enzyme reaction (CYB5), heme metabolism (CPOX), lipid metabolism (ACOT2), and
mitochondrial biogenesis (WARS2 and MRPS28) (Figure 5-2). Our results support previous
suggestions of AHR-mediated energy metabolic alterations and hepatosteatosis and
consequently TCDD-induced toxicity. Though the experimental conditions for the TCDD-induced
effects on mitochondrial respiration and mitochondrial protein expression were not identical, it is
97
certain that the main factors in mitochondria affected by TCDD exposure are related to redox
potential and lipid metabolism, which also affect energy maintenance. The ability of the AHR to
crosstalk with other signaling pathways and mitochondrial retrograde signaling may orchestrate
temporally different cellular responses upon TCDD exposure. The effort to find a connection
between early and later mitochondrial responses against TCDD needs to be considered in any
future study of AHR-mediated TCDD-induced liver diseases.
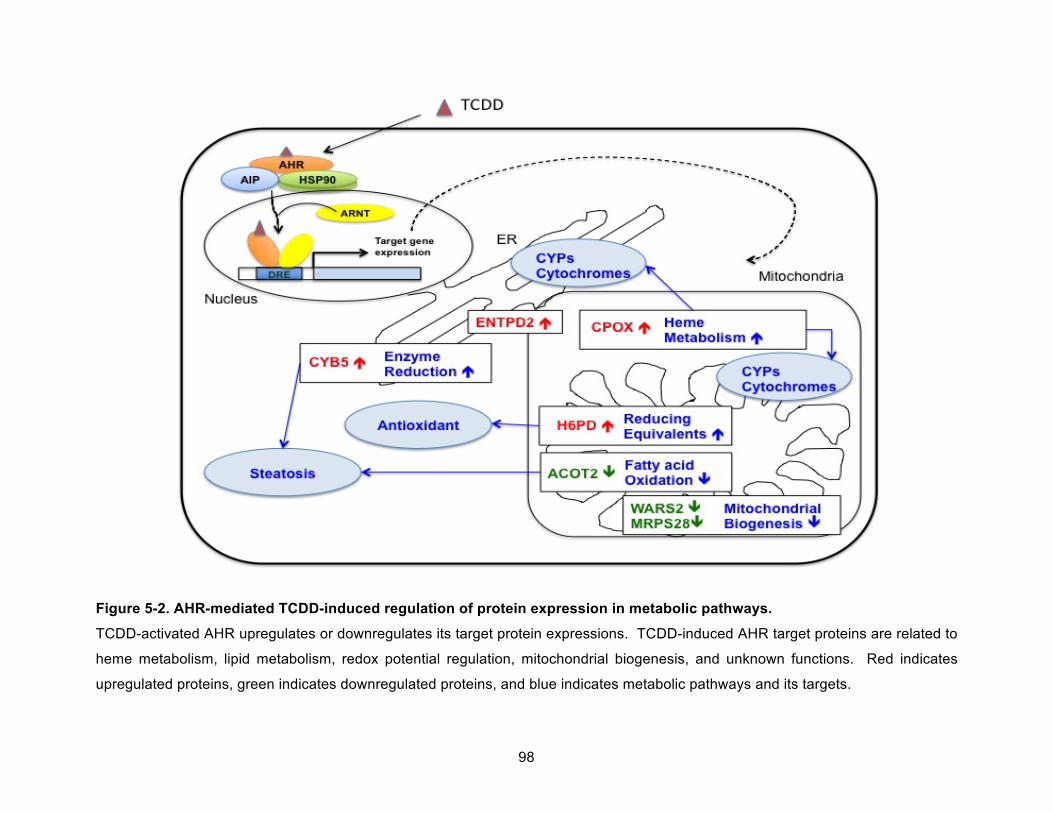
98
Figure 5-2. AHR-mediated TCDD-induced regulation of protein expression in metabolic pathways.
TCDD-activated AHR upregulates or downregulates its target protein expressions. TCDD-induced AHR target proteins are related to
heme metabolism, lipid metabolism, redox potential regulation, mitochondrial biogenesis, and unknown functions. Red indicates
upregulated proteins, green indicates downregulated proteins, and blue indicates metabolic pathways and its targets.

99
CHAPTER 6. CONCLUSIONS AND FUTURE STUDIES
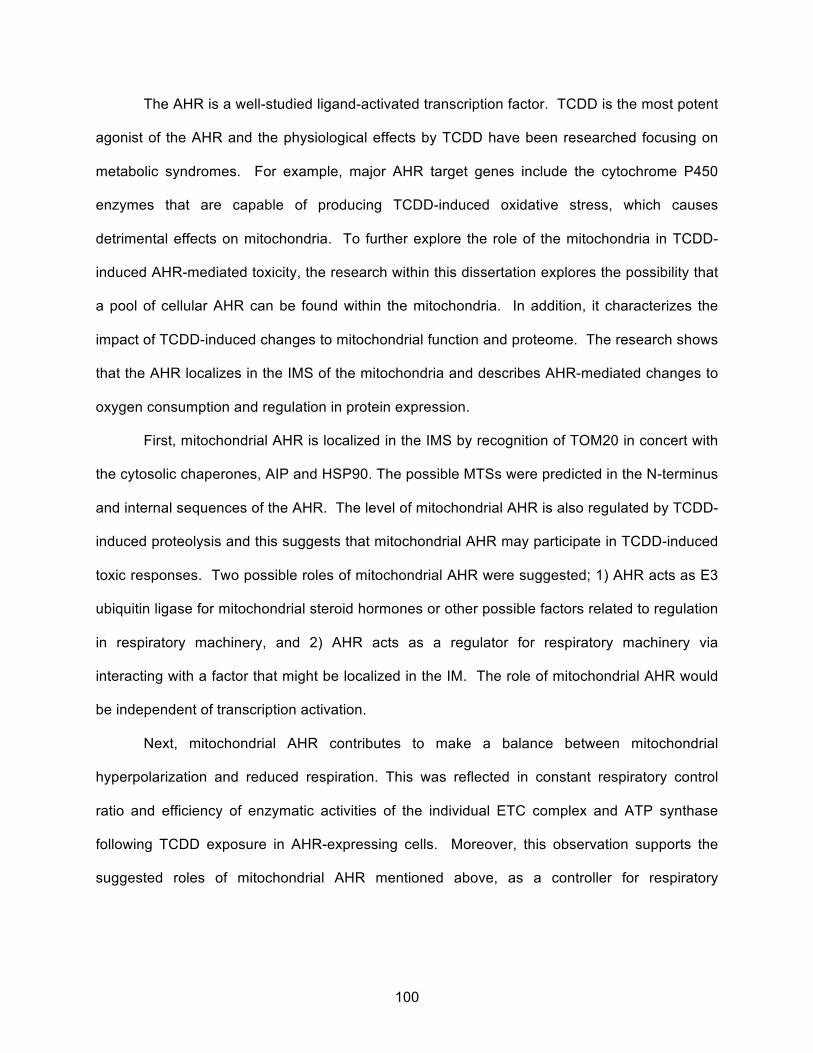
100
The AHR is a well-studied ligand-activated transcription factor. TCDD is the most potent
agonist of the AHR and the physiological effects by TCDD have been researched focusing on
metabolic syndromes. For example, major AHR target genes include the cytochrome P450
enzymes that are capable of producing TCDD-induced oxidative stress, which causes
detrimental effects on mitochondria. To further explore the role of the mitochondria in TCDD-
induced AHR-mediated toxicity, the research within this dissertation explores the possibility that
a pool of cellular AHR can be found within the mitochondria. In addition, it characterizes the
impact of TCDD-induced changes to mitochondrial function and proteome. The research shows
that the AHR localizes in the IMS of the mitochondria and describes AHR-mediated changes to
oxygen consumption and regulation in protein expression.
First, mitochondrial AHR is localized in the IMS by recognition of TOM20 in concert with
the cytosolic chaperones, AIP and HSP90. The possible MTSs were predicted in the N-terminus
and internal sequences of the AHR. The level of mitochondrial AHR is also regulated by TCDD-
induced proteolysis and this suggests that mitochondrial AHR may participate in TCDD-induced
toxic responses. Two possible roles of mitochondrial AHR were suggested; 1) AHR acts as E3
ubiquitin ligase for mitochondrial steroid hormones or other possible factors related to regulation
in respiratory machinery, and 2) AHR acts as a regulator for respiratory machinery via
interacting with a factor that might be localized in the IM. The role of mitochondrial AHR would
be independent of transcription activation.
Next, mitochondrial AHR contributes to make a balance between mitochondrial
hyperpolarization and reduced respiration. This was reflected in constant respiratory control
ratio and efficiency of enzymatic activities of the individual ETC complex and ATP synthase
following TCDD exposure in AHR-expressing cells. Moreover, this observation supports the
suggested roles of mitochondrial AHR mentioned above, as a controller for respiratory
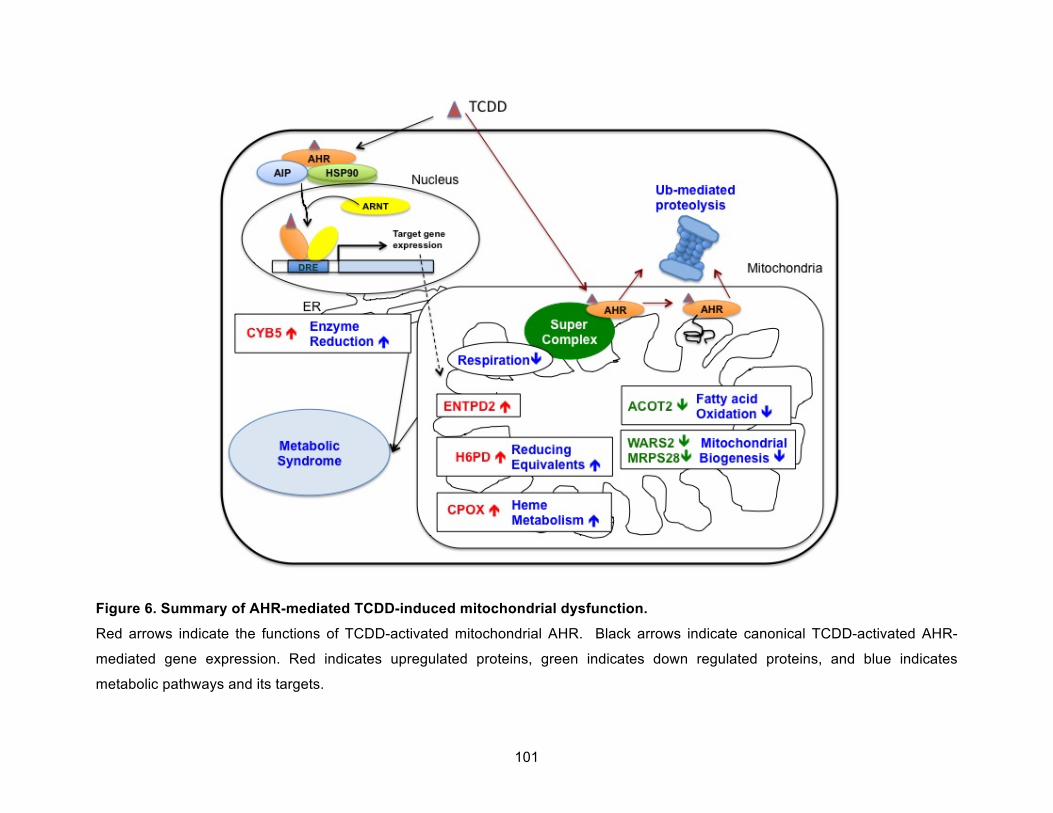
101
Figure 6. Summary of AHR-mediated TCDD-induced mitochondrial dysfunction.
Red arrows indicate the functions of TCDD-activated mitochondrial AHR. Black arrows indicate canonical TCDD-activated AHR-
mediated gene expression. Red indicates upregulated proteins, green indicates down regulated proteins, and blue indicates
metabolic pathways and its targets.
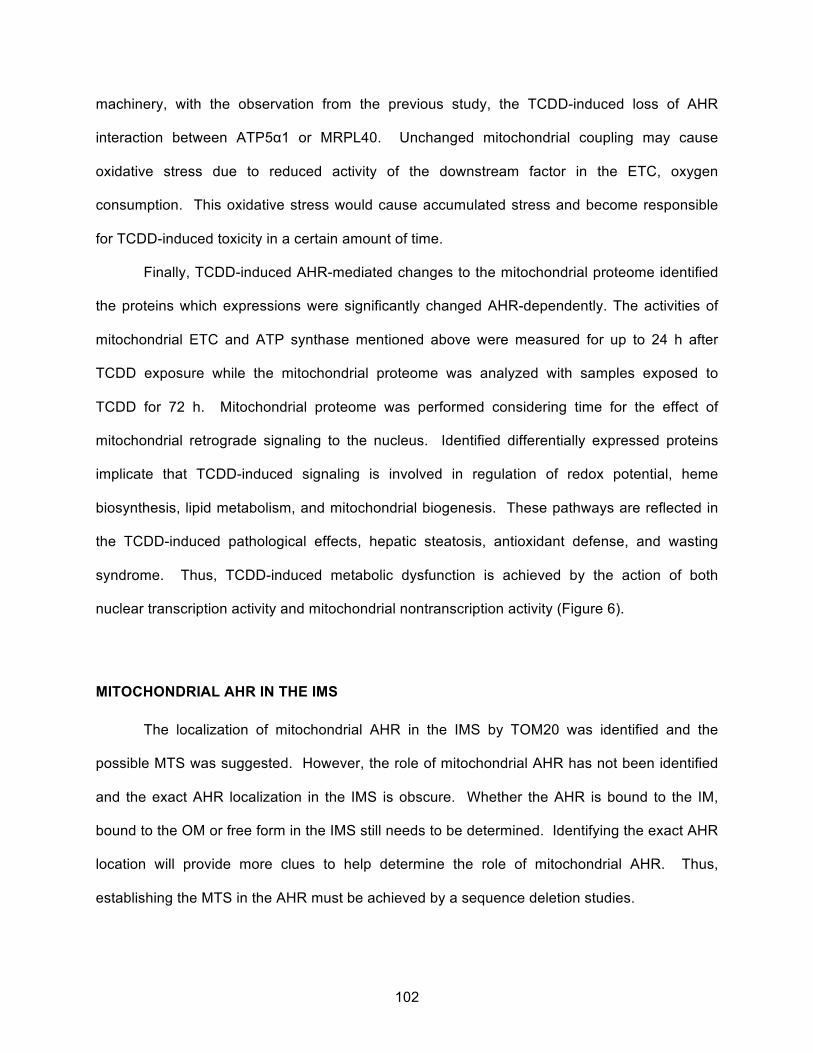
102
machinery, with the observation from the previous study, the TCDD-induced loss of AHR
interaction between ATP5α1 or MRPL40. Unchanged mitochondrial coupling may cause
oxidative stress due to reduced activity of the downstream factor in the ETC, oxygen
consumption. This oxidative stress would cause accumulated stress and become responsible
for TCDD-induced toxicity in a certain amount of time.
Finally, TCDD-induced AHR-mediated changes to the mitochondrial proteome identified
the proteins which expressions were significantly changed AHR-dependently. The activities of
mitochondrial ETC and ATP synthase mentioned above were measured for up to 24 h after
TCDD exposure while the mitochondrial proteome was analyzed with samples exposed to
TCDD for 72 h. Mitochondrial proteome was performed considering time for the effect of
mitochondrial retrograde signaling to the nucleus. Identified differentially expressed proteins
implicate that TCDD-induced signaling is involved in regulation of redox potential, heme
biosynthesis, lipid metabolism, and mitochondrial biogenesis. These pathways are reflected in
the TCDD-induced pathological effects, hepatic steatosis, antioxidant defense, and wasting
syndrome. Thus, TCDD-induced metabolic dysfunction is achieved by the action of both
nuclear transcription activity and mitochondrial nontranscription activity (Figure 6).
MITOCHONDRIAL AHR IN THE IMS
The localization of mitochondrial AHR in the IMS by TOM20 was identified and the
possible MTS was suggested. However, the role of mitochondrial AHR has not been identified
and the exact AHR localization in the IMS is obscure. Whether the AHR is bound to the IM,
bound to the OM or free form in the IMS still needs to be determined. Identifying the exact AHR
location will provide more clues to help determine the role of mitochondrial AHR. Thus,
establishing the MTS in the AHR must be achieved by a sequence deletion studies.
103
The limitation in studying mitochondrial AHR is that mitochondrial AHR exist as very
small pool compared to cytosolic AHR. To overcome this limitation, creating cell strains that
express different functional forms of the AHR would be an important first step. Once the MTS is
identified, it will be possible to create mutant AHRs that are incapable of entering the
mitochondria, as well as, those with inability to enter the nucleus or are engineered to increase
the amount within the mitochondria. This genetic engineering would make it possible to
generate AHR signaling simpler or magnify the effect from the AHR signaling more specialized.
Because cytosolic AHR is observed as a complex form with molecular chaperones and
destabilized without chaperones, it is assumed that AHR would exist as a bound form in the
mitochondria not as a free form. Once, mitochondrial AHR can be obtained the amount enough
to identify its partner proteins, clues can be found for the role of the ligand-activated AHR in
mitochondria.
The hypothesis on the role of AHR mentioned above regarding mitochondrial respiration
can be evaluated. To clearly examine the role of AHR in mitochondria, it is necessary to test
the hypothesis in other cell types, which have differing mitochondrial respiration activity, such as
skeletal muscle and heart in addition to kidney, adipose tissues and skin, which are frequently
used to study TCDD-toxicity. If the existence of AHR in the mitochondria is critical for
mitochondrial respiratory function especially, the AHR-mediated effect would be more clearly
observed in those cells having more active mitochondria.
THE ROLE OF THE AHR IN MITOCHODNRIAL METABOLISM AND ITS ROLE IN TCDD-
INDUCED TOXICITY
The constant respiratory control ratio and efficiency of ETC capacity under TCDD
exposure was dependent on AHR expression. The comparison of OCR and enzyme activities of
OXPHOS between hepa1c1c7 and c12 cells has limitation to explain AHR-mediated effect
104
because hepa1c1c7 and c12 cells may have other cellular differences other than AHR
dominance/deficiency. Human B cell SKW6.4 is an AHR null cell line and Dr. Kaminski’s lab at
the Michigan State University established SKW6.4 that overexpress the AHR. Because of
identical cellular context, performing the same experiments with SKW6.4 cells with/ without
expression of AHR would confirm the effect of AHR on homeostasis on respiratory control and
efficiency of ETC and ATP synthase enzyme activities, which were observed in mouse
hepatoma cells.
One of identified metabolic pathway from SILAC analysis was redox regulation by
increased levels of H6PD, which could affect mitochondrial GSH/GSSG ratio and SOD activity.
Decreased levels of ACOT2 suggested alterations in fatty acid oxidation. Gene expression
analysis by other researches identified increased fatty acid uptake in liver but has not identified
decreased enzyme expression levels involved in fatty acid oxidation clearly. Identification of
activities of suggested metabolic pathways could advance our understanding of metabolic
switches by AHR-mediated TCDD toxicity. In addition, another interesting protein identified from
SILAC analysis is ENTPD2. Although mitochondrial ENTPD2 cannot be identified due to lack of
a proper antibody, characterization of mitochondrial ENTPD2 against TCDD exposure would be
a novel finding since a role for mitochondrial-localized ENTPD2 has not been revealed so far.
Lastly, several of the proposed endogenous ligands for the AHR, such as steroids and
heme and tryptophan metabolites have direct links to mitochondria function. The role of these
metabolites on modulating AHR function within the mitochondria has interesting implications.
These metabolites might alter their own flux via changes in AHR signaling within the organelle
that regulates their production without having a signal to the nucleus. Considering that
mitochondria are central intracellular organelles for energy production and the numbers or state
of mitochondria are critical factors for cellular development, proliferation, and survival, the
physiological effects of AHR signaling activated by endogenous ligands linking to mitochondrial
function can be studied to shed light on AHR biology.

105
APPENDICES
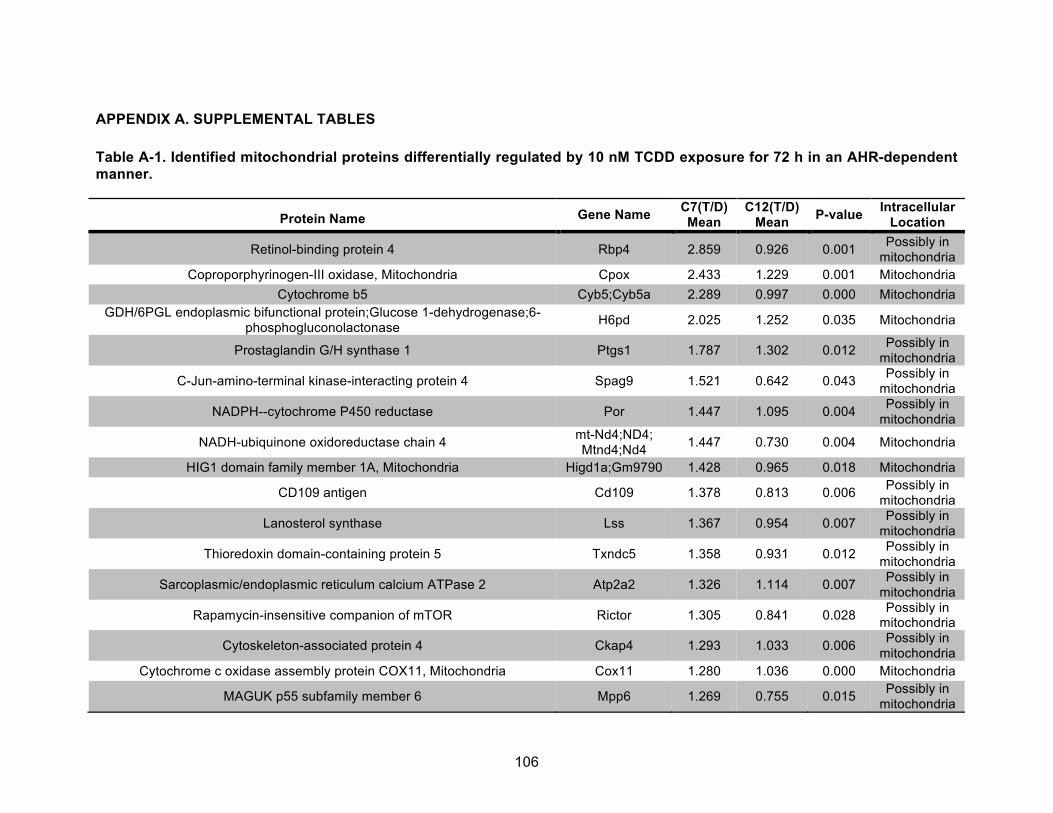
106
APPENDIX A. SUPPLEMENTAL TABLES
Table A-1. Identified mitochondrial proteins differentially regulated by 10 nM TCDD exposure for 72 h in an AHR-dependent manner.
Protein Name Gene Name C7(T/D) Mean
C12(T/D) Mean P-value Intracellular
Location
Retinol-binding protein 4 Rbp4 2.859 0.926 0.001 Possibly in mitochondria
Coproporphyrinogen-III oxidase, Mitochondria Cpox 2.433 1.229 0.001 Mitochondria Cytochrome b5 Cyb5;Cyb5a 2.289 0.997 0.000 Mitochondria
GDH/6PGL endoplasmic bifunctional protein;Glucose 1-dehydrogenase;6-phosphogluconolactonase H6pd 2.025 1.252 0.035 Mitochondria
Prostaglandin G/H synthase 1 Ptgs1 1.787 1.302 0.012 Possibly in mitochondria
C-Jun-amino-terminal kinase-interacting protein 4 Spag9 1.521 0.642 0.043 Possibly in mitochondria
NADPH--cytochrome P450 reductase Por 1.447 1.095 0.004 Possibly in mitochondria
NADH-ubiquinone oxidoreductase chain 4 mt-Nd4;ND4; Mtnd4;Nd4 1.447 0.730 0.004 Mitochondria
HIG1 domain family member 1A, Mitochondria Higd1a;Gm9790 1.428 0.965 0.018 Mitochondria
CD109 antigen Cd109 1.378 0.813 0.006 Possibly in mitochondria
Lanosterol synthase Lss 1.367 0.954 0.007 Possibly in mitochondria
Thioredoxin domain-containing protein 5 Txndc5 1.358 0.931 0.012 Possibly in mitochondria
Sarcoplasmic/endoplasmic reticulum calcium ATPase 2 Atp2a2 1.326 1.114 0.007 Possibly in mitochondria
Rapamycin-insensitive companion of mTOR Rictor 1.305 0.841 0.028 Possibly in mitochondria
Cytoskeleton-associated protein 4 Ckap4 1.293 1.033 0.006 Possibly in mitochondria
Cytochrome c oxidase assembly protein COX11, Mitochondria Cox11 1.280 1.036 0.000 Mitochondria
MAGUK p55 subfamily member 6 Mpp6 1.269 0.755 0.015 Possibly in mitochondria
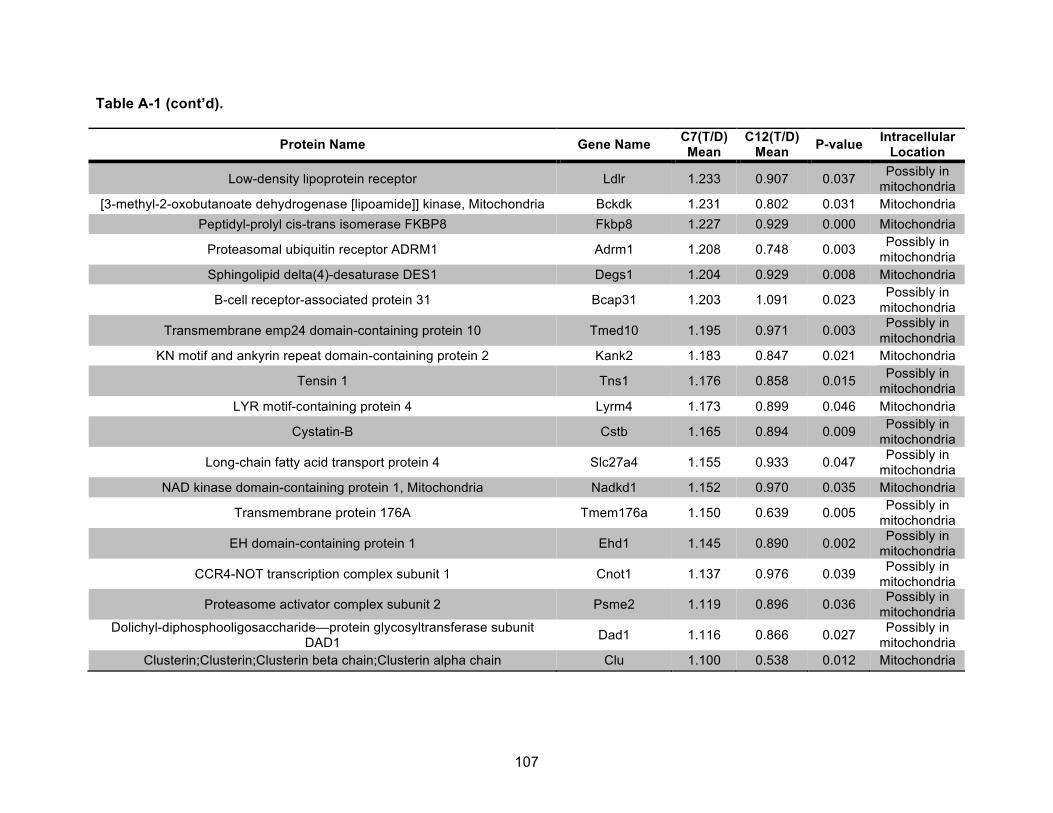
107
Table A-1 (cont’d).
Protein Name Gene Name C7(T/D) Mean
C12(T/D) Mean P-value Intracellular
Location
Low-density lipoprotein receptor Ldlr 1.233 0.907 0.037 Possibly in mitochondria
[3-methyl-2-oxobutanoate dehydrogenase [lipoamide]] kinase, Mitochondria Bckdk 1.231 0.802 0.031 Mitochondria Peptidyl-prolyl cis-trans isomerase FKBP8 Fkbp8 1.227 0.929 0.000 Mitochondria
Proteasomal ubiquitin receptor ADRM1 Adrm1 1.208 0.748 0.003 Possibly in mitochondria
Sphingolipid delta(4)-desaturase DES1 Degs1 1.204 0.929 0.008 Mitochondria
B-cell receptor-associated protein 31 Bcap31 1.203 1.091 0.023 Possibly in mitochondria
Transmembrane emp24 domain-containing protein 10 Tmed10 1.195 0.971 0.003 Possibly in mitochondria
KN motif and ankyrin repeat domain-containing protein 2 Kank2 1.183 0.847 0.021 Mitochondria
Tensin 1 Tns1 1.176 0.858 0.015 Possibly in mitochondria
LYR motif-containing protein 4 Lyrm4 1.173 0.899 0.046 Mitochondria
Cystatin-B Cstb 1.165 0.894 0.009 Possibly in mitochondria
Long-chain fatty acid transport protein 4 Slc27a4 1.155 0.933 0.047 Possibly in mitochondria
NAD kinase domain-containing protein 1, Mitochondria Nadkd1 1.152 0.970 0.035 Mitochondria
Transmembrane protein 176A Tmem176a 1.150 0.639 0.005 Possibly in mitochondria
EH domain-containing protein 1 Ehd1 1.145 0.890 0.002 Possibly in mitochondria
CCR4-NOT transcription complex subunit 1 Cnot1 1.137 0.976 0.039 Possibly in mitochondria
Proteasome activator complex subunit 2 Psme2 1.119 0.896 0.036 Possibly in mitochondria
Dolichyl-diphosphooligosaccharide—protein glycosyltransferase subunit DAD1 Dad1 1.116 0.866 0.027 Possibly in
mitochondria Clusterin;Clusterin;Clusterin beta chain;Clusterin alpha chain Clu 1.100 0.538 0.012 Mitochondria
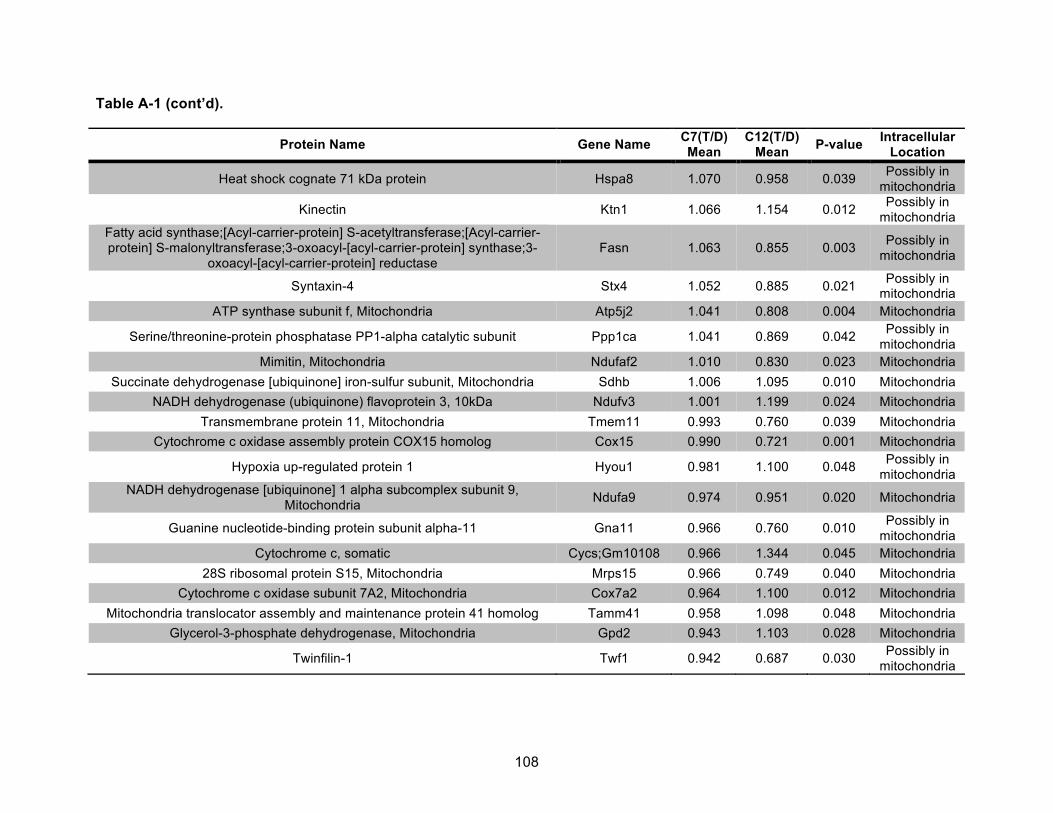
108
Table A-1 (cont’d).
Protein Name Gene Name C7(T/D) Mean
C12(T/D) Mean P-value Intracellular
Location
Heat shock cognate 71 kDa protein Hspa8 1.070 0.958 0.039 Possibly in mitochondria
Kinectin Ktn1 1.066 1.154 0.012 Possibly in mitochondria
Fatty acid synthase;[Acyl-carrier-protein] S-acetyltransferase;[Acyl-carrier-protein] S-malonyltransferase;3-oxoacyl-[acyl-carrier-protein] synthase;3-
oxoacyl-[acyl-carrier-protein] reductase Fasn 1.063 0.855 0.003 Possibly in
mitochondria
Syntaxin-4 Stx4 1.052 0.885 0.021 Possibly in mitochondria
ATP synthase subunit f, Mitochondria Atp5j2 1.041 0.808 0.004 Mitochondria
Serine/threonine-protein phosphatase PP1-alpha catalytic subunit Ppp1ca 1.041 0.869 0.042 Possibly in mitochondria
Mimitin, Mitochondria Ndufaf2 1.010 0.830 0.023 Mitochondria Succinate dehydrogenase [ubiquinone] iron-sulfur subunit, Mitochondria Sdhb 1.006 1.095 0.010 Mitochondria
NADH dehydrogenase (ubiquinone) flavoprotein 3, 10kDa Ndufv3 1.001 1.199 0.024 Mitochondria Transmembrane protein 11, Mitochondria Tmem11 0.993 0.760 0.039 Mitochondria
Cytochrome c oxidase assembly protein COX15 homolog Cox15 0.990 0.721 0.001 Mitochondria
Hypoxia up-regulated protein 1 Hyou1 0.981 1.100 0.048 Possibly in mitochondria
NADH dehydrogenase [ubiquinone] 1 alpha subcomplex subunit 9, Mitochondria Ndufa9 0.974 0.951 0.020 Mitochondria
Guanine nucleotide-binding protein subunit alpha-11 Gna11 0.966 0.760 0.010 Possibly in mitochondria
Cytochrome c, somatic Cycs;Gm10108 0.966 1.344 0.045 Mitochondria 28S ribosomal protein S15, Mitochondria Mrps15 0.966 0.749 0.040 Mitochondria
Cytochrome c oxidase subunit 7A2, Mitochondria Cox7a2 0.964 1.100 0.012 Mitochondria Mitochondria translocator assembly and maintenance protein 41 homolog Tamm41 0.958 1.098 0.048 Mitochondria
Glycerol-3-phosphate dehydrogenase, Mitochondria Gpd2 0.943 1.103 0.028 Mitochondria
Twinfilin-1 Twf1 0.942 0.687 0.030 Possibly in mitochondria
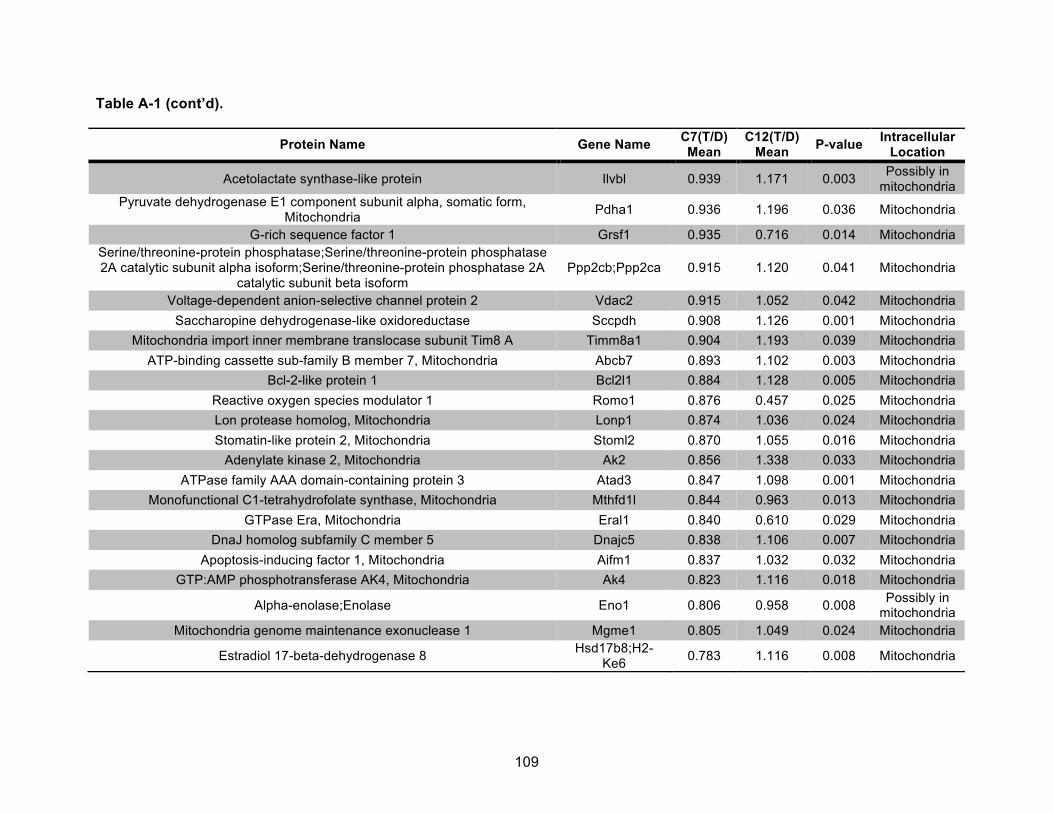
109
Table A-1 (cont’d).
Protein Name Gene Name C7(T/D) Mean
C12(T/D) Mean P-value Intracellular
Location
Acetolactate synthase-like protein Ilvbl 0.939 1.171 0.003 Possibly in mitochondria
Pyruvate dehydrogenase E1 component subunit alpha, somatic form, Mitochondria Pdha1 0.936 1.196 0.036 Mitochondria
G-rich sequence factor 1 Grsf1 0.935 0.716 0.014 Mitochondria Serine/threonine-protein phosphatase;Serine/threonine-protein phosphatase 2A catalytic subunit alpha isoform;Serine/threonine-protein phosphatase 2A
catalytic subunit beta isoform Ppp2cb;Ppp2ca 0.915 1.120 0.041 Mitochondria
Voltage-dependent anion-selective channel protein 2 Vdac2 0.915 1.052 0.042 Mitochondria Saccharopine dehydrogenase-like oxidoreductase Sccpdh 0.908 1.126 0.001 Mitochondria
Mitochondria import inner membrane translocase subunit Tim8 A Timm8a1 0.904 1.193 0.039 Mitochondria ATP-binding cassette sub-family B member 7, Mitochondria Abcb7 0.893 1.102 0.003 Mitochondria
Bcl-2-like protein 1 Bcl2l1 0.884 1.128 0.005 Mitochondria Reactive oxygen species modulator 1 Romo1 0.876 0.457 0.025 Mitochondria Lon protease homolog, Mitochondria Lonp1 0.874 1.036 0.024 Mitochondria Stomatin-like protein 2, Mitochondria Stoml2 0.870 1.055 0.016 Mitochondria
Adenylate kinase 2, Mitochondria Ak2 0.856 1.338 0.033 Mitochondria ATPase family AAA domain-containing protein 3 Atad3 0.847 1.098 0.001 Mitochondria
Monofunctional C1-tetrahydrofolate synthase, Mitochondria Mthfd1l 0.844 0.963 0.013 Mitochondria GTPase Era, Mitochondria Eral1 0.840 0.610 0.029 Mitochondria
DnaJ homolog subfamily C member 5 Dnajc5 0.838 1.106 0.007 Mitochondria Apoptosis-inducing factor 1, Mitochondria Aifm1 0.837 1.032 0.032 Mitochondria
GTP:AMP phosphotransferase AK4, Mitochondria Ak4 0.823 1.116 0.018 Mitochondria
Alpha-enolase;Enolase Eno1 0.806 0.958 0.008 Possibly in mitochondria
Mitochondria genome maintenance exonuclease 1 Mgme1 0.805 1.049 0.024 Mitochondria
Estradiol 17-beta-dehydrogenase 8 Hsd17b8;H2-Ke6 0.783 1.116 0.008 Mitochondria
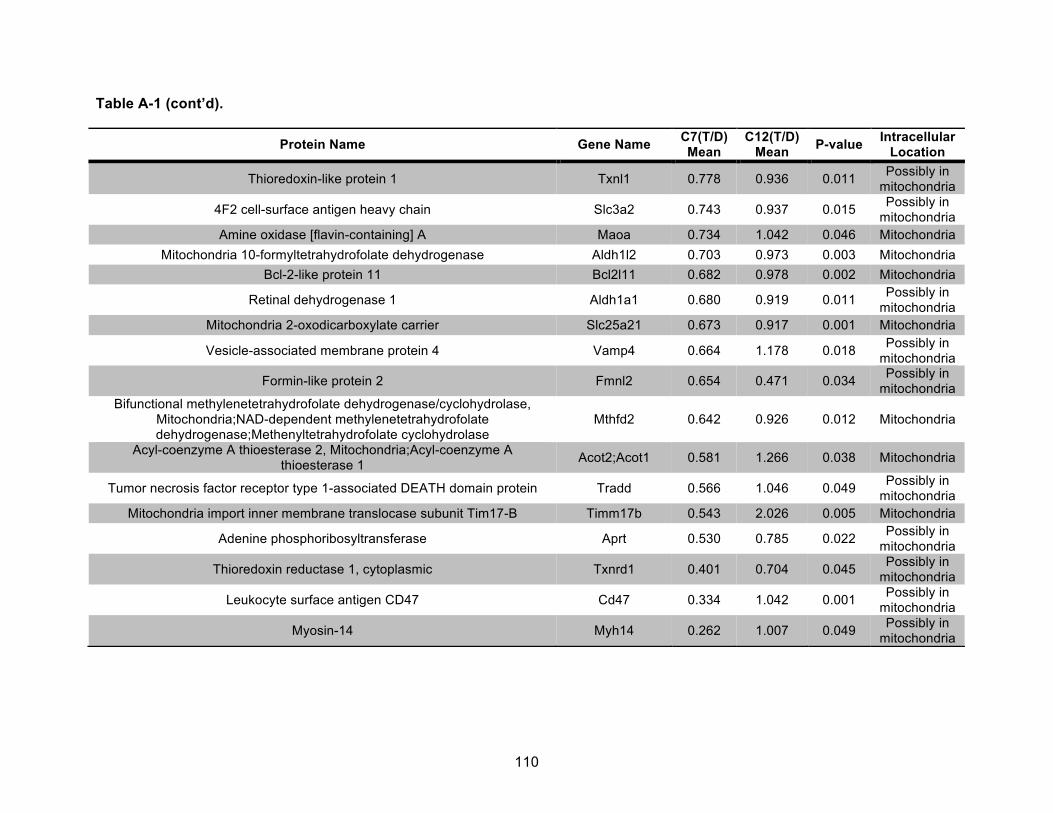
110
Table A-1 (cont’d).
Protein Name Gene Name C7(T/D) Mean
C12(T/D) Mean P-value Intracellular
Location
Thioredoxin-like protein 1 Txnl1 0.778 0.936 0.011 Possibly in mitochondria
4F2 cell-surface antigen heavy chain Slc3a2 0.743 0.937 0.015 Possibly in mitochondria
Amine oxidase [flavin-containing] A Maoa 0.734 1.042 0.046 Mitochondria Mitochondria 10-formyltetrahydrofolate dehydrogenase Aldh1l2 0.703 0.973 0.003 Mitochondria
Bcl-2-like protein 11 Bcl2l11 0.682 0.978 0.002 Mitochondria
Retinal dehydrogenase 1 Aldh1a1 0.680 0.919 0.011 Possibly in mitochondria
Mitochondria 2-oxodicarboxylate carrier Slc25a21 0.673 0.917 0.001 Mitochondria
Vesicle-associated membrane protein 4 Vamp4 0.664 1.178 0.018 Possibly in mitochondria
Formin-like protein 2 Fmnl2 0.654 0.471 0.034 Possibly in mitochondria
Bifunctional methylenetetrahydrofolate dehydrogenase/cyclohydrolase, Mitochondria;NAD-dependent methylenetetrahydrofolate dehydrogenase;Methenyltetrahydrofolate cyclohydrolase
Mthfd2 0.642 0.926 0.012 Mitochondria
Acyl-coenzyme A thioesterase 2, Mitochondria;Acyl-coenzyme A thioesterase 1 Acot2;Acot1 0.581 1.266 0.038 Mitochondria
Tumor necrosis factor receptor type 1-associated DEATH domain protein Tradd 0.566 1.046 0.049 Possibly in mitochondria
Mitochondria import inner membrane translocase subunit Tim17-B Timm17b 0.543 2.026 0.005 Mitochondria
Adenine phosphoribosyltransferase Aprt 0.530 0.785 0.022 Possibly in mitochondria
Thioredoxin reductase 1, cytoplasmic Txnrd1 0.401 0.704 0.045 Possibly in mitochondria
Leukocyte surface antigen CD47 Cd47 0.334 1.042 0.001 Possibly in mitochondria
Myosin-14 Myh14 0.262 1.007 0.049 Possibly in mitochondria
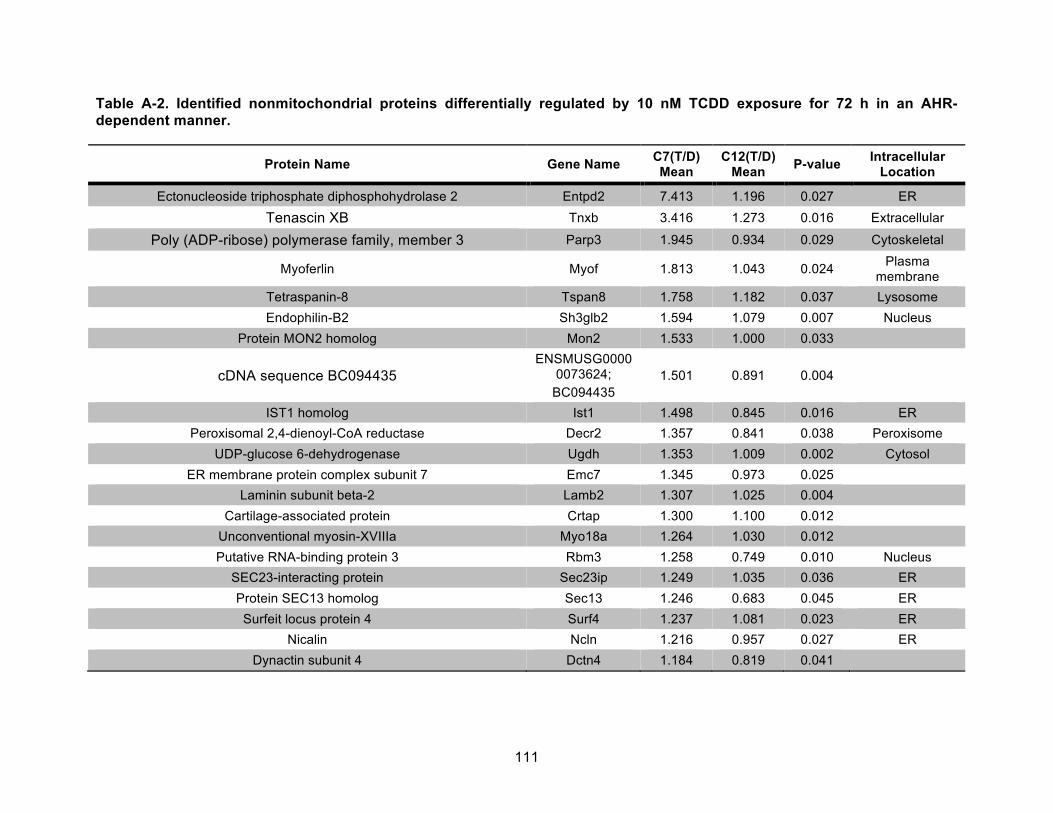
111
Table A-2. Identified nonmitochondrial proteins differentially regulated by 10 nM TCDD exposure for 72 h in an AHR-dependent manner.
Protein Name Gene Name C7(T/D) Mean
C12(T/D) Mean P-value Intracellular
Location
Ectonucleoside triphosphate diphosphohydrolase 2 Entpd2 7.413 1.196 0.027 ER Tenascin XB Tnxb 3.416 1.273 0.016 Extracellular
Poly (ADP-ribose) polymerase family, member 3 Parp3 1.945 0.934 0.029 Cytoskeletal
Myoferlin Myof 1.813 1.043 0.024 Plasma membrane
Tetraspanin-8 Tspan8 1.758 1.182 0.037 Lysosome Endophilin-B2 Sh3glb2 1.594 1.079 0.007 Nucleus
Protein MON2 homolog Mon2 1.533 1.000 0.033
cDNA sequence BC094435 ENSMUSG0000
0073624; BC094435
1.501 0.891 0.004
IST1 homolog Ist1 1.498 0.845 0.016 ER Peroxisomal 2,4-dienoyl-CoA reductase Decr2 1.357 0.841 0.038 Peroxisome
UDP-glucose 6-dehydrogenase Ugdh 1.353 1.009 0.002 Cytosol ER membrane protein complex subunit 7 Emc7 1.345 0.973 0.025
Laminin subunit beta-2 Lamb2 1.307 1.025 0.004
Cartilage-associated protein Crtap 1.300 1.100 0.012
Unconventional myosin-XVIIIa Myo18a 1.264 1.030 0.012
Putative RNA-binding protein 3 Rbm3 1.258 0.749 0.010 Nucleus
SEC23-interacting protein Sec23ip 1.249 1.035 0.036 ER Protein SEC13 homolog Sec13 1.246 0.683 0.045 ER Surfeit locus protein 4 Surf4 1.237 1.081 0.023 ER
Nicalin Ncln 1.216 0.957 0.027 ER Dynactin subunit 4 Dctn4 1.184 0.819 0.041
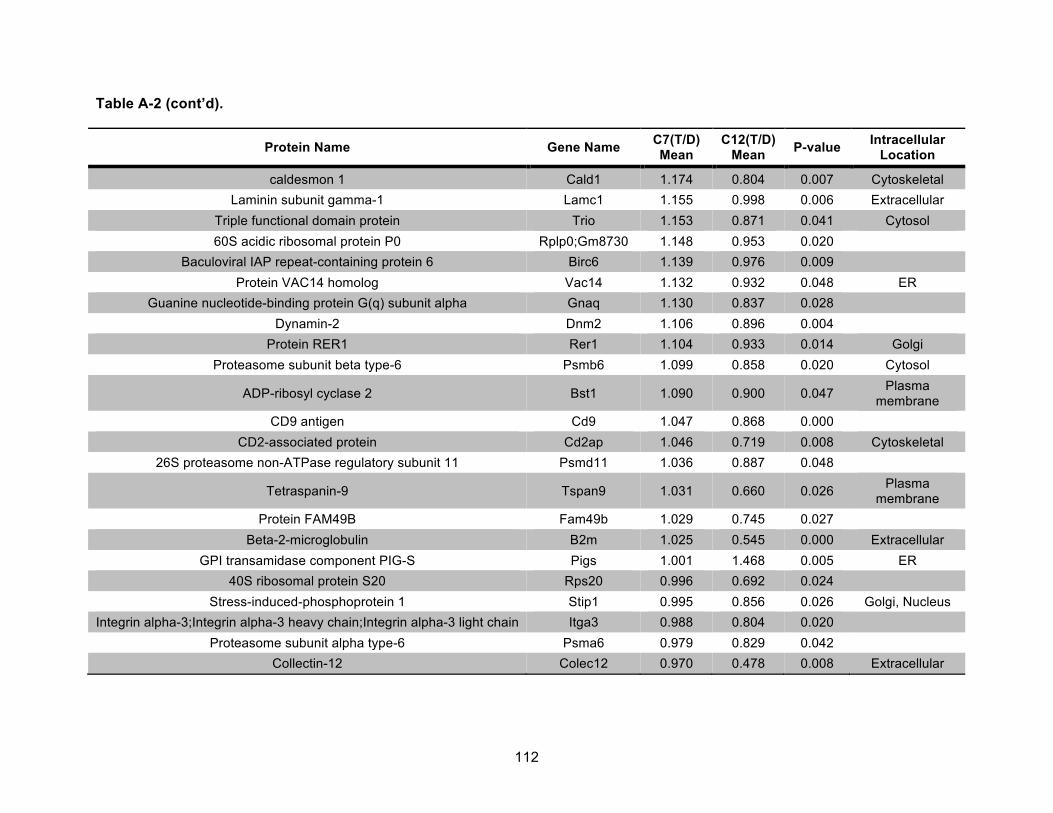
112
Table A-2 (cont’d).
Protein Name Gene Name C7(T/D) Mean
C12(T/D) Mean P-value Intracellular
Location
caldesmon 1 Cald1 1.174 0.804 0.007 Cytoskeletal Laminin subunit gamma-1 Lamc1 1.155 0.998 0.006 Extracellular
Triple functional domain protein Trio 1.153 0.871 0.041 Cytosol 60S acidic ribosomal protein P0 Rplp0;Gm8730 1.148 0.953 0.020
Baculoviral IAP repeat-containing protein 6 Birc6 1.139 0.976 0.009
Protein VAC14 homolog Vac14 1.132 0.932 0.048 ER
Guanine nucleotide-binding protein G(q) subunit alpha Gnaq 1.130 0.837 0.028
Dynamin-2 Dnm2 1.106 0.896 0.004
Protein RER1 Rer1 1.104 0.933 0.014 Golgi Proteasome subunit beta type-6 Psmb6 1.099 0.858 0.020 Cytosol
ADP-ribosyl cyclase 2 Bst1 1.090 0.900 0.047 Plasma membrane
CD9 antigen Cd9 1.047 0.868 0.000
CD2-associated protein Cd2ap 1.046 0.719 0.008 Cytoskeletal 26S proteasome non-ATPase regulatory subunit 11 Psmd11 1.036 0.887 0.048
Tetraspanin-9 Tspan9 1.031 0.660 0.026 Plasma
membrane Protein FAM49B Fam49b 1.029 0.745 0.027
Beta-2-microglobulin B2m 1.025 0.545 0.000 Extracellular
GPI transamidase component PIG-S Pigs 1.001 1.468 0.005 ER 40S ribosomal protein S20 Rps20 0.996 0.692 0.024
Stress-induced-phosphoprotein 1 Stip1 0.995 0.856 0.026 Golgi, Nucleus
Integrin alpha-3;Integrin alpha-3 heavy chain;Integrin alpha-3 light chain Itga3 0.988 0.804 0.020
Proteasome subunit alpha type-6 Psma6 0.979 0.829 0.042
Collectin-12 Colec12 0.970 0.478 0.008 Extracellular
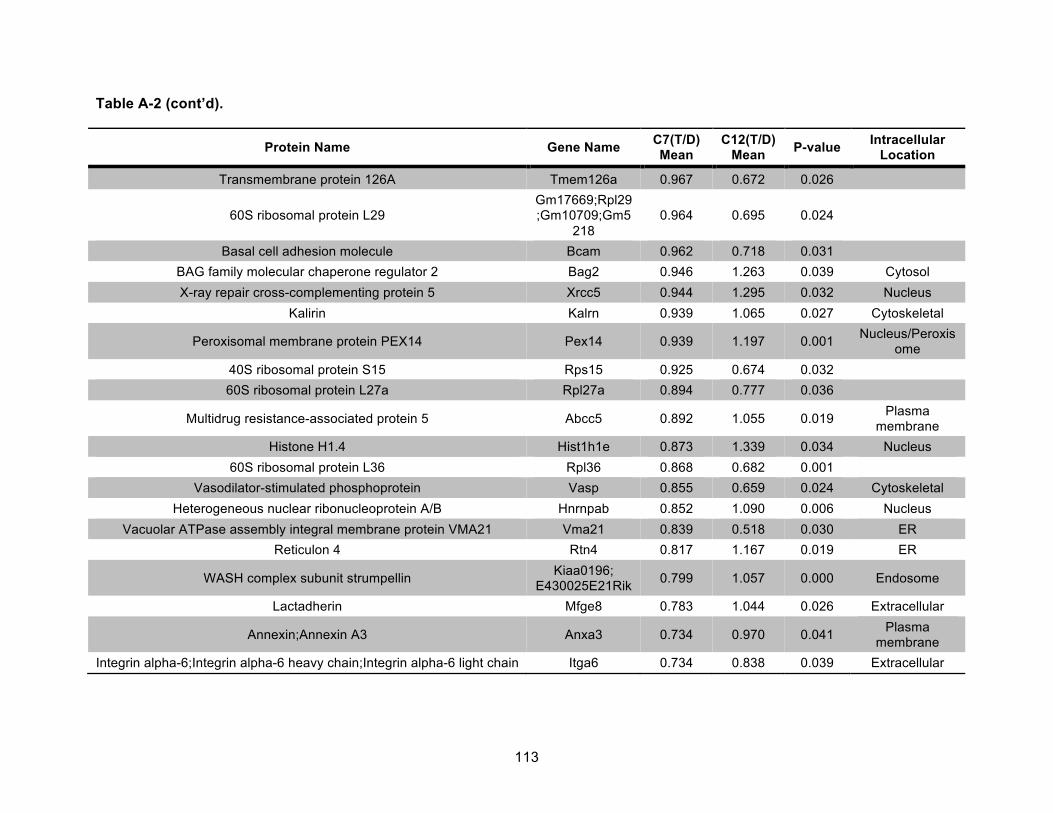
113
Table A-2 (cont’d).
Protein Name Gene Name C7(T/D) Mean
C12(T/D) Mean P-value Intracellular
Location
Transmembrane protein 126A Tmem126a 0.967 0.672 0.026
60S ribosomal protein L29 Gm17669;Rpl29;Gm10709;Gm5
218 0.964 0.695 0.024
Basal cell adhesion molecule Bcam 0.962 0.718 0.031
BAG family molecular chaperone regulator 2 Bag2 0.946 1.263 0.039 Cytosol X-ray repair cross-complementing protein 5 Xrcc5 0.944 1.295 0.032 Nucleus
Kalirin Kalrn 0.939 1.065 0.027 Cytoskeletal
Peroxisomal membrane protein PEX14 Pex14 0.939 1.197 0.001 Nucleus/Peroxisome
40S ribosomal protein S15 Rps15 0.925 0.674 0.032
60S ribosomal protein L27a Rpl27a 0.894 0.777 0.036
Multidrug resistance-associated protein 5 Abcc5 0.892 1.055 0.019 Plasma membrane
Histone H1.4 Hist1h1e 0.873 1.339 0.034 Nucleus 60S ribosomal protein L36 Rpl36 0.868 0.682 0.001
Vasodilator-stimulated phosphoprotein Vasp 0.855 0.659 0.024 Cytoskeletal
Heterogeneous nuclear ribonucleoprotein A/B Hnrnpab 0.852 1.090 0.006 Nucleus Vacuolar ATPase assembly integral membrane protein VMA21 Vma21 0.839 0.518 0.030 ER
Reticulon 4 Rtn4 0.817 1.167 0.019 ER
WASH complex subunit strumpellin Kiaa0196; E430025E21Rik 0.799 1.057 0.000 Endosome
Lactadherin Mfge8 0.783 1.044 0.026 Extracellular
Annexin;Annexin A3 Anxa3 0.734 0.970 0.041 Plasma membrane
Integrin alpha-6;Integrin alpha-6 heavy chain;Integrin alpha-6 light chain Itga6 0.734 0.838 0.039 Extracellular
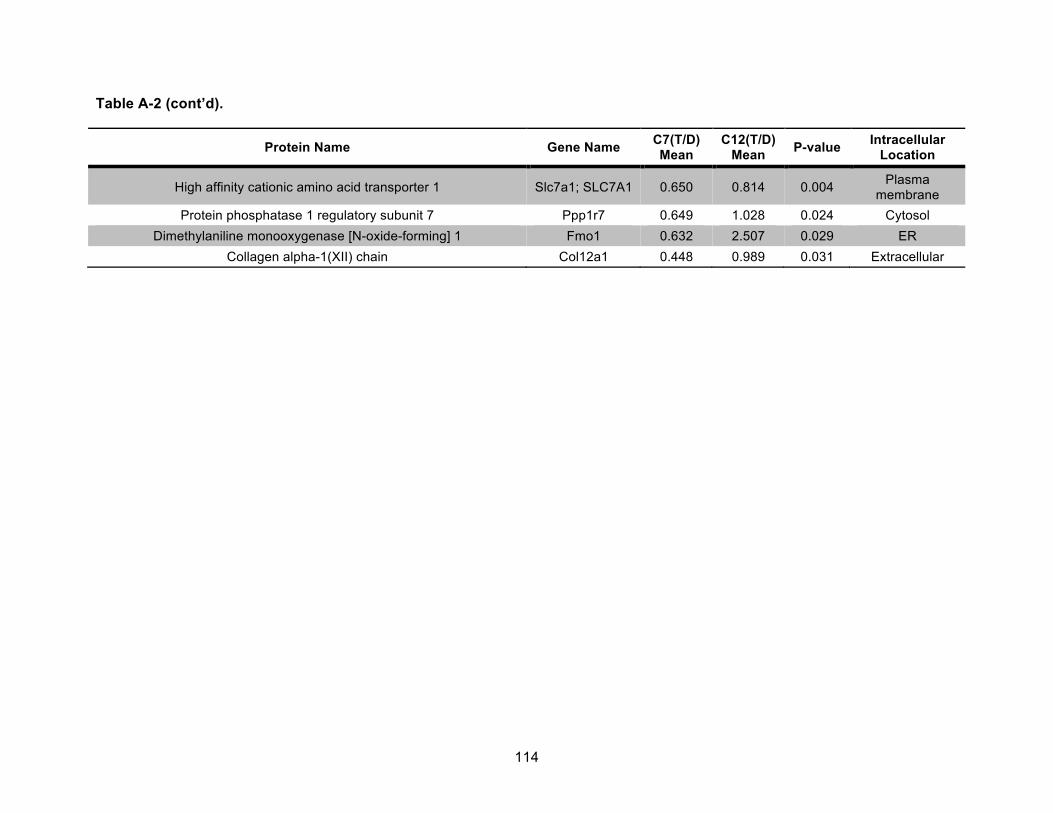
114
Table A-2 (cont’d).
Protein Name Gene Name C7(T/D) Mean
C12(T/D) Mean P-value Intracellular
Location
High affinity cationic amino acid transporter 1 Slc7a1; SLC7A1 0.650 0.814 0.004 Plasma membrane
Protein phosphatase 1 regulatory subunit 7 Ppp1r7 0.649 1.028 0.024 Cytosol Dimethylaniline monooxygenase [N-oxide-forming] 1 Fmo1 0.632 2.507 0.029 ER
Collagen alpha-1(XII) chain Col12a1 0.448 0.989 0.031 Extracellular
115
APPENDIX B. HYPOXIA INDUCIBLE FACTORS (HIFs) MODULATE MITOCHONDRIAL
OXYGEN CONSUMPTION AND TRANSCRIPTIONAL REGULATION OF NUCLEAR-
ENCODED ELECTRON TRANSPORT CHAIN GENES
Authors: Hye Jin Hwang, Scott G. Lynn, Ajith Vengellur, Yogesh Saini, Elizabeth A. Grier, Shelagh M. Ferguson-Miller, and John J. LaPres
This chapter is adapted with permission from Biochemistry, 2015, 54 (24), 3739–3748.
Copyright 2015 American Chemical Society.
116
Abstract
Hypoxia inducible factor-1 (HIF1) is a stress-responsive nuclear transcription factor that
is activated with a decrease in oxygen availability. HIF1 regulates the expression of genes
involved in a cell’s adaptation to hypoxic stress, including those with mitochondrial specific
function. To gain a more comprehensive understanding of the role of HIF1 in mitochondrial
homeostasis, we studied the link between hypoxia, HIF1 transactivation, and electron transport
chain (ETC) function. We established immortalized mouse embryonic fibroblasts (MEFs) for
HIF1α wild-type (WT) and null cells and tested whether HIF1α regulates mitochondrial
respiration by modulating gene expressions of nuclear encoded ETC components. High-
throughput quantitative real-time polymerase chain reaction was performed to screen nuclear
encoded mitochondrial genes related to the ETC to identify those whose regulation was HIF1α-
dependent. Our data suggest that HIF1α regulates transcription of cytochrome c oxidase (CcO)
heart/muscle isoform 7a1 (Cox7a1) under hypoxia where it is induced 1.5-2.5 fold, whereas
Cox4i2 hypoxic induction was HIF1α-independent. We propose that adaptation to hypoxic
stress of CcO as the main cellular oxygen consumer is mediated by induction of hypoxia-
sensitive tissue-specific isoforms. We suggest that HIF1 plays a central role in maintaining
homeostasis in cellular respiration during hypoxic stress via regulation of CcO activity.
117
Introduction
Hypoxia is defined as a state in which the level of oxygen drops below normal in cells or
tissues.211 Hypoxia causes stress within a cell that disrupts homeostasis and these hypoxia-
induced disruptions are associated with all of the leading causes of death in the United States,
including cardiovascular disease, strokes, and cancer.169, 212 Because of the detrimental effects
of decreased oxygen tension, primarily at the level of energetics, organisms have developed a
programmed response to this condition.213 This response is predominantly aimed at increasing
the level of glucose utilization at the cellular level and the stimulation of erythropoiesis and
angiogenesis at organismal levels.212 This occurs primarily through the transcriptional
regulation of genes involved in these processes, such as those for glycolytic enzymes and
transporters (Gapdh and Slc2a1), erythropoietin (Epo), and vascular endothelial growth factor
(Vegfa). The transcriptional response to hypoxia is primarily regulated by a subset of the PAS
superfamily of proteins, the hypoxia inducible factors.211, 212
Hypoxia inducible factors (HIFs), which include HIF1α, HIF2α, HIF3α, aryl hydrocarbon
receptor nuclear translocator (ARNT, also known as HIF1b) and ARNT2, are transcriptional
regulators whose activity is sensitive to decreases in oxygen availability.169, 212 HIF1α, HIF2α,
and HIF3α are primarily cytoplasmic and, under normal oxygen tension conditions, are quickly
degraded by the ubiquitin pathway. This degradation is dependent upon protein motifs, termed
oxygen-dependent degradation domains (ODDs), found near the carboxy terminus of the
protein.212 The hydroxylation of conserved residues within the ODD by oxygen-requiring prolyl
hydroxylase domain-containing proteins (PHDs) targets HIFs for proteasomal degradation.
Under hypoxic conditions, HIFs are stabilized and translocate to the nucleus where they are free
to form dimers with ARNT or ARNT2. These heterodimers bind genomic DNA at sites called
hypoxia response elements (HREs) to modulate transcription.212 Though HIFs are the primary
mediators of the cellular response to hypoxic stress, HIF-independent signaling pathways also
play a significant role following exposure to low levels of oxygen.214, 215
118
Hypoxia directly impacts mitochondrial function by limiting the availability of oxygen
necessary to complete the electron transport chain (ETC). Mitochondria utilize approximately
90% of cellular oxygen and, in return, generate approximately 90% of the total cellular energy
(ATP) in normal tissues.216, 217 Aerobic respiration involves three distinct phases: oxidation of
substrates (e.g., glucose), electron transport, and oxidative phosphorylation (OXPHOS). In this
process, reducing equivalents, primarily derived from the tricarboxylic acid (TCA) cycle, are
transferred to the ETC and ultimately to O2. The energetically favorable movement of electrons
within the ETC is coupled to the production of an electrochemical gradient across the inner
membrane of the mitochondria, which is used to drive ATP synthesis. The critical role of
oxygen in this process makes the ability to cope with changes in oxygen tension a metabolic
priority. To maintain necessary energy levels under hypoxic stress, eukaryotic cells adapt by
switching to anaerobic metabolism and substrate level phosphorylation. Most of the regulation
necessary to make this metabolic switch is provided by HIF1 via transcriptional regulation of a
battery of genes, including glycolytic enzymes, glucose transporters, and pyruvate
dehydrogenase kinase.218 HIF1 also impacts mitochondrial function via transcriptional
regulation of Bcl-2/adenovirus E1B 19 kDa-interacting protein3 (Bnip3) expression.219, 220 In
addition, HIF1 negatively regulates mitochondrial biogenesis and O2 consumption by activating
the transcription of genes that regulate c-Myc and by suppressing mitochondrial gene
expression nontranscriptionally.218, 221
The respiratory chain in the inner mitochondrial membrane contains four enzyme
complexes (I-IV) through which electrons pass on their way to reducing O2 to water. Complex
IV, cytochrome c oxidase (CcO), transfers the electrons from cytochrome c to O2 for the
exergonic oxygen reduction reaction, which is utilized for the proton pump. Mammalian CcO
crystallizes as a dimer, with each monomer containing 13 subunits, where subunits 1-3 are
encoded by the mitochondrial genome. The other 10 subunits are nuclear-encoded proteins
with COX4, COX6A, COX6B, COX7A, and COX8 having tissue- and species-specific
119
isoforms.210, 222-224 COX4, specifically isoform 1 (Cox4i1), has been implicated in the allosteric
inhibition of CcO via binding of ATP to the matrix domain.116, 225 Hypoxia was shown to
upregulate Cox4i2 isoform expression in liver and lung, which can alter CcO activity, ATP levels,
and ROS production and is proposed as a mechanism for protecting tissues from oxidative
damage.226, 227 Cox6a isoforms are postulated to participate in mammalian thermogenesis by
decreasing H+/e- ratios and increasing respiration and heat production.116 Cox7a1 is expressed
tissue-specifically in heart and skeletal muscle, and Cox7a2, a liver-type isoform, is expressed
ubiquitously. Though it has been suggested that Cox7a isoforms are associated with glucose
uptake, total body aerobic capacity, StAR expression, and steroidogenesis, very little is known
about the function of this isoform pair.228, 229
To gain a more comprehensive understanding of the link between hypoxic stress, HIF1α
activation, and mitochondrial function, we generated two immortalized cell lines [Hif1α, wild-type
(WT) and null] and measured extracellular oxygen levels (indicative of oxygen consumption
rates) after exposure to mitochondrial modulators. Following challenge, the cells were also
assessed for changes in mitochondrial function and the expression of genes that encode
proteins that are important for ETC and OXPHOS via a comprehensive qPCR screen. The
results revealed HIF1α-responsive genes within the ETC, especially in complex IV, subunit 7a1
of cytochrome c oxidase (Cox7a1). Finally, the results suggest that Hif1a plays a central role in
regulating the specific activity of CcO under various experimental conditions. This most likely
involves various mechanisms, such as allosteric regulation, the redox status of the cell, and, in
cells that express both subunits, complex composition.
120
Materials and Methods
Mouse Embryonic Fibroblast (MEF) Isolation
Hif1αflox/flox transgenic mice were generous gifts from R. Johnson (University of
Cambridge, Cambridge, U.K.). Mice used in this study were kept at the animal housing facility
under strict hygienic and pathogen-free conditions approved by the University Laboratory
Animal Resource regulatory unit. All procedures were performed with the approval of the
Michigan State University Committee on Animals Use and Care. Genotype-specific
homozygous male and female mice were mated, and the females were kept isolated until day
14 of gestation (vaginal plug detection day was considered as day 0). Dams were anesthetized
in a CO2 chamber for 90 s and then sacrificed using cervical dislocation. Embryos were
surgically removed from the uterine horns and processed for fibroblast isolation using a protocol
adapted from previous reports.230 Briefly, after surgical excision, embryos were transferred to a
sterile cell culture hood, washed with 70% ethanol and PBS, cleaned (removal of liver, limbs
and head), diced, incubated with trypsin/EDTA at 37 °C for 30 min and then passed through a
22 gauge needle onto a 10 cm plate and placed in a 37 °C incubator.
Cell Culture
High-glucose (Glc) MEF medium was Dulbeco's modified Eagle’s medium (DMEM)
(#11965, Gibco, Grand Island, NY) containing glucose (4500 mg/L) supplemented with 10%
heat inactivated fetal bovine serum (FBS), 100 U/mL penicillin, 100 µg/mL streptomycin, 2mM L-
glutamine, 0.1 mM nonessential amino acids, and 10 mM HEPES (pH 7.8). Galactose (Gal)
MEF medium was glucose-free DMEM (#11966, Gibco) supplemented with 10 mM galactose
and all additives described above. All cell culture work, unless otherwise specified, was
performed under standard cell culture conditions (5% CO2, 35% humidity, and 37 °C) in a
NAPCO 7000 incubator (NAPCO, Winchester, VA) for normoxic conditions (21% O2) or in an O2
121
Controlled Glove Box (Coy Laboratory Products Inc., Grass Lake, MI) for hypoxic conditions
(1% O2).
MEF Cell Line Generation and Genotyping
Freshly isolated MEF cells were plated in 10 cm plates at ~70% confluency with Glc
medium changed daily. Cells were then immortalized by transfection with a plasmid construct
(pRNS) containing the SV-40 large T antigen (a generous gift from C.C. Chang, Michigan State
University) using Lipofectamine 2000 (Invitrogen, Carlsbad, CA) following the manufacturer’s
instructions. Positive stable integrants were selected with 300 µg/mL of G418 (Gibco). G418
resistant cells were split and infected with either LacZ recombinant (Ad-CMV-b-Gal) or Cre
recombinase (Ad-CMV-Cre) adenovirus (Vector BioLabs, Philadelphia, PA) at 4000 multiplicity
of infection for 48 h. Cells were then plated at very low densities (100 cells/15 cm plate) and
when individual colonies became visible, clones were isolated and genotyped. Four WT and
four null clones for Hif1α were pooled in equal numbers to generate two cell lines, Hif1α WT and
Hif1α null. For genotyping, cell lines were grown to confluency in a 6 cm plate, rinsed and
scraped with cold PBS (4 °C), and collected by centrifugation. Genomic DNA extraction and
genotyping were performed on the cell pellet as previously described (primers F, TTG GGG
ATG AAA ACA TCT GC; primer R, GCA GTT AAG AGC ACT AGT TG).231 The size of the
amplified gene for Hif1α WT was 962 bp.
Nuclear Protein Preparation
MEF cells were grown in 15 cm plates to confluency under normoxic (21% O2) or
hypoxic (1% O2) conditions or with 150 µM CoCl2 for 24 h, and protein extracts were prepared
as described previously.169 Briefly, cells were washed with cold PBS (4 °C) and removed from
the plate surface by being scraped in cold (4 °C) PBS and collected by centrifugation. Nuclear
122
fractions were prepared by lysing the cells in 10 mM Tris (pH 7.5), 1.5 mM MgCl2, 10 mM KCl
supplemented with Complete-mini EDTA-free protease inhibitor tablets (Roche Applied Science,
Indianapolis, IN), 2 mM DTT, 1 mM Na3VO4, and 0.4 mM PMSF and kept on ice for 10 min.
Nuclei were collected by centrifugation (12000g for 10 min) and resuspended in 20 mM Tris (pH
7.5), 0.42 M KCl, 20% glycerol, and 1.5 mM MgCl2 supplemented as dscribed above and
rotated for 45 min at 4 °C. Insoluble material was removed by centrifugation (20000g for 10
min), and the protein concentrations of the supernatant were determined using the Bio-Rad
(Hercules, CA) Bradford assay kit and BSA standards.178 Protein samples were analyzed for
HIF1α stabilization through Western blotting.
Mitochondrial Protein Preparation
MEF cells were grown in 15 cm plates to confluency under normoxic (21% O2) or
hypoxic (1% O2) conditions for 24 h, and mitochondria were isolated using a protocol adapted
from a previous report.168 Briefly, cells were washed with cold PBS (4 °C) and removed from
the plate surface by being scraped in solution A (0.25 M sucrose, 20 mM HEPES, 10 mM KCl,
1.5 mM MgCl2, 1 mM EDTA, 1 mM EGTA, 1 mM DTT, and 0.1 mM PMSF). Samples were then
subjected to three freeze/thaw cycles with mixing by pipet for each thaw, and insoluble material
was removed by centrifugation (700g for 10 min at 4 °C). The supernatant was further cleared
by centrifugation (10000g for 15 min at 4 °C) and aspirated, and the pellet was resuspended in
solution A. Mitochondrial protein concentrations were determined using Bio-Rad Bradford
assay kit and BSA standards.178 Protein samples were analyzed for CcO enzyme activity.
Western Blotting
Protein samples were separated by sodium dodecyl sulfate−polyacrylamide gel
electrophoresis (SDS-PAGE) and transferred to a nitrocellulose membrane. Western blots were
123
performed with rabbit antibodies against HIF1α (NB100-479, Novus Biologicals, Inc., Littleton,
CO) and β-actin (SC-7210, Santa Cruz Biotechnology, Inc., Dallas, TX). Proteins were
visualized with horseradish peroxidase-conjugated goat anti-rabbit IgG (sc-2004, Santa Cruz
Biotechnology, Inc.) and an ECL Western blot system (Pierce, Rockford, IL).
Oxygen Consumption Rate (OCR) Measurements
OCR was measured using an XF24 Extracellular Flux Analyzer (Seahorse Bioscience,
Billerica, MA) as described in the manufacturer’s instructions. Hif1α WT and null cells,
preadapted to medium glucose levels for 24 h, were plated in Glc or Gal medium at a density of
40000 cells/well and were allowed to adhere to the plate for 24 h. The culture medium was then
replaced with specific XF24 assay medium. Glc XF24 assay medium consisted of DMEM base
(#D5030, Sigma-Aldrich, St. Louis, MO) supplemented with 25 mM glucose, 31 mM NaCl, 1 mM
sodium pyruvate (Atlanta Biologicals, Inc., Flowery Branch, GA), 2 mM GlutaMAX (Gibco) and
15 mg/L phenol red (Sigma-Aldrich). Gal XF24 assay medium consisted of DMEM base
(#D5030, Sigma-Aldrich) supplemented with 10 mM galactose instead of glucose and all
additives described above. Measurement of OCR was started 90 min after switching XF24
assay medium and the inhibitors of ETC and OXPHOS system were injected in the following
order: oligomycin A (1 µM), CCCP (1.5 µM for WT and 0.75 µM for null cells), and rotenone (0.5
µM)/antimycin A (0.5 µM). The concentration of CCCP for each cell line was optimized by
measuring OCR in different nutrient environments, Glc or Gal XF24 assay medium. After OCR
had been measured, cells were washed with cold PBS and lysed in buffer [10 mM Tris-HCl (pH
7.5) and 0.1% Triton X-100] by being frozen and thawed. The total protein amounts in each well
were determined using a Bio-Rad Bradford assay kit and BSA standards.178 The OCR
(picomoles per minute) was divided by total protein amounts for each well, and spare respiratory
capacity was calculated by manufacturer’s software, the XF Mito Stress Test Report Generator.
124
RNA Isolation and Quantitative Real-Time PCR (qPCR)
RNA was isolated from the two different cell strains cultured in different carbon sources
and at different oxygen tensions using TRIzol reagent via the manufacturer’s instructions
(Invitrogen). RNA pellets were resuspended in ddH2O and quantified spectrophotometrically
(260 nm). Total RNA (2 µg) was reverse transcribed by SuperScript III using an anchored oligo-
(dT)20 primer as described by the manufacturer (Invitrogen). The resulting cDNA was diluted in
ddH2O and used as a template for high-throughput qPCR (HTP qPCR) and manual qPCR.
Primer pairs were designed to amplify 104 nuclear genes that encode specific mitochondrially
related proteins (table B-1). In total, 40 ETC complex I, 4 ETC complex II, 16 ETC complex III,
15 ETC complex IV, and 19 ETC complex V genes were assayed. Five uncoupling proteins,
three chaperone, three housekeeping reference, and five control genes (one stress responsive
gene and four HIF1α-responsive genes) were also examined.
HTP qPCR mixtures consisting of 2 µL of cDNA, 0.3 µM of each primer and 2X Power
SYBR Green PCR Master Mix (Applied Biosystems, Foster City, CA) were aliquoted into 384-
well plates using a Biomeck 2000 Laboratory Automation Workstation (Beckman Coulter Inc.,
Fullerton, CA). Amplification was conducted using an Applied Biosystems PRISM 7900HT
Sequence Detection System. Quantification was determined using the comparative CT method
(∆∆CT) (Applied Biosystems). The geometric mean of the expression of three housekeeping
genes (Actb, Hprt, and Ppia) was used to control for differences in RNA loading, quality, and
cDNA synthesis. Fold changes in expression were calculated with HTP qPCR results using the
∆∆CT method with the WT Glc control (WT Glc Ctrl) group for each time point (4 and 24 h) being
scaled to equal 1. Cluster version 3.0 software was used to generate average linkage files, and
Maple Tree version 0.2.3.2 BETA (http://sourceforge.net/projects/mapletree/) was used to
create colored dendrograms from the linkage files, where red indicates upregulation and green
indicates downregulation.232
125
Manual qPCR was performed with 25 µL reactions (5 µL of cDNA template, each primer
at 0.3 µM, 3 mM MgCl2, 200 µM dNTPs, 0.6 unit of AmpliTaq Gold and 10X SYBR Green PCR
Buffer) and amplified using an Applied Biosystems PRISM 7000 Sequence Detection System.
The Hprt housekeeping gene was a reference and expression levels of key genes (Slc2a1,
Vegfa, Cox4i1, Cox4i2, Bnip3, Cox6a1, Cox6a2, Cox7a1, and Cox7a2) were calculated using
the ∆∆CT method. Fold changes of Slc2a1, Vegfa, and Bnip3 were calculated compared to the
WT Glc control group (WT Glc Ctrl) for 24 h being scaled to equal 1. Fold changes of Cox4i1,
Cox4i2, Cox6a1, Cox6a2, Cox7a1, and Cox7a2 were expressed compared to the WT Glc Ctrl of
one isoform of each Cox subunit for 24 h being scaled to equal 1.
Measurement of CcO Enzyme Activity
CcO activity was determined as previously described with slight modifications.233 Bovine
heart cytochrome c was dissolved in assay buffer (40 mM phosphate buffer and 0.5% Tween
80) at 0.4 mg/mL and was reduced using sodium dithionite. The fully reduced cytochrome c
was confirmed by the ratio of absorbance at 550 and 565 nm, and the change in absorbance at
550 nm was recorded as a function of time for the CcO assay. After the absorbance at 550 nm
of reduced cytochrome c (Ared) had been recorded, isolated mitochondria were added and the
absorbance at 550 nm was recorded every 5 s for 3 min. The CcO activity was calculated using
the expression
(∆Abs550/min)×(total assay volume)
/[19.6 mM-1×(mitochondrial volume)×(mitochondrial concentration)]
with units of micromoles per min per milligram. The specific activity was calculated as a
turnover number in inverse minutes, dividing CcO activity in micromoles per min per milligram
protein by mitochondrial CcO concentration in micromoles per milligram protein. The
126
absorbance for CcO activity was measured using a SpectraMax M2 spectrophotometer
(Molecular Devices, Sunnyvale, CA).
Mitochondrial CcO Measurement
The concentration of cytochrome aa3 (CcO) was determined as previously described234
by measuring the visible difference spectra (dithionite-reduced minus ferricyanide-oxidized) of
the detergent solubilized mitochondria from 500 to 700 nm. The peak at 605 nm represented
the reduced minus oxidized peak of cytochrome a. The concentration of CcO was calculated
using the extinction coefficient for reduced-oxidized CcO of 24 mM-1cm-1 at 605-630 nm.
Statistical Analysis
The result of spare respiratory capacity was analyzed for significant differences by
analysis of variance (ANOVA) followed by Tukey’s post hoc test.
Results
Creation of Hif1α WT and Null Cells
The genotype of the Hif1α WT and Hif1α null cells was confirmed by PCR, and the
extent of recombination was approximately 100% in the nulls (Figure B-1A). To confirm the
functional deletion of the Hif1α gene, HIF1α protein levels following exposure to control
conditions (Ctrl), 150 µM CoCl2 (Co) or hypoxia (1% O2, Hyp) for 24 h were examined by
Western blot analysis (Figure B-1B). Hif1α null cells did not express HIF1α protein under CoCl2
or hypoxia, confirming that recombination-induced functional deletion of Hif1α gene was
approximately 100%.
127
Cellular Respiration in Hif1α WT and Null Cells under Different Energy Sources
To determine the role of HIF1α in cellular respiration, the extracellular oxygen flux of
each cell line in different nutrients was measured to calculate OCR (Figure B-2). OCR was
monitored in the presence of ETC and OXPHOS inhibitors, oligomycin (a), CCCP (b), and
rotenone/antimycin (c), in Hif1α WT and null cells in Glc and Gal media (Figure B-2A). It is
important to note that spare respiratory capacity was described as maximal respiration [i.e., the
OCR in presence of CCCP (44.9 min in Figure B-2A)] divided by a basal respiration (OCR at 9.9
min in Figure B-2A) times 100 (Figure B-2B). The Hif1α WT cells in both Glc and Gal media
had spare respiratory capacities significantly higher than those of Hif1α null cells in the Gal
media (WT Glc, 182%; WT Gal, 222 %; null Gal, 100 %). The Hif1α null cells in the Glc media
showed a spare respiratory capacity of 158 %, but this was not significant when compared to
that of null cells in the Gal media. Similar results were also observed in the two cell types and
under different conditions when pericellular oxygen consumption was measured using a
SensorDish® Reader (PreSens Precision Sensing GmbH, Regensburg, Germany)235 (data not
shown).
Screening HIF1-Dependent mRNA Expression of Nuclear-Encoded Mitochondrial Genes
The oxygen consumption data suggest that the cellular respiration efficiency in the two
cell types is inherently different. To further elucidate the role of HIF1α in mitochondrial function,
HTP qPCR was utilized to screen the expression levels of 104 nuclear-encoded genes
associated with the ETC and mitochondrial function. Hif1α WT and null cells were exposed to
control (Ctrl) conditions or 1% O2 (Hyp) in both Glc and Gal media for 4 and 24 h (Figure B-3A).
Compared to the 24 h time point, the 4 h time point showed a high percentage of downregulated
genes. Five groupings of differentially expressed genes are indicated in Figure B-3A. Group 1
has many genes that were upregulated at 4 h and downregulated at 24 h, including the complex
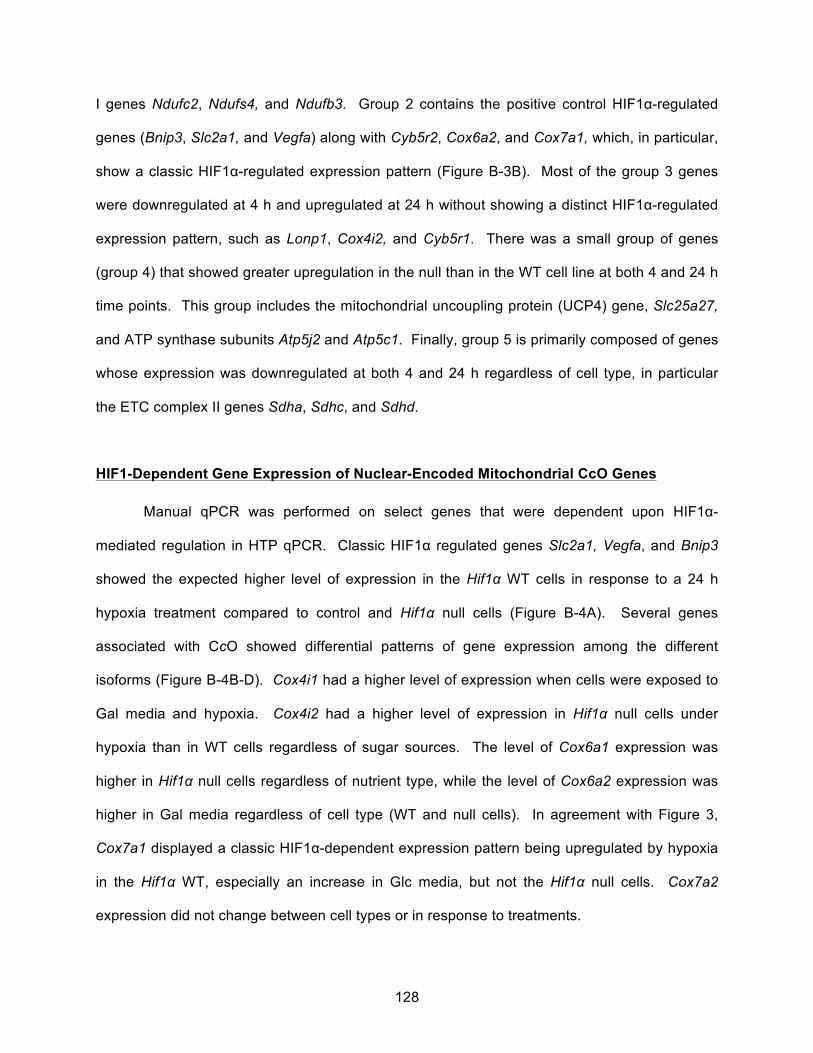
128
I genes Ndufc2, Ndufs4, and Ndufb3. Group 2 contains the positive control HIF1α-regulated
genes (Bnip3, Slc2a1, and Vegfa) along with Cyb5r2, Cox6a2, and Cox7a1, which, in particular,
show a classic HIF1α-regulated expression pattern (Figure B-3B). Most of the group 3 genes
were downregulated at 4 h and upregulated at 24 h without showing a distinct HIF1α-regulated
expression pattern, such as Lonp1, Cox4i2, and Cyb5r1. There was a small group of genes
(group 4) that showed greater upregulation in the null than in the WT cell line at both 4 and 24 h
time points. This group includes the mitochondrial uncoupling protein (UCP4) gene, Slc25a27,
and ATP synthase subunits Atp5j2 and Atp5c1. Finally, group 5 is primarily composed of genes
whose expression was downregulated at both 4 and 24 h regardless of cell type, in particular
the ETC complex II genes Sdha, Sdhc, and Sdhd.
HIF1-Dependent Gene Expression of Nuclear-Encoded Mitochondrial CcO Genes
Manual qPCR was performed on select genes that were dependent upon HIF1α-
mediated regulation in HTP qPCR. Classic HIF1α regulated genes Slc2a1, Vegfa, and Bnip3
showed the expected higher level of expression in the Hif1α WT cells in response to a 24 h
hypoxia treatment compared to control and Hif1α null cells (Figure B-4A). Several genes
associated with CcO showed differential patterns of gene expression among the different
isoforms (Figure B-4B-D). Cox4i1 had a higher level of expression when cells were exposed to
Gal media and hypoxia. Cox4i2 had a higher level of expression in Hif1α null cells under
hypoxia than in WT cells regardless of sugar sources. The level of Cox6a1 expression was
higher in Hif1α null cells regardless of nutrient type, while the level of Cox6a2 expression was
higher in Gal media regardless of cell type (WT and null cells). In agreement with Figure 3,
Cox7a1 displayed a classic HIF1α-dependent expression pattern being upregulated by hypoxia
in the Hif1α WT, especially an increase in Glc media, but not the Hif1α null cells. Cox7a2
expression did not change between cell types or in response to treatments.
129
HIF1α-Dependent Regulation of CcO Activity
The results of transcriptional CcO subunit expressions suggest that HIF1α plays a role in
modulating the expression of Cox7a1 and, potentially, other critical subunits. A biochemical
assessment of the CcO activity was performed to determine if its activity was influenced by
changes in Hif1α genotype. Hif1α WT and null cell lines were exposed to control conditions and
1% O2 for 24 h in both Glc and Gal media, and mitochondria were isolated. CcO activity and
quantity were assessed in these isolated mitochondria (Table B-2). The specific activity of CcO
remained fairly constant in both cell strains and different treatment paradigms, with two
exceptions. The WT cells showed a decrease in CcO activity following hypoxic exposure in Glc-
containing media that was not evident in Gal-containing media. In addition, the null cells grown
in Gal media showed an almost 3-fold increase in CcO specific activity under hypoxic stress.
This increase reflects both an increase in enzyme activity and a decrease in enzyme
concentration under these conditions. These data suggest that loss of HIF1α signaling removes
the cell’s ability to regulate CcO activity under hypoxic stress and that maintenance of this
activity below a given threshold is important for mitochondrial viability. However, the observed
changes in CcO activity under some conditions may not be explained by changes in CcO
isoform composition because Cox7a1 transcripts constitute <1% of total subunit 7a transcripts
in our cell lines (Figure B-4D) even after hypoxic induction (see Discussion).
COX7A Subunit and CcO Protein Structure
The hypoxia-induced expression of Cox7a1 appears to be HIF1a-dependent, and loss of
HIF1a signaling affects the capacity of mitochondria to regulate oxygen consumption and CcO
specific activity following hypoxic stress. In cells that express significant amounts of both
isoforms, HIF1a might alter subunit composition of CcO upon hypoxia exposure to maintain
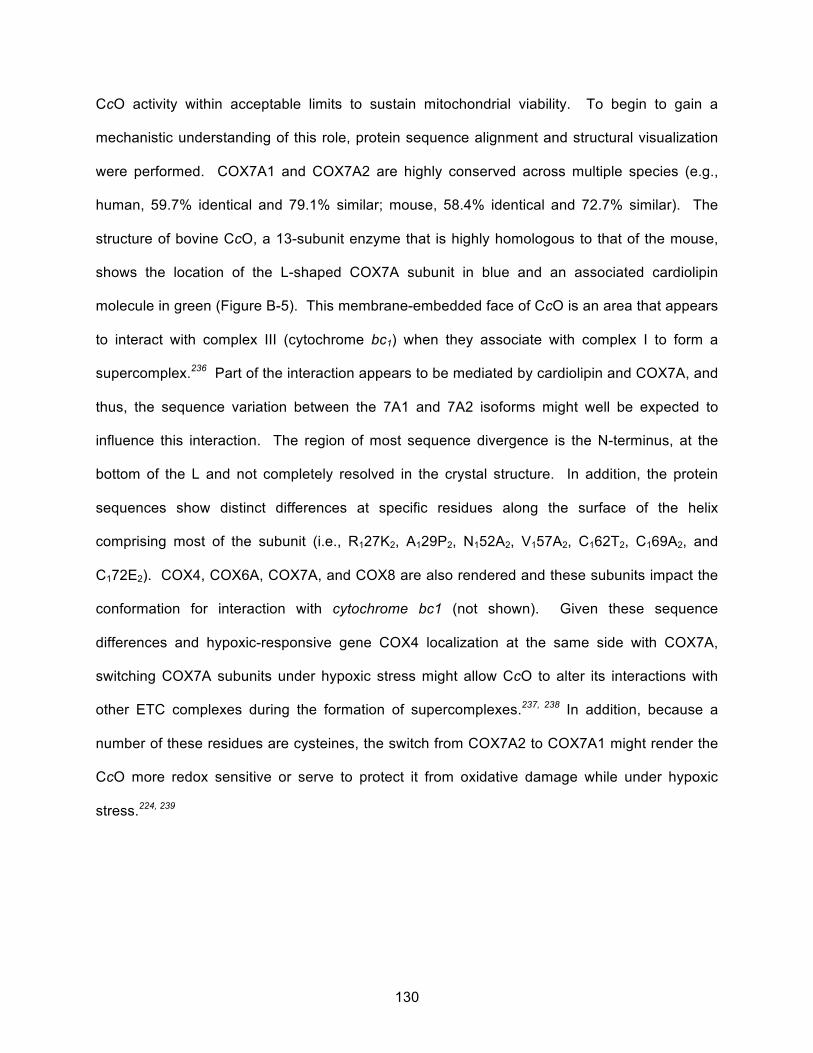
130
CcO activity within acceptable limits to sustain mitochondrial viability. To begin to gain a
mechanistic understanding of this role, protein sequence alignment and structural visualization
were performed. COX7A1 and COX7A2 are highly conserved across multiple species (e.g.,
human, 59.7% identical and 79.1% similar; mouse, 58.4% identical and 72.7% similar). The
structure of bovine CcO, a 13-subunit enzyme that is highly homologous to that of the mouse,
shows the location of the L-shaped COX7A subunit in blue and an associated cardiolipin
molecule in green (Figure B-5). This membrane-embedded face of CcO is an area that appears
to interact with complex III (cytochrome bc1) when they associate with complex I to form a
supercomplex.236 Part of the interaction appears to be mediated by cardiolipin and COX7A, and
thus, the sequence variation between the 7A1 and 7A2 isoforms might well be expected to
influence this interaction. The region of most sequence divergence is the N-terminus, at the
bottom of the L and not completely resolved in the crystal structure. In addition, the protein
sequences show distinct differences at specific residues along the surface of the helix
comprising most of the subunit (i.e., R127K2, A129P2, N152A2, V157A2, C162T2, C169A2, and
C172E2). COX4, COX6A, COX7A, and COX8 are also rendered and these subunits impact the
conformation for interaction with cytochrome bc1 (not shown). Given these sequence
differences and hypoxic-responsive gene COX4 localization at the same side with COX7A,
switching COX7A subunits under hypoxic stress might allow CcO to alter its interactions with
other ETC complexes during the formation of supercomplexes.237, 238 In addition, because a
number of these residues are cysteines, the switch from COX7A2 to COX7A1 might render the
CcO more redox sensitive or serve to protect it from oxidative damage while under hypoxic
stress.224, 239
131
Discussion
In this study, we demonstrate a role of HIF1α in the basal oxygen utilization rate and the
ETC function of MEF cells and establish HIF1α regulation of genes associated with cytochrome
c oxidase (CcO). Gene expression changes for CcO components occur in response to hypoxia,
and the extracellular oxygen concentrations (oxygen consumption rate data) support an
apparent constitutive modulation of mitochondrial function by HIF1α. This study adds to the
growing body of evidence that the hypoxia signaling system (especially HIF1α) regulates ETC
biogenesis and processes associated with mitochondrial function, such as energy production,
reactive oxygen species homeostasis, autophagy/apoptosis, and oxygen consumption.
Addition of exogenous glucose to cultured cells will increase the rate of glycolysis and
inhibit OXPHOS, a phenomenon known as the Crabtree effect.240 A change from Glc to Gal in
culture media increases the respiration rate and cytosolic pH, increases the rate of cellular
oxygen consumption and results in mitochondrial remodeling.240, 241 In human primary
myotubes, Gal medium enhances aerobic metabolism and decreases the rate of anaerobic
glycolysis.242 Our results support these observations with an increased spare respiratory
capacity in the Hif1α WT cells (Figure B-2B) and dramatic changes in ETC gene expression
profiles in response to Gal (Figure B-3).164, 243, 244 For example, after 24 h, expression profiles
show genes upregulated in response to Gal only in the presence of HIF1α (e.g., Ndufa10), in
the absence of HIF1α (e.g., Atp5l), and regardless of HIF1α status (e.g., Surf1). Cox8a showed
upregulation in response to glucose only when HIF1α was present, while Ucp1 conversely
showed upregulation only in Hif1α null cells. Rossignol et al. found no greater levels of
mitochondria in HeLa cells grown with galactose than those grown with glucose; however, there
were significant galactose-induced changes in mitochondrial protein expression in both HeLa
and MRC5 fibroblast cells.241 MRC5 fibroblast cells had significantly increased protein
quantities for complex I, II, and IV subunits, while complex III protein levels were not increased.
In our 24 h study, the complex III genes were almost all downregulated in the HIF1α null cells
132
with mixed responses in regard to Gal (e.g., Uqcrc1, Uqcrh, and Uqcrq). The uniqueness of the
complex III response to Gal is a point of interest as the role of ROS generated at complex III has
been implicated in HIF stabilization and signaling, though this is debated.217, 245, 246 Clearly, there
is a complex interaction between HIF1α and carbon substrate availability on mitochondrial
function, OXPHOS, and gene expression of ETC components.
There is ample evidence that hypoxia alters mitochondrial function and oxygen
utilization.217, 218, 247 HIF1 influences mitochondrial function by suppressing both the TCA cycle
and respiration and controls mitochondrial biogenesis and autophagy.217, 247 Few studies,
however, have examined HIF1-dependent changes in the expression of specific ETC genes. A
Cox4 isoform exchange (Cox4i1 to Cox4i2) in response to hypoxia was reported to be
coordinated by HIF1. HIF1 upregulates Cox4i2 mRNA expression and concurrently increases
the level of Cox4i1 degradation through an increased level of expression of Lonp1, a
mitochondrial protease.227 Our results show an upregulation of Lonp1 and Cox4i2, but the
increased level of Cox4i2 was observed in Hif1α null, as well as, WT cells (Figures B-3 and B-
4). These results are in agreement with a previously published report that also found that
Cox4i2 is upregulated under hypoxia via a novel oxygen-responsive element (ORE) separate
from an HRE.226, 248 We observed a higher level of expression of Cox4i1 in both WT and Hif1α
null cells grown with Gal, supporting the idea that Cox4i1 expression is independent of HIF1α.
There is some indication that Cox4i2 is expressed in only certain tissues, while Cox4i1 is
ubiquitously expressed and is the isoform responsible for ATP regulation of CcO activity.116, 210,
225
Our results indicate that Cox7a1 is a HIF1-regulated gene (Figures B-3 and B-4), and
the 5000 bp sequence on the mouse Cox7a1 gene (NC_00073.5: 30964250 to 30969250 bp)
prior to the start codon reveals at least six possible HREs.227 One of these HREs (5’-GCGTG-
3’) occurs within the 92 bp segment immediately upstream of the major transcription start site (-
80 bp), which in the bovine Cox7a1 gene is considered to be the basal promoter region
133
responsible for most of the gene expression and activity.249 Evidence indicates that the level of
Cox7a1 mRNA expression in human skeletal muscle decreases significantly with age and is
positively related with glucose uptake, total body aerobic capacity, and PGC-1α mRNA
expression.228 Cox7a1 knockout male mice displayed tissue-specific differences in resting ATP
levels and reduced CcO specific activity and respiratory control ratio in skeletal muscle from WT
mice.239, 250 In addition, a significant increase in ROS production has been observed in response
to Cox7a2 overexpression similar to the increased ROS production observed with the Cox4i2
replacement of Cox4i1 under nonhypoxic conditions.227 Because ROS is produced by the
transfer of an electron to O2 at complex I or complex III, changes in CcO structure that produce
ROS are most probably manifested by limitations in CcO activity.251 Moreover, cardiolipin,
which interacts with COX7A near the site of the cytochrome bc1 interface, is critical for CcO
assembly and organizing components in supercomplexes and consequently improves CcO
function.116 Taken together, this information shows a potential link among Cox7a subunits, CcO
activity, and hypoxia, but further experimentation is needed to determine the impact of Cox7a
subunit switching on supercomplex formation, ETC efficiency, and cellular energetics under
various oxygen tensions in cell systems that express measurably levels of both Cox7a isoforms.
The CcO activity (Table B-2) and cellular respiration (Figure B-2) in Hif1α null cells
suggest that HIF1α stabilization under hypoxia is necessary to maintain homeostasis in cellular
oxidative metabolism. As previously described, cellular respiration was measured under non-
hypoxic condition and the respiration capacity in Hif1α null cells was not changed by a
mitochondrial uncoupler with either carbon source while WT cells adapted to each nutrient type.
CcO activity, however, was increased almost three-fold in Hif1α null cells grown in Gal media
following hypoxic stress. This increase was not observed in Hif1α WT cells. These results
suggest two things. First, the Hif1a null cells are at maximal respiration normally. This inability
to maintain spare respiratory capacity suggests the Hif1a null cells are partially uncoupled or
lack the necessary regulatory mitochondria-to-nuclear signaling to maintain reserve respiratory
134
capacity. This might be partially explained by the upregulation of UCP4 in the null cells (Figure
2). This loss of spare respiratory capacity might also help explain why these cells lose
mitochondrial mass under stress (i.e., hypoxia + GAL media). Second, HIF1α plays a role in
regulating overall CcO activity to maintain optimal efficiency and limit ROS generation.
Galactose forces the cells to become more reliant on oxidative phosphorylation to meet energy
demands, and hypoxia limits the cell’s ability to produce ATP through complex IV. Under these
conditions (i.e., hypoxia + GAL media), cells must modulate the efficiency of oxidative
phosphorylation to maintain cellular energetics and limit oxidative stress. The results suggest
that this adaptation is dependent upon HIF1α, and in its absence, CcO activity becomes
unregulated and damages the mitochondria. This is evident from the increase in specific activity
and the decrease in mitochondrial mass under these conditions. This might stem from the cell’s
inability to upregulate glycolytic capacity in the absence of HIF1a. Therefore, the higher CcO
activity in Hif1α null cells in Gal media under hypoxia shows an adapted response to cope with a
stronger dependence on energy production via oxidative phosphorylation.
In conclusion, our study indicates a significant difference in oxygen utilization by Hif1α
WT and Hif1α null MEF cells in response to a mitochondrial uncoupler. These cell lines show
differences in ETC gene expression profiles under different nutrient types and oxygen
concentrations. Most importantly, we have identified HIF1α as a regulator of CcO activity and
Cox7a1 gene expression. Given their location within the crystal structure, we suggest a
possible role for these hypoxia-induced isoform changes to translate into structural changes in a
supercomplex formation depending on redox state or oxidative stress. Altogether, this study
indicates that HIF1α is critical for mitochondrial respiration control and transcriptional regulation
of CcO components to achieve cellular adaptation in an oxygen-limiting environment.
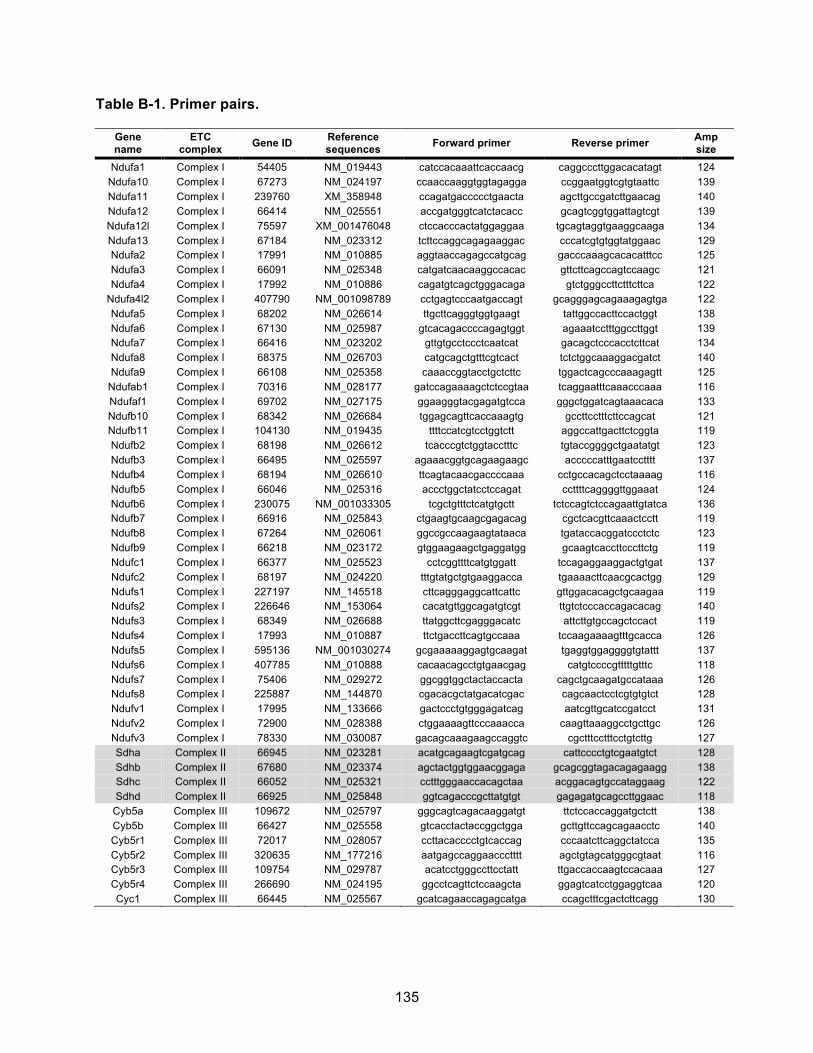
135
Table B-1. Primer pairs.
Gene name
ETC complex Gene ID Reference
sequences Forward primer Reverse primer Amp size
Ndufa1 Complex I 54405 NM_019443 catccacaaattcaccaacg caggcccttggacacatagt 124 Ndufa10 Complex I 67273 NM_024197 ccaaccaaggtggtagagga ccggaatggtcgtgtaattc 139 Ndufa11 Complex I 239760 XM_358948 ccagatgaccccctgaacta agcttgccgatcttgaacag 140 Ndufa12 Complex I 66414 NM_025551 accgatgggtcatctacacc gcagtcggtggattagtcgt 139 Ndufa12l Complex I 75597 XM_001476048 ctccacccactatggaggaa tgcagtaggtgaaggcaaga 134 Ndufa13 Complex I 67184 NM_023312 tcttccaggcagagaaggac cccatcgtgtggtatggaac 129 Ndufa2 Complex I 17991 NM_010885 aggtaaccagagccatgcag gacccaaagcacacatttcc 125 Ndufa3 Complex I 66091 NM_025348 catgatcaacaaggccacac gttcttcagccagtccaagc 121 Ndufa4 Complex I 17992 NM_010886 cagatgtcagctgggacaga gtctgggccttctttcttca 122
Ndufa4l2 Complex I 407790 NM_001098789 cctgagtcccaatgaccagt gcagggagcagaaagagtga 122 Ndufa5 Complex I 68202 NM_026614 ttgcttcagggtggtgaagt tattggccacttccactggt 138 Ndufa6 Complex I 67130 NM_025987 gtcacagaccccagagtggt agaaatcctttggccttggt 139 Ndufa7 Complex I 66416 NM_023202 gttgtgcctccctcaatcat gacagctcccacctcttcat 134 Ndufa8 Complex I 68375 NM_026703 catgcagctgtttcgtcact tctctggcaaaggacgatct 140 Ndufa9 Complex I 66108 NM_025358 caaaccggtacctgctcttc tggactcagcccaaagagtt 125
Ndufab1 Complex I 70316 NM_028177 gatccagaaaagctctccgtaa tcaggaatttcaaacccaaa 116 Ndufaf1 Complex I 69702 NM_027175 ggaagggtacgagatgtcca gggctggatcagtaaacaca 133 Ndufb10 Complex I 68342 NM_026684 tggagcagttcaccaaagtg gccttcctttcttccagcat 121 Ndufb11 Complex I 104130 NM_019435 ttttccatcgtcctggtctt aggccattgacttctcggta 119 Ndufb2 Complex I 68198 NM_026612 tcacccgtctggtacctttc tgtaccggggctgaatatgt 123 Ndufb3 Complex I 66495 NM_025597 agaaacggtgcagaagaagc acccccatttgaatcctttt 137 Ndufb4 Complex I 68194 NM_026610 ttcagtacaacgaccccaaa cctgccacagctcctaaaag 116 Ndufb5 Complex I 66046 NM_025316 accctggctatcctccagat ccttttcaggggttggaaat 124 Ndufb6 Complex I 230075 NM_001033305 tcgctgtttctcatgtgctt tctccagtctccagaattgtatca 136 Ndufb7 Complex I 66916 NM_025843 ctgaagtgcaagcgagacag cgctcacgttcaaactcctt 119 Ndufb8 Complex I 67264 NM_026061 ggccgccaagaagtataaca tgataccacggatccctctc 123 Ndufb9 Complex I 66218 NM_023172 gtggaagaagctgaggatgg gcaagtcaccttcccttctg 119 Ndufc1 Complex I 66377 NM_025523 cctcggttttcatgtggatt tccagaggaaggactgtgat 137 Ndufc2 Complex I 68197 NM_024220 tttgtatgctgtgaaggacca tgaaaacttcaacgcactgg 129 Ndufs1 Complex I 227197 NM_145518 cttcagggaggcattcattc gttggacacagctgcaagaa 119 Ndufs2 Complex I 226646 NM_153064 cacatgttggcagatgtcgt ttgtctcccaccagacacag 140 Ndufs3 Complex I 68349 NM_026688 ttatggcttcgagggacatc attcttgtgccagctccact 119 Ndufs4 Complex I 17993 NM_010887 ttctgaccttcagtgccaaa tccaagaaaagtttgcacca 126 Ndufs5 Complex I 595136 NM_001030274 gcgaaaaaggagtgcaagat tgaggtggaggggtgtattt 137 Ndufs6 Complex I 407785 NM_010888 cacaacagcctgtgaacgag catgtccccgtttttgtttc 118 Ndufs7 Complex I 75406 NM_029272 ggcggtggctactaccacta cagctgcaagatgccataaa 126 Ndufs8 Complex I 225887 NM_144870 cgacacgctatgacatcgac cagcaactcctcgtgtgtct 128 Ndufv1 Complex I 17995 NM_133666 gactccctgtgggagatcag aatcgttgcatccgatcct 131 Ndufv2 Complex I 72900 NM_028388 ctggaaaagttcccaaacca caagttaaaggcctgcttgc 126 Ndufv3 Complex I 78330 NM_030087 gacagcaaagaagccaggtc cgctttcctttcctgtcttg 127 Sdha Complex II 66945 NM_023281 acatgcagaagtcgatgcag cattcccctgtcgaatgtct 128 Sdhb Complex II 67680 NM_023374 agctactggtggaacggaga gcagcggtagacagagaagg 138 Sdhc Complex II 66052 NM_025321 cctttgggaaccacagctaa acggacagtgccataggaag 122 Sdhd Complex II 66925 NM_025848 ggtcagacccgcttatgtgt gagagatgcagccttggaac 118
Cyb5a Complex III 109672 NM_025797 gggcagtcagacaaggatgt ttctccaccaggatgctctt 138 Cyb5b Complex III 66427 NM_025558 gtcacctactaccggctgga gcttgttccagcagaacctc 140 Cyb5r1 Complex III 72017 NM_028057 ccttacacccctgtcaccag cccaatcttcaggctatcca 135 Cyb5r2 Complex III 320635 NM_177216 aatgagccaggaaccctttt agctgtagcatgggcgtaat 116 Cyb5r3 Complex III 109754 NM_029787 acatcctgggccttcctatt ttgaccaccaagtccacaaa 127 Cyb5r4 Complex III 266690 NM_024195 ggcctcagttctccaagcta ggagtcatcctggaggtcaa 120 Cyc1 Complex III 66445 NM_025567 gcatcagaaccagagcatga ccagctttcgactcttcagg 130
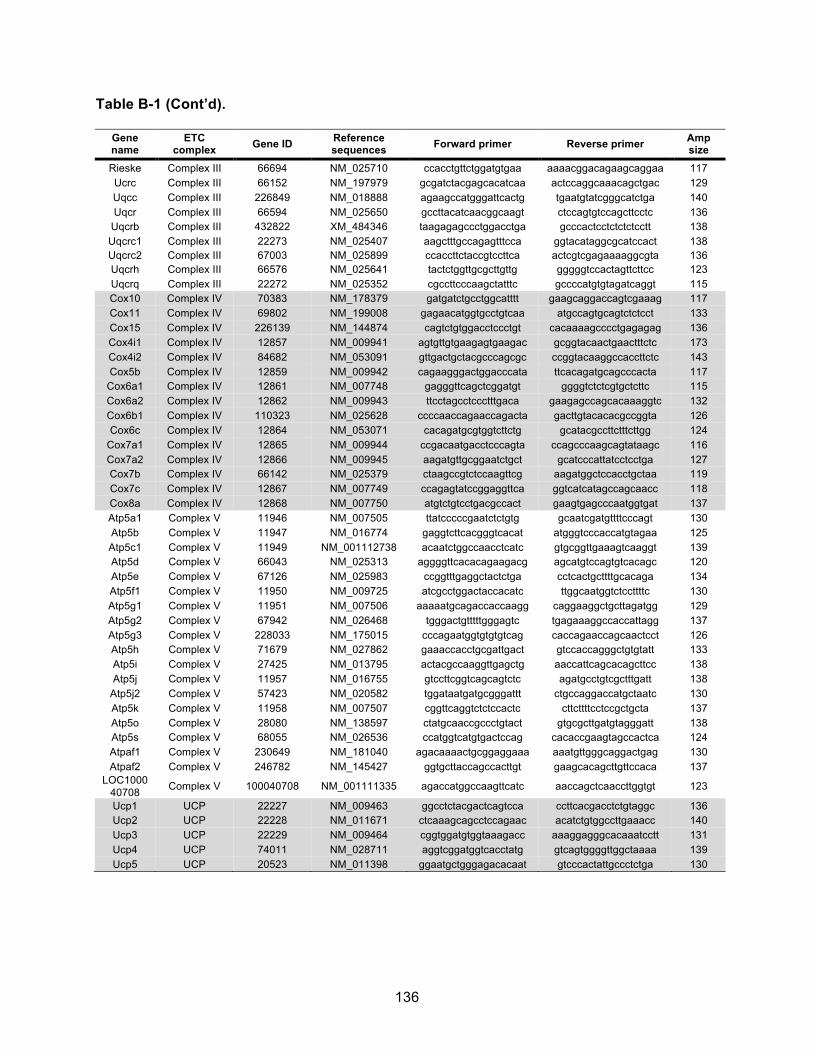
136
Table B-1 (Cont’d).
Gene name
ETC complex Gene ID Reference
sequences Forward primer Reverse primer Amp size
Rieske Complex III 66694 NM_025710 ccacctgttctggatgtgaa aaaacggacagaagcaggaa 117 Ucrc Complex III 66152 NM_197979 gcgatctacgagcacatcaa actccaggcaaacagctgac 129 Uqcc Complex III 226849 NM_018888 agaagccatgggattcactg tgaatgtatcgggcatctga 140 Uqcr Complex III 66594 NM_025650 gccttacatcaacggcaagt ctccagtgtccagcttcctc 136
Uqcrb Complex III 432822 XM_484346 taagagagccctggacctga gcccactcctctctctcctt 138 Uqcrc1 Complex III 22273 NM_025407 aagctttgccagagtttcca ggtacataggcgcatccact 138 Uqcrc2 Complex III 67003 NM_025899 ccaccttctaccgtccttca actcgtcgagaaaaggcgta 136 Uqcrh Complex III 66576 NM_025641 tactctggttgcgcttgttg gggggtccactagttcttcc 123 Uqcrq Complex III 22272 NM_025352 cgccttcccaagctatttc gccccatgtgtagatcaggt 115 Cox10 Complex IV 70383 NM_178379 gatgatctgcctggcatttt gaagcaggaccagtcgaaag 117 Cox11 Complex IV 69802 NM_199008 gagaacatggtgcctgtcaa atgccagtgcagtctctcct 133 Cox15 Complex IV 226139 NM_144874 cagtctgtggacctccctgt cacaaaagcccctgagagag 136 Cox4i1 Complex IV 12857 NM_009941 agtgttgtgaagagtgaagac gcggtacaactgaactttctc 173 Cox4i2 Complex IV 84682 NM_053091 gttgactgctacgcccagcgc ccggtacaaggccaccttctc 143 Cox5b Complex IV 12859 NM_009942 cagaagggactggacccata ttcacagatgcagcccacta 117
Cox6a1 Complex IV 12861 NM_007748 gagggttcagctcggatgt ggggtctctcgtgctcttc 115 Cox6a2 Complex IV 12862 NM_009943 ttcctagcctccctttgaca gaagagccagcacaaaggtc 132 Cox6b1 Complex IV 110323 NM_025628 ccccaaccagaaccagacta gacttgtacacacgccggta 126 Cox6c Complex IV 12864 NM_053071 cacagatgcgtggtcttctg gcatacgccttctttcttgg 124
Cox7a1 Complex IV 12865 NM_009944 ccgacaatgacctcccagta ccagcccaagcagtataagc 116 Cox7a2 Complex IV 12866 NM_009945 aagatgttgcggaatctgct gcatcccattatcctcctga 127 Cox7b Complex IV 66142 NM_025379 ctaagccgtctccaagttcg aagatggctccacctgctaa 119 Cox7c Complex IV 12867 NM_007749 ccagagtatccggaggttca ggtcatcatagccagcaacc 118 Cox8a Complex IV 12868 NM_007750 atgtctgtcctgacgccact gaagtgagcccaatggtgat 137 Atp5a1 Complex V 11946 NM_007505 ttatcccccgaatctctgtg gcaatcgatgttttcccagt 130 Atp5b Complex V 11947 NM_016774 gaggtcttcacgggtcacat atgggtcccaccatgtagaa 125 Atp5c1 Complex V 11949 NM_001112738 acaatctggccaacctcatc gtgcggttgaaagtcaaggt 139 Atp5d Complex V 66043 NM_025313 aggggttcacacagaagacg agcatgtccagtgtcacagc 120 Atp5e Complex V 67126 NM_025983 ccggtttgaggctactctga cctcactgcttttgcacaga 134 Atp5f1 Complex V 11950 NM_009725 atcgcctggactaccacatc ttggcaatggtctccttttc 130 Atp5g1 Complex V 11951 NM_007506 aaaaatgcagaccaccaagg caggaaggctgcttagatgg 129 Atp5g2 Complex V 67942 NM_026468 tgggactgtttttgggagtc tgagaaaggccaccattagg 137 Atp5g3 Complex V 228033 NM_175015 cccagaatggtgtgtgtcag caccagaaccagcaactcct 126 Atp5h Complex V 71679 NM_027862 gaaaccacctgcgattgact gtccaccagggctgtgtatt 133 Atp5i Complex V 27425 NM_013795 actacgccaaggttgagctg aaccattcagcacagcttcc 138 Atp5j Complex V 11957 NM_016755 gtccttcggtcagcagtctc agatgcctgtcgctttgatt 138
Atp5j2 Complex V 57423 NM_020582 tggataatgatgcgggattt ctgccaggaccatgctaatc 130 Atp5k Complex V 11958 NM_007507 cggttcaggtctctccactc cttcttttcctccgctgcta 137 Atp5o Complex V 28080 NM_138597 ctatgcaaccgccctgtact gtgcgcttgatgtagggatt 138 Atp5s Complex V 68055 NM_026536 ccatggtcatgtgactccag cacaccgaagtagccactca 124 Atpaf1 Complex V 230649 NM_181040 agacaaaactgcggaggaaa aaatgttgggcaggactgag 130 Atpaf2 Complex V 246782 NM_145427 ggtgcttaccagccacttgt gaagcacagcttgttccaca 137
LOC100040708 Complex V 100040708 NM_001111335 agaccatggccaagttcatc aaccagctcaaccttggtgt 123
Ucp1 UCP 22227 NM_009463 ggcctctacgactcagtcca ccttcacgacctctgtaggc 136 Ucp2 UCP 22228 NM_011671 ctcaaagcagcctccagaac acatctgtggccttgaaacc 140 Ucp3 UCP 22229 NM_009464 cggtggatgtggtaaagacc aaaggagggcacaaatcctt 131 Ucp4 UCP 74011 NM_028711 aggtcggatggtcacctatg gtcagtggggttggctaaaa 139 Ucp5 UCP 20523 NM_011398 ggaatgctgggagacacaat gtcccactattgccctctga 130
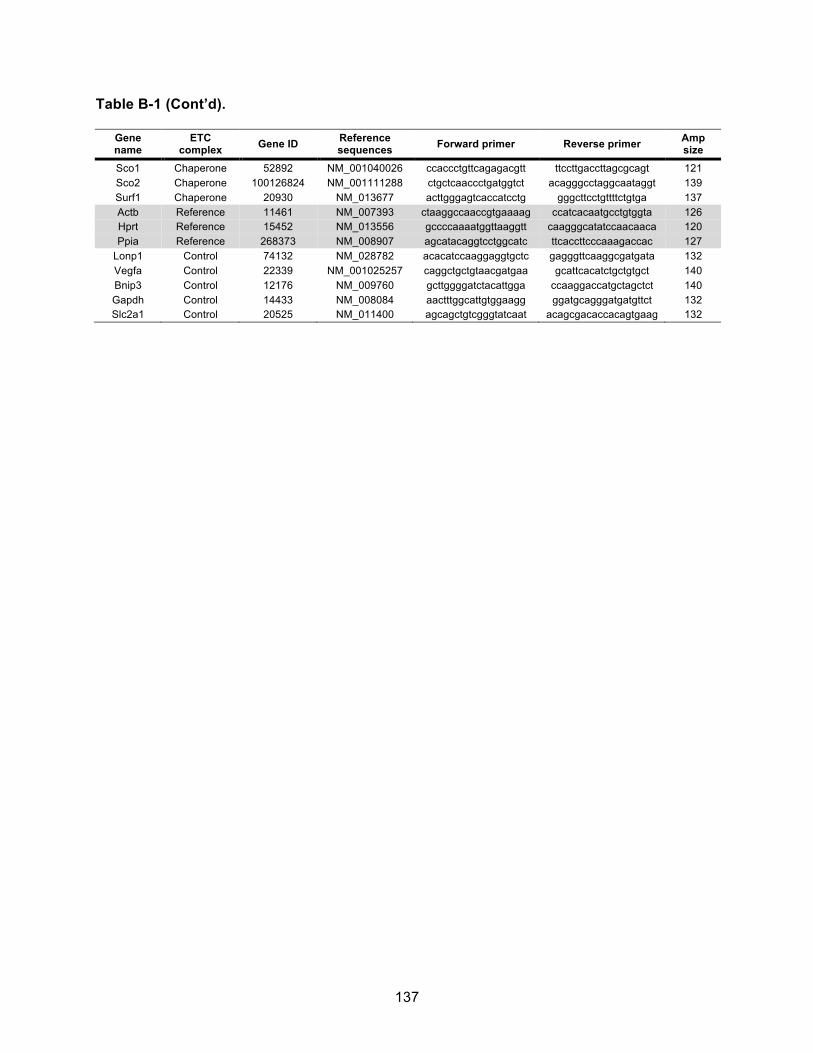
137
Table B-1 (Cont’d).
Gene name
ETC complex Gene ID Reference
sequences Forward primer Reverse primer Amp size
Sco1 Chaperone 52892 NM_001040026 ccaccctgttcagagacgtt ttccttgaccttagcgcagt 121 Sco2 Chaperone 100126824 NM_001111288 ctgctcaaccctgatggtct acagggcctaggcaataggt 139 Surf1 Chaperone 20930 NM_013677 acttgggagtcaccatcctg gggcttcctgttttctgtga 137 Actb Reference 11461 NM_007393 ctaaggccaaccgtgaaaag ccatcacaatgcctgtggta 126 Hprt Reference 15452 NM_013556 gccccaaaatggttaaggtt caagggcatatccaacaaca 120 Ppia Reference 268373 NM_008907 agcatacaggtcctggcatc ttcaccttcccaaagaccac 127
Lonp1 Control 74132 NM_028782 acacatccaaggaggtgctc gagggttcaaggcgatgata 132 Vegfa Control 22339 NM_001025257 caggctgctgtaacgatgaa gcattcacatctgctgtgct 140 Bnip3 Control 12176 NM_009760 gcttggggatctacattgga ccaaggaccatgctagctct 140 Gapdh Control 14433 NM_008084 aactttggcattgtggaagg ggatgcagggatgatgttct 132 Slc2a1 Control 20525 NM_011400 agcagctgtcgggtatcaat acagcgacaccacagtgaag 132
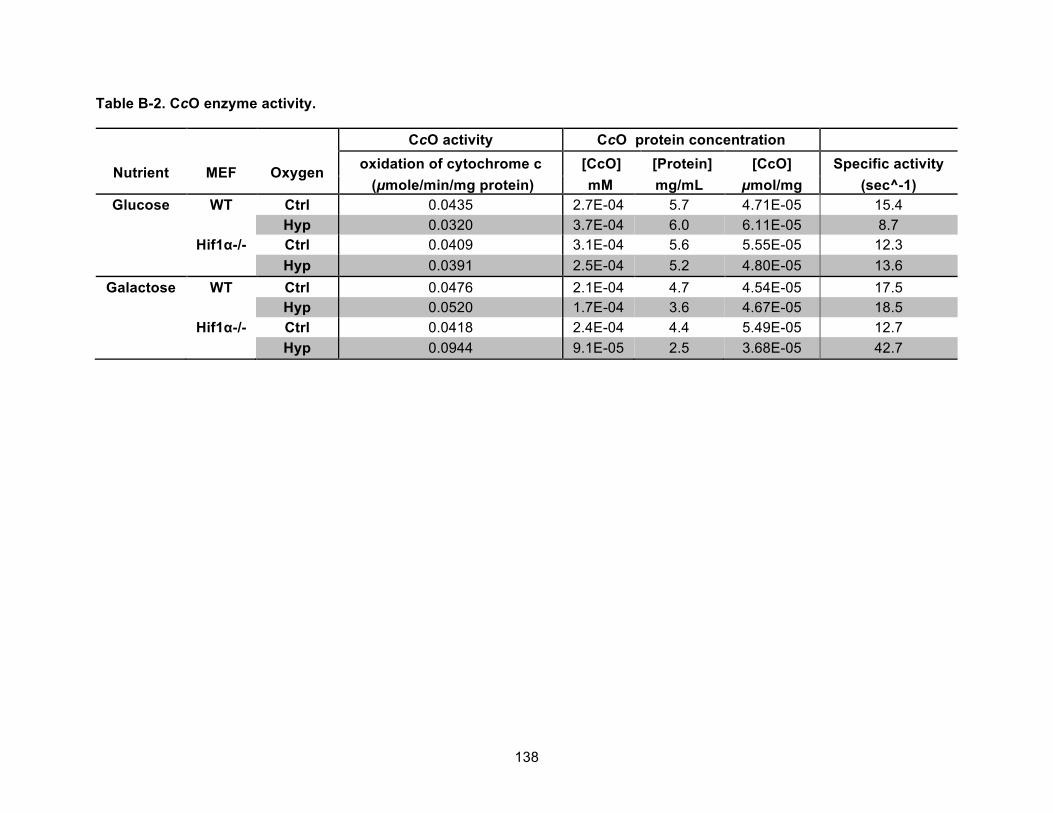
138
Table B-2. CcO enzyme activity.
CcO activity CcO protein concentration
Nutrient MEF Oxygen oxidation of cytochrome c [CcO] [Protein] [CcO] Specific activity (µmole/min/mg protein) mM mg/mL µmol/mg (sec^-1)
Glucose WT Ctrl 0.0435 2.7E-04 5.7 4.71E-05 15.4 Hyp 0.0320 3.7E-04 6.0 6.11E-05 8.7 Hif1α-/- Ctrl 0.0409 3.1E-04 5.6 5.55E-05 12.3 Hyp 0.0391 2.5E-04 5.2 4.80E-05 13.6
Galactose WT Ctrl 0.0476 2.1E-04 4.7 4.54E-05 17.5 Hyp 0.0520 1.7E-04 3.6 4.67E-05 18.5 Hif1α-/- Ctrl 0.0418 2.4E-04 4.4 5.49E-05 12.7 Hyp 0.0944 9.1E-05 2.5 3.68E-05 42.7
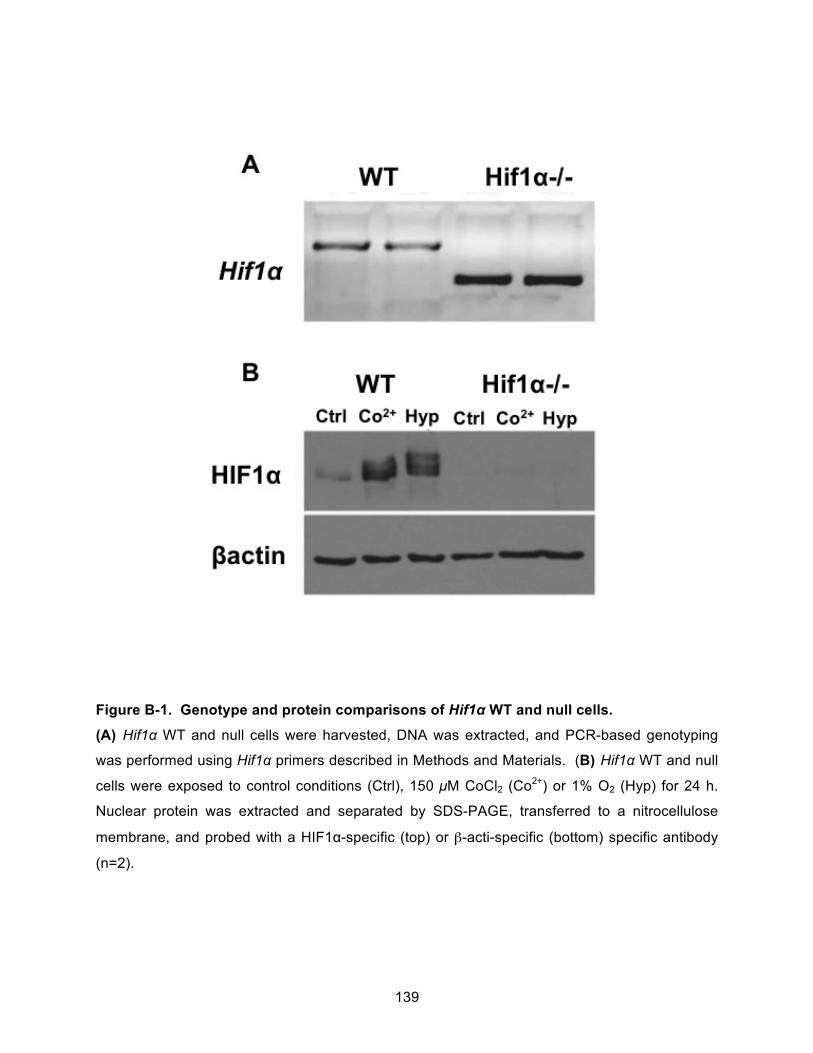
139
Figure B-1. Genotype and protein comparisons of Hif1α WT and null cells.
(A) Hif1α WT and null cells were harvested, DNA was extracted, and PCR-based genotyping
was performed using Hif1α primers described in Methods and Materials. (B) Hif1α WT and null
cells were exposed to control conditions (Ctrl), 150 µM CoCl2 (Co2+) or 1% O2 (Hyp) for 24 h.
Nuclear protein was extracted and separated by SDS-PAGE, transferred to a nitrocellulose
membrane, and probed with a HIF1α-specific (top) or β-acti-specific (bottom) specific antibody
(n=2).
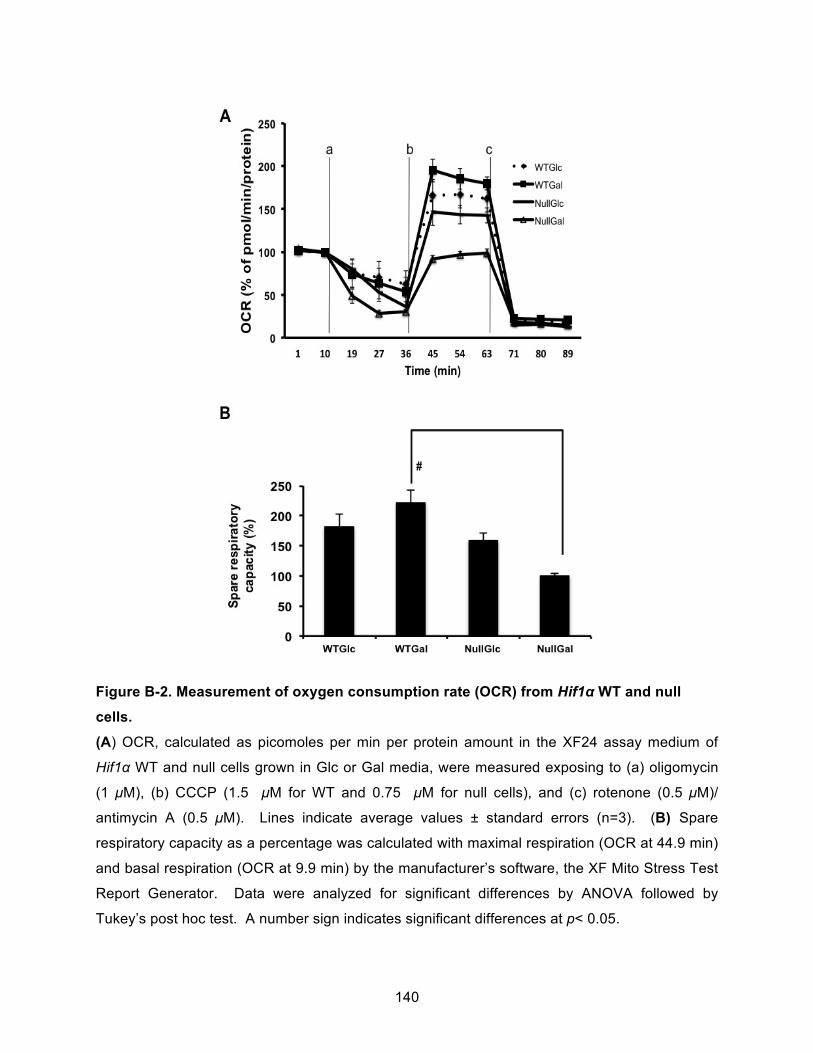
140
Figure B-2. Measurement of oxygen consumption rate (OCR) from Hif1α WT and null
cells.
(A) OCR, calculated as picomoles per min per protein amount in the XF24 assay medium of
Hif1α WT and null cells grown in Glc or Gal media, were measured exposing to (a) oligomycin
(1 µM), (b) CCCP (1.5 µM for WT and 0.75 µM for null cells), and (c) rotenone (0.5 µM)/
antimycin A (0.5 µM). Lines indicate average values ± standard errors (n=3). (B) Spare
respiratory capacity as a percentage was calculated with maximal respiration (OCR at 44.9 min)
and basal respiration (OCR at 9.9 min) by the manufacturer’s software, the XF Mito Stress Test
Report Generator. Data were analyzed for significant differences by ANOVA followed by
Tukey’s post hoc test. A number sign indicates significant differences at p< 0.05.
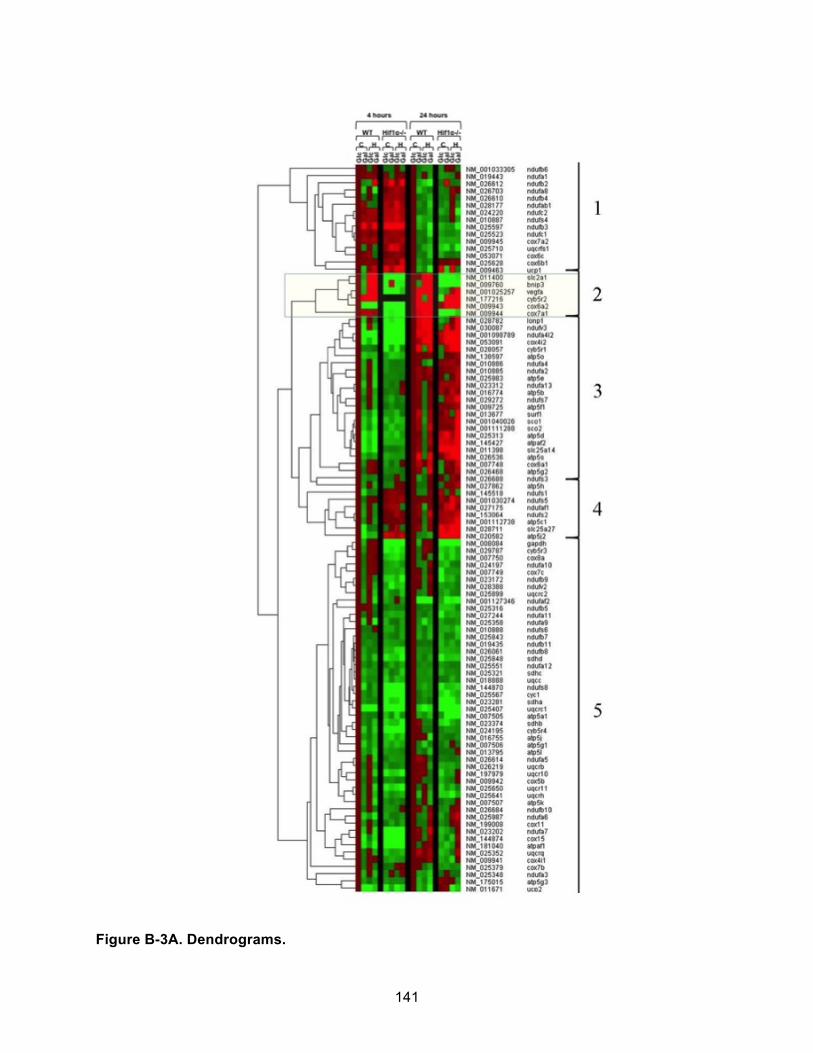
141
Figure B-3A. Dendrograms.
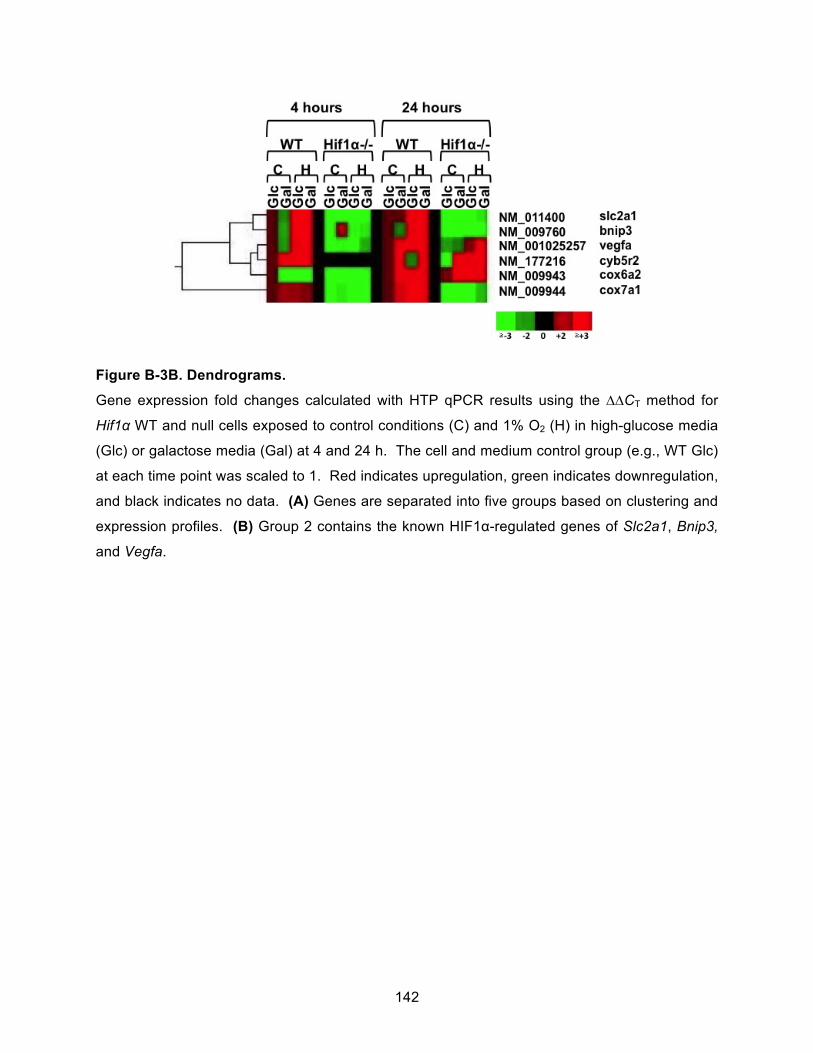
142
Figure B-3B. Dendrograms.
Gene expression fold changes calculated with HTP qPCR results using the ∆∆CT method for
Hif1α WT and null cells exposed to control conditions (C) and 1% O2 (H) in high-glucose media
(Glc) or galactose media (Gal) at 4 and 24 h. The cell and medium control group (e.g., WT Glc)
at each time point was scaled to 1. Red indicates upregulation, green indicates downregulation,
and black indicates no data. (A) Genes are separated into five groups based on clustering and
expression profiles. (B) Group 2 contains the known HIF1α-regulated genes of Slc2a1, Bnip3,
and Vegfa.
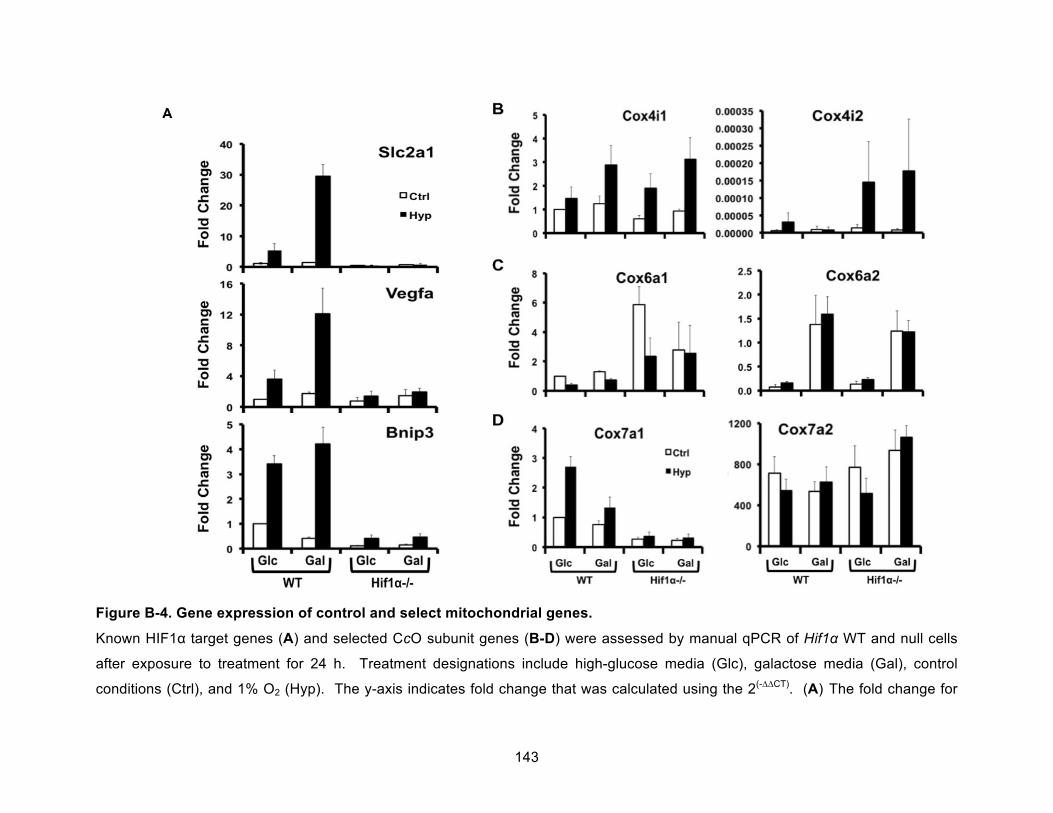
143
Figure B-4. Gene expression of control and select mitochondrial genes.
Known HIF1α target genes (A) and selected CcO subunit genes (B-D) were assessed by manual qPCR of Hif1α WT and null cells
after exposure to treatment for 24 h. Treatment designations include high-glucose media (Glc), galactose media (Gal), control
conditions (Ctrl), and 1% O2 (Hyp). The y-axis indicates fold change that was calculated using the 2(-∆∆CT). (A) The fold change for
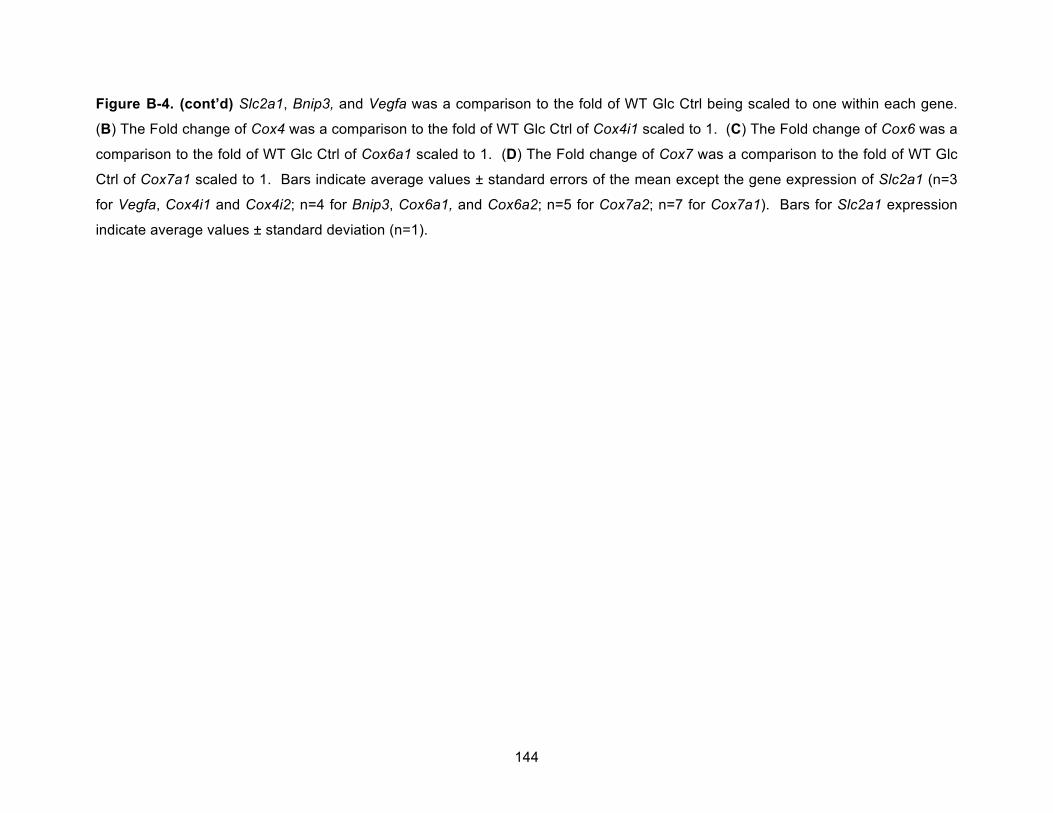
144
Figure B-4. (cont’d)!Slc2a1, Bnip3, and Vegfa was a comparison to the fold of WT Glc Ctrl being scaled to one within each gene.
(B) The Fold change of Cox4 was a comparison to the fold of WT Glc Ctrl of Cox4i1 scaled to 1. (C) The Fold change of Cox6 was a
comparison to the fold of WT Glc Ctrl of Cox6a1 scaled to 1. (D) The Fold change of Cox7 was a comparison to the fold of WT Glc
Ctrl of Cox7a1 scaled to 1. Bars indicate average values ± standard errors of the mean except the gene expression of Slc2a1 (n=3
for Vegfa, Cox4i1 and Cox4i2; n=4 for Bnip3, Cox6a1, and Cox6a2; n=5 for Cox7a2; n=7 for Cox7a1). Bars for Slc2a1 expression
indicate average values ± standard deviation (n=1).
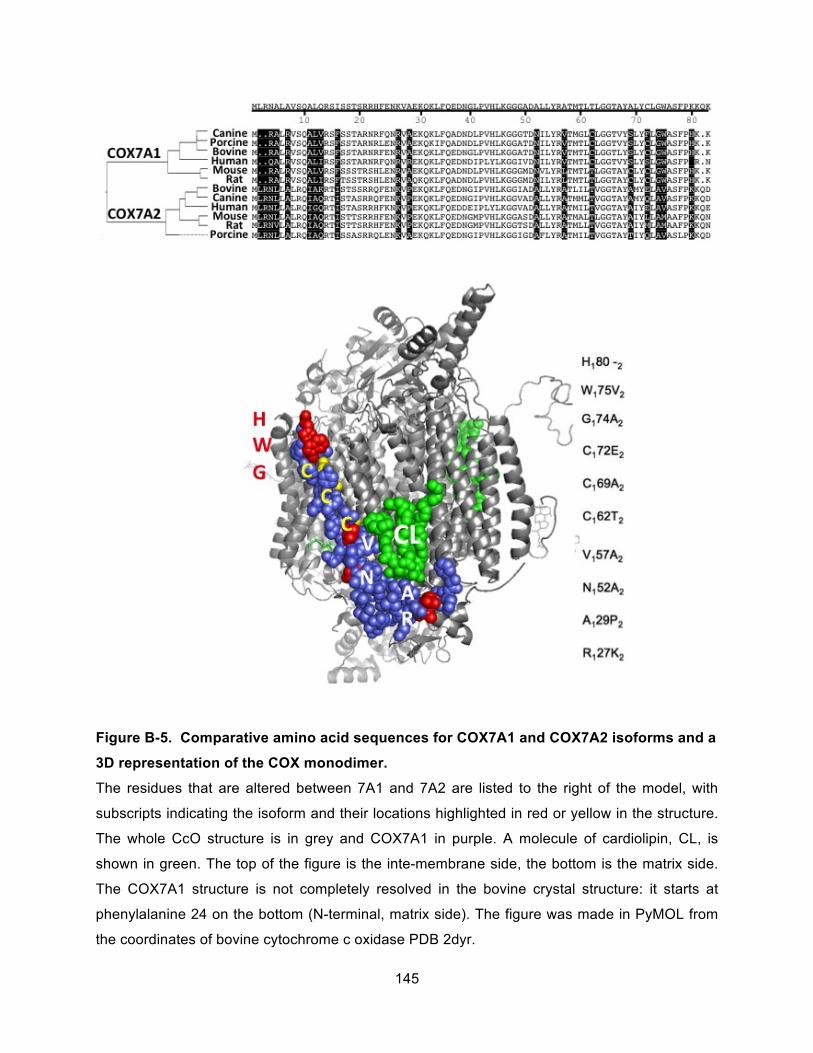
145
Figure B-5. Comparative amino acid sequences for COX7A1 and COX7A2 isoforms and a
3D representation of the COX monodimer.
The residues that are altered between 7A1 and 7A2 are listed to the right of the model, with
subscripts indicating the isoform and their locations highlighted in red or yellow in the structure.
The whole CcO structure is in grey and COX7A1 in purple. A molecule of cardiolipin, CL, is
shown in green. The top of the figure is the inte-membrane side, the bottom is the matrix side.
The COX7A1 structure is not completely resolved in the bovine crystal structure: it starts at
phenylalanine 24 on the bottom (N-terminal, matrix side). The figure was made in PyMOL from
the coordinates of bovine cytochrome c oxidase PDB 2dyr.

146
!!!!!!!!
REFERENCES
147
REFERENCES
(1) McIntosh, B. E., Hogenesch, J. B., and Bradfield, C. A. (2010) Mammalian Per-Arnt-Sim proteins in environmental adaptation, Annu. Rev. Physiol. 72, 625-645.
(2) Gu, Y. Z., Hogenesch, J. B., and Bradfield, C. A. (2000) The PAS superfamily: sensors of environmental and developmental signals, Annu. Rev. Pharmacol. Toxicol. 40, 519-561.
(3) Hites, R. A. (2011) Dioxins: an overview and history, Environ. Sci. Technol. 45, 16-20.
(4) Linden, J., Lensu, S., Tuomisto, J., and Pohjanvirta, R. (2010) Dioxins, the aryl hydrocarbon receptor and the central regulation of energy balance, Front Neuroendocrinol. 31, 452-478.
(5) Poland, A., Glover, E., and Kende, A. S. (1976) Stereospecific, high affinity binding of 2,3,7,8-tetrachlorodibenzo-p-dioxin by hepatic cytosol. Evidence that the binding species is receptor for induction of aryl hydrocarbon hydroxylase, J. Biol. Chem. 251, 4936-4946.
(6) Legraverend, C., Hannah, R. R., Eisen, H. J., Owens, I. S., Nebert, D. W., and Hankinson, O. (1982) Regulatory gene product of the Ah locus. Characterization of receptor mutants among mouse hepatoma clones, J. Biol. Chem. 257, 6402-6407.
(7) Reyes, H., Reisz-Porszasz, S., and Hankinson, O. (1992) Identification of the Ah receptor nuclear translocator protein (Arnt) as a component of the DNA binding form of the Ah receptor, Science 256, 1193-1195.
(8) Bacsi, S. G., Reisz-Porszasz, S., and Hankinson, O. (1995) Orientation of the heterodimeric aryl hydrocarbon (dioxin) receptor complex on its asymmetric DNA recognition sequence, Mol. Pharmacol. 47, 432-438.
(9) Denison, M. S., Fisher, J. M., and Whitlock, J. P., Jr. (1988) The DNA recognition site for the dioxin-Ah receptor complex. Nucleotide sequence and functional analysis, J. Biol. Chem. 263, 17221-17224.
(10) Heid, S. E., Pollenz, R. S., and Swanson, H. I. (2000) Role of heat shock protein 90 dissociation in mediating agonist-induced activation of the aryl hydrocarbon receptor, Mol. Pharmacol. 57, 82-92.
(11) LaPres, J. J., Glover, E., Dunham, E. E., Bunger, M. K., and Bradfield, C. A. (2000) ARA9 modifies agonist signaling through an increase in cytosolic aryl hydrocarbon receptor, J. Biol. Chem. 275, 6153-6159.
148
(12) Carver, L. A., LaPres, J. J., Jain, S., Dunham, E. E., and Bradfield, C. A. (1998) Characterization of the Ah receptor-associated protein, ARA9, J. Biol. Chem. 273, 33580-33587.
(13) Nguyen, L. P., and Bradfield, C. A. (2008) The search for endogenous activators of the aryl hydrocarbon receptor, Chem. Res. Toxicol. 21, 102-116.
(14) Abel, J., and Haarmann-Stemmann, T. (2010) An introduction to the molecular basics of aryl hydrocarbon receptor biology, Biol. Chem. 391, 1235-1248.
(15) Puga, A., Ma, C., and Marlowe, J. L. (2009) The aryl hydrocarbon receptor cross-talks with multiple signal transduction pathways, Biochem. Pharmacol. 77, 713-722.
(16) Fukunaga, B. N., Probst, M. R., Reisz-Porszasz, S., and Hankinson, O. (1995) Identification of functional domains of the aryl hydrocarbon receptor, J. Biol. Chem. 270, 29270-29278.
(17) Ikuta, T., Eguchi, H., Tachibana, T., Yoneda, Y., and Kawajiri, K. (1998) Nuclear localization and export signals of the human aryl hydrocarbon receptor, J. Biol. Chem. 273, 2895-2904.
(18) Soshilov, A., and Denison, M. S. (2008) Role of the Per/Arnt/Sim domains in ligand-dependent transformation of the aryl hydrocarbon receptor, J. Biol. Chem. 283, 32995-33005.
(19) Rowlands, J. C., McEwan, I. J., and Gustafsson, J. A. (1996) Trans-activation by the human aryl hydrocarbon receptor and aryl hydrocarbon receptor nuclear translocator proteins: direct interactions with basal transcription factors, Mol. Pharmacol. 50, 538-548.
(20) Ramadoss, P., and Perdew, G. H. (2005) The transactivation domain of the Ah receptor is a key determinant of cellular localization and ligand-independent nucleocytoplasmic shuttling properties, Biochemistry 44, 11148-11159.
(21) Bell, D. R., and Poland, A. (2000) Binding of aryl hydrocarbon receptor (AhR) to AhR-interacting protein. The role of hsp90, J. Biol. Chem. 275, 36407-36414.
(22) Carver, L. A., and Bradfield, C. A. (1997) Ligand-dependent interaction of the aryl hydrocarbon receptor with a novel immunophilin homolog in vivo, J. Biol. Chem. 272, 11452-11456.
(23) Ramadoss, P., Petrulis, J. R., Hollingshead, B. D., Kusnadi, A., and Perdew, G. H. (2004) Divergent roles of hepatitis B virus X-associated protein 2 (XAP2) in human versus mouse Ah receptor complexes, Biochemistry 43, 700-709.
149
(24) Zhang, S., Rowlands, C., and Safe, S. (2008) Ligand-dependent interactions of the Ah receptor with coactivators in a mammalian two-hybrid assay, Toxicol. Appl. Pharmacol. 227, 196-206.
(25) Yao, G., Craven, M., Drinkwater, N., and Bradfield, C. A. (2004) Interaction networks in yeast define and enumerate the signaling steps of the vertebrate aryl hydrocarbon receptor, PLoS Biol. 2, E65.
(26) Kohle, C., and Bock, K. W. (2007) Coordinate regulation of Phase I and II xenobiotic metabolisms by the Ah receptor and Nrf2, Biochem. Pharmacol. 73, 1853-1862.
(27) Nault, R., Forgacs, A. L., Dere, E., and Zacharewski, T. R. (2013) Comparisons of differential gene expression elicited by TCDD, PCB126, betaNF, or ICZ in mouse hepatoma Hepa1c1c7 cells and C57BL/6 mouse liver, Toxicol. Lett. 223, 52-59.
(28) Cheng, Y., Jin, U. H., Allred, C. D., Jayraman, A., Chapkin, R. S., and Safe, S. (2015) Aryl Hydrocarbon Receptor Activity of Tryptophan Metabolites in Young Adult Mouse Colonocytes, Drug Metab. Dispos.
(29) Wang, Y., Wang, Q., Wu, B., Li, Y., and Lu, G. (2013) Correlation between TCDD acute toxicity and aryl hydrocarbon receptor structure for different mammals, Ecotoxicol. Environ. Saf. 89, 84-88.
(30) Pandini, A., Soshilov, A. A., Song, Y., Zhao, J., Bonati, L., and Denison, M. S. (2009) Detection of the TCDD binding-fingerprint within the Ah receptor ligand binding domain by structurally driven mutagenesis and functional analysis, Biochemistry 48, 5972-5983.
(31) Ma, Q., and Baldwin, K. T. (2000) 2,3,7,8-tetrachlorodibenzo-p-dioxin-induced degradation of aryl hydrocarbon receptor (AhR) by the ubiquitin-proteasome pathway. Role of the transcription activaton and DNA binding of AhR, J. Biol. Chem. 275, 8432-8438.
(32) Xing, X., Bi, H., Chang, A. K., Zang, M. X., Wang, M., Ao, X., Li, S., Pan, H., Guo, Q., and Wu, H. (2012) SUMOylation of AhR modulates its activity and stability through inhibiting its ubiquitination, J. Cell. Physiol. 227, 3812-3819.
(33) Ikuta, T., Kobayashi, Y., and Kawajiri, K. (2004) Phosphorylation of nuclear localization signal inhibits the ligand-dependent nuclear import of aryl hydrocarbon receptor, Biochem. Biophys. Res. Commun. 317, 545-550.
(34) Hahn, M. E., Allan, L. L., and Sherr, D. H. (2009) Regulation of constitutive and inducible AHR signaling: complex interactions involving the AHR repressor, Biochem. Pharmacol. 77, 485-497.
(35) Mimura, J., Ema, M., Sogawa, K., and Fujii-Kuriyama, Y. (1999) Identification of a novel mechanism of regulation of Ah (dioxin) receptor function, Genes Dev. 13, 20-25.
150
(36) MacPherson, L., Ahmed, S., Tamblyn, L., Krutmann, J., Forster, I., Weighardt, H., and Matthews, J. (2014) Aryl hydrocarbon receptor repressor and TiPARP (ARTD14) use similar, but also distinct mechanisms to repress aryl hydrocarbon receptor signaling, Int. J. Mol. Sci. 15, 7939-7957.
(37) Evans, B. R., Karchner, S. I., Allan, L. L., Pollenz, R. S., Tanguay, R. L., Jenny, M. J., Sherr, D. H., and Hahn, M. E. (2008) Repression of aryl hydrocarbon receptor (AHR) signaling by AHR repressor: role of DNA binding and competition for AHR nuclear translocator, Mol. Pharmacol. 73, 387-398.
(38) MacPherson, L., Tamblyn, L., Rajendra, S., Bralha, F., McPherson, J. P., and Matthews, J. (2013) 2,3,7,8-Tetrachlorodibenzo-p-dioxin poly(ADP-ribose) polymerase (TiPARP, ARTD14) is a mono-ADP-ribosyltransferase and repressor of aryl hydrocarbon receptor transactivation, Nucleic Acids Res. 41, 1604-1621.
(39) Nakata, A., Urano, D., Fujii-Kuriyama, Y., Mizuno, N., Tago, K., and Itoh, H. (2009) G-protein signalling negatively regulates the stability of aryl hydrocarbon receptor, EMBO Rep. 10, 622-628.
(40) de Oliveira, S. K., Hoffmeister, M., Gambaryan, S., Muller-Esterl, W., Guimaraes, J. A., and Smolenski, A. P. (2007) Phosphodiesterase 2A forms a complex with the co-chaperone XAP2 and regulates nuclear translocation of the aryl hydrocarbon receptor, J. Biol. Chem. 282, 13656-13663.
(41) Oesch-Bartlomowicz, B., Huelster, A., Wiss, O., Antoniou-Lipfert, P., Dietrich, C., Arand, M., Weiss, C., Bockamp, E., and Oesch, F. (2005) Aryl hydrocarbon receptor activation by cAMP vs. dioxin: divergent signaling pathways, Proc. Natl. Acad. Sci. U. S. A. 102, 9218-9223.
(42) de Oliveira, S. K., and Smolenski, A. (2009) Phosphodiesterases link the aryl hydrocarbon receptor complex to cyclic nucleotide signaling, Biochem. Pharmacol. 77, 723-733.
(43) Meyer, B. K., Petrulis, J. R., and Perdew, G. H. (2000) Aryl hydrocarbon (Ah) receptor levels are selectively modulated by hsp90-associated immunophilin homolog XAP2, Cell Stress Chaperones 5, 243-254.
(44) Margineantu, D. H., Emerson, C. B., Diaz, D., and Hockenbery, D. M. (2007) Hsp90 inhibition decreases mitochondrial protein turnover, PLoS One 2, e1066.
(45) Rodriguez-Sinovas, A., Boengler, K., Cabestrero, A., Gres, P., Morente, M., Ruiz-Meana, M., Konietzka, I., Miro, E., Totzeck, A., Heusch, G., Schulz, R., and Garcia-Dorado, D. (2006) Translocation of connexin 43 to the inner mitochondrial membrane of cardiomyocytes through the heat shock protein 90-dependent TOM pathway and its importance for cardioprotection, Circ. Res. 99, 93-101.
151
(46) Young, J. C., Hoogenraad, N. J., and Hartl, F. U. (2003) Molecular chaperones Hsp90 and Hsp70 deliver preproteins to the mitochondrial import receptor Tom70, Cell 112, 41-50.
(47) Kekatpure, V. D., Dannenberg, A. J., and Subbaramaiah, K. (2009) HDAC6 modulates Hsp90 chaperone activity and regulates activation of aryl hydrocarbon receptor signaling, J. Biol. Chem. 284, 7436-7445.
(48) Lee, Y. S., Lim, K. H., Guo, X., Kawaguchi, Y., Gao, Y., Barrientos, T., Ordentlich, P., Wang, X. F., Counter, C. M., and Yao, T. P. (2008) The cytoplasmic deacetylase HDAC6 is required for efficient oncogenic tumorigenesis, Cancer Res. 68, 7561-7569.
(49) Trivellin, G., and Korbonits, M. (2011) AIP and its interacting partners, J. Endocrinol. 210, 137-155.
(50) Kuzhandaivelu, N., Cong, Y. S., Inouye, C., Yang, W. M., and Seto, E. (1996) XAP2, a novel hepatitis B virus X-associated protein that inhibits X transactivation, Nucleic Acids Res. 24, 4741-4750.
(51) Meyer, B. K., Pray-Grant, M. G., Vanden Heuvel, J. P., and Perdew, G. H. (1998) Hepatitis B virus X-associated protein 2 is a subunit of the unliganded aryl hydrocarbon receptor core complex and exhibits transcriptional enhancer activity, Mol. Cell. Biol. 18, 978-988.
(52) Jaffrain-Rea, M. L., Angelini, M., Gargano, D., Tichomirowa, M. A., Daly, A. F., Vanbellinghen, J. F., D'Innocenzo, E., Barlier, A., Giangaspero, F., Esposito, V., Ventura, L., Arcella, A., Theodoropoulou, M., Naves, L. A., Fajardo, C., Zacharieva, S., Rohmer, V., Brue, T., Gulino, A., Cantore, G., Alesse, E., and Beckers, A. (2009) Expression of aryl hydrocarbon receptor (AHR) and AHR-interacting protein in pituitary adenomas: pathological and clinical implications, Endocr. Relat. Cancer 16, 1029-1043.
(53) Nukaya, M., Lin, B. C., Glover, E., Moran, S. M., Kennedy, G. D., and Bradfield, C. A. (2010) The aryl hydrocarbon receptor-interacting protein (AIP) is required for dioxin-induced hepatotoxicity but not for the induction of the Cyp1a1 and Cyp1a2 genes, J. Biol. Chem. 285, 35599-35605.
(54) Fernandez-Salguero, P., Pineau, T., Hilbert, D. M., McPhail, T., Lee, S. S., Kimura, S., Nebert, D. W., Rudikoff, S., Ward, J. M., and Gonzalez, F. J. (1995) Immune system impairment and hepatic fibrosis in mice lacking the dioxin-binding Ah receptor, Science 268, 722-726.
(55) Mezrich, J. D., Fechner, J. H., Zhang, X., Johnson, B. P., Burlingham, W. J., and Bradfield, C. A. (2010) An interaction between kynurenine and the aryl hydrocarbon receptor can generate regulatory T cells, J. Immunol. 185, 3190-3198.
152
(56) Barouki, R., Coumoul, X., and Fernandez-Salguero, P. M. (2007) The aryl hydrocarbon receptor, more than a xenobiotic-interacting protein, FEBS Lett. 581, 3608-3615.
(57) Ikuta, T., Kobayashi, Y., and Kawajiri, K. (2004) Cell density regulates intracellular localization of aryl hydrocarbon receptor, J. Biol. Chem. 279, 19209-19216.
(58) Hu, Q., He, G., Zhao, J., Soshilov, A., Denison, M. S., Zhang, A., Yin, H., Fraccalvieri, D., Bonati, L., Xie, Q., and Zhao, B. (2013) Ginsenosides are novel naturally-occurring aryl hydrocarbon receptor ligands, PLoS One 8, e66258.
(59) Opitz, C. A., Litzenburger, U. M., Sahm, F., Ott, M., Tritschler, I., Trump, S., Schumacher, T., Jestaedt, L., Schrenk, D., Weller, M., Jugold, M., Guillemin, G. J., Miller, C. L., Lutz, C., Radlwimmer, B., Lehmann, I., von Deimling, A., Wick, W., and Platten, M. (2011) An endogenous tumour-promoting ligand of the human aryl hydrocarbon receptor, Nature 478, 197-203.
(60) Bock, K. W., and Kohle, C. (2009) The mammalian aryl hydrocarbon (Ah) receptor: from mediator of dioxin toxicity toward physiological functions in skin and liver, Biol. Chem. 390, 1225-1235.
(61) Yang, J., Solaimani, P., Dong, H., Hammock, B., and Hankinson, O. (2013) Treatment of mice with 2,3,7,8-Tetrachlorodibenzo-p-dioxin markedly increases the levels of a number of cytochrome P450 metabolites of omega-3 polyunsaturated fatty acids in the liver and lung, J. Toxicol. Sci. 38, 833-836.
(62) Seubert, J. M., Darmon, A. J., El-Kadi, A. O., D'Souza, S. J., and Bend, J. R. (2002) Apoptosis in murine hepatoma hepa 1c1c7 wild-type, C12, and C4 cells mediated by bilirubin, Mol. Pharmacol. 62, 257-264.
(63) Rodrigues, C. M., Sola, S., Silva, R., and Brites, D. (2000) Bilirubin and amyloid-beta peptide induce cytochrome c release through mitochondrial membrane permeabilization, Mol. Med. 6, 936-946.
(64) Oakes, G. H., and Bend, J. R. (2005) Early steps in bilirubin-mediated apoptosis in murine hepatoma (Hepa 1c1c7) cells are characterized by aryl hydrocarbon receptor-independent oxidative stress and activation of the mitochondrial pathway, J. Biochem. Mol. Toxicol. 19, 244-255.
(65) Moura-Alves, P., Fae, K., Houthuys, E., Dorhoi, A., Kreuchwig, A., Furkert, J., Barison, N., Diehl, A., Munder, A., Constant, P., Skrahina, T., Guhlich-Bornhof, U., Klemm, M., Koehler, A. B., Bandermann, S., Goosmann, C., Mollenkopf, H. J., Hurwitz, R., Brinkmann, V., Fillatreau, S., Daffe, M., Tummler, B., Kolbe, M., Oschkinat, H., Krause, G., and Kaufmann, S. H. (2014) AhR sensing of bacterial pigments regulates antibacterial defence, Nature 512, 387-392.
153
(66) Watson, J. D., Prokopec, S. D., Smith, A. B., Okey, A. B., Pohjanvirta, R., and Boutros, P. C. (2014) TCDD dysregulation of 13 AHR-target genes in rat liver, Toxicol. Appl. Pharmacol. 274, 445-454.
(67) Black, M. B., Budinsky, R. A., Dombkowski, A., Cukovic, D., LeCluyse, E. L., Ferguson, S. S., Thomas, R. S., and Rowlands, J. C. (2012) Cross-species comparisons of transcriptomic alterations in human and rat primary hepatocytes exposed to 2,3,7,8-tetrachlorodibenzo-p-dioxin, Toxicol. Sci. 127, 199-215.
(68) Forgacs, A. L., Dere, E., Angrish, M. M., and Zacharewski, T. R. (2013) Comparative analysis of temporal and dose-dependent TCDD-elicited gene expression in human, mouse, and rat primary hepatocytes, Toxicol. Sci. 133, 54-66.
(69) Viluksela, M., Unkila, M., Pohjanvirta, R., Tuomisto, J. T., Stahl, B. U., Rozman, K. K., and Tuomisto, J. (1999) Effects of 2,3,7,8-tetrachlorodibenzo-p-dioxin (TCDD) on liver phosphoenolpyruvate carboxykinase (PEPCK) activity, glucose homeostasis and plasma amino acid concentrations in the most TCDD-susceptible and the most TCDD-resistant rat strains, Arch. Toxicol. 73, 323-336.
(70) Fong, C. J., Burgoon, L. D., and Zacharewski, T. R. (2005) Comparative microarray analysis of basal gene expression in mouse Hepa-1c1c7 wild-type and mutant cell lines, Toxicol. Sci. 86, 342-353.
(71) Lin, S., Yang, Z., Liu, H., and Cai, Z. (2011) Metabolomic analysis of liver and skeletal muscle tissues in C57BL/6J and DBA/2J mice exposed to 2,3,7,8-tetrachlorodibenzo-p-dioxin, Mol. Biosyst. 7, 1956-1965.
(72) Prokopec, S. D., Watson, J. D., Lee, J., Pohjanvirta, R., and Boutros, P. C. (2015) Sex-related differences in murine hepatic transcriptional and proteomic responses to TCDD, Toxicol. Appl. Pharmacol. 284, 188-196.
(73) Zhang, W., Sargis, R. M., Volden, P. A., Carmean, C. M., Sun, X. J., and Brady, M. J. (2012) PCB 126 and other dioxin-like PCBs specifically suppress hepatic PEPCK expression via the aryl hydrocarbon receptor, PLoS One 7, e37103.
(74) Aqil, F., Shen, H., Jeyabalan, J., Xin, X., Lehmler, H. J., Ludewig, G., Robertson, L. W., and Gupta, R. C. (2014) Sustained expression of CYPs and DNA adduct accumulation with continuous exposure to PCB126 and PCB153 through a new delivery method: Polymeric implants, Toxicol. Rep. 1, 820-833.
(75) Yeager, R. L., Reisman, S. A., Aleksunes, L. M., and Klaassen, C. D. (2009) Introducing the "TCDD-inducible AhR-Nrf2 gene battery", Toxicol. Sci. 111, 238-246.
(76) Boopathi, E., Srinivasan, S., Fang, J. K., and Avadhani, N. G. (2008) Bimodal protein targeting through activation of cryptic mitochondrial targeting signals by an inducible cytosolic endoprotease, Mol. Cell 32, 32-42.
154
(77) Dong, H., Dalton, T. P., Miller, M. L., Chen, Y., Uno, S., Shi, Z., Shertzer, H. G., Bansal, S., Avadhani, N. G., and Nebert, D. W. (2009) Knock-in mouse lines expressing either mitochondrial or microsomal CYP1A1: differing responses to dietary benzo[a]pyrene as proof of principle, Mol. Pharmacol. 75, 555-567.
(78) Bansal, S., Leu, A. N., Gonzalez, F. J., Guengerich, F. P., Chowdhury, A. R., Anandatheerthavarada, H. K., and Avadhani, N. G. (2014) Mitochondrial targeting of cytochrome P450 (CYP) 1B1 and its role in polycyclic aromatic hydrocarbon-induced mitochondrial dysfunction, J. Biol. Chem. 289, 9936-9951.
(79) Shimada, T., and Fujii-Kuriyama, Y. (2004) Metabolic activation of polycyclic aromatic hydrocarbons to carcinogens by cytochromes P450 1A1 and 1B1, Cancer Sci. 95, 1-6.
(80) Dong, H., Shertzer, H. G., Genter, M. B., Gonzalez, F. J., Vasiliou, V., Jefcoate, C., and Nebert, D. W. (2013) Mitochondrial targeting of mouse NQO1 and CYP1B1 proteins, Biochem. Biophys. Res. Commun. 435, 727-732.
(81) Nebert, D. W., Roe, A. L., Dieter, M. Z., Solis, W. A., Yang, Y., and Dalton, T. P. (2000) Role of the aromatic hydrocarbon receptor and [Ah] gene battery in the oxidative stress response, cell cycle control, and apoptosis, Biochem. Pharmacol. 59, 65-85.
(82) Miao, W., Hu, L., Scrivens, P. J., and Batist, G. (2005) Transcriptional regulation of NF-E2 p45-related factor (NRF2) expression by the aryl hydrocarbon receptor-xenobiotic response element signaling pathway: direct cross-talk between phase I and II drug-metabolizing enzymes, J. Biol. Chem. 280, 20340-20348.
(83) Wang, L., He, X., Szklarz, G. D., Bi, Y., Rojanasakul, Y., and Ma, Q. (2013) The aryl hydrocarbon receptor interacts with nuclear factor erythroid 2-related factor 2 to mediate induction of NAD(P)H:quinoneoxidoreductase 1 by 2,3,7,8-tetrachlorodibenzo-p-dioxin, Arch. Biochem. Biophys. 537, 31-38.
(84) Lu, H., Cui, W., and Klaassen, C. D. (2011) Nrf2 protects against 2,3,7,8-tetrachlorodibenzo-p-dioxin (TCDD)-induced oxidative injury and steatohepatitis, Toxicol. Appl. Pharmacol. 256, 122-135.
(85) Dabir, P., Marinic, T. E., Krukovets, I., and Stenina, O. I. (2008) Aryl hydrocarbon receptor is activated by glucose and regulates the thrombospondin-1 gene promoter in endothelial cells, Circ. Res. 102, 1558-1565.
(86) Ohtake, F., Takeyama, K., Matsumoto, T., Kitagawa, H., Yamamoto, Y., Nohara, K., Tohyama, C., Krust, A., Mimura, J., Chambon, P., Yanagisawa, J., Fujii-Kuriyama, Y., and Kato, S. (2003) Modulation of oestrogen receptor signalling by association with the activated dioxin receptor, Nature 423, 545-550.
155
(87) Bock, K. W. (2012) Ah receptor- and Nrf2-gene battery members: modulators of quinone-mediated oxidative and endoplasmic reticulum stress, Biochem. Pharmacol. 83, 833-838.
(88) Hayes, C. L., Spink, D. C., Spink, B. C., Cao, J. Q., Walker, N. J., and Sutter, T. R. (1996) 17 beta-estradiol hydroxylation catalyzed by human cytochrome P450 1B1, Proc. Natl. Acad. Sci. U. S. A. 93, 9776-9781.
(89) Tsuchiya, Y., Nakajima, M., Kyo, S., Kanaya, T., Inoue, M., and Yokoi, T. (2004) Human CYP1B1 is regulated by estradiol via estrogen receptor, Cancer Res. 64, 3119-3125.
(90) Ohtake, F., Baba, A., Takada, I., Okada, M., Iwasaki, K., Miki, H., Takahashi, S., Kouzmenko, A., Nohara, K., Chiba, T., Fujii-Kuriyama, Y., and Kato, S. (2007) Dioxin receptor is a ligand-dependent E3 ubiquitin ligase, Nature 446, 562-566.
(91) Smith, B. W., Rozelle, S. S., Leung, A., Ubellacker, J., Parks, A., Nah, S. K., French, D., Gadue, P., Monti, S., Chui, D. H., Steinberg, M. H., Frelinger, A. L., Michelson, A. D., Theberge, R., McComb, M. E., Costello, C. E., Kotton, D. N., Mostoslavsky, G., Sherr, D. H., and Murphy, G. J. (2013) The aryl hydrocarbon receptor directs hematopoietic progenitor cell expansion and differentiation, Blood 122, 376-385.
(92) Stockinger, B., Di Meglio, P., Gialitakis, M., and Duarte, J. H. (2014) The aryl hydrocarbon receptor: multitasking in the immune system, Annu. Rev. Immunol. 32, 403-432.
(93) Matsumura, F. (2009) The significance of the nongenomic pathway in mediating inflammatory signaling of the dioxin-activated Ah receptor to cause toxic effects, Biochem. Pharmacol. 77, 608-626.
(94) Tian, Y., Ke, S., Denison, M. S., Rabson, A. B., and Gallo, M. A. (1999) Ah receptor and NF-kappaB interactions, a potential mechanism for dioxin toxicity, J. Biol. Chem. 274, 510-515.
(95) Harrill, J. A., Hukkanen, R. R., Lawson, M., Martin, G., Gilger, B., Soldatow, V., Lecluyse, E. L., Budinsky, R. A., Rowlands, J. C., and Thomas, R. S. (2013) Knockout of the aryl hydrocarbon receptor results in distinct hepatic and renal phenotypes in rats and mice, Toxicol. Appl. Pharmacol. 272, 503-518.
(96) Kawajiri, K., Kobayashi, Y., Ohtake, F., Ikuta, T., Matsushima, Y., Mimura, J., Pettersson, S., Pollenz, R. S., Sakaki, T., Hirokawa, T., Akiyama, T., Kurosumi, M., Poellinger, L., Kato, S., and Fujii-Kuriyama, Y. (2009) Aryl hydrocarbon receptor suppresses intestinal carcinogenesis in ApcMin/+ mice with natural ligands, Proc. Natl. Acad. Sci. U. S. A. 106, 13481-13486.
156
(97) Ming, M., Wang, S., Wu, W., Senyuk, V., Le Beau, M. M., Nucifora, G., and Qian, Z. (2012) Activation of Wnt/beta-catenin protein signaling induces mitochondria-mediated apoptosis in hematopoietic progenitor cells, J. Biol. Chem. 287, 22683-22690.
(98) Schmidt, O., Pfanner, N., and Meisinger, C. (2010) Mitochondrial protein import: from proteomics to functional mechanisms, Nat. Rev. Mol. Cell Biol. 11, 655-667.
(99) Friedman, J. R., and Nunnari, J. (2014) Mitochondrial form and function, Nature 505, 335-343.
(100) Wallace, D. C. (2005) A mitochondrial paradigm of metabolic and degenerative diseases, aging, and cancer: a dawn for evolutionary medicine, Annu. Rev. Genet. 39, 359-407.
(101) Fox, T. D. (2012) Mitochondrial protein synthesis, import, and assembly, Genetics 192, 1203-1234.
(102) Hom, J., and Sheu, S. S. (2009) Morphological dynamics of mitochondria--a special emphasis on cardiac muscle cells, J. Mol. Cell. Cardiol. 46, 811-820.
(103) Scarpulla, R. C. (2008) Transcriptional paradigms in mammalian mitochondrial biogenesis and function, Physiol. Rev. 88, 611-638.
(104) Chen, X. J., Wang, X., Kaufman, B. A., and Butow, R. A. (2005) Aconitase couples metabolic regulation to mitochondrial DNA maintenance, Science 307, 714-717.
(105) Matsushima, Y., and Kaguni, L. S. (2012) Matrix proteases in mitochondrial DNA function, Biochim. Biophys. Acta 1819, 1080-1087.
(106) Shutt, T. E., and Shadel, G. S. (2010) A compendium of human mitochondrial gene expression machinery with links to disease, Environ. Mol. Mutagen 51, 360-379.
(107) Gadir, N., Haim-Vilmovsky, L., Kraut-Cohen, J., and Gerst, J. E. (2011) Localization of mRNAs coding for mitochondrial proteins in the yeast Saccharomyces cerevisiae, RNA 17, 1551-1565.
(108) Baker, M. J., Frazier, A. E., Gulbis, J. M., and Ryan, M. T. (2007) Mitochondrial protein-import machinery: correlating structure with function, Trends Cell Biol. 17, 456-464.
(109) Gava, L. M., Goncalves, D. C., Borges, J. C., and Ramos, C. H. (2011) Stoichiometry and thermodynamics of the interaction between the C-terminus of human 90kDa heat shock protein Hsp90 and the mitochondrial translocase of outer membrane Tom70, Arch. Biochem. Biophys. 513, 119-125.
157
(110) Budas, G. R., Churchill, E. N., Disatnik, M. H., Sun, L., and Mochly-Rosen, D. (2010) Mitochondrial import of PKCepsilon is mediated by HSP90: a role in cardioprotection from ischaemia and reperfusion injury, Cardiovasc. Res. 88, 83-92.
(111) Yano, M., Terada, K., and Mori, M. (2003) AIP is a mitochondrial import mediator that binds to both import receptor Tom20 and preproteins, J. Cell Biol. 163, 45-56.
(112) Fan, A. C., Kozlov, G., Hoegl, A., Marcellus, R. C., Wong, M. J., Gehring, K., and Young, J. C. (2011) Interaction between the human mitochondrial import receptors Tom20 and Tom70 in vitro suggests a chaperone displacement mechanism, J. Biol. Chem. 286, 32208-32219.
(113) van der Laan, M., Wiedemann, N., Mick, D. U., Guiard, B., Rehling, P., and Pfanner, N. (2006) A role for Tim21 in membrane-potential-dependent preprotein sorting in mitochondria, Curr. Biol. 16, 2271-2276.
(114) Bragoszewski, P., Gornicka, A., Sztolsztener, M. E., and Chacinska, A. (2013) The ubiquitin-proteasome system regulates mitochondrial intermembrane space proteins, Mol. Cell. Biol. 33, 2136-2148.
(115) Garesse, R., and Kaguni, L. S. (2005) A Drosophila model of mitochondrial DNA replication: proteins, genes and regulation, IUBMB Life 57, 555-561.
(116) Arnold, S. (2012) The power of life--cytochrome c oxidase takes center stage in metabolic control, cell signalling and survival, Mitochondrion 12, 46-56.
(117) Piantadosi, C. A., and Suliman, H. B. (2008) Transcriptional Regulation of SDHa flavoprotein by nuclear respiratory factor-1 prevents pseudo-hypoxia in aerobic cardiac cells, J. Biol. Chem. 283, 10967-10977.
(118) Psarra, A. M., and Sekeris, C. E. (2008) Steroid and thyroid hormone receptors in mitochondria, IUBMB Life 60, 210-223.
(119) Jeninga, E. H., Schoonjans, K., and Auwerx, J. (2010) Reversible acetylation of PGC-1: connecting energy sensors and effectors to guarantee metabolic flexibility, Oncogene 29, 4617-4624.
(120) Sena, L. A., and Chandel, N. S. (2012) Physiological roles of mitochondrial reactive oxygen species, Mol. Cell 48, 158-167.
(121) Kotiadis, V. N., Duchen, M. R., and Osellame, L. D. (2014) Mitochondrial quality control and communications with the nucleus are important in maintaining mitochondrial function and cell health, Biochim. Biophys. Acta 1840, 1254-1265.
(122) Nunnari, J., and Suomalainen, A. (2012) Mitochondria: in sickness and in health, Cell 148, 1145-1159.
158
(123) Brand, M. D. (2010) The sites and topology of mitochondrial superoxide production, Exp. Gerontol. 45, 466-472.
(124) Bleier, L., Wittig, I., Heide, H., Steger, M., Brandt, U., and Drose, S. (2015) Generator-specific targets of mitochondrial reactive oxygen species, Free Radic. Biol. Med. 78, 1-10.
(125) Drose, S., and Brandt, U. (2012) Molecular mechanisms of superoxide production by the mitochondrial respiratory chain, Adv. Exp. Med. Biol. 748, 145-169.
(126) Voet, D., and Voet, J. G. (1995) Biochemistry, 2nd ed., J. Wiley & Sons, New York.
(127) Denko, N. C. (2008) Hypoxia, HIF1 and glucose metabolism in the solid tumour, Nat. Rev. Cancer 8, 705-713.
(128) Chin, R. M., Fu, X., Pai, M. Y., Vergnes, L., Hwang, H., Deng, G., Diep, S., Lomenick, B., Meli, V. S., Monsalve, G. C., Hu, E., Whelan, S. A., Wang, J. X., Jung, G., Solis, G. M., Fazlollahi, F., Kaweeteerawat, C., Quach, A., Nili, M., Krall, A. S., Godwin, H. A., Chang, H. R., Faull, K. F., Guo, F., Jiang, M., Trauger, S. A., Saghatelian, A., Braas, D., Christofk, H. R., Clarke, C. F., Teitell, M. A., Petrascheck, M., Reue, K., Jung, M. E., Frand, A. R., and Huang, J. (2014) The metabolite alpha-ketoglutarate extends lifespan by inhibiting ATP synthase and TOR, Nature 510, 397-401.
(129) Dang, L., White, D. W., Gross, S., Bennett, B. D., Bittinger, M. A., Driggers, E. M., Fantin, V. R., Jang, H. G., Jin, S., Keenan, M. C., Marks, K. M., Prins, R. M., Ward, P. S., Yen, K. E., Liau, L. M., Rabinowitz, J. D., Cantley, L. C., Thompson, C. B., Vander Heiden, M. G., and Su, S. M. (2009) Cancer-associated IDH1 mutations produce 2-hydroxyglutarate, Nature 462, 739-744.
(130) Xu, W., Yang, H., Liu, Y., Yang, Y., Wang, P., Kim, S. H., Ito, S., Yang, C., Wang, P., Xiao, M. T., Liu, L. X., Jiang, W. Q., Liu, J., Zhang, J. Y., Wang, B., Frye, S., Zhang, Y., Xu, Y. H., Lei, Q. Y., Guan, K. L., Zhao, S. M., and Xiong, Y. (2011) Oncometabolite 2-hydroxyglutarate is a competitive inhibitor of alpha-ketoglutarate-dependent dioxygenases, Cancer Cell 19, 17-30.
(131) Koivunen, P., Hirsila, M., Remes, A. M., Hassinen, I. E., Kivirikko, K. I., and Myllyharju, J. (2007) Inhibition of hypoxia-inducible factor (HIF) hydroxylases by citric acid cycle intermediates: possible links between cell metabolism and stabilization of HIF, J. Biol. Chem. 282, 4524-4532.
(132) King, A., Selak, M. A., and Gottlieb, E. (2006) Succinate dehydrogenase and fumarate hydratase: linking mitochondrial dysfunction and cancer, Oncogene 25, 4675-4682.
(133) Benit, P., Letouze, E., Rak, M., Aubry, L., Burnichon, N., Favier, J., Gimenez-Roqueplo, A. P., and Rustin, P. (2014) Unsuspected task for an old team: succinate, fumarate and
159
other Krebs cycle acids in metabolic remodeling, Biochim. Biophys. Acta 1837, 1330-1337.
(134) Zhao, S., Xu, W., Jiang, W., Yu, W., Lin, Y., Zhang, T., Yao, J., Zhou, L., Zeng, Y., Li, H., Li, Y., Shi, J., An, W., Hancock, S. M., He, F., Qin, L., Chin, J., Yang, P., Chen, X., Lei, Q., Xiong, Y., and Guan, K. L. (2010) Regulation of cellular metabolism by protein lysine acetylation, Science 327, 1000-1004.
(135) Schlicker, C., Gertz, M., Papatheodorou, P., Kachholz, B., Becker, C. F., and Steegborn, C. (2008) Substrates and regulation mechanisms for the human mitochondrial sirtuins Sirt3 and Sirt5, J. Mol. Biol. 382, 790-801.
(136) Lin, Z. F., Xu, H. B., Wang, J. Y., Lin, Q., Ruan, Z., Liu, F. B., Jin, W., Huang, H. H., and Chen, X. (2013) SIRT5 desuccinylates and activates SOD1 to eliminate ROS, Biochem. Biophys. Res. Commun. 441, 191-195.
(137) Fong, G. H., and Takeda, K. (2008) Role and regulation of prolyl hydroxylase domain proteins, Cell Death. Differ. 15, 635-641.
(138) Nassir, F., and Ibdah, J. A. (2014) Role of mitochondria in nonalcoholic fatty liver disease, Int. J. Mol. Sci. 15, 8713-8742.
(139) Begriche, K., Massart, J., Robin, M. A., Bonnet, F., and Fromenty, B. (2013) Mitochondrial adaptations and dysfunctions in nonalcoholic fatty liver disease, Hepatology 58, 1497-1507.
(140) Mandal, P. K. (2005) Dioxin: a review of its environmental effects and its aryl hydrocarbon receptor biology, J. Comp. Physiol. B. 175, 221-230.
(141) Steenland, K., Bertazzi, P., Baccarelli, A., and Kogevinas, M. (2004) Dioxin revisited: developments since the 1997 IARC classification of dioxin as a human carcinogen, Environ. Health Perspect. 112, 1265-1268.
(142) Diani-Moore, S., Zhang, S., Ram, P., and Rifkind, A. B. (2013) Aryl hydrocarbon receptor activation by dioxin targets phosphoenolpyruvate carboxykinase (PEPCK) for ADP-ribosylation via 2,3,7,8-tetrachlorodibenzo-p-dioxin (TCDD)-inducible poly(ADP-ribose) polymerase (TiPARP), J. Biol. Chem. 288, 21514-21525.
(143) Boverhof, D. R., Burgoon, L. D., Tashiro, C., Chittim, B., Harkema, J. R., Jump, D. B., and Zacharewski, T. R. (2005) Temporal and dose-dependent hepatic gene expression patterns in mice provide new insights into TCDD-Mediated hepatotoxicity, Toxicol. Sci. 85, 1048-1063.
(144) Ikegwuonu, F. I., and Jefcoate, C. R. (1999) Evidence for the involvement of the fatty acid and peroxisomal beta-oxidation pathways in the inhibition by dehydroepiandrosterone (DHEA) and induction by 2,3,7,8-tetrachlorodibenzo-p-dioxin
160
(TCDD) and benz(a)anthracene (BA) of cytochrome P4501B1 (CYP1B1) in mouse embryo fibroblasts (C3H10T1/2 cells), Mol. Cell. Biochem. 198, 89-100.
(145) Diani-Moore, S., Ram, P., Li, X., Mondal, P., Youn, D. Y., Sauve, A. A., and Rifkind, A. B. (2010) Identification of the aryl hydrocarbon receptor target gene TiPARP as a mediator of suppression of hepatic gluconeogenesis by 2,3,7,8-tetrachlorodibenzo-p-dioxin and of nicotinamide as a corrective agent for this effect, J. Biol. Chem. 285, 38801-38810.
(146) Angrish, M. M., Jones, A. D., Harkema, J. R., and Zacharewski, T. R. (2011) Aryl hydrocarbon receptor-mediated induction of Stearoyl-CoA desaturase 1 alters hepatic fatty acid composition in TCDD-elicited steatosis, Toxicol. Sci. 124, 299-310.
(147) Sato, S., Shirakawa, H., Tomita, S., Ohsaki, Y., Haketa, K., Tooi, O., Santo, N., Tohkin, M., Furukawa, Y., Gonzalez, F. J., and Komai, M. (2008) Low-dose dioxins alter gene expression related to cholesterol biosynthesis, lipogenesis, and glucose metabolism through the aryl hydrocarbon receptor-mediated pathway in mouse liver, Toxicol. Appl. Pharmacol. 229, 10-19.
(148) Tanos, R., Patel, R. D., Murray, I. A., Smith, P. B., Patterson, A. D., and Perdew, G. H. (2012) Aryl hydrocarbon receptor regulates the cholesterol biosynthetic pathway in a dioxin response element-independent manner, Hepatology 55, 1994-2004.
(149) Angrish, M. M., Dominici, C. Y., and Zacharewski, T. R. (2013) TCDD-elicited effects on liver, serum, and adipose lipid composition in C57BL/6 mice, Toxicol. Sci. 131, 108-115.
(150) He, J., Hu, B., Shi, X., Weidert, E. R., Lu, P., Xu, M., Huang, M., Kelley, E. E., and Xie, W. (2013) Activation of the aryl hydrocarbon receptor sensitizes mice to nonalcoholic steatohepatitis by deactivating mitochondrial sirtuin deacetylase Sirt3, Mol. Cell. Biol. 33, 2047-2055.
(151) Unkila, M., Pohjanvirta, R., and Tuomisto, J. (1998) Body weight loss and changes in tryptophan homeostasis by chlorinated dibenzo-p-dioxin congeners in the most TCDD-susceptible and the most TCDD-resistant rat strain, Arch. Toxicol. 72, 769-776.
(152) Shen, D., Dalton, T. P., Nebert, D. W., and Shertzer, H. G. (2005) Glutathione redox state regulates mitochondrial reactive oxygen production, J. Biol. Chem. 280, 25305-25312.
(153) Shertzer, H. G., Genter, M. B., Shen, D., Nebert, D. W., Chen, Y., and Dalton, T. P. (2006) TCDD decreases ATP levels and increases reactive oxygen production through changes in mitochondrial F(0)F(1)-ATP synthase and ubiquinone, Toxicol. Appl. Pharmacol. 217, 363-374.
(154) Kennedy, L. H., Sutter, C. H., Leon Carrion, S., Tran, Q. T., Bodreddigari, S., Kensicki, E., Mohney, R. P., and Sutter, T. R. (2013) 2,3,7,8-Tetrachlorodibenzo-p-dioxin-
161
mediated production of reactive oxygen species is an essential step in the mechanism of action to accelerate human keratinocyte differentiation, Toxicol. Sci. 132, 235-249.
(155) Makay, B., Makay, O., Yenisey, C., Icoz, G., Ozgen, G., Unsal, E., Akyildiz, M., and Yetkin, E. (2009) The interaction of oxidative stress response with cytokines in the thyrotoxic rat: is there a link?, Mediators Inflamm. 2009, 391682.
(156) Elmarakby, A. A., and Sullivan, J. C. (2012) Relationship between oxidative stress and inflammatory cytokines in diabetic nephropathy, Cardiovasc. Ther. 30, 49-59.
(157) Chen, C. Y., Huang, Y. L., and Lin, T. H. (1998) Association between oxidative stress and cytokine production in nickel-treated rats, Arch. Biochem. Biophys. 356, 127-132.
(158) Vogel, C. F., Khan, E. M., Leung, P. S., Gershwin, M. E., Chang, W. L., Wu, D., Haarmann-Stemmann, T., Hoffmann, A., and Denison, M. S. (2014) Cross-talk between aryl hydrocarbon receptor and the inflammatory response: a role for nuclear factor-kappaB, J. Biol. Chem. 289, 1866-1875.
(159) Senft, A. P., Dalton, T. P., Nebert, D. W., Genter, M. B., Hutchinson, R. J., and Shertzer, H. G. (2002) Dioxin increases reactive oxygen production in mouse liver mitochondria, Toxicol. Appl. Pharmacol. 178, 15-21.
(160) Senft, A. P., Dalton, T. P., Nebert, D. W., Genter, M. B., Puga, A., Hutchinson, R. J., Kerzee, J. K., Uno, S., and Shertzer, H. G. (2002) Mitochondrial reactive oxygen production is dependent on the aromatic hydrocarbon receptor, Free Radic. Biol. Med. 33, 1268-1278.
(161) Aly, H. A., and Domenech, O. (2009) Cytotoxicity and mitochondrial dysfunction of 2,3,7,8-tetrachlorodibenzo-p-dioxin (TCDD) in isolated rat hepatocytes, Toxicol. Lett. 191, 79-87.
(162) Rico de Souza, A., Zago, M., Pollock, S. J., Sime, P. J., Phipps, R. P., and Baglole, C. J. (2011) Genetic ablation of the aryl hydrocarbon receptor causes cigarette smoke-induced mitochondrial dysfunction and apoptosis, J. Biol. Chem. 286, 43214-43228.
(163) Biswas, G., Srinivasan, S., Anandatheerthavarada, H. K., and Avadhani, N. G. (2008) Dioxin-mediated tumor progression through activation of mitochondria-to-nucleus stress signaling, Proc. Natl. Acad. Sci. U. S. A. 105, 186-191.
(164) Forgacs, A. L., Burgoon, L. D., Lynn, S. G., LaPres, J. J., and Zacharewski, T. (2010) Effects of TCDD on the expression of nuclear encoded mitochondrial genes, Toxicol. Appl. Pharmacol. 246, 58-65.
(165) Tappenden, D. M., Lynn, S. G., Crawford, R. B., Lee, K., Vengellur, A., Kaminski, N. E., Thomas, R. S., and LaPres, J. J. (2011) The aryl hydrocarbon receptor interacts with
162
ATP5alpha1, a subunit of the ATP synthase complex, and modulates mitochondrial function, Toxicol. Appl. Pharmacol. 254, 299-310.
(166) Tappenden, D. M., Hwang, H. J., Yang, L., Thomas, R. S., and Lapres, J. J. (2013) The Aryl-Hydrocarbon Receptor Protein Interaction Network (AHR-PIN) as Identified by Tandem Affinity Purification (TAP) and Mass Spectrometry, J. Toxicol. 2013, 279829.
(167) Kang, B. H., Xia, F., Pop, R., Dohi, T., Socolovsky, M., and Altieri, D. C. (2011) Developmental control of apoptosis by the immunophilin aryl hydrocarbon receptor-interacting protein (AIP) involves mitochondrial import of the survivin protein, J. Biol. Chem. 286, 16758-16767.
(168) Yang, T. T., Hsu, C. T., and Kuo, Y. M. (2009) Cell-derived soluble oligomers of human amyloid-beta peptides disturb cellular homeostasis and induce apoptosis in primary hippocampal neurons, J. Neural Transm. 116, 1561-1569.
(169) Vengellur, A., and LaPres, J. J. (2004) The role of hypoxia inducible factor 1alpha in cobalt chloride induced cell death in mouse embryonic fibroblasts, Toxicol. Sci. 82, 638-646.
(170) Frezza, C., Cipolat, S., and Scorrano, L. (2007) Organelle isolation: functional mitochondria from mouse liver, muscle and cultured fibroblasts, Nat. Protoc. 2, 287-295.
(171) Griparic, L., and van der Bliek, A. M. (2005) Assay and properties of the mitochondrial dynamin related protein Opa1, Methods Enzymol. 404, 620-631.
(172) Brand, M. D., and Nicholls, D. G. (2011) Assessing mitochondrial dysfunction in cells, Biochem. J. 435, 297-312.
(173) Frazier, A. E., and Thorburn, D. R. (2012) Biochemical analyses of the electron transport chain complexes by spectrophotometry, Methods Mol. Biol. 837, 49-62.
(174) Barrientos, A., Fontanesi, F., and Diaz, F. (2009) Evaluation of the mitochondrial respiratory chain and oxidative phosphorylation system using polarography and spectrophotometric enzyme assays, Curr. Protoc. Hum. Genet. Chapter 19, Unit19 13.
(175) Shevchenko, A., Wilm, M., Vorm, O., and Mann, M. (1996) Mass spectrometric sequencing of proteins silver-stained polyacrylamide gels, Anal. Chem. 68, 850-858.
(176) Cox, J., and Mann, M. (2008) MaxQuant enables high peptide identification rates, individualized p.p.b.-range mass accuracies and proteome-wide protein quantification, Nat. Biotechnol. 26, 1367-1372.
(177) Cox, J., Neuhauser, N., Michalski, A., Scheltema, R. A., Olsen, J. V., and Mann, M. (2011) Andromeda: a peptide search engine integrated into the MaxQuant environment, J. Proteome Res. 10, 1794-1805.
163
(178) Lowry, O. H., Rosebrough, N. J., Farr, A. L., and Randall, R. J. (1951) Protein measurement with the Folin phenol reagent, J. Biol. Chem. 193, 265-275.
(179) Claros, M. G., and Vincens, P. (1996) Computational method to predict mitochondrially imported proteins and their targeting sequences, Eur. J. Biochem. 241, 779-786.
(180) Fukasawa, Y., Tsuji, J., Fu, S. C., Tomii, K., Horton, P., and Imai, K. (2015) MitoFates: improved prediction of mitochondrial targeting sequences and their cleavage sites, Mol. Cell. Proteomics 14, 1113-1126.
(181) Sickmann, A., Reinders, J., Wagner, Y., Joppich, C., Zahedi, R., Meyer, H. E., Schonfisch, B., Perschil, I., Chacinska, A., Guiard, B., Rehling, P., Pfanner, N., and Meisinger, C. (2003) The proteome of Saccharomyces cerevisiae mitochondria, Proc. Natl. Acad. Sci. U. S. A. 100, 13207-13212.
(182) Diekert, K., Kispal, G., Guiard, B., and Lill, R. (1999) An internal targeting signal directing proteins into the mitochondrial intermembrane space, Proc. Natl. Acad. Sci. U. S. A. 96, 11752-11757.
(183) Huang, X., and Miller, W. (1991) A time-efficient, linear-space local similarity algorithm, Adv. Appl. Math. 12, 337-357.
(184) Pollenz, R. S., Wilson, S. E., and Dougherty, E. J. (2006) Role of endogenous XAP2 protein on the localization and nucleocytoplasmic shuttling of the endogenous mouse Ahb-1 receptor in the presence and absence of ligand, Mol. Pharmacol. 70, 1369-1379.
(185) Pollenz, R. S., and Dougherty, E. J. (2005) Redefining the role of the endogenous XAP2 and C-terminal hsp70-interacting protein on the endogenous Ah receptors expressed in mouse and rat cell lines, J. Biol. Chem. 280, 33346-33356.
(186) Azzu, V., and Brand, M. D. (2010) Degradation of an intramitochondrial protein by the cytosolic proteasome, J. Cell Sci. 123, 578-585.
(187) Azzu, V., and Brand, M. D. (2010) The on-off switches of the mitochondrial uncoupling proteins, Trends Biochem. Sci. 35, 298-307.
(188) Jaiswal, P. K., Srivastava, S., Gupta, J., and Thakur, I. S. (2012) Dibenzofuran induces oxidative stress, disruption of trans-mitochondrial membrane potential (DeltaPsim) and G1 arrest in human hepatoma cell line, Toxicol. Lett. 214, 137-144.
(189) Forgacs, A. L., Kent, M. N., Makley, M. K., Mets, B., DelRaso, N., Jahns, G. L., Burgoon, L. D., Zacharewski, T. R., and Reo, N. V. (2012) Comparative metabolomic and genomic analyses of TCDD-elicited metabolic disruption in mouse and rat liver, Toxicol. Sci. 125, 41-55.
164
(190) Zhang, J., Lanham, K. A., Heideman, W., Peterson, R. E., and Li, L. (2013) Statistically enhanced spectral counting approach to TCDD cardiac toxicity in the adult zebrafish heart, J. Proteome Res. 12, 3093-3103.
(191) Sarioglu, H., Brandner, S., Haberger, M., Jacobsen, C., Lichtmannegger, J., Wormke, M., and Andrae, U. (2008) Analysis of 2,3,7,8-tetrachlorodibenzo-p-dioxin-induced proteome changes in 5L rat hepatoma cells reveals novel targets of dioxin action including the mitochondrial apoptosis regulator VDAC2, Mol. Cell. Proteomics 7, 394-410.
(192) Schulz, M., Brandner, S., Eberhagen, C., Eckardt-Schupp, F., Larsen, M. R., and Andrae, U. (2013) Quantitative phosphoproteomic analysis of early alterations in protein phosphorylation by 2,3,7,8-tetrachlorodibenzo-p-dioxin, J. Proteome Res. 12, 866-882.
(193) Leopold, J. A., and Loscalzo, J. (2000) Cyclic strain modulates resistance to oxidant stress by increasing G6PDH expression in smooth muscle cells, Am. J. Physiol. Heart Circ. Physiol. 279, H2477-2485.
(194) Mailloux, R. J., and Harper, M. E. (2010) Glucose regulates enzymatic sources of mitochondrial NADPH in skeletal muscle cells; a novel role for glucose-6-phosphate dehydrogenase, FASEB J. 24, 2495-2506.
(195) Kohno, H., Furukawa, T., Yoshinaga, T., Tokunaga, R., and Taketani, S. (1993) Coproporphyrinogen oxidase. Purification, molecular cloning, and induction of mRNA during erythroid differentiation, J. Biol. Chem. 268, 21359-21363.
(196) Chavan, H., and Krishnamurthy, P. (2012) Polycyclic aromatic hydrocarbons (PAHs) mediate transcriptional activation of the ATP binding cassette transporter ABCB6 gene via the aryl hydrocarbon receptor (AhR), J. Biol. Chem. 287, 32054-32068.
(197) Dere, E., Lo, R., Celius, T., Matthews, J., and Zacharewski, T. R. (2011) Integration of genome-wide computation DRE search, AhR ChIP-chip and gene expression analyses of TCDD-elicited responses in the mouse liver, BMC Genomics 12, 365.
(198) Lang, E., Schafer, M., Schwender, H., Neumann, N. J., and Frank, J. (2015) Occurrence of Malignant Tumours in the Acute Hepatic Porphyrias, JIMD Rep. 22, 17-22.
(199) Smith, A. G., Clothier, B., Robinson, S., Scullion, M. J., Carthew, P., Edwards, R., Luo, J., Lim, C. K., and Toledano, M. (1998) Interaction between iron metabolism and 2,3,7,8-tetrachlorodibenzo-p-dioxin in mice with variants of the Ahr gene: a hepatic oxidative mechanism, Mol. Pharmacol. 53, 52-61.
(200) Farombi, E. O., and Surh, Y. J. (2006) Heme oxygenase-1 as a potential therapeutic target for hepatoprotection, J. Biochem. Mol. Biol. 39, 479-491.
165
(201) Moffat, C., Bhatia, L., Nguyen, T., Lynch, P., Wang, M., Wang, D., Ilkayeva, O. R., Han, X., Hirschey, M. D., Claypool, S. M., and Seifert, E. L. (2014) Acyl-CoA thioesterase-2 facilitates mitochondrial fatty acid oxidation in the liver, J. Lipid Res. 55, 2458-2470.
(202) Masse, K., Bhamra, S., Eason, R., Dale, N., and Jones, E. A. (2007) Purine-mediated signalling triggers eye development, Nature 449, 1058-1062.
(203) Vandenbeuch, A., Anderson, C. B., Parnes, J., Enjyoji, K., Robson, S. C., Finger, T. E., and Kinnamon, S. C. (2013) Role of the ectonucleotidase NTPDase2 in taste bud function, Proc. Natl. Acad. Sci. U. S. A. 110, 14789-14794.
(204) Yu, J., Lavoie, E. G., Sheung, N., Tremblay, J. J., Sevigny, J., and Dranoff, J. A. (2008) IL-6 downregulates transcription of NTPDase2 via specific promoter elements, Am. J. Physiol. Gastrointest. Liver Physiol. 294, G748-756.
(205) Mateo, J., Kreda, S., Henry, C. E., Harden, T. K., and Boyer, J. L. (2003) Requirement of Cys399 for processing of the human ecto-ATPase (NTPDase2) and its implications for determination of the activities of splice variants of the enzyme, J. Biol. Chem. 278, 39960-39968.
(206) Dere, E., Lee, A. W., Burgoon, L. D., and Zacharewski, T. R. (2011) Differences in TCDD-elicited gene expression profiles in human HepG2, mouse Hepa1c1c7 and rat H4IIE hepatoma cells, BMC Genomics 12, 193.
(207) Gao, L., Dong, L., and Whitlock, J. P., Jr. (1998) A novel response to dioxin. Induction of ecto-ATPase gene expression, J. Biol. Chem. 273, 15358-15365.
(208) Vlajkovic, S. M., Housley, G. D., Greenwood, D., and Thorne, P. R. (1999) Evidence for alternative splicing of ecto-ATPase associated with termination of purinergic transmission, Brain Res. Mol. Brain Res. 73, 85-92.
(209) Hwang, H. J., Lynn, S. G., Vengellur, A., Saini, Y., Grier, E. A., Ferguson-Miller, S. M., and LaPres, J. J. (2015) Hypoxia Inducible Factors Modulate Mitochondrial Oxygen Consumption and Transcriptional Regulation of Nuclear-Encoded Electron Transport Chain Genes, Biochemistry 54, 3739-3748.
(210) Huttemann, M., Kadenbach, B., and Grossman, L. I. (2001) Mammalian subunit IV isoforms of cytochrome c oxidase, Gene 267, 111-123.
(211) Vengellur, A., Woods, B. G., Ryan, H. E., Johnson, R. S., and LaPres, J. J. (2003) Gene expression profiling of the hypoxia signaling pathway in hypoxia-inducible factor 1alpha null mouse embryonic fibroblasts, Gene Expression 11, 181-197.
(212) Ratcliffe, P. J. (2013) Oxygen sensing and hypoxia signalling pathways in animals: the implications of physiology for cancer, J. Physiol. 591, 2027-2042.
166
(213) Bunn, H. F., and Poyton, R. O. (1996) Oxygen sensing and molecular adaptation to hypoxia, Physiol. Rev. 76, 839-885.
(214) Shen, C., Nettleton, D., Jiang, M., Kim, S. K., and Powell-Coffman, J. A. (2005) Roles of the HIF-1 hypoxia-inducible factor during hypoxia response in Caenorhabditis elegans, J. Biol. Chem. 280, 20580-20588.
(215) Li, Y., Padmanabha, D., Gentile, L. B., Dumur, C. I., Beckstead, R. B., and Baker, K. D. (2013) HIF- and non-HIF-regulated hypoxic responses require the estrogen-related receptor in Drosophila melanogaster, PLoS Genet. 9, e1003230.
(216) Taylor, C. T. (2008) Mitochondria and cellular oxygen sensing in the HIF pathway, Biochem. J. 409, 19-26.
(217) Solaini, G., Baracca, A., Lenaz, G., and Sgarbi, G. (2010) Hypoxia and mitochondrial oxidative metabolism, Biochim. Biophys. Acta 1797, 1171-1177.
(218) Palsson-McDermott, E. M., and O'Neill, L. A. (2013) The Warburg effect then and now: from cancer to inflammatory diseases, Bioessays 35, 965-973.
(219) Bruick, R. K. (2000) Expression of the gene encoding the proapoptotic Nip3 protein is induced by hypoxia, Proc. Natl. Acad. Sci. U. S. A. 97, 9082-9087.
(220) Rikka, S., Quinsay, M. N., Thomas, R. L., Kubli, D. A., Zhang, X., Murphy, A. N., and Gustafsson, A. B. (2011) Bnip3 impairs mitochondrial bioenergetics and stimulates mitochondrial turnover, Cell Death Differ. 18, 721-731.
(221) Gomes, A. P., Price, N. L., Ling, A. J., Moslehi, J. J., Montgomery, M. K., Rajman, L., White, J. P., Teodoro, J. S., Wrann, C. D., Hubbard, B. P., Mercken, E. M., Palmeira, C. M., de Cabo, R., Rolo, A. P., Turner, N., Bell, E. L., and Sinclair, D. A. (2013) Declining NAD(+) induces a pseudohypoxic state disrupting nuclear-mitochondrial communication during aging, Cell 155, 1624-1638.
(222) Huttemann, M., Jaradat, S., and Grossman, L. I. (2003) Cytochrome c oxidase of mammals contains a testes-specific isoform of subunit VIb--the counterpart to testes-specific cytochrome c?, Mol. Reprod. Dev. 66, 8-16.
(223) Huttemann, M., Schmidt, T. R., and Grossman, L. I. (2003) A third isoform of cytochrome c oxidase subunit VIII is present in mammals, Gene 312, 95-102.
(224) Pierron, D., Wildman, D. E., Huttemann, M., Markondapatnaikuni, G. C., Aras, S., and Grossman, L. I. (2012) Cytochrome c oxidase: evolution of control via nuclear subunit addition, Biochim. Biophys. Acta 1817, 590-597.
167
(225) Acin-Perez, R., Gatti, D. L., Bai, Y., and Manfredi, G. (2011) Protein phosphorylation and prevention of cytochrome oxidase inhibition by ATP: coupled mechanisms of energy metabolism regulation, Cell Metab. 13, 712-719.
(226) Huttemann, M., Lee, I., Liu, J., and Grossman, L. I. (2007) Transcription of mammalian cytochrome c oxidase subunit IV-2 is controlled by a novel conserved oxygen responsive element, FEBS J. 274, 5737-5748.
(227) Fukuda, R., Zhang, H., Kim, J. W., Shimoda, L., Dang, C. V., and Semenza, G. L. (2007) HIF-1 regulates cytochrome oxidase subunits to optimize efficiency of respiration in hypoxic cells, Cell 129, 111-122.
(228) Ronn, T., Poulsen, P., Hansson, O., Holmkvist, J., Almgren, P., Nilsson, P., Tuomi, T., Isomaa, B., Groop, L., Vaag, A., and Ling, C. (2008) Age influences DNA methylation and gene expression of COX7A1 in human skeletal muscle, Diabetologia 51, 1159-1168.
(229) Chen, L., Xin, Z. C., Li, X., Tian, L., Yuan, Y. M., Liu, G., Jiang, X. J., and Guo, Y. L. (2006) Cox7a2 mediates steroidogenesis in TM3 mouse Leydig cells, Asian J. Androl. 8, 589-594.
(230) Ryan, H. E., Poloni, M., McNulty, W., Elson, D., Gassmann, M., Arbeit, J. M., and Johnson, R. S. (2000) Hypoxia-inducible factor-1alpha is a positive factor in solid tumor growth, Cancer Res. 60, 4010-4015.
(231) Saini, Y., Harkema, J. R., and LaPres, J. J. (2008) HIF1alpha is essential for normal intrauterine differentiation of alveolar epithelium and surfactant production in the newborn lung of mice, J. Biol. Chem. 283, 33650-33657.
(232) de Hoon, M. J., Imoto, S., Nolan, J., and Miyano, S. (2004) Open source clustering software, Bioinformatics 20, 1453-1454.
(233) Capaldi, R. A., Marusich, M. F., and Taanman, J. W. (1995) Mammalian cytochrome-c oxidase: characterization of enzyme and immunological detection of subunits in tissue extracts and whole cells, Methods Enzymol. 260, 117-132.
(234) Thompson, D. A., and Ferguson-Miller, S. (1983) Lipid and subunit III depleted cytochrome c oxidase purified by horse cytochrome c affinity chromatography in lauryl maltoside, Biochemistry 22, 3178-3187.
(235) Naciri, M., Kuystermans, D., and Al-Rubeai, M. (2008) Monitoring pH and dissolved oxygen in mammalian cell culture using optical sensors, Cytotechnology 57, 245-250.
(236) Althoff, T., Mills, D. J., Popot, J. L., and Kuhlbrandt, W. (2011) Arrangement of electron transport chain components in bovine mitochondrial supercomplex I1III2IV1, EMBO J 30, 4652-4664.
168
(237) Tsukihara, T., Aoyama, H., Yamashita, E., Tomizaki, T., Yamaguchi, H., Shinzawa-Itoh, K., Nakashima, R., Yaono, R., and Yoshikawa, S. (1996) The whole structure of the 13-subunit oxidized cytochrome c oxidase at 2.8 A, Science 272, 1136-1144.
(238) Cui, T. Z., Conte, A., Fox, J. L., Zara, V., and Winge, D. R. (2014) Modulation of the respiratory supercomplexes in yeast: enhanced formation of cytochrome oxidase increases the stability and abundance of respiratory supercomplexes, J. Biol. Chem. 289, 6133-6141.
(239) Huttemann, M., Klewer, S., Lee, I., Pecinova, A., Pecina, P., Liu, J., Lee, M., Doan, J. W., Larson, D., Slack, E., Maghsoodi, B., Erickson, R. P., and Grossman, L. I. (2012) Mice deleted for heart-type cytochrome c oxidase subunit 7a1 develop dilated cardiomyopathy, Mitochondrion 12, 294-304.
(240) Rodriguez-Enriquez, S., Juarez, O., Rodriguez-Zavala, J. S., and Moreno-Sanchez, R. (2001) Multisite control of the Crabtree effect in ascites hepatoma cells, Eur. J. Biochem. 268, 2512-2519.
(241) Rossignol, R., Gilkerson, R., Aggeler, R., Yamagata, K., Remington, S. J., and Capaldi, R. A. (2004) Energy substrate modulates mitochondrial structure and oxidative capacity in cancer cells, Cancer Res. 64, 985-993.
(242) Aguer, C., Gambarotta, D., Mailloux, R. J., Moffat, C., Dent, R., McPherson, R., and Harper, M. E. (2011) Galactose enhances oxidative metabolism and reveals mitochondrial dysfunction in human primary muscle cells, PLoS One 6, e28536.
(243) Pulliam, D. A., Deepa, S. S., Liu, Y., Hill, S., Lin, A. L., Bhattacharya, A., Shi, Y., Sloane, L., Viscomi, C., Zeviani, M., and Van Remmen, H. (2014) Complex IV-deficient Surf1(-/-) mice initiate mitochondrial stress responses, Biochem. J. 462, 359-371.
(244) Oelkrug, R., Goetze, N., Meyer, C. W., and Jastroch, M. (2014) Antioxidant properties of UCP1 are evolutionarily conserved in mammals and buffer mitochondrial reactive oxygen species, Free Radic. Biol. Med. 77, 210-216.
(245) Chandel, N. S. (2010) Mitochondrial regulation of oxygen sensing, Adv. Exp. Med. Biol. 661, 339-354.
(246) Chua, Y. L., Dufour, E., Dassa, E. P., Rustin, P., Jacobs, H. T., Taylor, C. T., and Hagen, T. (2010) Stabilization of hypoxia-inducible factor-1alpha protein in hypoxia occurs independently of mitochondrial reactive oxygen species production, J. Biol. Chem. 285, 31277-31284.
(247) Papandreou, I., Cairns, R. A., Fontana, L., Lim, A. L., and Denko, N. C. (2006) HIF-1 mediates adaptation to hypoxia by actively downregulating mitochondrial oxygen consumption, Cell Metab. 3, 187-197.
169
(248) Aras, S., Pak, O., Sommer, N., Finley, R., Jr., Huttemann, M., Weissmann, N., and Grossman, L. I. (2013) Oxygen-dependent expression of cytochrome c oxidase subunit 4-2 gene expression is mediated by transcription factors RBPJ, CXXC5 and CHCHD2, Nucleic Acids Res. 41, 2255-2266.
(249) Seelan, R. S., Gopalakrishnan, L., Scarpulla, R. C., and Grossman, L. I. (1996) Cytochrome c oxidase subunit VIIa liver isoform. Characterization and identification of promoter elements in the bovine gene, J. Biol. Chem. 271, 2112-2120.
(250) Lee, I., Huttemann, M., Liu, J., Grossman, L. I., and Malek, M. H. (2012) Deletion of heart-type cytochrome c oxidase subunit 7a1 impairs skeletal muscle angiogenesis and oxidative phosphorylation, J. Physiol. 590, 5231-5243.
(251) Chen, Q., Vazquez, E. J., Moghaddas, S., Hoppel, C. L., and Lesnefsky, E. J. (2003) Production of reactive oxygen species by mitochondria: central role of complex III, J. Biol. Chem. 278, 36027-36031.