The Role of Oxidative Stress and Some Biochemical Aspects ...
129
Republic of Iraq Ministry of Higher Education and Scientific Research Al-Nahrain University/ College of Science Department of Biotechnology The Role of Oxidative Stress and Some Biochemical Aspects in Patients with Type Π Diabetic Nephropathy A Thesis Submitted to the Council of Science College / Al-Nahrain University, In partial Fulfillment of the Requirements for the Degree of Master of science in Biotechnology By Ala'a Waleed Abbas B.Sc. Biotechnology/College of Science/Al-Nahrain University (2014) Supervised by Prof. Dr. Waleed Hameed Yousif December 2016 Rabi Al-awwal 1437
Transcript of The Role of Oxidative Stress and Some Biochemical Aspects ...
Republic of Iraq
Ministry of Higher Education and Scientific Research
Al-Nahrain University/ College of Science Department of Biotechnology
The Role of Oxidative Stress and Some
Biochemical Aspects in Patients with
Type Π Diabetic Nephropathy
A Thesis
Submitted to the Council of Science College / Al-Nahrain University, In
partial Fulfillment of the Requirements for the Degree of Master of science in
Biotechnology
By
Ala'a Waleed Abbas
B.Sc. Biotechnology/College of Science/Al-Nahrain University (2014)
Supervised by
Prof. Dr. Waleed Hameed Yousif
December 2016 Rabi Al-awwal 1437
Supervisor Certification
I, certify that this thesis entitled “The role of oxidative stress and some
biochemical aspects in patients with type Π diabetic nephropathy” was prepared
by the student “Ala'a Waleed Abbas ” under my supervision at the College of
Science / Al- Nahrain University as a partial fulfillment of the requirements for the
degree of Master of Science in Biotechnology.
Signature:
Name: Dr.Waleed Hameed Yousif Scientific Degree: Professor
Date:
In view of the available recommendations, I forward this thesis for dissertation
debate by the examining committee.
Signature:
Name: Dr.Hameed M. Jasim
Scientific Degree: Professor
Title: Head of Biotechnology Department

Committee Certification
We, the Examining Committee certify that we have read this
thesis and examined the student in its content and according to our
opinion, is accepted as a thesis for the Degree of Master of Science in
Biotechnology.
Signature:
Name: Dr. Saad S. AL-Dujaily
Scientific Degree: Professor
Date:
(Chairman)
Signature: Signature:
Name: Dr. Abbas Mahdi Rahmah Name: Dr. Rehab S. Ramadhan
Scientific Degree: Assistant professor Scientific Degree: Assistant professor
Da t e : Da t e :
(Member) (Member)
Signature:
Name: Dr. Waleed Hameed Yousif
Scientific Degree: Professor
Date:
(Member and Supervisor)
I, hereby certify upon the decision of the Examining Committee. Signature:
Name: Dr. Hadi M. A. Abood
Scientific Degree: Professor
Title: Dean, College of Science
Date:


Dedication
To my father…………..
For his
unlimited care, guidance and
Sacrifices
To my lovely mother ……….
For her
unlimited love and Kindness
To my dearest brothers and
sister ………
I dedicate this work
In gratitude for your
Support
Patience
Understanding
Ala'a

Acknowledgments
At the beginning, thanks to great Allah, Lord of the whole creation
who gave me the faith and strength to accomplish this work.
My special thanks with respect and appreciation to my supervisors
Prof. Dr. Waleed H. Yousif and Dr. Khaleed J. Khaleel for their
continuous efforts, guidance and useful advises during this work.
Grateful thanks are conveyed to the staff of Biotechnology Department
⁄ College of Science ⁄ Al-Nahrain University,for their assistance and
encouragement throughout the study, and to all those whom I forgot to
mention for their support.
Deep thanks are devoted to the Al-Fajer laboratory staff at Abd Al-
majid Hussein private hospital , especially Mohammed A. Alhilaly , Ali
Taher , Hussein, Ahmed, Huda, Amena and special thanks for Dr.
Bassam and Mr. Husam for all kinds of help.
I am sincerely grateful to my father, my mother, my brothers, my sister
and all my family members for their help and support throughout my
study.
I feel that I am deeply thankful to my friends and colleagues Reem
Youssor , Dena, lena and Aya .
My thank goes to all the patients and people who participated in this
study and made this project possible.
Ala'a

Summary
This work was designed to study the role of oxidative stress and some
biochemical aspects in nephropathy in type 2 diabetic patients.
Thirty – one type 2 diabetic nephropathy and thirty type 2 diabetes
mellitus patients attending to the abd- Almajid private hospital between
December 2015 to July 2016 were recruited for this study. For the
purpose of comparison, twenty - eight healthy controls subjects matched
for age were also included.
Random blood sugar, serum urea, serum creatinine, glycosylated
hemoglobin, serum complements 3 and 4, serum malondialdehyde, serum
glutathione and serum catalase activity were measured in blood.
Microalbumin, creatinine and albumin / creatinine ratio were measured
in urine.
The results of the present study showed an in increase in random blood
sugar in diabetic and diabetic nephropathy patients at the ages of 45-80
years. No change was observed in serum urea concentration in diabetic
patients, whereas an increase was found in diabetic nephropathy patients
at the ages of 45-80 years. The findings also showed no change in serum
creatinine concentrations in diabetic patients at the ages of 45-80 years
and in diabetic nephropathy patients at the age of 45-56 years. Serum
creatinine concentrations increased significantly in diabetic nephropathy
patients at the ages of 57-80 years. The percentages of glycosylated
hemoglobin increased in diabetic and diabetic nephropathy patients at the
ages of 45-80 years. No changes were recorded in serum complements 3
and 4 concentrations in diabetic and diabetic nephropathy patients of all
age groups. No changes were observed in serum malondialdehyde
concentrations in diabetic and diabetic nephropathy patients at the age of
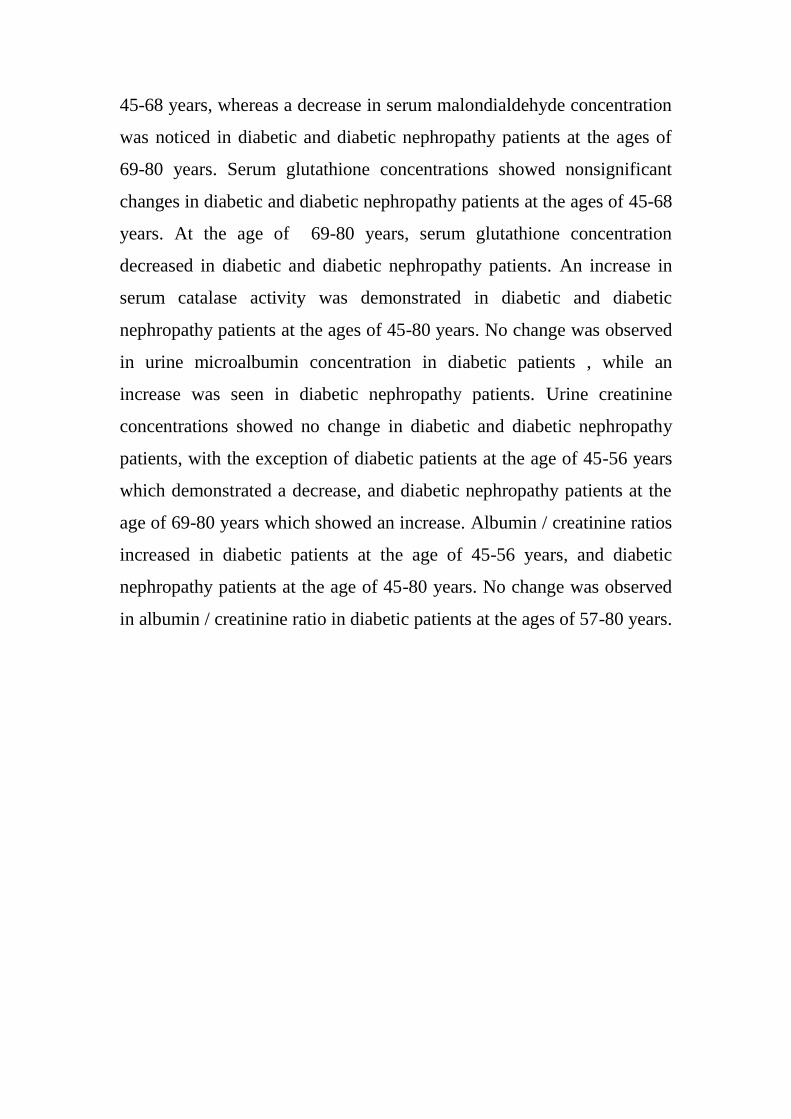
45-68 years, whereas a decrease in serum malondialdehyde concentration
was noticed in diabetic and diabetic nephropathy patients at the ages of
69-80 years. Serum glutathione concentrations showed nonsignificant
changes in diabetic and diabetic nephropathy patients at the ages of 45-68
years. At the age of 69-80 years, serum glutathione concentration
decreased in diabetic and diabetic nephropathy patients. An increase in
serum catalase activity was demonstrated in diabetic and diabetic
nephropathy patients at the ages of 45-80 years. No change was observed
in urine microalbumin concentration in diabetic patients , while an
increase was seen in diabetic nephropathy patients. Urine creatinine
concentrations showed no change in diabetic and diabetic nephropathy
patients, with the exception of diabetic patients at the age of 45-56 years
which demonstrated a decrease, and diabetic nephropathy patients at the
age of 69-80 years which showed an increase. Albumin / creatinine ratios
increased in diabetic patients at the age of 45-56 years, and diabetic
nephropathy patients at the age of 45-80 years. No change was observed
in albumin / creatinine ratio in diabetic patients at the ages of 57-80 years.
XI
List of contents No. Title Page No.
Chapter One
Introduction and Literature review
1.
Introduction and Literature review 1
1.1.
Introduction
1
1. 2. Literature review 3
1.2.1. Definition of diabetes
3
1. 2.2. Diabetic nephropathy
3
1.2.2.1 Definitions
3
1.2.2.2 Pathogenesis of diabetic nephropathy 5
1.2.2.3 Risk Factors of the diabetic nephropathy:
5
1.2.2.3.1 Hyperglycemia
5
1.2.2.3.2 Proteinuria
7
1.2.2.3.3 Blood pressure
7
1.2.3 Reactive Oxygen Species in Diabetes
Mellitus
7
1.2.4 Oxidative Stress and Insulin Resistance 8
1.2.5 Antioxidant Deficiency 9
1.2.6 Oxidative Stress and Other Diabetic
Complications
10
1.2.7
Complement Fixation and Immune Complex
Deposition in Diabetic Nephropathy
12
1.2.8 Malondialdehyde(MDA) 13
List of contents
XII
1.2.9 Catalase (CAT) 14
1.2.10 Glutathione(GSH) 15
1.2.11 Creatinine 16
1.2.12 Microalbuminuria 17
Chapter two
Materials and methods
2. Materials and methods 18
2.1 Materials 18
2.1.1 Equipment 18
2.1.2 Kits 19
2.2 Subjects 19
2.2.1 Type2Diabetic nephropathy patients 20
2.2.2 Type2 Diabetic mellitus patients 20
2.2.3 Control subjects 20
2.3 Collection of samples 20
2.3.1 Collection of blood samples 20
2.3.2 Collection of urine samples 20
2.4 Methods 21
2.4.1 Blood glucose determination using glucose
kit
21
2.4.1.1 Principle of the method 21
2.4.2 Blood urea determination using blood urea
kit
21
2.4.2.1 Principle of the method 21
2.4.3 Creatinine determination using creatinine kit. 22
2.4.3.1 Test principle 22
2.4.4.1 Principle of the method 22
List of contents
XIII
2.4.5 Malondialdehyde determination using ELISA
kit (MDA).
22
2.4.5.1 Test principle 22
2.4.5.2 Assay procedure 23
2.4.6 Glutathione determination using ELISA kit
(GSH)
25
2.4.6.1 Test principle 25
2.4.6.2 Assay procedure 25
2.4.7 Catalase determination using ELISA kit
(CAT)
27
2.4.7.1 Test principle 27
2.4.7.2 Assay procedure 27
2.4.8 Creatinine, microalbumin and protein
detection by urine test strip
29
2.4.8.1 Test Principles 29
2.4.8.1.1 Creatinine 29
2.4.8.1.2 Microalbomin 29
2.4.8.1.3 Protein 29
2.4.8.2 Assay procedure 29
2.4.9 Determination of the C3, C4 protein, by
radial immunodiffusion plate
30
2.4.9.1 Test principle 30
2.4.9.2 Assay procedure 30
2.4.10 Statistical analysis 31
Chapter Three
Results and discussion
3. Results and discussion 31
3.1 Results 31
3.1.1 Serum and urine biochemical parameters in
healthy control subjects, diabetic and diabetic
nephropathy patients at the age 45-56 years
31
List of contents
XIV
3.1.2
Serum and urine Biochemical parameters in
healthy control subjects, diabetic and diabetic
nephropathy patients at the of age 57-68
years
41
3.1.3
Serum and urine Biochemical parameters in
healthy control subjects, diabetic and diabetic
nephropathy patients at the age 69-80 years
53
3.2 Discussion 65
3.2.1 Random blood sugar 65
3.2.2 Serum urea 65
3.2.3 Serum creatinine 66
3.2.4 Glycosylated hemoglobin 66
3.2.5 Serum complements 3 and 4 67
3.2.6 Serum malondialdehyde 67
3.2.7 Serum glutathione 68
3.2.8 Serum catalase activity 68
3.2.9 Urine microalbumin 69
3.2.10 Urine creatinine 69
3.2.11 Albumin / creatinine ratio 70
Chapter four
Conclusions and Recommendations
4. Conclusions and Recommendations 71
4.1 Conclusions 71
4.2 Recommendations 72
References 73
XV
List of Tables
Table Title Page No.
2.1 The used equipments and
their sources
18
2.2 The used chemicals and
their sources
19
XVI
List of Figures
Figure Title Page
No.
2.1 Standard curve of MDA. 24
2.2 Standard curve of GSH.
26
2.1 Standard curve of Catalase. 29
3.1 Random blood sugar concentration in healthy control
subjects, diabetic and diabetic nephropathy patients
(age 45-56 years).
31
3.2 Serum urea concentrations in healthy control subjects,
diabetic and diabetic nephropathy patients (age 45-56
years).
32
3.3 Serum creatinine concentrations in healthy control
subjects, diabetic and diabetic nephropathy patients
(age 45-56 years).
33
3.4 The percentages of glycosylated hemoglobin HbA1c in
healthy control subjects, diabetic and diabetic
nephropathy patients (age 45-56 years).
34
3.5 Serum complement3 concentrations in healthy control
subjects, diabetic and diabetic nephropathy patients
(age 45-56 years).
35
3.6 Serum complement 4 in healthy control subjects,
diabetic and diabetic nephropathy patients (age 45-56
years).
35
XVII
3.7 Malondialdehyde in healthy control subjects, diabetic
and diabetic nephropathy pationts( age 45-56 years).
36
3.8 Serum glutathinoe (GSH) concentrations in healthy
control subjects, diabetic and diabetic nephropathy (age
45-56 years).
37
3.9 Serum catalase activity in healthy control subjects,
diabetic and diabetic nephropathy patients (age 45-56
years).
38
3.10 Urine microalbumin concentrations in healthy control
subjects, diabetic and diabetic nephropathy patients
(age 45-56 years).
39
3.11 Urine creatinine concentrations in healthy control
subjects, diabetic and diabetic nephropathy patients
(age 45-56 years). P< 0.05.
40
3.12 Albumin/creatinine ratio in healthy control subjects,
diabetic and diabetic nephropathy patients(age 45-56
years).
41
3.13 Random blood sugar concentrations in healthy control
subjects, diabetic and diabetic nephropathy patients
(age 57-68 years).
42
3.14 serum urea concentrations in healthy control subjects,
diabetic and diabetic nephropathy patients (age 57-68
years).
43
3.15 Serum creatinine concentrations in healthy control
subjects, diabetic and diabetic nephropathy patients
(age 57-68 years).
44

XVIII
3.16 The percentage of glycosylated hemoglobin HbA1c in
healthy control subjects, diabetic and diabetic
nephropathy pationts (age 57-68 years). different
letters mean significant differences at P< 0.05.
45
3.17 . Serum complement3 concentrations in healthy control
subjects, diabetic and diabetic nephropathy patients
(age 57-68 years).
46
3.18 Serum complement 4 concentration in healthy control
subjects, diabetic and diabetic nephropathy patients
(age 57-68 years).
47
3.19 Serrum malondialdehyde(MDA) concentration in
healthy control subjects, diabetic and diabetic
nephropathy patients(age 57-68 years).
48
3.20 Serum glutathione(GSH) concentrations in healthy
control subjects, diabetic and diabetic nephropathy
patients (age 57-68 years).
49
3.21 Serum catalase activity in healthy control subjects,
diabetic and diabetic nephropathy patients
(age 57- 68years).
50
3.22 Urine microalbumine(MALB) concentrations in healthy
control subjects, diabetic and diabetic nephropathy
patients (age 57-68 years).
51
3.23 Urine creatinine concentrations in healthy control
subjects, diabetic and diabetic nephropathy patients
(age 57-68 years).
52
XIX
3.24 Albumin/Creatinine ratio in healthy control subjects,
diabetic and diabetic nephropathy patients
(age 57-68 years).
53
3.25 Random blood sugar (RBS) concentrations in healthy
control subjects, diabetic and diabetic nephropathy
patients (age 69-80 years).
54
3.26 Serum urea concentrations in healthy control subjects,
diabetic and diabetic nephropathy patients
(age 69-80 years).
55
3.27 Serum creatinine concentrations in healthy control
subjects, diabetic and diabetic nephropathy patients
(age 68-80 years).
56
3.28 The percentage of glycosylated hemoglobin(HbA1C)in
healthy control subjects, diabetic and diabetic
nephropathy patients (age 69-80 yrars).
57
3.29 Serum complement3 concentrations in healthy control
subjects, diabetic and diabetic nephropathy patients
(age 69-80 years).
58
3.30 Serum complement 4 concentrations in healthy control
subjects, diabetic and diabetic nephropathy patients
(age 69-80 years).
58
3.31 Serum malondialdehyde(MDA) concentrations in
healthy control, diabetic and diabetic nephropathy
patients (age 69-80 years).
59
XX
3.32 Serum glutathione(GSH) concentrations in healthy
control subjects, diabetic and diabetic nephropathy
patients (age 69-80 years).
60
3.33 Serum catalase activity in healthy control subjects,
diabetic and diabetic nephropathy patients
(age 69-80 years).
61
3.34 Urine microalbomin(MALB) concentration in healthy
control, diabetic and diabetic nephropathy patients
(age 69-80 years).
62
3.35 Urine creatinine concentrations in healthy control
subjects, diabetic and diabetic nephropathy patient
(age 69-80 years).
63
3.36 Albumin/Creatinine ratio in healthy control, diabetic
and diabetic nephropathy patients
(age 69-80 years).
64
IX
Abbreviation Meaning
ACE Angiotensin converting enzyme
AER Albumin excretion rate
AGEs Advanced glycation end-products
ATP Adenosine Triphosphate
ADP Adenosine diphosphate
AKI Kidney injury
CAT Catalase
C3, C4 Complements 3 and 4
DN Diabetes nephropathy
DM Diabetes mellitus
DNA Deoxyribonucleic acid
ESRD End-stage renal disease
EDTA Ethylenediaminetetraacetic acid
ELISA Enzyme linked immunosorbent assay
EGFR estimated glomerular filtration rate
FADH Flavin adenine dinucleotide
GFAT Glutamine fructose6-phosphate amino
transferase
GSH Reduced Glutathione
GSSG Oxidized glutathione
GLDH glutamate dehydrogenase
HbA1c Glycosylated hemoglobin
H2O2 Hydrogen peroxide
HO• Hydroxyl radical
IDF International Diabetes Federation
Ig Immunoglobulin
MALB microalbuminuria
MDA Malondialdehyde
mRNA Messenger ribonucleic acid
MAPK Mitogen-Activated-Protein Kinase
NO Nitric oxide
NO− Nitroxyl
NADPH Nicotinamide adenine dinucleotide
NAC N-acetylcysteine
NF-κB Nuclear factor
X
O.D Optical Density
Ox-LDL Oxidized low-density lipoproteins
OONO− Peroxynitrite
O2− Superoxide anion
PKC Protein kinase C
ROS Reactive oxygen species
RNS Reactive nitrogen species
RSNO Nitrosothiol
RAGE Receptor for AGE binding
TTAB tetradecyltrimethylammonium bromide
TGF-β Transforming growth factor
UDP Uridine-diphosphate
UV Ultraviolet
VEGF Vascular endothelial growth factor
WHO World Health Organization

Chapter One
Introduction
and
Literatures Review

Chapter one Introductions
Page 1
1. Introduction and literature review.
1.1. Introduction.
The term diabetes mellitus (DM) describes a metabolic disorder of multiple
etiologies characterized by disturbances of carbohydrate ,fat and protein
metabolism resulting from defects in insulin secretion , insulin action or both
(WHO, 1999). It is a major worldwide health problem predisposing to markedly
increased cardiovascular mortality and serious morbidity and mortality related
to the development of nephropathy , neuropathy and retinopathy (WHO,
2005).Three principal types of DM are recognized ; Type 1 DM(T1DM), Type
2DM (T2DM) and gestational diabetes. Type 1 diabetes mellitus is
characterized by loss of the insulin- producing beta cells of the islets of
Langerhans in the pancreas leading to a deficiency of insulin, while T2DM is
characterized differently and is due to insulin resistance or reduced insulin
sensitivity , combined with relatively reduced insulin secretion (American
Diabetes Association, 2012). Due to increasing obesity, sedentary life style and
dietary habits in both Western and developing countries, the prevalence of
T2DM is growing at an exponential rate. The increase in T2 DM is also seen in
younger people and in developing countries , and estimates in the Middle East
and Africa revealed that the prevalence is high and set to increase dramatically
during the next 18 years (WHO,2008; Li et al., 2009).The etiology of T2DM is
not well-understood , although associated health risk factors are recognized ; for
instance, a family history of diabetes age over 45 years , race or ethnic
background, metabolic syndrome (also called insulin resistance syndrome),
obesity, hypertension, and history of vascular disease such as stroke, abnormal
cholesterol levels and history of gestational diabetes (American Diabetes
Association , 2012) .Diabetic nephropathy is a major long-term complication of
diabetes mellitus (Lu et al., 2013 ; Ribeiro et al., 2013). It develops in more
than of 40% of patients in spite of glucose control(Gross et al., 2005). Oxidative
Chapter one Introductions
Page 2
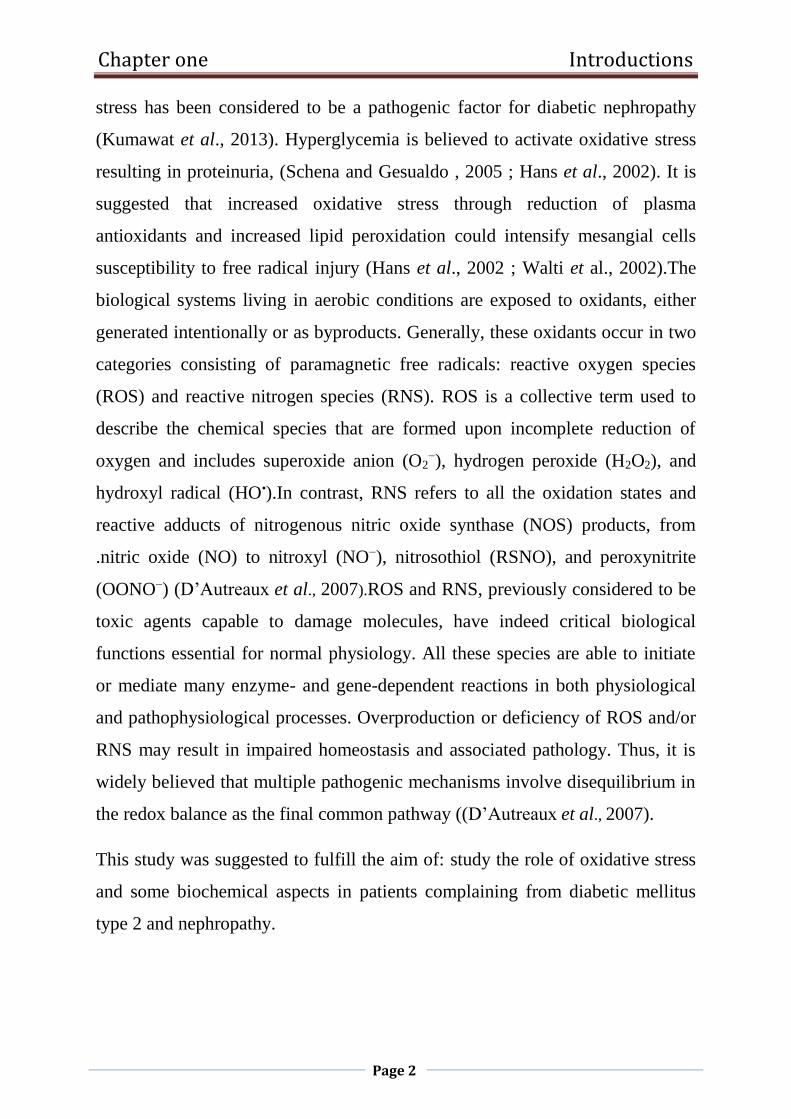
stress has been considered to be a pathogenic factor for diabetic nephropathy
(Kumawat et al., 2013). Hyperglycemia is believed to activate oxidative stress
resulting in proteinuria, (Schena and Gesualdo , 2005 ; Hans et al., 2002). It is
suggested that increased oxidative stress through reduction of plasma
antioxidants and increased lipid peroxidation could intensify mesangial cells
susceptibility to free radical injury (Hans et al., 2002 ; Walti et al., 2002).The
biological systems living in aerobic conditions are exposed to oxidants, either
generated intentionally or as byproducts. Generally, these oxidants occur in two
categories consisting of paramagnetic free radicals: reactive oxygen species
(ROS) and reactive nitrogen species (RNS). ROS is a collective term used to
describe the chemical species that are formed upon incomplete reduction of
oxygen and includes superoxide anion (O2−), hydrogen peroxide (H2O2), and
hydroxyl radical (HO•).In contrast, RNS refers to all the oxidation states and
reactive adducts of nitrogenous nitric oxide synthase (NOS) products, from
.nitric oxide (NO) to nitroxyl (NO−), nitrosothiol (RSNO), and peroxynitrite
(OONO−) (D’Autreaux et al., 2007).ROS and RNS, previously considered to be
toxic agents capable to damage molecules, have indeed critical biological
functions essential for normal physiology. All these species are able to initiate
or mediate many enzyme- and gene-dependent reactions in both physiological
and pathophysiological processes. Overproduction or deficiency of ROS and/or
RNS may result in impaired homeostasis and associated pathology. Thus, it is
widely believed that multiple pathogenic mechanisms involve disequilibrium in
the redox balance as the final common pathway ((D’Autreaux et al., 2007).
This study was suggested to fulfill the aim of: study the role of oxidative stress
and some biochemical aspects in patients complaining from diabetic mellitus
type 2 and nephropathy.
Chapter one Literature Review
Page 3
1.2 Literature review.
1.2.1 Definition of diabetes.
Diabetes is a systemic disease characterized by chronic hyperglycemia and
disturbances in carbohydrate, lipid, and protein metabolism. It may present with
characteristic symptoms such as thirst, polyuria, and weight loss, but its most
severe manifestations are ketoacidosis or nonketotic hyperosmolaric coma. The
symptoms are often vague or may even be absent altogether (Bennett et al.,
2005). All over the world, the prevalence rates of diabetes are increasing, and in
the latest IDF ATLAS, northern Europe had a 7% prevalence of diabetes in the
adult population, while corresponding rates were already 8% in the US and 9%
in China (Sicree et al., 2003).
1.2.2 Diabetic nephropathy.
1.2.2.1 Definitions.
Diabetic nephropathy is defined as a progressive increase in the urinary
albumin excretion rate accompanied by increasing blood pressure and a
relentless decline in the glomerular filtration rate with end-stage renal failure as
the final endpoint (Marshall et al., 2003). Diabetic nephropathy is typically
accompanied by retinopathy. Many people with diabetes do not necessarily
progress to end-stage renal disease (ESRD), as they may die before then from
cardiovascular disease (Borch-Johnsen et al., 1987). The different stages of
diabetic nephropathy are classified according to the increase in the urinary
albumin excretion rate in timed urine collections either overnight or during a
24-h period. Microalbuminuria is defined as an increase in the AER above
normal (i.e. ≥ 20 μg/min or ≥ 30 mg/24 h). Proteinuria represents an increase in
albuminuria of ≥ 200 μg/min or ≥ 300mg/24 h. When daily proteinuria exceeds
3 g, the patient is deemed to have nephrotic syndrome. The final stage of
diabetic nephropathy is ESRD. To be classified as microalbuminuric or

Chapter one Literature Review
Page 4
proteinuric, the patient’s AER must exceed the upper limit in at least two of
three urine collections. Diabetic nephropathy is the leading cause of end-stage
renal disease (ESRD) in Western countries.It is characterized by accumulation
of mesangial cells, collagen IV, fibronectin and laminin. Accumulation of these
substances activates the oxidative stress cascade and results in overproduction
of ROS. As in the eye, mesangial cells are essential to preserve normal function
also in the kidney(Tracy et al., 1997) By contrast, in diabetic patients
accumulation of AGEs can induce TGF-β synthesis, thereby leading to
extracellular fibrosis. Studies have demonstrated a role for the Src pathway in
this process. Src is a non-receptor tyrosine kinase activated by receptor tyrosine
kinases such as EGFR. Different stimuli, such as ROS or high glucose levels,
can induce Src-dependent EGFR transactivation, thus resulting in increased
synthesis of MAPK and collagen IV (Koenig et al., 1999). Glycation of some
proteins,such as laminin and collagen IV, can also alter vascular permeability to
albumin, thus contributing to renal damage. In addition, high glucose may
decrease the expression of mitochondrial anti-oxidants, such as manganese
superoxide dismutase, with consequent impairment of the electron chain and
overproduction of ROS. Oxidative stress, in turn, is a stimulus for the synthesis
of mitochondrial DNA. Because mitochondria are the main intracellular source
of ROS, an increase in their number amplifies cell exposure to ROS and
increases kidney damage (Visser et al., 1999).
Chapter one Literature Review
Page 5
1.2.2.2 Pathogenesis of diabetic nephropathy.
The specific pathology of diabetic nephropathy is restricted mainly to the
renal glomeruli and the tubular interstitium (Gnudi et al., 2003). Histologically,
the hallmarks of diabetic nephropathy include thickening of the glomerular
basement membrane and an increase in the fractional volume of the mesangium
(Mauer et al., 1981). Expansion of the glomerular mesangium correlates closely
with a reduced renal function and the development of proteinuria (Mauer et al.,
1984). During the progression of the disease, mesangial expansion typically
presents as nodular glomerular lesions. For diabetic nephropathy, these
pathognomonic lesions bear the name Kimmelstiel-Wilson nodules according to
their first description by Kimmelstiel and Wilson (Kimmelstiel and Wilson
1936).The tubulointerstitial injury appears to be closely associated to the
glomerular pathology. Interstitial expansion is related to renal dysfunction,
proteinuria, and mesangial expansion (Remuzzi et al.,1998).
1.2.2.3 Risk factors of the diabetic nephropathy.
1.2.2.3.1 Hyperglycemia.
Poor glycemic control has been shown to contribute to the development of
micro- and macroalbuminuria. Intensive glucose control, HbA1c 7% vs 9%,
reduces the risk for progression from normo- to microalbuminuria in patients
with type 1 diabetes (Diabetes Control and Complications Trial Research Group
1993).Hyperglycemia has also been linked to many deleterious processes in
renal tissue. High glucose in the mesangial cells induces cell hypertrophy and
increases the extracellular matrix deposits by stimulating the expression of
various genes and protein secretion, such as collagen and fibronectin (Ayo et
al.,1990 ; Ayo et al.,1991). Furthermore, hyperglycemia has been shown to
stimulate the transforming growth factor (TGF)-β system, and the induction of
this system is considered to be one of the main determinants of hypertrophy of
the mesangial and tubular cells in diabetic nephropathy (Wolf and Ziyadeh
Chapter one Literature Review
Page 6
1999).Sustained hyperglycemia leads to enhanced non-enzymatic protein
glycation, which represents the increased covalent binding of glucose to
proteins. The process of glycation progresses via relatively stable ketoamines,
products of Amadori, to stable advanced glycation end-products (AGEs).AGEs
accumulate in the tissues over the lifetime of the protein (Raj et al., 2000). In
patients with diabetes, AGEs accumulate in renal glomeruli and tubuli (Makino
et al., 1995).AGEs have been shown to affect properties of extracellular matrix
proteins leading to matrix rigidity and mesangial expansion (Lee et al.,
1997).The enzyme aldose reductase via the polyol pathway, reduces glucose to
sorbitol. In chronic hyperglycemia sorbitol accumulates in many tissues,
including the renal glomeruli and tubuli. Some have suggested that this
accumulation of sorbitol is deleterious to the renal tissue by disturbing cellular
osmoregulation and by changing the cellular redox potential (Greene , 1988 ;
Greene et al., 1987). In addition, inhibition of the enzyme aldose reductase has
been shown to prevent a glucose-induced increase in TGF-β1 production and
protein kinase C (PKC) activity in human mesangial cells (Ishii et al., 1998).
The hexoasamine pathway, another of the intracellular pathways of glucose
metabolism, also appears to be related to diabetic complications (Schleicher and
Weigert 2000). Activation of this pathway during hyperglycemia has been
linked to diabetic nephropathy through its end-product, N-acetylglucosamine,
which in turn is associated with increased TGF-β1 expression (Kolm-Litty et
al., 1998).Hyperglycemia is also associated with oxidative stress through the
increased production of reactive oxygen species (Giugliano et al., 1996 ;
Nishikawa et al., 2000). Oxidative stress and its concomitant, reactive oxygen
species, are not only recognized as one of the most important components in the
pathogenesis of diabetic microvascular complications, but also as a possible
unifying mechanism in the pathogenesis of both microvascular and
macrovascular complications (Baynes and Thorpe 1999 ; Brownlee , 2005).
High glucose in diabetic cells induces the production of superoxide,which is

Chapter one Literature Review
Page 7
deleterious to the cells by activation of the polyol and hexosamine pathways,
the formation of AGEs, and the activation of PKC (Brownlee , 2005).
1.2.2.3.2 Proteinuria.
Proteinuria is a key factor in diabetic nephropathy and a predictor of
progression to ESRD, and has even been suggested as an important factor in
promoting the progression of diabetic nephropathy (Remuzzi et al., 1997 ;
Thomas et al., 2001). Excessive protein overload leads to tubulointerstitial
damage by inducing the release of chemokines and endothelin (Wang et al.,
1997 ; Zoja et al., 1995). The beneficial effect of ACE-inhibition in diabetic
nephropathy has at least partly been associatedwith its effect on proteinuria
(Kasiske et al., 1993).
1.2.2.3.3 Blood pressure.
Blood pressure rises in parallel with the increase in the urinary albumin
excretion rate, and if blood pressure goes untreated, over 80% of the patients
with proteinuria will have blood pressure exceeding 140/90 mmHg. It thus
comes as no surprise that hypertension is an essential component of the clinical
picture in patients with ESRD (Marshall , 2003).
1.2.3 Reactive oxygen species in diabetes mellitus.
There is a bulk of evidence demonstrating that mitochondrial ROS
(predominantly superoxide anion) overproduction is involved in diabetes and
diabetic complications, even though it is difficult to identify the exact site of
ROS formation in the mitochondria. Earlier work suggested that glucose can
directly stimulates ROS overproduction (Du et al., 1999), but it was later shown
that high glucose activates various enzymatic cascades in mitochondria,
including activation of NADPH oxidase, uncoupling of NO synthases and
stimulation of xanthine oxidase [Du et al., 1999 ; Du et al., 2000). Glycated
proteins can also be the promoters of ROS formation (Mullarkey et al., 1990),
Chapter one Literature Review
Page 8
thus suggesting that different sources may be responsible for ROS
overproduction and oxidative stress in diabetes. The exact role of mitochondria
is not completely clear. For some time, mitochondria have been considered the
major source of ROS in diabetes and diabetic complications, but Martens et al.
have demonstrated that HG might actually suppress mitochondrial superoxide
formation in metabolically responsive pancreatic β-cells (Martens et al., 2005).
Similarly, Herlein et al. have shown that there is no excess of superoxide
production by complexes I and III from mitochondria of streptozotocin diabetic
rats (Herlein et al., 2009). In addition, Hou et al. have reported significant ROS
generation under low glucose conditions in mouse β-cells, which is prevented
by the ROS scavengers N-acetylcysteine (NAC) and manganese(III)tetrakis(4-
benzoic acid) porphyrin (Hou et al., 2008). Other studies assert an increase of
the number of mitochondria. Although their role seems to be controversial,
mitochondria are the main source of ROS and further studies are required to
deeply analyze their action.
1.2.4 oxidative stress and insulin resistance.
A large number of studies have provided evidence for the pivotal role of
oxidative stress in insulin resistant states such as obesity, the metabolic
syndrome and type 2 diabetes (Schaffer et al., 2012 ; . Stadle , 2012) Thus, ROS
overproduction is an important trigger for insulin resistance and a relevant
factor in the development of type 2 diabetes (Houstis et al., 2006). Again,
mitochondria and NADPH oxidase are considered the major sources of ROS
overproduction, given that mitochondrial superoxide production is a common
feature in models of insulin resistance in adipocytes, myotubes and mice.
Several animal studies have been performed to investigate the role of increased
oxidative stress in insulin resistant states. In obese mice, increased H2O2
generation by adipose tissue can be observed prior to the onset of diabetes
(Furukawa et al., 2004). This event is accompanied by decreased mRNA levels
Chapter one Literature Review
Page 9
of SOD, catalase and glutathione peroxidase and all these changes are
exaggerated by the development of diabetes. Obesity and related insulin
resistance are frequently associated with increased accumulation of lipids
(triglycerides) in the liver. Increased lipid peroxidation markers have thus been
observed in the liver of animal models of diabetes and obesity (Svegliati-Baroni
et al., 2006). Evidence of systemic oxidative stress includes detection of
increased circulating and urinary levels of the lipid peroxidation product F2-
isoprostane (8-epi-prostaglandin F2α) in both types 1 and 2 diabetes (Davi et
al., 2003 ; Monnier et al., 2006), as well as in obesity. Remarkably, this marker
correlates with blood glucose levels and glucose variability, and ameliorates
following therapeutic interventions (Davi et al., 1999).
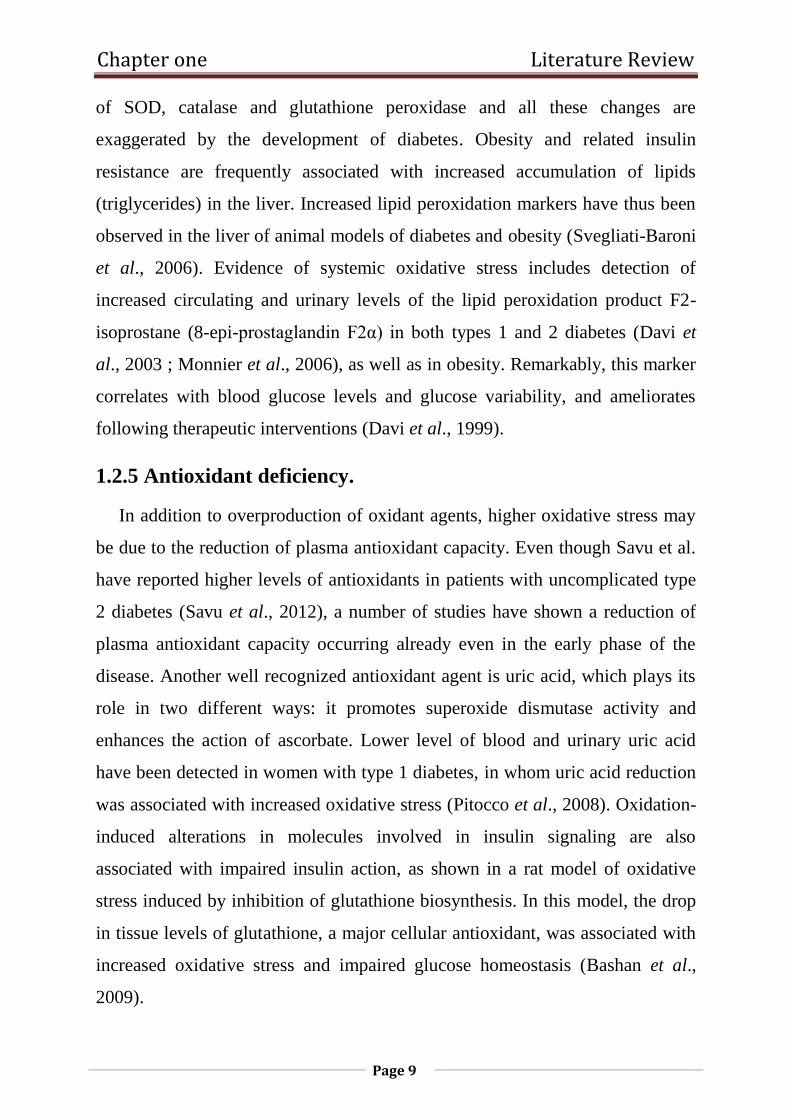
1.2.5 Antioxidant deficiency.
In addition to overproduction of oxidant agents, higher oxidative stress may
be due to the reduction of plasma antioxidant capacity. Even though Savu et al.
have reported higher levels of antioxidants in patients with uncomplicated type
2 diabetes (Savu et al., 2012), a number of studies have shown a reduction of
plasma antioxidant capacity occurring already even in the early phase of the
disease. Another well recognized antioxidant agent is uric acid, which plays its
role in two different ways: it promotes superoxide dismutase activity and
enhances the action of ascorbate. Lower level of blood and urinary uric acid
have been detected in women with type 1 diabetes, in whom uric acid reduction
was associated with increased oxidative stress (Pitocco et al., 2008). Oxidation-
induced alterations in molecules involved in insulin signaling are also
associated with impaired insulin action, as shown in a rat model of oxidative
stress induced by inhibition of glutathione biosynthesis. In this model, the drop
in tissue levels of glutathione, a major cellular antioxidant, was associated with
increased oxidative stress and impaired glucose homeostasis (Bashan et al.,
2009).
Chapter one Literature Review
Page 10
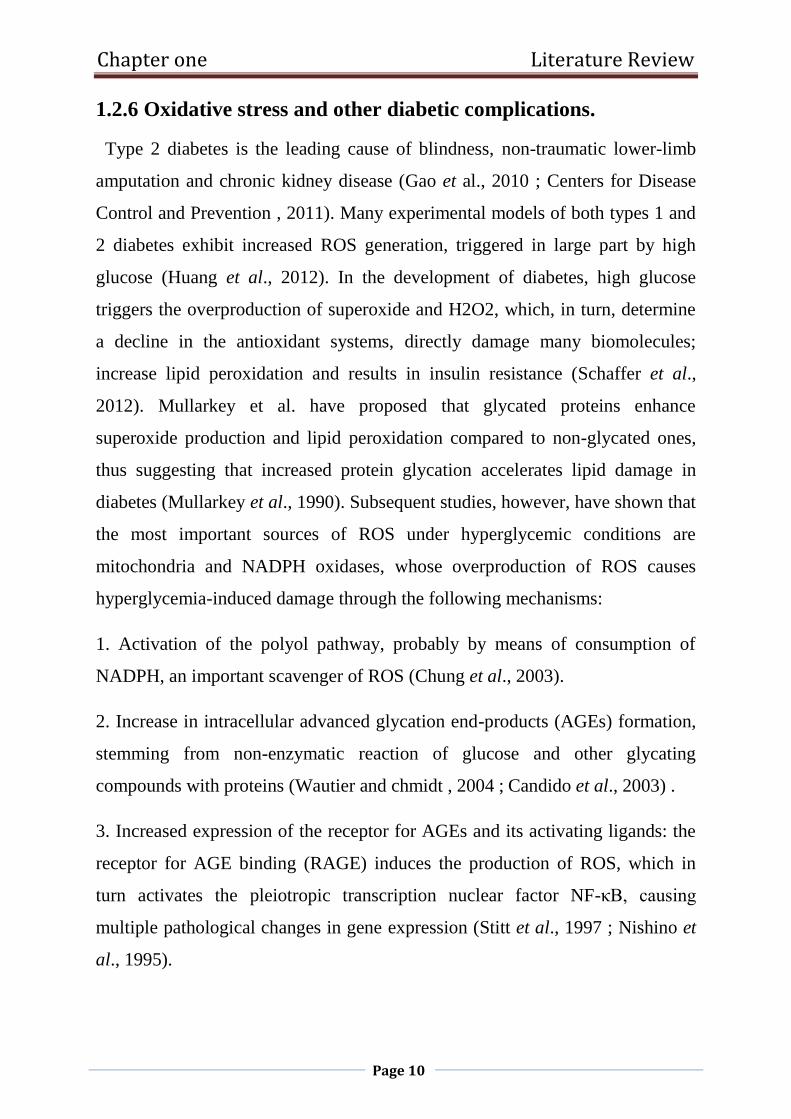
1.2.6 Oxidative stress and other diabetic complications.
Type 2 diabetes is the leading cause of blindness, non-traumatic lower-limb
amputation and chronic kidney disease (Gao et al., 2010 ; Centers for Disease
Control and Prevention , 2011). Many experimental models of both types 1 and
2 diabetes exhibit increased ROS generation, triggered in large part by high
glucose (Huang et al., 2012). In the development of diabetes, high glucose
triggers the overproduction of superoxide and H2O2, which, in turn, determine
a decline in the antioxidant systems, directly damage many biomolecules;
increase lipid peroxidation and results in insulin resistance (Schaffer et al.,
2012). Mullarkey et al. have proposed that glycated proteins enhance
superoxide production and lipid peroxidation compared to non-glycated ones,
thus suggesting that increased protein glycation accelerates lipid damage in
diabetes (Mullarkey et al., 1990). Subsequent studies, however, have shown that
the most important sources of ROS under hyperglycemic conditions are
mitochondria and NADPH oxidases, whose overproduction of ROS causes
hyperglycemia-induced damage through the following mechanisms:
1. Activation of the polyol pathway, probably by means of consumption of
NADPH, an important scavenger of ROS (Chung et al., 2003).
2. Increase in intracellular advanced glycation end-products (AGEs) formation,
stemming from non-enzymatic reaction of glucose and other glycating
compounds with proteins (Wautier and chmidt , 2004 ; Candido et al., 2003) .
3. Increased expression of the receptor for AGEs and its activating ligands: the
receptor for AGE binding (RAGE) induces the production of ROS, which in
turn activates the pleiotropic transcription nuclear factor NF-κB, causing
multiple pathological changes in gene expression (Stitt et al., 1997 ; Nishino et
al., 1995).
Chapter one Literature Review
Page 11
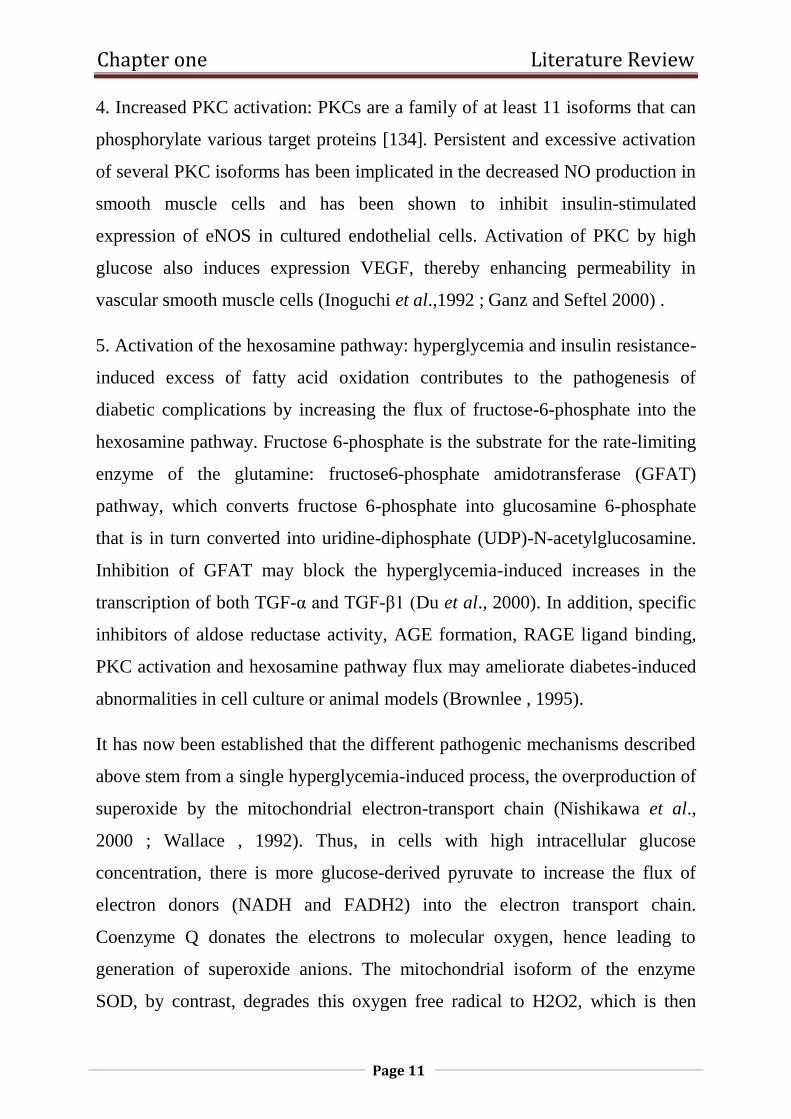
4. Increased PKC activation: PKCs are a family of at least 11 isoforms that can
phosphorylate various target proteins [134]. Persistent and excessive activation
of several PKC isoforms has been implicated in the decreased NO production in
smooth muscle cells and has been shown to inhibit insulin-stimulated
expression of eNOS in cultured endothelial cells. Activation of PKC by high
glucose also induces expression VEGF, thereby enhancing permeability in
vascular smooth muscle cells (Inoguchi et al.,1992 ; Ganz and Seftel 2000) .
5. Activation of the hexosamine pathway: hyperglycemia and insulin resistance-
induced excess of fatty acid oxidation contributes to the pathogenesis of
diabetic complications by increasing the flux of fructose-6-phosphate into the
hexosamine pathway. Fructose 6-phosphate is the substrate for the rate-limiting
enzyme of the glutamine: fructose6-phosphate amidotransferase (GFAT)
pathway, which converts fructose 6-phosphate into glucosamine 6-phosphate
that is in turn converted into uridine-diphosphate (UDP)-N-acetylglucosamine.
Inhibition of GFAT may block the hyperglycemia-induced increases in the
transcription of both TGF-α and TGF-β1 (Du et al., 2000). In addition, specific
inhibitors of aldose reductase activity, AGE formation, RAGE ligand binding,
PKC activation and hexosamine pathway flux may ameliorate diabetes-induced
abnormalities in cell culture or animal models (Brownlee , 1995).
It has now been established that the different pathogenic mechanisms described
above stem from a single hyperglycemia-induced process, the overproduction of
superoxide by the mitochondrial electron-transport chain (Nishikawa et al.,
2000 ; Wallace , 1992). Thus, in cells with high intracellular glucose
concentration, there is more glucose-derived pyruvate to increase the flux of
electron donors (NADH and FADH2) into the electron transport chain.
Coenzyme Q donates the electrons to molecular oxygen, hence leading to
generation of superoxide anions. The mitochondrial isoform of the enzyme
SOD, by contrast, degrades this oxygen free radical to H2O2, which is then
Chapter one Literature Review
Page 12
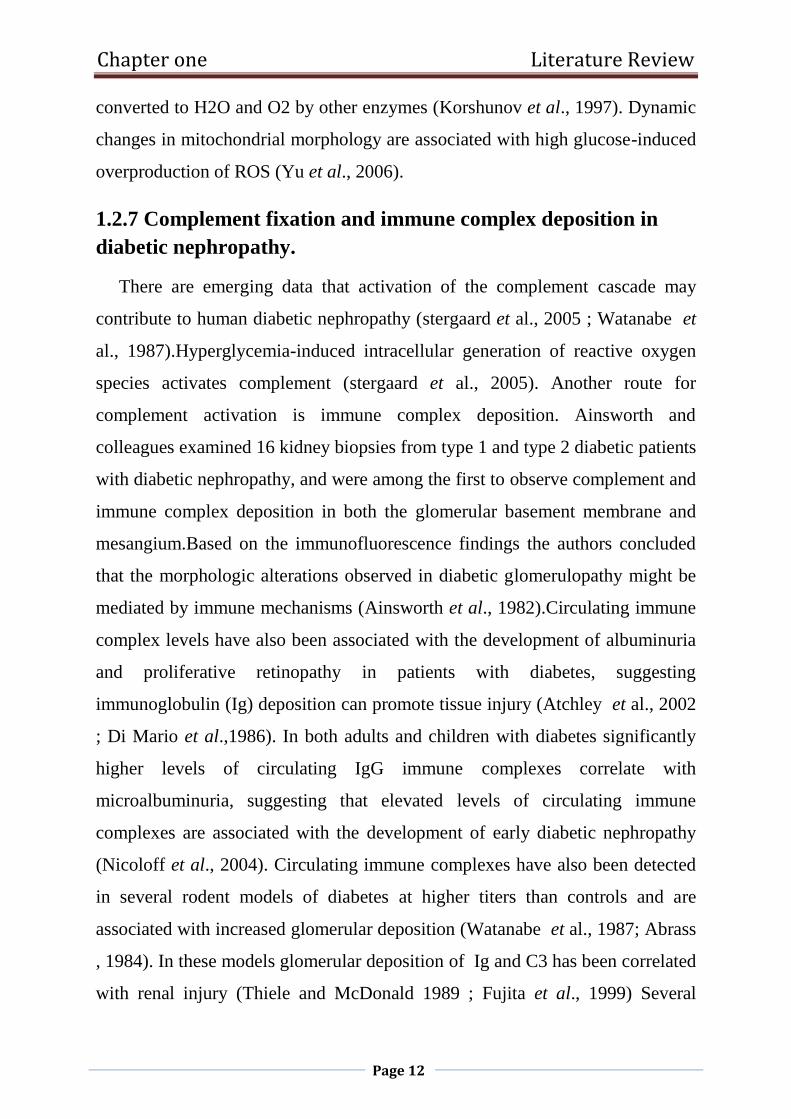
converted to H2O and O2 by other enzymes (Korshunov et al., 1997). Dynamic
changes in mitochondrial morphology are associated with high glucose-induced
overproduction of ROS (Yu et al., 2006).
1.2.7 Complement fixation and immune complex deposition in
diabetic nephropathy.
There are emerging data that activation of the complement cascade may
contribute to human diabetic nephropathy (stergaard et al., 2005 ; Watanabe et
al., 1987).Hyperglycemia-induced intracellular generation of reactive oxygen
species activates complement (stergaard et al., 2005). Another route for
complement activation is immune complex deposition. Ainsworth and
colleagues examined 16 kidney biopsies from type 1 and type 2 diabetic patients
with diabetic nephropathy, and were among the first to observe complement and
immune complex deposition in both the glomerular basement membrane and
mesangium.Based on the immunofluorescence findings the authors concluded
that the morphologic alterations observed in diabetic glomerulopathy might be
mediated by immune mechanisms (Ainsworth et al., 1982).Circulating immune
complex levels have also been associated with the development of albuminuria
and proliferative retinopathy in patients with diabetes, suggesting
immunoglobulin (Ig) deposition can promote tissue injury (Atchley et al., 2002
; Di Mario et al.,1986). In both adults and children with diabetes significantly
higher levels of circulating IgG immune complexes correlate with
microalbuminuria, suggesting that elevated levels of circulating immune
complexes are associated with the development of early diabetic nephropathy
(Nicoloff et al., 2004). Circulating immune complexes have also been detected
in several rodent models of diabetes at higher titers than controls and are
associated with increased glomerular deposition (Watanabe et al., 1987; Abrass
, 1984). In these models glomerular deposition of Ig and C3 has been correlated
with renal injury (Thiele and McDonald 1989 ; Fujita et al., 1999) Several
Chapter one Literature Review
Page 13
pathogenic mechanisms of immune complex deposition in diabetic renal injury
have been proposed. Glomerular and tubular basement membrane thickening
may involve an antigen-antibody reaction that stimulates resident cells to
proliferate (Nicoloff et al., 2004). Moreover, certain immune complexes
stimulate mesangial expansion by inducing collagen production (Abdelsamie et
al., 2011). Immune complexes may also promote glomerular macrophage
accrual. For example, in diabetic mice increased accumulation of macrophages
in the glomeruli correlates with an increased glomerular deposition of IgG
(Chow et al., 2004). The immune complex activated complement cascade was
directly tested in a study using human antibodies to oxidized low-density
lipoproteins (Ox-LDL) collected from sera of patients with type 1 diabetes.
Human anti-Ox-LDL antibodies incubated with complement fragments in vitro
form immune complexes and trigger activation of the classical complement
pathway. Moreover, Ox-LDL immune complexes induce inflammatory cytokine
release from macrophages in vitro(Saad et al., 2006).
1.2.8 Malondialdehyde(MDA).
Malondialdehyde (MDA) is a substance produced during polyunsaturated
fatty acid peroxidation which has been detected in the serum of patients with
T2D and correlate with the progression of disease(Del Rio et al., 2005 ; Kamper
et al., 2010). MDA is known to have toxic influence on cell membrane
structure. It can modulate signal transduction as well as modify proteins and
DNA(Srivastava et al., 2002). diabetic nephropathy is associated with high
blood glucose level and oxidative stress (significant increase in MDA level).
1.2.9 Catalase (CAT).
Catalase is a homotetrameric enzyme found in the tissues of almost all
mammals, and demonstrating the highest activity in the liver and erythrocytes.
Within the cell, catalase is localized primarily in the peroxisomes and
Chapter one Literature Review
Page 14
mitochondria. The principal role of catalase lies in the degradation of H2O2,
produced with support of peroxisomal oxidases. In the erythrocytes, catalase
constitues the first line of defense against H2O2 (Mueller et al., 1997).In the
situations of normal H2O2 concentration, the reaction goes towards H2O2
conversion into water and oxygen:
Catalase + 2 H2O2 → Compaund I + H2O
Compaund I + H2O2 → Katalaza + H2O + O2
The second H2O2 molecule serves as the donor of hydrogen ion.In the situations
of low H2O2 concentration and in the presence of small molecular electron
donors, catalase may act as peroxydase as well (Ghadermarzi and Moosavi-
Movahedi,1996). Catalase forms a firm bond with NADPH, which can prevent
the accumulation of inactive forms of the enzyme slowly created when catalase
is exposed to hydrogen peroxide. These effects of NADPH are evident in low
concentrations in the cell as well (Kirkman et al., 1987).Numerous diseases can
be accompanied with altered catalase activity. Reduced catalase activity has
been documented in diabetes mellitus (DM), malignant diseases, Down
syndrome, as well as in regenerating tissues and in experimental conditions of
nephrotoxicity (Djordjević et al., 2000). Since catalase has a predominant role
in the control of H2O2 concentration (Mueller et al., 1997; Gaetani et al.,
1996), which has been shown to damage pancreatic cells and inhibits insulin
activity (Murata et al.,1998; Tiedge et al., 1998; Jorns et al., 1999), it is
believed that catalase in that manner protects cells from the harmful action of
H2O2 (Murata et al.,1998).

Chapter one Literature Review
Page 15
1.2.10 Glutathione (GSH).
Glutathione is one of the most important nonenzymatic antioxidant in
mammal cells. In the cell, it is most commonly found as a thiol – in a reduced
form – and less as a disulfide – in an oxidized form (Toyokuni, 1996; Hann et
al., 1990; Natarajan,1995).GSH concentration in the cell is determined by the
control of enzymes involved in its synthesis, availability of synthesis precursors,
intensity of GSH depletion for cellular detoxification processes, interorgan GSH
distribution, as well as GSH regeneration in the so called glutathione redox
cycle. Erythrocytes represent a unique transport system for glutathione and its
conjugates. In contrast to other cells, GSH appears in erythrocytes in several
intermediary metabolic forms. In physiologic conditions, reduced GSH form
appears in the highest percentage. The other GSH form is oxidized glutathione,
occurring in the process of nonenzymatic oxidation or oxidation mediated by
GSH-peroxidase. The third erythrocyte form is the disulphide form of
glutathione bound to proteins and non-protein sulphydril
compounds.Glutathione S-conjugates (occurring via the action of glutathione S-
transferase) are the fourth potential intracellular-intermediary form of GSH in
the erythrocytes. Erythrocytes take up toxic molecules from the plasma, to be
excreted back into plasma after conjugation with GSH. Further detoxification of
S-conjugates continues in the liver and kidneys; nontoxic compounds are then
excreted from the organism via the bile or urine. GSH is involved in many
cellular functions. It is thought that during the evolution, depending on the
cellular metabolic needs, glutathione is engaged in the regulation of different
processes. Though the role of glutathion has been commonly associated with the
protection of the cell from active free radicals, glutathione is involved in many
other processes such as detoxification from xenobiotics, synthesis of nucleic
acids and proteins, cell signaling, proliferation, and differentiation (Djordjević
et al., 2000). However, its essential role lies in the protective antioxidant

Chapter one Literature Review
Page 16
system. GSH, GSH-transferase and GSH-reductase constitute an antioxidant
system of glutathione, in which GSH-reductase is required for the reduction of
oxidized glutathione and consequential glutathione recycling in the so called
glutathione redox cycle. Depletion of GSH in the cell increases its sensitivity to
oxidative damage (Rizzardini et al., 2003). In contrast, accumulation of GSH in
the cell, especially in the mitochondria, can prevent neural apoptosis caused by
ischemia (Li et al., 2002) and excitotoxicity (Kobayashi et al., 2000). The
involvement of GSH in the limitation of prooxidative cell status, has as the
ultimate consequence deceleration of aging, atherogenesis, mutagenesis, and
carcecogenesis (Anghileri and Thouvenot ,1997; Vostreis et al., 1988).
1.2.11 Creatinine.
Creatinine is produced in muscle metabolism as the end product of creatine
phosphate and is subsequently excreted principally by way of the kidneys,
predominantly by glomerular filtration (Taylor , 1989).Blood assays for
creatinine constitute the most commonly used measure of the presence and
progression of CKD. Thus, the level of the serum creatinine in a subject is a
general reflection of the level of kidney function. With kidney disease and loss
of nephrons, the level of serum creatinine would therefore show an upward
trend. Conversely, with improving kidney function, such as that seen following
acute kidney injury (AKI), the level of serum creatinine will then trend
downwards.Accordingly, serum creatinine is the most widely used assay to
measure the presence and progression of CKD (Levey , 1990).
Chapter one Literature Review
Page 17
1.2.12 Microalbuminuria.
Diabetic kidney disease or nephropathy is the most common cause of end
stage renal disease (ESRD) or kidney failure in the Western World. One of the
earliest markers of diabetic nephropathy is the presence of small amount of the
protein albumin in the urine. This is called MAU or microalbuminuria (urinary
albumin excretion of 30-300 mg/24 hours). Microalbuminuria may progress
over a span of a number of years to overt nephropathy characterized by the
presence of larger amounts of the protein albumin leaking through the kidneys’
filter mechanism into the urine. This is called macroalbuminuria (urinary
albumin > 300 mg/24 hours). The presence of macroalbuminuria indicates more
serious kidney disease. Progression to ESRD or kidney failure may then occur
within several years. Once overt kidney failure has developed 2 year survival is
approximately 50%( Canadian Diabetes Association , 2003 ; Rose and Bakris ,
2004).

Chapter Two
Materials
and
Methods

Chapter two materials and methods
Page 18
2. Materials and Methods.
2.1 Materials.
2.1.1 Equipment.
The used equipment and their sources are presented in table (2-1).
Table (2-1): The used equipments and their sources.
Origen Company Name of equipment
China Dragon MeD Automatic micropipettes
Germany Eppendorf Research
plus
Automatic micropipettes (0.5- 10)
China KJMR2 Blood Mixer
India Remi Centrifuge
Germany Human Comblizyer (urinelyzer)
Jordan AFCO-DISPO Disposable gel and clot activator tube
Jordan AL-Hanof factory EDTA K2(2.5 ml)
China CETOTEST Eppendorf
Qater QJECT Plastic disposable syringes; 5ml
UK EPSON Printer
Korea LG Refrigerator and freezer (-20 ˚C)
Germany Roche Cobas cΙΙΙ
Germany Human HumanReaderHS
Germany Human Combiwash
Chapter two materials and methods
Page 19
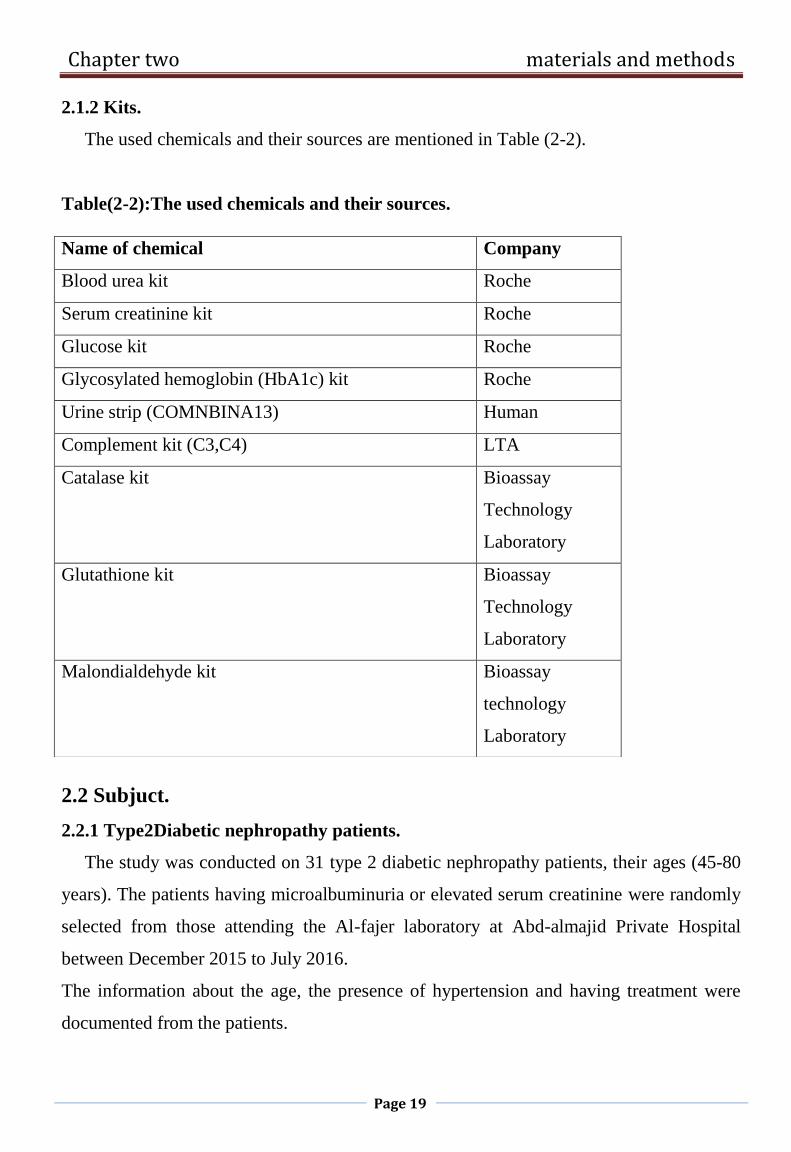
2.1.2 Kits.
The used chemicals and their sources are mentioned in Table (2-2).
Table(2-2):The used chemicals and their sources.
2.2 Subjuct.
2.2.1 Type2Diabetic nephropathy patients.
The study was conducted on 31 type 2 diabetic nephropathy patients, their ages (45-80
years). The patients having microalbuminuria or elevated serum creatinine were randomly
selected from those attending the Al-fajer laboratory at Abd-almajid Private Hospital
between December 2015 to July 2016.
The information about the age, the presence of hypertension and having treatment were
documented from the patients.
Name of chemical Company
Blood urea kit Roche
Serum creatinine kit Roche
Glucose kit Roche
Glycosylated hemoglobin (HbA1c) kit Roche
Urine strip (COMNBINA13) Human
Complement kit (C3,C4) LTA
Catalase kit Bioassay
Technology
Laboratory
Glutathione kit Bioassay
Technology
Laboratory
Malondialdehyde kit Bioassay
technology
Laboratory
Chapter two materials and methods
Page 20
2.2.2 Type2 Diabetic mellitus patients.
The study also included 30 type 2 diabetes mellitus (T2DM) patients, their ages (45-80
years). They were randomly selected from those attending the Al-fajer laboratory at Abd-
almajid Private Hospital between December 2015 to July 2016.
The information about the age, the presence of hypertension and having treatment were
documented from the patients.
2.2.3 Control subjects.
For the purpose of comparisons, 28 healthy controls subjects comparable to diabetes
mellitus and diabetic nephropathy patients in respect to age (45-80) year. The controls
were selected among subjects who were apparently healthy in terms of being non-diabetic,
with no other endocrine disorders or metabolic kidney diseases and were free of acute
illness or infection at time of sampling.
2.3 Collection of samples.
2.3.1 Collection of blood samples.
Five ml of blood were obtained from patients and control subjects by venipuncture,
using a 5 ml disposable syringe, 3ml of blood and dispensed in a gel tubes and centrifuged
at 3000 rpm for 10 minutes to collect serum. The serum was divided into aliquots in
Eppendorf tubes for measuring the random blood sugar (RBS), Blood urea , serum
creatinine, complement(C3,C4), catalase, malondialdehyde and glutathione and stored in
deep freezer at (-20◦C), other 2 ml were collected into EDTA tubes for measuring HbA1c.
2.3.2 Collection of urine samples.
Urine was collected two times by spot urine collection. The urine was collected into
sterile cups without any blood or urinary tract infection.
Chapter two materials and methods
Page 21
2.4 Methods.
2.4.1 Blood glucose determination using glucose kit.
2.4.1.1 Principle of the method.
Enzymatic reference method with hexokinase.
Hexokinase catalyzes the phosphorylation of glucose to glucose-6-phosphate by ATP.
Glucose + ATP HK
G-6-P + ADP
Glucose-6-phospate dehydrogenase oxidizes glucose-6-phosphate in the presence of
NADP to gluconate-6-phosphate. No other carbohydrate is oxidized. The rate of NADPH
formation during the reaction is directly proportional to the glucose concentration and is
measured photometrically.
G-6-P + NADP gluconate-6-p + NADPH + H
2.4.2 Blood urea determination using blood urea kit.
2.4.2.1 Principle of the method.
Kinetic test with urease and glutamate dehydrogenase.
Urea is hydrolyzed by urease to form ammonium and carbonate.
Urea + H2O Urease
2 NH4+ + CO3
2-
In the second reaction 2-oxoglutarate react with ammonium in the presence of glutamate
dehydrogenase (GLDH) and the coenzyme NADH to produce L-glutamate. In this reaction
two moles of NADH are oxidized to NAD for each mole of urea hydrolyzed.
NH4+ +2-oxoglutarate + NADH
GLDH L-glutamate + NAD+ + H2O
The rate of decrease in the NADH concentration is directly proportion to the urea
concentration in the specimen and is measured photometrically.

Chapter two materials and methods
Page 22
2.4.3 Creatinine determination using creatinine kit.
2.4.3.1 Test principle.
This kinetic colorimetric assay is based on the Jaffé method. In alkaline solution,
creatinine forms a yellow-orange complex with picrate. The rate of dye formation is
proportional to the creatinine concentration in the specimen. The assay uses "rate-
blanking" to minimize interference by bilirubin. To correct for non-specific reaction
caused by serum/plasma pseudo-creatinine chromogens, including protein and ketones, the
results for serum or plasma are corrected by -18 µmol/L (-0.2 mg/dL).
Creatinine + picric acid Alkaline pH
yellow-red complex
2.4.4 Glycosylated hemoglobin determination using HbA1c kit.
2.4.4.1 Principle of the method.
This method uses TTAB (tetradecyltrimethylammonium bromide) as the detergent in
the hemolyzing reagent to eliminate interference from leukocytes (TTAB does not lyse
leukocytes). Sample pretreatment to remove labile HbA1c is not necessary.
All hemoglobin variants which are glycated at the β-chain n-terminus and which have
antibody-recognizable regions identical to that of HbA1c are measured by this assay.
Consequently, the metabolic state of patients having uremia or the most frequent
hemoglobinopathies (HbAS, HbAE) can be determined using this assay.
The hemoglobin A1c (HbA1c) determination is based on the turbidimetric inhibition
immunoassay (TINIA) for hemolyzed whole blood.
2.4.5 Malondialdehyde determination using ELISA kit (MDA).
2.4.5.1Test principle.
This kit uses enzyme-linked immune sorbent assay (ELISA) based on the Biotin
double antibody sandwich technology to assay the Human Malondialdehyde (MDA). Add
Malondialdehyde (MDA) to the wells, which are pre-coated with Malondialdehyde
(MDA) monoclonal antibody and then incubate. After that, add anti MDA antibodies

Chapter two materials and methods
Page 23
labeled with biotin to unite with streptavidin-HRP, which forms immune complex.
Remove unbound enzymes after incubation and washing. Add substrate A and B. Then the
solution will turn blue and change into yellow with the effect of acid. The shades of
solution and the concentration of Human Malondialdehyde (MDA) are positively
correlated.
2.4.5.2 Assay procedure.
1. Standard solutions were diluted as follow:
2. The number of stripes needed is determined by that of samples to be tested added by
that of standards. It is suggested that each standard solution and each blank well should be
arranged with three or more wells as much as possible.
3. Sample injection: 1) Blank well: no sample, anti MDA antibody labeled with biotin or
streptavidin-HRP is added to comparison blank well except chromogen solution A & B
and stop solution while taking the same steps that follow. 2) Standard solution well: Add
50μl standard and streptomycin-HRP 50μl (biotin antibodies have united in advance in the
standard so no biotin antibodies are added.) 3) Sample well to be tested: Add 40μl sample
and then 10μl MDA antibodies, 50μl streptavidin-HRP. Then cover it with seal plate
membrane. Shake gently to mix them up. Incubate at 37℃ for 60 minutes.
4. Preparation of washing solution: Dilute the washing concentration (30X) with distilled
water for later use.
40nmol/ml Standard No.5 120μl Original Standard + 120μl Standard
diluents
20nmol/ml Standard No.4 120μl Standard No.5 + 120μl Standard diluents
10nmol/ml Standard No.3 120μl Standard No.4 + 120μl Standard diluent
5nmol/ml Standard No.2 120μl Standard No.3 + 120μl Standard diluent
2.5nmol/ml Standard No.1 120μl Standard No.2 + 120μl Standard diluent
Chapter two materials and methods
Page 24
5. Washing: Remove the seal plate membrane carefully, drain the liquid and shake off the
remaining liquid. Fill each well with washing solution. Drain the liquid after 30 seconds’
standing. Then repeat this procedure five times and blot the plate.
6. Color development: Add 50μl chromogen solution A firstly to each well and then add
50μl chromogen solution B to each well as well. Shake gently to mix them up. Incubate for
10 minutes at 37℃ away from light for color development.
7. Stop: Add 50μl Stop Solution to each well to stop the reaction (the blue color changes
into yellow immediately at that moment).
8. Assay: Take blank well as zero, measure the absorbance (OD) of each well one by one
under 450nm wavelength, which should be carried out within the 10 minutes after having
added the stop solution.
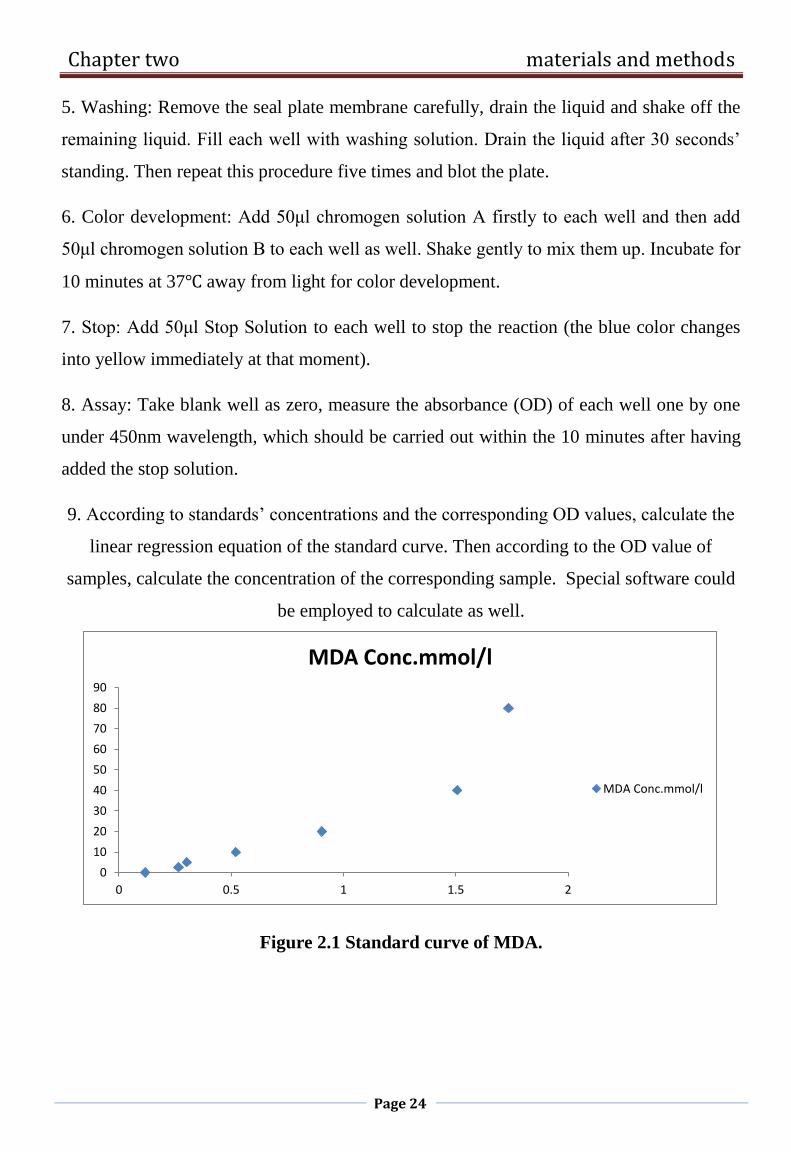
9. According to standards’ concentrations and the corresponding OD values, calculate the
linear regression equation of the standard curve. Then according to the OD value of
samples, calculate the concentration of the corresponding sample. Special software could
be employed to calculate as well.
Figure 2.1 Standard curve of MDA.
0
10
20
30
40
50
60
70
80
90
0 0.5 1 1.5 2
MDA Conc.mmol/l
MDA Conc.mmol/l
Chapter two materials and methods
Page 25
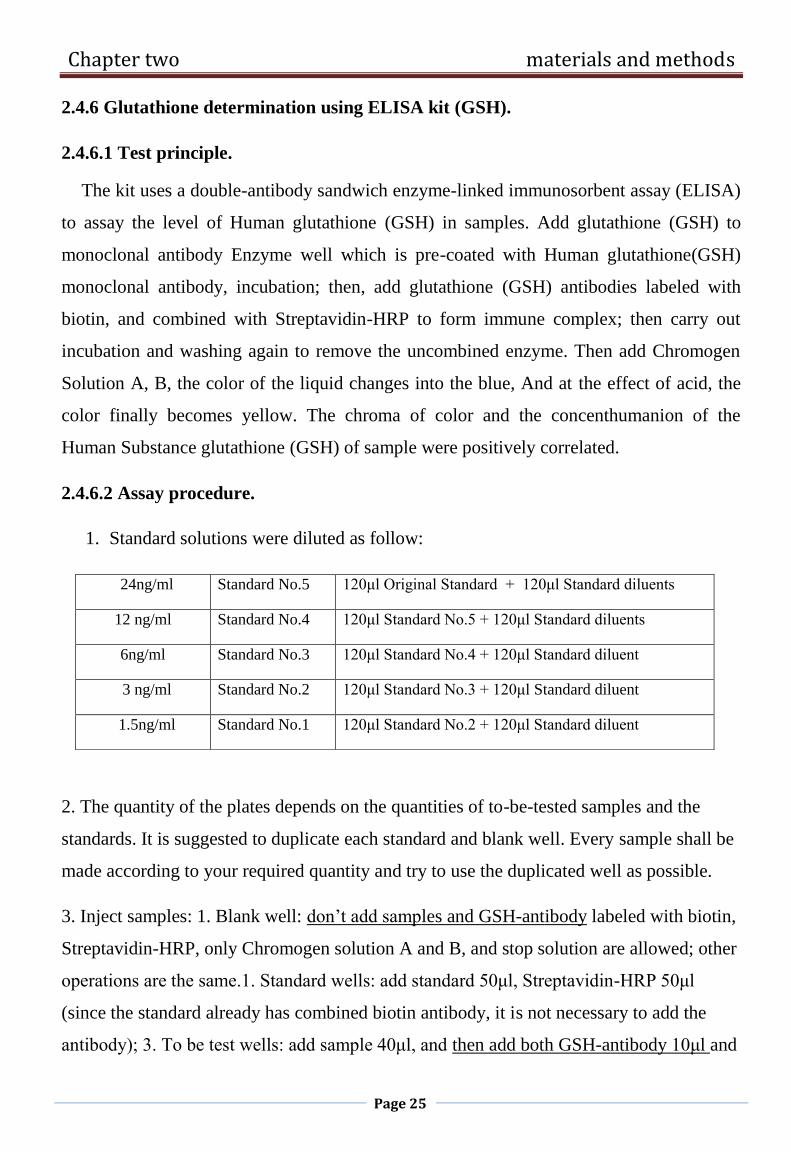
2.4.6 Glutathione determination using ELISA kit (GSH).
2.4.6.1 Test principle.
The kit uses a double-antibody sandwich enzyme-linked immunosorbent assay (ELISA)
to assay the level of Human glutathione (GSH) in samples. Add glutathione (GSH) to
monoclonal antibody Enzyme well which is pre-coated with Human glutathione(GSH)
monoclonal antibody, incubation; then, add glutathione (GSH) antibodies labeled with
biotin, and combined with Streptavidin-HRP to form immune complex; then carry out
incubation and washing again to remove the uncombined enzyme. Then add Chromogen
Solution A, B, the color of the liquid changes into the blue, And at the effect of acid, the
color finally becomes yellow. The chroma of color and the concenthumanion of the
Human Substance glutathione (GSH) of sample were positively correlated.
2.4.6.2 Assay procedure.
1. Standard solutions were diluted as follow:
2. The quantity of the plates depends on the quantities of to-be-tested samples and the
standards. It is suggested to duplicate each standard and blank well. Every sample shall be
made according to your required quantity and try to use the duplicated well as possible.
3. Inject samples: 1. Blank well: don’t add samples and GSH-antibody labeled with biotin,
Streptavidin-HRP, only Chromogen solution A and B, and stop solution are allowed; other
operations are the same.1. Standard wells: add standard 50μl, Streptavidin-HRP 50μl
(since the standard already has combined biotin antibody, it is not necessary to add the
antibody); 3. To be test wells: add sample 40μl, and then add both GSH-antibody 10μl and
24ng/ml Standard No.5 120μl Original Standard + 120μl Standard diluents
12 ng/ml Standard No.4 120μl Standard No.5 + 120μl Standard diluents
6ng/ml Standard No.3 120μl Standard No.4 + 120μl Standard diluent
3 ng/ml Standard No.2 120μl Standard No.3 + 120μl Standard diluent
1.5ng/ml Standard No.1 120μl Standard No.2 + 120μl Standard diluent

Chapter two materials and methods
Page 26
Streptavidin-HRP 50μl. Then seal the sealing memberance, and gently shaking, incubated
60 minutes at 37 ℃.
4. Confection: dilute 30 times the 30×washing concentrate with distilled water as standby.
5. Washing: remove the memberance carefully, and drain the liquid, shake away the
remaining water.
6. Add chromogen solution a 50μl, then chromogen solution B 50μl to each well. Gently
mixed, incubate for 10 min at 37℃ away from light.
7. Stop: Add Stop Solution 50μl into each well to stop the reaction(the blue changes into
yellow immediately).
8. Final measurement: Take blank well as zero , measure the optical densit (OD) under 450
nm wavelength which should be carried out within 15min after adding the stop solution.
9. According to standards’ concentration and the corresponding OD values, calculate out
the standard curve linear regression equation, and then apply the OD values of the sample
on the regression equation to calculate the corresponding sample’s concentration. It is
acceptable to use kinds of software to make calculations.
Figure 2.2 Standard curve of GSH.
0
10
20
30
40
50
60
0 0.5 1 1.5 2 2.5
GSH Conc.ng/ml
GSH Conc.ng/ml
Chapter two materials and methods
Page 27
2.4.7 Catalase determination using ELISA kit (CAT).
2.4.7.1Test principle.
This kit uses enzyme-linked immune sorbent assay (ELISA) based on the Biotin double
antibody sandwich technology to assay the Human Catalase (CAT). Add Catalase (CAT)
to the wells, which are pre-coated with Catalase (CAT) monoclonal antibody and then
incubate. After that, add anti CAT antibodies labeled with biotin to unite with streptavidin-
HRP, which forms immune complex. Remove unbound enzymes after incubation and
washing. Add substrate A and B. Then the solution will turn blue and change into yellow
with the effect of acid. The shades of solution and the concentration of Human Catalase
(CAT) are positively correlated.
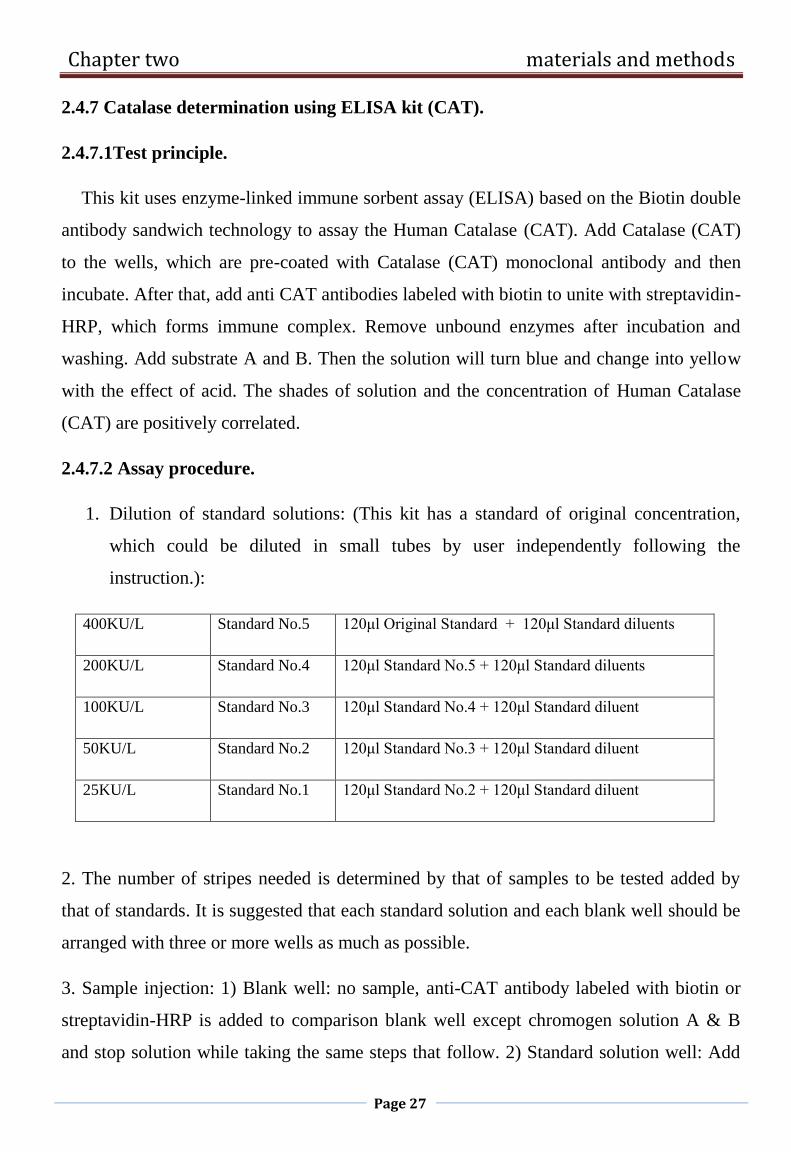
2.4.7.2 Assay procedure.
1. Dilution of standard solutions: (This kit has a standard of original concentration,
which could be diluted in small tubes by user independently following the
instruction.):
2. The number of stripes needed is determined by that of samples to be tested added by
that of standards. It is suggested that each standard solution and each blank well should be
arranged with three or more wells as much as possible.
3. Sample injection: 1) Blank well: no sample, anti-CAT antibody labeled with biotin or
streptavidin-HRP is added to comparison blank well except chromogen solution A & B
and stop solution while taking the same steps that follow. 2) Standard solution well: Add
400KU/L Standard No.5 120μl Original Standard + 120μl Standard diluents
200KU/L Standard No.4 120μl Standard No.5 + 120μl Standard diluents
100KU/L Standard No.3 120μl Standard No.4 + 120μl Standard diluent
50KU/L Standard No.2 120μl Standard No.3 + 120μl Standard diluent
25KU/L Standard No.1 120μl Standard No.2 + 120μl Standard diluent

Chapter two materials and methods
Page 28
50μl standard and streptavidin-HRP 50μl (biotin antibodies have united in advance in the
standard so no biotin antibodies are added. 3) Sample well to be tested: Add 40μl sample
and then 10μl CAT antibodies, 50μl streptavidin-HRP. Then cover it with seal plate
membrane. Shake gently to mix them up. Incubate at 37℃ for 60 minutes.
4. Preparation of washing solution: Dilute the washing concentration (30X) with distilled
water for later use.
5. Washing: Remove the seal plate membrane carefully, drain the liquid and shake off the
remaining liquid. Fill each well with washing solution. Drain the liquid after 30 seconds’
standing. Then repeat this procedure five times and blot the plate.
6. Color development: Add 50μl chromogen solution A firstly to each well and then add
50μl chromogen solution B to each well as well. Shake gently to mix them up. Incubate for
10 minutes at 37℃ away from light for color development.
7. Stop: Add 50μl Stop Solution to each well to stop the reaction (the blue color changes
into yellow immediately at that moment).
8. Assay: Take blank well as zero, measure the absorbance (OD) of each well one by one
under 450nm wavelength, which should be carried out within the 10 minutes after having
added the stop solution.
9. According to standards’ concentrations and the corresponding OD values, calculate the
linear regression equation of the standard curve. Then according to the OD value of
samples, calculate the concentration of the corresponding sample. Special software could
be employed to calculate as well.
Chapter two materials and methods
Page 29
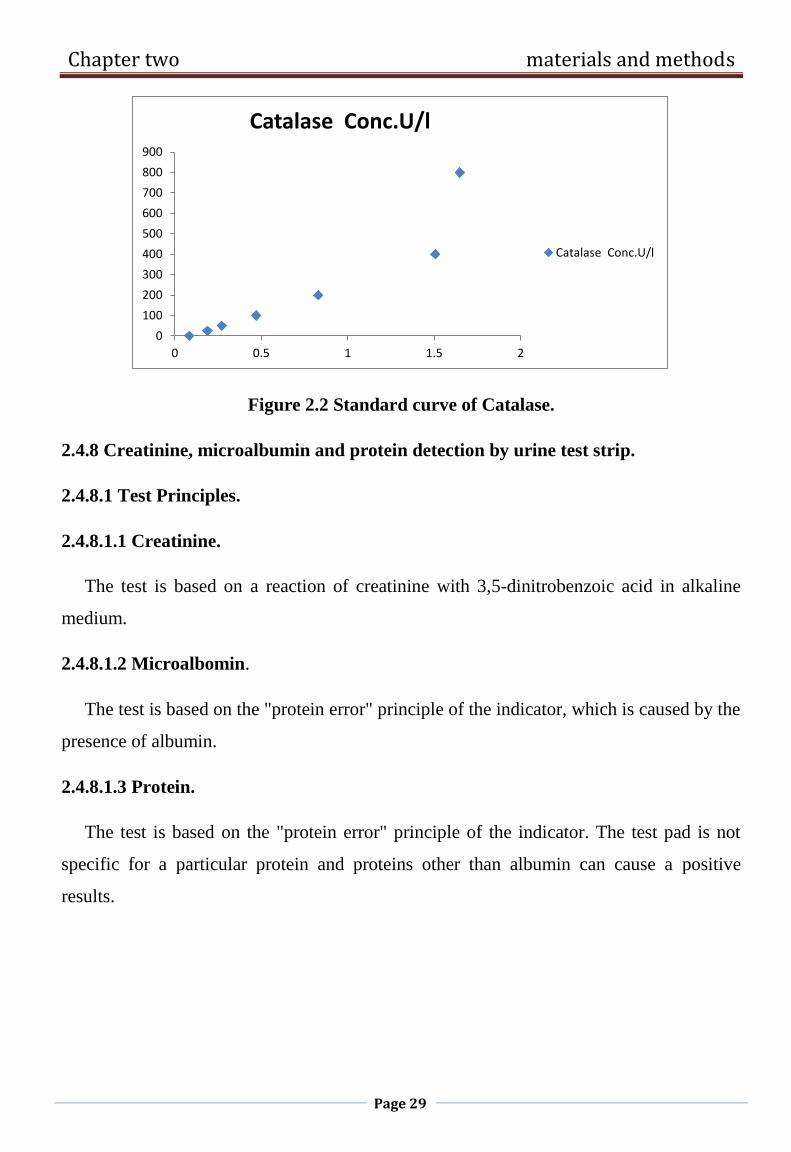
Figure 2.2 Standard curve of Catalase.
2.4.8 Creatinine, microalbumin and protein detection by urine test strip.
2.4.8.1 Test Principles.
2.4.8.1.1 Creatinine.
The test is based on a reaction of creatinine with 3,5-dinitrobenzoic acid in alkaline
medium.
2.4.8.1.2 Microalbomin.
The test is based on the "protein error" principle of the indicator, which is caused by the
presence of albumin.
2.4.8.1.3 Protein.
The test is based on the "protein error" principle of the indicator. The test pad is not
specific for a particular protein and proteins other than albumin can cause a positive
results.
0
100
200
300
400
500
600
700
800
900
0 0.5 1 1.5 2
Catalase Conc.U/l
Catalase Conc.U/l

Chapter two materials and methods
Page 30
2.4.8.2 Assay procedure.
1. Only well mixed, non-centrifuged urine was used which should not be older than two
hours.
2. The test strip was immersed in the urine for approximately 2 sec, so that all reagent
are covered. The excess urine was removed from the strip by wiping the edge of the
strip on the urine container or on absorbent paper.
3. The urine strip was reflectometric read with Combilyzer.
2.4.9 Determenation of the C3, C4 protein, by radial immunodiffusion plate.
2.4.9.1 Test principle.
The examined protein, diffusing in agarose gel containing a specific antibody will form an
immune-complex, visible as a ring around the well. The ring diameter is direct
proportional to the concentration of the analysed protein. The proportion corresponde to
the diffusion time. In fact, at the end (72), the square of diameter will be in linear
proportion to the concentration of the sample.
With the plate is supplied a reference table in which each diameter of the halo is associated
a concentration.
2.4.9.2 Assay procedure.
Remove the plate from its envelope and leave to stand at room temperature for few
minutes so that any condensed water in the wells can evaporate. Fill the wells with 5 µl of
sample and/or controls and wait it has been completely adsorbing before handing the plate.
Close the plate and place it in a moist chamber for 72 hours.
2.5 Statistical analysis.
The Statistical Analysis System- SAS (2012) program was used analyzed of differente
factors in study parameters . Least significant difference –LSD test was used to significant
P< 0.05 compare between means in this study (SAS., 2012).

Chapter Three
Results
and
Discussion

Chapter Three Results
Page 31
3. Results and discussion.
3.1 Results.
3.1.1 Serum and urine biochemical parameters in healthy control
subjects, diabetic and diabetic nephropathy patients at the age 45-56
years.
1. Random blood sugar (RBS) concentration.
Figures3.1 shows random blood sugar concentration in healthy control
subjects, diabetic and diabetic nephropathy patients at the age 45-56. The
Figure demonstrates that RBS increases significantly (p<0.05) in diabetic
and diabetic nephropathy patients as compared with the healthy control
subjects (Appendix 1).
0
50
100
150
200
250
300
Healthy controlsubjects
Diabeticpatients
Diabeticnephropathy
patients
102.99 b
279.2 a
214.49 a
Ra
nd
om
Blo
od
Su
ga
r c
on
ce
ntr
ati
on
(mg
/dl)
Figure 3.1:Random blood sugar concentration in healthycontrol subjects, diabetic and diabetic nephropathypatients (age 45-56 years). different letters meansignificant differences at P< 0.05.

Chapter Three Results
Page 32
2. Serum urea concentration.
The results of serum urea concentration are shown in Figure 3.2. No
change is observed in serum urea concentration in diabetic patients,
whereas in diabetic nephropathy patients, serum urea concentration
shows a significant (p<0.05) increase when compared with the healthy
control subjects (Appendix 1).
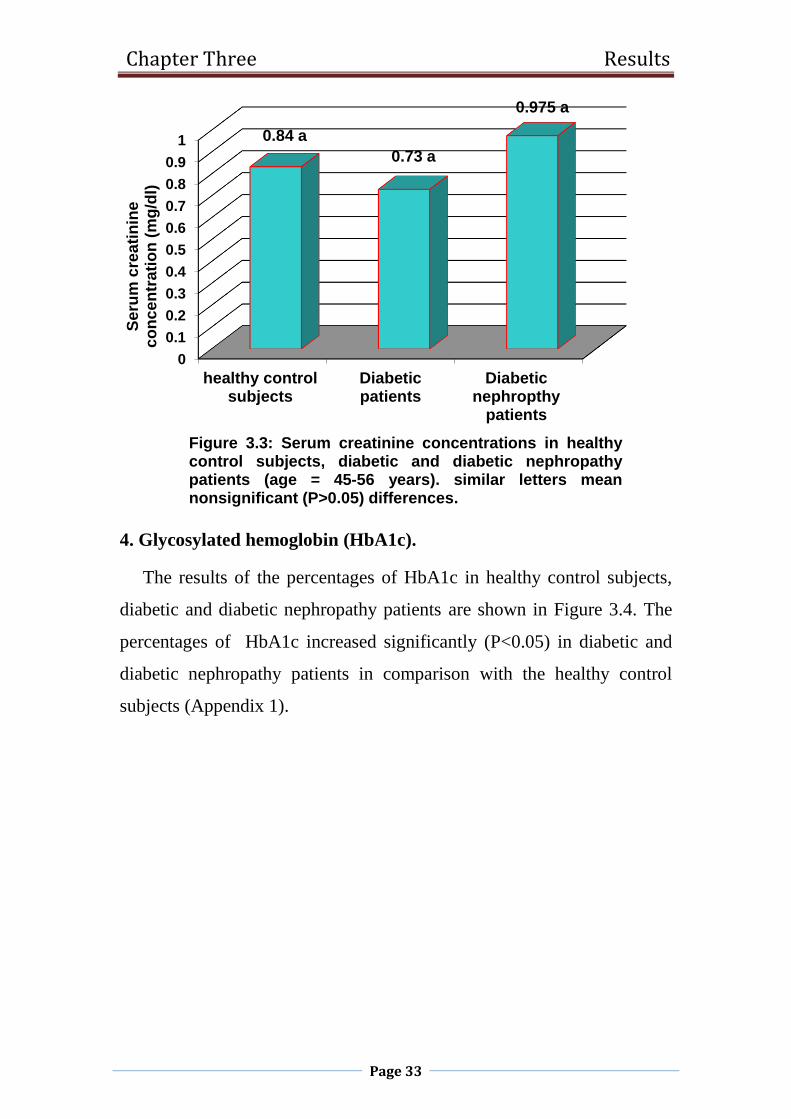
3. Serum creatinine concentration.
Figure3.3 shows nonsignificant (p>0.05) changes was observed in
serum creatinine concentration in diabetic and diabetic nephropathy
patients as compared with the healthy control subjects (Appendix 1).
0
10
20
30
40
50
60
healthy controlsubjects
Diabeticpatients
Diabeticnephropathy
patients
32.24 b 32.72 b
52.21 a
Se
rum
ure
a c
on
ce
ntr
ati
on
(mg
/dl)
Figure 3.2: Serum urea concentrations in healthy controlsubjects, diabetic and diabetic nephropathy patients(age 45-56 years). different letters mean significantdifferences at P< 0.05.
Chapter Three Results
Page 33
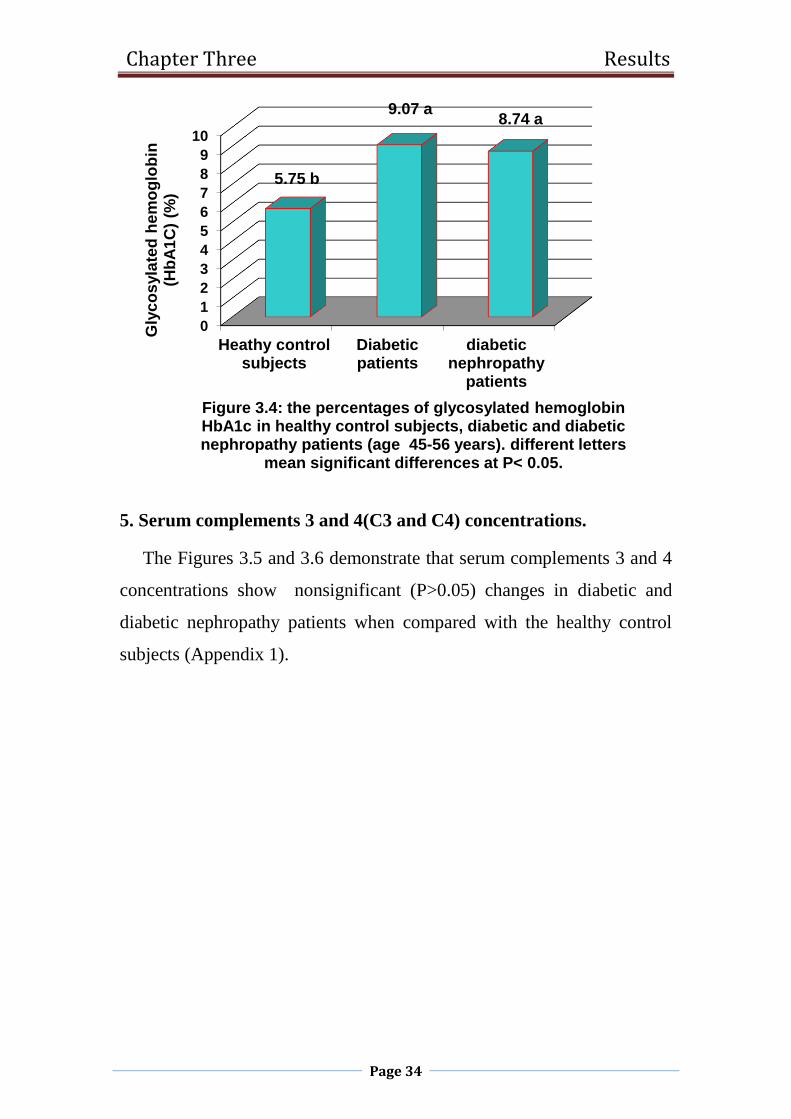
4. Glycosylated hemoglobin (HbA1c).
The results of the percentages of HbA1c in healthy control subjects,
diabetic and diabetic nephropathy patients are shown in Figure 3.4. The
percentages of HbA1c increased significantly (P<0.05) in diabetic and
diabetic nephropathy patients in comparison with the healthy control
subjects (Appendix 1).
0
0.1
0.2
0.3
0.4
0.5
0.6
0.7
0.8
0.9
1
healthy controlsubjects
Diabeticpatients
Diabeticnephropthy
patients
0.84 a
0.73 a
0.975 a
Se
rum
cre
ati
nin
e
co
nce
ntr
ati
on
(m
g/d
l)
Figure 3.3: Serum creatinine concentrations in healthycontrol subjects, diabetic and diabetic nephropathypatients (age = 45-56 years). similar letters meannonsignificant (P>0.05) differences.
Chapter Three Results
Page 34
5. Serum complements 3 and 4(C3 and C4) concentrations.
The Figures 3.5 and 3.6 demonstrate that serum complements 3 and 4
concentrations show nonsignificant (P>0.05) changes in diabetic and
diabetic nephropathy patients when compared with the healthy control
subjects (Appendix 1).
0
1
2
3
4
5
6
7
8
9
10
Heathy controlsubjects
Diabeticpatients
diabeticnephropathy
patients
5.75 b
9.07 a8.74 a
Gly
co
syla
ted
he
mo
glo
bin
(H
bA
1C
) (%
)
Figure 3.4: the percentages of glycosylated hemoglobin HbA1c in healthy control subjects, diabetic and diabetic nephropathy patients (age 45-56 years). different letters
mean significant differences at P< 0.05.

Chapter Three Results
Page 35
0
20
40
60
80
100
120
healthy controlsubjects
Diabeticpatients
Diabeticnephropathy
patients
102.78 a116.74 a 116.2 a
Co
mp
lem
en
t 3
co
nce
ntr
ati
on
(mg
/dl)
Figure 3.5: Serum complement3 concentrations inhealthy control subjects, diabetic and diabeticnephropathy patients (age 45-56 years). similareletters mean nonsignificant (P< 0.05) differences`.
0
5
10
15
20
25
30
Healthy controlsubjects
Diabeticpatients
Diabeticnephropathy
patients
23.13 a
27.06 a
24.89 a
Co
mp
lem
en
t 4
co
nce
ntr
ati
on
(mg
/dl)
Figure 3.6: Serum complement 4 in healthy controlsubjects, diabetic and diabetic nephropathy patients (age45-56 years). similar letters mean nonsignificant(P>0.05)differences.
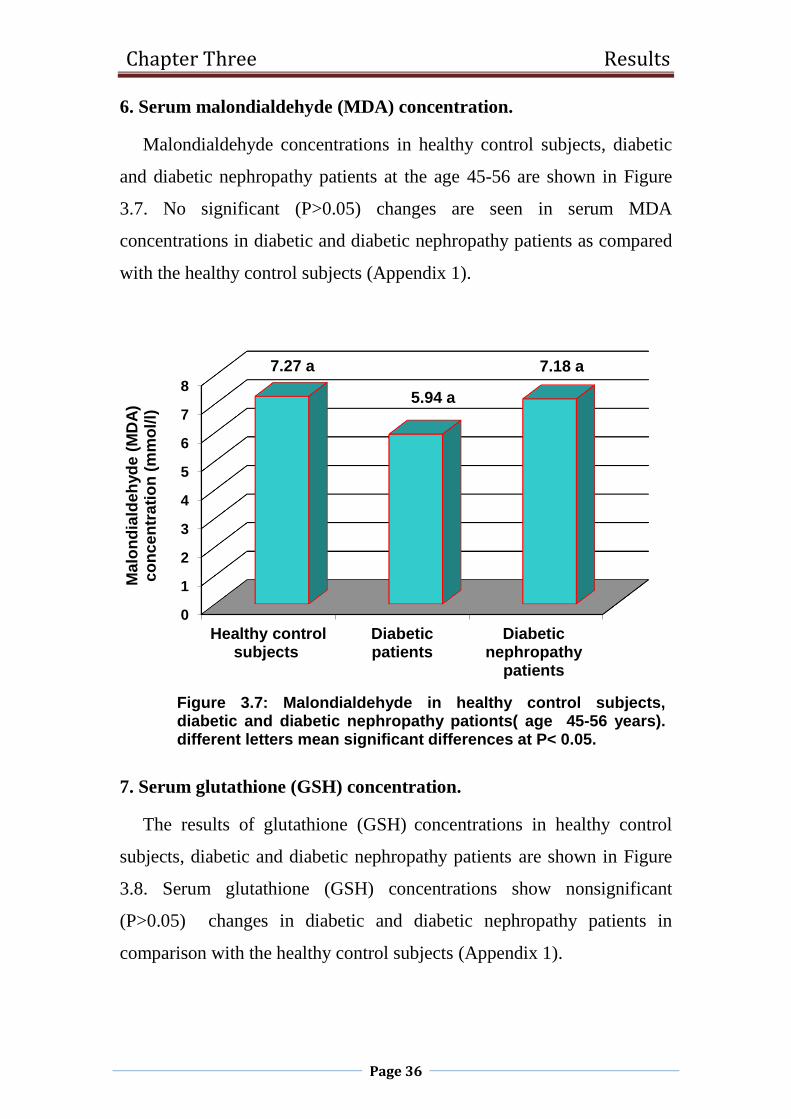
Chapter Three Results
Page 36
6. Serum malondialdehyde (MDA) concentration.
Malondialdehyde concentrations in healthy control subjects, diabetic
and diabetic nephropathy patients at the age 45-56 are shown in Figure
3.7. No significant (P>0.05) changes are seen in serum MDA
concentrations in diabetic and diabetic nephropathy patients as compared
with the healthy control subjects (Appendix 1).
7. Serum glutathione (GSH) concentration.
The results of glutathione (GSH) concentrations in healthy control
subjects, diabetic and diabetic nephropathy patients are shown in Figure
3.8. Serum glutathione (GSH) concentrations show nonsignificant
(P>0.05) changes in diabetic and diabetic nephropathy patients in
comparison with the healthy control subjects (Appendix 1).
0
1
2
3
4
5
6
7
8
Healthy controlsubjects
Diabeticpatients
Diabeticnephropathy
patients
7.27 a
5.94 a
7.18 a
Ma
lon
dia
lde
hyd
e (
MD
A)
co
nc
en
tra
tio
n (
mm
ol/
l)
Figure 3.7: Malondialdehyde in healthy control subjects,diabetic and diabetic nephropathy pationts( age 45-56 years).different letters mean significant differences at P< 0.05.
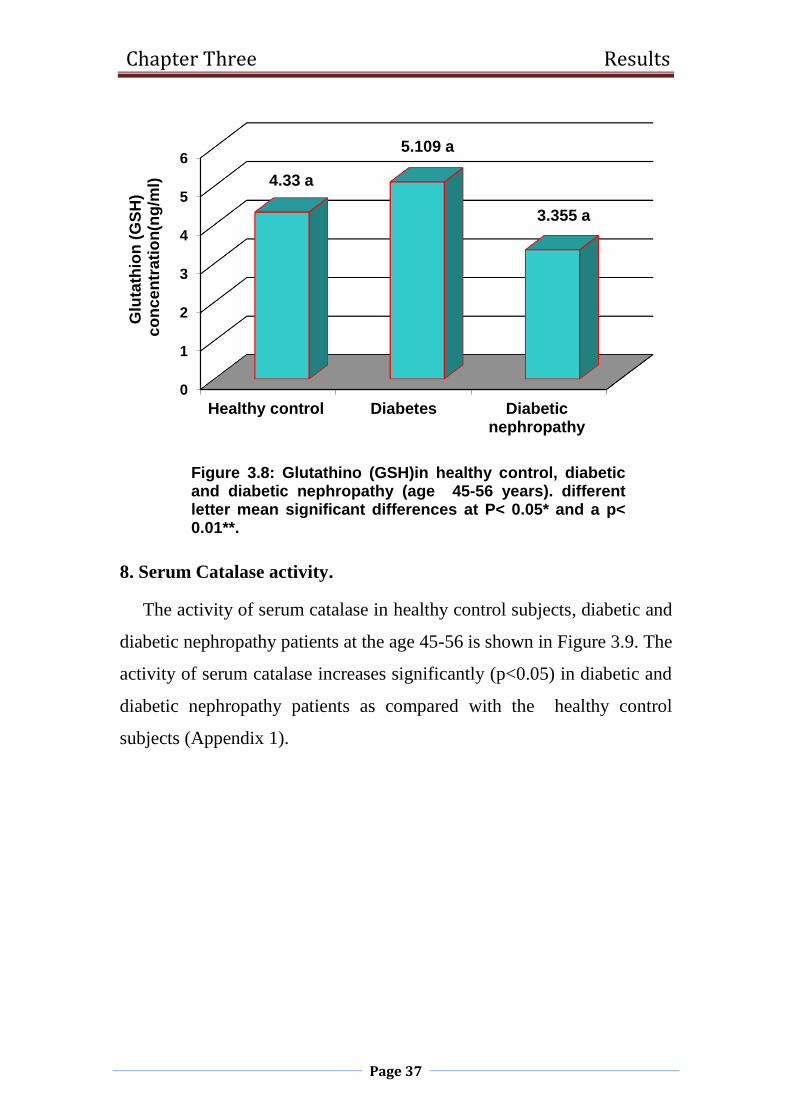
Chapter Three Results
Page 37
8. Serum Catalase activity.
The activity of serum catalase in healthy control subjects, diabetic and
diabetic nephropathy patients at the age 45-56 is shown in Figure 3.9. The
activity of serum catalase increases significantly (p<0.05) in diabetic and
diabetic nephropathy patients as compared with the healthy control
subjects (Appendix 1).
0
1
2
3
4
5
6
Healthy control Diabetes Diabeticnephropathy
4.33 a
5.109 a
3.355 a
Glu
tath
ion
(G
SH
)c
on
ce
ntr
ati
on
(ng
/ml)
Figure 3.8: Glutathino (GSH)in healthy control, diabeticand diabetic nephropathy (age 45-56 years). differentletter mean significant differences at P< 0.05* and a p<0.01**.
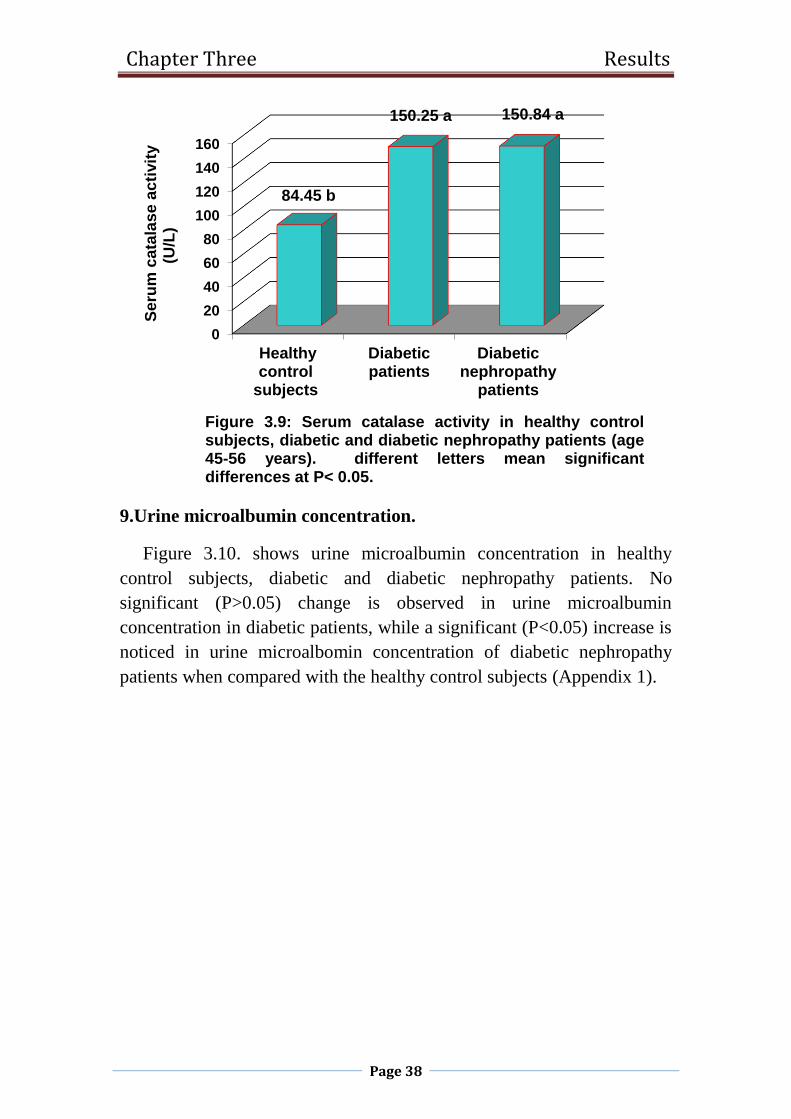
Chapter Three Results
Page 38
9.Urine microalbumin concentration.
Figure 3.10. shows urine microalbumin concentration in healthy
control subjects, diabetic and diabetic nephropathy patients. No
significant (P>0.05) change is observed in urine microalbumin
concentration in diabetic patients, while a significant (P<0.05) increase is
noticed in urine microalbomin concentration of diabetic nephropathy
patients when compared with the healthy control subjects (Appendix 1).
0
20
40
60
80
100
120
140
160
Healthycontrol
subjects
Diabeticpatients
Diabeticnephropathy
patients
84.45 b
150.25 a 150.84 a
Se
rum
ca
tala
se
ac
tivit
y(U
/L)
Figure 3.9: Serum catalase activity in healthy controlsubjects, diabetic and diabetic nephropathy patients (age45-56 years). different letters mean significantdifferences at P< 0.05.
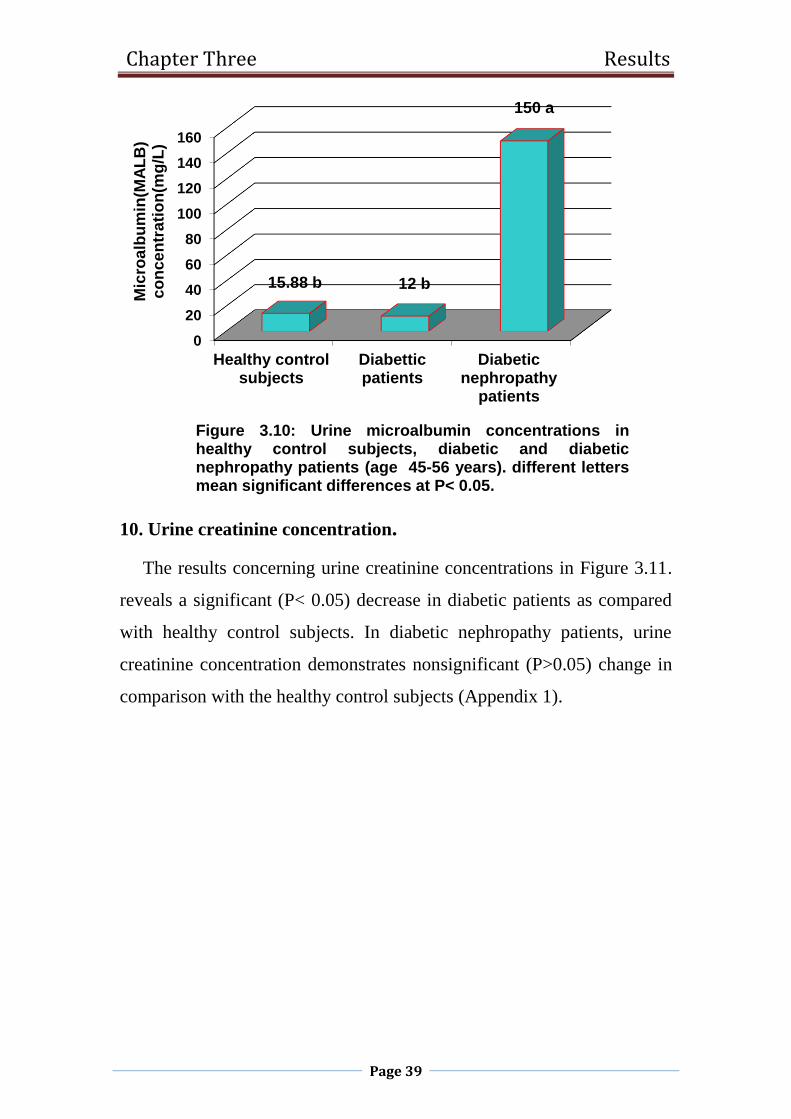
Chapter Three Results
Page 39
10. Urine creatinine concentration.
The results concerning urine creatinine concentrations in Figure 3.11.
reveals a significant (P< 0.05) decrease in diabetic patients as compared
with healthy control subjects. In diabetic nephropathy patients, urine
creatinine concentration demonstrates nonsignificant (P>0.05) change in
comparison with the healthy control subjects (Appendix 1).
0
20
40
60
80
100
120
140
160
Healthy controlsubjects
Diabetticpatients
Diabeticnephropathy
patients
15.88 b 12 b
150 a
Mic
roa
lbu
min
(MA
LB
) c
on
ce
ntr
ati
on
(mg
/L)
Figure 3.10: Urine microalbumin concentrations inhealthy control subjects, diabetic and diabeticnephropathy patients (age 45-56 years). different lettersmean significant differences at P< 0.05.
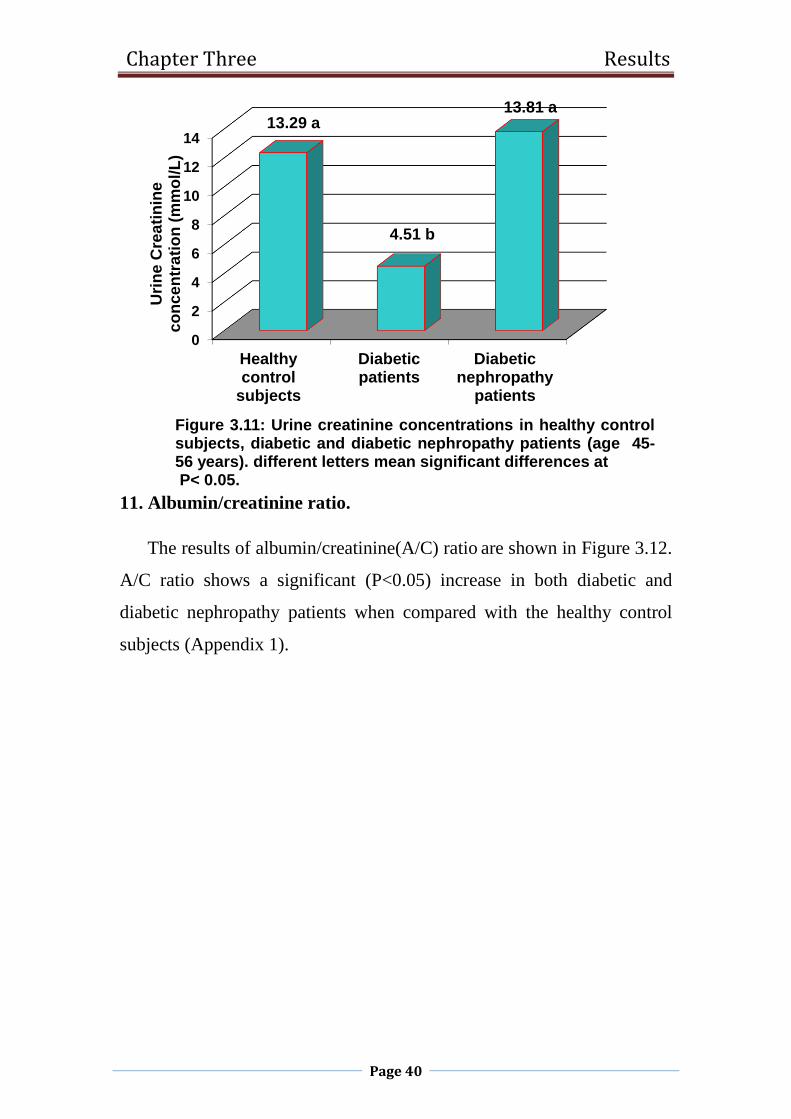
Chapter Three Results
Page 40
11. Albumin/creatinine ratio.
The results of albumin/creatinine(A/C) ratio are shown in Figure 3.12.
A/C ratio shows a significant (P<0.05) increase in both diabetic and
diabetic nephropathy patients when compared with the healthy control
subjects (Appendix 1).
0
2
4
6
8
10
12
14
Healthycontrol
subjects
Diabeticpatients
Diabeticnephropathy
patients
13.29 a
4.51 b
13.81 a
Uri
ne
Cre
ati
nin
e
co
nce
ntr
ati
on
(m
mo
l/L
)
Figure 3.11: Urine creatinine concentrations in healthy controlsubjects, diabetic and diabetic nephropathy patients (age 45-56 years). different letters mean significant differences atP< 0.05.
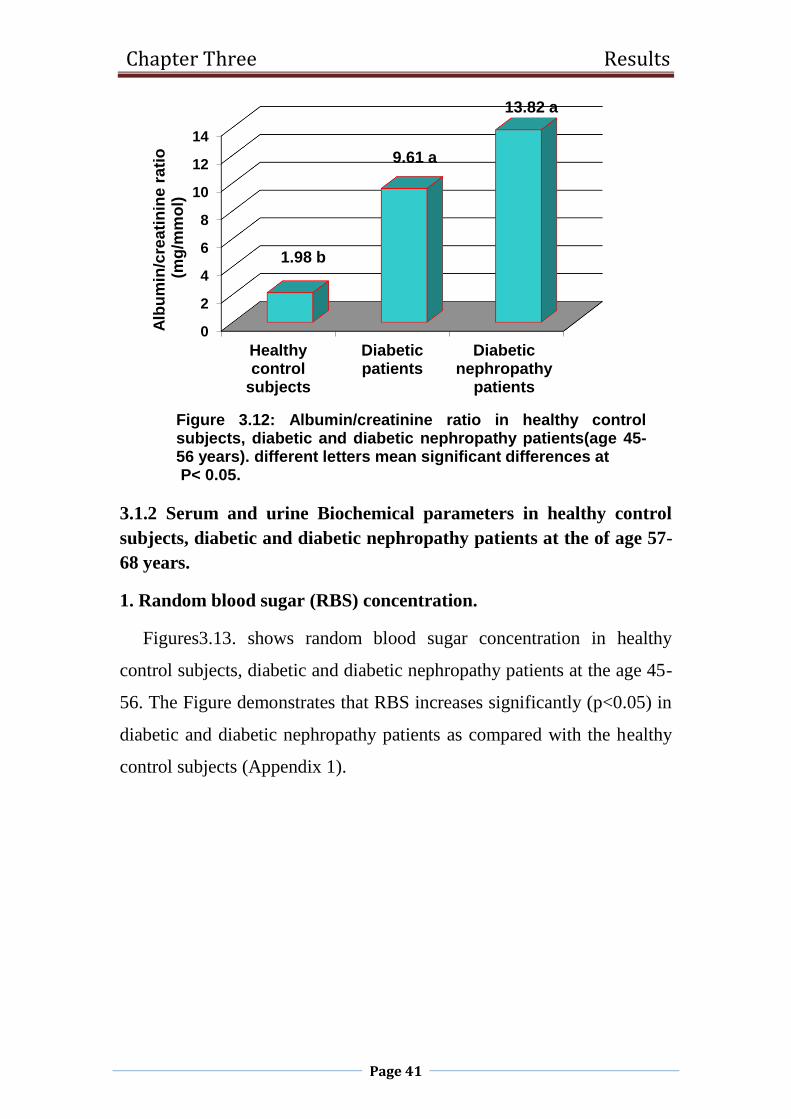
Chapter Three Results
Page 41
3.1.2 Serum and urine Biochemical parameters in healthy control
subjects, diabetic and diabetic nephropathy patients at the of age 57-
68 years.
1. Random blood sugar (RBS) concentration.
Figures3.13. shows random blood sugar concentration in healthy
control subjects, diabetic and diabetic nephropathy patients at the age 45-
56. The Figure demonstrates that RBS increases significantly (p<0.05) in
diabetic and diabetic nephropathy patients as compared with the healthy
control subjects (Appendix 1).
0
2
4
6
8
10
12
14
Healthycontrol
subjects
Diabeticpatients
Diabeticnephropathy
patients
1.98 b
9.61 a
13.82 a
Alb
um
in/c
rea
tin
ine
ra
tio
(mg
/mm
ol)
Figure 3.12: Albumin/creatinine ratio in healthy controlsubjects, diabetic and diabetic nephropathy patients(age 45-56 years). different letters mean significant differences atP< 0.05.
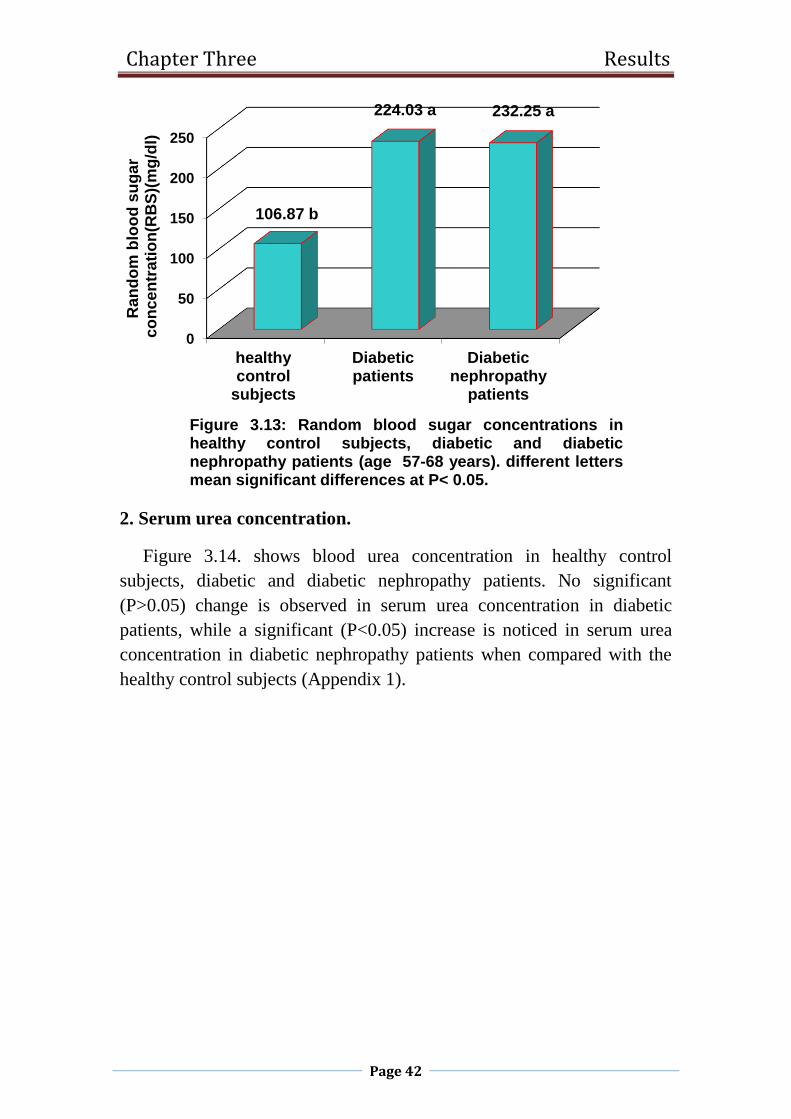
Chapter Three Results
Page 42
2. Serum urea concentration.
Figure 3.14. shows blood urea concentration in healthy control
subjects, diabetic and diabetic nephropathy patients. No significant
(P>0.05) change is observed in serum urea concentration in diabetic
patients, while a significant (P<0.05) increase is noticed in serum urea
concentration in diabetic nephropathy patients when compared with the
healthy control subjects (Appendix 1).
0
50
100
150
200
250
healthycontrol
subjects
Diabeticpatients
Diabeticnephropathy
patients
106.87 b
224.03 a 232.25 a
Ran
do
m b
loo
d s
ug
ar
co
nce
ntr
ati
on
(RB
S)(
mg
/dl)
Figure 3.13: Random blood sugar concentrations inhealthy control subjects, diabetic and diabeticnephropathy patients (age 57-68 years). different lettersmean significant differences at P< 0.05.

Chapter Three Results
Page 43
3. Serum creatinine concentration.
The results of serum creatinine concentrations in healthy control
subjects, diabetic and diabetic nephropathy patients are shown in Figure
3.15. No change is observed in serum creatinine concentration in diabetic
patients, where as in diabetic nephropathy patients, serum creatinine
concentration shows a significant (p<0.05) increase when compared with
the healthy control subjects (Appendix 1).
0
10
20
30
40
50
60
Healthy controlsubjects
Diabeticpatients Diabeticnephropathy
patients
34.14 b 34.09 b
58.83 as
eru
m u
rea
c
on
ce
ntr
ati
on
(m
g/d
l)
Figure 3.14: serum urea concentrations in healthy controlsubjects, diabetic and diabetic nephropathy patients (age57-68 years). different letters mean significant differencesat P< 0.05.
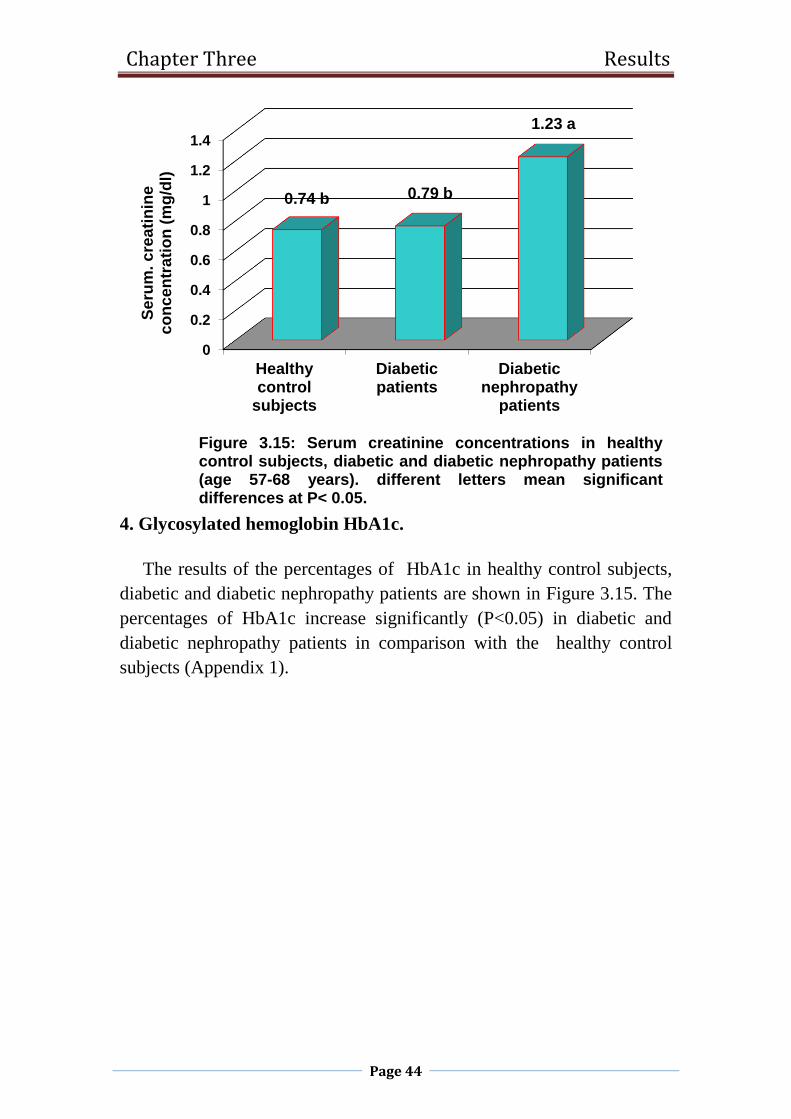
Chapter Three Results
Page 44
4. Glycosylated hemoglobin HbA1c.
The results of the percentages of HbA1c in healthy control subjects,
diabetic and diabetic nephropathy patients are shown in Figure 3.15. The
percentages of HbA1c increase significantly (P<0.05) in diabetic and
diabetic nephropathy patients in comparison with the healthy control
subjects (Appendix 1).
0
0.2
0.4
0.6
0.8
1
1.2
1.4
Healthycontrol
subjects
Diabeticpatients
Diabeticnephropathy
patients
0.74 b 0.79 b
1.23 a
Se
rum
. c
rea
tin
ine
c
on
ce
ntr
ati
on
(m
g/d
l)
Figure 3.15: Serum creatinine concentrations in healthycontrol subjects, diabetic and diabetic nephropathy patients(age 57-68 years). different letters mean significantdifferences at P< 0.05.
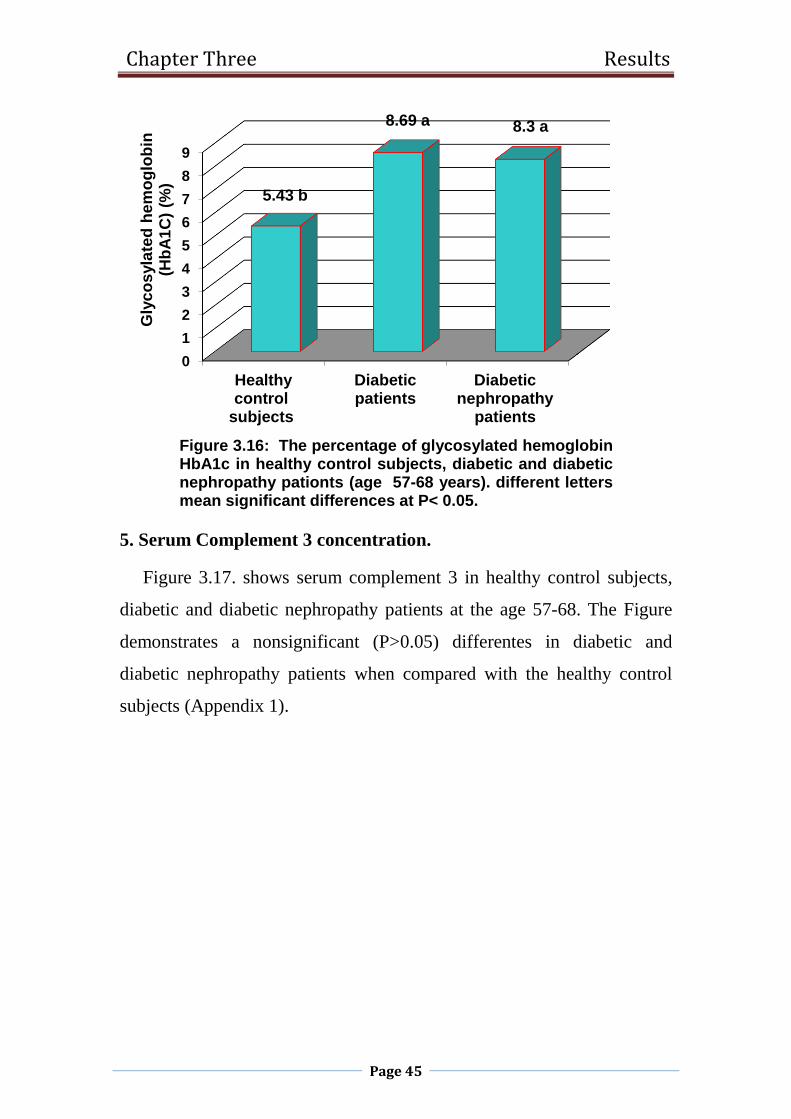
Chapter Three Results
Page 45
5. Serum Complement 3 concentration.
Figure 3.17. shows serum complement 3 in healthy control subjects,
diabetic and diabetic nephropathy patients at the age 57-68. The Figure
demonstrates a nonsignificant (P>0.05) differentes in diabetic and
diabetic nephropathy patients when compared with the healthy control
subjects (Appendix 1).
0
1
2
3
4
5
6
7
8
9
Healthycontrol
subjects
Diabeticpatients
Diabeticnephropathy
patients
5.43 b
8.69 a 8.3 aG
lyc
os
yla
ted
he
mo
glo
bin
(Hb
A1
C)
(%)
Figure 3.16: The percentage of glycosylated hemoglobinHbA1c in healthy control subjects, diabetic and diabeticnephropathy pationts (age 57-68 years). different lettersmean significant differences at P< 0.05.
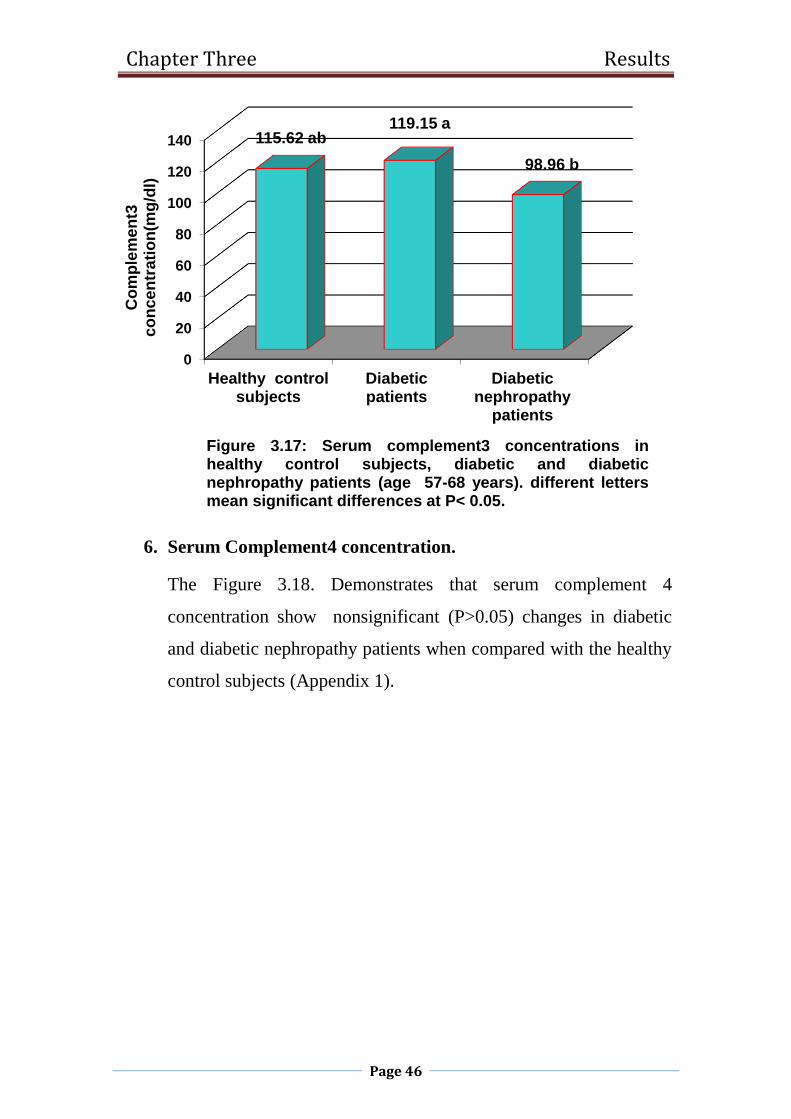
Chapter Three Results
Page 46
6. Serum Complement4 concentration.
The Figure 3.18. Demonstrates that serum complement 4
concentration show nonsignificant (P>0.05) changes in diabetic
and diabetic nephropathy patients when compared with the healthy
control subjects (Appendix 1).
0
20
40
60
80
100
120
140
Healthy controlsubjects
Diabeticpatients
Diabeticnephropathy
patients
115.62 ab119.15 a
98.96 b
Co
mp
lem
en
t3
co
nc
en
tra
tio
n(m
g/d
l)
Figure 3.17: Serum complement3 concentrations inhealthy control subjects, diabetic and diabeticnephropathy patients (age 57-68 years). different lettersmean significant differences at P< 0.05.

Chapter Three Results
Page 47
7. Serum malondialdehyde (MDA) concentration.
Figure 3.19. shows nonsignificant (p>0.05) changes in serum
malondialdehyde concentration in diabetic and diabetic nephropathy
patients as compared with the healthy control subjects (Appendix 1).
0
5
10
15
20
25
30
35
Healthycontrol
subjects
Diabeticpatients
Diabeticnephropathy
patients
23.15 a
32.83 a
24.01 aC
om
ple
me
nt4
co
nce
ntr
ati
on
(mg
/dl)
Figure 3.18. Serum complement 4 concentration inhealthy control subjects, diabetic and diabeticnephropathy patients (age 57-68 years). similar lettersmean nonsignificant(P>0.05) differences.
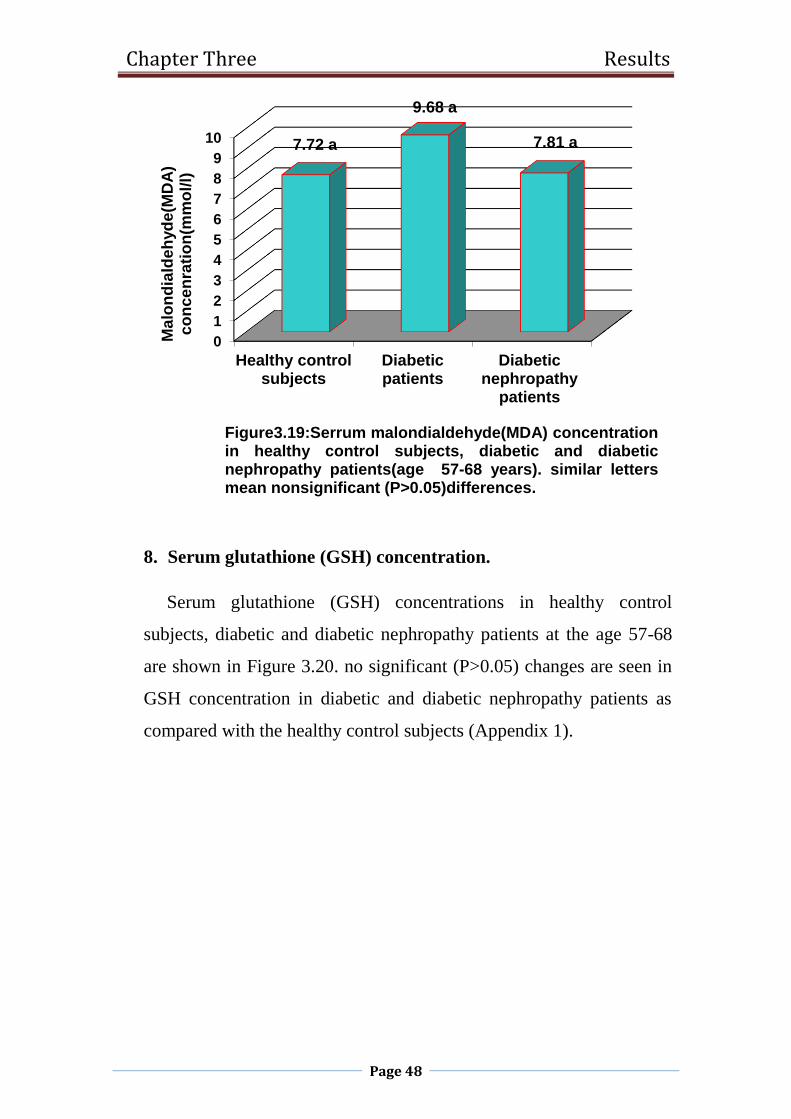
Chapter Three Results
Page 48
8. Serum glutathione (GSH) concentration.
Serum glutathione (GSH) concentrations in healthy control
subjects, diabetic and diabetic nephropathy patients at the age 57-68
are shown in Figure 3.20. no significant (P>0.05) changes are seen in
GSH concentration in diabetic and diabetic nephropathy patients as
compared with the healthy control subjects (Appendix 1).
0
1
2
3
4
5
6
7
8
9
10
Healthy controlsubjects
Diabeticpatients
Diabeticnephropathy
patients
7.72 a
9.68 a
7.81 a
Ma
lon
dia
lde
hyd
e(M
DA
) c
on
ce
nra
tio
n(m
mo
l/l)
Figure3.19:Serrum malondialdehyde(MDA) concentrationin healthy control subjects, diabetic and diabeticnephropathy patients(age 57-68 years). similar lettersmean nonsignificant (P>0.05)differences.
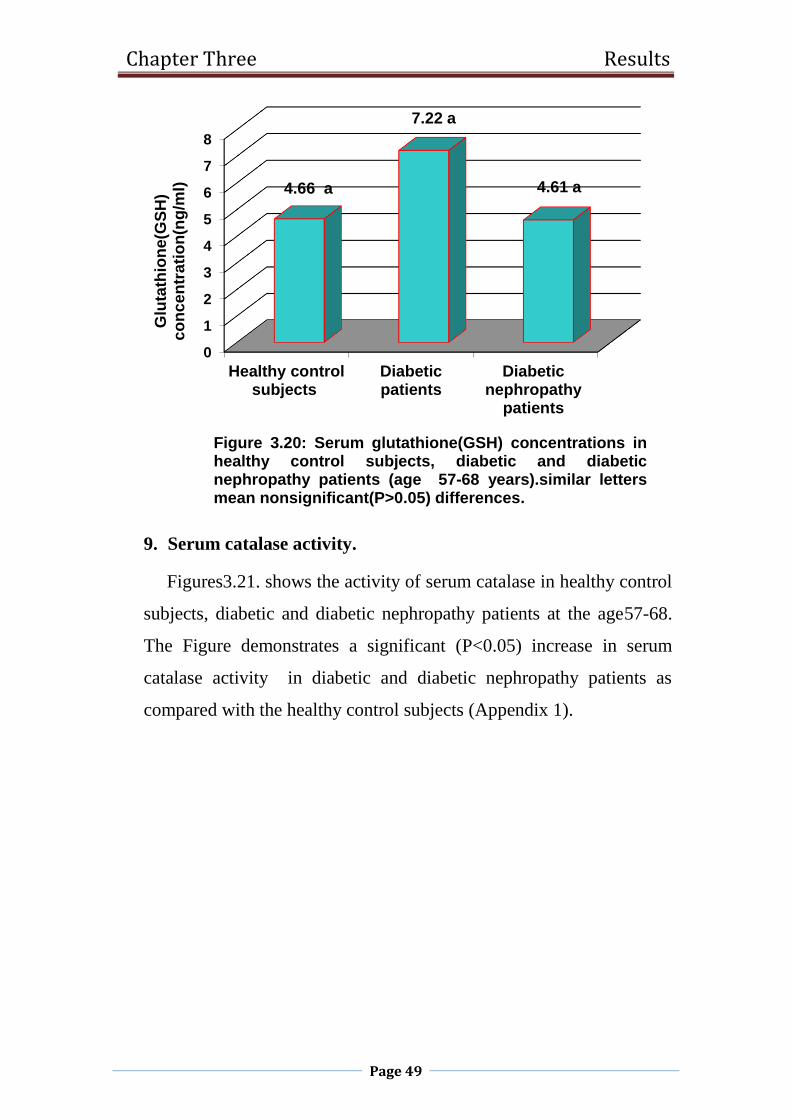
Chapter Three Results
Page 49
9. Serum catalase activity.
Figures3.21. shows the activity of serum catalase in healthy control
subjects, diabetic and diabetic nephropathy patients at the age57-68.
The Figure demonstrates a significant (P<0.05) increase in serum
catalase activity in diabetic and diabetic nephropathy patients as
compared with the healthy control subjects (Appendix 1).
0
1
2
3
4
5
6
7
8
Healthy controlsubjects
Diabeticpatients
Diabeticnephropathy
patients
4.66 a
7.22 a
4.61 a
Glu
tath
ion
e(G
SH
) c
on
ce
ntr
ati
on
(ng
/ml)
Figure 3.20: Serum glutathione(GSH) concentrations inhealthy control subjects, diabetic and diabeticnephropathy patients (age 57-68 years).similar lettersmean nonsignificant(P>0.05) differences.
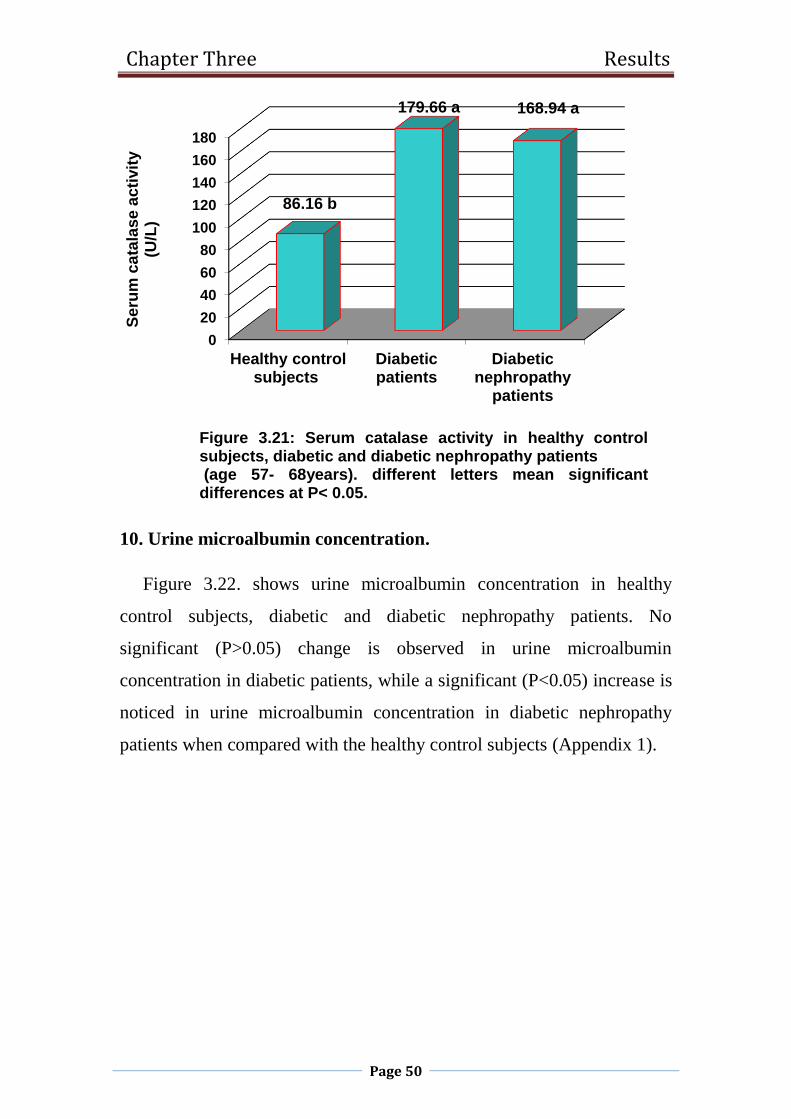
Chapter Three Results
Page 50
10. Urine microalbumin concentration.
Figure 3.22. shows urine microalbumin concentration in healthy
control subjects, diabetic and diabetic nephropathy patients. No
significant (P>0.05) change is observed in urine microalbumin
concentration in diabetic patients, while a significant (P<0.05) increase is
noticed in urine microalbumin concentration in diabetic nephropathy
patients when compared with the healthy control subjects (Appendix 1).
0
20
40
60
80
100
120
140
160
180
Healthy controlsubjects
Diabeticpatients
Diabeticnephropathy
patients
86.16 b
179.66 a 168.94 a
Se
rum
ca
tala
se
ac
tivit
y(U
/L)
Figure 3.21: Serum catalase activity in healthy controlsubjects, diabetic and diabetic nephropathy patients(age 57- 68years). different letters mean significant
differences at P< 0.05.
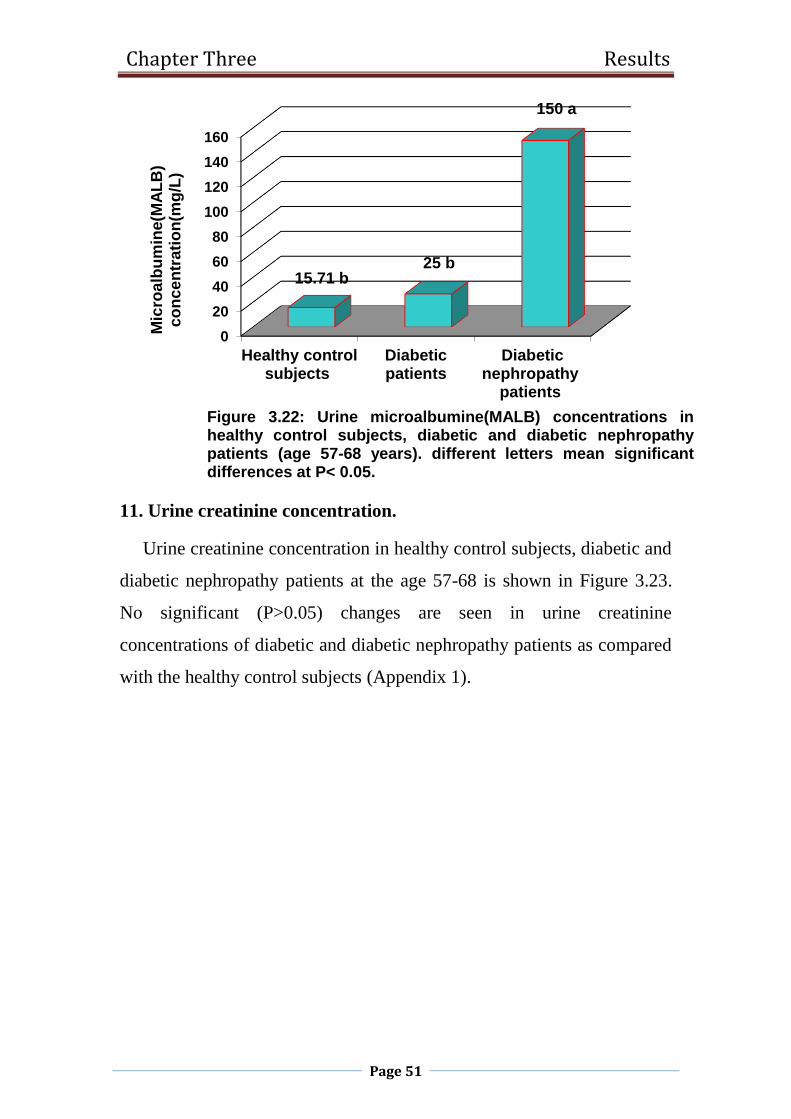
Chapter Three Results
Page 51
11. Urine creatinine concentration.
Urine creatinine concentration in healthy control subjects, diabetic and
diabetic nephropathy patients at the age 57-68 is shown in Figure 3.23.
No significant (P>0.05) changes are seen in urine creatinine
concentrations of diabetic and diabetic nephropathy patients as compared
with the healthy control subjects (Appendix 1).
0
20
40
60
80
100
120
140
160
Healthy controlsubjects
Diabeticpatients
Diabeticnephropathy
patients
15.71 b25 b
150 a
Mic
roa
lbu
min
e(M
AL
B)
co
nc
en
tra
tio
n(m
g/L
)
Figure 3.22: Urine microalbumine(MALB) concentrations inhealthy control subjects, diabetic and diabetic nephropathypatients (age 57-68 years). different letters mean significantdifferences at P< 0.05.
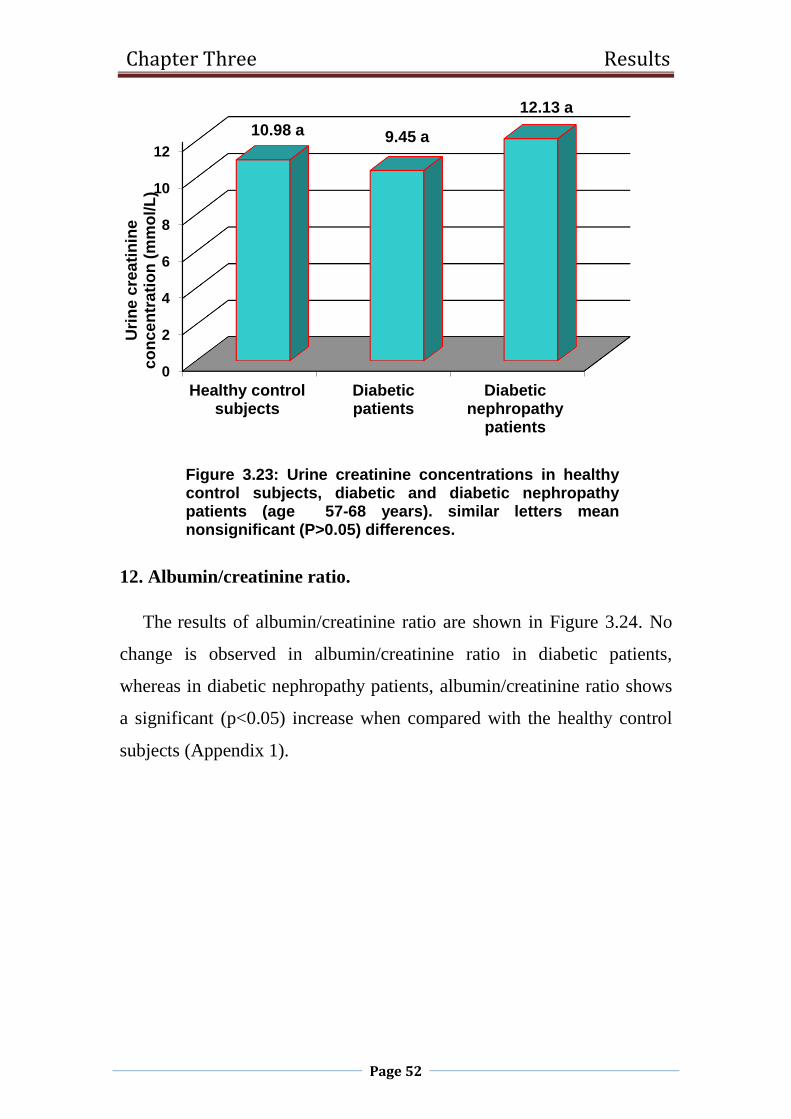
Chapter Three Results
Page 52
12. Albumin/creatinine ratio.
The results of albumin/creatinine ratio are shown in Figure 3.24. No
change is observed in albumin/creatinine ratio in diabetic patients,
whereas in diabetic nephropathy patients, albumin/creatinine ratio shows
a significant (p<0.05) increase when compared with the healthy control
subjects (Appendix 1).
0
2
4
6
8
10
12
Healthy controlsubjects
Diabeticpatients
Diabeticnephropathy
patients
10.98 a 9.45 a
12.13 a
Uri
ne
cre
ati
nin
e
co
nce
ntr
ati
on
(m
mo
l/L
)
Figure 3.23: Urine creatinine concentrations in healthycontrol subjects, diabetic and diabetic nephropathypatients (age 57-68 years). similar letters meannonsignificant (P>0.05) differences.

Chapter Three Results
Page 53
3.1.3 Serum and urine Biochemical parameters in healthy control
subjects, diabetic and diabetic nephropathy patients at the age 69-80
years.
1. Random blood sugar concentration.
Figures3.25 shows random blood sugar concentration in healthy
control subjects, diabetic and diabetic nephropathy patients at the age 69-
80. The Figure demonstrates that RBS increases significantly (p<0.05) in
diabetic and diabetic nephropathy patients as compared with the healthy
control subjects (Appendix 1).
0
5
10
15
20
25
30
Healthycontrol
subjects
Diabeticpatients
Diabeticnephropathy
patients
7.21 b6.34 b
26.62 aA
lbu
min
/Cre
ati
nin
e r
ati
o(m
g/m
mo
l)
Figure 3.24: Albumin/Creatinine ratio in healthy controlsubjects, diabetic and diabetic nephropathy patients (age57-68 years). different letters mean significant differencesat P< 0.05.

Chapter Three Results
Page 54
2. Serum urea concentration.
The results of serum urea concentrations are shown in Figure 3.26. No
change is observed in serum urea concentration in diabetic patients,
whereas in diabetic nephropathy patients, serum urea concentration
shows a significant (p<0.05) increase when compared with the healthy
control subjects (Appendix 1).
0
50
100
150
200
250
Healthycontrol
subjects
Diabeticpatients
Diabeticnephropathy
patients
105.62 b
150.65 a
217.68 a
Ran
do
m b
loo
d s
ug
ar
(RB
S)
co
nce
ntr
ati
on
(mg
/dl)
Figure 3.25: Random blood sugar (RBS) concentrationsin healthy control subjects, diabetic and diabeticnephropathy patients (age 69-80 years). different lettermean significant differences at P< 0.05.
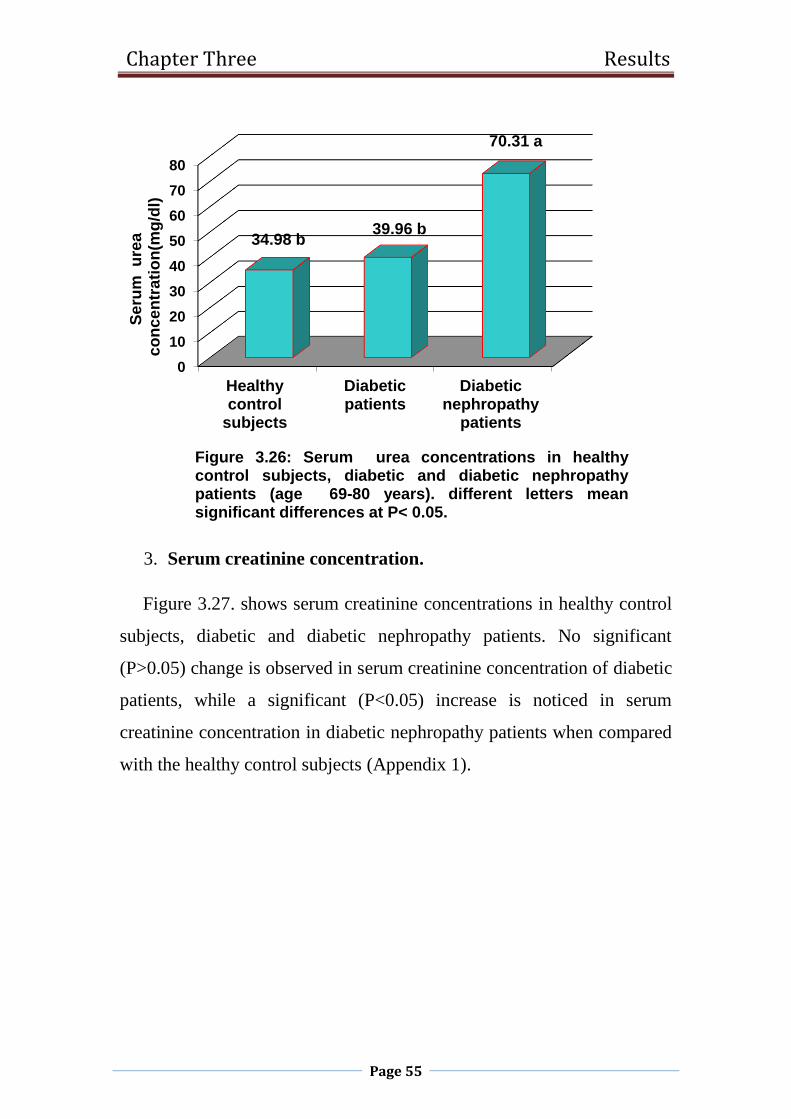
Chapter Three Results
Page 55
3. Serum creatinine concentration.
Figure 3.27. shows serum creatinine concentrations in healthy control
subjects, diabetic and diabetic nephropathy patients. No significant
(P>0.05) change is observed in serum creatinine concentration of diabetic
patients, while a significant (P<0.05) increase is noticed in serum
creatinine concentration in diabetic nephropathy patients when compared
with the healthy control subjects (Appendix 1).
0
10
20
30
40
50
60
70
80
Healthycontrol
subjects
Diabeticpatients
Diabeticnephropathy
patients
34.98 b39.96 b
70.31 aS
eru
m u
rea
co
nce
ntr
ati
on
(mg
/dl)
Figure 3.26: Serum urea concentrations in healthycontrol subjects, diabetic and diabetic nephropathypatients (age 69-80 years). different letters meansignificant differences at P< 0.05.
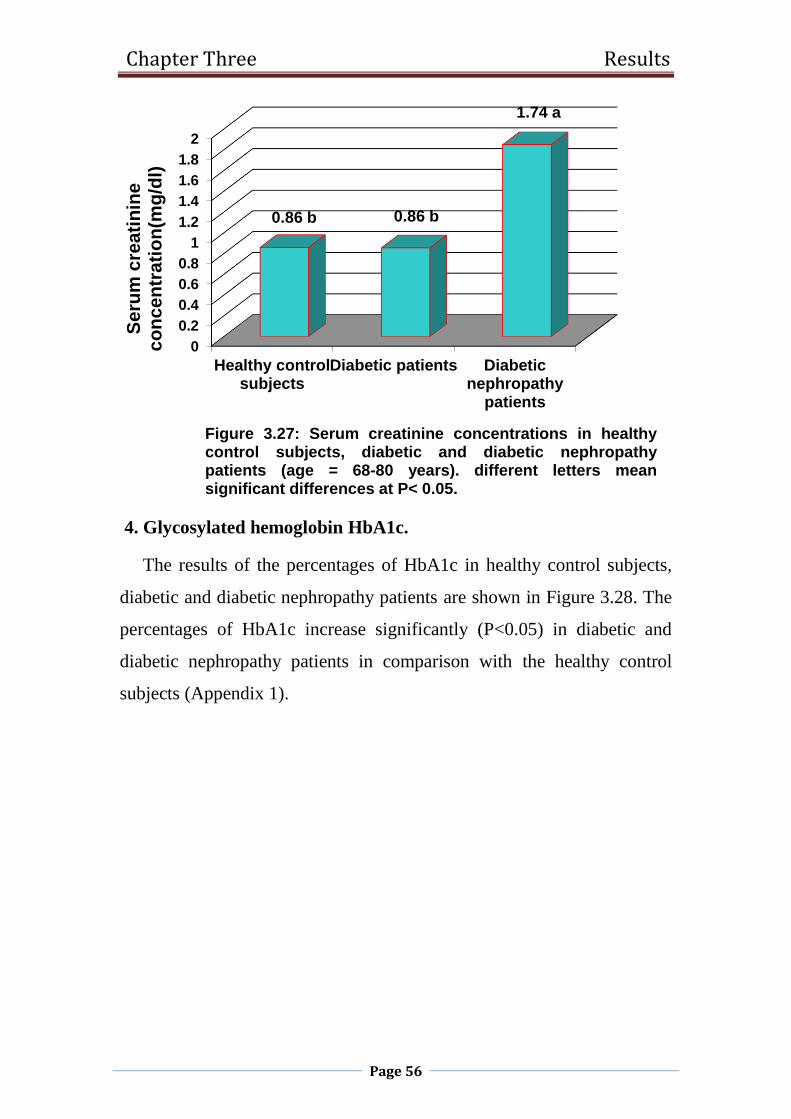
Chapter Three Results
Page 56
4. Glycosylated hemoglobin HbA1c.
The results of the percentages of HbA1c in healthy control subjects,
diabetic and diabetic nephropathy patients are shown in Figure 3.28. The
percentages of HbA1c increase significantly (P<0.05) in diabetic and
diabetic nephropathy patients in comparison with the healthy control
subjects (Appendix 1).
0
0.2
0.4
0.6
0.8
1
1.2
1.4
1.6
1.8
2
Healthy controlsubjects
Diabetic patients Diabeticnephropathy
patients
0.86 b 0.86 b
1.74 a
Se
rum
cre
ati
nin
e
co
nc
en
tra
tio
n(m
g/d
l)
Figure 3.27: Serum creatinine concentrations in healthycontrol subjects, diabetic and diabetic nephropathypatients (age = 68-80 years). different letters meansignificant differences at P< 0.05.
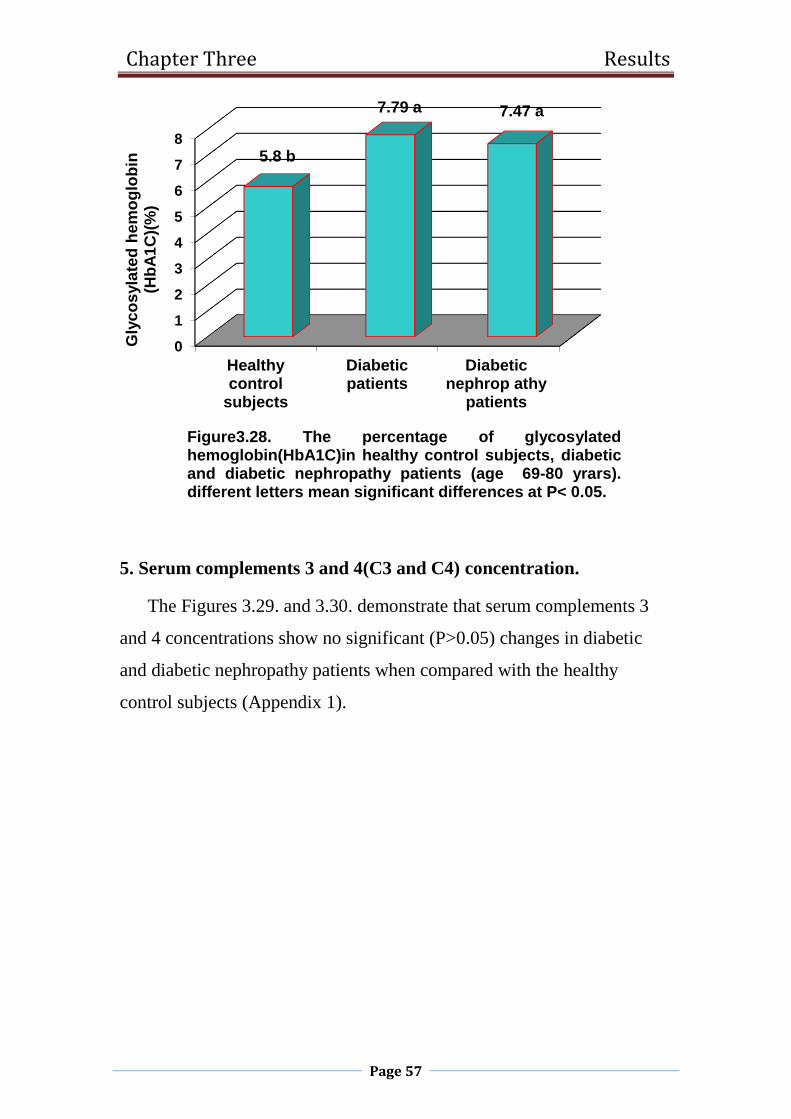
Chapter Three Results
Page 57
5. Serum complements 3 and 4(C3 and C4) concentration.
The Figures 3.29. and 3.30. demonstrate that serum complements 3
and 4 concentrations show no significant (P>0.05) changes in diabetic
and diabetic nephropathy patients when compared with the healthy
control subjects (Appendix 1).
0
1
2
3
4
5
6
7
8
Healthycontrol
subjects
Diabeticpatients
Diabeticnephrop athy
patients
5.8 b
7.79 a 7.47 a
Gly
co
syla
ted
he
mo
glo
bin
(Hb
A1
C)(
%)
Figure3.28. The percentage of glycosylatedhemoglobin(HbA1C)in healthy control subjects, diabeticand diabetic nephropathy patients (age 69-80 yrars).different letters mean significant differences at P< 0.05.
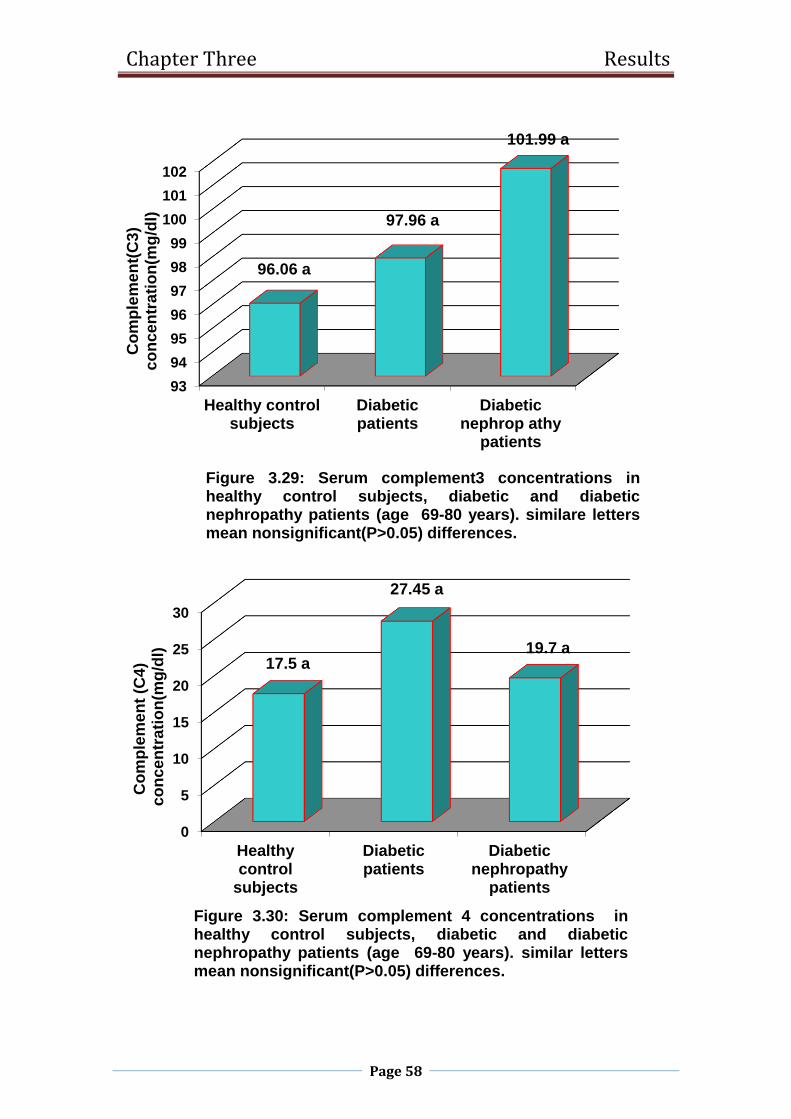
Chapter Three Results
Page 58
93
94
95
96
97
98
99
100
101
102
Healthy controlsubjects
Diabeticpatients
Diabeticnephrop athy
patients
96.06 a
97.96 a
101.99 aC
om
ple
me
nt(
C3
) c
on
ce
ntr
ati
on
(mg
/dl)
Figure 3.29: Serum complement3 concentrations inhealthy control subjects, diabetic and diabeticnephropathy patients (age 69-80 years). similare lettersmean nonsignificant(P>0.05) differences.
0
5
10
15
20
25
30
Healthycontrol
subjects
Diabeticpatients
Diabeticnephropathy
patients
17.5 a
27.45 a
19.7 a
Co
mp
lem
en
t (C
4)
co
nc
en
tra
tio
n(m
g/d
l)
Figure 3.30: Serum complement 4 concentrations inhealthy control subjects, diabetic and diabeticnephropathy patients (age 69-80 years). similar lettersmean nonsignificant(P>0.05) differences.

Chapter Three Results
Page 59
6. Serum malondialdehyde (MDA) concentration.
Figure 3.31. shows serum malondialdehyde concentrations in healthy
control subjects, diabetic and diabetic nephropathy patients at the age 68-
80. The Figure demonstrates that serum MDA concentration decrease
significantly (P<0.05) in diabetic and diabetic nephropathy patients as
compared with the healthy control subjects (Appendix 1).
7. Serum glutathione (GSH) concentration.
The results of serum glutathione (GSH) concentrations are shown in
Figure 3.32. serum GSH concentrations decrease significantly (P<0.05)
in diabetic and diabetic nephropathy patients as compared with the
healthy control subjects (Appendix 1).
0
2
4
6
8
10
12
14
16
Healthycontrol
subjects
Diabeticpatients
Diabeticnephropathy
patients
14.5 a
5.03 b
7.84 b
Ma
lon
dia
lde
hyd
e(M
DA
) c
on
ce
ntr
ati
on
(mm
ol/
l)
Figure3.31:Serummalondialdehyde(MDA) concentrationsin healthy control, diabetic and diabetic nephropathypatients (age 69-80 years). different letters meansignificant differences at P< 0.05.

Chapter Three Results
Page 60
8. Serum catalase activity.
Figure 3.33 shows no significant (p>0.05) change in the activity of
serum catalase in diabetic and diabetic nephropathy patients as
compared with the healthy control subjects (Appendix 1).
0
1
2
3
4
5
6
7
8
9
10
Healthycontrol
subjects
Diabeticpatients
Diabeticnephropathy
patients
9.62 a
5.12 b
4.25 b
Glu
tath
ion
e(G
SH
) c
on
ce
ntr
ati
on
(ng
/ml)
Figure 3.32: Serum glutathione(GSH) concentrations inhealthy control subjects, diabetic and diabeticnephropathy patients (age 69-80 years). different lettersmean significant differences at P< 0.05.
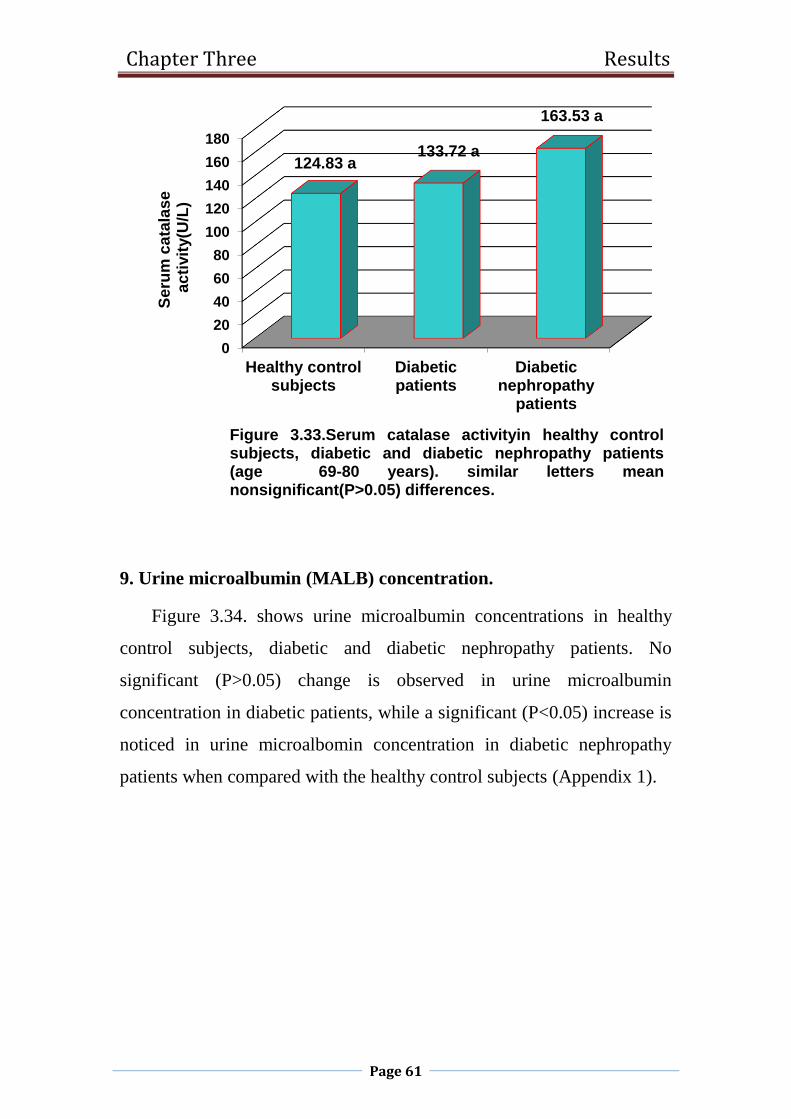
Chapter Three Results
Page 61
9. Urine microalbumin (MALB) concentration.
Figure 3.34. shows urine microalbumin concentrations in healthy
control subjects, diabetic and diabetic nephropathy patients. No
significant (P>0.05) change is observed in urine microalbumin
concentration in diabetic patients, while a significant (P<0.05) increase is
noticed in urine microalbomin concentration in diabetic nephropathy
patients when compared with the healthy control subjects (Appendix 1).
0
20
40
60
80
100
120
140
160
180
Healthy controlsubjects
Diabeticpatients
Diabeticnephropathy
patients
124.83 a133.72 a
163.53 a
Se
rum
ca
tala
se
ac
tivit
y(U
/L)
Figure 3.33.Serum catalase activityin healthy controlsubjects, diabetic and diabetic nephropathy patients(age 69-80 years). similar letters meannonsignificant(P>0.05) differences.
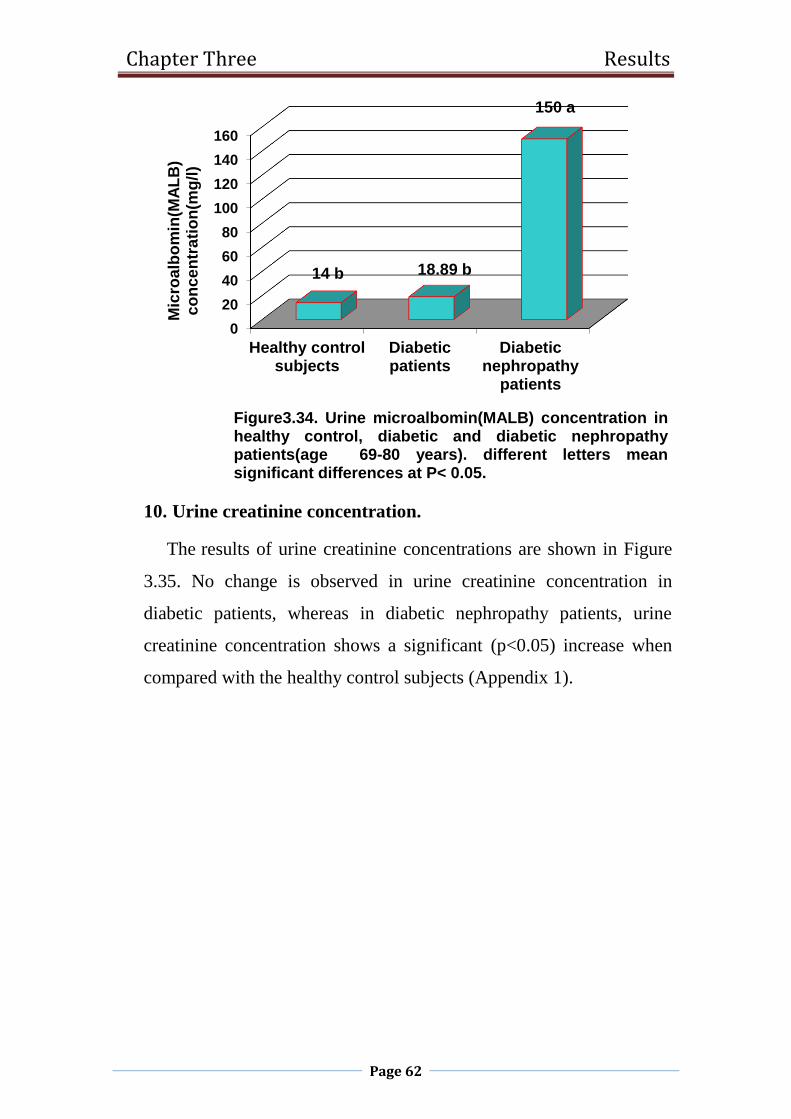
Chapter Three Results
Page 62
10. Urine creatinine concentration.
The results of urine creatinine concentrations are shown in Figure
3.35. No change is observed in urine creatinine concentration in
diabetic patients, whereas in diabetic nephropathy patients, urine
creatinine concentration shows a significant (p<0.05) increase when
compared with the healthy control subjects (Appendix 1).
0
20
40
60
80
100
120
140
160
Healthy controlsubjects
Diabeticpatients
Diabeticnephropathy
patients
14 b 18.89 b
150 a
Mic
roa
lbo
min
(MA
LB
)c
on
ce
ntr
ati
on
(mg
/l)
Figure3.34. Urine microalbomin(MALB) concentration inhealthy control, diabetic and diabetic nephropathypatients(age 69-80 years). different letters meansignificant differences at P< 0.05.

Chapter Three Results
Page 63
11. Albumin/creatinine ratio.
The results concerning albomin/creatinine ratio in Figure 3.36. reveals
a significant (P< 0.05)increase in diabetic nephropathy patients as
compared with healthy control subjects. In diabetic patients,
Albumin/Creatinine ratio demonstrates no significant (P>0.05) change in
comparison with the healthy control subjects (Appendix 1).
0
2
4
6
8
10
12
14
16
18
Healthy controlsubjects
Diabeticpatients
Diabeticnephropathy
patients
7.04 b
12.85 ab
17.66 a
Uri
ne
cre
ati
nin
ec
on
ce
ntr
ati
on
(mm
ol/
L)
Figure 3.35: Urine creatinine concentrations in healthycontrol subjects, diabetic and diabetic nephropathypatient(age 69-80 years). different letters meansignificant differences at P< 0.05.
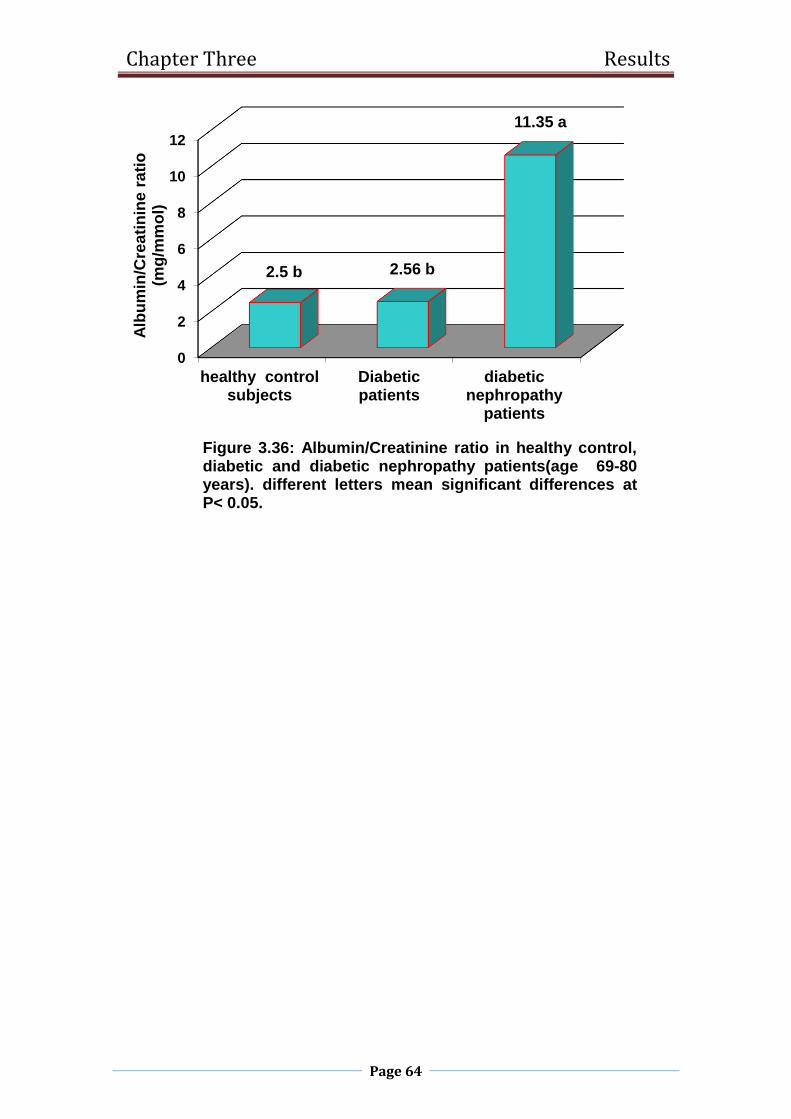
Chapter Three Results
Page 64
0
2
4
6
8
10
12
healthy controlsubjects
Diabeticpatients
diabeticnephropathy
patients
2.5 b 2.56 b
11.35 aA
lbu
min
/Cre
ati
nin
e r
ati
o(m
g/m
mo
l)
Figure 3.36: Albumin/Creatinine ratio in healthy control,diabetic and diabetic nephropathy patients(age 69-80years). different letters mean significant differences atP< 0.05.

Chapter three discussion
Page 65
3.2 Discussion.
3.2.1Random blood sugar.
The results of the present study showed an in increase in random blood
sugar in diabetic and diabetic nephropathy patients at the ages of 45-80
years. Similar results were obtained in diabetic (Deepa et al., 2011; Singh
et al., 2014; Kanwar et al., 2015; Bamanikar et al., 2016) and diabetic
nephropathy patients (Ahmed et al., 2010; Usman et al., 2012).
Hyperglycemia results from defects in insulin secretion and insulin action
or both. Type 2 diabetes mellitus is characterized by insulin resistance in
peripheral tissue and a defect in insulin secretion from the beta cell of the
pancreas (Garber, 2000). The chronic hyperglycemia associated with
diabetes mellitus is due to derangement in carbohydrate, fat, and protein
metabolism (Kanwar et al., 2015). It can increase oxidative stress which
has been considered to be a pathogenic factor of diabetic complications
including nephropathy (Kumawat et al., 2013).
3.2.2 Serum urea:
No change was observed in serum urea concentration in diabetic
patients, whereas an increase was demonstrated in diabetic nephropathy
patients at the ages of 45-80 years. Bamanikar et al. (2016) demonstrated
that out of 100 diabetic samples, 18 had high urea level. They showed
that poorly controlled blood sugar levels would cause increase in serum
urea levels thus increasing the chances of the patient suffering from
diabetic nephropathy. The duration and severity of diabetes strongly
correlate with serum urea levels (Bamanikar et al., 2016). The increase in
serum urea concentration in diabetic nephropathy patients in the current
study is in accordance with other studies (Ahmed et al., 2010; Singh et
al., 2014; Kanwar et al.,2015). Bamanikar et al.(2016) reported that an
Chapter three discussion
Page 66
increase in urea level is observed when there is damage to the kidney, and
the increase in blood urea level in the presence of hyperglycemia in
diabetic patients indicates damage to the kidney.
3.2.3Serum creatinine:
The findings of the current study indicated no change in serum
creatinine concentrations in diabetic patients at the ages of 45-80 years
and in diabetic nephropathy patients at the age of 45-56 years. Serum
creatinine concentrations increased significantly in diabetic nephropathy
patients at the ages of 57-80 years. Creatinine is a waste product in the
blood formed by the normal breakdown of muscles cells during activity,
and the healthy kidneys filters creatinine out of the blood into the urine
(Usman et al., 2012). When kidneys are not functioning well, creatinine
levels build up in the blood, since creatinine is an indicator of normal
functioning of the kidney and its increase in the blood indicates kidney
dysfunction (Kamal, 2014). Anjaneyulu and Chopra (2004) reported that
the increase in serum creatinine in diabetic rats indicated progressive
renal damage.
3.2.4 Glycosylated hemoglobin:
The results obtained from this study revealed that the percentages of
glycosylated hemoglobin increased in diabetic and diabetic nephropathy
patients at the ages of 45-80 years. These findings seem to agree with
Rani et al. (2016) who observed a significant increase in glycosylated
hemoglobin (%) in complicated and non-complicated patients with
nephropathy. Carbohydrates such as glucose is known to bind non-
enzymatically to proteins such as hemoglobin in a process called
glycosylation (glycation) (Varashree and Gopalakrishna, 2011).
Glycosylated hemoglobin is formed by non-enzymatic, substrate-
Chapter three discussion
Page 67
concentration dependent irreversible process of combination of aldehyde
group of glucose with the amino-terminal valine of the β- chain of
hemoglobin (Chandalia and Krishnaswamy, 2002). The formation of
glycosylated hemoglobin is dependent on glucose concentration, and the
individuals with hyperglycemia will have higher levels of glycosylated
hemoglobin (Gabby et al., 1979).
3.2.5 Serum complements 3 and 4:
No changes were seen in serum complements 3 and 4 concentrations
in diabetic and diabetic nephropathy patients of all age groups with the
exception of serum complement 3 concentration at the age of 57-68 years
which showed a decrease. Conflicting results were reported in the
literature concerning the role of complement in diabetes mellitus.
Nikolova et al. (2004) found that serum complements 3 and 4 levels were
within the normal range in diabetic nephropathy patients. On the contrary,
Dezayee and Alnakshabandi (2011) demonstrated an increase in serum
complement 3 in type 2 diabetic patients with a decrease in serum
complement 4 as compared with the healthy subjects. On the other hand,
there is evidence that complement may be involved in susceptibility to
and progression of diabetic nephropathy (Fearn and sheerin, 2015).
3.2.6 Serum malondialdehyde:
In the present study, no changes were observed in serum
malondialdehyde concentrations in diabetic and diabetic nephropathy
patients at the age of 45-68 years, whereas a decrease in serum
malondialdehyde concentration was noticed in diabetic and diabetic
nephropathy patients at the ages of 69-80 years. Human body possesses
natural antioxidants to control the level of reactive oxygen species by
scavenging them both enzymatically and non-enzymetically (Matough et
Chapter three discussion
Page 68
al., 2012). In addition to the naturally occurring antioxidants, the
antioxidant activity of drugs may play a role in ameliorating the oxidative
stress induced renal damage during diabetes (Agarwal et al; 2015) and
good glycemic control could be supportive and beneficial in reducing
effects caused by oxidative stress ( Jabeen et al., 2013).
3.2.7 Serum glutathione:
Serum glutathione concentrations show nonsignificant changes in
diabetic and diabetic nephropathy patients at the ages of 57-68 years. At
the age of 69-80 years, serum glutathione concentration decreased in
diabetic and diabetic nephropathy patients. Glutathione level has been
shown to decrease in type 2 diabetes mellitus (Dongre and Meshram,
2015) with and without nephropathy (Kumawat et al., 2013). Glutathione
can maintain SH groups of protein, detoxify foreign radicals and also act
as coenzyme in several enzymatic reactions (Tsai et al., 2012). The
decrease in the glutathione level and glutathione peroxidase activity was
correlated with glutathione reductase activity in diabetic nephropathy (
Kumawat et al., 2013). Glutathione peroxidase catalyzes the reduction of
lipid peroxides at the expense of glutathione. H2O2 is inactivated by
glutathione peroxidase resulting in consumption of glutathione
(Waggiallah and Alzohairy, 2011). The oxidized glutathione is reduced to
two molecules of glutathione by glutathione reductase.
3.2.8 Serum catalase activity:
The results of the current study demonstrated an increase in serum
catalase activity in diabetic and diabetic nephropathy patients at the ages
of 45-80 years. These results are in agreement with those obtained by
others in type 2 diabetes mellitus with or without nephropathy (Kumawat
et al., 2013 ; Jabeen et al., 2013; Goicheva et al., 2014). On the contrary,
Chapter three discussion
Page 69
Ezeiruaku et al. (2016) reported that the mean plasma catalase activity
decreased in type 2 diabetics. Kedziora-Kornatowska et al. (1998) found
lower catalase activities in erythrocytes of non-insulin dependent diabetes
mellitus patients with or without nephropathy. Catalase acts as main
regulator of hydrogen peroxide metabolism. It catalyzes the
decomposition of hydrogen peroxide to water and oxygen (Jabeen et al.,
2013). The reason for increased catalase activity can be linked to a
secondary compensatory activation of the enzyme ( Goicheva et al.,
2014).
3.2.9 Urine microalbumin:
The present study revealed no change in urine microalbumin
concentration in diabetic patients, while an increase was seen in diabetic
nephropathy patients. The microalbuminuria levels were shown to be
higher in complicated cases (Rani et al., 2016). The development of
vascular complications in diabetes correlates with the intensity of
hyperglycemia, and the high intracellular glucose concentration has been
suggested to be a prerequisite for the development of structural and
functional changes in the kidney ( Kumawat et al., 2013). Diabetic
nephropathy is characterized by proteinuria, reduced glomerular filtration
rate, podocyte injury, mesangial matrix accumulation and
tubulointerstitial damage (Wolf, 2004). Therefore, The cause of increased
in microalbuminuria may be attributed to a defect in the glomerulare
membrane filtration.
3.2.10 Urine creatinine:
The results of the present study showed no changes in urine creatinine
concentrations in diabetic and diabetic nephropathy patients, with the
exception of diabetic patients at the age of 45-56 years which
Chapter three discussion
Page 70
demonstrated a decrease, and diabetic nephropathy patients at the age of
69-80 years which showed an increase. It is assumed that creatinine
excretion rates are fairly constant during the day, as long as the
glomerular filtration rate (GFR) remains constant (Price et al., 2005).
Differences in creatinine excretion are likely in part due to differences in
muscle mass (Mattix et al., 2002). Diabetes affects the kidney in stages,
and at the onset of diabetes, the GFR becomes disturbed (Dabla, 2010).
Creatinine is used for the determination of GFR. It is filtered by the
glomerulus , and a small amount is secreted into the glomerular filtrate by
the proximal tubule. Creatinine clearance is the rate at which creatinine is
cleared from the blood (i.e. excreted into the urine) and normal kidneys
have higher filtration rate than the affected ones in terms of kidney
disease (Bazari, 2007). Diabetic nephropathy occurs in conjunction with
hyperfiltrative period in which creatinine clearance and GFR are high
(USRDS, 2002)followed by a gradual decrease in GFR that leads to
kidney failure (Gal et al., 1997).
3.2.11 Albumin / creatinine ratio:
In the current study, an increase in albumin / creatinine ratios was seen
in diabetic patients at the age of 45-56 years, and diabetic nephropathy
patients at the age of 45-80 years. No change was observed in albumin /
creatinine ratio in diabetic patients at the ages of 57-80 years. Manjunatha
Goud et al. (2010)showed a significant increase in urine albumin /
creatinine ratio in diabetic cataract patients without nephropathy and in
diabetic cataract patients with nephropathy. The urine albumin /
creatinine ratio is commonly used as an index of albuminuria (Wang et
al., 2013). The presence of microalbuminuria in type 2 diabetic patients is
an important predictor of progressive renal failure (Manjunatha Goud et
al., 2010).

Conclusions
and
Recommendatios
Chapter four Conclusions & Recommendations
Page 71
4. Conclusions and Recommendations.
4.1 Conclusions.
In general, diabetic patients demonstrated hyperglycemia, an
increase in the percentages of glycosylated hemoglobin and catalase
activity with an associated no changes in serum complements 3 and 4,
MDA. GSH at the different age groups. With the exception of GSH,
MDA at the age group of 69-80 years which showed a decrease.
Diabetic nephropathy patients showed more profound biochemical
changes than diabetic patients as reflected by hyperglycemia, an increase
in serum urea, creatinine, the percentages of glycosylated hemoglobin,
catalase activity, urine creatinine and A/C ratio with an associated
microalbuminuria at the different age groups. Serum complements 3 and
4, MDA and GSH (with the exception of GSH, MDA at the age of 69-80
years which showed a decrease) remained unchanged.
Chapter four Conclusions & Recommendations
Page 72
4.2 Recommendations.
1. Carrying out a molecular study for diabetic nephropathy.
2. Evaluation of inflammatory markers such as IL-10, IL-17, IL18, in
diabetic nephropathy patients.
3. Study the formation of advanced glycation end products.
4. Study the immunoglobulin secretion in urine.
5. Measurement of interferon gama (INF-δ).

References
References
Page 73
-A-
Abdelsamie, S. A. , Li, Y. , Huang, Y. , Lee, M. H. , Klein, R. L. and et
al. 2011. Oxidized LDL immune complexes stimulate collagen IV
production in mesangial cells via Fc gamma receptors I and III. Clin
Immunol, 139: 258-266.
Abrass, C. K. (1984). Evaluation of the presence of circulating immune
complexes and their relationship to glomerular IgG deposits in
streptozotocin-induced diabetic rats. Clin Exp Immunol, 57: 17-24.
Ahmed, Sh. H., Abd- Ali, F. and Abdullah, M. R. 2010. Biochemical
study on diabetic nephropathy patients. Ibn Al- Haitham J. Pure Appl. Sci.,
23 (3): 152- 158.
Ayo, S. H. , Radnik, R. A. , Garoni, J. A. , Glass, W. F. and Kreisberg, J.
I. 1990. High glucose causes an increase in extracellular matrix proteins in
cultured mesangial cells. Am J Pathol 136: 1339-1348.
Ayo, S. H. , Radnik, R. A. , Glass, W. F. , Garoni, E. R. and Rampt, D.
R.1991. Appling,J. I. Kreisberg. Increased extracellular matrix synthesis and
mRNA in mesangial cells grown in high glucose medium. Am J Physiol 260:
F185-191.
Ainsworth, S. K. , Hirsch, H. Z. , Brackett, N. C. , Brissie, J. r. R. M.
and Williams, A. V. 1982. Diabetic glomerulonephropathy: histopathologic,
immunofluorescent, and ultrastructural studies of 16 cases. Hum Pathol 13:
470-478.
References
Page 74
Atchley, D.H. , Lopes-Virella, M. F. , Zheng, D. , Kenny, D. and Virella,
G. 2002. Oxidized LDL-anti-oxidized LDL immune complexes and diabetic
nephropathy. Diabetologia 45: 1562-1571
Anghileri, L. J. and Thouvenot, P. 1997. Non-transferrin-bound iron and
tumor cells. Anticancer Research, 17(4A):2529-33.
American Diabetes Association 2012. Diagnosis and Classification of
Diabetes mellitus. Diabetes Care,35: (suppl.1):S64-71
American Diabetes Association 2012. Standards of medical care in
diabetes. Diabetes Care, 35: (suppl.1):S11-63.
Anjaneyulu, M. and Chopra, K. 2004. Quercetine, an anti-oxidant
bioflavonoid, attenuates diabetic nephropathy in rats. Clin. Exp. Pharmacol.
Physiol., 31: 244-248.
Agarwal, N. , Sadhukhan, P. , Saha, S. and Sil, P. C. 2015. Therapeutic
insights against oxidative stress induced diabetic nephropathy : Areview. J.
Autoimmune Disorders, 1 (1:2): 1-16.
-B-
Bennett, P. H. and Knowler, W. C. 2005. Definition, diagnosis, and
classification of diabetes mellitus and glucose homeostasis. In: Kahn CR,
Weir GC, King GL,Jacobson AM, Moses AC, Smith RJ, eds. Joslin´s
Diabetes mellitus. Selected chapters from the fourteenth edition.
Philadelphia: Lippincott Williams&Wilkins:105-115.
References
Page 75
Borch-Johnsen, K. , Andersen, P. K. and Deckert, T. 1985. The effect of
proteinuria on relative mortality in type 1 (insulindependent) diabetes.
Diabetologia, 28:590-596.
Borch- Johnsen, K. and Kreiner, S. 1987. Proteinuria: valuea as predictor
of cardiovascular mortality in insulin dependent diabetes mellitus. Br Med J,
294: 1651-1654.
Baynes , J. W. and Thorpe, S. R. 1999. Role of oxidative stress in diabetic
complications: a new perspective on an old paradigm. Diabetes, 48: 1-9.
Brownlee, M. 2005. The pathobiology of diabetic complications. Diabetes,
54: 1615-1625.
Bashan, N. , Kovsan, J. , Kachko, I. , Ovadia, H. and Rudich, A.
2009.Positive and negative regulation of insulin signaling by reactive
oxygen and nitrogen species. Physiol. Rev.89, 27–71.
Brownlee, M. 1995. Advanced protein glycosylation in diabetes and aging.
Annu. Rev. Med., 46,223–234
Bamanikar, S.A., Bamanikar, A.A. and Arora, A. 2016. Study of serum
urea creatinine in diabetic and nondiabetic patients in a tertiary teaching
hospital. J. Med. Res., 2(1) : 12-15.
Bazari, H. 2007. Approach to the patient with renal disease. In: Goldman,
L., Ausiello, D.,editors. Cecil medicine. 23rd. edition. Philadelphia, Pa:
Saunders Elsevier.
References
Page 76
-C-
Centers for Disease Control and Prevention. National Diabetes Fact
Sheet: National Estimates and General Information on Diabetes and
Prediabetes in the United States, 2011.U.S. Department of Health and
Human Services: Atlanta, GA, USA, 2011
Chung, S. S. , Ho, E. C., Lam, K.S. and Chung, S.K. 2003.Contribution
of polyol pathway to diabetes-induced oxidative stress. J. Am. Soc. Nephrol.
14, S233–S236.
Candido, R. , Forbes, J. M. , Thomas, M.C. , Thallas, V. , Dean, R.G. ,
Burns, W.C. , Tikellis, C. , Ritchie, R. H. , Twigg, S. M. Cooper, M. E.
and et al. 2003. A breaker of advanced glycation end products attenuates
diabetes-induced myocardial structural changes. Circ. Res. 92,785–792.
Chow, F. , Ozols, E. , Nikolic-Paterson, D. J. , Atkins, R.C. and Tesch,
G.H. 2004.Macrophages in mouse type 2 diabetic nephropathy: correlation
with diabetic state and progressive renal injury. Kidney Int 65: 116-128.
Canadian Diabetes Association Clinical Practice Guidelines Expert
Committee. Canadian Diabetes Association 2003 Guidelines for the
Prevention and Management of Diabetes in Canada. Can J. Diabetes
2003; 27(suppl. 2):S66-71. 2
Chandalia, H. B. and Krishnaswamy, P. R. 2002. Glycated hemoglobin.
Curr. Sci., 83 (12): 1522- 1532.

References
Page 77
-D-
D’Autreaux, B. and Toledano, M.B. 2007. ROS as signalling molecules:
Mechanisms that generate specificity in ROS homeostasis. Nat. Rev. Mol.
Cell Biol. 8: 813–824.
Diabetes Control and Complications Trial Research Group. 1993. The
effect of intensive treatment of diabetes on the development and progression
of long term complications in insulin-dependent diabetes mellitus. N Engl J
Med, 329:977-986.
Du, X. , Stocklauser-Farber, K. and Rosen, P.1999. Generation of
reactive oxygen intermediates,activation of NF-κB and induction of
apoptosis in human endothelial cells by glucose: Role of nitric oxide
synthase? Free Radic. Biol. Med. 27, 752–763.
Du, X. L. , Edelstein, D. , Rossetti, L. , Fantus, I. G. , Goldberg, H. ,
Ziyadeh, F. , Wu, J. and Brownlee, 2000.M.Hyperglycemia-induced
mitochondrial superoxide overproduction activates the hexosamine pathway
and induces plasminogen activator inhibitor-1 expression by increasing Sp1
glycosylation.Proc. Natl. Acad. Sci. USA 97, 1222–1226.
Davi, G., Chiarelli, F., Santilli, F., Pomilio, M., Vigneri, S., Falco, A. ,
Basili, S., Ciabattoni, G.and Patrono, C. 2003. Enhanced lipid
peroxidation and platelet activation in the early phase of type 1diabetes
mellitus: Role of interleukin-6 and disease duration. Circulation 107, 3199–
3203.
Davi, G. , Ciabattoni, G. , Consoli, A. , Mezzetti, A. , Falco, A.,
Santarone, S. , Pennese, E. ,Vitacolonna, E. , Bucciarelli, T. and
Costantini, F. , et al. 1999.In vivo formation of 8-isoprostaglandin F2α and

References
Page 78
platelet activation in diabetes mellitus: Effects of improved metabolic
control and vitamin E supplementation. Circulation 99, 224–229.
Du, X. L. , Edelstein, D. , Rossetti, L. , Fantus, I.G. , Goldberg, H. ,
Ziyadeh, F. , Wu, J. ,and Brownlee, M. 2000.Hyperglycemia-induced
mitochondrial superoxide overproduction activates the hexosamine pathway
and induces plasminogen activator inhibitor-1 expression by increasing Sp1
glycosylation.Proc. Natl. Acad. Sci. USA 97, 1222–1226.
Di Mario, U. , Borsey, D.Q. , Contreas, G. ,Prowse, C.V. Clarke, B.F.
and et al. 1986. The relationship of soluble immune complexes, insulin
antibodies and insulin-antiinsulin complexes to platelet and coagulation
factors in type 1 diabetic patients with and without proliferative retinopathy.
Clin Exp Immunol, 65: 57-65.
Del Rio, D. , Stewart, A.J. and Pellegrini, N. 2005. A review of recent
studies on malondialdehyde as toxic molecule and biological marker of
oxidative stress. Nutr Metab Cardiovasc Dis, 15(4):316–328.
Djordjević, B. V., Ćosić, V., Pavlović, D., Vlahović, P., Jevtović T., Kocić
G. and Savić, V. 2000.Does captopril change oxidative stress in puromycin
aminonucleoside nepropathy?Renal. Fail., 22, 535-544.
Djordjević, V.B., Pavlović, D.D. and Kocić, G.M. 2000. Biochemistry of
free radicals. Medical Faculty Niš.
Deepa, K., Manjunatha goud, B. K., Oinam, S. D., Devaki,R.N., Bhavna,
N., Asha, P. and Naureen, A. 2011. Serum urea, creatinine in relation to
fasting plasma glucose levels in type 2 diabetic patients. Int. J. Pharm. Biol.
Sci., 1(3) : 279-283.
References
Page 79
Dezayee, Z. M. I. and Alnakshabandi, A. A. 2011. Assessment of some
immunological parameters in respect to glycemic control in type 1 and 2
diabetes mellitus: comparative study. Res. J. Med. Sci., 5(3): 119-121.
Dongre, U. J. and Meshram, V. G. 2015. Evaluation of glutathione
dependent antioxidant enzyme in maternally inherited type 2 diabetes
mellitus. J. Pharm. Sci. Res., 7(3): 137- 140.
Dabla, P. R. 2010. Renal function in diabetic nephropathy. World J.
Diabetes, 1(2): 48-56.
-E-
Emerging Risk Factors Collaboration; Sarwar, N., Gao, P., Seshasai,
S.R., Gobin, R., Kaptoge, S.,di angelantonio, E., Ingelsson, E., Lawlor,
D.A. and Selvin, E., et al. 2010.Diabetes mellitus, fasting blood glucose
concentration, and risk of vascular disease: A collaborative meta-analysis of
102 prospective studies. Lancet 375, 2215–2222.
Ezriruaka, F. C. Wankasi, M. M. and George, G. S. 2016. The
antioxidant enzymes (superoxide dismutase; glutathione peroxidase;
catalase) status in chronic and non chronic diabetes mellitus type 1 and type
2 subjects in Yenegoa, Bayelsa state, Nigeria. Int. J. Biol. Res., 2(1): 34- 45.
-F-
Furukawa, S., Fujita, T., Shimabukuro, M., Iwaki, M., Yamada, Y.,
Nakajima, Y., Nakayama, O. , Makishima, M., Matsuda, M. and
Shimomura, I. 2004. Increased oxidative stress in obesity and its impact on
metabolic syndrome. J. Clin. Investig.114, 1752–1761.
References
Page 80
Fujita ,T. , Ohi, H. , Komatsu, K. , Endo, M. Ohsawa, I. and et al. 1999
Complement activation accelerates glomerular injury in diabetic rats.
Nephron 81: 208-214.
Fearn, A. and Sheerin, N. S. 2015. Evaluation of glutathione dependent
antioxidant enzymes in maternally inherited type 2 diabetes mellitus. J.
Pharm. Sci. Res., 7(3): 137-140.
-G-
Ghadermarzi, M. and Moosavi-Movahedi A.A. 1996. Determination of
the kinetic parameters for the suicide substrate inactivation of bovine liver
catalase by hidrogen peroxide.J. Enzime Inhibition, 10, 167-175.
Gaetani, G.F, Ferraris, A.M., Rolfo, M., Mangerini, R., Arena, S. and
Kirkman, H.N. 1996.Predominant role of catalase in the disposal of
hydrogen peroxide within human erythrocytes. Blood, 87:1569–1599
Gabby, K. H. Sosenko, J. M., Banuchi, G. A. Minin, M. J. and Fluckigu,
R. 1979. Glycosylated hemoglobins; increased glycosylation of hemoglobin
A in diabetes patients. Diabetes, 28(4): 337-340.
Goicheva, P., Iliev, R. and Gadjeva, V.2014. Comparative analysis of
some markers of oxidativestreaa in patients with diabetes nephropathy on
chronic hemodialysis _ four years study. trakia J. Sci., 12 (suppl. 1): 184-
190.
Gal, M. A. Houganard, P., Borch- Johnsen, K. and parving, H. H. 1997.
Risk factors for development of incipient and overt diabetic nephropathy in
patients with type Π diabetes mellitus. Brit. Med. J., 314: 783- 788.

References
Page 81
Ganz, M.B. and Seftel, A. 2000.Glucose-induced changes in protein kinase
C and nitric oxide are prevented by vitamin E. Am. J. Physiol. Endocrinol.
Metab. 278, E146–E152.
G. , Ziyadeh and Wolf , F.N. 1999. Molecular mechanism of diabetic renal
hypertrophy. Kidney Int, 56: 393-405.
Greene, D. 1998. The pathogenesis and prevention of diabetic neuropathy
and nephropathy. Metabolism, 37 (Suppl.1): 25-29
Greene, D.A. , Lattimer, S.A. and Sima, A.A. 1987. Sorbitol,
phosphoinositides, and sodiumpotassium-ATPase in the pathogenesis of
diabetic cpmplications. N Engl J Med316: 599-606.
Giugliano, D. , Ceriello, A. and Paolisso, G. 1996. Oxidative stress and
diabetic vascular complications. Diabetes Care 19: 257-267.
Gnudi, L., Gruden, G. and Viberti G.F. 2003. Pathogenesis of diabetic
nephropathy. In :Pickup JC, Williams G, eds. Textbook of Diabetes, 3cn
edn. Oxford, Blackwell Science Ltd, 52.1-52.22.
Gross, J.L. , de Azevedo, M.J. , Silveiro, S.P. , Canani, L.H. , Caramori,
M. L. and Zelmanovitz, T. 2005. Diabetic nephropathy: diagnosis,
prevention, and treatment. Diabetes Care, 28(1):164–176.
Garber, A. J. 2000. The importance of early insulin secretion and its
impact on glycaemic regulation. Int. J. Obes. Relat. Metab. Disord., 24
(suppl. 3 ): S32- S37.

References
Page 82
-H-
Herlein, J.A., Fink, B.D., O’Malley, Y. and Sivitz, W.I. 2009.Superoxide
and respiratory coupling in mitochondria of insulin-deficient diabetic rats.
Endocrinology . 150, 46–55.
Hans, C.P. , Chaudhary, D.P. and Bansal, D.D. 2002. Magnesium
deficiency increases oxidative stress in rats. Indian J Exp Biol 40(11):1275–
1279.
Hou, N., Torii, S., Saito, N., Hosaka, M. and Takeuchi, T. 2008.Reactive
oxygen species-mediated pancreatic β-cell death is regulated by interactions
between stressactivated protein kinases, p38 and c-Jun N-terminal kinase
and mitogen-activated protein kinase phosphatases. Endocrinology .149,
1654–1665.
Houstis, N., Rosen, E.D. and Lander, E.S. 2006.Reactive oxygen species
have a causal role in multiple forms of insulin resistance. Nature, 440, 944–
948.
Huang, A., Yang, Y.M., Feher, A., Bagi, Z., Kaley, G. and Sun, D. 2012.
Exacerbation of endothelial dysfunction during the progression of diabetes:
Role of oxidative stress. Am. J. Physiol. Regul. Integr. Comp. Physiol. 302,
R674–R681.
Hann, H.L., Stahlhut, M.W. and Hann, C.L. 1990. Effect of iron and
deferoxamine on cell growth and in vitro ferritin synthesis in human
hepatoma cell lines. Hepatology,11:566-569.
Inoguchi, T., Battan, R., Handler, E., Sportsman, J.R., Heath, W. and
King, G.L.1992.Preferential elevation of protein kinase C isoform β II and
References
Page 83
diacylglycerol levels in the aorta and heart of diabetic rats: Differential
reversibility to glycemic control by islet cell transplantation.Proc. Natl.
Acad. Sci. USA 89, 11059–11063.
-I-
Ishii, H. and Tada, H. and Isogai, S 1998. An aldose reductase inhibitor
prevents glucose induced increase in transforming growth factor-beta and
protein kinase C activity in cultured mesangial cells, Diabetologia 41: 362-
364.
-J-
Jörns, A., Munday, R., Tiedge, M. and Lenzen, S. 1999. Effect of
superoxide dismutase, catalase, chelating agents, and free radical scavengers
on the toxicity of alloxan to isolated pancreatic islets in vitro. Free Rad Biol
Med, 26:1300–1304. Toyokuni, S. (1996). Iron-induced carcinogenesis: the
role of redox regulation. Free Radic Biol Med, 20:553-566.
Jabeen, F., Rizvi, H. A., Aziz, F. and Akhtar, Y. 2013. Effect of glycemic
control on lipid profile, platelet indices and antioxidant enzymes (catalase
and superoxide dismutase ) activities in type 2 diabetes. Int. J. Aes., 1(7):
207- 215.
-K-
Kedziora- Kornatowska, K. Z., Luciak, M., Blaszczyk, J. and Pawlak,
W., 1998. Lipid peroxidation and activities of antioxidant enzymes in
erythrocytes of patients with non- insulin dependent diabetes with or without
diabetic nephropathy. Nephrol. Dial. Transplant, 13: 2829- 2832.
References
Page 84
Kobayashi, M.S., Han, D. and Packer, L. 2000. Antioxidants and herbal
extracts protect HT-4 neuronal cells against glutamate-induced cytotoxicity.
Free Radic Res , 32:115–124.
Kumawat, M. , Sharma, T.K. , Singh, I. , Singh, N. , Ghalaut, V.S. ,
Vardey, S.K. and Shankar, V.2013.Antioxidant enzymes and lipid
peroxidation in type 2 diabetes mellitus patients with and without
nephropathy. N Am J Med Sci 2013,5(3):213–219.
Kirkman, H.N., Galiano, S., Gaetani, G.F. 1987. The function of catalase-
bound NADPH. J.Biol. Chem., Vol. 262, Issue 2, 660-666.
Kanwar, G., Jain, n., sharma, n., shekhawat, M., Ahmed, J. and Kabra,
R. 2015. Significance of serum urea and creatinine levels in type 2 diabetic
patients. IQSR J. Dent. Med. Sci., 14 (8) : 65-67.
Kumawat, M., Sharma, T. K., Singh, I., Singh, N., Ghalaut, V. S.,
Vardey, S. K. and Shankar, V. 2013. Antioxidant enzymes and lipid
peroxidation in type 2 diabetes mellitus patients with and without
nephropathy. N. Am. J. Med. Sci., 5(3): 213-291.
Kamal., A. 2014. Impact of diabetes on renal function parameters. Indian J.
Fundament. Appl. Life Sci., 4(3): 411-416.
Koenig, W. , Sund, M. , Fröhlich, M. , Fischer, H.G. , Löwel, H. ,
Döring, A. , Hutchinson, W.L. and Pepys, M.B.1999. C-reactive protein, a
sensitive marker of inflammation, predicts future risk of coronary heart
disease in initially healthy middle-aged men. Circulation 99: 237-242.
Kimmelstiel, P. and Wilson, C. 1936 Intercapillary lesions in the glomeruli
of the kidney. Am J Pathol 12: 83-105.
References
Page 85
Kolm-Litty, V. , Sauer, U. , Nerlich, A. , Lehmann, R. and Schleicher,
E.D. 1998.High glucoseinduced transforming growth factor beta 1
production is mediated by the hexosamine pathway in porcine glomerular
mesangial cell. J Clin Invest 101:160-169.
Kasiske, B.L. , Kalil, R.S.N. , Ma, J.Z. , Liao, M. and Keane, W.F. 1997.
Effect of antihypertensive monocyte chemoattractant protein-1 in proximal
tubule cells by urinary protein. J Am Soc Nephrol 8:1537 -1545.
Korshunov, S.S., Skulachev, V.P. and Starkov, A.A. 1997.High protonic
potential actuates a mechanism of production of reactive oxygen species in
mitochondria. FEBS Lett. 416, 15–18.
Kamper, M. , Tsimpoukidi, O. , Chatzigeorgiou, A. , Lymberi, M. and
Kamper, E.F. 2010. The antioxidant effect of angiotensin II receptor
blocker, losartan, in streptozotocin-induced diabetic rats. Transl Res
156(1):26–36.
-L-
Lee, H.B. , Cha, M.K. , Song, K.I. , Kim, J.H. , Lee, E.Y. , Kim, S.I. ,
Kim, J. and Yoo, M.H. 1997. Pathogenic role of advanced glycosylation
end products in diabetic nephropathy. Kidney Int 60 (Suppl.): S60-S65.
Li, L., Shen, Y.M., Yang, X.S., Wu, W.L., Wang, B.G., Chen, Z.H.and
Hao, X.J. 2002. Effects of spiramine T on antioxidant enzymatic activities
and nitric oxide production in cerebral ischemia-reperfusion gerbils. Brain
Res, 944:205–209.
Levey, A.S. 1990. Measurement of renal function in chronic renal disease.
Kidney Int. 38,167–184.
References
Page 86
Li, L. ,Yang, G., Shi, S. , Yang, M., Liu, H. and Boden, G. 2009. The
adipose triglyceride lipase, adiponectin and visfatin are down regulated
byTNF- α in vivo. J. Cytokine, 45: 12-19.
Lu, H.J. , Tzeng, T.F. , Hsu, J.C. , Kuo, S.H. , Chang, C.H. , Huang, S.Y.
, Chang, F.Y. , Wu, M.C. and Liu, I.M. 2013. An aqueous-ethanol extract
of liriope spicata var. prolifera ameliorates diabetic nephropathy through
suppression of renal inflammation. Evid Based Complement Alternat Med
2013:201643.
-M-
Marshall, A. 2003. Clinical features and management of nephropathy. In:
Pickup JC, Williams G, eds. Textbook of diabetes 2. Oxford: Blackwell
Science Ltd:53.1-53.17.
Mauer, S.M. , Steffes,y. , M.W. and Brown, D.M.1981. The kidney in
diabetes. Am J Med 70:603-612.
Mauer. S.M. , Steffes, M.W. , Ellis, E.N. , Sutherland, D.E.R. , Brown,
D.M. and Goetz, F. D. 1984.Structural- functional relationships in diabetic
nephropathy. J Clin Invest 74:1143-1155.
Makino, H. , Shikata, K. , Hironaka, K. , Kushiro, M. , Yamasaki, Y. ,
Sugimoto, H. , Ota, Z. , Araki, N. and Horiuchi, S. 1995. Ultrastructure of
non-enzymatically glycated mesangial matrix in diabetic nephropathy.
Kidney Int 48: 512-526.
References
Page 87
Mullarkey, C.J., Edelstein, D. and Brownee, 1990.M. Free radical
generation by early glycation products:A mechanism for accelerated
atherogenesis in diabetes. Biochem. Biophys. Res. Commun.,173, 932–939.
Martens, G.A., Cai, Y., Hinke, S., Stange, G., van de Casteele, M. and
Pipeleers, D. 2005.Glucose suppresses superoxide generation in
metabolically responsive pancreatic β-cells. J. Biol.Chem. 280, 20389–
20396.
Monnier, L., Mas, E., Ginet, C., Michel, F., Villon, L., Cristol, J.P. and
Colette, C. 2006.Activation of oxidative stress by acute glucose fluctuations
compared with sustained chronic hyperglycemia in patients with type 2
diabetes. JAMA 295, 1681–1687.
Mullarkey, C.J., Edelstein, D. and Brownee, M. 1990.Free radical
generation by early glycation products:A mechanism for accelerated
atherogenesis in diabetes. Biochem. Biophys. Res. Commun.173, 932–939
Mueller, S., Riedel, H.D. and Stremmel, W. 1997. Direct evidence for
catalase as the predominant H2 O2− removing enzyme in human
erythrocites. Blood 90, 4973-4978.
Murata, M., Imada, M., Inoue, S. and Kawanishi, S. 1998. Metal
mediated DNA damage by diabetogenic alloxan in the presence of NADH.
Free Radic Biol Med, 25:586–595.
Matough, F. A. Budin, S. B., Hamid, Z. A., Alwahaibi, N. and
Mohamed, J. 2012. The role of oxidative stress and antioxidants in diabetic
complications. Sultan Qaboos Univ. Med. J., 12: 5-18.
References
Page 88
Mattix, H. J. Hsu, C- Y., Shaykevich, S. and Churhan, G. 2002. Use of
the albumin / creatinine ratio to detect microalbuminuria : Implications of
sex and race. J. Am. Soc. Nephrol., 13: 1034- 1039.
Manjunatha Goud, B. K. Deepa, K., Sarsina Devi, O., Poornima, A. M.,
Nandini, M. and Asha, K. 2010. Comparison of blood sorbitol level and
microalbuminuria in early detection of diabetic nephropathy in type 2
diabetes. Int. J. Pharma. BioSci., 1(4): B-335-B339.
Manjunatha Goud, B. K. Deepa, K., Sarsina Devi, O., Poornima, A. M.,
Nandini, M. and Asha, K. 2010. Comparison of blood sorbitol level and
microalbuminuria in early detection of diabetic nephropathy in type 2
diabetes. Int. J. Pharma. BioSci., 1(4): B-335-B339.
-N-
Nishino, T., Horii, Y., Shiiki, H., Yamamoto, H., Makita, Z., Bucala, R.
and Dohi, K. 1995.Immunohistochemical detection of advanced
glycosylation end products within the vascular lesions and glomeruli in
diabetic nephropathy. Hum. Pathol. 26, 308–313.
Nishikawa, T., Edelstein, D., Du, X.L., Yamagishi, S., Matsumura, T.,
Kaneda, Y., Yorek, M.A., Beebe, D., Oates, P.J., Hammes, H.P. and et
al. 2000.Normalizing mitochondrial superoxide production blocks three
pathways of hyperglycaemic damage. Nature 404, 787–790.
Nicoloff, G. , Blazhev, A. , Petrova, C. and Christova, P. 2004.
Circulating immune complexes among diabetic children. Clin Dev Immunol
11: 61-66.
Natarajan, V. 1995. Oxidants and signal transduction in vascular
endothelium [Review]. J Lab Clin Med, 125: 26-37.

References
Page 89
Nikolova, M., Kiperova, B., Djerassi, R., Andrew, E., Bogov, B.,
Tzekova, D., Baleva, M., Hristov, V., Manolov, D., Kamenov, Z.,
Todorov, T. and Vlahov, I. 2004. Immunological phenomena in patients
with diabetic nephropathy. BANTAO J., 2(1): 22-24.
-P-
Pitocco, D., di Stasio, E., Romitelli, F., Zaccardi, F., Tavazzi, B., Manto,
A., Caputo, S. , Musella, T., Zuppi, C., Santini, S.A. and et al.
2008.Hypouricemia linked to an overproduction of nitric oxide is an early
marker of oxidative stress in female subjects with type 1 diabetes. Diabetes
Metab. Res. Rev. 24, 318–323.
Price, C. P. Newall, R. G. and Boyd, J. C. 2005. Use of protein : creatinine
ratio measurements on random urine samples for prediction of significant
proteinuria: A systematic review. Clin. Chem., 51: 1577-1586.
-R-
Raj, D.S. , Choudhury, D. , Welbourne ,T.C. and Levi, M.
2000.Advanced glycation endproducts:a nephrologists´s perspective. Am J
Kidney Dis 35: 365-380.
Remuzzi, G. , Ruggenenti, P. and Benigni, A. 1997. Understanding, the
nature of renal disease progression. Kidney Int 51 : 2-15.
Remuzzi, G. and Bertani, T. 1998. Pathophysiology of progressive
nephropathies. N Engl JMed 339: 1448-1456
Rizzardini, M., Lupi, M., Bernasconi, S., Mangolini, A. and Cantoni, L.
2003. Mitochondrial dysfunction and death in motor neurons exposed to the
glutathione-depleting agent ethacrynic acid. J Neurol Sci, 207:51–58.

References
Page 90
Rose, B.D. and Bakris, G.L. 2004. Microalbuminuria and Cardiovascular
disease In: UpToDate, Rose, BD (Ed), UpToDate, Wellesley, MA.
Ribeiro, M.C. , Avila, D.S. , Barbosa, N.B. , Meinerz, D.F. , Waczuk,
E.P. , Hassan, W. and Rocha, J.B. 2013. Hydrochlorothiazide and high-fat
diets reduce plasma magnesium levels and increase hepatic oxidative stress
in rats. Magnes Res 26(1):32–40.
Rani, K. , Gavel, P. and Bharti, S. 2016. MDA, oxidative stress marker-
role in diabetic nephropathy with special reference to type Π diabetes
mellitus. Indian J. Appl. Res., 6(5): 128-130.
-S-
SAS. 2012. Statistical Analysis System, User's Guide. Statistical. Version
9.1th ed. SAS. Inst. Inc. Cary. N.C. USA.
Sicree, R. , Shaw, J.E.R. and Zimmet, P.Z 2003.The global burden of
diabetes. In: Gan D, ed. Diabetes Atlas, 2nd ed. Brussels: International
Diabetes Federation: 15-71.
Schleicher, E.D. and Weigert, C. 2000. Role of hexosamine biosynthetic
pathway in diabetic nephropathy. Kidney Int 77 (Suppl.): S13-S18
Schaffer, S.W., Jong, C.J. and Mozaffari, M. 2012.Role of oxidative
stress in diabetes-mediated vascular dysfunction: Unifying hypothesis of
diabetes revisited. Vascul. Pharmacol. 57, 139–149.
Stadler, K. 2012.Oxidative stress in diabetes. Adv. Exp. Med. Biol., 771,
272–287.
References
Page 91
Svegliati-Baroni, G., Candelaresi, C., Saccomanno, S., Ferretti, G.,
Bachetti, T., Marzioni, M.;de Minicis, S., Nobili, L., Salzano, R. ,
Omenetti, A. and et al.2006. A model of insulin resistance and
nonalcoholic steatohepatitis in rats: Role of peroxisome proliferator-
activated receptor-α and n-3polyunsaturated fatty acid treatment on liver
injury. Am. J. Pathol. 169, 846–860.
Savu, O., Ionescu-Tirgoviste, C., Atanasiu, V., Gaman, L., Papacocea,
R. and Stoian, I. 2012.Increase in total antioxidant capacity of plasma
despite high levels of oxidative stress in uncomplicated type 2 diabetes
mellitus. J. Int. Med. Res. 40, 709–716.
Schaffer, S.W., Jong, C.J. and Mozaffari, M. 2012.Role of oxidative
stress in diabetes-mediated vascular dysfunction: Unifying hypothesis of
diabetes revisited. Vascul. Pharmacol. 57, 139–149.
Stitt, A.W., Li, Y.M., Gardiner, T.A., Bucala, R., Archer, D.B. and
Vlassar, H. 1997.Advanced glycation end products (AGEs) co-localize with
AGE receptors in the retinal vasculature of diabetic and of AGE-infused
rats. Am. J. Pathol. 150, 523–531.
Saad, A.F. , Virella, G. , Chassereau, C. , Boackle, R.J. and Lopes-
Virella, M.F. 2006. OxLDL immune complexes activate complement and
induce cytokine production by MonoMac 6 cells and human macrophages. J
Lipid Res 47: 1975-1983.
Srivastava ,S. , Chandrasekar, B. , Bhatnagar, A. and Prabhu, S.D.
2002. Lipid peroxidationderived aldehydes and oxidative stress in the failing
heart: role of aldose reductase. Am J Physiol Heart Circ Physiol
283(6):H2612–H2619.
References
Page 92
Schena, F.P. and Gesualdo, L. 2005. Pathogenetic mechanisms of diabetic
nephropathy. J Am Soc Nephrol 16(Suppl 1):S30–S33.
Singh, P., Khan, S. and Mittal, R. K. 2014. Glycemic status and renal
function among type 2 diabetics. Bangladesh J. Med. Sci., 13 (4): 406-410.
-T-
Tracy, R.P. , Lemaitre, R.N. , Psaty, B.M, , Ives, D.G. , Evans, R.W.
,Cushman, M. , Meilahn, E.N and Kuller, L.H. 1997. Relationship of C-
reactive protein to risk of cardiovascular disease in the elderly. Results from
the Cardiovascular Health Study and the Rural Health Promotion Project.
Arterioscler Thromb Vasc Biol 17: 1121-1127.
Thomas, W. , Shen, Y. , Molitch, M.E. and Steffes, M.W. 2001. Rise in
albuminuria and blood pressure in patients who progressed to diabetic
nephropathy in the Diabetes Control and Complications Trial. J Am Soc
Nephrol 12: 333-340.
Thiele, G.M. and McDonald, T.L. 1989. Assessment of the role of the
immunoglobulin isotypes in the development of diabetic nephropathy in
untreated streptozotocin induced diabetic rats. Diabetes Res 12: 15-24.
Tiedge, M., Lortz, S., Munday, R. and Lenzen, S. 1998. Complementary
action of anti-oxidant enzymes in the protection of bioengineered insulin-
producing RINm5F cells against toxicity of reactive oxygen species.
Diabetes, 47:1578–1585.
References
Page 93
Taylor, E.H. 1989.Clinical Chemistry; John Wiley and Sons: New York,
NY, USA, pp. 58–62.
Tsai, C. J., Tung, S. C., Kuo, M. C. and shen, F. C. 2012. Acute blood
glucose fluctuations can decrease blood glutathione and adiponectin levels in
patients with type 2 diabetes. Diabetes Res. Clin. Pract., 98(2): 257-263.
-U-
Usman, A., Umar, R. A. Shehu, N. I., Wali, U. and Nasir, A. 2012.
Markers of diabetic nephropathy in diabetic patients in gusau, Zamfara state,
Nigeria. Nigerian J. Basic Appl. Sci., 20 (2): 130- 133.
United States Renal Data System (USRDS). 2001. Annual report: Atlas of
end stage renal diseases in the United State. Am. J. Kidney Diseases, 41: 57-
254.
-V-
Visser, M. , Bouter, L.M. , McQuillan, G.M. , Wener, M.H. and Harris,
T.B. 1999. Elevated C-reactive protein levels in overweight and obese
adults. JAMA 282: 2131-2135.
Vostreis, M., Moran, P.L. and Seligman, P.A. 1988. Transferrin synthesis
by small cell lung cancer cells acts as an autocrine regulator of cellular
proliferation.; J Clin Invest 82:331.
Varashree, B. S. and Gopalakrishna, B.P. 2011. Correlation of lipid
peroxidation with glycated hemoglobin levels in diabetes mellitus. J. Health
Allied Sci., 10 (2): 11-14.
References
Page 94
-W-
Wang, Y. , Chen, J. , Chen, L. , Tay, Y-C. , Rangan, G.K. and Harris,
D.C.H 1997. Induction of monocyte chemoattractant protein-1 in proximal
tubule cells by urinary protein. J Am Soc Nephrol 8:1537 -1545.
Wautier, J.L. and Schmidt, A.M. 2004. Protein glycation: A firm link to
endothelial cell dysfunction. Circ. Res. 95, 233–238.
Wallace, D.C. 1992. Disease of the mitochondrial DNA. Annu. Rev.
Biochem., 61, 1175–1212.
Watanabe. S. , Tomino, Y. , Inoue, W. , Yagame, M. , Kaneshige, H. and
et al. 1987. Detection of immunoglobulins and/or complement in kidne
tissues from nonobese diabetic (NOD) mice. Tokai J Exp Clin Med 12: 201-
208.
Walti, M.K. , Zimmermann, M.B. , Spinas, G.A. , Jacob, S. and Hurrell,
R.F. 2002. Dietary magnesium intake in type 2 diabetes. Eur J Clin Nutr
56(5):409–414.
Waggiallah, H. and Alzohairy, M. 2011. THE effect of oxidative stress on
human red cells glutathione peroxidase, glutathione reductase level, and
prevalence of anemia among diabetics. N. Am. J. Med. Sci., 3 : 344- 347.
Wiof, G. 2004. New insights into the pathophysiology of diabetic
nephropathy from heamodynamics to molecular pathology. Eur. J. Clin.
Invest., 34: 785-796.
Wang, Z., Hoy, W. E. and Wang, Z. 2013. The correlates of urinary
albumin to creatinine ratio (ACR) in a high risk Australian aboriginal
community. BMC Nephrology, 14:176-182.
References
Page 95
World Health Organization 2005. EMRO strategies for diabetes control
and prevention Reginal office for the Eastern Mediterranean. PO. Box 7608.
Nasr City Cairo. 11371. Egypt.
-Y-
Yu, T., Robotham, J.L. and Yoon, Y. 2006. Increased production of
reactive oxygen species in hyperglycemic conditions requires dynamic
change of mitochondrial morphology.Proc. Natl. Acad. Sci. USA 103, 2653–
2658.
-Z-
Zoja, C. , Morigi, M. , Figliuzzi, M. , Bruzzi, I. , Oldroyd, S. , Benigni,
A. , Ronco, P.M. and Remuzzi, G. 1995. Proximal tubular cell synthesis
and secretion of endothelin-1 on challenge with albumin and other proteins.
Am J Kidney Dis 26: 934-941.
Appendices
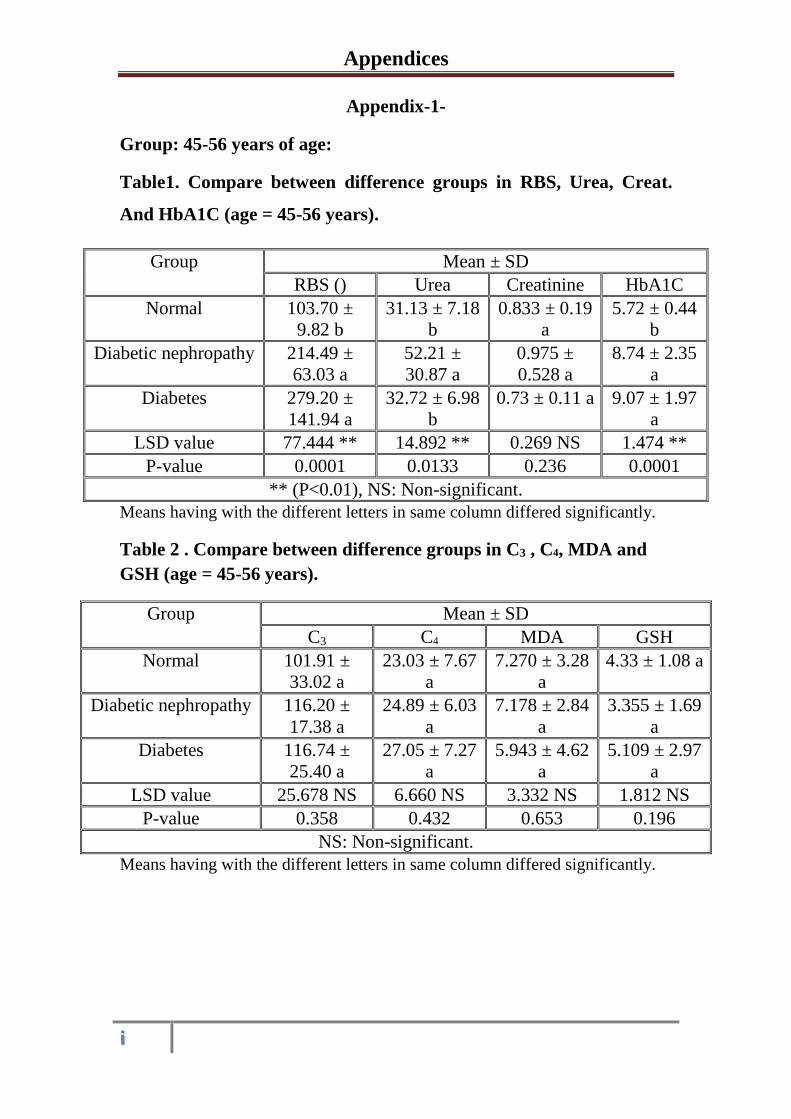
Appendices
i
Appendix-1-
Group: 45-56 years of age:
Table1. Compare between difference groups in RBS, Urea, Creat.
And HbA1C (age = 45-56 years).
Group Mean ± SD
RBS () Urea Creatinine HbA1C
Normal 103.70 ±
9.82 b
31.13 ± 7.18
b
0.833 ± 0.19
a
5.72 ± 0.44
b
Diabetic nephropathy 214.49 ±
63.03 a
52.21 ±
30.87 a
0.975 ±
0.528 a
8.74 ± 2.35
a
Diabetes 279.20 ±
141.94 a
32.72 ± 6.98
b
0.73 ± 0.11 a 9.07 ± 1.97
a
LSD value 77.444 ** 14.892 ** 0.269 NS 1.474 **
P-value 0.0001 0.0133 0.236 0.0001
** (P<0.01), NS: Non-significant.
Means having with the different letters in same column differed significantly.
Table 2 . Compare between difference groups in C3 , C4, MDA and
GSH (age = 45-56 years).
Group Mean ± SD
C3 C4 MDA GSH
Normal 101.91 ±
33.02 a
23.03 ± 7.67
a
7.270 ± 3.28
a
4.33 ± 1.08 a
Diabetic nephropathy 116.20 ±
17.38 a
24.89 ± 6.03
a
7.178 ± 2.84
a
3.355 ± 1.69
a
Diabetes 116.74 ±
25.40 a
27.05 ± 7.27
a
5.943 ± 4.62
a
5.109 ± 2.97
a
LSD value 25.678 NS 6.660 NS 3.332 NS 1.812 NS
P-value 0.358 0.432 0.653 0.196
NS: Non-significant.
Means having with the different letters in same column differed significantly.
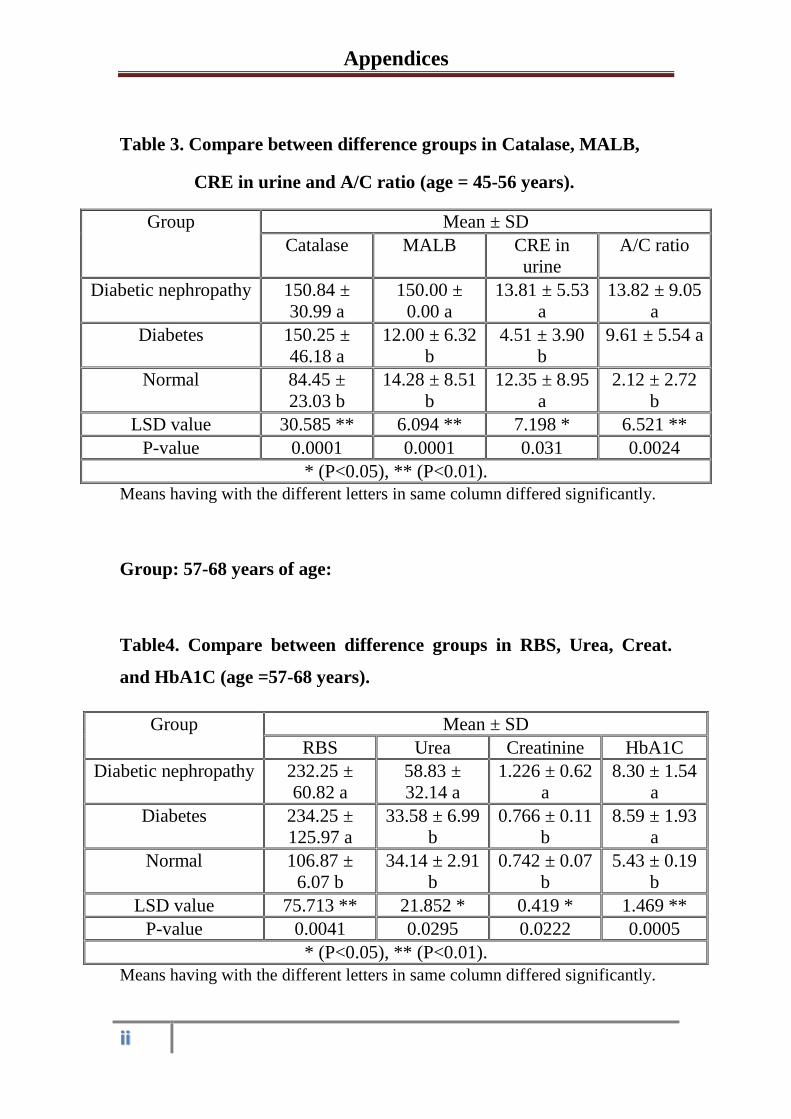
Appendices
ii
Table 3. Compare between difference groups in Catalase, MALB,
CRE in urine and A/C ratio (age = 45-56 years).
Group Mean ± SD
Catalase MALB CRE in
urine
A/C ratio
Diabetic nephropathy 150.84 ±
30.99 a
150.00 ±
0.00 a
13.81 ± 5.53
a
13.82 ± 9.05
a
Diabetes 150.25 ±
46.18 a
12.00 ± 6.32
b
4.51 ± 3.90
b
9.61 ± 5.54 a
Normal 84.45 ±
23.03 b
14.28 ± 8.51
b
12.35 ± 8.95
a
2.12 ± 2.72
b
LSD value 30.585 ** 6.094 ** 7.198 * 6.521 **
P-value 0.0001 0.0001 0.031 0.0024
* (P<0.05), ** (P<0.01).
Means having with the different letters in same column differed significantly.
Group: 57-68 years of age:
Table4. Compare between difference groups in RBS, Urea, Creat.
and HbA1C (age =57-68 years).
Group Mean ± SD
RBS Urea Creatinine HbA1C
Diabetic nephropathy 232.25 ±
60.82 a
58.83 ±
32.14 a
1.226 ± 0.62
a
8.30 ± 1.54
a
Diabetes 234.25 ±
125.97 a
33.58 ± 6.99
b
0.766 ± 0.11
b
8.59 ± 1.93
a
Normal 106.87 ±
6.07 b
34.14 ± 2.91
b
0.742 ± 0.07
b
5.43 ± 0.19
b
LSD value 75.713 ** 21.852 * 0.419 * 1.469 **
P-value 0.0041 0.0295 0.0222 0.0005
* (P<0.05), ** (P<0.01).
Means having with the different letters in same column differed significantly.
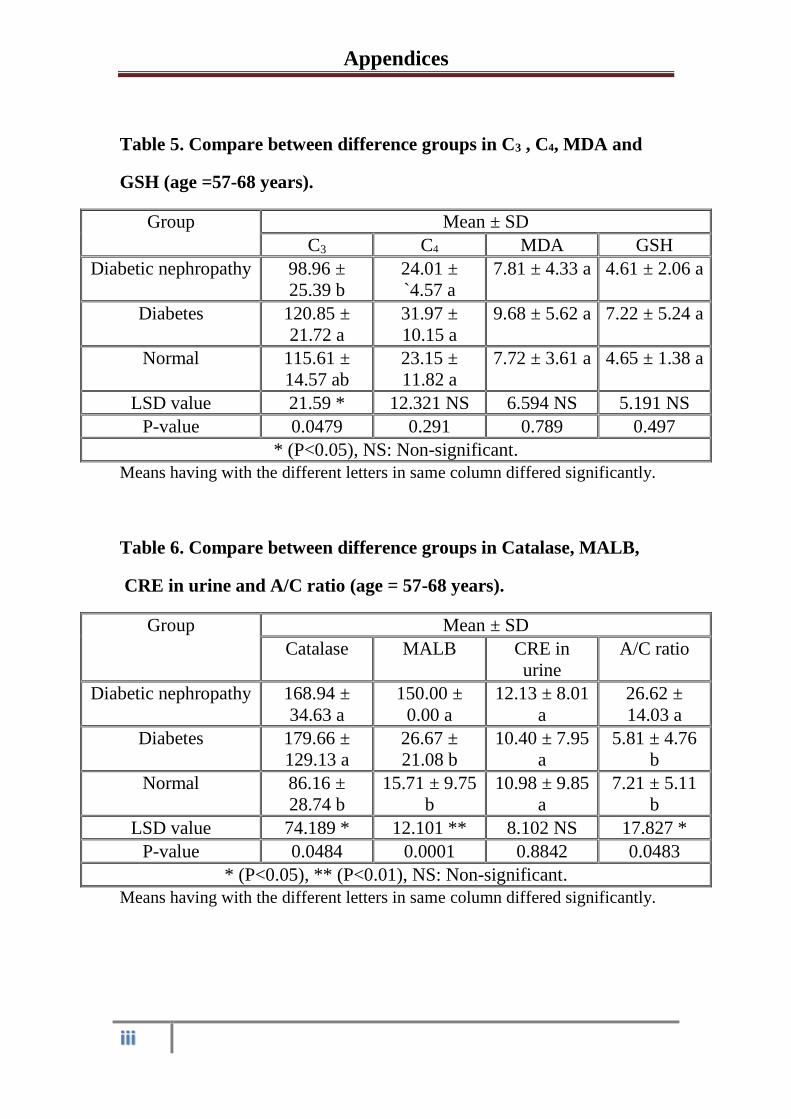
Appendices
iii
Table 5. Compare between difference groups in C3 , C4, MDA and
GSH (age =57-68 years).
Group Mean ± SD
C3 C4 MDA GSH
Diabetic nephropathy 98.96 ±
25.39 b
24.01 ±
`4.57 a
7.81 ± 4.33 a 4.61 ± 2.06 a
Diabetes 120.85 ±
21.72 a
31.97 ±
10.15 a
9.68 ± 5.62 a 7.22 ± 5.24 a
Normal 115.61 ±
14.57 ab
23.15 ±
11.82 a
7.72 ± 3.61 a 4.65 ± 1.38 a
LSD value 21.59 * 12.321 NS 6.594 NS 5.191 NS
P-value 0.0479 0.291 0.789 0.497
* (P<0.05), NS: Non-significant.
Means having with the different letters in same column differed significantly.
Table 6. Compare between difference groups in Catalase, MALB,
CRE in urine and A/C ratio (age = 57-68 years).
Group Mean ± SD
Catalase MALB CRE in
urine
A/C ratio
Diabetic nephropathy 168.94 ±
34.63 a
150.00 ±
0.00 a
12.13 ± 8.01
a
26.62 ±
14.03 a
Diabetes 179.66 ±
129.13 a
26.67 ±
21.08 b
10.40 ± 7.95
a
5.81 ± 4.76
b
Normal 86.16 ±
28.74 b
15.71 ± 9.75
b
10.98 ± 9.85
a
7.21 ± 5.11
b
LSD value 74.189 * 12.101 ** 8.102 NS 17.827 *
P-value 0.0484 0.0001 0.8842 0.0483
* (P<0.05), ** (P<0.01), NS: Non-significant.
Means having with the different letters in same column differed significantly.
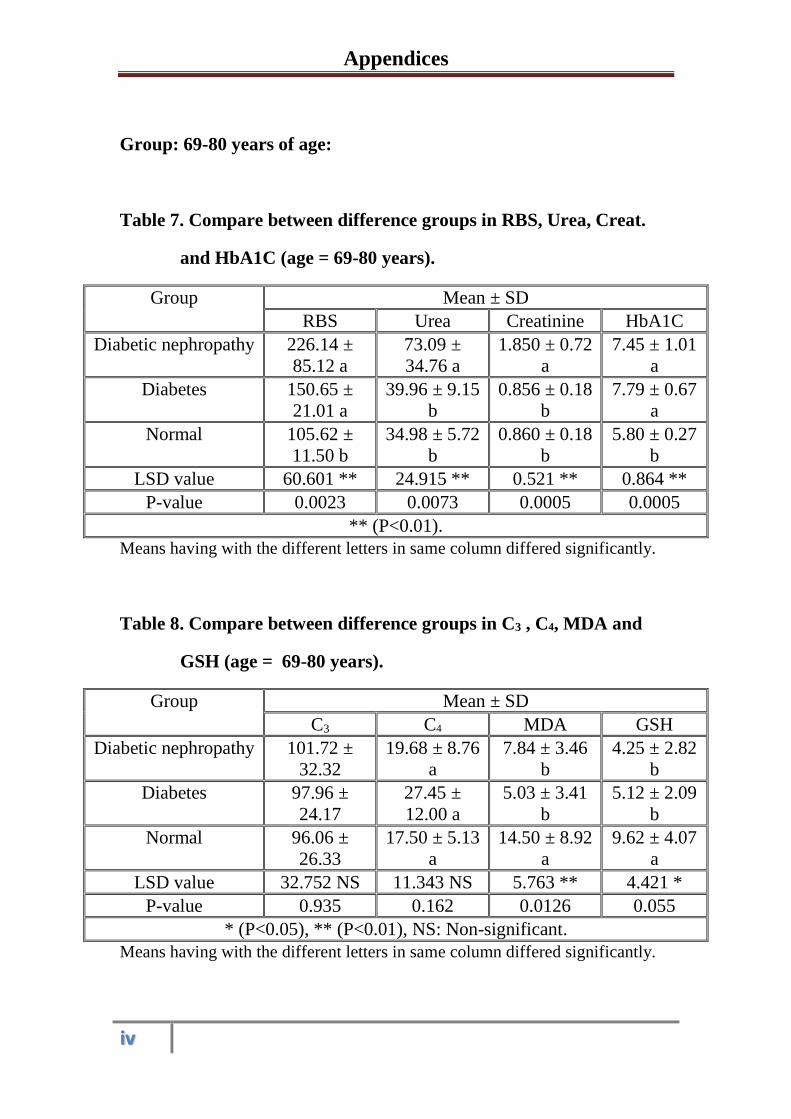
Appendices
iv
Group: 69-80 years of age:
Table 7. Compare between difference groups in RBS, Urea, Creat.
and HbA1C (age = 69-80 years).
Group Mean ± SD
RBS Urea Creatinine HbA1C
Diabetic nephropathy 226.14 ±
85.12 a
73.09 ±
34.76 a
1.850 ± 0.72
a
7.45 ± 1.01
a
Diabetes 150.65 ±
21.01 a
39.96 ± 9.15
b
0.856 ± 0.18
b
7.79 ± 0.67
a
Normal 105.62 ±
11.50 b
34.98 ± 5.72
b
0.860 ± 0.18
b
5.80 ± 0.27
b
LSD value 60.601 ** 24.915 ** 0.521 ** 0.864 **
P-value 0.0023 0.0073 0.0005 0.0005
** (P<0.01).
Means having with the different letters in same column differed significantly.
Table 8. Compare between difference groups in C3 , C4, MDA and
GSH (age = 69-80 years).
Group Mean ± SD
C3 C4 MDA GSH
Diabetic nephropathy 101.72 ±
32.32
19.68 ± 8.76
a
7.84 ± 3.46
b
4.25 ± 2.82
b
Diabetes 97.96 ±
24.17
27.45 ±
12.00 a
5.03 ± 3.41
b
5.12 ± 2.09
b
Normal 96.06 ±
26.33
17.50 ± 5.13
a
14.50 ± 8.92
a
9.62 ± 4.07
a
LSD value 32.752 NS 11.343 NS 5.763 ** 4.421 *
P-value 0.935 0.162 0.0126 0.055
* (P<0.05), ** (P<0.01), NS: Non-significant.
Means having with the different letters in same column differed significantly.
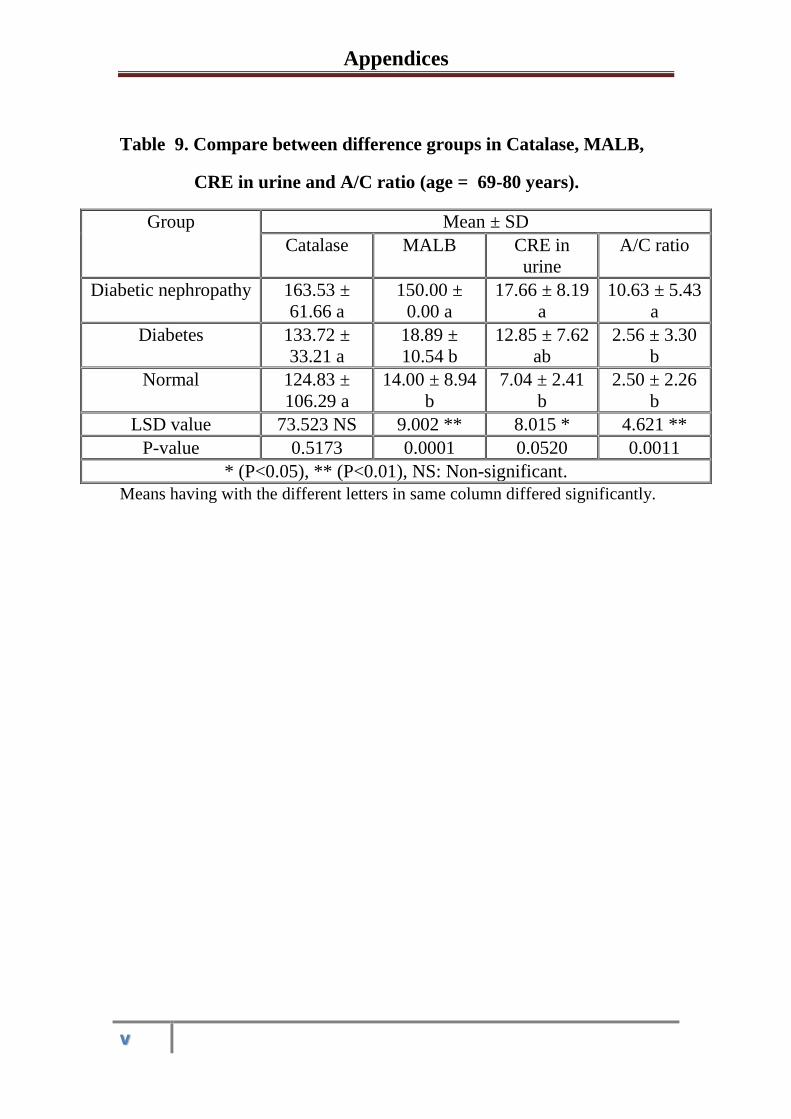
Appendices
v
Table 9. Compare between difference groups in Catalase, MALB,
CRE in urine and A/C ratio (age = 69-80 years).
Group Mean ± SD
Catalase MALB CRE in
urine
A/C ratio
Diabetic nephropathy 163.53 ±
61.66 a
150.00 ±
0.00 a
17.66 ± 8.19
a
10.63 ± 5.43
a
Diabetes 133.72 ±
33.21 a
18.89 ±
10.54 b
12.85 ± 7.62
ab
2.56 ± 3.30
b
Normal 124.83 ±
106.29 a
14.00 ± 8.94
b
7.04 ± 2.41
b
2.50 ± 2.26
b
LSD value 73.523 NS 9.002 ** 8.015 * 4.621 **
P-value 0.5173 0.0001 0.0520 0.0011
* (P<0.05), ** (P<0.01), NS: Non-significant.
Means having with the different letters in same column differed significantly.
الملخص
وقد اظهرت نتائج تركيز الكرياتنين في البول عدم بينما ظهرت زياده في مرضى اعتلال الكليه لداء السكر.
حدوث تغيرات في مرضى داء السكر ومرضى اعتلال الكليه لداء السكر باستثناء مرضى داء السكر لفئات
سنه. والذين اظهروا انخفاض في تركيز الكرياتنين في البول وكذلك مرضى اعتلال الكليه 56-45الاعمار
الكرياتنين في البول. وقد سنه. والذين اظهروا حدوث زياده في تركيز 80-69 لداء السكر لفئات الاعمار
سنه وكذلك لمرضى اعتلال 56-45الكرياتنين في مرضى داء السكر لفئات الاعمار /ازدادت نسبه الالبومين
عمار سنه. ولم تتغير هذه النسبه في مرضى داء السكر لفئات الا 80-45الكليه لداء السكر لفئات الاعمار
سنه. 57-80
الملخص
ت هذه الدراسه للتعرف على دور الاجهاد التأكسدي وبعض الجوانب الكيمياويه الحياتيه في أجري
.المرضى المصابين باعتلال الكليه لداء السكر النوع الثاني
وثلاثون مريضاً . ثلاثون مريضاً مصاباً باعتلال الكليه لداء السكر النوع الثانيواحد و تضمنت الدراسه
مصاباً بداء السكر النوع الثاني الذي تمت مراجعتهم لمستشفى الدكتور عبدالمجيد الخاص للفتره من كانون
كما شملت الدراسه لاغراض المقارنه بجمع عينه من الاصحاء . 2016/لغايه تموز و 2015/الاول
( بنفس اعمار المرضى.28)عدد
3العشوائي واليوريا والكرياتنين والهيموكلوبين الكلايكوسيليتي والمتممين وقد تم قياس تراكيز السكر
والمالونداي الديهايد والكلوتاثايون وفعاليه انزيم الكاتليز في الدم. فضلاً عن ذلك فقد تم قياس تراكيز 4و
الكرياتنين./المايكروالبومين والكرياتنين في البول مع قياس نسبة الالبومين
زياده في تركيز الكلوكوز العشوائي في المرضى المصابين بداء السكر واظهرت نتائج الدراسه وجود
ولم يلاحظ وجود تغير في تركيز سنه. 80-45والمرضى المصابين باعتلال الكليه لداء السكر لفئة الاعمار
ليوريا في مصل دم اليوريا في مصل الدم في مرض داء السكر, في حين لوحظ وجود زياده في تركيز ا
سنه. كما اشارت النتائج الى عدم حدوث 80-45المرضى المصابين باعتلال الكليه لداء السكر لفئة الاعمار
ز سنه. وازداد تركي 56-45تغير في تركيز الكرياتنين في مصل الدم في مرضى داء السكر لفئة الاعمار
سنه. 80-57كليه لداء السكر لفئة الاعمار الكرياتنين في مصل الدم بشكل معنوي في مرض اعتلال ال
واوضحت النتائج بان هناك زياده في النسب المئويه للهيموكلوبين الكلايكوسيليت في مرضى داء السكر
اي تغيرات 4و 3سنه. ولم تظهر تراكيز المتممين 80-45ومرضى اعتلال الكليه لداء السكر لفئة الاعمار
ولم تحدث تغيرات ومرضى اعتلال الكليه لداء السكر لكل فئات الاعمار. في المرضى المصابين بداء السكر
-45في تركيز المالونداي الديهايد في مرضى داء السكر ومرضى اعتلال الكليه لداء السكر لفئات الاعمار
سنه. بينما لوحظ وجود انخفاض في تركيز المالونداي الديهايد في مرضى داء السكر ومرضى اعتلال 68
اما بخصوص تركيز الكلوتاثايون في مصل الدم فقد بينت سنه. 80-69يه لداء السكر لفئات الاعمار الكل
-45كليه لداء السكر للفئه العمريه النتائج عدم حدوث تغيرات معنويه في مرض داء السكر ومرض اعتلال ال
وقد سنه. 80-69 ي مرض داء السكر لفئات الاعمار سنه. بينما لوحظ وجود انخفاض في تركيزه ف 68
اوضحت النتائج زياده في فعالية انزيم الكاتاليز في مرضى داء السكر ومرضى اعتلال الكليه لداء السكر
, سنه. ولم يسجل اي تغير في تركيز المايكروالبومين في البول لمرضى داء السكر 80-45لفئات الاعمار

جمهورية العراق
وزارة التعليم العالي والبحث العلمي
جامعة النهرين
كلية العلوم
الكيمياويه دور الاجهاد التأكسدي وبعض الجوانب
اعتلال الكليه لداء ب المصابين في المرضى ياتيهالح
ع الثانيالسكر النو
رسالة
/جامعة النهرين كلية العلوم مجلس مقدمة الى
حيائيةالتقانة الا / علومال في كلية جزء من متطلبات نيل درجة الماجستيرك
لمن قب
ء وليد عباسآلا
(4201بكلوريوس علوم/تقانه احيائيه/كلية العلوم/ جامعة النهرين)
بأشراف
د. وليد حميد يوسف.أ
2016كانون الاول 1438ربيع الاول