The Pliocene history of C grasslands on the Texas ... · 2004, Mammalian Biochronology of the...
1
C 3 photosynthesis δ 13 C = -19‰ C 4 photosynthesis δ 13 C = -5‰ C 3 plants -25.5‰ C 3 SOM -25.5‰ C 3 CO 3 -12.1 to -9.1‰ C 4 plants -11.5‰ C 4 SOM -11.5‰ C 4 CO 3 +1.9 to 4.9‰ C 3 feeders apatite -11.4‰ C 4 feeders apatite +2.6‰ atmospheric CO 2 -6.5‰ soil CO 2 metabolism and biosynthesis δ 13 C = +14.1‰ 12 CO 2 δ 13 C = +4.4‰ T dependent ppt δ 13 C = +9-12‰ 12 11.5 11 10.5 10 9.5 9 8.5 8 7.5 7 6.5 6 5.5 5 4.5 4 3.5 3 2.5 2 1.5 1 0.5 0 -10 -8 -6 -4 -2 0 21 25 29 33 4 8 12 0 end of section 0 20 40 60 80 10 30 50 70 Percent C 4 Biomass Meters Meters 7 6.5 6 5.5 5 4.5 4 3.5 3 2.5 2 1.5 1 0.5 0 -10 -8 -6 -4 -2 0 21 25 29 33 0 modern soil 2 4 6 0 20 40 60 80 10 30 50 70 Percent C 4 Biomass Meters Meters -10 -8 -6 -4 -2 0 21 25 29 33 8 16 24 0 28 27 26 25 24 23 22 21 20 19 18 17 16 15 14 13 12 11 10 9 8 7 6 5 4 3 2 1 0 0 20 40 60 80 10 30 50 70 Percent C 4 Biomass Meters Meters -10 -8 -6 -4 -2 0 21 25 29 33 4 8 12 0 14.5 14 13.5 13 12.5 12 11.5 11 10.5 10 9.5 9 8.5 8 7.5 7 6.5 6 5.5 5 4.5 4 3.5 3 2.5 2 1.5 1 0.5 0 modern soil 0 20 40 60 80 10 30 50 70 Percent C 4 Biomass Meters Meters 0 2 4 6 8 10 12 14 16 0.1 0.2 0.3 0.4 0.5 0.7 0.8 0.9 1.0 1.1 ≥1.2 Frequency δ 18 O (VSMOW) 0.6 0 1.2 North Cita Canyon intranodule δ 18 O variability Christian Ranch intranodule δ 13 C variability 0 2 4 6 8 10 12 14 0.1 0.2 0.3 0.4 0.5 0.7 0.8 0.9 1.0 1.1 ≥1.1 0.6 0 Frequency δ 13 C (VPDB) 0 2 4 6 8 10 12 14 16 0.25 0.5 0.75 1 1.25 1.75 2 2.5 2.75 3 ≥3.5 1.5 0 2.25 3.25 3.5 Christian Ranch intranodule δ 18 O variability Frequency δ 18 O (VSMOW) 0 2 4 6 8 10 0.1 0.2 0.3 0.4 0.5 0.7 0.8 0.9 1.0 1.1 ≥1.1 0.6 0 North Cita Canyon intranodule δ 13 C variability Frequency δ 13 C (VPDB) The Pliocene history of C 4 grasslands on the Texas panhandle: temporal and spatial variability Samuel E. Miller 1 and David L. Fox 2 1 Department of Geology, Amherst College, Amherst, MA 01002 2 Department of Geology and Geophysics, University of Minnesota, Twin Cities, Minneapolis, MN 55455 Introduction to stable isotopes: Stable isotopes in paleosols, or fossil soils, provide evidence of past vegetational and climatic patterns. The ratio of 13 C to 12 C in paleosol carbonate nodules serves as a proxy for the relative abundance of plants using the C 3 and C 4 photosynthetic pathways. The ratio of 18 O to 16 O in these nodules reflects both soil temperature and the isotopic compo- sition of local meteoric water at the time of carbonate precipitation. Denoted by the variable R sam , the ratio of rare to common isotope in the sample is compared to a standard ratio, R std , to calculate a δ value in parts per thousand ( 0 / 00 ). For example, to find the δ value of 13 C data: δ 13 C = (( 13 C sam / 12 C sam )/( 13 C std / 12 C std ) - 1) * 1000 = ((R sam /R std ) - 1) * 1000. Carbon isotopic data are reported relative to the Vienna Pee Dee Belemnite (VPDB) standard and oxygen isotopic data are reported relative to the Vienna Standard Mean Ocean Water (VSMOW) standard. Stable isotopes in soil carbonates: The C 3 and C 4 photosynthetic pathways discriminate against heavier molecules of CO 2 to different degrees. Plants using C 4 photosynthesis have lower isotopic selectivity than C 3 plants due to the more efficient concentration of CO 2 at the carbon fixation enzyme RuBisCO. In other words, C 3 photosynthesis depletes 13 C relative to 12 C more than than C 4 photosynthesis. δ 13 C values of C 3 and C 4 plant tissue range from -22 0 / 00 to -30 0 / 00 and -10 0 / 00 to -14 0 / 00 , respectively (Fig. 1). 2 Decomposition of plant tissue in the soil creates a primary subsurface source of CO 2 for calcite precipitation. In soil greater than about 25 cm in depth, atmospheric CO 2 is a negligible component of the total CO 2 content. 3 The carbonate-bicarbonate equilibrium mainly controls calcite precipitation: CaCO 3 + H 2 O + CO 2 ↔ Ca 2 + + 2HCO 3 - . Ca 2 + concentration and pH seem to primarily drive calcite precipitation from soil water. 3 The diffusion of soil CO 2 to the atmosphere enriches the 13 C content of the remaining CO 2 , and the temperature-dependent precipitation of calcite results in further 13 C enrichment. In a soil containing only C 3 plants, isotopic fractionations during the process of calcite precipitation at depth should create carbonates with a δ 13 C value between -12.1 0 / 00 and -9.1 0 / 00 . Likewise, carbonates formed in soils containing only C 4 plants should have a δ 13 C value between +1.9 0 / 00 and +4.9 0 / 00 . On the Great Plains of the Neogene, a time when a significant proportion of C 4 plants has been present in that region, one expects that paleosol carbonates should have δ 13 C values between the C 3 and C 4 endmember values. Abstract: This study examines paleosol carbonates from two Pliocene sites in the panhandle of Texas to trace the development of C 4 biomass on the Great Plains. Isotopic data from these sites are compared to each other and to other data from the Neogene of the central and southern Great Plains. This study also analyzes outcrop-level and subsample variability. As hypothesized, the Pliocene level of C 4 biomass in the region lies between lower levels in the Miocene and higher levels in the Pleistocene. Chronology: Stage-of-evolution biochronology dates the Christian Ranch Local Fauna of the Texas Panhandle at 5.8 to 5.1 Ma, or the latest Miocene and earliest Pliocene. 6 In conjunction with magnetostratigraphy, the same approach dates the Upper and Lower Cita Canyon faunas at 3.9 to 3.4 Ma. 7 The overlap between the geochronologically dated first and last appearances of fossils found together at the site place the Cita Canyon faunas at 3.3 Ma. 8 Both approaches yield a date in the mid- to late Pliocene. The layers containing the two vertebrate assemblages of Upper Cita Canyon lie between 2.25 m and 7 m in the section (Fig. 5). The siltstone from 7 to 10 m outcrops at another site, Harrell Ranch, within North Cita Canyon, over which lies a Type O Pearlette Ash Bed. 9 This ash is dated at 0.60 Ma. 10 A majority of carbonate samples from Upper Cita Canyon were taken from a layer of prismatic carbonate above 10 m in the section, but are not necessarily younger than 0.60 Ma. If the ash was deposited after the carbonate, an upper age constraint of 0.60 Ma can be placed on the Upper Cita Canyon isotopic data. Acknowledgements: Thanks to the NSF REU program for funding and Lucy Chang, Laura Domingo, and Jonathan Marcot for assistance in the field and photographs. References: 1. Fig. 3 from Koch, P.L., 1998, Isotopic Reconstruction of Past Continental Environments. Annual Review of Earth and Planetary Sciences, v. 26, p. 573-613. 2. Cerling, T.E., Harris, J.M., MacFadden, B.J., Leakey, M.G., Quade, J., Eisenmann, V., and Ehleringer, J.R., 1997, Global vegetation change through the Miocene/Pliocene boundary. Nature, v. 389, 11 September 1997, p. 153-158. 3. Cerling, T.E. and Quade, J., 1993, Stable Carbon and Oxygen Isotopes in Soil Carbonates. Climate Change in Continental Isotopic Records, Geophysical Monograph 78, p. 217-231. 4. http://www.gpnps.org/region.htm. Great Plains Native Plant Society. 5. Fox, D.L. and Koch, P.L., 2004, Carbon and oxygen isotopic variability in Neogene paleosol carbonates: constraints on tzhe evolution of the C 4 -grasslands of the Great Plains, USA. Palaeogeography, Palaeoclimatology, Palaeoecology, v. 207, p. 305-329. 6. Tedford, R.H., Albright III, L.B., Barnosky, A.D., Ferrusquia-Villafranca, I., Hunt, Jr., R.M., Storer, J.E., Swisher III, C.C., Voorhies, M.R., Webb, S.D., and Whistler, D.P., 2004, Mammalian Biochronology of the Arikareean Through Hemphillian Interval (Late Oligocene Through Early Pliocene Epochs), in Woodburne, M.O., ed., Late Cretaceous and Cenozoic Mammals of North America: biostratigraphy and geochronology: Columbia University Press, p. 169-231. 7. Bell, C.J. and Lundelius, Jr., E.L. (co-chairmen of the committee of contributers), Barnosky, A.D., Graham, R.W., Lindsay, E.H., Ruez, Jr., D.R., Semken, Jr., H.A., Webb, S.D., and Zakrzewski, R.J., 2004, The Blancan, Irvingtonian, and Rancholabrean Mammal Ages, in Woodburne, M.O., ed., Late Cretaceous and Cenozoic Mammals of North America: biostratigraphy and geochronology: Columbia University Press, p. 232-314. 8. Alroy, J.M., 2007, http://paleodb.org/cgi-bin/bridge.pl?action=explainAEOestimate&user=Guest&collection_no=20033. The Paleobiology Database. 9. Johnston, C.S. and Savage, D.E., 1955, A Survey of the Various Late Cenozoic Vertebrate Faunas of the Panhandle of Texas Part I: Introduction, Description of Localities, Preliminary Faunal Lists: University of California Press. 10. Lindsay, E.H., 1997, The Pliocene-Pleistocene boundary in continental sequences of North America, in The Pleistocene Boundary and the Beginning of the Quaternary: Final Report: Cambridge University Press, p. 278-291. 11. Epstein, H.E., Lauenroth, W.K., Burke, I.C., and Coffin, D.P., 1997, Productivity patterns of C 3 and C functional types in the U.S. Great Plains. Ecology, v. 78, p. 722-731. Figure 2: Christian Ranch Section 1 δ 13 C (closed circle) and δ 18 O (open circle) values Figure 4: Christian Ranch Section 3 δ 13 C (closed circle) and δ 18 O (open circle) values Figure 3: Christian Ranch Section 2 δ 13 C (closed circle) and δ 18 O (open circle) values Figure 5: North Cita Canyon δ 13 C (closed circle) and δ 18 O (open circle) values. Data points in red were taken about 10 m away from and parallel to the black data points on the face of the outcrop. The data at 1.25 m are anomalous. Figure 6: Histograms of δ 13 C values, with the bottom graph containing the oldest samples and the top graph containing the youngest. To the right are descriptive statistics of each histogram’s data. 0 10 20 30 40 50 60 70 80 <-10 >1 -9 -8 -7 -6 -5 -4 -3 -2 -1 0 1 All Great Plains Miocene from Fox and Koch, 2004 Meade, KS Miocene Frequency δ 13 C (VPDB) <-10 0 2 4 6 8 10 >1 -9 -8 -7 -6 -5 -4 -3 -2 -1 0 1 Frequency δ 13 C (VPDB) 0 5 10 15 20 25 30 <-10 >1 -9 -8 -7 -6 -5 -4 -3 -2 -1 0 1 Frequency δ 13 C (VPDB) 0 1 2 3 4 5 6 7 <-10 >1 -9 -8 -7 -6 -5 -4 -3 -2 -1 0 1 Frequency δ 13 C (VPDB) <-10 >1 0 2 4 6 8 10 12 14 16 18 -9 -8 -7 -6 -5 -4 -3 -2 -1 0 1 Christian Ranch all data Christian Ranch sections 1 and 2 Frequency δ 13 C (VPDB) Figure 7: Histograms of intrasample δ 13 C and δ 18 O differences. Figure 6: A view of Palo Duro Canyon. North Cita Canyon is a tributary of this system, which lies at the headwaters of the Red River. The shaded yellow region of the inset map shows the current extent of the Great Plains. 4 The red dot marks the location of Palo Duro Canyon (Christian Ranch is approxi- mately 10 miles to the east). The blue dot marks the location of Meade, KS. Materials and methods: This study analyzes unpublished isotopic data from paleosol carbonates of Palo Duro Canyon State Park and Christian Ranch in the panhandle of Texas. Previously published Great Plains data from the Neogene are used for comparison. 5 Most collection sites were assigned an age estimate using the extensive mammalian biostratigraphy of the Great Plains. Carbonate nodules were collected from lower boundaries of carbonate layers and at least 30 cm below the top of the uppermost stratigraphic boundary to minimize the amount of carbon in the sample derived from atmospheric CO 2 . Nodules were identified as pedogenic (soil-formed) on the basis of external morphology, the presence of inclusions of overgrown clastic sediment, and the presence of nearby rhizoconcretions, or calcitic root traces. Two powder samples were drilled from different places on an unweathered surface of each nodule to estimate small-scale isotopic variability. These were roasted in vacuo at 400°C for at least 1 hour to remove organic matter and water. Samples were reacted with H 3 PO 4 at 70°C in a Kiel automatic carbonate extraction device and the isotopic composition of the resulting CO 2 was measured using a Finnigan MAT 252 gas source isotope ratio mass spectrometer at the University of Kansas. } } Triassic redbeds Neogene deposits Meade, KS late Pliocene and early Pleistocene 5 North Cita Canyon, TX mid- to late Pliocene Meade, KS mid-Pliocene 5 Christian Ranch, TX latest Miocene and earliest Pliocene All Great Plains Miocene 5 N = 21 Mean = -2.33 Standard deviation = 1.11 All data: N = 34 Mean = -3.41 Standard deviation = 1.04 Section 3: N = 11 Mean = -2.21 Standard deviation = 0.59 N = 107 Mean = -4.91 Standard deviation = 0.90 All data: N = 35 Mean = -5.61 Standard deviation = 1.73 Sections 1 and 2: N = 20 Mean = -6.52 Standard deviation = 0.36 All data: N = 230 Mean = -6.75 Standard deviation = 0.83 Meade, KS Miocene: N = 22 Mean = -7.10 Standard deviation = 0.83 Correlating isotopes with biomass: A simple linear-mixing model is used to correlate δ 13 C with C 4 biomass: δ 13 C = %C 4 biomass * δ 13 C C 4 endmember + (1- %C 4 biomass) * δ 13 C C 3 endmember Carbonate nodules form on a scale of hundreds to thousands of years, so δ 13 C values integrate a vegetational signal over that time. 5 Statistical analysis: Fig. 6 shows the increasing abundance of C 4 plants on the Great Plains through the Neogene. ANOVA indicates that not all the δ 13 C means of the data sets from Fig. 6 are similar. The comparison of all pairs of means using Scheffé’s Test at the significance level α of 0.05 discerns individual mean inequalities. Of note, the difference between the North Cita Canyon and early Pliocene Meade, KS means is greater than the critical difference, indicating that they are statistically dissimilar. These data could overlap temporally, suggesting that the difference in C 4 biomass might be controlled by latitudinal mean annual temperature variation, with higher C 4 biomass in warmer southern climes. This pattern controls much of the distribution of C 3 and C 4 plants on the modern Great Plains. 11 Fig. 7 shows that the variability within carbonate nodules is small relative to the standard deviations of the isotopic data from each locality. Thus, variation within sections is not significantly influenced by intrasample variability. Isotopic values from two parallel sections in North Cita Canyon vary considerably (Fig. 5). Consistent with observations of the canyon’s modern vegetational dispersion, this indicates landscape-level patchiness in C 4 dominance and fluctuations in aridity and soil water source. Figure 1: Sources of carbon isotope fractionation 1 North Cita Canyon all data North Cita Canyon parallel section 3
Transcript of The Pliocene history of C grasslands on the Texas ... · 2004, Mammalian Biochronology of the...
C3 photosynthesisδ13C = -19‰
C4 photosynthesisδ13C = -5‰
C3 plants-25.5‰
C3 SOM-25.5‰
C3 CO3-12.1 to -9.1‰
C4 plants-11.5‰
C4 SOM-11.5‰
C4 CO3+1.9 to 4.9‰
C3 feedersapatite -11.4‰
C4 feedersapatite +2.6‰
atmospheric CO2-6.5‰
soil CO2
metabolism and biosynthesisδ13C = +14.1‰
12CO2δ13C = +4.4‰
T dependent pptδ13C = +9-12‰
12
11.5
11
10.5
10
9.5
9
8.5
8
7.5
7
6.5
6
5.5
5
4.5
4
3.5
3
2.5
2
1.5
1
0.5
0-10 -8 -6 -4 -2 0 21 25 29 33
4
8
12
0
end of section
0 20 40 60 8010 30 50 70
Percent C4 Biomass
Met
ers M
eters
7
6.5
6
5.5
5
4.5
4
3.5
3
2.5
2
1.5
1
0.5
0-10 -8 -6 -4 -2 0 21 25 29 33
0
modern soil
2
4
6
0 20 40 60 8010 30 50 70
Percent C4 Biomass
Met
ers M
eters
-10 -8 -6 -4 -2 0 21 25 29 33
8
16
24
0
28
27
26
25
24
23
22
21
20
19
18
17
16
15
14
13
12
11
10
9
8
7
6
5
4
3
2
1
0
0 20 40 60 8010 30 50 70
Percent C4 Biomass
Met
ers M
eters
-10 -8 -6 -4 -2 0 21 25 29 33
4
8
12
0
14.5
14
13.5
13
12.5
12
11.5
11
10.5
10
9.5
9
8.5
8
7.5
7
6.5
6
5.5
5
4.5
4
3.5
3
2.5
2
1.5
1
0.5
0
modern soil
0 20 40 60 8010 30 50 70
Percent C4 Biomass
Met
ers M
eters
0
2
4
6
8
10
12
14
16
0.1
0.2
0.3
0.4
0.5
0.7
0.8
0.9
1.0 1.1
≥1.2
F req
uen
cy
δ18O (VSMOW)
0.60
1.2
North Cita Canyon intranodule δ18O variability
Christian Ranch intranodule δ13C variability
0
2
4
6
8
10
12
14
0.1
0.2
0.3
0.4
0.5
0.7
0.8
0.9
1.0 1.1
≥1.1
0.60
F req
uen
cy
δ13C (VPDB)
0
2
4
6
8
10
12
14
16
0.25 0.
50.
751
1.25
1.75 2
2.5
2.75 3
≥3.51.50
2.25
3.25 3.
5
Christian Ranch intranodule δ18O variability
Freq
uen
cy
δ18O (VSMOW)
0
2
4
6
8
10
0.1
0.2
0.3
0.4
0.5
0.7
0.8
0.9
1.0 1.1
≥1.1
0.60
North Cita Canyon intranodule δ13C variability
Freq
uen
cy
δ13C (VPDB)
The Pliocene history of C4 grasslands on the Texas panhandle: temporal and spatial variabilitySamuel E. Miller1 and David L. Fox2
1Department of Geology, Amherst College, Amherst, MA 010022Department of Geology and Geophysics, University of Minnesota, Twin Cities, Minneapolis, MN 55455
Introduction to stable isotopes:
Stable isotopes in paleosols, or fossil soils, provide evidence of past vegetational and climatic patterns. The ratio of 13C to 12C in paleosol carbonate nodules serves as a proxy for the relative abundance of plants using the C3 and C4 photosynthetic pathways. The ratio of 18O to 16O in these nodules reflects both soil temperature and the isotopic compo- sition of local meteoric water at the time of carbonate precipitation. Denoted by the variable Rsam, the ratio of rare to common isotope in the sample is compared to a standard ratio, Rstd, to calculate a δ value in parts per thousand (0/00). For example, to find the δ value of 13C data:
δ13C = ((13Csam/12Csam)/(13Cstd/12Cstd) - 1) * 1000
= ((Rsam/Rstd) - 1) * 1000.
Carbon isotopic data are reported relative to the Vienna Pee Dee Belemnite (VPDB) standard and oxygen isotopic data are reported relative to the Vienna Standard Mean Ocean Water (VSMOW) standard.
Stable isotopes in soil carbonates:
The C3 and C4 photosynthetic pathways discriminate against heavier molecules of CO2 to different degrees. Plants using C4 photosynthesis have lower isotopic selectivity than C3 plants due to the more efficient concentration of CO2 at the carbon fixation enzyme RuBisCO. In other words, C3 photosynthesis depletes 13C relative to 12C more than than C4 photosynthesis. δ13C values of C3 and C4 plant tissue range from -220/00 to -300/00 and -100/00 to -140/00, respectively (Fig. 1).2
Decomposition of plant tissue in the soil creates a primary subsurface source of CO2 for calcite precipitation. In soil greater than about 25 cm in depth, atmospheric CO2 is a negligible component of the total CO2 content.3 The carbonate-bicarbonate equilibrium mainly controls calcite precipitation:
CaCO3 + H2O + CO2 ↔ Ca2+ + 2HCO3-.
Ca2+ concentration and pH seem to primarily drive calcite precipitation from soil water. 3 The diffusion of soil CO2 to the atmosphere enriches the 13C content of the remaining CO2, and the temperature-dependent precipitation of calcite results in further 13C enrichment. In a soil containing only C3 plants, isotopic fractionations during the process of calcite precipitation at depth should create carbonates with a δ13C value between -12.10/00 and -9.10/00. Likewise, carbonates formed in soils containing only C4 plants should have a δ13C value between +1.90/00 and +4.90/00. On the Great Plains of the Neogene, a time when a significant proportion of C4 plants has been present in that region, one expects that paleosol carbonates should have δ13C values between the C3 and C4 endmember values.
Abstract:
This study examines paleosol carbonates from two Pliocene sites in the panhandle of Texas to trace the development of C4 biomass on the Great Plains. Isotopic data from these sites are compared to each other and to other data from the Neogene of the central and southern Great Plains. This study also analyzes outcrop-level and subsample variability. As hypothesized, the Pliocene level of C4 biomass in the region lies between lower levels in the Miocene and higher levels in the Pleistocene.
Chronology:
Stage-of-evolution biochronology dates the Christian Ranch Local Fauna of the Texas Panhandle at 5.8 to 5.1 Ma, or the latest Miocene and earliest Pliocene.6 In conjunction with magnetostratigraphy, the same approach dates the Upper and Lower Cita Canyon faunas at 3.9 to 3.4 Ma.7 The overlap between the geochronologically dated first and last appearances of fossils found together at the site place the Cita Canyon faunas at 3.3 Ma.8 Both approaches yield a date in the mid- to late Pliocene.
The layers containing the two vertebrate assemblages of Upper Cita Canyon lie between 2.25 m and 7 m in the section (Fig. 5). The siltstone from 7 to 10 m outcrops at another site, Harrell Ranch, within North Cita Canyon, over which lies a Type O Pearlette Ash Bed.9 This ash is dated at 0.60 Ma.10 A majority of carbonate samples from Upper Cita Canyon were taken from a layer of prismatic carbonate above 10 m in the section, but are not necessarily younger than 0.60 Ma. If the ash was deposited after the carbonate, an upper age constraint of 0.60 Ma can be placed on the Upper Cita Canyon isotopic data.
Acknowledgements:
Thanks to the NSF REU program for funding and Lucy Chang, Laura Domingo, and Jonathan Marcot for assistance in the field and photographs.
References:
1. Fig. 3 from Koch, P.L., 1998, Isotopic Reconstruction of Past Continental Environments. Annual Review of Earth and Planetary Sciences, v. 26, p. 573-613.2. Cerling, T.E., Harris, J.M., MacFadden, B.J., Leakey, M.G., Quade, J., Eisenmann, V., and Ehleringer, J.R., 1997, Global vegetation change through the Miocene/Pliocene boundary. Nature, v. 389, 11 September 1997, p. 153-158.3. Cerling, T.E. and Quade, J., 1993, Stable Carbon and Oxygen Isotopes in Soil Carbonates. Climate Change in Continental Isotopic Records, Geophysical Monograph 78, p. 217-231.4. http://www.gpnps.org/region.htm. Great Plains Native Plant Society.5. Fox, D.L. and Koch, P.L., 2004, Carbon and oxygen isotopic variability in Neogene paleosol carbonates: constraints on tzhe evolution of the C4-grasslands of the Great Plains, USA. Palaeogeography, Palaeoclimatology, Palaeoecology, v. 207, p. 305-329.6. Tedford, R.H., Albright III, L.B., Barnosky, A.D., Ferrusquia-Villafranca, I., Hunt, Jr., R.M., Storer, J.E., Swisher III, C.C., Voorhies, M.R., Webb, S.D., and Whistler, D.P., 2004, Mammalian Biochronology of the Arikareean Through Hemphillian Interval (Late Oligocene Through Early Pliocene Epochs), in Woodburne, M.O., ed., Late Cretaceous and Cenozoic Mammals of North America: biostratigraphy and geochronology: Columbia University Press, p. 169-231.7. Bell, C.J. and Lundelius, Jr., E.L. (co-chairmen of the committee of contributers), Barnosky, A.D., Graham, R.W., Lindsay, E.H., Ruez, Jr., D.R., Semken, Jr., H.A., Webb, S.D., and Zakrzewski, R.J., 2004, The Blancan, Irvingtonian, and Rancholabrean Mammal Ages, in Woodburne, M.O., ed., Late Cretaceous and Cenozoic Mammals of North America: biostratigraphy and geochronology: Columbia University Press, p. 232-314.8. Alroy, J.M., 2007, http://paleodb.org/cgi-bin/bridge.pl?action=explainAEOestimate&user=Guest&collection_no=20033. The Paleobiology Database.9. Johnston, C.S. and Savage, D.E., 1955, A Survey of the Various Late Cenozoic Vertebrate Faunas of the Panhandle of Texas Part I: Introduction, Description of Localities, Preliminary Faunal Lists: University of California Press.10. Lindsay, E.H., 1997, The Pliocene-Pleistocene boundary in continental sequences of North America, in The Pleistocene Boundary and the Beginning of the Quaternary: Final Report: Cambridge University Press, p. 278-291.11. Epstein, H.E., Lauenroth, W.K., Burke, I.C., and Coffin, D.P., 1997, Productivity patterns of C3 and C
4
functional types in the U.S. Great Plains. Ecology, v. 78, p. 722-731.δ13C
Figure 2: Christian Ranch Section 1 δ13C (closed circle) and δ18O (open circle) values
Figure 4: Christian Ranch Section 3 δ13C (closed circle) and δ18O (open circle) values
Figure 3: Christian Ranch Section 2 δ13C (closed circle) and δ18O (open circle) values
Figure 5: North Cita Canyon δ13C (closed circle) and δ18O (open circle) values. Data points in red were taken about 10 m away from and parallel to the black
data points on the face of the outcrop. The data at 1.25 m are anomalous.
Figure 6: Histograms of δ13C values, with the bottom graph containing the oldest samples and the top graph containing the youngest. To the
right are descriptive statistics of each histogram’s data.
0
10
20
30
40
50
60
70
80
<-10 >1-9 -8 -7 -6 -5 -4 -3 -2 -1 0 1
All Great Plains Miocenefrom Fox and Koch, 2004
Meade, KS Miocene
Freq
uen
cy
δ13C (VPDB)
<-10
0
2
4
6
8
10
>1-9 -8 -7 -6 -5 -4 -3 -2 -1 0 1
Freq
uen
cy
δ13C (VPDB)
0
5
10
15
20
25
30
<-10 >1-9 -8 -7 -6 -5 -4 -3 -2 -1 0 1
Freq
uen
cy
δ13C (VPDB)
0
1
2
3
4
5
6
7
<-10 >1-9 -8 -7 -6 -5 -4 -3 -2 -1 0 1
Freq
uen
cy
δ13C (VPDB)
<-10 >1
0
2
4
6
8
10
12
14
16
18
-9 -8 -7 -6 -5 -4 -3 -2 -1 0 1
Christian Ranch all data
Christian Ranchsections 1 and 2
Freq
uen
cy
δ13C (VPDB)
Figure 7: Histograms of intrasample δ13C and δ18O differences.
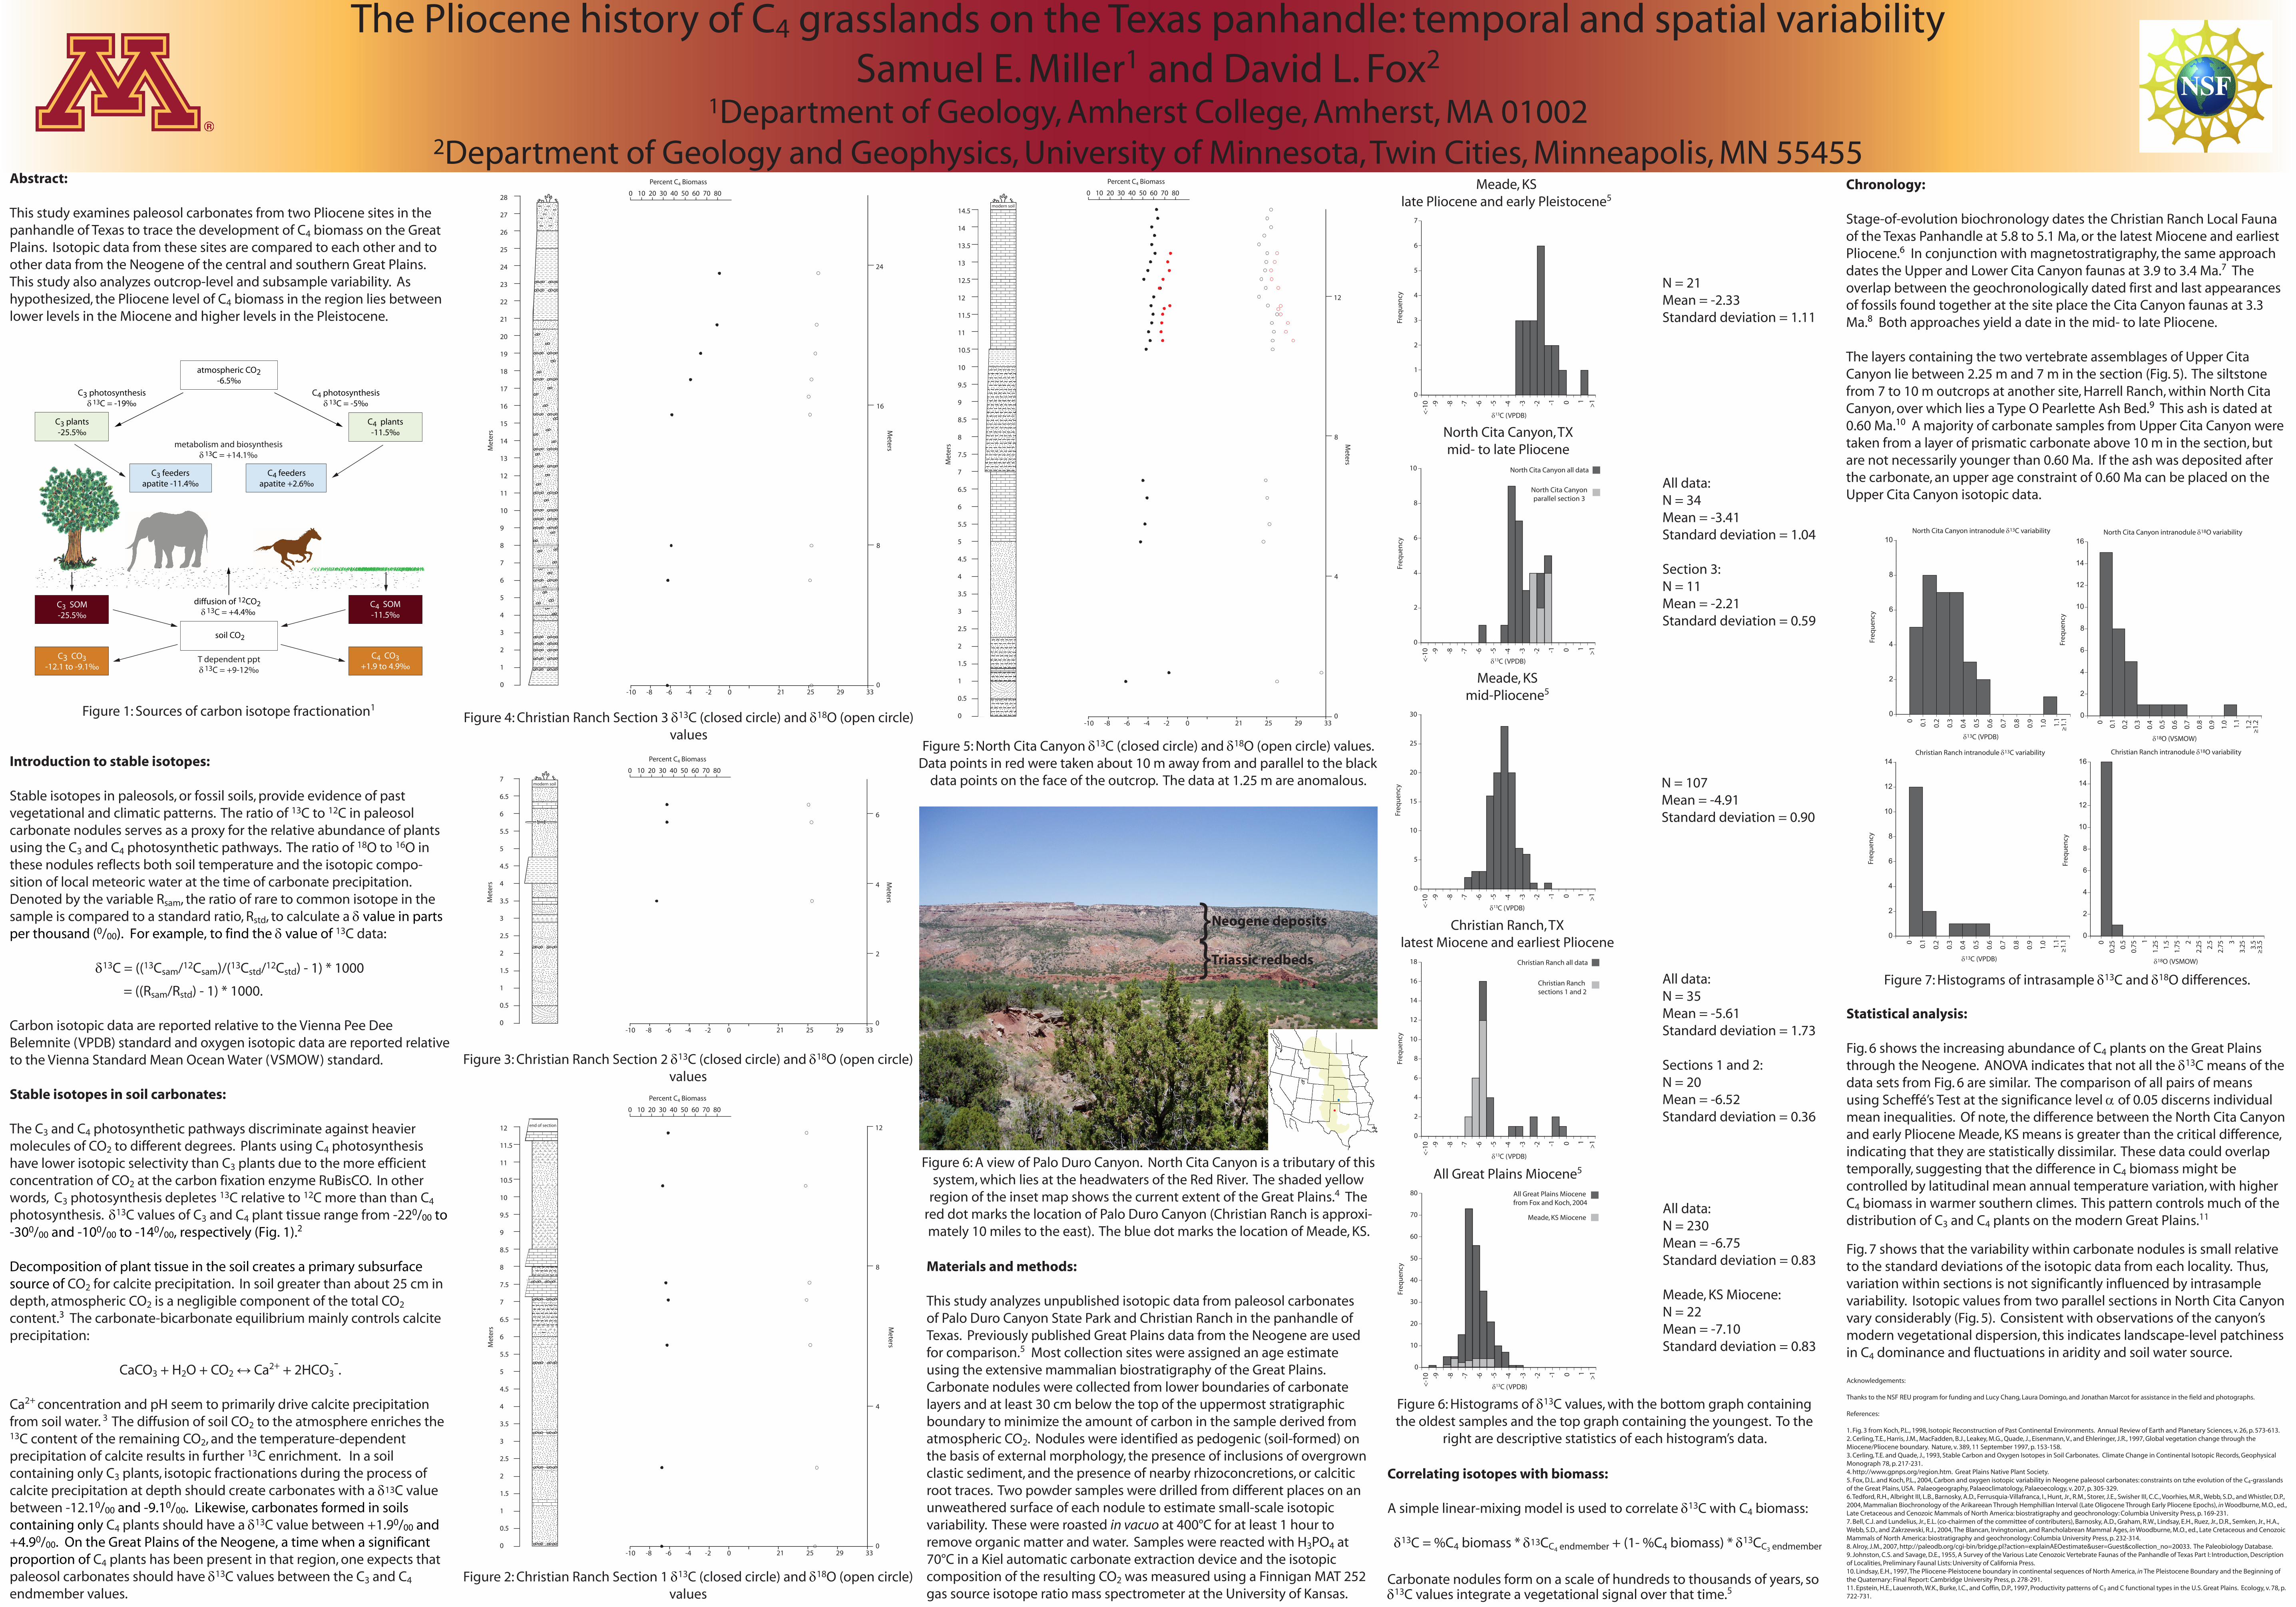
Figure 6: A view of Palo Duro Canyon. North Cita Canyon is a tributary of this system, which lies at the headwaters of the Red River. The shaded yellow
region of the inset map shows the current extent of the Great Plains.4 The red dot marks the location of Palo Duro Canyon (Christian Ranch is approxi-mately 10 miles to the east). The blue dot marks the location of Meade, KS.
Materials and methods:
This study analyzes unpublished isotopic data from paleosol carbonates of Palo Duro Canyon State Park and Christian Ranch in the panhandle of Texas. Previously published Great Plains data from the Neogene are used for comparison.5 Most collection sites were assigned an age estimate using the extensive mammalian biostratigraphy of the Great Plains. Carbonate nodules were collected from lower boundaries of carbonate layers and at least 30 cm below the top of the uppermost stratigraphic boundary to minimize the amount of carbon in the sample derived from atmospheric CO2. Nodules were identified as pedogenic (soil-formed) on the basis of external morphology, the presence of inclusions of overgrown clastic sediment, and the presence of nearby rhizoconcretions, or calcitic root traces. Two powder samples were drilled from different places on an unweathered surface of each nodule to estimate small-scale isotopic variability. These were roasted in vacuo at 400°C for at least 1 hour to remove organic matter and water. Samples were reacted with H3PO4 at 70°C in a Kiel automatic carbonate extraction device and the isotopic composition of the resulting CO2 was measured using a Finnigan MAT 252 gas source isotope ratio mass spectrometer at the University of Kansas.
}}
Triassic redbeds
Neogene deposits
Meade, KSlate Pliocene and early Pleistocene5
North Cita Canyon, TXmid- to late Pliocene
Meade, KSmid-Pliocene5
Christian Ranch, TXlatest Miocene and earliest Pliocene
All Great Plains Miocene5
N = 21Mean = -2.33Standard deviation = 1.11
All data:N = 34Mean = -3.41Standard deviation = 1.04
Section 3:N = 11Mean = -2.21Standard deviation = 0.59
N = 107Mean = -4.91Standard deviation = 0.90
All data:N = 35Mean = -5.61Standard deviation = 1.73
Sections 1 and 2:N = 20Mean = -6.52Standard deviation = 0.36
All data:N = 230Mean = -6.75Standard deviation = 0.83
Meade, KS Miocene:N = 22Mean = -7.10Standard deviation = 0.83
Correlating isotopes with biomass:
A simple linear-mixing model is used to correlate δ13C with C4 biomass:
δ13C = %C4 biomass * δ13CC4 endmember + (1- %C4 biomass) * δ13CC3 endmember
Carbonate nodules form on a scale of hundreds to thousands of years, so δ13C values integrate a vegetational signal over that time.5
Statistical analysis:
Fig. 6 shows the increasing abundance of C4 plants on the Great Plains through the Neogene. ANOVA indicates that not all the δ13C means of the data sets from Fig. 6 are similar. The comparison of all pairs of means using Scheffé’s Test at the significance level α of 0.05 discerns individual mean inequalities. Of note, the difference between the North Cita Canyon and early Pliocene Meade, KS means is greater than the critical difference, indicating that they are statistically dissimilar. These data could overlap temporally, suggesting that the difference in C4 biomass might be controlled by latitudinal mean annual temperature variation, with higher C4 biomass in warmer southern climes. This pattern controls much of the distribution of C3 and C4 plants on the modern Great Plains.11
Fig. 7 shows that the variability within carbonate nodules is small relative to the standard deviations of the isotopic data from each locality. Thus, variation within sections is not significantly influenced by intrasample variability. Isotopic values from two parallel sections in North Cita Canyon vary considerably (Fig. 5). Consistent with observations of the canyon’s modern vegetational dispersion, this indicates landscape-level patchiness in C4 dominance and fluctuations in aridity and soil water source.
Figure 1: Sources of carbon isotope fractionation1
North Cita Canyon all data
North Cita Canyonparallel section 3