The Large Intestine in Nutrition and Disease
161
The Large Intestine in Nutrition and Disease
Transcript of The Large Intestine in Nutrition and Disease

The Large Intestinein Nutritionand Disease
The Large Intestine
in Nutrition and Disease
Dr. John H. CUMMINGS
Course given in the frame of the Chaire Danone 1995Edited by the Institut Danone in 1997

© Institut Danonerue du Duc, 100B-1150 BRUXELLES (Belgique)e-mail: institut [email protected]://www.danone-institute.behttp://www.danone-institute.com
D/1997/7468/1ISBN 2-930151-02-1
α-glucosidase inhibitor 48β-galactosidase 17ß-sitosterol 502-bromooctanoate 802-mercaptoacetate 812-methylbutyrate 543-mercaptopropionate 815-ASA 81, 84
A/V differences 50, 51, 54absorption 55acetate 64acetic acid 1, 53acetogenesis 72, 75Acidaminococcus 9actinomyces 8adriamycin 63Africa 5, 15, 28, 29, 51alcohol 65, 105, 106alkaline phosphatase 62amines 2, 13, 14, 21amino acid 41, 54ammonia 2, 13, 14, 49, 50, 68ampicillin 47amylopectin 18, 21, 80amylose 18, 21, 23analysis of dietary fibre 33anatomy 5-6antibiotics 21, 47, 95apoptosis 61, 63, 64, 82arabinogalactan 45, 53arabinoxylan 98arrest of cell growth 62artichokes 19athymic mice 81Austria 37, 38autonomic nervous system 60
Bacillus 9bacitracin 47bacteria 5-7, 95Bacteroides 7, 8, 20, 41Bacteroides ovatus 48, 49BALB/c mice 81banana 22, 23, 25-27, 36beans 68, 98
Belgium 19, 37, 103 bicarbonate 55, 56Bifidobacterium 7, 19-21, 41, 46Bifidobacterium bifidum 7, 8Bifidobacterium breve 49Bifidobacterium infantis 7, 8bile acid metabolism 30, 39, 107, 110biomass 5, 9, 95, 96bladder cancer 103blood cholesterol 21, 39, 65blood glucose 17, 65bottle-fed babies 87bowel habit 87-91bowel rest 65brain 43, 64branched-chain fatty acids 54breads 43, 98breast cancer 103, 104breast-fed babies 21, 87breath hydrogen 27, 28, 70, 72Brussels sprouts 68BURKITT 29, 30, 108, 109butyrate clearance 58butyrate oxidation 79, 81, 82butyric acid 1, 110
caecum 1, 5, 18, 43, 46, 54, 80calcium 12, 93, 108cancer deaths 103, 104caproate 44carbohydrate malabsorption 10carbohydrates 9, 10, 15-28, 46, 70, 95carbon dioxide 49, 52, 56, 58, 68carbonic anhydrase 56carboxymethylcellulose (CMC) 99, 100carcinogens 107, 108, 110cardiac muscle 64cardiovascular disease 19, 29, 31carrageenan 80, 81cell growth and differentiation
57, 106, 110cell metabolism 57cell wall polysaccharides 53, 94cellulose 18,93, 94, 99cereal starches 22cervical cancer 103, 104
Index
chemist 33chemistry 17, 29, 31, 99chewing 23, 24, 39chicory 19, 101children 46, 50, 53, 72chloride 83chloride-bicarbonate exchange 56chondroitin 80chromatin structure 63classification of dietary carbohydrates
16-18CLEAVE 29clindamycin 47Clostridium 7-9, 20, 21Clostridium bifermentans 9Clostridium perfringens 9, 19, 48, 49Clostridium tetani 9co-trimoxazole 47colistin 47colonic epithelial cell
43, 52, 55, 57, 58, 60colonocyte 43, 57, 81, 82colonoscopy 80colostomy 43, 44, 58constipation 32, 39, 90, 96, 97-98coprostanol 50coprostanone 50corn bran 46, 94cornflakes 25-27, 36COST 37Croatia/Yugoslavia 37, 38crude fibre 30cryptcell production rate (CCPR) 59, 61cytoskeletal organisation 62
dangers of eating fibre 96definition of dietary fibre 29-33defunctioned colon 85Denmark 37, 89dental caries 19deoxycholate 39, 107Desulfobulbus 74Desulfovibrio 8, 74dexamethasone 62dextran-sulphate model 80, 81dextran sulphate sodium (DSS) 81diabetes 19, 21, 29, 31, 32, 39, 98diarrhoea 46, 47-48, 83dietary fibre 29-33, 91, 95
dietary fibre intakes37, 38, 91-93, 96, 106, 109
differentiation 61-64, 106, 110disaccharides 18, 101distal colon 56, 58, 73, 74, 82, 83diversion colitis 43, 65, 85diverticular disease 3, 30, 32, 39DNA damaging agents 63, 107, 108doxycycline 47Dugong 44
electrolyte transport 11elephant 1, 45energy metabolism 53ENGLYST 24, 34-36enteral feeding 43, 98enzymatic chemical methods 34enzymatic gravimetric methods 33epithelial cell 30, 57, 59, 64epithelial cell proliferation 59erythromycin 47Escherichia coli 9estuarine sediment 73ethanethiol 68ethanol 33, 68, 72Eubacterium 7, 8exercise 88, 106experimental colitis 80
faecal SCFA 47, 83faecal sulphide 81faeces 5, 13, 44, 74,108familial adenomatous polyposis (FAP)
106, 107fasting 51, 52fat 107fecapetaene 107, 108fermentation 8, 12, 15, 45-46, 68, 96Finland 37, 38, 89flatus 13, 68, 96food structure 31, 39formate 49, 69France 37free fatty acid 65fructooligosaccharides (FOS) 18-21, 101fucose 41fusobacteria 20
gallstones 29, 39
INDEX
garlic 19, 101gastric emptying 39gelatinisation 23-25, 33gene expression 61-63germ-free animal 57, 80Germany, FRG 37Germany, GDR 37glucose 39, 58, 65glutamine 58, 86gluten-free diets 98glycemic index 27GSTµ 108guar 18, 45, 96guinea pig 55, 56, 58, 80gut contents 54, 96
H2S 68, 74, 75hardness and dryness of stools 87HDL cholesterol 65heart 29, 32, 43hemicellulose 18heterocyclic amines 108hexosamines 41histone acetylation 61, 63horse 56household food surveys 38hydrogen 52, 69-72hydrogen metabolism 67-68Hylon VII 48hypermethylation of DNA 63
ileostomy 9, 10, 27, 28, 41, 52ileum 9, 59, 86immune function 21, 81India 15, 28, 89insulin 23, 39, 62, 65intestinal gas 19, 67, 68intestinal resection 47inulin 17, 19, 21, 54IQ 108irritable bowel 3, 39isobutyrate 54isoleucine 54isovalerate 54ispaghula 18, 96, 98-100Italy 37
Japan 19, 89, 103jejunal trophic effect 59, 60
karaya 18ketone bodies 58kidney 43KLASON lignin 33, 34
labelling index 61, 84lactate 46, 68, 83, 86Lactobacillus 7, 8, 20lactose 17, 31, 53lactose intolerance 68lactulose
16, 27, 47, 51, 68, 69, 71, 77, 101large bowel 3, 14large bowel cancer
32, 61, 64, 72, 103, 108, 109large bowel cancer - genetic abnormalities
106, 107large bowel cancer - epidemiology
105, 106large intestine 2, 5, 6, 13laxatives 94, 98, 101LDL cholesterol 65left colon 14, 43, 90, 97legumes 22, 23, 25, 93, 94, 98leucine 54lignin 32-34, 94lipid metabolism XIII, 21liver 50, 65long-distance runners 88lung cancer 103, 104
magnesium 12, 55, 93MAILLARD reaction products 37maize 26, 28, 43Malaysia 89Manatee 44, 45mannitol 47marine sediment 73mean transit time (MTT) 49-50, 72meat 106, 108methanogenic bacteria (MB) 73, 76Megasphaera elsdenii 9MeIQ 108menstrual cycle 88mercaptans 68metabolism of SCFA 57, 64-65, 79, 80methanethiol 68Methanobrevibacter 8, 73, 74methanogenic 73-76
INDEX
Methanosphaera stadtmaniae 73methylcellulose 99, 100methylmalonicaciduria 53metronidazole 47, 64, 80, 86mineral absorption 30, 39mineral malabsorption 96monkey 48motor activity 96mucin 30, 41, 75mucosal growth 59-60mucus 2, 16, 41, 74, 76multichamber fermentation system 49muscle 14, 43, 50
nalidixic acid 47neomycin 47Netherlands 51, 103, 104New Zealand 51, 89nitrate 2, 41, 57nitrosamines 108non-cellulosic polysaccharides 31non-starch polysaccharides (NSP)
9, 29-31, 91, 92, 94, 95, 110Norway 37nystatin 47
oats 36, 93, 94obesity 19, 29, 30, 32, 39, 105oesophageal cancer 103, 104ofloxacin 47old age 39, 87, 96, 98oligosaccharides 15, 17, 19-21, 31olsalazine 81onions 19, 101organic acids 16outlet obstruction 97ovarian cancer 103, 104oxygen 58
P4501A2 108PAINTER 30pancreatic amylase 22-25pancreatic cancer 103, 104pancreatic enzymes 16, 22parenteral infusions 65particle size 39pea fibre 45pectin 45, 47, 53, 69, 93, 94, 96penetrometer 87
penicillin 47Peptostreptococcus 9Peru 89pH 11, 13, 21, 46, 55, 56, 60, 83phenols 2, 13, 14, 49, 50PhIP 108phosphate 12physical property of NSP 94, 95physically inaccessible starch 24-26phytate 93, 96, 100, 101pig 44, 45, 48, 53pivampicillin 47placental-like alkaline phosphatase (PLAP)
61, 62plasma gastrin 60pneumatosis cystoides intestinalis (PCI)
76-77polydextrose 16, 101polysaccharides 17, 18, 92portal blood 51, 52, 58portal vein 50potassium 11, 12potatoes 22, 23, 25, 26, 43potential difference 55pouchitis 86premature infants 53propionate 65propionibacteria 8, 46propionic acid 1, 19, 65PROSKY 33-36protein 13, 40, 50, 54proximal colon 56, 58prunes 101pyrodextrins 16, 17, 19
radio-opaque pellets 90, 97raffinose 18, 19, 47rapidly available glucose (RAG) 27rapidly digestible starch (RDS) 24-26rat 1, 21, 48, 57, 59, 60, 80-82rectum 89, 90, 105regional differences 13-14resistant starch (RS) 15, 24, 25, 101retrogradation 24, 25Rice Krispies 26right colon 14, 43, 44, 90, 97, 106RS1 24-26RS2 24-26, 69RS3 24-26
INDEX
rumen 44, 50, 55, 73Ruminoccus 8, 9, 41
salicylates 81Sarcina ventriculi 9satiety 30, 39SCFA enemas 83, 84, 86SCFA production rates 50, 51short-chain fatty acids (SCFA)
12, 13, 43-54, 83sigmoid colon 14, 44, 90, 97skeletal muscle 64slowly digestible starch 24sodium 12, 57sodium absorption 57sodium lignosulphonate 80sodium sulphite 81soluble fibre 96, 98SOUTHGATE 30, 37soya 46, 94spaghetti 23, 25, 26Spain 37spirochaete 9stable isotope 53stachyose 18, 19starch 21-28, 48starch digestion 10, 22-24, 27, 28starch granules 21-24starvation 65, 85sterculia 18, 98-100steroids 84sterol absorption 39stoichiometry 52-53, 68stomach cancer 103, 104stool weight
39, 47, 87-89, 92, 93, 95, 96, 99, 109streptococci 7Streptococcus bovis 9Streptococcus equinus 9Streptococcus faecalis 9Streptococcus salivarius 9substrates for fermentation 15succinate 47, 48, 49sugar alcohols 16, 18, 31sugar beet 46sugars 17, 18sulfasalazine 81sulphate 2, 50, 73-75, 91, 101
sulphate-reducing bacteria (SRB)46, 73-75, 81
sulphated amylopectin 80sulphide 2, 73-75, 81, 82sulphur metabolism 80, 85Sweden 37, 89Switzerland 37, 38
tanins 33TCA cycle 58TGF 64transcription 61, 63, 110transit 5, 49, 89-91triglycerides 21, 65trophic effect 59, 60TROWELL 29-31
Uganda 28, 29, 89UK5, 9, 30, 34, 37, 43, 51, 88-90, 92, 98, 103ulcerative colitis (UC) 3, 43, 65, 79-84, 97unavailable carbohydrate 30urea 16, 41USA 51, 89
valine 54vancomycin 47Veillonella 9venous blood 51, 64viscosity 39
WALKER 30water 5, 11, 12, 57, 87water-holding capacity 39, 47, 94, 100wheat 11, 93wheat bran 10, 93, 100white bread 26whole body calorimeter 69
x-ray 5, 6, 63, 90x-ray diffraction patterns 22, 23xylan 47
zinc 93
INDEX
Contents
Avant-propos IXForeword XAcknowledgements XIISummary XIII
1 – Introduction 1
2 – Anatomy, Bacteriology and Function 5
2-1 Anatomy 52-2 Bacteria 52-3 Function 9
2-3-1 Regional differences 13
3 – Carbohydrate and Protein Digestion: the Substrates Availablefor Fermentation 15
3-1 Introduction 153-2 Carbohydrates 15
3-2-1 Classification of Dietary Carbohydrates 163-2-2 Sugars 173-2-3 Oligosaccharides 193-2-4 Starches 213-2-5 Non-Starch Polysaccharides – Dietary Fibre 29
3-3 Protein and Nitrogen 403-4 Mucus 413-5 Summary 41
4 – Short-Chain Fatty Acids 43
4-1 Introduction 434-2 Occurrence of SCFA in Hindgut 434-3 In Vitro Studies of Fermentation 454-4 Effect of Antibiotics on Faecal SCFA 474-5 SCFA and Diarrhoea 474-6 Diet 484-7 Microflora 484-8 Transit Time 494-9 SCFA Production Rates 50
4-9-1 Studies of Portal Blood 514-9-2 Stoichiometry 52
4-9-3 Stable Isotope Studies 534-9-4 Amino Acids as Substrates 54
4-10 Absorption 55
4-10-1 General Mechanisms 554-10-2 Bicarbonate 564-10-3 Sodium 57
4-11 Cell Metabolism and Growth 57
4-11-1 Energy Metabolism 574-11-2 Mucosal Growth 59
4-12 Differentiation, Gene Expression and Large Bowel Cancer 61
4-12-1 Properties of Butyrate 614-12-2 Cellular Mechanisms 63
4-13 Metabolism of SCFA 64
4-13-1 Acetate 644-13-2 Propionate 65
5 – Hydrogen Metabolism 67
5-1 Introduction 675-2 Hydrogen H2 695-3 Methane 725-4 Sulphate and Sulphide 735-5 Acetogenesis 755-6 Pneumatosis Cystoides Intestinalis 76
6 – Colitis and Pouchitis 79
6-1 Ulcerative Colitis 79
6-1-1 Sulphur Metabolism 806-1-2 Faecal SCFA in UC 836-1-3 SCFA Enemas 83
6-2 Diversion Colitis 856-3 Pouchitis 86
7 – Bowel Habit and Constipation 87
7-1 Bowel Habit 87
7-1-1 Frequency 877-1-2 Consistency 877-1-3 Stool Weight 877-1-4 Transit Time 897-1-5 Diet and Bowel Habit 91
7-2 Constipation 97
7-2-1 Constipation and Diet 987-2-2 Bulk Laxatives 987-2-3 Other Laxative Dietary Constituents 101
8 – Diet and Large Bowel Cancer 103
8-1 Introduction 1038-2 Epidemiology 1058-3 Genetics 1068-4 Mechanisms 107
8-4-1 Fat 1078-4-2 Meat 1088-4-3 Protective Mechanisms 108
8-5 Conclusion 110
References 111
Index 151
Avant-propos
The Institut Danone is an association of scientists involved in humannutrition. Its mission is to forge links between the scientific community and healthand education professionals. It was within this perspective that the Institut createdthe Danone Chair.
The aim of the Danone Chair is to diffuse recent findings in the field ofhuman nutrition. Each year, one French-speaking university and one Dutch-speaking university from Belgium organise a course of lectures headed by aBelgian or foreign authority in the field. This course, aimed at a multi-disciplinaryuniversity audience, includes an introductory lecture followed by a 15 hourcourse. The full set of lectures is published by the Institut Danone as a monograph.
The Danone Chair was awarded during the 1994–1995 academic year tothe Université Catholique de Louvain and the Katholieke Universiteit Leuven.Holders of the Chair were Dr. John Hedley CUMMINGS, associate lecturer in theFaculty of Medicine, University of Cambridge and member of the Scientific staff ofthe MRC DUNN Clinical Nutrition Centre, Cambridge (UK) and Prof. Paul ROZIN,Professor of Psychology at the University of Pennsylvania (USA).
The current monograph is based on the lectures given by Dr. CUMMINGS inthe frame of the Danone Chair at the Université Catholique de Louvain.
The Institut Danone warmly thanks Dr. CUMMINGS for the quality of hislectures and his monograph. The Institut also thanks Professor Marcel ROBERFROID
for his contribution to the organisation of the Chair and Mrs Micheline POPULER forher editorial work on the text of Dr. CUMMINGS’monograph.
Prof. Dr. Kenny DE MEIRLEIR Prof. Dr. Jacqueline KNOPS
Chairman Chairwoman of the Scientific Council of the Board of Directors
IX
Foreword
Dr. John Hedley CUMMINGS, a born English gentleman, is presently amember of the Clinical Scientific Staff at the MRC DUNN Clinical Nutrition Centreand Honorary Consultant Physician at ADDENBROOKE’s Hospital in Cambridge aswell as Associate Lecturer in the Faculty of Clinical Medicine, University ofCambridge, UK.
He was trained both as a medical doctor and as a biochemist in theUniversities of Leeds, London and Cambridge. He is an accredited specialist inGastroenterology and Internal Medicine. His teaching at the University ofCambridge, London School of Hygiene and Tropical Medicine and King’s Collegein London concerns mainly human nutrition.
The major contribution of J.H. CUMMINGS to human medicine is therecognition that the large bowel is playing key physiological roles not only withregard to water and ion absorption but also to carbohydrate and proteinmetabolism. Already his first scientific paper published in Lancet in 1973concerned the “Role of colon in ileal-resection diarrhoea”. Since then, he haspublished some 150 scientific papers which have contributed significantly to ourpresent understanding of the key role of the colonic microbiota that colonises thelarge bowel creating a true symbiosis. His contribution is at the basic level ofknowledge in the physiology of the colon, but also in the pathophysiology ofimportant bowel diseases and finally in the methodologies which we all need toinvestigate these functions and their pathologic dysfunction.
He was amongst the first to recognize the importance for health of dietarycarbohydrates which even though they are not digested in the upper part of thegastro-intestinal tract are extensively fermented in the colon by the anaerobicbacteria. The concepts of energy salvage, bifidogenesis, colonisation resistance areall concepts to which his research has contributed enormously.
His laboratory in Cambridge has been a place for postgraduate and post-doctoral training of a vast number of scientists from all over the world many ofwhom are actually back in their country where they occupy leading scientificpositions.
Besides being a leading scientist, J.H. CUMMINGS is also known for thequality of his conferences and his lectures which are always very clear, wellillustrated, well presented and very stimulating. These are the main reasons whyhe has been and still is invited worldwide to participate at the most importantscientific meetings in the fields of nutrition and gastroenterology.
X
For those who have the privilege to know him personally, J.H. CUMMINGS isnot only a top level scientist with whom it is so stimulating to discuss, but also aman of great humanism interested in art and open to all problems of mankind. Heenjoys life and particularly good food as expected for someone interested inhuman nutrition !
It has been a great privilege and a great pleasure for me to welcome J.H.CUMMINGS as the first Danone Lecturer in the Faculty of Medicine at the UniversitéCatholique de Louvain. His lectures have all been so rich and so stimulating. Weare grateful to the Institut Danone for having created such a Chair which will,without any doubt, contribute significantly to the implementation of nutrition as anessential part of education in biomedical disciplines.
Prof. Dr. Marcel ROBERFROID
Pharmaceutical Sciences DepartmentUniversité Catholique de Louvain
XI
Acknowledgements
The work described in this monograph has been done in Cambridge bymembers of the Medical Research Council DUNN Clinical Nutrition Centre – GutGroup, without whose ideas and help the concept of the human large bowel as adigestive organ would not have developed. I am especially glad to acknowledgethe longstanding collaboration of Drs Sheila BINGHAM, Hans ENGLYST, GeorgeMACFARLANE and Glen GIBSON. In addition many other members of this group, pastand present, have contributed including: Emily BEATTY, Aedin CASSIDY, ElaineCOLLARD, Edna COLLINSON, Leonora DURCELL, Geoff HUDSON, Alex LOKTIONOV,Sandra MACFARLANE, Ian O’NEILL, Max PITCHER, Mike QUIGLEY, Shirley RUNSWICK,Judith WILLS, Philip JAMES, Hugh WIGGINS, Ian McNEIL, Aiden CHALLEN, HenrikANDERSSON, John BANWELL, David SAUNDERS, Alison STEPHEN, Ru POMARE, WolfgangSCHEPPACH, Stefan CHRISTL, Ashok CHACKO, Charles ETTERLIN, Laura BRAVO,Catherine MICHEL and many students who have enlivened the group over the years.
The text of this monograph covers most of the lectures given during mytenure of the Danone Chair at UCL Brussels. It is drawn partly from previouslypublished reviews and books to which the reader should refer for full informationon these many subjects. Such reference sources include particularly The LargeIntestine edited by PHILLIPS et al. and published by Raven Press (1992);Constipation, by KAMM and LENNARD-JONES, Wrightson Biomedical Publishing Ltd(1994); Human Colonic Bacteria by GIBSON and MACFARLANE, CRC Press (1995);Diseases of the Gut and Pancreas by MISIEWICZ et al., Blackwell ScientificPublications (1994); Physiological and Clinical Aspects of Short Chain Fatty AcidMetabolism by CUMMINGS et al., Cambridge University Press (1995).
Finally, I am most grateful to the Danone Institute of Belgium andparticularly to Professor Marcel ROBERFROID of UCL Brussels for making this visitingProfessorship an enjoyable and productive exercise both scientifically and in thedevelopment of nutritional medicine in Europe.
Dr. John H. CUMMINGS
XII
Summary
The classical view of the human colon is that of an organ which absorbs saltand water and provides a mechanism for the orderly disposal of waste products ofdigestion. It is now clear, however, that it has a major role in digestion through thesalvage of energy, and possibly nitrogen, from carbohydrate and protein notdigested in the upper gut. This is achieved by the metabolism of anaerobic bacteriaand is known as fermentation.
The principal dietary substrates for fermentation in man are starch, non-starchpolysaccharides (NSP) which are the major plant cell wall carbohydrates,oligosaccharides and some sugars. These are broken down to short-chain fatty acids(SCFA) (acetate, propionate and butyrate), the gases H2 and CO2 and stimulatebacterial growth, or biomass. SCFA are rapidly absorbed, acetate reaches musclewhere it serves as a fuel for the tissues, whilst propionate is largely cleared by theliver and may contribute to the regulation of lipid metabolism. Butyrate ismetabolised by the colonic epithelium, which derives 60-70% of its energy frombacterial fermentation products. Butyrate is an important regulator of cell growthand differentation. Hydrogen disposal in the colon is either by excretion through thelung or in flatus, or through further metabolism to methane, sulphide and acetate.Stimulation of biomass leads to increased faecal bulk and bacterial protein synthesis.
The principal chronic colonic diseases, constipation, cancer, diverticulardisease and ulcerative colitis, are also affected by fermentation and its products.Bowel habit is partly determined by the amount of carbohydrate reaching thecolon, whilst in ulcerative colitis there is evidence for sulphur compunds and otherbacterial end-products affecting cell metabolism.
Over the last decade, much progress has been made in our understandingof the pathology and molecular genetics of colon carcinogenesis. This hasculminated in the development of a well-defined model for the aetiology of coloncancer. It has been proposed that the pathology of malignant tumours in the colonfrequently (though not exclusively) follows a series of events known as theadenoma-carcinoma sequence. Certain genetic alterations are known to occurfrequently in colonic adenocarcinomas. Fermentation in the large bowel is nowunderstood to be a protective factor in colon cancer. The role of butyrate oncolonic cells at the molecular level provides an exciting link between dietaryfactors and the development of colon cancer. Whilst the fermentation of NSP(fibre) undoubtedly generates butyrate, in vitro studies have shown that thefermentation of starch generates greater proportions of butyrate than thefermentation of other carbohydrates.
XIII
The recommendation for countries with Western-style diets to increase theirintake of starch and NSP has become universal since it was first suggested by theUS Senate Select Committee on Nutrition and Human Needs in 1977—theMCGOVERN Report. Limits for starch intake have usually been set by default, that isstarch is considered to be an energy filler in the diet once limits have been set forfat and protein.
The specific advantages of consuming starch are that as a substitute forsaturated fat it will lower blood cholesterol, substituting for sugar will reduce therisk of dental caries and, together with resistant starch, may contribute to theprevention of bowel cancer. Moreover, many starchy foods such as cereals, pulsesand vegetables contain a wide variety of micronutrients which sugary and fattyfoods do not.
A number of national bodies have now made quantitative recommendationsfor increases in “dietary fibre” intake but, because of the lack of an agreeddefinition of fibre and of a method for measuring it, these recommendations do notcross international boundaries very well. Therefore, the BNF, WHO and the UKDepartment of Health have opted for NSP as the best index of fibre. However theevidence points to the goal of a diet characterised by high NSP (and starch) intakes.
XIV
1 – Introduction
How does the elephant grow and maintain its magnificent body on such anapparently poor diet of leaves and branches? Unlike the cow, sheep, antelope,camel and even the giraffe, it has no rumen in which to ferment a diet so resistantto normal digestive enzymes. However, the elephant, like the rat, horse, rabbit,zebra, rhinoceros and bear, has a highly developed caecum and large intestinewhich contain an abundant anaerobic bacterial flora, that takes over from whereendogenous digestive enzymes have failed and allows the breakdown, orfermentation, of more resistant components of the diet. The contents of the caecumand large bowel of the elephant account for 12% of its weight [1] which, in a fullygrown African elephant, will amount to 555 kg.
Human large bowel contents amount to only around 0.22 kg or 0.3% of ourweight [2]. Nevertheless, in the vast chambers of the large bowel of the elephant,the human and even the minute colon of the shrew, fundamentally the sameprocess goes on, namely fermentation.
The large intestine is a digestive organ in which anaerobic bacteria breakdown carbohydrates such as fibre and starch not digested in the upper gut. Theprincipal products are short-chain fatty acids (SCFA), acetic, propionic and butyricacids, which are absorbed. SCFA provide energy for the host, which can be up to30% of basal energy requirement in some species, although in the human onWestern diets it is probably nearer 5% [3–5]. Fermentation also gives rise tohydrogen and carbon dioxide, which have to be excreted, and to biomass(bacteria) which in turn affects a number of metabolic processes in the colon.Biomass is excreted in faeces, hence the laxative properties of fermentedcarbohydrates.
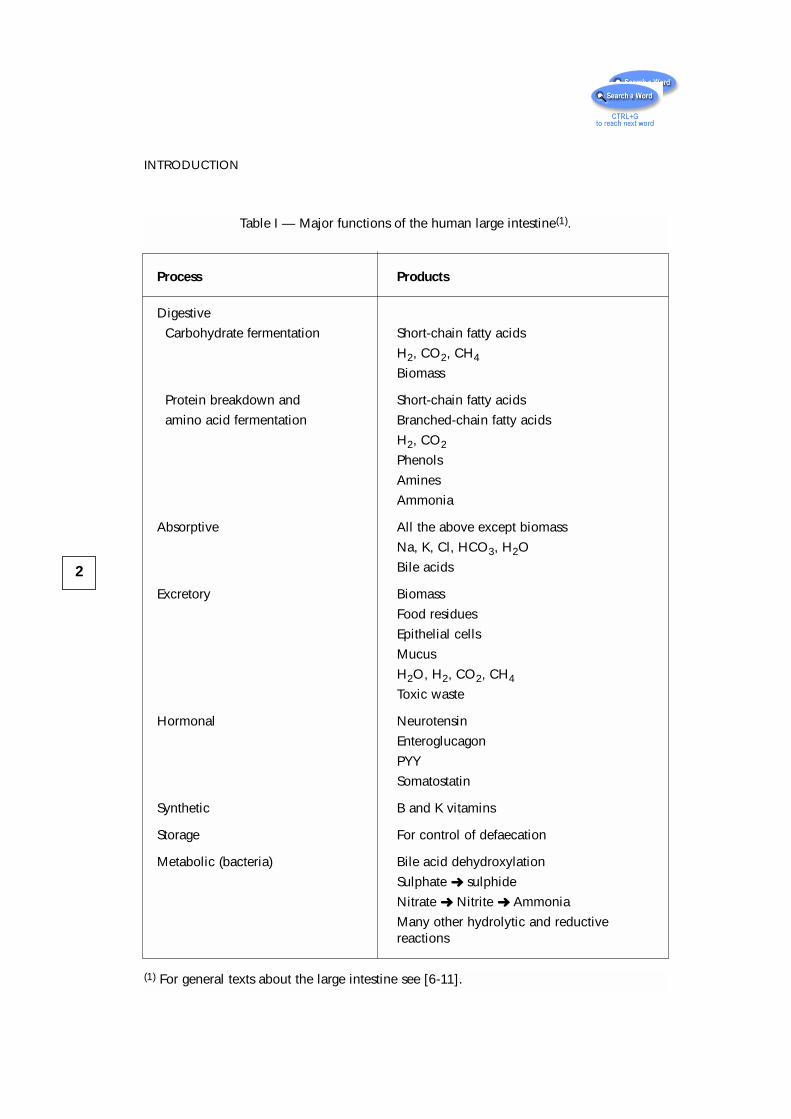
Other substrates, particularly protein, are also fermented and produce arange of products in addition to SCFA (Table I).
Thus are found in large bowel contents biomass, epithelial cells, residualfood particles and mucus, together with the gases nitrogen, hydrogen, carbondioxide and methane. In addition acetate, propionate and butyrate are theprincipal anions, with smaller amounts of the branched-chain fatty acids(isobutyrate, isovalerate), and lactate, amines, phenols and sulphide. Cations aremainly potassium, calcium, magnesium, the ammonium ion and sodium, withplant sterols, and degradation products of cholesterol and bile acids making up theoverall matrix.
Fermentation dominates large bowel function. It affects every processincluding salt and water absorption, pH, epithelial cell metabolism, motility andbowel habit and colonisation resistance, in addition to providing products whichare absorbed and reach the liver and peripheral tissues. Humans are able to live
1
2
INTRODUCTION
Process Products
Digestive
Carbohydrate fermentation Short-chain fatty acids
H2, CO2, CH4
Biomass
Protein breakdown and Short-chain fatty acids
amino acid fermentation Branched-chain fatty acids
H2, CO2
Phenols
Amines
Ammonia
Absorptive All the above except biomass
Na, K, Cl, HCO3, H2O
Bile acids
Excretory Biomass
Food residues
Epithelial cells
Mucus
H2O, H2, CO2, CH4
Toxic waste
Hormonal Neurotensin
Enteroglucagon
PYY
Somatostatin
Synthetic B and K vitamins
Storage For control of defaecation
Metabolic (bacteria) Bile acid dehydroxylation
Sulphate ➜ sulphide
Nitrate ➜ Nitrite ➜ Ammonia
Many other hydrolytic and reductive reactions
Table I — Major functions of the human large intestine(1).
(1) For general texts about the large intestine see [6-11].
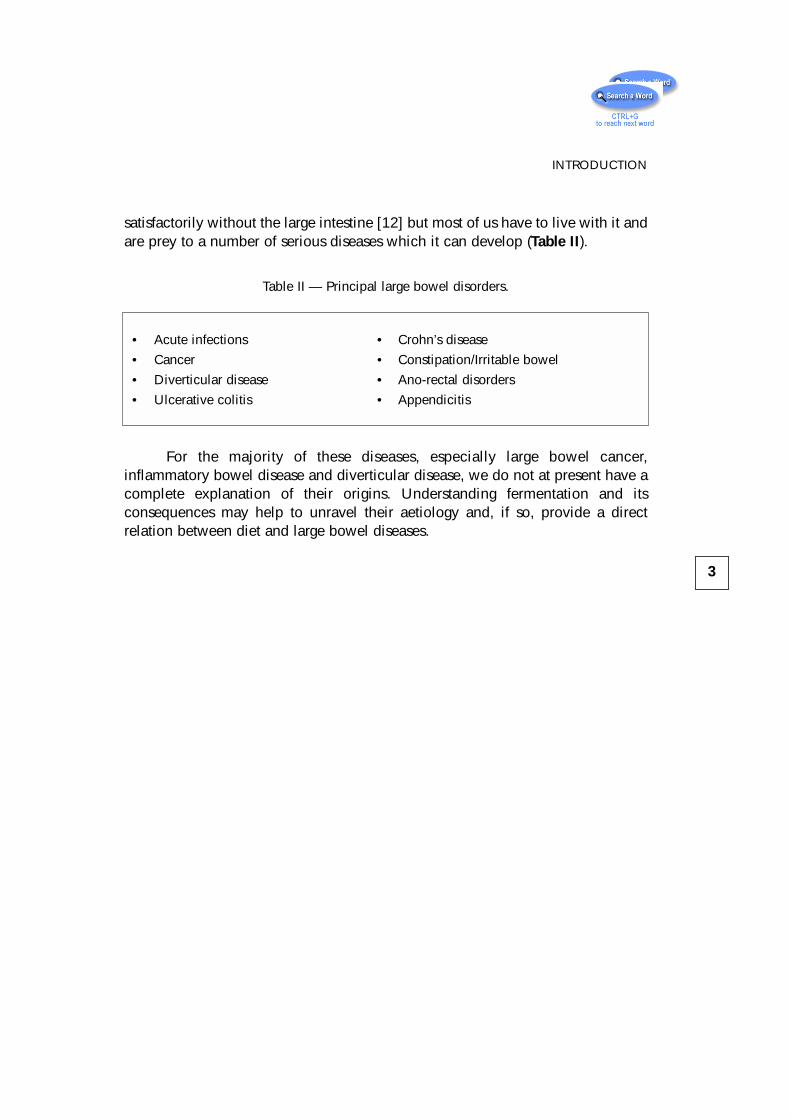
satisfactorily without the large intestine [12] but most of us have to live with it andare prey to a number of serious diseases which it can develop (Table II).
Table II — Principal large bowel disorders.
For the majority of these diseases, especially large bowel cancer,inflammatory bowel disease and diverticular disease, we do not at present have acomplete explanation of their origins. Understanding fermentation and itsconsequences may help to unravel their aetiology and, if so, provide a directrelation between diet and large bowel diseases.
3
INTRODUCTION
• Acute infections • Crohn’s disease
• Cancer • Constipation/Irritable bowel
• Diverticular disease • Ano-rectal disorders
• Ulcerative colitis • Appendicitis
2 – Anatomy, Bacteriologyand Function
2-1 AnatomyThe human colon is not neatly laid out around the abdominal cavity but lies
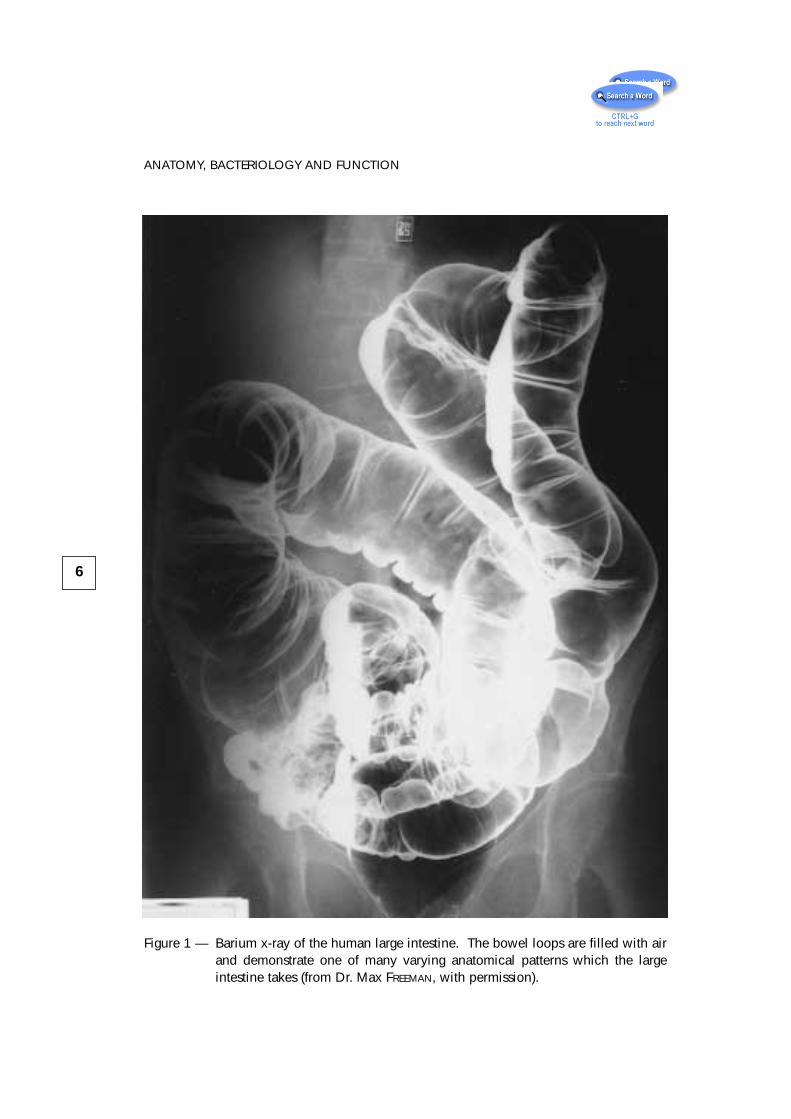
with loops and flexures throughout the pelvis and in varying configurations aroundthe abdomen (Figure 1).
In a study of the large intestine of 46 sudden death victims from both Africaand the UK [2] the large bowel was 154 (range 113 to 207) cm in length and hada surface area of 1274 (731 to 2509) sq cm. The bowel contained 222(58-904) gof contents, of which 36 g was dry matter and 186 g water. Moisture contentranged from 85% in the caecum to 77% in the recto-sigmoid region. pH was 5.8in the caecum, rising to 6.5 in the recto-sigmoid.
Mouth to anus transit through the human gut takes about 60 h in UK adults[13] with women 72 h and men 55 h. Of this 4–6 h will be mouth to caecumtransit time so residence in the colon is around 54 h. Transit in Africans is reportedto be much quicker—in the region of 24 to 48 h [14]. Transit through differentregions of the colon has been measured using a variety of x-ray techniques.Reported times are 7–24 h for the caecum and right colon, 9–30 h for the left colonand 12–44 h for the recto-sigmoid [15].
The composition of large bowel contents has largely been derived frommeasurements of faeces but some data are also available from autopsy material.In the caecal region the largest fraction is proteinaceous at 40% (N x 6.25) of drymatter, followed by carbohydrate 20%, fats 20%, minerals 10% and residualmoisture about 10%. What this means in practice is lots of bacteria sitting onfood particles surrounded in a matrix of glycoprotein and exfoliated cells(Figure 2).
2-2 BacteriaApart from food residues, the major component of colonic contents is
bacteria whose numbers exceed 1011 per g dry matter. Several hundred specieshave been identified [16–19] but some 30–40 species belonging to 5 or 6 generaaccount for 99% of biomass.
5
6
ANATOMY, BACTERIOLOGY AND FUNCTION
Figure 1 — Barium x-ray of the human large intestine. The bowel loops are filled with airand demonstrate one of many varying anatomical patterns which the largeintestine takes (from Dr. Max FREEMAN, with permission).
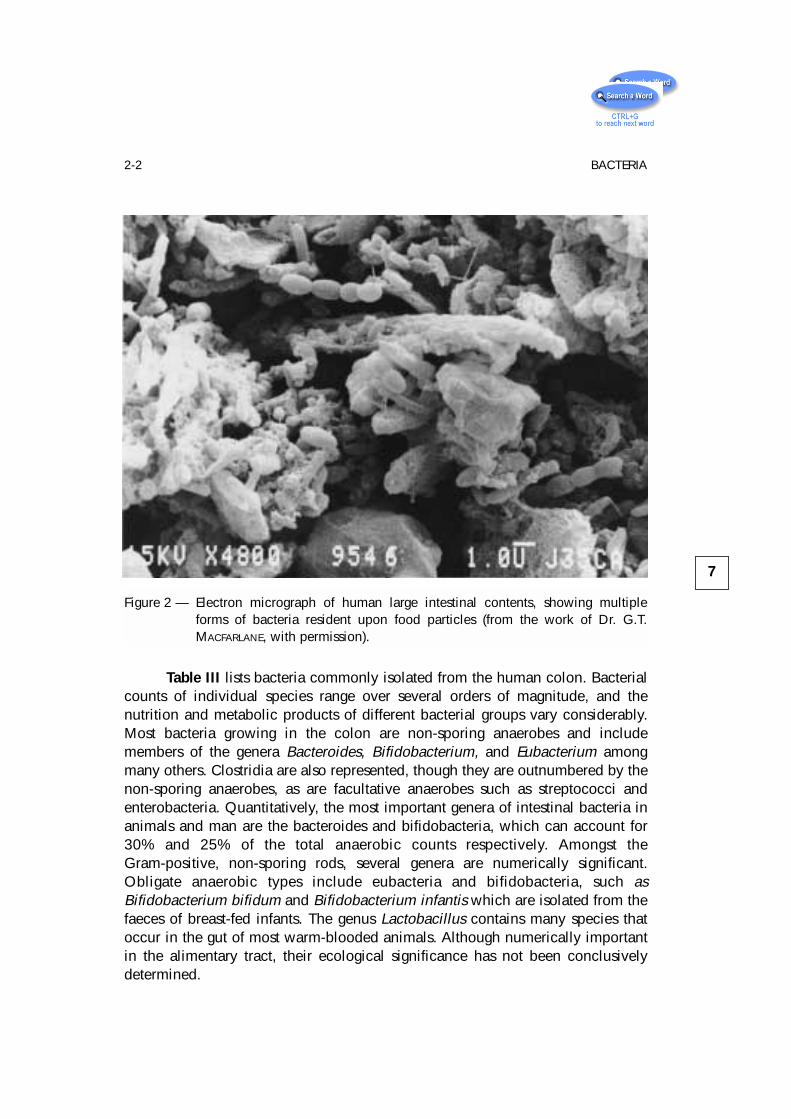
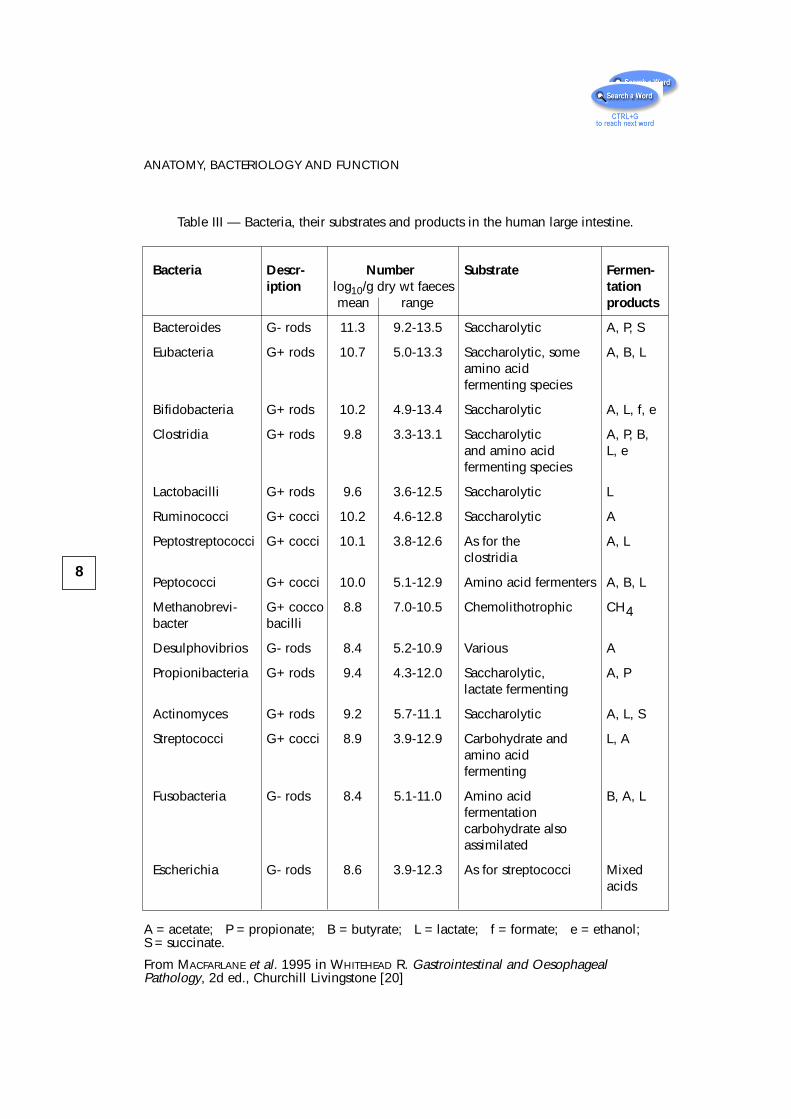
Table III lists bacteria commonly isolated from the human colon. Bacterialcounts of individual species range over several orders of magnitude, and thenutrition and metabolic products of different bacterial groups vary considerably.Most bacteria growing in the colon are non-sporing anaerobes and includemembers of the genera Bacteroides, Bifidobacterium, and Eubacterium amongmany others. Clostridia are also represented, though they are outnumbered by thenon-sporing anaerobes, as are facultative anaerobes such as streptococci andenterobacteria. Quantitatively, the most important genera of intestinal bacteria inanimals and man are the bacteroides and bifidobacteria, which can account for30% and 25% of the total anaerobic counts respectively. Amongst theGram-positive, non-sporing rods, several genera are numerically significant.Obligate anaerobic types include eubacteria and bifidobacteria, such asBifidobacterium bifidum and Bifidobacterium infantis which are isolated from thefaeces of breast-fed infants. The genus Lactobacillus contains many species thatoccur in the gut of most warm-blooded animals. Although numerically importantin the alimentary tract, their ecological significance has not been conclusivelydetermined.
7
2-2 BACTERIA
Figure 2 — Electron micrograph of human large intestinal contents, showing multipleforms of bacteria resident upon food particles (from the work of Dr. G.T.MACFARLANE, with permission).
8
ANATOMY, BACTERIOLOGY AND FUNCTION
Bacteria Descr- Number Substrate Fermen-iption log10/g dry wt faeces tation
mean range products
Bacteroides G- rods 11.3 9.2-13.5 Saccharolytic A, P, S
Eubacteria G+ rods 10.7 5.0-13.3 Saccharolytic, some A, B, Lamino acidfermenting species
Bifidobacteria G+ rods 10.2 4.9-13.4 Saccharolytic A, L, f, e
Clostridia G+ rods 9.8 3.3-13.1 Saccharolytic A, P, B,and amino acid L, efermenting species
Lactobacilli G+ rods 9.6 3.6-12.5 Saccharolytic L
Ruminococci G+ cocci 10.2 4.6-12.8 Saccharolytic A
Peptostreptococci G+ cocci 10.1 3.8-12.6 As for the A, Lclostridia
Peptococci G+ cocci 10.0 5.1-12.9 Amino acid fermenters A, B, L
Methanobrevi- G+ cocco 8.8 7.0-10.5 Chemolithotrophic CH4bacter bacilli
Desulphovibrios G- rods 8.4 5.2-10.9 Various A
Propionibacteria G+ rods 9.4 4.3-12.0 Saccharolytic, A, Plactate fermenting
Actinomyces G+ rods 9.2 5.7-11.1 Saccharolytic A, L, S
Streptococci G+ cocci 8.9 3.9-12.9 Carbohydrate and L, Aamino acidfermenting
Fusobacteria G- rods 8.4 5.1-11.0 Amino acid B, A, Lfermentationcarbohydrate alsoassimilated
Escherichia G- rods 8.6 3.9-12.3 As for streptococci Mixedacids
Table III — Bacteria, their substrates and products in the human large intestine.
A = acetate; P = propionate; B = butyrate; L = lactate; f = formate; e = ethanol;S = succinate.
From MACFARLANE et al. 1995 in WHITEHEAD R. Gastrointestinal and OesophagealPathology, 2d ed., Churchill Livingstone [20]
Several types of spore-forming rods and cocci are also normal inhabitants ofthe gut. The genus Clostridium is probably the most ubiquitous: C. perfringens, C.bifermentans and C. tetani are regularly isolated, albeit in relatively low numbers,and are of significance in human and veterinary medicine. The presence of aerobicmembers of the genus Bacillus is thought to result from contamination from theenvironment. Facultative and obligately anaerobic Gram-positive cocci are alsonumerically important. The strict anaerobes include Peptostreptococcus,Ruminoccus, Megasphaera elsdenii and Sarcina ventriculi. The facultativelyanaerobic streptococci are well represented by many species from LANCEFIELD
group D including S. faecalis, S. bovis and S. equinus and some from group K suchas S. salivarius which is usually associated with the mouth. Gram-negativeanaerobic cocci include Veillonella and Acidaminococcus.
Although they are not numerous, the Gram-negative facultative anaerobicrods include a number of very important pathogens. Members of theEnterobacteriaceae, particularly Escherichia coli, are usually thought of ascharacteristic intestinal bacteria. Several types of spirochaete can be seen in thegut of healthy animals, but their status in the human colon is uncertain.
2-3 FunctionSome broad idea of the function of the large intestine can be deduced from
a comparison of the amounts and composition of material entering from the ileumand the composition leaving as faeces.
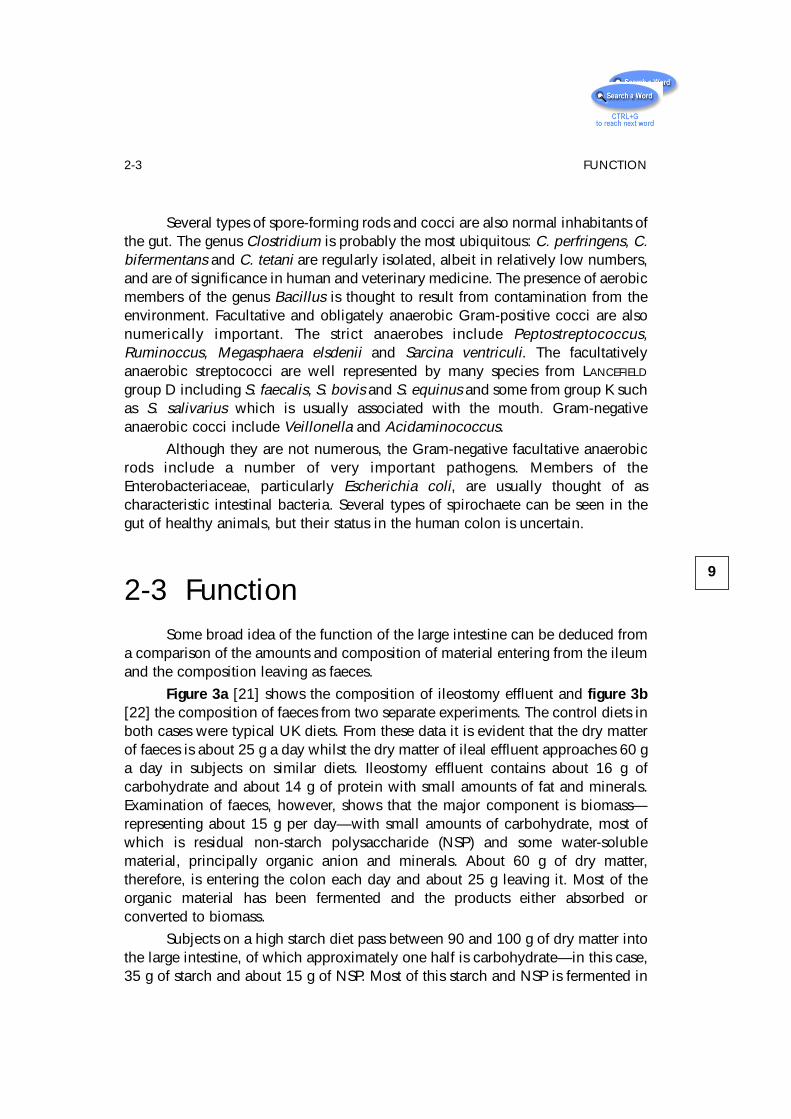
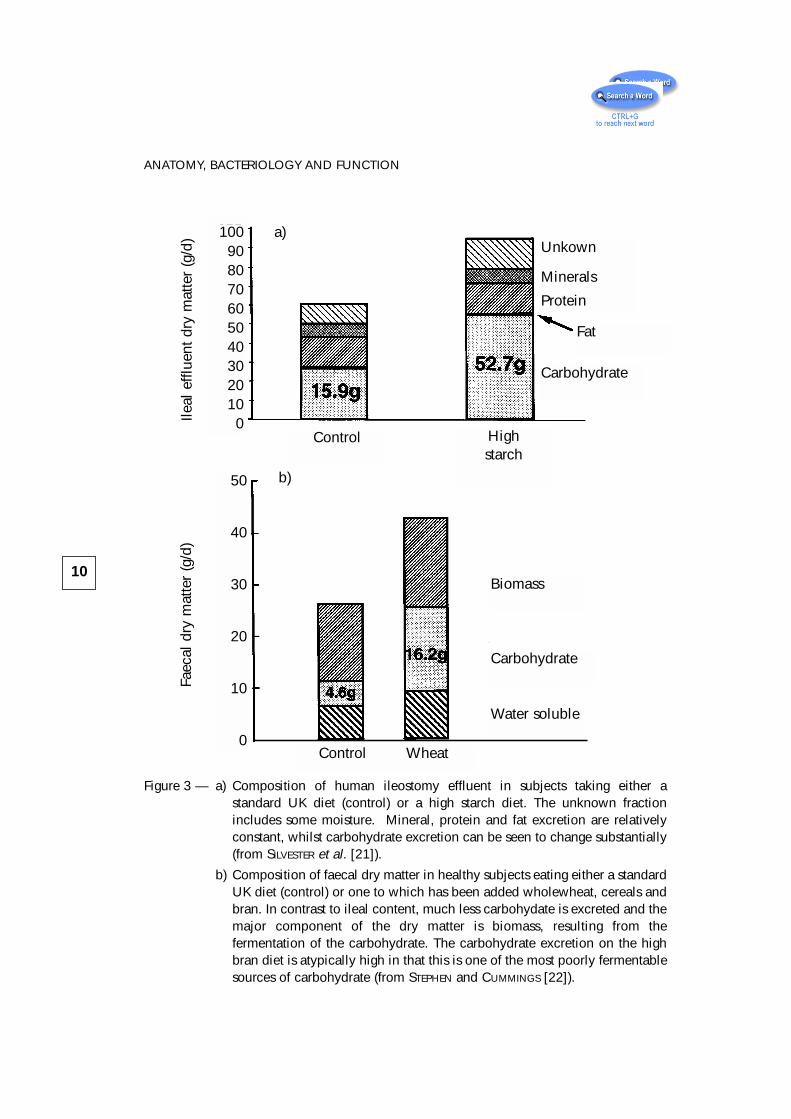
Figure 3a [21] shows the composition of ileostomy effluent and figure 3b[22] the composition of faeces from two separate experiments. The control diets inboth cases were typical UK diets. From these data it is evident that the dry matterof faeces is about 25 g a day whilst the dry matter of ileal effluent approaches 60 ga day in subjects on similar diets. Ileostomy effluent contains about 16 g ofcarbohydrate and about 14 g of protein with small amounts of fat and minerals.Examination of faeces, however, shows that the major component is biomass—representing about 15 g per day—with small amounts of carbohydrate, most ofwhich is residual non-starch polysaccharide (NSP) and some water-solublematerial, principally organic anion and minerals. About 60 g of dry matter,therefore, is entering the colon each day and about 25 g leaving it. Most of theorganic material has been fermented and the products either absorbed orconverted to biomass.
Subjects on a high starch diet pass between 90 and 100 g of dry matter intothe large intestine, of which approximately one half is carbohydrate—in this case,35 g of starch and about 15 g of NSP. Most of this starch and NSP is fermented in
9
2-3 FUNCTION
10
ANATOMY, BACTERIOLOGY AND FUNCTION
Figure 3 — a) Composition of human ileostomy effluent in subjects taking either astandard UK diet (control) or a high starch diet. The unknown fractionincludes some moisture. Mineral, protein and fat excretion are relativelyconstant, whilst carbohydrate excretion can be seen to change substantially(from SILVESTER et al. [21]).
b) Composition of faecal dry matter in healthy subjects eating either a standardUK diet (control) or one to which has been added wholewheat, cereals andbran. In contrast to ileal content, much less carbohydate is excreted and themajor component of the dry matter is biomass, resulting from thefermentation of the carbohydrate. The carbohydrate excretion on the highbran diet is atypically high in that this is one of the most poorly fermentablesources of carbohydrate (from STEPHEN and CUMMINGS [22]).
Control Highstarch
Unkown
Minerals
Protein
Carbohydrate
Fat
Biomass
Carbohydrate
Water soluble
Control Wheat
1009080706050403020100
50
40
30
20
10
0
a)
b)
Ileal
effl
uent
dry
mat
ter
(g/d
)Fa
ecal
dry
mat
ter
(g/d
)
the colon (see Chapter 3). Subjects eating a high NSP diet with most of the NSPcoming from wheat excrete a significant amount of NSP in faeces, together withincreased biomass and some increased mineral and organic anion excretion. Inthese subjects biomass is the dominant component of faeces.
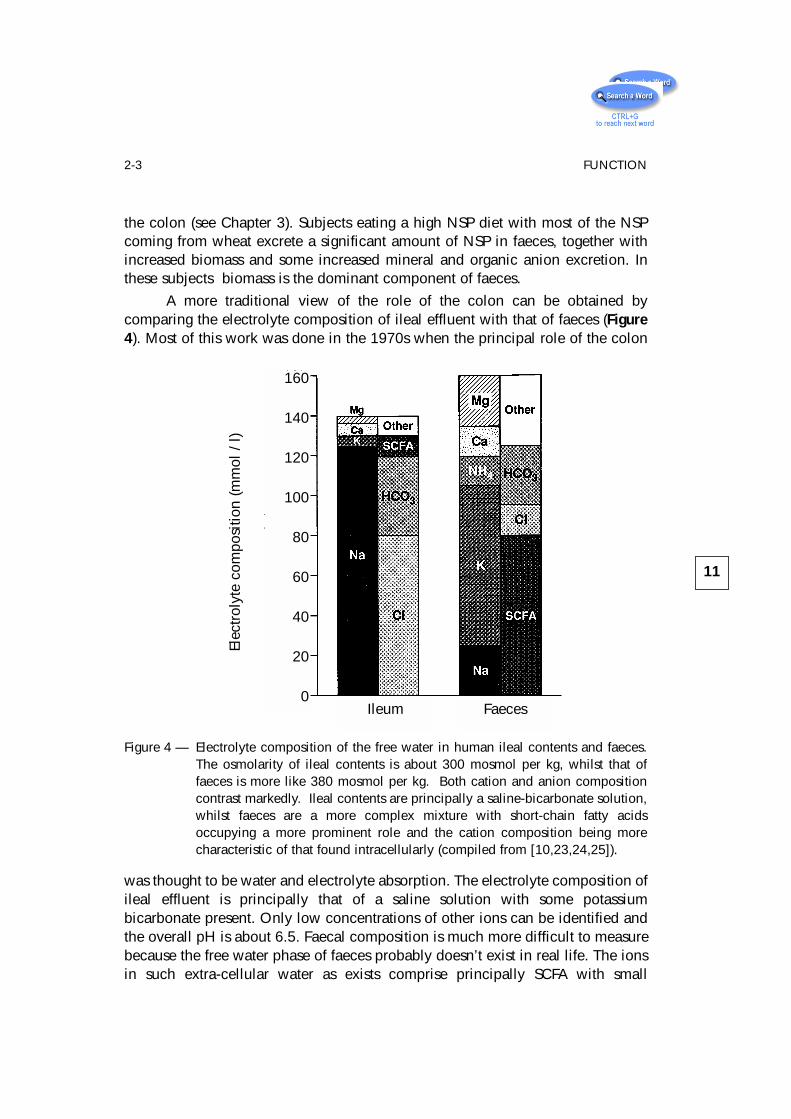
A more traditional view of the role of the colon can be obtained bycomparing the electrolyte composition of ileal effluent with that of faeces (Figure4). Most of this work was done in the 1970s when the principal role of the colon
was thought to be water and electrolyte absorption. The electrolyte composition ofileal effluent is principally that of a saline solution with some potassiumbicarbonate present. Only low concentrations of other ions can be identified andthe overall pH is about 6.5. Faecal composition is much more difficult to measurebecause the free water phase of faeces probably doesn’t exist in real life. The ionsin such extra-cellular water as exists comprise principally SCFA with small
11
2-3 FUNCTION
Ileum
160
140
120
100
80
60
40
20
0
Elec
trol
yte
com
posi
tion
(mm
ol /
l)
Faeces
Figure 4 — Electrolyte composition of the free water in human ileal contents and faeces.The osmolarity of ileal contents is about 300 mosmol per kg, whilst that offaeces is more like 380 mosmol per kg. Both cation and anion compositioncontrast markedly. Ileal contents are principally a saline-bicarbonate solution,whilst faeces are a more complex mixture with short-chain fatty acidsoccupying a more prominent role and the cation composition being morecharacteristic of that found intracellularly (compiled from [10,23,24,25]).
amounts of bicarbonate, chloride and traces of sulphate and phosphate. The majorcations are potassium, calcium and magnesium with some sodium. When thevolumes of ileal water (probably over 1l a day) and faecal water (probably no morethan 100 ml a day) are calculated, then it can be seen quite clearly that the colonis absorbing substantial amounts of water, sodium and chloride and generatingshort-chain fatty acids.
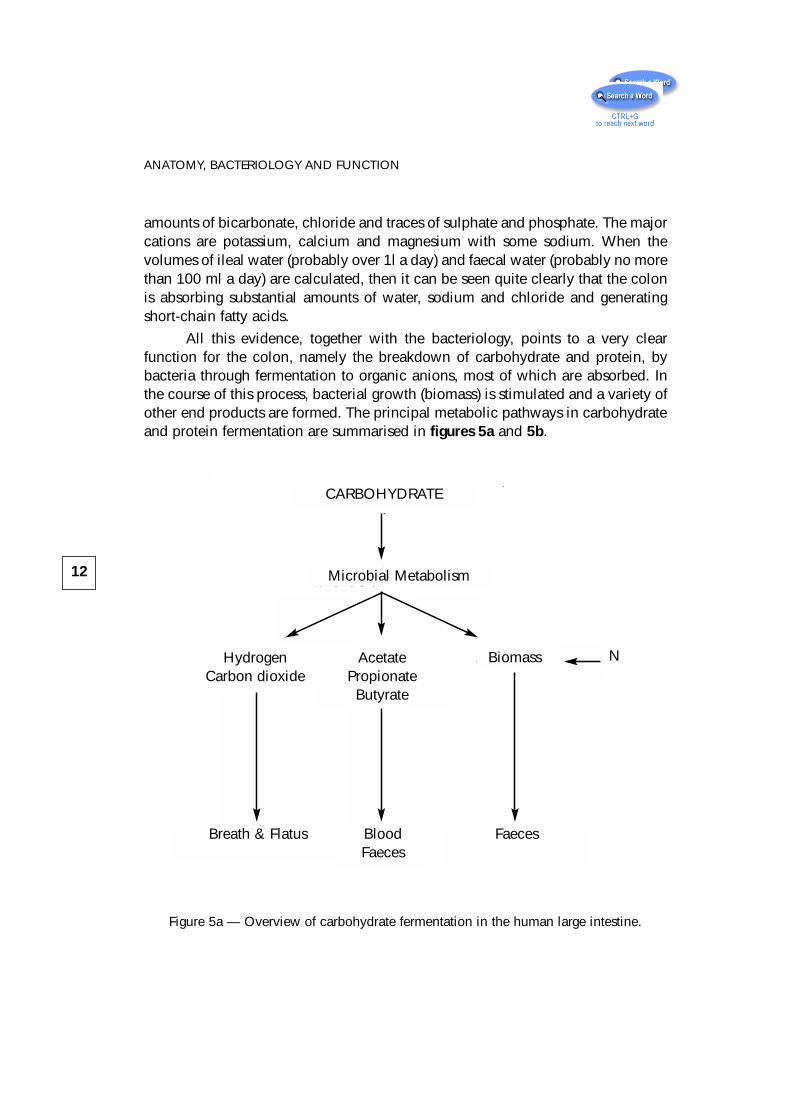
All this evidence, together with the bacteriology, points to a very clearfunction for the colon, namely the breakdown of carbohydrate and protein, bybacteria through fermentation to organic anions, most of which are absorbed. Inthe course of this process, bacterial growth (biomass) is stimulated and a variety ofother end products are formed. The principal metabolic pathways in carbohydrateand protein fermentation are summarised in figures 5a and 5b.
Figure 5a — Overview of carbohydrate fermentation in the human large intestine.
12
ANATOMY, BACTERIOLOGY AND FUNCTION
CARBOHYDRATE
Microbial Metabolism
HydrogenCarbon dioxide
Biomass NAcetatePropionate
Butyrate
Breath & Flatus BloodFaeces
Faeces
These fermentative processes are the key events in the large intestinegoverning all aspects of its function.
2-3-1 Regional Differences
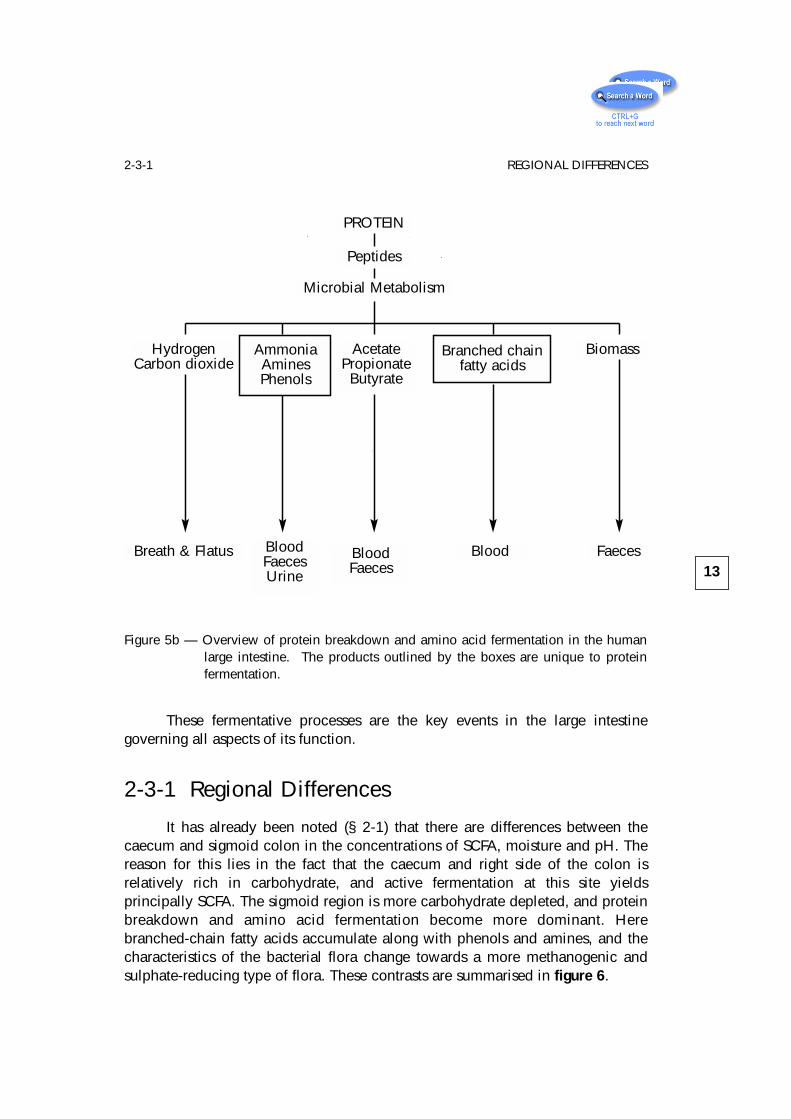
It has already been noted (§ 2-1) that there are differences between thecaecum and sigmoid colon in the concentrations of SCFA, moisture and pH. Thereason for this lies in the fact that the caecum and right side of the colon isrelatively rich in carbohydrate, and active fermentation at this site yieldsprincipally SCFA. The sigmoid region is more carbohydrate depleted, and proteinbreakdown and amino acid fermentation become more dominant. Herebranched-chain fatty acids accumulate along with phenols and amines, and thecharacteristics of the bacterial flora change towards a more methanogenic andsulphate-reducing type of flora. These contrasts are summarised in figure 6.
13
2-3-1 REGIONAL DIFFERENCES
PROTEIN
Peptides
Microbial Metabolism
Blood FaecesBreath & Flatus BloodFaeces
BloodFaecesUrine
BiomassHydrogenCarbon dioxide
Branched chainfatty acids
AcetatePropionate
Butyrate
AmmoniaAminesPhenols
Figure 5b — Overview of protein breakdown and amino acid fermentation in the humanlarge intestine. The products outlined by the boxes are unique to proteinfermentation.
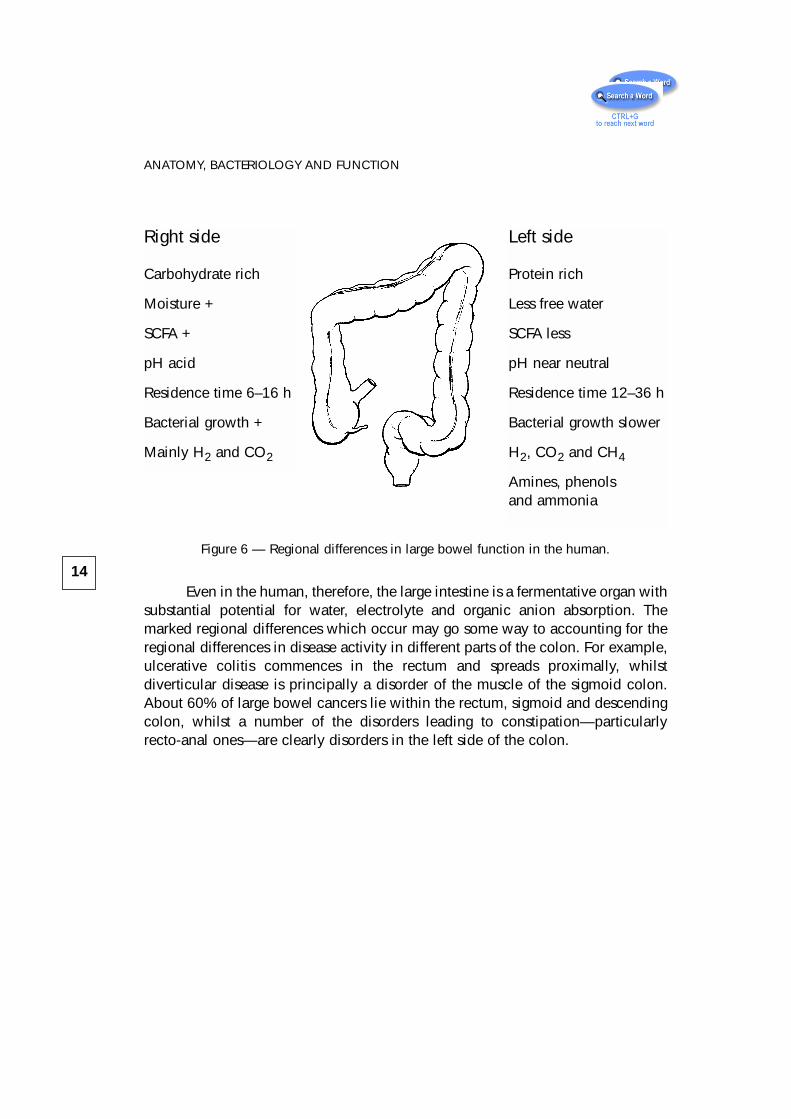
Figure 6 — Regional differences in large bowel function in the human.
Even in the human, therefore, the large intestine is a fermentative organ withsubstantial potential for water, electrolyte and organic anion absorption. Themarked regional differences which occur may go some way to accounting for theregional differences in disease activity in different parts of the colon. For example,ulcerative colitis commences in the rectum and spreads proximally, whilstdiverticular disease is principally a disorder of the muscle of the sigmoid colon.About 60% of large bowel cancers lie within the rectum, sigmoid and descendingcolon, whilst a number of the disorders leading to constipation—particularlyrecto-anal ones—are clearly disorders in the left side of the colon.
14
ANATOMY, BACTERIOLOGY AND FUNCTION
Right side
Carbohydrate rich
Moisture +
SCFA +
pH acid
Residence time 6–16 h
Bacterial growth +
Mainly H2 and CO2
Left side
Protein rich
Less free water
SCFA less
pH near neutral
Residence time 12–36 h
Bacterial growth slower
H2, CO2 and CH4
Amines, phenolsand ammonia
3 – Carbohydrate andProtein Digestion:the SubstratesAvailable forFermentation
3-1 IntroductionFermentation is driven very largely by the amount and type of substrate
available to the bacteria. Unlike the ruminant animal, however, where the wholediet enters the fermentation chamber, the hindgut has to rely on what is notdigested and absorbed higher up in the gut. The function of the large bowel is thusclosely tied to digestive physiology in the small intestine, and an understanding ofthe role of the large bowel requires knowledge of digestive events in the upper gut.
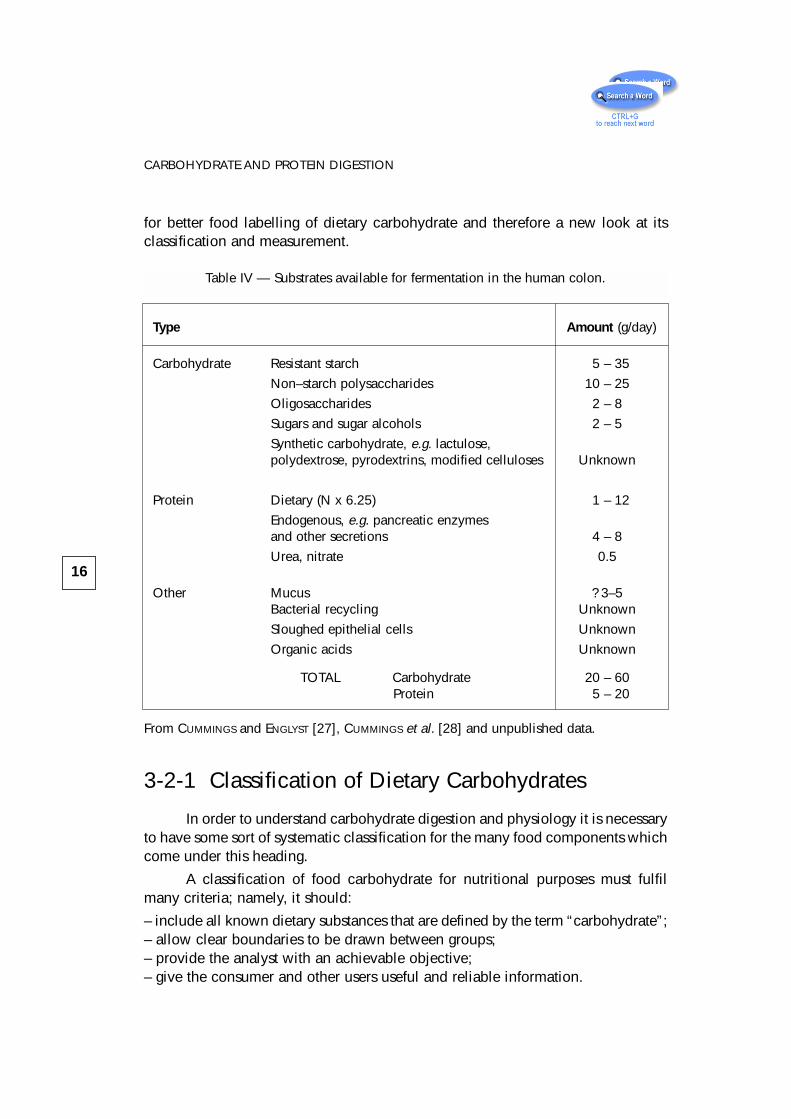
The major substrates for fermentation are fairly well known and are shownin table IV. The numbers are based on people eating Western style diets and willbe considerably different in those living on starchy staples in non-industrialisedcommunities in Africa and India.
3-2 CarbohydratesOur understanding of carbohydrate digestive physiology has changed
substantially in recent years. The polysaccharides of the plant cell wall (fibre) areno longer thought of as inert material passing through the gut and simply affectingbowel habit. They consist of a range of polymers with contrasting physiologicaleffects. Starch is known now not to be rapidly and completely digested in the smallbowel and the concept of resistant starch has been developed [29–32] with itsattendant implications for glycemic control and large bowel function. Morerecently the importance of a previously neglected group of carbohydrates, theoligosaccharides, has emerged with the demonstration that they selectively affectmicrobial function in the large intestine [33]. With this knowledge has come a call
15
for better food labelling of dietary carbohydrate and therefore a new look at itsclassification and measurement.
3-2-1 Classification of Dietary Carbohydrates
In order to understand carbohydrate digestion and physiology it is necessaryto have some sort of systematic classification for the many food components whichcome under this heading.
A classification of food carbohydrate for nutritional purposes must fulfilmany criteria; namely, it should:
– include all known dietary substances that are defined by the term “carbohydrate”;– allow clear boundaries to be drawn between groups;– provide the analyst with an achievable objective;– give the consumer and other users useful and reliable information.
16
CARBOHYDRATE AND PROTEIN DIGESTION
Table IV — Substrates available for fermentation in the human colon.
Type Amount (g/day)
Carbohydrate Resistant starch 5 – 35
Non–starch polysaccharides 10 – 25
Oligosaccharides 2 – 8
Sugars and sugar alcohols 2 – 5
Synthetic carbohydrate, e.g. lactulose,polydextrose, pyrodextrins, modified celluloses Unknown
Protein Dietary (N x 6.25) 1 – 12
Endogenous, e.g. pancreatic enzymesand other secretions 4 – 8
Urea, nitrate 0.5
Other Mucus ? 3–5Bacterial recycling Unknown
Sloughed epithelial cells Unknown
Organic acids Unknown
TOTAL Carbohydrate 20 – 60Protein 5 – 20
From CUMMINGS and ENGLYST [27], CUMMINGS et al. [28] and unpublished data.
Carbohydrates are polyhydroxyaldehydes and ketones that have theempirical formula (CH2O)n. For nutritional purposes they are best classifiedprimarily according to the degree of polymerisation with subdivisions based onglycosidic linkages and chemistry of individual sugars because these determinephysiological properties. Table V shows such a classification, which provides alogical approach to food carbohydrate and defines categories which are readilymeasurable analytically. Although it is possible to determine in the laboratory allthe carbohydrate fractions listed in table V with reasonable accuracy, no methodexists which will divide them physiologically into, for example, digestible andundigestible (available and unavailable) fractions. The physiological properties inthe gut of the different chemical categories of carbohydrate overlap in manyrespects.
The boundaries between the three main divisions—sugars, oligosaccharidesand polysaccharides—are reasonably well defined by convention but presentsome analytical and labelling problems. This is particularly so for the boundarybetween oligosaccharides and polysaccharides because it is conventionallydefined as separating carbohydrates with about 10 or more monomeric units. Inanalytical terms, this cut-off is provided by polysaccharides which are precipitatedin 80% ethanol. However, some carbohydrates straddle both the analytical andlabelling boundary. For example, both polydextrose, pyrodextrins and manyfructans contain a variety of carbohydrate fractions which occur in both theoligosaccharide and polysaccharide categories. Inulin—a fructan which, inphysiological terms, belongs to the oligosaccharides—spans this group with adegree of polymerisation (DP) of anything from 6 to 100. A better term toencompass all these carbohydrates would probably be short-chain carbohydratesbut then one would still be left with the problem of deciding an upper limit.
3-2-2 Sugars
Sugars add sweetness to food and make it pleasant to eat, hence the use oftable sugar—which is sucrose, a disaccharide of glucose and fructose—to sweetendrinks, breakfast cereals, fruit desserts, tomato ketchup, etc. High concentrationsof sugar aid in the preservation of jams and pie fillings, and sugars are importantin creating the texture and structure of cakes, biscuits and confectionery. Mostsugars are absorbed from the small intestine and, through the maintenance ofblood glucose, provide rapidly available energy to the tissues. Sugars are notnormally a substrate for fermentation. Sucrose, and occasionally other sugars, maybe malabsorbed but only in pathological conditions such as jejuno-ileal bypass.Dietary lactose from milk does pass into the large intestine in people withβ-galactosidase deficiency and is fermented since this enzyme is widely present inbacteria. Lactose is rarely found in adult human faeces. The rise in consumption
17
3-2-2 SUGARS
18
CARBOHYDRATE AND PROTEIN DIGESTION
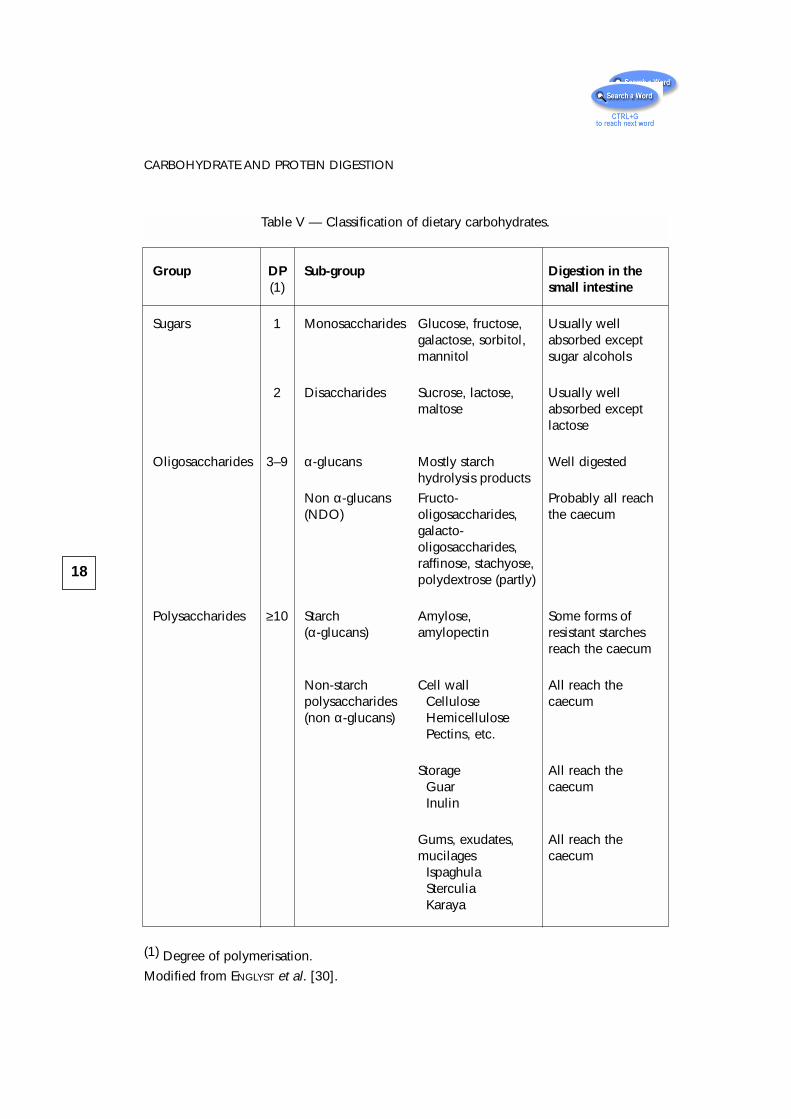
Table V — Classification of dietary carbohydrates.
Group DP Sub-group Digestion in the(1) small intestine
Sugars 1 Monosaccharides Glucose, fructose, Usually wellgalactose, sorbitol, absorbed exceptmannitol sugar alcohols
2 Disaccharides Sucrose, lactose, Usually wellmaltose absorbed except
lactose
Oligosaccharides 3–9 α-glucans Mostly starch Well digestedhydrolysis products
Non α-glucans Fructo- Probably all reach(NDO) oligosaccharides, the caecum
galacto-oligosaccharides,raffinose, stachyose,polydextrose (partly)
Polysaccharides ≥10 Starch Amylose, Some forms of(α-glucans) amylopectin resistant starches
reach the caecum
Non-starch Cell wall All reach thepolysaccharides Cellulose caecum(non α-glucans) Hemicellulose
Pectins, etc.
Storage All reach theGuar caecumInulin
Gums, exudates, All reach themucilages caecum
IspaghulaSterculiaKaraya
(1) Degree of polymerisation.
Modified from ENGLYST et al. [30].
of sucrose from 1850 to 1950 has led to the claim that it is responsible for dentalcaries and may contribute to obesity, diabetes and cardiovascular disease.However dental caries prevalence has declined dramatically over the past 30years, probably as a result of fluoridation of drinking water and toothpaste. Currentepidemiological evidence does not support a role for sugars in the cause ofcardiovascular disease or diabetes or obesity [34–36].
3-2-3 Oligosaccharides
Oligosaccharides are carbohydrates with a degree of polymerisation (DP) of3–10 [37]. They are readily soluble in water and include tri- and tetrasaccharidessuch as raffinose and stachyose, maltodextrins from partial hydrolysis of starch,pyrodextrins produced by heating starch in acid conditions, fructo- andgalactooligosaccharides, and some inulins. Pyrodextrin preparations are marketedin Japan for their health-giving properties as drinks and are thought to be poorlydigested. The trisaccharide raffinose (Gal-Glc-Fuc) and tetrasaccharide stachyose(Gal-Gal-Glc-Fuc) are found in legumes and, because of their non-digestibility inthe small bowel, provide substrates for bacterial fermentation in the colon,especially gas formation [38, 39]. Several other possible health benefits arecurrently of interest [33, 40].
It is, however, the fructooligosaccharides that have aroused interest in recentyears, mostly because of their property to stimulate the growth of bifidobacteria inthe colon, first described by YAZAWA and colleagues [41, 42]. Polymers andoligosaccharides of fructose are synthesised by many plants and are found in thehuman diet in onions, garlic, artichokes and chicory, which provide up to 12 g/d[43, 44]. The best known are the inulins, a group of β-(2-1) linear fructose polymerswith a DP ≤ 60. Fructooligosaccharides are produced in two ways, either by partialhydrolysis using endoglycosidases, for example Raftilose (Orafti, Tienen, Belgium),which is made from chicory inulin, or by synthesis from sucrose by using fungalβ-fructofuronosidase, e.g. Neosugar (Meiji, Kanagawa, Japan) [45].
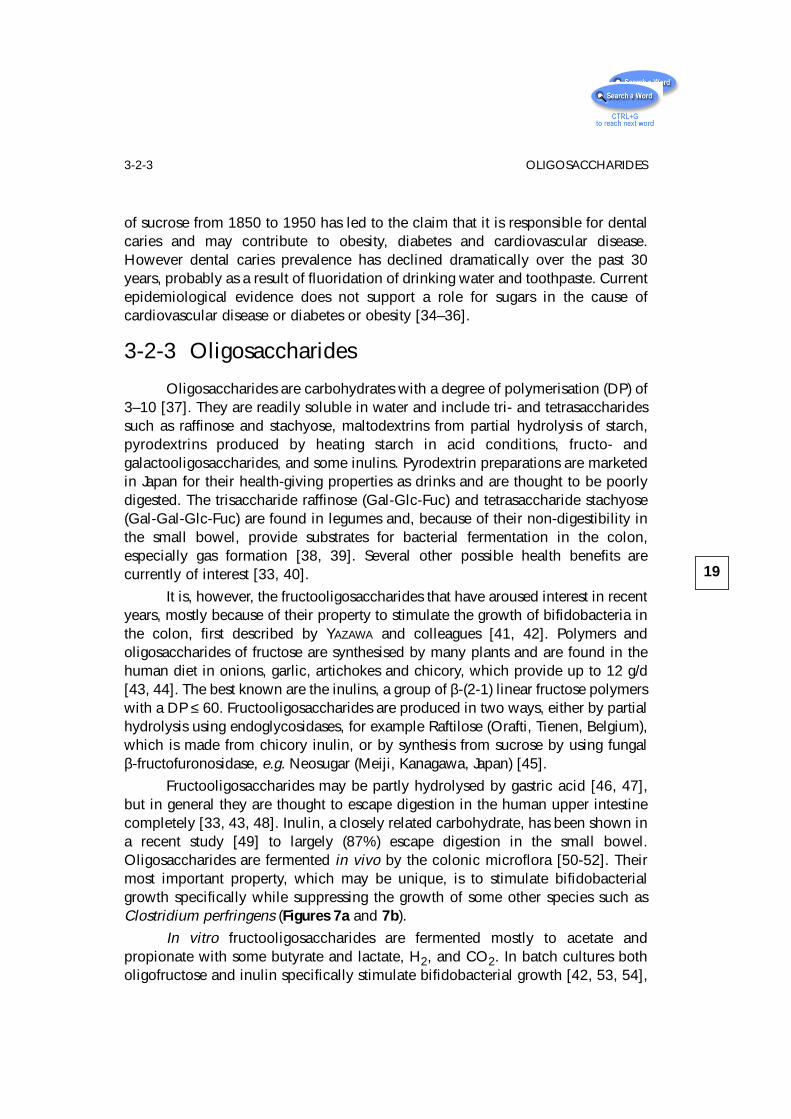
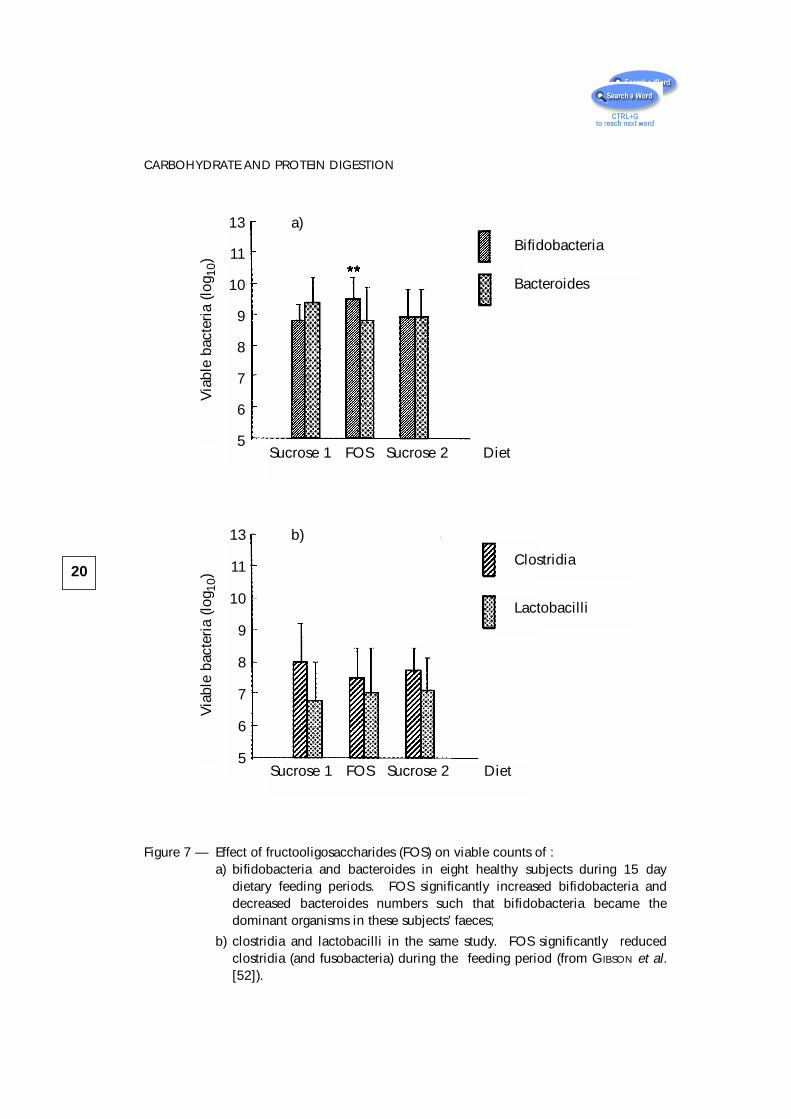
Fructooligosaccharides may be partly hydrolysed by gastric acid [46, 47],but in general they are thought to escape digestion in the human upper intestinecompletely [33, 43, 48]. Inulin, a closely related carbohydrate, has been shown ina recent study [49] to largely (87%) escape digestion in the small bowel.Oligosaccharides are fermented in vivo by the colonic microflora [50-52]. Theirmost important property, which may be unique, is to stimulate bifidobacterialgrowth specifically while suppressing the growth of some other species such asClostridium perfringens (Figures 7a and 7b).
In vitro fructooligosaccharides are fermented mostly to acetate andpropionate with some butyrate and lactate, H2, and CO2. In batch cultures botholigofructose and inulin specifically stimulate bifidobacterial growth [42, 53, 54],
19
3-2-3 OLIGOSACCHARIDES
20
CARBOHYDRATE AND PROTEIN DIGESTION
Figure 7 — Effect of fructooligosaccharides (FOS) on viable counts of :a) bifidobacteria and bacteroides in eight healthy subjects during 15 day
dietary feeding periods. FOS significantly increased bifidobacteria anddecreased bacteroides numbers such that bifidobacteria became thedominant organisms in these subjects’ faeces;
b) clostridia and lactobacilli in the same study. FOS significantly reducedclostridia (and fusobacteria) during the feeding period (from GIBSON et al.[52]).
13
11
10
9
8
7
6
5
13
11
10
9
8
7
6
5
Via
ble
bact
eria
(log
10)
Via
ble
bact
eria
(log
10)
Sucrose 1 FOS Sucrose 2 Diet
Sucrose 1 FOS Sucrose 2 Diet
Bifidobacteria
Bacteroides
Lactobacilli
Clostridia
a)
b)
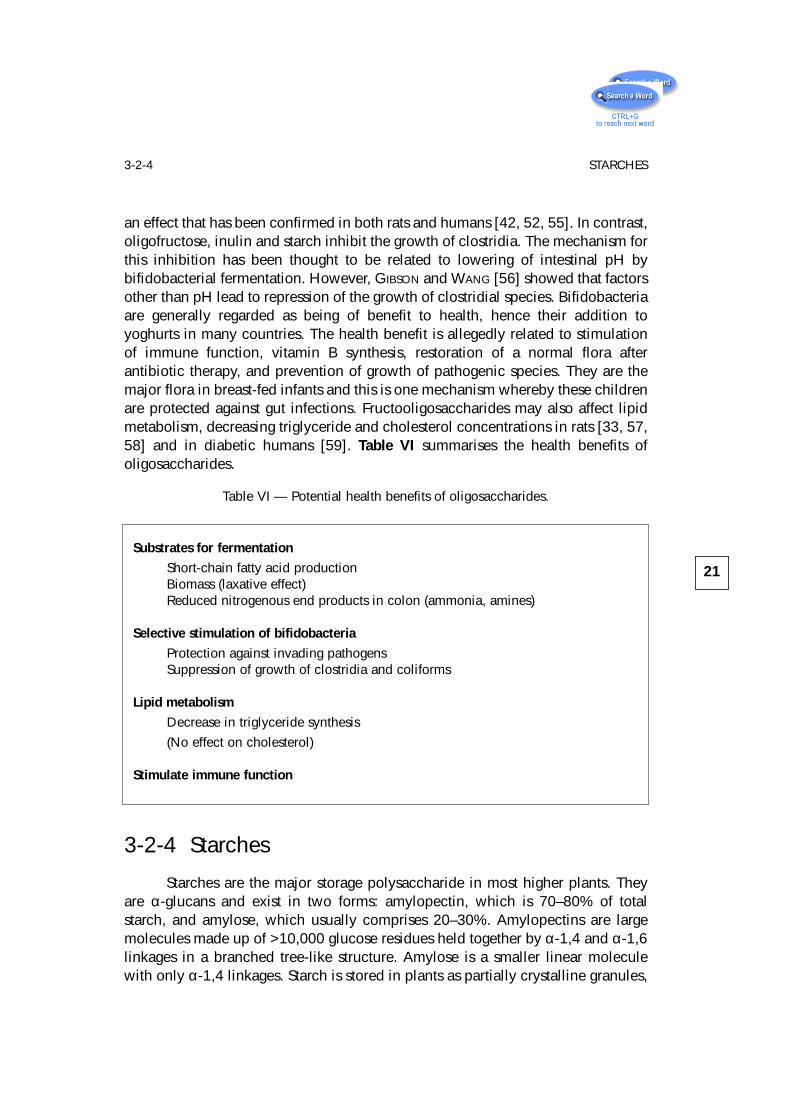
an effect that has been confirmed in both rats and humans [42, 52, 55]. In contrast,oligofructose, inulin and starch inhibit the growth of clostridia. The mechanism forthis inhibition has been thought to be related to lowering of intestinal pH bybifidobacterial fermentation. However, GIBSON and WANG [56] showed that factorsother than pH lead to repression of the growth of clostridial species. Bifidobacteriaare generally regarded as being of benefit to health, hence their addition toyoghurts in many countries. The health benefit is allegedly related to stimulationof immune function, vitamin B synthesis, restoration of a normal flora afterantibiotic therapy, and prevention of growth of pathogenic species. They are themajor flora in breast-fed infants and this is one mechanism whereby these childrenare protected against gut infections. Fructooligosaccharides may also affect lipidmetabolism, decreasing triglyceride and cholesterol concentrations in rats [33, 57,58] and in diabetic humans [59]. Table VI summarises the health benefits ofoligosaccharides.
3-2-4 Starches
Starches are the major storage polysaccharide in most higher plants. Theyare α-glucans and exist in two forms: amylopectin, which is 70–80% of totalstarch, and amylose, which usually comprises 20–30%. Amylopectins are largemolecules made up of >10,000 glucose residues held together by α-1,4 and α-1,6linkages in a branched tree-like structure. Amylose is a smaller linear moleculewith only α-1,4 linkages. Starch is stored in plants as partially crystalline granules,
21
3-2-4 STARCHES
Table VI — Potential health benefits of oligosaccharides.
Substrates for fermentation
Short-chain fatty acid productionBiomass (laxative effect)Reduced nitrogenous end products in colon (ammonia, amines)
Selective stimulation of bifidobacteria
Protection against invading pathogensSuppression of growth of clostridia and coliforms
Lipid metabolism
Decrease in triglyceride synthesis
(No effect on cholesterol)
Stimulate immune function
which in amylopectin have clusters of interchain branching points and domains ofshort chains. These short chains exist as double helixes and give rise to analternating pattern of crystalline (arrays of double-stranded helixes) andamorphous (zones of dense branching) regions [60]. This partially crystallinestructure has distinct patterns on x-ray diffraction. Three main types have beendescribed: A, B and C. Type A is thermodynamically the most stable form and isfound in cereal starches. The B form is characteristic of banana, potato and othertubers and the C pattern is found in legumes. The size and crystalline nature ofstarch granules influence their susceptibility to pancreatic enzymes. In general,starch granules showing x-ray diffraction patterns B and C tend to be more resistantto pancreatic amylase.
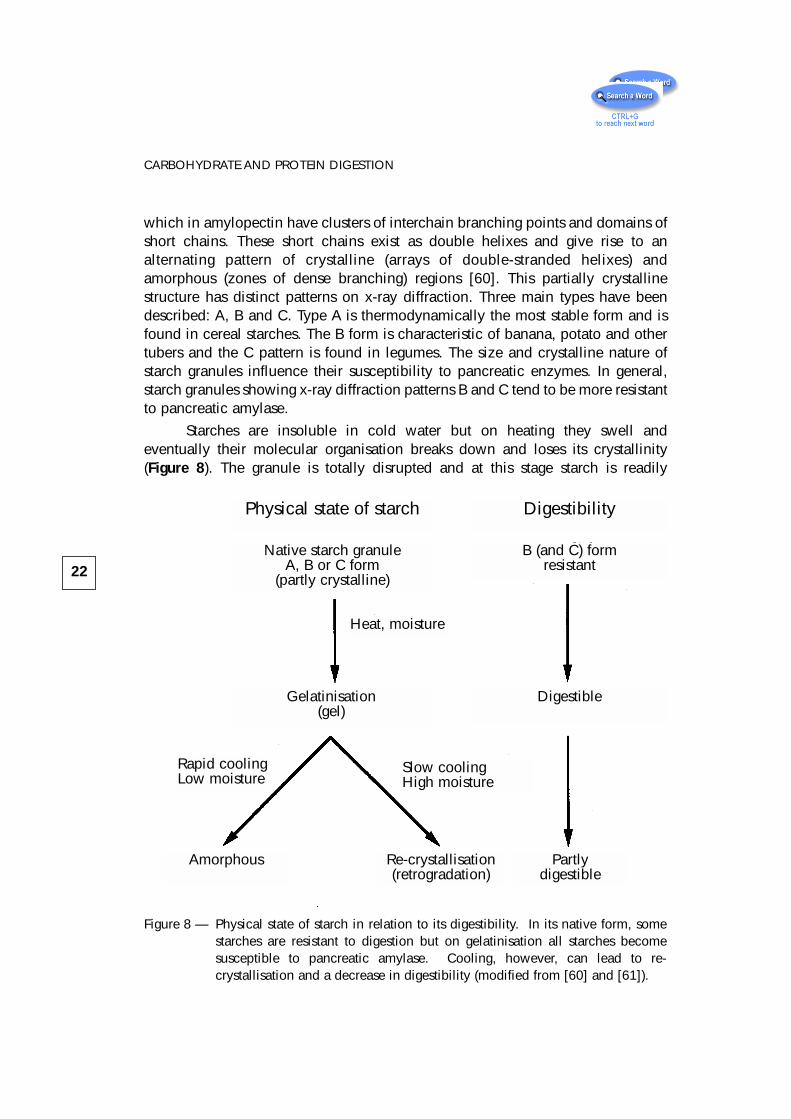
Starches are insoluble in cold water but on heating they swell andeventually their molecular organisation breaks down and loses its crystallinity(Figure 8). The granule is totally disrupted and at this stage starch is readily
22
CARBOHYDRATE AND PROTEIN DIGESTION
Physical state of starch Digestibility
Native starch granuleA, B or C form
(partly crystalline)
B (and C) formresistant
DigestibleGelatinisation(gel)
Partlydigestible
Re-crystallisation(retrogradation)
Amorphous
Slow coolingHigh moisture
Rapid coolingLow moisture
Heat, moisture
Figure 8 — Physical state of starch in relation to its digestibility. In its native form, somestarches are resistant to digestion but on gelatinisation all starches becomesusceptible to pancreatic amylase. Cooling, however, can lead to re-crystallisation and a decrease in digestibility (modified from [60] and [61]).
hydrolyzed by enzymes. The whole process of disruption and swelling is knownas gelatinisation [60] and is the essence of cooking starchy foods. On cooling,gelatinised starch recrystallises, a change known as retrogradation. Retrogradedstarch, particularly amylose, is more resistant to enzymic hydrolysis. The physicaldeterminants of starch gelatinisation and recrystallisation are complex but are ofvital importance for starch digestion because even simple food processes such asheating and cooling which occur during the preparation of a meal will affect thenutritional quality of starchy foods.
Starch digestion
In the past decade two widely held assumptions concerning the digestion ofstarch have been disproved. The first is that all starch, because it exists as largecomplex polymers, is hydrolysed and absorbed more slowly than are simple sugarsor disaccharides. Several studies in vitro and in vivo have shown that the physicalform of food is the major determinant of the rate of digestion of both starches andsugars [62–65]. The second wrong assumption is that starch is completelyhydrolysed and absorbed within the small intestine. It is now known that the extentof starch digestion within the small intestine is variable and that a substantialamount of starch, depending again on physical form, escapes digestion in thesmall intestine and enters the colon [30]. The reasons for the incomplete digestionof starch may be separated into intrinsic factors (i.e. properties of the food) andextrinsic factors (e.g. chewing and transit through the bowel).
– Intrinsic factors
Starch digestion is slowed in the small intestine if the physical form of thefood hinders access of pancreatic amylase. This occurs if starch is contained withinwhole or partly disrupted plant structures such as grains or seeds; if rigid cell wallsinhibit swelling and dispersion of starch, as in legumes [64, 66] or if starch is verydensely packed in a food such as spaghetti [67]. When the rate of starch digestionis decreased, postprandial glucose and insulin responses are reduced or delayed.HEATON et al. [68] demonstrated that these responses are smaller if wheat, maizeor oats are given as whole or coarsely ground grains than if given when finelymilled. When hydrolysis is grossly retarded, physically inaccessible starch mayenter the colon and be fermented or, in some cases, appear in faeces [69].
Starch granules which show x-ray diffraction patterns B and C (e.g. inpotato, banana and legumes) are more resistant to pancreatic amylase than arethose of pattern A (in cereals). Ungelatinised granules of the B form may survivecooking such as the baking of biscuits. When starch granules are fully gelatinisedand dispersed, the starch becomes easily digestible. However, as the gel cools and
23
3-2-4 STARCHES
ages, the polymers once more form a partially crystalline structure.Recrystallisation or retrogradation depends on the formation of interchainhydrogen bonds and occurs most rapidly for the linear amylose. Retrogradation ofamylopectin is limited by its branched structure and the polymers of retrogradedamylose. Retrograded starch characteristically forms the B-type pattern.
Other factors intrinsic to starchy foods that have been shown to affectα-amylase activity in vitro include amylose-lipid complexes [70], native α-amylaseinhibitors [71] and NSPs which may have a direct effect on enzyme activity [72].
– Extrinsic factors
Although the effect of intrinsic factors on digestion of starchy foods may bemeasured in a reproducible way, this does not necessarily predict exactly the rateand extent of digestion of these foods by individuals. This is because eatingexposes food to variable external influences which may alter the susceptibility ofthe starch to hydrolysis by pancreatic amylase. For example, the extent of chewingdetermines the physical accessibility of starch contained within rigid structures[73]. Other factors are the transit time of the food from mouth to terminal ileum[74], the concentration of amylase in the gut, the amount of starch present and thepresence of other food components that might retard enzymic hydrolysis.
Classification and measurement of starches
A classification of starch for nutritional purposes which is based on theintrinsic factors affecting starch digestibility is shown in table VII. In view of theimportance to health of starch there is a need to have good laboratory methods forits measurement for both research purposes and for food tables and labelling. Asingle value for total starch is of limited use because of the widely varyingdigestibility of different starch types.
The various categories of starch shown in table VII may be determined in thelaboratory by controlled enzymatic hydrolysis and measurement of the releasedglucose as described by ENGLYST. Total starch (TS) is measured as the glucosereleased by complete enzymatic hydrolysis of starch after gelatinisation in boilingwater and treatment with potassium hydroxide to disperse retrograded amylose.Rapidly digestible starch (RDS) and slowly digestible starch (SDS) are measuredafter incubation with pancreatic amylase and amyloglucosidase at 37oC. A value forrapidly digestible starch is obtained as the glucose released after 20 min and slowlydigestible starch as the glucose released after a further 100 min incubation.Resistant starch (RS) is calculated as the starch not hydrolysed after 120 minincubation. If required, separate values may be obtained for physically inaccessiblestarch (RS1), resistant starch granules (RS2) and retrograded amylose (RS3) [30].
24
CARBOHYDRATE AND PROTEIN DIGESTION
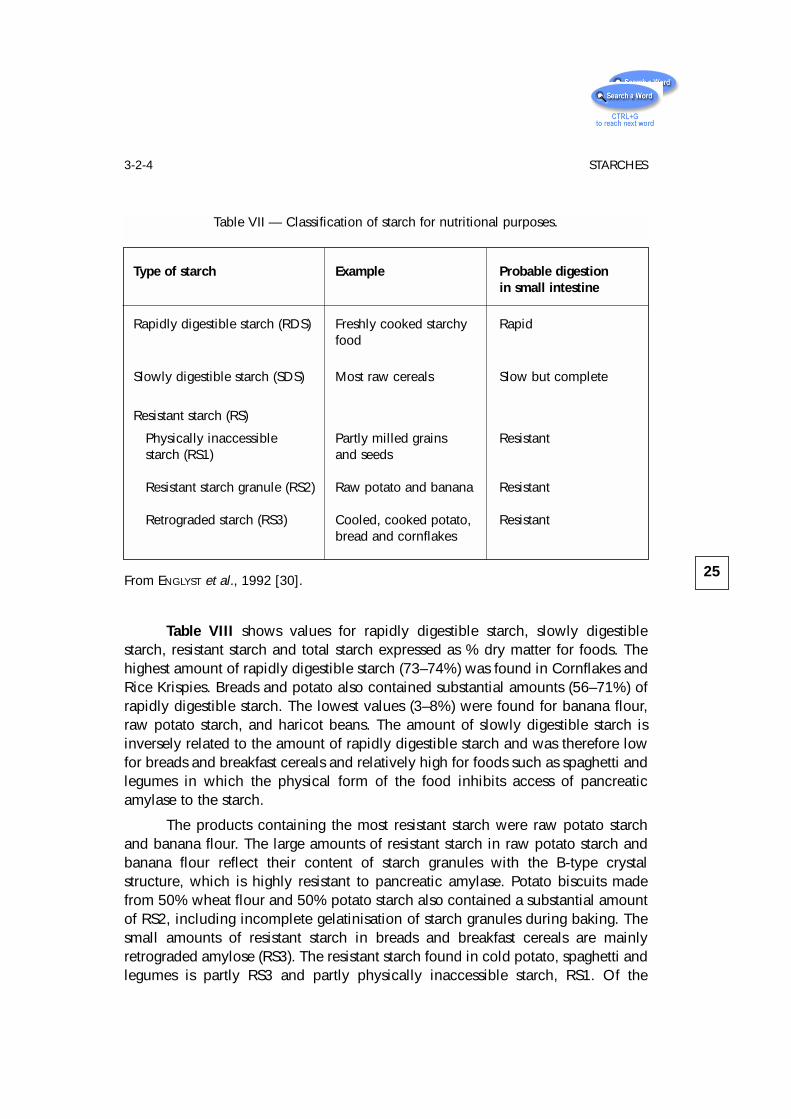
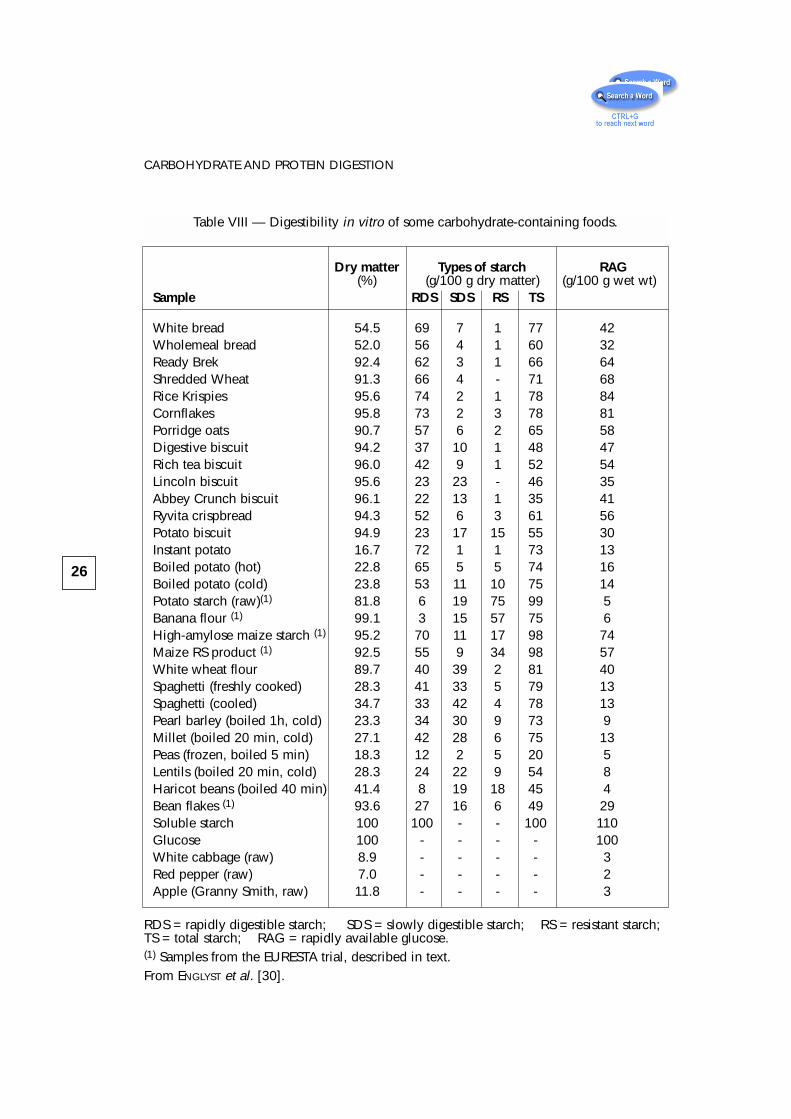
Table VIII shows values for rapidly digestible starch, slowly digestiblestarch, resistant starch and total starch expressed as % dry matter for foods. Thehighest amount of rapidly digestible starch (73–74%) was found in Cornflakes andRice Krispies. Breads and potato also contained substantial amounts (56–71%) ofrapidly digestible starch. The lowest values (3–8%) were found for banana flour,raw potato starch, and haricot beans. The amount of slowly digestible starch isinversely related to the amount of rapidly digestible starch and was therefore lowfor breads and breakfast cereals and relatively high for foods such as spaghetti andlegumes in which the physical form of the food inhibits access of pancreaticamylase to the starch.
The products containing the most resistant starch were raw potato starchand banana flour. The large amounts of resistant starch in raw potato starch andbanana flour reflect their content of starch granules with the B-type crystalstructure, which is highly resistant to pancreatic amylase. Potato biscuits madefrom 50% wheat flour and 50% potato starch also contained a substantial amountof RS2, including incomplete gelatinisation of starch granules during baking. Thesmall amounts of resistant starch in breads and breakfast cereals are mainlyretrograded amylose (RS3). The resistant starch found in cold potato, spaghetti andlegumes is partly RS3 and partly physically inaccessible starch, RS1. Of the
25
3-2-4 STARCHES
Table VII — Classification of starch for nutritional purposes.
Type of starch Example Probable digestionin small intestine
Rapidly digestible starch (RDS) Freshly cooked starchy Rapidfood
Slowly digestible starch (SDS) Most raw cereals Slow but complete
Resistant starch (RS)
Physically inaccessible Partly milled grains Resistantstarch (RS1) and seeds
Resistant starch granule (RS2) Raw potato and banana Resistant
Retrograded starch (RS3) Cooled, cooked potato, Resistantbread and cornflakes
From ENGLYST et al., 1992 [30].
26
CARBOHYDRATE AND PROTEIN DIGESTION
Table VIII — Digestibility in vitro of some carbohydrate-containing foods.
Dry matter Types of starch RAG(%) (g/100 g dry matter) (g/100 g wet wt)
Sample RDS SDS RS TS
White bread 54.5 69 7 1 77 42Wholemeal bread 52.0 56 4 1 60 32Ready Brek 92.4 62 3 1 66 64Shredded Wheat 91.3 66 4 - 71 68Rice Krispies 95.6 74 2 1 78 84Cornflakes 95.8 73 2 3 78 81Porridge oats 90.7 57 6 2 65 58Digestive biscuit 94.2 37 10 1 48 47Rich tea biscuit 96.0 42 9 1 52 54Lincoln biscuit 95.6 23 23 - 46 35Abbey Crunch biscuit 96.1 22 13 1 35 41Ryvita crispbread 94.3 52 6 3 61 56Potato biscuit 94.9 23 17 15 55 30Instant potato 16.7 72 1 1 73 13Boiled potato (hot) 22.8 65 5 5 74 16Boiled potato (cold) 23.8 53 11 10 75 14Potato starch (raw)(1) 81.8 6 19 75 99 5Banana flour (1) 99.1 3 15 57 75 6High-amylose maize starch (1) 95.2 70 11 17 98 74Maize RS product (1) 92.5 55 9 34 98 57White wheat flour 89.7 40 39 2 81 40Spaghetti (freshly cooked) 28.3 41 33 5 79 13Spaghetti (cooled) 34.7 33 42 4 78 13Pearl barley (boiled 1h, cold) 23.3 34 30 9 73 9Millet (boiled 20 min, cold) 27.1 42 28 6 75 13Peas (frozen, boiled 5 min) 18.3 12 2 5 20 5Lentils (boiled 20 min, cold) 28.3 24 22 9 54 8Haricot beans (boiled 40 min) 41.4 8 19 18 45 4Bean flakes (1) 93.6 27 16 6 49 29Soluble starch 100 100 - - 100 110Glucose 100 - - - - 100White cabbage (raw) 8.9 - - - - 3Red pepper (raw) 7.0 - - - - 2Apple (Granny Smith, raw) 11.8 - - - - 3
RDS = rapidly digestible starch; SDS = slowly digestible starch; RS = resistant starch;TS = total starch; RAG = rapidly available glucose.(1) Samples from the EURESTA trial, described in text.From ENGLYST et al. [30].
common foods analysed, haricot beans (soaked overnight and boiled for 40 min)contained the most resistant starch, which constituted 40% of the total starch andcomprised all three resistant starch fractions.
During the measurement of rapidly and slowly digestible starch, a value isobtained for rapidly available glucose (RAG) as the glucose measured after 20 minincubation with pancreatin, amyloglucosidase, and invertase (G20) :
RAG = free glucose + glucose from sucrose +
+ glucose released from starch within 20 min incubation.
The rapidly available glucose value thus represents the amount of glucose(in % by wt) that can be expected to be rapidly available for absorption after ameal. Rapidly available glucose, expressed as a percentage of total starch plus freesugars, shows a correlation with the glycemic index [62]. The foods in table VIIIshow a wide range in their content of rapidly available glucose. For example, therapidly available glucose in a 35 g-portion of cornflakes (28 g glucose)corresponds with that in 68 g white bread, 88 g wholemeal bread, 175 g freshlycooked potato and 700 g haricot beans (cooked as described).
Starch digestion in vivo
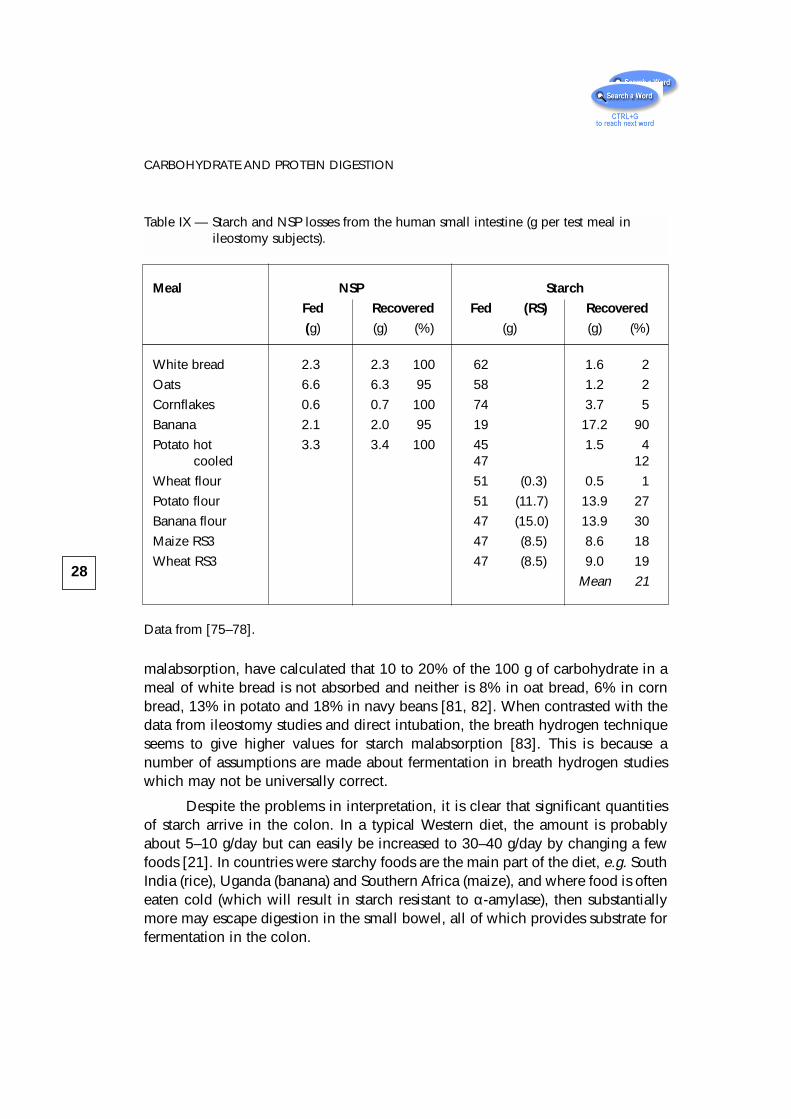
The amount of starch which escapes digestion in the human small boweleach day is difficult to quantify. Table IX shows results from a series of ileostomystudies in humans. From the table it will be seen that cereal starches are on thewhole well digested, with only 2 to 3% escaping in ileostomy effluent, unless thestarch has been processed and retrogradation has taken place (RS3). The same is truefor freshly cooked potato, but once cooled 12% becomes amylase resistant. Bananastarch escapes digestion almost entirely. In another series of ileostomy studies,CHAPMAN et al. [74] found only 2.4% (1.9 g) of starch malabsorbed from meals ofwheat and potato starch, while WOLEVER et al. [79] found total carbohydrate passingto the large intestine after test meals to be 11% (9.5 g) from white bread, 8% (7.7 g)from wholemeal bread and 18% (20.8 g) from red kidney beans. In studies ofhealthy people intubated so that direct measurement of carbohydrate passingthrough the ileum could be made, STEPHEN et al. [80] found that 6% and 9% (2.1and 4.8 g) of the carbohydrate from two mixed meals were malabsorbed.
A number of studies of starch digestion have relied on the appearance inbreath of hydrogen generated during fermentation as an index of starchbreakdown. The amount of hydrogen in breath is compared to that released duringfermentation of a known amount of carbohydrate such as lactulose and, from thisratio, quantitative data for starch absorption are derived. For example, LEVITT’sgroup, in a series of studies using breath hydrogen as a marker of carbohydrate
27
3-2-4 STARCHES
malabsorption, have calculated that 10 to 20% of the 100 g of carbohydrate in ameal of white bread is not absorbed and neither is 8% in oat bread, 6% in cornbread, 13% in potato and 18% in navy beans [81, 82]. When contrasted with thedata from ileostomy studies and direct intubation, the breath hydrogen techniqueseems to give higher values for starch malabsorption [83]. This is because anumber of assumptions are made about fermentation in breath hydrogen studieswhich may not be universally correct.
Despite the problems in interpretation, it is clear that significant quantitiesof starch arrive in the colon. In a typical Western diet, the amount is probablyabout 5–10 g/day but can easily be increased to 30–40 g/day by changing a fewfoods [21]. In countries were starchy foods are the main part of the diet, e.g. SouthIndia (rice), Uganda (banana) and Southern Africa (maize), and where food is ofteneaten cold (which will result in starch resistant to α-amylase), then substantiallymore may escape digestion in the small bowel, all of which provides substrate forfermentation in the colon.
28
CARBOHYDRATE AND PROTEIN DIGESTION
Table IX — Starch and NSP losses from the human small intestine (g per test meal in ileostomy subjects).
Meal NSP Starch
Fed Recovered Fed (RS) Recovered
(g) (g) (%) (g) (g) (%)
White bread 2.3 2.3 100 62 1.6 2
Oats 6.6 6.3 95 58 1.2 2
Cornflakes 0.6 0.7 100 74 3.7 5
Banana 2.1 2.0 95 19 17.2 90
Potato hot 3.3 3.4 100 45 1.5 4cooled 47 12
Wheat flour 51 (0.3) 0.5 1
Potato flour 51 (11.7) 13.9 27
Banana flour 47 (15.0) 13.9 30
Maize RS3 47 (8.5) 8.6 18
Wheat RS3 47 (8.5) 9.0 19
Mean 21
Data from [75–78].
3-2-5 Non-Starch Polysaccharides – Dietary Fibre
The digestive physiology of NSP (dietary fibre) is simple. In humans, all NSPescapes digestion and arrives in the caecum (Table IX). The problems arise withthe definition and methods of analysis.
Definition of Dietary Fibre
Even after more than 25 years of research into the chemistry, physiology andhealth benefits of dietary fibre, we still have to ask the question “What is dietaryfibre?”. This is not because of ignorance — we now know a lot about fibre — butfor other reasons. The original description of dietary fibre by TROWELL (1972) [84]namely “that portion of food which is derived from the cellular walls of plants,which is digested very poorly by human beings” is a nutritional concept and notreally a true definition. Subsequent attempts to define fibre in the light of newknowledge have either been equally unsatisfactory or have failed to gaininternational agreement. Fibre means different things to different people, largelydepending on your point of view. For example, the consumer sees it as somethingassociated with particular health benefits, the breakfast cereal manufacturer as auseful marketing ploy, the nutritionist as a characteristic of a healthy diet, theanalyst as a group of chemical substances and the botanist as part of the plant. Allof these views are legitimate in their own context, but not necessarily compatiblewith a single definition nor always in the best interests of the consumer.
The present concept of dietary fibre came into being around 1970 as a resultof the convergence of evidence from epidemiology, physiology and analyticalstudies, which related the nature of diet to the prevalance of cardiovasculardisease, obesity, diabetes, gallstones and various conditions of the large bowel.
HIGGINSON and OETTLÉ [85] made an important early epidemiologicalobservation when they noted in 1960 that constipation and bowel cancer wererare in Africa whilst being common in the West, and that in Africa “a large amountof roughage is consumed ..” and “stools are bulkier and more frequent ...”. In 1971BURKITT [86] suggested a specific hypothesis relating lack of dietary fibre to thecause of bowel cancer and a mechanism whereby fibre, through its capacity to“regulate the speed of transit, bulk and consistency of stool ...” and effectmicrobial metabolism was able to prevent it.
About this time TROWELL, influenced by his experience in Uganda [87] andby reading CLEAVE’s “The Saccharine Disease” [88], suggested that a number ofother chronic Western diseases like obesity, diabetes, coronary heart disease,gallstones might also be due to consumption of fibre-depleted foods. Concurrently
29
3-2-5 NON-STARCH POLYSACCHARIDES
PAINTER, working in Oxford, proposed that diverticular disease was due to colonicstasis induced by lack of fibre [89]. BURKITT and WALKER then added varicose veinsand haemorrhoids to the list of fibre-deficiency disorders [14, 90].
Parallel with these epidemiological observations was the development ofknowledge of the physiological properties of fibre in the gut. By 1970 there wasalready a substantial body of such knowledge, which was summarised in earlybooks and reviews [91–93]. These sources stressed principally the large boweleffects of dietary fibre, including the pioneering work of WILLIAMS and OLMSTED [94,95] and the early studies of bile acid and cholesterol metabolism summarised bySTORY and KRITCHEVSKY [96]. Subsequently a number of other properties of fibrebecame apparent, most notably those that moderate the absorption of othercarbohydrates and so may influence the management of diabetes. Possible effectson satiety and obesity, vitamins and mineral absorption, mucin secretion andepithelial cell turnover in the gut were subsequently discovered [97, 98].
Advances were also occurring during this time in methods for determinationof dietary fibre in the laboratory, most notable of which were those of SOUTHGATE
[99] and, in animal nutrition, of VAN SOEST [100].
The convergence of these lines of evidence gave birth to the dietary fibrehypothesis and stimulated BURKITT and TROWELL to write a book [101]. BURKITT
wrote to TROWELL asking him to define “dietary fibre”. TROWELL thought this wouldbe simple but could not find fibre defined in any textbooks of medicine or nutrition[102]. Some food tables listed values for the crude fibre content of foods. Crudefibre, a value obtained by a gravimetric method used to analyse animal feeds, hadbeen in use for over 150 years. However, VAN SOEST and colleagues had alreadyshown that this method failed to recover the majority of the plant cell wall material[100].
In the UK the Medical Research Council’s Composition of Foods [103]contained data on “unavailable carbohydrate”, a term used by MCCANCE andLAWRENCE in 1929 [46] and earlier by ATWATER. In trying to prepare accurate foodtables for diabetic diets MCCANCE and LAWRENCE tried to distinguish between“available carbohydrate (which) consists of starch and soluble sugars ... and the ...unavailable, mainly ... hemicellulose and fibre (cellulose)”.
TROWELL, however, wanted a generic term for the undigested plant cell wallthat he thought was important to health and so he decided to redefine fibre. Theearliest formal description of dietary fibre was therefore by TROWELL, who definedit as “the proportion of food which is derived from the cellular walls of plantswhich is digested very poorly in human beings” [84]. This was largely an attemptto distinguish it from crude fibre. It was a physiological-botanical descriptionwhich did not identify the precise nature of dietary fibre nor define exactly thelimiting characteristics of substances that should be included or excluded in the
30
CARBOHYDRATE AND PROTEIN DIGESTION
description, apart from the reference to plant cell wall material. Moreover, therewas no method specified. Implicit in the definition, however, was the belief thatthis fraction of the diet had special health-giving properties.
Since 1972 TROWELL, and others, have redefined fibre on a number ofoccasions. What history, however, points to is a fraction of the diet associated withthe plant cell wall, believed to be indigestible in man, affecting principally bowelfunction but also possibly lipid and carbohydrate metabolism, and valuable in theprevention of large bowel disorders, coronary heart disease and diabetes.
– Distinctive features of dietary fibre
There are three possible areas where we might find a unique defining aspectof dietary fibre, these being: its chemistry, its non-digestibility and itsphysiological/health properties.
• Chemistry. The plant cell wall is a very diverse structure and varies greatlyin its composition. In mature cells, however, it is principally composed of agroup of polysaccharides which are unique in the human diet in that theycontain no α-glucosidic bonds, i.e. they are non-α-glucans or non-starchpolysaccharides (NSP). Other components of the plant cell wall are usuallyno more than 10% [104]. A second distinctive feature of the plant cell wallis that it provides a structure to food, and confers physical properties duringdigestion. Unlike the cell walls of foods of animal origin, the plant cell wallis much thicker, tougher and more resistant to digestion. The plant cell walltherefore gives us two fairly characteristic features by which we mightidentify dietary fibre : its polysaccharide composition and its physicalproperties.
• Non-digestibility. The supposed non-digestibility of dietary fibre wasoriginally thought to be a total lack of digestion in the whole gut, i.e. fibresimply passed through from mouth to anus, bulked up faeces by its waterholding and was effectively inert. However, the extensive breakdown inman of the polysaccharides of the plant cell wall (cellulose, pectin and othernon-cellulosic polysaccharides) was demonstrated by WILLIAMS andOLMSTED in 1936 [94, 95] and many times since (see summary by CUMMINGS
in 1981 [105]). But what about non-digestibility in the small bowel? No-onehas yet identified human enzymes capable of hydrolysing plantpolysaccharides other than starch and a variety of human studies usingbreath hydrogen, ileostomy subjects and ileal intubation, and in vitrotechniques have clearly shown that NSP survive intact to reach the colon.However, this is a feature shared by many carbohydates, e.g. resistantstarches, most oligosaccharides, sugar alcohols and in many populations,lactose.
31
3-2-5 NON-STARCH POLYSACCHARIDES
• Health benefits. Is there such a thing as a true fibre-deficiency disorder,i.e. a disease that is induced only by low intakes of dietary fibre? Perhapsthe nearest we can get to this is constipation. Physiologically there is noother dietary component at present which shows such a close relationbetween bowel habit and intake in the diet. However, all malabsorbedcarbohydrates can effect laxation, in particular resistant starches [106-109]and oligosaccharides [52], although fibre may well be the most effective inthis context. Other large bowel diseases such as diverticular disease andcancer are candidate fibre-deficiency disorders, but current evidence by nomeans supports an exclusive role for fibre in these conditions like, forexample, deficiency of vitamin C leading to scurvy. The case with regard tocoronary heart disease, diabetes and obesity is even less convincing,although dietary fibre may contribute. The health benefits of fibre thereforedo not provide a distinct defining characteristic or a disease that can beexclusively associated with it, although constipation comes closest tofulfilling this criterion. However, constipation has many causes and laxationis produced by other carbohydrates. Dietary fibre serves as a marker of adiet rich in plant food, many components of which contribute to health.
– Limiting the definition of dietary fibre
We thus have a good case to avoid the concept of non-digestibility andbased on chemical and physiological properties, for limiting the definition ofdietary fibre to plant cell wall material. From health studies, no distinctive featureof dietary fibre emerges although faecal bulking comes closest. If we define fibreas plant cell wall material we exclude resistant starch, oligosaccharides andnon-digestible sugars. Since the dietary fibre content of foodstuffs—especiallybreakfast cereals—is thought to sell products, some manufacturers argue for theinclusion of as many constituents of the diet as possible under the label of fibreto give a high “fibre” value. This, however, is a very short-sighted view andagainst both the historical concept of dietary fibre and the consumers’ interest. Amore enlightened approach would be a new classification of dietarycarbohydrate and public education to back it up. Combining disimilarsubstances under the label of dietary fibre is unjustifiable physiologically andanalytically.
• Lignin. Lignin is a highly insoluble small polymer, the basic units ofwhich are substituted phenylpropanes. It is not a carbohydrate although itis a component of some plant cell walls. Most human foods are eaten at anunlignified stage, the main exception to this being wholegrain cereals.Interest in lignin is largely a carryover from animal studies where ligninforms a part of ruminant feeds and has been shown to retard plant cell walldigestibility. Its physiological effects and health benefits, which are likely to
32
CARBOHYDRATE AND PROTEIN DIGESTION
be different from those of the cell wall polysaccharides, have never beenclearly demonstrated in man. Moreover, there are no methods currentlyavailable for measuring true lignin that are suitable for general laboratoryuse. What is usually measured is “KLASON lignin”, which contains artefactsof heat treatment, tanins and other phenolics. Including a value for ligninwith the plant cell wall polysaccharides would make dietary fibremeasurements more difficult to interpret.
• The analyst. The food analyst is a chemist and needs a clear chemicalobjective. He or she does not want to be involved in assessments ofdigestibility nor have to measure chemically very disparate substanceseither with regard to molecular mass or composition. Asking the analyst tomeasure the plant cell wall is unrealistic but a suitable surrogate exists inthe measurement of the non-starch polysaccharides, and for reasonsalready given these are the most important fraction to measure. Accuratemethods which have been tested in international studies exist for NSP. Forthe analyst, therefore, the measurement of the non-starch polysaccharidesof the plant cell wall proves an accurate and attainable objective.
Dietary fibre should therefore be defined as plant cell wall material andmeasured as non-starch polysaccharides.
Analysis of Dietary Fibre
There are two principal methods of analysis for dietary fibre both of whichhave undergone extensive development and interlaboratory testing over a periodof ten years. These two methods are characterised by being either enzymaticgravimetric or enzymatic chemical.
– The enzymatic gravimetric methods [110–114]
The principal method, adopted by the Association of Official AnalyticalChemists (AOAC), was described first in 1984 by PROSKY et al. [110]. The aim ofthe method was that it should be rapid and measure indigestible carbohydrate as“the sum of the soluble and insoluble polysaccharides and lignin”. In principleit involves gelatinising dried foods with a heat stable α-amylase and thenenzymatically digesting them with protease and amyloglucosidase to removeprotein and starch. Ethanol is added to precipitate soluble dietary fibre and theresidue is filtered, washed and dried. The residue is analysed for protein (N x 6.25)and ash, and dietary fibre is determined as the weight of the residue less proteinand ash. The method has been subject to a number of modifications since itsinception including most recently that by LEE et al. (1992) [113] and to a series ofcollaborative interlaboratory trials [115-120]. The gravimetric residue contains
33
3-2-5 NON-STARCH POLYSACCHARIDES
principally undigestible polysaccharides, including some resistant starch,non-carbohydrate material including lignin, and unidentified substances [121].
Other gravimetric methods described include the urea enzymatic dialysismethod of VAN SOEST [122], that of MEUSER [123] and MONGEAU and BRASSARD’stechnique which has been tested in two collaborative trials [116, 117].
– The enzymatic chemical methods [29, 119, 120, 124–130]
The principal method here is that of ENGLYST et al., first described in 1978[131, 132]. The method is a development of that of SOUTHGATE [99] and aims toestimate the cell wall polysaccharides as non-starch polysaccharides (NSP) inplant foods. In principle, starch is removed enzymatically after solubilisation andNSP are measured as the sum of the constituent sugars released by acid hydrolysis.A value may be obtained for total dietary fibre or, if required, soluble and insolublefibre. Cellulose may be measured separately and the non-cellulosicpolysaccharides are characterised by measurement of the individualmonosaccharides by gas-liquid chromatography (GLC).
A rapid colorimetric modification of the ENGLYST method has been described[127] and an HPLC method [133–135]. The ENGLYST method has undergone anumber of modifications and a series of interlaboratory collaborative trials [119,120, 129, 130]. In practice the method measures the plant cell wallpolysaccharides and chemically related (non-α-glucan) polysaccharides insolublein 80% ethanol. Kits are commercially available for both methods.
THEANDER and co-workers [124–126] have elaborated another set ofmethods based on gas-liquid chromatography (the Uppsala methodology). TheUppsala and ENGLYST methods differ in two respects:– the Uppsala method includes KLASON lignin;– some resistant starch (retrograded amylose) is included in the Uppsala method,
as in the enzymatic gravimetric methods.
Dietary fibre methods which include lignin in fact measure what is knownas KLASON lignin. This is material insoluble in concentrated sulphuric acid and isnot an estimate of true lignin but includes other acid-insoluble material. KLASON
was a Swedish chemist who devised the method.
– Comparison of methods
Both the ENGLYST and PROSKY methods can be performed in normallyequipped laboratories and give reasonably reproducible results in interlaboratorytrials. Both have been applied to a wide range of foodstuffs. The major difference,as already indicated, lies in what is measured.
There have been very few formal collaborative studies in which bothmethods have been compared. The first study reported by the UK Ministry of Agri-culture, Fisheries and Food (MAFF) in 1985 compared two early versions of the
34
CARBOHYDRATE AND PROTEIN DIGESTION
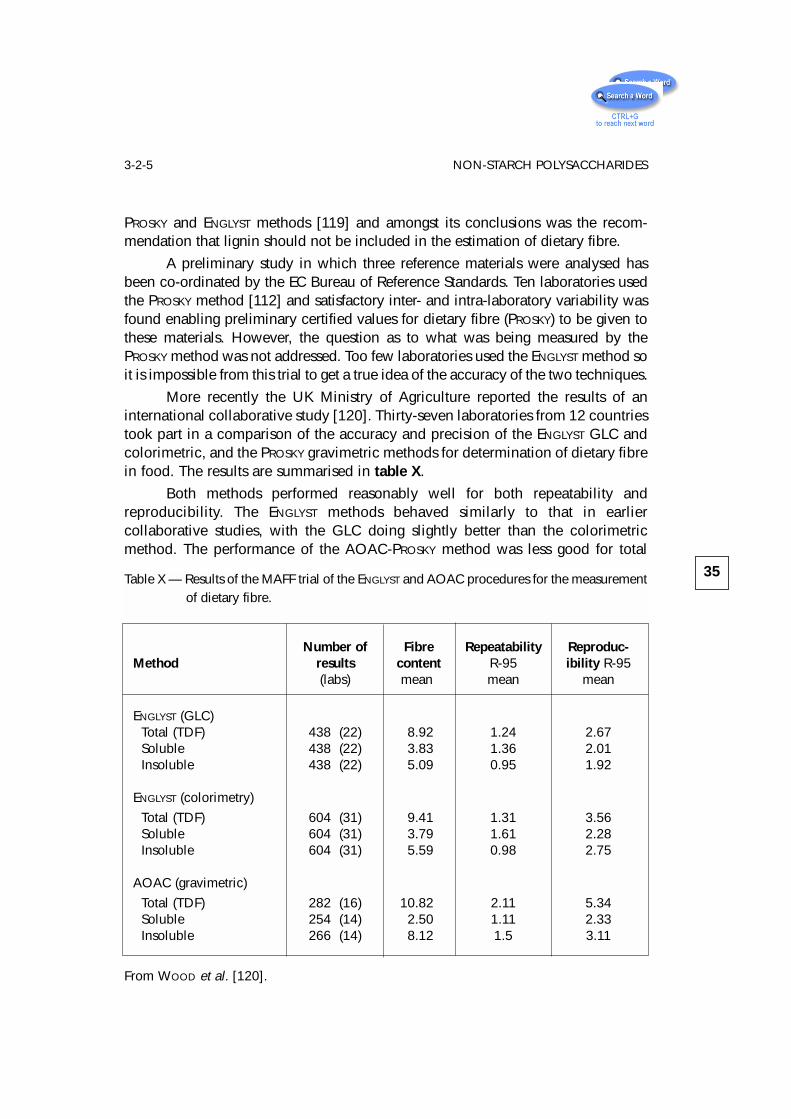
PROSKY and ENGLYST methods [119] and amongst its conclusions was the recom-mendation that lignin should not be included in the estimation of dietary fibre.
A preliminary study in which three reference materials were analysed hasbeen co-ordinated by the EC Bureau of Reference Standards. Ten laboratories usedthe PROSKY method [112] and satisfactory inter- and intra-laboratory variability wasfound enabling preliminary certified values for dietary fibre (PROSKY) to be given tothese materials. However, the question as to what was being measured by thePROSKY method was not addressed. Too few laboratories used the ENGLYST method soit is impossible from this trial to get a true idea of the accuracy of the two techniques.
More recently the UK Ministry of Agriculture reported the results of aninternational collaborative study [120]. Thirty-seven laboratories from 12 countriestook part in a comparison of the accuracy and precision of the ENGLYST GLC andcolorimetric, and the PROSKY gravimetric methods for determination of dietary fibrein food. The results are summarised in table X.
Both methods performed reasonably well for both repeatability andreproducibility. The ENGLYST methods behaved similarly to that in earliercollaborative studies, with the GLC doing slightly better than the colorimetricmethod. The performance of the AOAC-PROSKY method was less good for total
35
3-2-5 NON-STARCH POLYSACCHARIDES
Table X — Results of the MAFF trial of the ENGLYST and AOAC procedures for the measurement of dietary fibre.
Number of Fibre Repeatability Reproduc-Method results content R-95 ibility R-95
(labs) mean mean mean
ENGLYST (GLC)Total (TDF) 438 (22) 8.92 1.24 2.67Soluble 438 (22) 3.83 1.36 2.01Insoluble 438 (22) 5.09 0.95 1.92
ENGLYST (colorimetry)
Total (TDF) 604 (31) 9.41 1.31 3.56Soluble 604 (31) 3.79 1.61 2.28Insoluble 604 (31) 5.59 0.98 2.75
AOAC (gravimetric)
Total (TDF) 282 (16) 10.82 2.11 5.34Soluble 254 (14) 2.50 1.11 2.33Insoluble 266 (14) 8.12 1.5 3.11
From WOOD et al. [120].
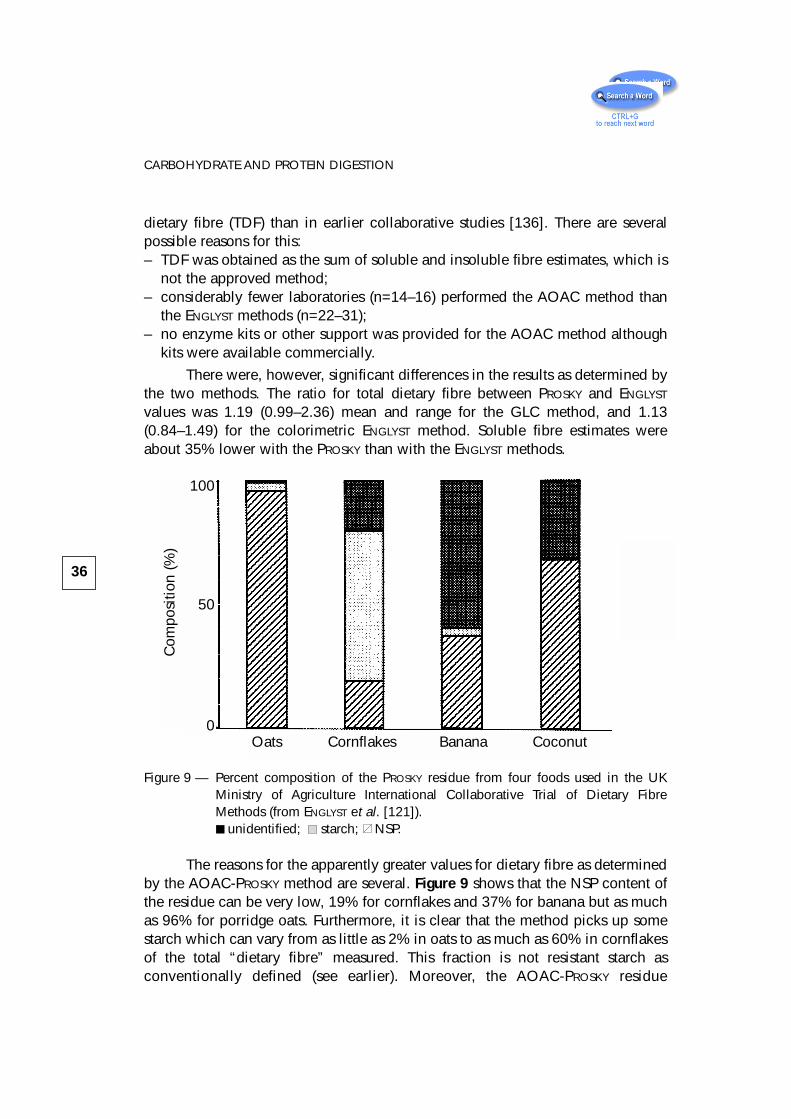
dietary fibre (TDF) than in earlier collaborative studies [136]. There are severalpossible reasons for this: – TDF was obtained as the sum of soluble and insoluble fibre estimates, which is
not the approved method;– considerably fewer laboratories (n=14–16) performed the AOAC method than
the ENGLYST methods (n=22–31);– no enzyme kits or other support was provided for the AOAC method although
kits were available commercially.
There were, however, significant differences in the results as determined bythe two methods. The ratio for total dietary fibre between PROSKY and ENGLYST
values was 1.19 (0.99–2.36) mean and range for the GLC method, and 1.13(0.84–1.49) for the colorimetric ENGLYST method. Soluble fibre estimates wereabout 35% lower with the PROSKY than with the ENGLYST methods.
Figure 9 — Percent composition of the PROSKY residue from four foods used in the UKMinistry of Agriculture International Collaborative Trial of Dietary FibreMethods (from ENGLYST et al. [121]).
unidentified; starch; NSP.
The reasons for the apparently greater values for dietary fibre as determinedby the AOAC-PROSKY method are several. Figure 9 shows that the NSP content ofthe residue can be very low, 19% for cornflakes and 37% for banana but as muchas 96% for porridge oats. Furthermore, it is clear that the method picks up somestarch which can vary from as little as 2% in oats to as much as 60% in cornflakesof the total “dietary fibre” measured. This fraction is not resistant starch asconventionally defined (see earlier). Moreover, the AOAC-PROSKY residue
36
CARBOHYDRATE AND PROTEIN DIGESTION
Oats Cornflakes Banana Coconut
Com
posi
tion
(%)
100
50
0
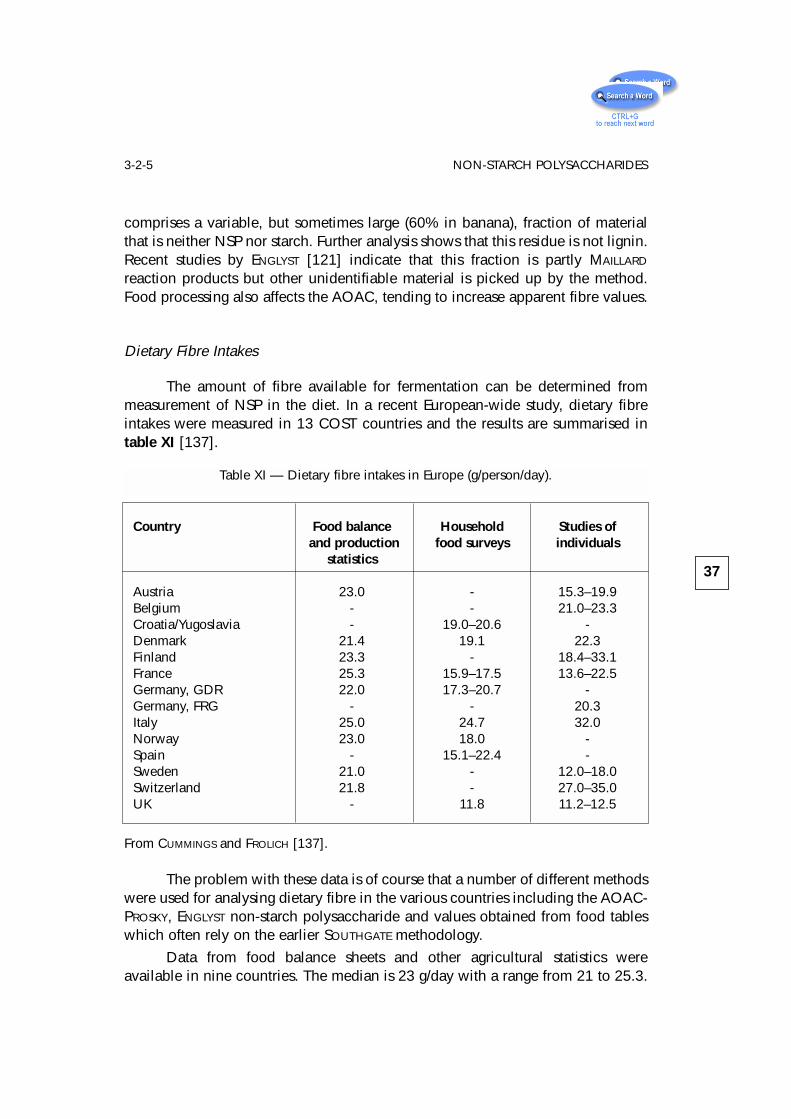
comprises a variable, but sometimes large (60% in banana), fraction of materialthat is neither NSP nor starch. Further analysis shows that this residue is not lignin.Recent studies by ENGLYST [121] indicate that this fraction is partly MAILLARD
reaction products but other unidentifiable material is picked up by the method.Food processing also affects the AOAC, tending to increase apparent fibre values.
Dietary Fibre Intakes
The amount of fibre available for fermentation can be determined frommeasurement of NSP in the diet. In a recent European-wide study, dietary fibreintakes were measured in 13 COST countries and the results are summarised intable XI [137].
The problem with these data is of course that a number of different methodswere used for analysing dietary fibre in the various countries including the AOAC-PROSKY, ENGLYST non-starch polysaccharide and values obtained from food tableswhich often rely on the earlier SOUTHGATE methodology.
Data from food balance sheets and other agricultural statistics wereavailable in nine countries. The median is 23 g/day with a range from 21 to 25.3.
37
3-2-5 NON-STARCH POLYSACCHARIDES
Table XI — Dietary fibre intakes in Europe (g/person/day).
Country Food balance Household Studies ofand production food surveys individuals
statistics
Austria 23.0 - 15.3–19.9Belgium - - 21.0–23.3Croatia/Yugoslavia - 19.0–20.6 -Denmark 21.4 19.1 22.3Finland 23.3 - 18.4–33.1France 25.3 15.9–17.5 13.6–22.5Germany, GDR 22.0 17.3–20.7 -Germany, FRG - - 20.3Italy 25.0 24.7 32.0Norway 23.0 18.0 -Spain - 15.1–22.4 -Sweden 21.0 - 12.0–18.0Switzerland 21.8 - 27.0–35.0UK - 11.8 11.2–12.5
From CUMMINGS and FROLICH [137].
The range of values is remarkably small, particularly in view of the variety ofanalytical methods which were used including AOAC and various gravimetricmethods, ENGLYst and other enzymatic chemical methods.
Results from household food surveys were available again in nine countries.The median was 19 g/d and range 11.8 to 24.7. The result is significantly (t 2.73,p < .05) lower than that obtained from food balance sheets because of the natureof the method and also a greater preponderance of countries using enzymatic-chemical methods which give lower results than the gravimetric techniques. Theaverage for the five countries using mainly enzymatic-chemical methods is16.6 g/d and for the six using gravimetric methods 20.3 g/d. The values cannotalways be divided clearly into one method or another because often food tablescontain results using several different techniques, nevertheless the variance inthese data is partly dependent on methodology.
In ten countries data were available on the dietary fibre intakes ofindividuals. These studies should approach more nearly true dietary fibre intakesbut of course there are always questions about the representativeness of each groupfor the whole population [138]. The crude average for these studies is 20.8 g/d, witha wide range from 11.0 in the UK to 33.1 in Finland. The analytical methodologiesare much more mixed here so it is not really possible to calculate averages for themwith any reliance. What does emerge from the table, however, is that there isprobably real variation across Europe with a range of something around 12–25 g/dusing enzymatic-chemical methods and 18–30 g/d with other techniques(SOUTHGATE or gravimetric). If the data from all three survey methodologies areranked then Italy is consistently highest for dietary fibre intake, followed closely byFinland and Croatia/Yugoslavia. At the other end of the scale are Austria,Switzerland and the UK. However, in the absence of comparable methodologies,particularly for analysis of dietary fibre, such conclusions can only be very tentative.
Physiological Properties and Health Benefits of Fibre
Much has been claimed for dietary fibre, both in terms of its physiologicaleffects in humans and its resulting health benefits. The case for dietary fibre hasprobably been overstated but, now that the dust is beginning to settle on the fibrestory, it is clear that at least two important properties emerge. Firstly, fibre hasphysical structure which it confers upon the plant foods in the diet. This results ina number of effects in man and these are summarised in table XII.
The other principal property of fibre relates to its non-digestibility in theupper bowel and subsequent fermentation in the large intestine by the colonicbacteria. These properties have been well described previously [139–145]. Theyare summarised in table XIII.
38
CARBOHYDRATE AND PROTEIN DIGESTION
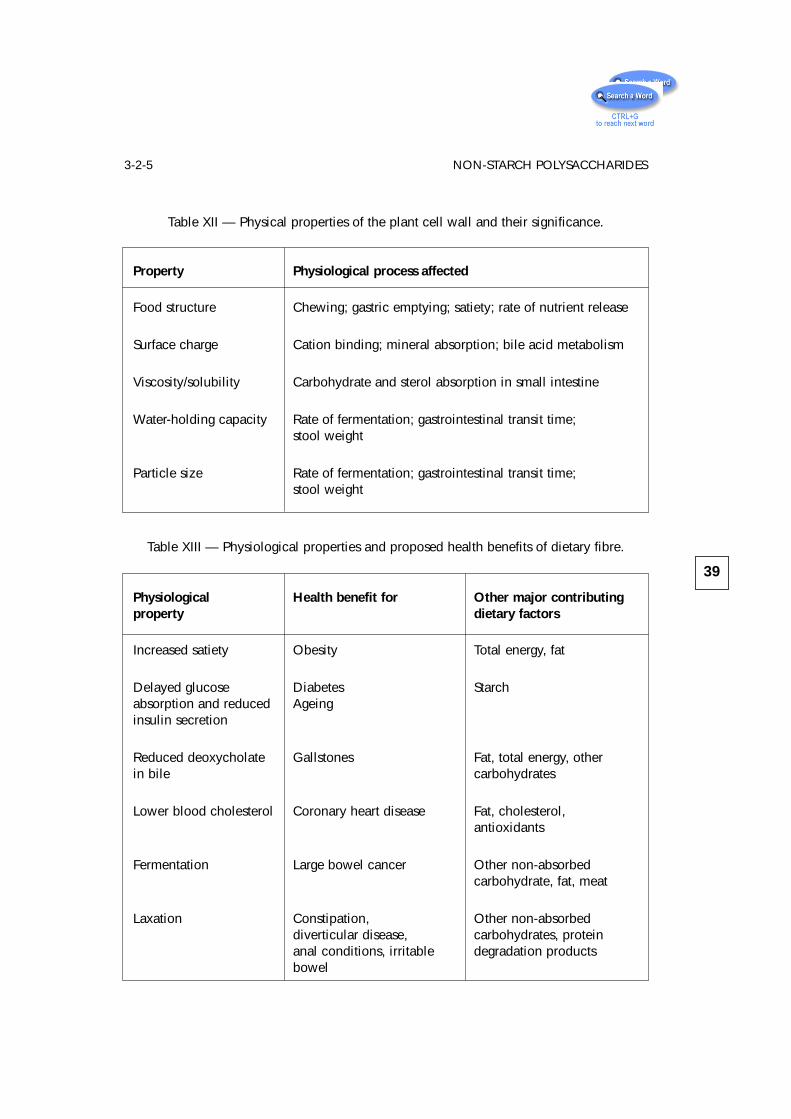
39
3-2-5 NON-STARCH POLYSACCHARIDES
Table XII — Physical properties of the plant cell wall and their significance.
Property Physiological process affected
Food structure Chewing; gastric emptying; satiety; rate of nutrient release
Surface charge Cation binding; mineral absorption; bile acid metabolism
Viscosity/solubility Carbohydrate and sterol absorption in small intestine
Water-holding capacity Rate of fermentation; gastrointestinal transit time;stool weight
Particle size Rate of fermentation; gastrointestinal transit time;stool weight
Table XIII — Physiological properties and proposed health benefits of dietary fibre.
Physiological Health benefit for Other major contributingproperty dietary factors
Increased satiety Obesity Total energy, fat
Delayed glucose Diabetes Starchabsorption and reduced Ageinginsulin secretion
Reduced deoxycholate Gallstones Fat, total energy, otherin bile carbohydrates
Lower blood cholesterol Coronary heart disease Fat, cholesterol,antioxidants
Fermentation Large bowel cancer Other non-absorbedcarbohydrate, fat, meat
Laxation Constipation, Other non-absorbeddiverticular disease, carbohydrates, proteinanal conditions, irritable degradation productsbowel
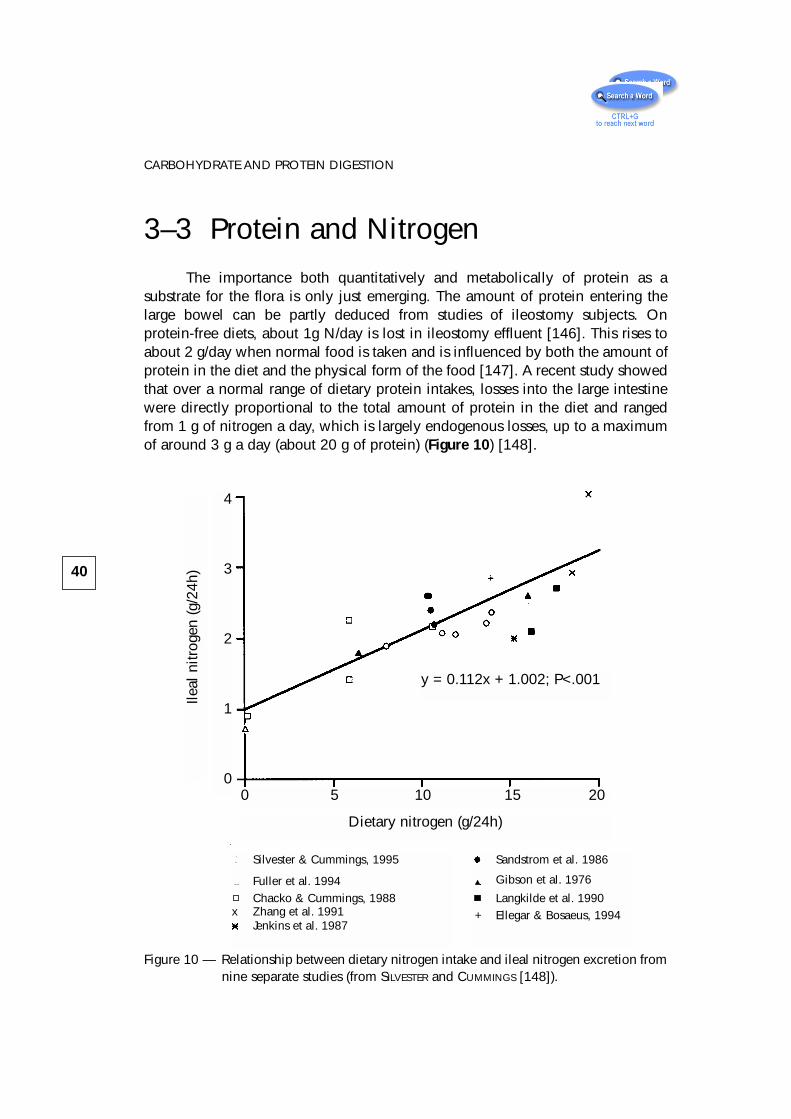
3–3 Protein and NitrogenThe importance both quantitatively and metabolically of protein as a
substrate for the flora is only just emerging. The amount of protein entering thelarge bowel can be partly deduced from studies of ileostomy subjects. Onprotein-free diets, about 1g N/day is lost in ileostomy effluent [146]. This rises toabout 2 g/day when normal food is taken and is influenced by both the amount ofprotein in the diet and the physical form of the food [147]. A recent study showedthat over a normal range of dietary protein intakes, losses into the large intestinewere directly proportional to the total amount of protein in the diet and rangedfrom 1 g of nitrogen a day, which is largely endogenous losses, up to a maximumof around 3 g a day (about 20 g of protein) (Figure 10) [148].
40
CARBOHYDRATE AND PROTEIN DIGESTION
0 5 10 15 20
Dietary nitrogen (g/24h)
y = 0.112x + 1.002; P<.001
4
3
2
1
0
Ileal
nitr
ogen
(g/2
4h)
Silvester & Cummings, 1995
Fuller et al. 1994Chacko & Cummings, 1988
x Zhang et al. 1991Jenkins et al. 1987
Sandstrom et al. 1986
Gibson et al. 1976
Langkilde et al. 1990+ Ellegar & Bosaeus, 1994
Figure 10 — Relationship between dietary nitrogen intake and ileal nitrogen excretion fromnine separate studies (from SILVESTER and CUMMINGS [148]).
The majority of the N is protein (48–51%) and peptides (20–30%). Very littleurea or nitrate is lost in ileostomy effluent [146, 147, 149]. On N-free diets, proteinlosses comprise mainly pancreatic enzymes whereas with normal food amino acidpatterns in ileostomy effluent suggest that food residues are the major contributor.Surprisingly, the amount of NSP appears not to influence small bowel proteinlosses [147, 148, 150] except where purified polysaccharides such as pectin aregiven .
3-4 MucusMucins are acidic glycoproteins secreted by goblet cells that line the
intestinal tract where they form a protective gel covering the mucosal surface [151,152]. Mucins have a protein core with carbohydrate side chains which containmainly galactose and hexosamines such as N-acetylglucosamine, with somefucose [153, 154]. The carbohydrate moieties occur as linear and branched-chainoligosaccharides which constitute as much as 85% of the molecule by weight[152]. Mucins and other host-produced substances have been found to supportcomplex communities of intestinal bacteria in vivo in the absence of any input ofdietary substrate [155], demonstrating that they provide a source of carbohydratefor the microflora. Bacteriological studies have suggested that bifidobacteria,ruminococci, and some bacteroides play an important role in their degradation[154, 156]. Mucus is both found in ileal effluent and secreted into the large bowel.The amounts are unknown but some estimates have been made from intubationstudies [80]. Mucopolysaccharides such as chondroitin sulphate also supportbacterial growth [157, 158]. In total, mucus and related substances probably addan additional 3 to 5 g of carbohydrate for fermentation.
3-5 SummaryIn summary, a wide variety of substrates, depending on dietary type, are
available for fermentation in the colon and the range is likely to become evengreater as food manufacturers use their ingenuity to bypass small bowel digestiveenzymes. Overall, between 10 and 60 g carbohydrate-containing and 6 to 18 gnitrogen-containing compounds probably become available to the flora on a dailybasis and constitute the major influence on intraluminal events. The nature of thediet is thus very important in determining colonic function.
41
3-4 MUCUS
4 – Short-chain fatty acids
4-1 IntroductionBoth carbohydrate and protein fermentation give rise to short-chain fatty
acids (SCFA) although, as we shall see later, protein is only a minor contributor tototal production. SCFA are the principal products of fermentation and, throughtheir absorption and metabolism, the host is able to salvage energy from food notdigested in the upper intestine. Recent years have seen increasing interest in SCFAin human biology resulting in a number of reviews and books on the subject [8,159–163]. SCFA affect colonic epithelial cell transport, colonocyte metabolism,growth and differentiation, hepatic control of lipid and carbohydrates, and provideenergy to muscle, kidney, heart and brain. Already there are clinical uses suggestedfor SCFA in the management of ulcerative colitis and diversion colitis, and inenteral feeding.
4-2 Occurrence of SCFA in hindgutAlthough there have been many reports of SCFA concentrations in human
faeces, very few measurements have been made from material within differentregions of the large bowel. Table XIV shows data from luminal contents obtainedat autopsy from sudden death victims in the UK and also from right and left-sidedcolostomies of patients at Baragwanath Hospital, Soweto, who were awaitingcolostomy closure some months after surgery for abdominal trauma. In all casesacetate is the dominant SCFA, and propionate is equal to or greater than butyrate.In both the autopsy and colostomy cases shown in table XIV, SCFA concentrationsare much higher in the right side of the colon, including the caecal area. It is herethat colonic bacteria first encounter carbohydrate substrates leaving the smallintestine and is thus the area of highest fermentative activity. Surprisingly, however,the molar ratios of acetate:propionate:butyrate are very similar in both right andleft colon. Generally, the concentrations in colostomy contents are higher but thismay be because these subjects were eating a maize based diet in which starchycarbohydrates accounted for 50-60% of their total energy intake, unlike in Westerncountries such as the UK, where carbohydrate amounts to around 45% of energy,of which only half comes from starchy sources (mainly bread and potatoes).
43
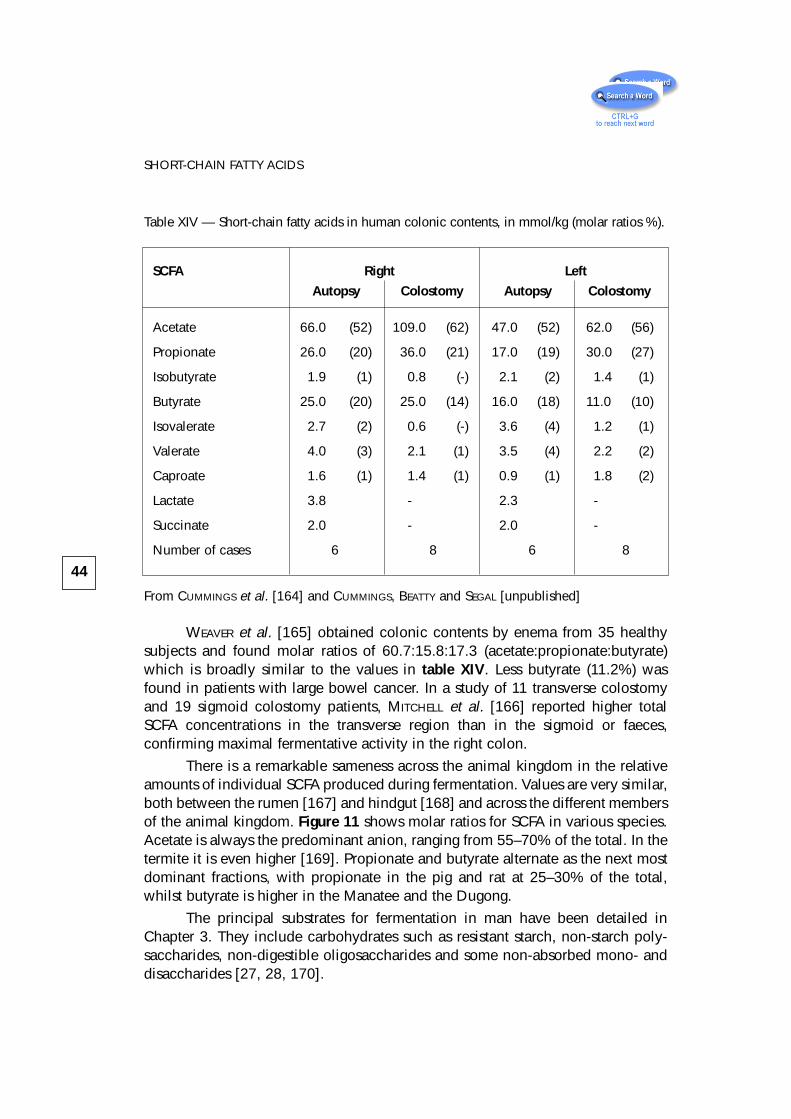
WEAVER et al. [165] obtained colonic contents by enema from 35 healthysubjects and found molar ratios of 60.7:15.8:17.3 (acetate:propionate:butyrate)which is broadly similar to the values in table XIV. Less butyrate (11.2%) wasfound in patients with large bowel cancer. In a study of 11 transverse colostomyand 19 sigmoid colostomy patients, MITCHELL et al. [166] reported higher totalSCFA concentrations in the transverse region than in the sigmoid or faeces,confirming maximal fermentative activity in the right colon.
There is a remarkable sameness across the animal kingdom in the relativeamounts of individual SCFA produced during fermentation. Values are very similar,both between the rumen [167] and hindgut [168] and across the different membersof the animal kingdom. Figure 11 shows molar ratios for SCFA in various species.Acetate is always the predominant anion, ranging from 55–70% of the total. In thetermite it is even higher [169]. Propionate and butyrate alternate as the next mostdominant fractions, with propionate in the pig and rat at 25–30% of the total,whilst butyrate is higher in the Manatee and the Dugong.
The principal substrates for fermentation in man have been detailed inChapter 3. They include carbohydrates such as resistant starch, non-starch poly-saccharides, non-digestible oligosaccharides and some non-absorbed mono- anddisaccharides [27, 28, 170].
44
SHORT-CHAIN FATTY ACIDS
Table XIV — Short-chain fatty acids in human colonic contents, in mmol/kg (molar ratios %).
SCFA Right Left
Autopsy Colostomy Autopsy Colostomy
Acetate 66.0 (52) 109.0 (62) 47.0 (52) 62.0 (56)
Propionate 26.0 (20) 36.0 (21) 17.0 (19) 30.0 (27)
Isobutyrate 1.9 (1) 0.8 (-) 2.1 (2) 1.4 (1)
Butyrate 25.0 (20) 25.0 (14) 16.0 (18) 11.0 (10)
Isovalerate 2.7 (2) 0.6 (-) 3.6 (4) 1.2 (1)
Valerate 4.0 (3) 2.1 (1) 3.5 (4) 2.2 (2)
Caproate 1.6 (1) 1.4 (1) 0.9 (1) 1.8 (2)
Lactate 3.8 - 2.3 -
Succinate 2.0 - 2.0 -
Number of cases 6 8 6 8
From CUMMINGS et al. [164] and CUMMINGS, BEATTY and SEGAL [unpublished]
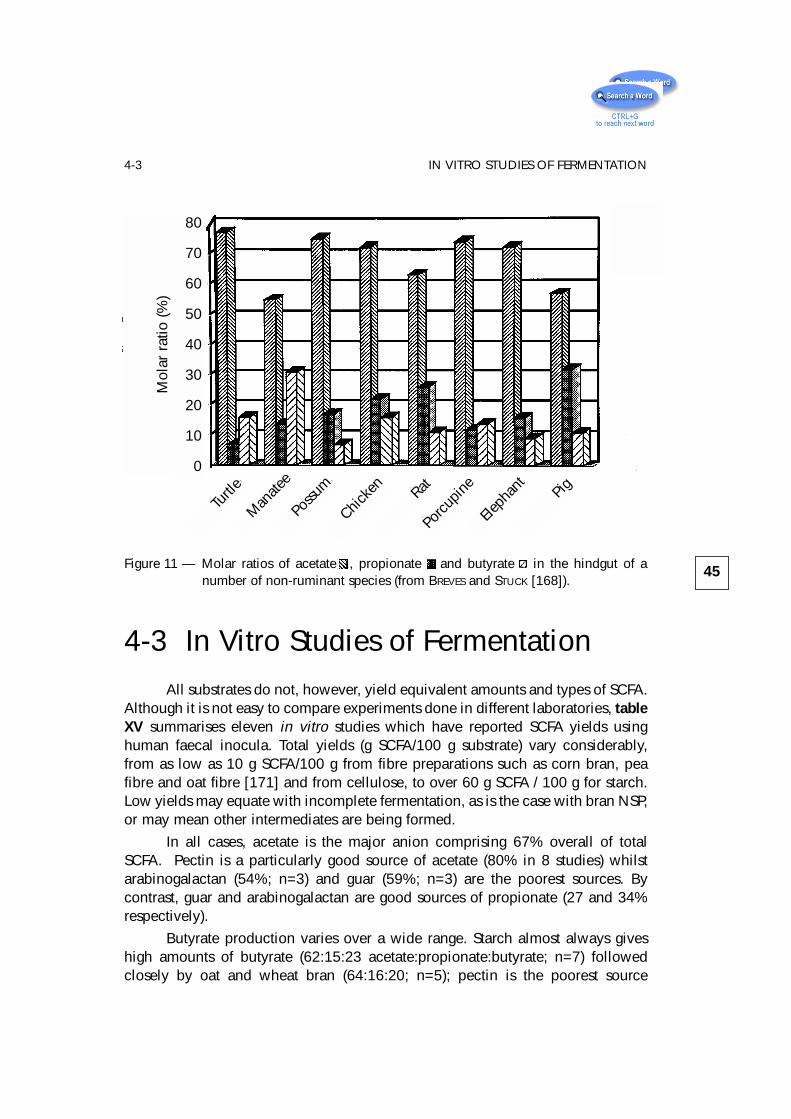
4-3 In Vitro Studies of FermentationAll substrates do not, however, yield equivalent amounts and types of SCFA.
Although it is not easy to compare experiments done in different laboratories, tableXV summarises eleven in vitro studies which have reported SCFA yields usinghuman faecal inocula. Total yields (g SCFA/100 g substrate) vary considerably,from as low as 10 g SCFA/100 g from fibre preparations such as corn bran, peafibre and oat fibre [171] and from cellulose, to over 60 g SCFA / 100 g for starch.Low yields may equate with incomplete fermentation, as is the case with bran NSP,or may mean other intermediates are being formed.
In all cases, acetate is the major anion comprising 67% overall of totalSCFA. Pectin is a particularly good source of acetate (80% in 8 studies) whilstarabinogalactan (54%; n=3) and guar (59%; n=3) are the poorest sources. Bycontrast, guar and arabinogalactan are good sources of propionate (27 and 34%respectively).
Butyrate production varies over a wide range. Starch almost always giveshigh amounts of butyrate (62:15:23 acetate:propionate:butyrate; n=7) followedclosely by oat and wheat bran (64:16:20; n=5); pectin is the poorest source
45
4-3 IN VITRO STUDIES OF FERMENTATION
Figure 11 — Molar ratios of acetate .., propionate .. and butyrate .. in the hindgut of anumber of non-ruminant species (from BREVES and STUCK [168]).
Mol
ar r
atio
(%)
80
70
60
50
40
30
20
10
0
Turtl
e
Man
atee
Possu
m
Chicke
nRat
Porcu
pine
Eleph
ant
Pig
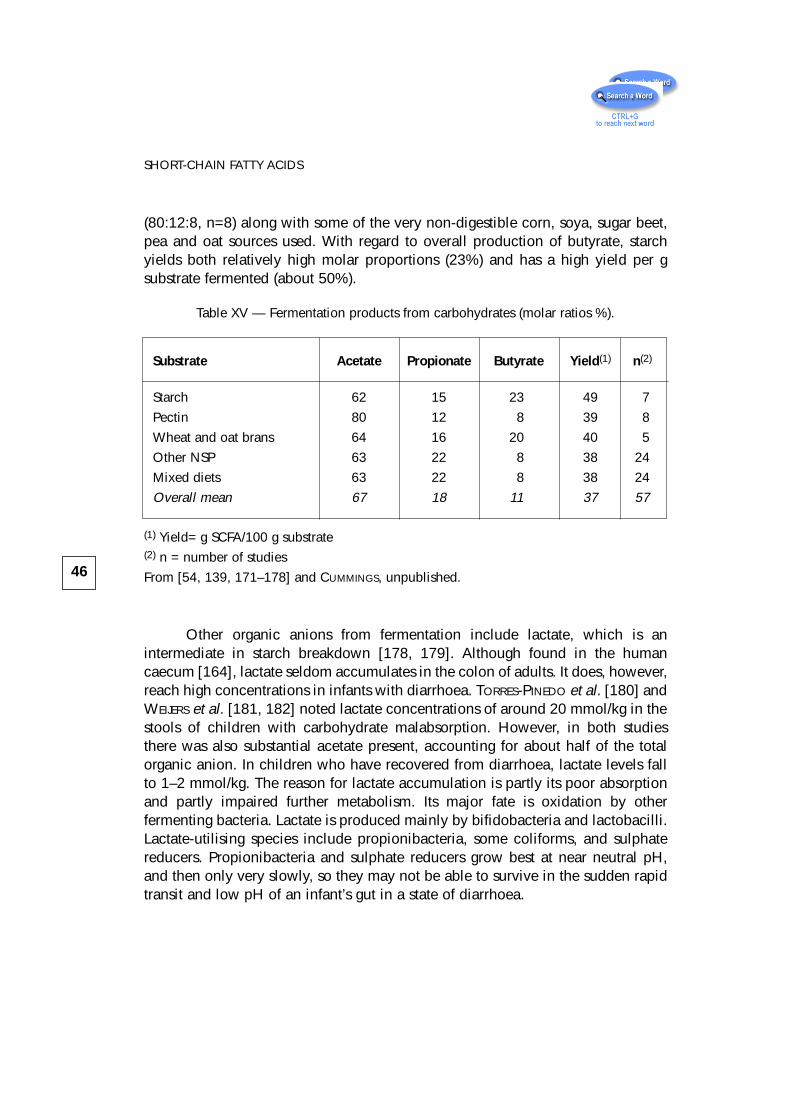
(80:12:8, n=8) along with some of the very non-digestible corn, soya, sugar beet,pea and oat sources used. With regard to overall production of butyrate, starchyields both relatively high molar proportions (23%) and has a high yield per gsubstrate fermented (about 50%).
Other organic anions from fermentation include lactate, which is anintermediate in starch breakdown [178, 179]. Although found in the humancaecum [164], lactate seldom accumulates in the colon of adults. It does, however,reach high concentrations in infants with diarrhoea. TORRES-PINEDO et al. [180] andWEIJERS et al. [181, 182] noted lactate concentrations of around 20 mmol/kg in thestools of children with carbohydrate malabsorption. However, in both studiesthere was also substantial acetate present, accounting for about half of the totalorganic anion. In children who have recovered from diarrhoea, lactate levels fallto 1–2 mmol/kg. The reason for lactate accumulation is partly its poor absorptionand partly impaired further metabolism. Its major fate is oxidation by otherfermenting bacteria. Lactate is produced mainly by bifidobacteria and lactobacilli.Lactate-utilising species include propionibacteria, some coliforms, and sulphatereducers. Propionibacteria and sulphate reducers grow best at near neutral pH,and then only very slowly, so they may not be able to survive in the sudden rapidtransit and low pH of an infant’s gut in a state of diarrhoea.
46
SHORT-CHAIN FATTY ACIDS
Table XV — Fermentation products from carbohydrates (molar ratios %).
Substrate Acetate Propionate Butyrate Yield(1) n(2)
Starch 62 15 23 49 7
Pectin 80 12 8 39 8
Wheat and oat brans 64 16 20 40 5
Other NSP 63 22 8 38 24
Mixed diets 63 22 8 38 24
Overall mean 67 18 11 37 57
(1) Yield= g SCFA/100 g substrate(2) n = number of studies
From [54, 139, 171–178] and CUMMINGS, unpublished.
4-4 Effect of Antibiotics on FaecalSCFA
Some antibiotics impair fermentative activities in the colon and reducefaecal SCFA levels. In the studies of HOVERSTAD et al. [183, 184] in which groupsof six healthy volunteers were given antibiotics by mouth for six days, the effectson faecal SCFA were closely related to the amounts of antibiotic which weredetectable in faeces. Reductions in total SCFA (mmol/kg faeces) were seen withclindamycin (62.9 to 7.3), bacitracin (105.4 to 21.8) and vancomycin (69.3 to19.4). Less striking changes were seen with ampicillin (62.4 to 47.8) anderythromycin (116.9 to 76.0), whilst metronidazole, co-trimoxazole, doxycycline,nalidixic acid and ofloxacin had no effect. High concentrations of clindamycin,bacitracin, erythromycin, vancomycin and nalidixic acid were found in faeces.Molar ratios of butyrate decreased with clindamycin, ampicillin, bacitracin andvancomycin.
Studies in vitro show that clindamycin, erythromycin and dicloxacillinreduce fermentative activity whereas penicillin and pivampicillin have no effect[185–187]. Lactate does not accumulate in vitro indicating a general suppressionof fermentation rather than specific bacteria being affected. However, apronounced increase in succinate concentrations in faeces (4.2 to 40.0) in healthysubjects taking a combination of neomycin, bacitracin, colistin and nystatin [188],together with reduction in SCFA (77.8 to 19.0), was seen in the studies of WILSON
et al. [189] suggesting inhibition of succinate utilising species.
4-5 SCFA and DiarrhoeaDiarrhoea, whether due to antibiotic administration or not [187, 190–192],
leads to reduced SCFA concentrations in faeces although total daily excretion mayincrease in proportion to rises in stool output. Studies which show increased SCFAoutputs in faeces in relation to normal stool weight include the effects of bran[193] bran pentosan [194], a variety of vegetables and cereal foods [94, 95],cellulose and pectin [195] and cellulose, xylan, corn bran or pectin [196].Similarly, in diarrhoea due to mannitol, lactulose or raffinose [190], magnesiumsulphate [192] and intestinal resection [191] increased excretion with increasedstool output is seen, but generally with lower concentrations.
In diarrhoea, the underlying mechanism is failure of the colon to absorbwater, whether because of increased volume and solute load from the small bowel,
47
4-5 SCFA AND DIARRHOEA
failure of solute absorption by a diseased mucosa, or the presence of bacterialtoxins or non-absorbable ions. In any event, fermentation continues until total guttransit time falls to about 18 hours below which SCFA levels decline to very lowlevels [191]. Provided SCFA are being produced, and the mucosal surface isnormal, the amount excreted each day will depend directly on stool weightbecause SCFA are the principal anion in colonic contents. Thus, measurement oftheir output or concentration in faeces in diarrhoea will reflect stool weight, buttheir molar ratios can sometimes give useful information.
4-6 DietAt least 95% of SCFA produced in the colon are absorbed, so it is not
surprising if faecal SCFA measurements prove an insensitive guide to eventsgoing on more proximally in the large bowel. This has proved to be the caseparticularly when studying dietary change. In FLEMING’s review of 42 publishedstudies of the effect of dietary fibre on faecal SCFA’s, the majority of humanstudies show no effect, although in the rat, pig and monkey, some differences areseen [197]. In a recent study of starch malabsorption, induced by theα-glucosidase inhibitor acarbose, an increase in the relative and absoluteamounts of butyrate in faeces was seen [198]. Similarly, faecal butyrateconcentrations increased on feeding resistant starch in the form of Hylon VII tohealthy volunteers [107, 108] although did not in other studies [109]. In in vitrostudies, summarised in table XV, starch seems to be a good source of butyrate.Moreover starch, not NSP, is probably the principal substrate for fermentation inthe hindgut of many human populations, especially those with starchy staples asthe main component of their diet [27, 28] and may be important in theprevention of large bowel cancer [199] (see § 8-4-3).
4-7 MicrofloraThe bacteria present in the colon could theoretically make a contribution to
the amount and type of SCFA present, because each genus has characteristicallydifferent fermentation end products (see table III). This may readily be seen whenbacteria are grown in pure culture [200]. For example, Clostridium perfringensgrown in carbon-limited cultures produces mainly acetate, butyrate, succinate andlactate, whilst Bacteroides ovatus produces much less acetate, a lot of propionateand some succinate. In the conditions of the colon, however, where many species
48
SHORT-CHAIN FATTY ACIDS
co-exist, these individual differences do not show up and a constancy of SCFAproduction is much more evident.
MACFARLANE and GIBSON’s studies using pure cultures have, however, shownclearly that substrate availability makes a significant difference to fermentationend-product generation [200]. When Bifidobacterium breve was grown incarbohydrate-limited conditions, formate and acetate were the principal products,whereas with excess carbohydrate, lactate and acetate predominated. Lactatefrequently appears where there is rapid fermentation of carbohydrate, and acts asan electron sink to dispose of excess reducing power, when substrate is plentiful.Similarly, with Bacteroides ovatus, acetate, succinate and propionate are the mainproducts under carbohydrate-limited conditions whereas acetate and succinatepredominate with excess carbohydrate. These reactions are influenced byintracellular CO2. When sufficient CO2 is available, as with carbohydrate-excess,there is a reduced requirement to decarboxylate succinate and therefore this acidis produced in preference to propionate [200].
4-8 Transit TimeTime is another factor which affects microbial activity in the colon. In both
ruminant and human studies [201–203] bacterial growth and metabolism is muchmore efficient at fast turnover times, giving increased biomass yields from givenamounts of substrate. This is because the maintenance energy requirements ofbacteria, used for motility, active transport, and control of intracellular soluteconcentrations, are less at high dilution rates. In vivo studies in man [203] showthat speeding up transit through the gut from 64 to 35 h increases biomassexcretion and reduces cellulose digestibility.
Time is also reflected in patterns of SCFA production. In studies of purecultures of Clostridium perfringens grown at different dilution rates, SCFAproduction varies. At low dilution rates butyrate was between 12 and 17% of totalorganic anion, depending on carbon availability, whereas at faster rates it fell to3–8%, with lactate production increasing significantly [200]. In an in vitromultichamber fermentation system inoculated with mixed faecal bacteria, longretention times reduced bacterial viability, lactate and succinate production andincreased acetate and propionate, especially in the first vessel of the system, whichwas equivalent to the right colon [204]. Long retention times also increasedprotein degradation when studied in a multichamber system [205], giving rise toincreased concentrations of phenols and ammonia.
In the only published study in man relating transit time to faecal SCFA’s[206], mean transit time (MTT) was significantly related to the proportion of
49
4-8 TRANSIT TIME
butyrate in faeces (r -0.485, p < .002). The absolute concentration of butyrate wasalso significantly associated with MTT (r -0.356, p < .03). No association wasfound between MTT and either concentration or molar ratios of acetate andpropionate in this study. Thus rapid transit, in the order of 30–40 hours, isassociated with a significantly higher faecal butyrate concentration and molar ratiothan slow transit of 60–80 hours.
Other changes in bacterial metabolism in the colon have been associatedwith transit time. DAVIGNON et al. showed [207], in subjects on controlled diets,that there was an inverse relationship between turnover time (equivalent to MTT)and formation of the neutral-steroid conversion products coprostanol andcoprostanone. An inverse relationship was also seen between turnover anddegradative losses of ß-sitosterol.
In support of MACFARLANE et al.’s in vitro findings [205], longer transit timesare also associated with increasing faecal ammonia concentrations and urinephenol outputs [208, 209]. Both dietary protein intake and transit time affecturinary phenol excretion, together accounting for 64% of the variation in excretion[209]. Many years ago, MACY [210] reported a similar relationship between transitand urinary sulphate excretion in children. Both the sulphate of MACY and urinaryphenols are bacterial metabolites of dietary protein breakdown.
4-9 SCFA Production RatesThe importance to man of SCFA lies not only in the relative amounts of each
acid produced but, more importantly, in the overall amount. Determining this is,however, much more difficult than simply measuring SCFA levels in gut contents.In ruminant animals, simultaneous catheterisation of the portal vein and an artery,together with isotope infusions, allows estimates of production to be made [211,212]. Such studies are not really possible in man because of difficulty accessingthe portal vein, and even for the ruminant physiologist they pose difficulties ininterpretation because each fatty acid is metabolised by different tissues in thebody, e.g. acetate in liver and muscle, propionate in the liver, and butyrate by therumen epithelium (in general). The picture is further complicated by endogenousacetate production by the liver. In man, a number of approaches are possible,including direct measurement of arterio-venous (A/V) differences in SCFAconcentrations across the gut at surgery or autopsy, in vitro fermentation models,estimation of substrate availability and breakdown, biomass production in thecolon and stable isotope infusions.
50
SHORT-CHAIN FATTY ACIDS
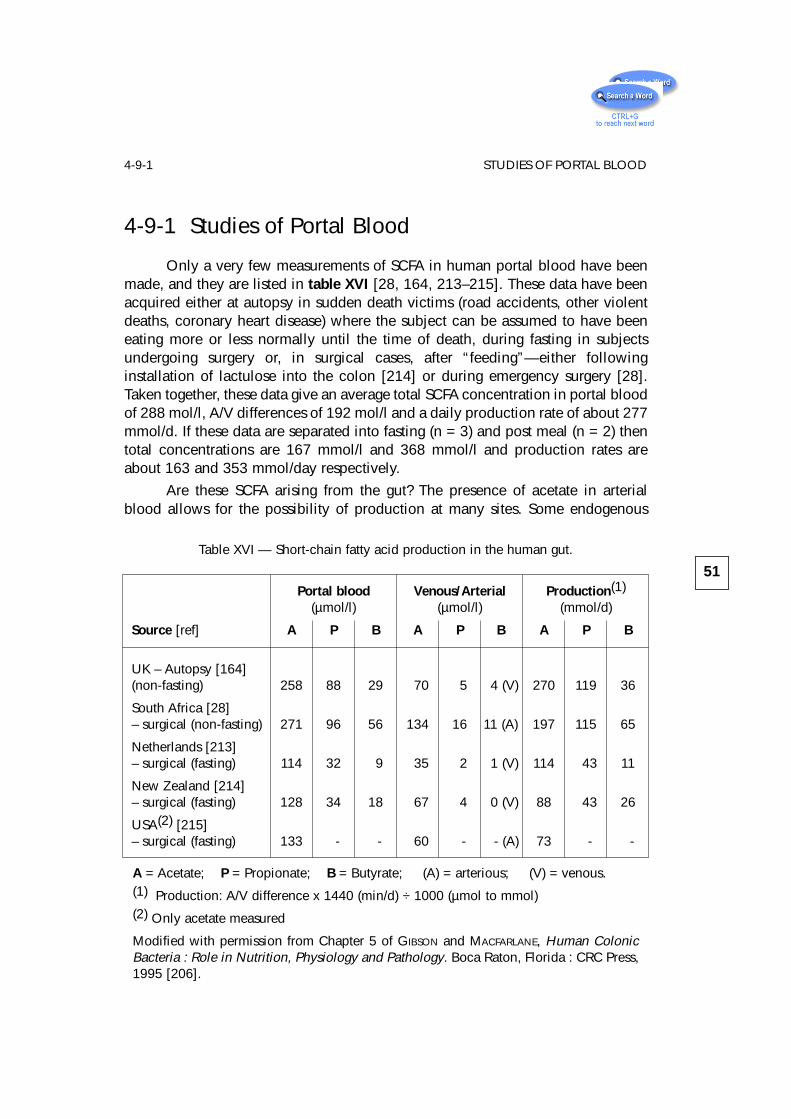
4-9-1 Studies of Portal Blood
Only a very few measurements of SCFA in human portal blood have beenmade, and they are listed in table XVI [28, 164, 213–215]. These data have beenacquired either at autopsy in sudden death victims (road accidents, other violentdeaths, coronary heart disease) where the subject can be assumed to have beeneating more or less normally until the time of death, during fasting in subjectsundergoing surgery or, in surgical cases, after “feeding”—either followinginstallation of lactulose into the colon [214] or during emergency surgery [28].Taken together, these data give an average total SCFA concentration in portal bloodof 288 mol/l, A/V differences of 192 mol/l and a daily production rate of about 277mmol/d. If these data are separated into fasting (n = 3) and post meal (n = 2) thentotal concentrations are 167 mmol/l and 368 mmol/l and production rates areabout 163 and 353 mmol/day respectively.
Are these SCFA arising from the gut? The presence of acetate in arterialblood allows for the possibility of production at many sites. Some endogenous
51
4-9-1 STUDIES OF PORTAL BLOOD
Table XVI — Short-chain fatty acid production in the human gut.
Portal blood Venous/Arterial Production(1)
(µmol/l) (µmol/l) (mmol/d)
Source [ref] A P B A P B A P B
UK – Autopsy [164](non-fasting) 258 88 29 70 5 4 (V) 270 119 36
South Africa [28]– surgical (non-fasting) 271 96 56 134 16 11 (A) 197 115 65
Netherlands [213]– surgical (fasting) 114 32 9 35 2 1 (V) 114 43 11
New Zealand [214]– surgical (fasting) 128 34 18 67 4 0 (V) 88 43 26
USA(2) [215]– surgical (fasting) 133 - - 60 - - (A) 73 - -
A = Acetate; P = Propionate; B = Butyrate; (A) = arterious; (V) = venous.(1) Production: A/V difference x 1440 (min/d) ÷ 1000 (µmol to mmol)(2) Only acetate measured
Modified with permission from Chapter 5 of GIBSON and MACFARLANE, Human ColonicBacteria : Role in Nutrition, Physiology and Pathology. Boca Raton, Florida : CRC Press,1995 [206].
(non-colonic) production does occur because subjects who have had their largeintestine removed (ileostomists) have 21 µmol/l [216] acetate in peripheral blood.Moreover, during prolonged fasting (108 h) venous blood SCFA rise from 43.9 ±4.4 (SEM) after 12 h fast to 104.6 ± 13.2 µmol/l after 60 h fast and 114 ± 15.6 after108 h fast in healthy subjects [216]. SKUTCHES et al. [215] have also observed netsynthesis in liver and muscle, when arterial blood levels fall below 80 µmol/l inman. Nevertheless, in the fed state the gut is likely to be the major source of SCFA.
In calculating production rates from A/V differences a number ofassumptions are made. Firstly, portal blood flow over the 24 h period is estimatedas 1 l/min. In practice, portal blood flow varies from less than 1 l/min during fastingto about 1.5 l/min post-prandially, but 1 l/min is a useful rule of thumb on average[217–219]. Blood SCFA levels also change between the fasting and fed state, butthis variation is likely to be small since fermentation in the large intestine is a slowprocess and broad peak levels of SCFA are reached 8–12 hours after a meal inperipheral blood [220, 221]. Another factor to be taken into account is thepartition of SCFA between red blood cells and plasma. The concentration ofacetate in red cells is only 40–80% that in plasma [222, 223] and in whole bloodis 80-85% of that in plasma. Of the values given in table XVI, all are measured inplasma except for reference [215] so a correction to production rates of 15-20%may be in order. However, portal blood SCFA measurements take no account ofmetabolism in the colonic epithelium. Almost certainly, 70–80% of butyrate ismetabolised in the colonic epithelium, with some propionate and even a littleacetate. Thus, A/V differences may underestimate total production by more thanenough to compensate for partitioning between red cells and plasma.
4-9-2 Stoichiometry
Calculations from A/V differences give production rates of 300–400 mmol/day. How much substrate would be required to produce this amount of SCFA?
A number of attempts to draw up equations for SCFA production have beenmade [224–229] based both on rumen and human studies. Given thatcarbohydrate is the major substrate and SCFA, CO2 and H2 the principal products,the most valuable information needed to write an equation is the overall ratio inwhich SCFA are produced. Taking all available evidence into account, and theprobable metabolism of SCFA by the epithelium, a molar ratio of around 60:20:18acetate:propionate:butyrate can be justifiably used and gives the followingstoichiometry:
59 C6H12O6 + 38 H20 —> 60 CH3COOH + 22 CH3CH2COOH +
+ 18 CH3(CH2)2 COOH + 96 CO2 + 268 H+
(Equation 1).
52
SHORT-CHAIN FATTY ACIDS
This avoids making assumptions about routes of H+ disposal [230] but takes noteof the fact that different substrates may produce very different relative amounts ofthe three SCFA when incubated alone (Table XV). The above stoichiometry gives ayield of SCFA from carbohydrate of 63 g SCFA/100 g. This is close to the figure of61g SCFA/100 g carbohydrate fermented which LIVESEY and ELIA [224] suggest fitsbest with experimental data used to calculate the energy value of fermentablecarbohydrate in mixed diets fed to humans and also with ruminant studies [201,202, 226]. However, if the data in table XV are examined it will be apparent thatyields of around 60 g SCFA/100 g carbohydrate fermented are seen only withstarch fermentation. Cell wall polysaccharides such as arabinogalactans andpectins give yields of 35–54 g SCFA/100 g. Therefore, a theoretical yield of 63 gSCFA/100 g from the equation is either an upper limit, or starch has to be the majorsubstrate for fermentation.
Equation 1 therefore requires 32–42 g of carbohydrate to be fermented inthe human colon each day to produce 300–400 mmol SCFA. Estimates of substrateavailability show that at least this amount is available for fermentation.
4-9-3 Stable Isotope Studies
Undoubtedly one of the best ways of measuring SCFA production rates inman is to use stable isotope technology. The first published attempts to do thiswere by WALTER et al. [231] investigating the sources of propionate in children withmethylmalonicaciduria. Propionate production was measured by a continuousintravenous infusion of 13C propionate, with breath and blood sampling for 13Cmeasurement. Total propionate production was 55–186 mmol/kg/h in the childrenand 17 mmol/kg/h in five healthy adults. Only 5–40% of the propionate producedin the children could be ascribed to protein catabolism, leaving a large role forcolonic fermentation. Using the data of WALTER et al. for the children and thestoichiometry of equation 1, total SCFA production in a 70 kg man would be of theorder of 380–760 mmol/d. These calculations are not possible for the healthycontrols because of propionate uptake by the healthy liver.
BREVES and colleagues [232] and FREEMAN et al. [233] applied stable isotopetechnology to studies of pigs and showed that 7– 40% of maintenance energyrequirements come from hindgut fermentation and that the gut itself, including theliver, may utilise a substantial portion of acetate production.
In premature infants, KIEN et al. [234] used 13C acetate intragastric infusions,together with blood and breath sampling, to show that 24–74% of ingested lactosewas fermented to acetic acid. This allows the conclusion that premature babies,who are known to digest lactose poorly, may salvage substantial energy fromunabsorbed carbohydrate through fermentation.
53
4-9-3 STABLE ISOTOPE STUDIES
Overall therefore, SCFA production in man has been estimated only ap-proximately at present from static A/V difference studies across the gut or indirectlyusing knowledge of substrate availability, and stoichiometry derived from in vitro,animal and human colon fermentation studies. Net yields vary greatly depending onthe type of substrate, its rate of fermentation and transit time through the colon.Stable isotope technology offers a more promising approach to this problem.
On the whole, these lines of evidence all point to a daily production inadults on Western diets of 300–400 mmol derived from fermentation of 30–40 gcarbohydrate and 12 g protein. These production rates are for the Western colonand are low, contributing much less to energy needs than those observed in the pigand, particularly, in ruminant species. The amounts and types of SCFA producedin the human colon can, however, readily be increased by changing the pattern ofthe diet, with the introduction of more cereal based starchy foods, fruit, vegetablesor other sources of resistant starch, NSP and non-digestible oligosaccharides suchas inulin and other fructans. This type of diet is found in many Third Worldpopulations where SCFA production may be much greater.
4-9-4 Amino Acids as Substrates
Amino acid fermentation also gives rise to SCFA and may therefore be anadditional source in man [235]. Amino acid fermentation yields not only SCFA butthe branched-chain fatty acids isobutyrate, isovalerate and 2-methylbutyrate,which arise, respectively, from valine, leucine and isoleucine. Table XIV shows theconcentration of these branched-chain fatty acids found in the human caecum.(isovalerate and 2-methylbutyrate are combined in that table because they runtogether in the chromatography system used). Although the amounts are muchlower than the three major SCFA, the presence of branched-chain fatty acidsindicates that amino acid fermentation is taking place. A fraction of total SCFAmust therefore come from protein breakdown. MACFARLANE et al. [235] haveshown, using batch culture studies of human faecal inocula, that SCFA are theprincipal end products formed during the degradation of protein by human colonicbacteria. Approximately 30% of protein is converted to SCFA. Branched-chainfatty acids constitute 16% of SCFA produced from bovine serum albumin and 21%of SCFA generated when casein is the substrate. Branched-chain fatty acidconcentrations in gut contents taken from the human proximal and distal colonswere, on average, 4.6 and 6.3 mmol/kg respectively, corresponding to 3.4% and7.5% of total SCFA. These results suggest that protein fermentation couldpotentially account for about 17% of the SCFA found in the caecum, and 38% ofthe SCFA produced in the sigmoid/rectum. Measurements of branched-chain fattyacids in portal and arterial blood taken from individuals undergoing emergencysurgery indicated that net production of branched-chain fatty acids by the gut was
54
SHORT-CHAIN FATTY ACIDS
in the region of 11 mmol/d, which would require the fermentation of about 12 gof protein. These data show that protein is a significant source of SCFA, and, withthe known amounts of carbohydrate entering the colon, we have enough substrateavailable to account for 300–400 mmol SCFA production each day.
4-10 AbsorptionSCFA are rapidly taken up from the human colon [236, 237] and absorption
rates in the rectum, descending and transverse colon are comparable to thoseobserved in other mammals. The first demonstration of SCFA absorption in manwas from an isolated human large bowel in 1964 by DAWSON et al. [238]. Earlymechanistic studies [236, 237, 239] showed absorption of all three SCFA whichwas largely unaffected by pH, with associated bicarbonate appearance in thelumen, consistent with part non-ionic diffusion and part transport of the anion.
4-10-1 General Mechanisms
SCFA absorption has been extensively studied in the rumen. They arerapidly absorbed, stimulate sodium absorption and are associated withbicarbonate exchange. pH has little effect but absorption rates are concentrationdependent and show little variation due to chain length [240]. Magnesiumabsorption may also be stimulated [241].
In man, as in the ruminant, a large concentration gradient for short-chainfatty acids exists between the colonic lumen and blood, at around 100 mmol/l,thereby favouring their movement into blood. At the pH of caecal contents (around5.5) [164] SCFA are largely present as anions. A transepithelial potential differenceexists, with the lumen positive, also favouring absorption of the anion.
Interpretation of experimental studies is complicated by the variety ofmethods used to investigate absorption. Techniques include short circuit currentexperiments with isolated epithelia, apical and basolateral membrane vesicles andwhole organ perfusion. This, coupled to the clear regional and possibleinterspecies differences which occur, as well as the differential metabolism ofSCFA by colonic epithelial cells, makes it difficult to find a consistent pattern.
Some generalisations may, however, be made. SCFA are absorbed from thehuman gut and concentration dependence can be shown [237]. pH has little effect[236]. One major route for absorption is likely to be by passive diffusion of theprotonated acid [242]. VON ENGELHARDT’s studies [243] suggested that in the guineapig, SCFA anions may permeate by a paracellular pathway. However, subsequent
55
4-10-1 GENERAL MECHANISM
studies in both horse and guinea pig using voltage clamping have shown that thismakes no difference to unidirectional fluxes, and largely rules out paracellulartransport and any associated bulk water flow. For non-ionic diffusion to occur,SCFA anions have to be protonated. H+ is probably made available via a Na+ – H+
exchange in the proximal colon and K+ – H+ ATPase in the distal colon. VON
ENGELHARDT, in studies on the guinea pig colon, has suggested that about 35% ofSCFA are absorbed in the undissociated form in the caecum, 30–50% in theproximal colon, and 60–80% in the distal colon.
4-10-2 Bicarbonate
A relationship between SCFA and bicarbonate secretion has often beenobserved [236, 237, 244–249]. The consistent appearance in the lumen ofbicarbonate during SCFA absorption is independent of chloride-bicarbonateexchange because it occurs in the absence of luminal chloride and is independentof chloride absorption. The amount of bicarbonate that accumulates is equivalentto about half of the acetate that is absorbed. Bicarbonate appearance in the lumenis probably the result of a SCFA-bicarbonate exchange at the cell surface.
Since SCFA transport is non-electrogenic, they must be absorbed either byanion exchange or co-transport with a cation. However, the associated changes inluminal pCO2 and pH do not accord with a simple anion exchange. Carbondioxide and bicarbonate in body fluids are related through the equation:
Any increase in luminal bicarbonate due to secretion from the mucosa will pushthe reaction to the left resulting in a rise in pH and pCO2. In experimental studiesin the pig [245], rumen [250] and man [237], pH rises but pCO2 falls duringacetate absorption. The explanation that has been advanced for this is that luminalor juxtamucosal hydration of CO2 occurs and that hydrogen ion is used toprotonate SCFA anion prior to crossing the mucosa as undissociated acid. Thus,absorption of the acid leads to bicarbonate accumulation, a rise in pH and a fallin pCO2. The colonic epithelium, in contrast to the small bowel, is rich in carbonicanhydrase [251, 252] and its inhibition reduces SCFA transport [253].Consequently, bicarbonate secretion by the colonic mucosa, either from thecytosol or a juxtamucosal carbonic anhydrase, is important in SCFA absorptionand provides the principal intraluminal buffer for fermentation.
56
SHORT-CHAIN FATTY ACIDS
H2O + CO2 ⇔ H2CO3 ⇔ H+ + HCO3-
(Equation 2).
Carbonicanhydrase
pKa6.4
4-10-3 Sodium
Stimulation of sodium absorption is seen in many studies of SCFA transport[237, 246, 254-257]. The stimulatory effect of fatty acids on sodium absorption isconsiderable. In ROEDIGER and MOORE’s study [237, 246, 254-257] on the isolatedperfused human colon, net sodium absorption (nmol/min/cm2 ± SEM) increasedfrom 320 ± 10 in the control perfusion to 1960 ± 480, with the addition of20 mmol/l butyrate to the perfusate. In the rat colon, it is notable that neithersuccinate nor lactate, which are poorly absorbed anions, stimulate sodiumabsorption whereas acetate [247, 258] and nitrate [259] do.
VON ENGELHARDT [243] believes that interaction of SCFA with Na+
absorption indicates that electroneutral transport of Na+ stimulates SCFAabsorption but not the reverse. Therefore, SCFA absorption itself affects Na+
transport very little. SCFA and sodium appear to be coupled in some way and thusprovide a powerful mechanism for the movement of sodium and water out of thecolonic lumen. In this context, SCFA must be seen as antidiarrhoeal, and failure intheir production leads to disturbances of salt and water absorption which are mostnotable in the germ-free animal.
Thus, SCFA absorption probably involves a number of mechanismsincluding both non-ionic, ionic and ion exchange processes. There are secondaryeffects on electrolyte transport and, perhaps most importantly for fermentation, onwater movement out of the colon, and on pH through HCO3
- and H+ transport atthe epithelial surface.
4-11 Cell Metabolism and GrowthProbably the single most important interaction between bacteria in the large
intestine and their host lies in the metabolic effects of SCFA in the colonicepithelial cell. All three major SCFA are metabolised to some extent by theepithelium to provide energy, but butyrate is especially important as a fuel forthese cells and may also play a critical role in moderating cell growth anddifferentiation.
4-11-1 Energy Metabolism
The colonic epithelium derives 60–70% of its energy from bacterialfermentation products [260, 261]. Using the isolated rat colonocyte ROEDIGER
[262], subsequently confirmed by others [263–266], showed that SCFA, and
57
4-11-1 ENERGY METABOLISM
particularly butyrate, are metabolised and suppress glucose oxidation. Studies ofCO2 production using mixtures of SCFA indicate that cellular activation is in theorder butyrate>propionate>acetate. SCFA are metabolised to CO2 and ketonebodies and are precursors for mucosal lipid synthesis [267]. In the intact rat, about12% of butyrate is transformed to ketone bodies [268] in the wall of the caecum.No ketogenesis was seen in the colon, a finding similar to that observed in therabbit and guinea pig [264, 269, 270]. In the rabbit, studies of 14C-SCFAmetabolism have shown label being transferred to amino acids, carboxylic acidsand sugars in the caecal wall [263, 264]. The human colonocyte also metabolisesglucose and glutamine [261].
However, more than 70% of oxygen consumption in isolated colonocytes isdue to butyrate oxidation, although there are regional differences. Carbon dioxideproduction from butyrate is similar in both proximal and distal colon in man, butketone body appearance is less in the distal gut. This implies that more butyrateenters the TCA cycle in the distal colon and is more important in this region.Conversely, glutamine metabolism is greater proximally, as is glucose oxidation.Thus, the proximal colon more resembles the small bowel, while the distal colonrelies on butyrate as a primary energy source. ROEDIGER [271] has suggested thatthe health of colonic epithelial cells is largely dependent on the availability andefficient metabolism of butyrate (see § 4-12-1).
Uptake and utilisation of butyrate by the colonic epithelium in vivo can bedemonstrated from study of levels of SCFA in portal and arterial blood and incolonic contents. Table XIV shows the amounts and molar ratios of SCFA inmaterial taken from sudden death victims [164] and at emergency surgery intrauma patients [28]. In the autopsy study, the molar proportion of butyrate fallsfrom 21% within the colonic lumen to 8% in portal blood, indicating substantialbutyrate clearance by the mucosa (assuming no production of acetate andpropionate by the mucosa). Table XV shows that in vitro about 11% of total SCFAproduced is butyrate, and in vivo (Table XIV) 11–25% of SCFA found in the colonis butyrate. The fall to 8% in portal blood indicates a clearance of 65% of thebutyrate by the mucosa. If either acetate or propionate are also metabolised by themucosa then 65% is a minimum estimate of clearance. However, the surgical datafrom Africa in table XVI show that portal blood butyrate molar ratio is 13%, whilstin colostomy contents of the patients from the same population in the samehospital, butyrate is 15% of total SCFA. This means that either the mucosa of thispopulation is selectively metabolising acetate and propionate—an unlikely event,producing butyrate—which is equally unlikely, or that all three acids are beingtaken up. These data all point to substantial butyrate, and probably somepropionate and acetate, utilisation by the mucosa in man.
58
SHORT-CHAIN FATTY ACIDS
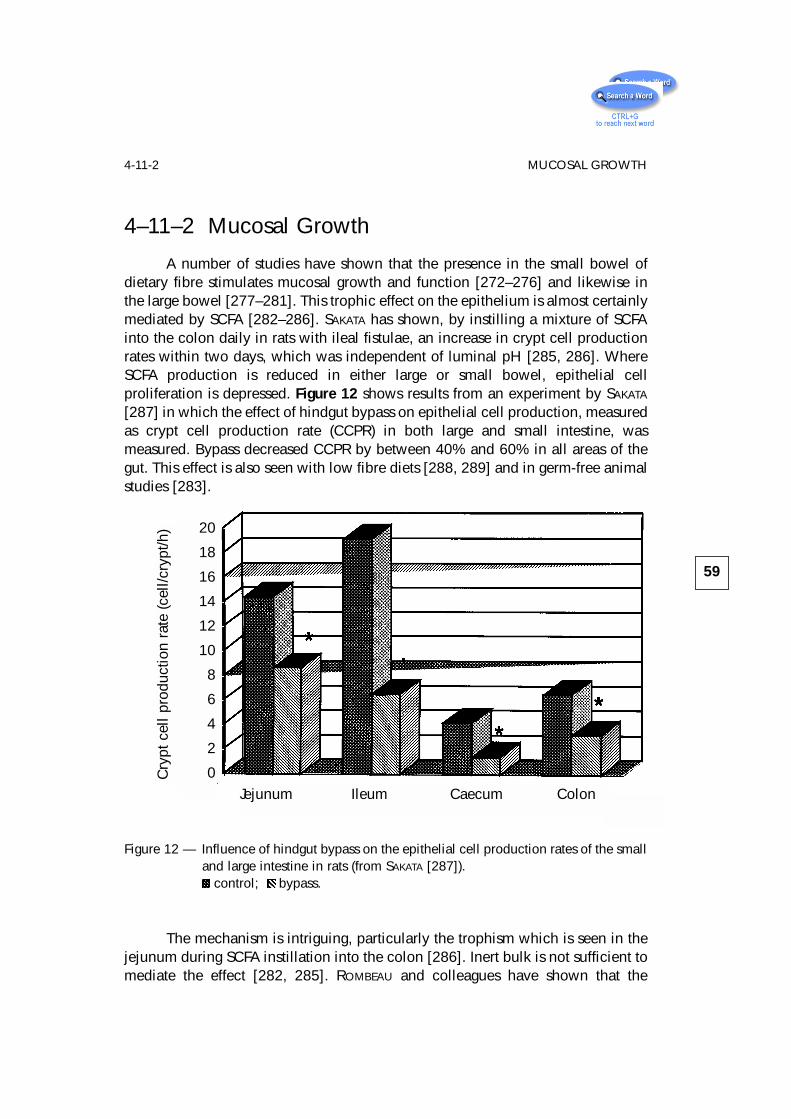
4–11–2 Mucosal Growth
A number of studies have shown that the presence in the small bowel ofdietary fibre stimulates mucosal growth and function [272–276] and likewise inthe large bowel [277–281]. This trophic effect on the epithelium is almost certainlymediated by SCFA [282–286]. SAKATA has shown, by instilling a mixture of SCFAinto the colon daily in rats with ileal fistulae, an increase in crypt cell productionrates within two days, which was independent of luminal pH [285, 286]. WhereSCFA production is reduced in either large or small bowel, epithelial cellproliferation is depressed. Figure 12 shows results from an experiment by SAKATA
[287] in which the effect of hindgut bypass on epithelial cell production, measuredas crypt cell production rate (CCPR) in both large and small intestine, wasmeasured. Bypass decreased CCPR by between 40% and 60% in all areas of thegut. This effect is also seen with low fibre diets [288, 289] and in germ-free animalstudies [283].
Figure 12 — Influence of hindgut bypass on the epithelial cell production rates of the smalland large intestine in rats (from SAKATA [287]).
control; bypass.
The mechanism is intriguing, particularly the trophism which is seen in thejejunum during SCFA instillation into the colon [286]. Inert bulk is not sufficient tomediate the effect [282, 285]. ROMBEAU and colleagues have shown that the
59
4-11-2 MUCOSAL GROWTHC
rypt
cel
l pro
duct
ion
rate
(cel
l/cry
pt/h
)
Jejunum Ileum Caecum Colon
20
18
16
14
12
10
8
6
4
2
0
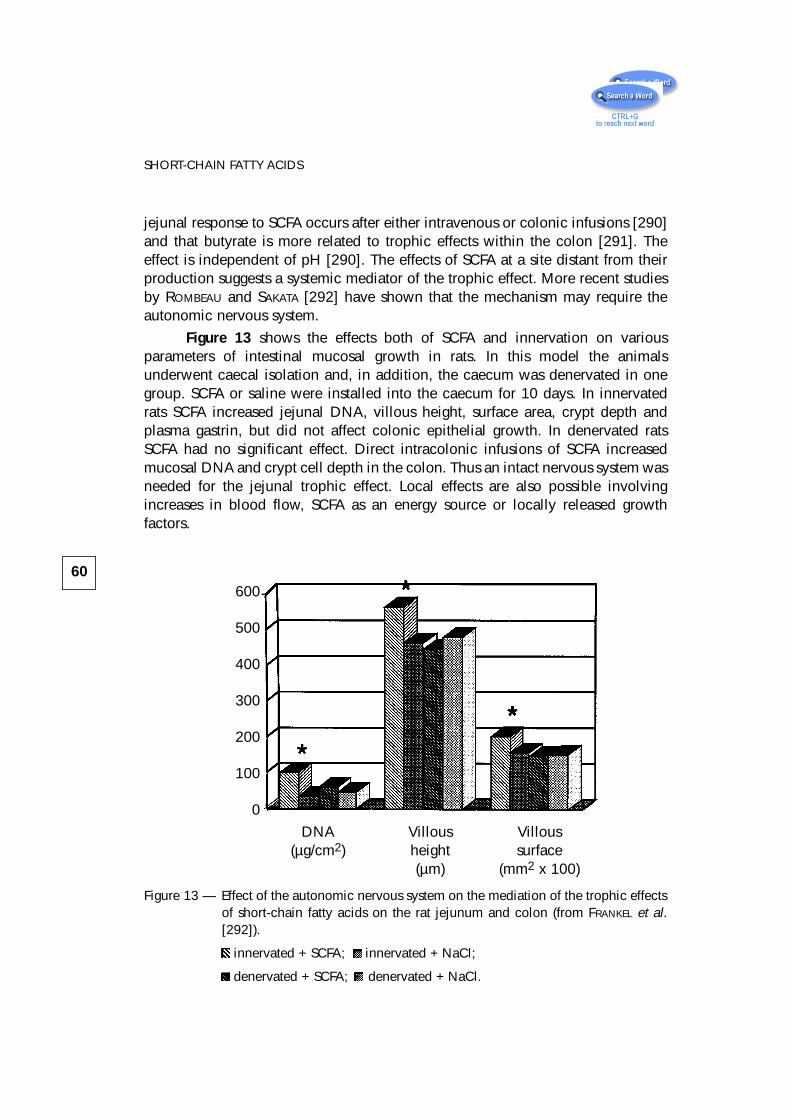
jejunal response to SCFA occurs after either intravenous or colonic infusions [290]and that butyrate is more related to trophic effects within the colon [291]. Theeffect is independent of pH [290]. The effects of SCFA at a site distant from theirproduction suggests a systemic mediator of the trophic effect. More recent studiesby ROMBEAU and SAKATA [292] have shown that the mechanism may require theautonomic nervous system.
Figure 13 shows the effects both of SCFA and innervation on variousparameters of intestinal mucosal growth in rats. In this model the animalsunderwent caecal isolation and, in addition, the caecum was denervated in onegroup. SCFA or saline were installed into the caecum for 10 days. In innervatedrats SCFA increased jejunal DNA, villous height, surface area, crypt depth andplasma gastrin, but did not affect colonic epithelial growth. In denervated ratsSCFA had no significant effect. Direct intracolonic infusions of SCFA increasedmucosal DNA and crypt cell depth in the colon. Thus an intact nervous system wasneeded for the jejunal trophic effect. Local effects are also possible involvingincreases in blood flow, SCFA as an energy source or locally released growthfactors.
Figure 13 — Effect of the autonomic nervous system on the mediation of the trophic effectsof short-chain fatty acids on the rat jejunum and colon (from FRANKEL et al.[292]).
innervated + SCFA; innervated + NaCl;
denervated + SCFA; denervated + NaCl.
60
SHORT-CHAIN FATTY ACIDS
600
500
400
300
200
100
0
DNA(µg/cm2)
Villousheight(µm)
Villoussurface
(mm2 x 100)
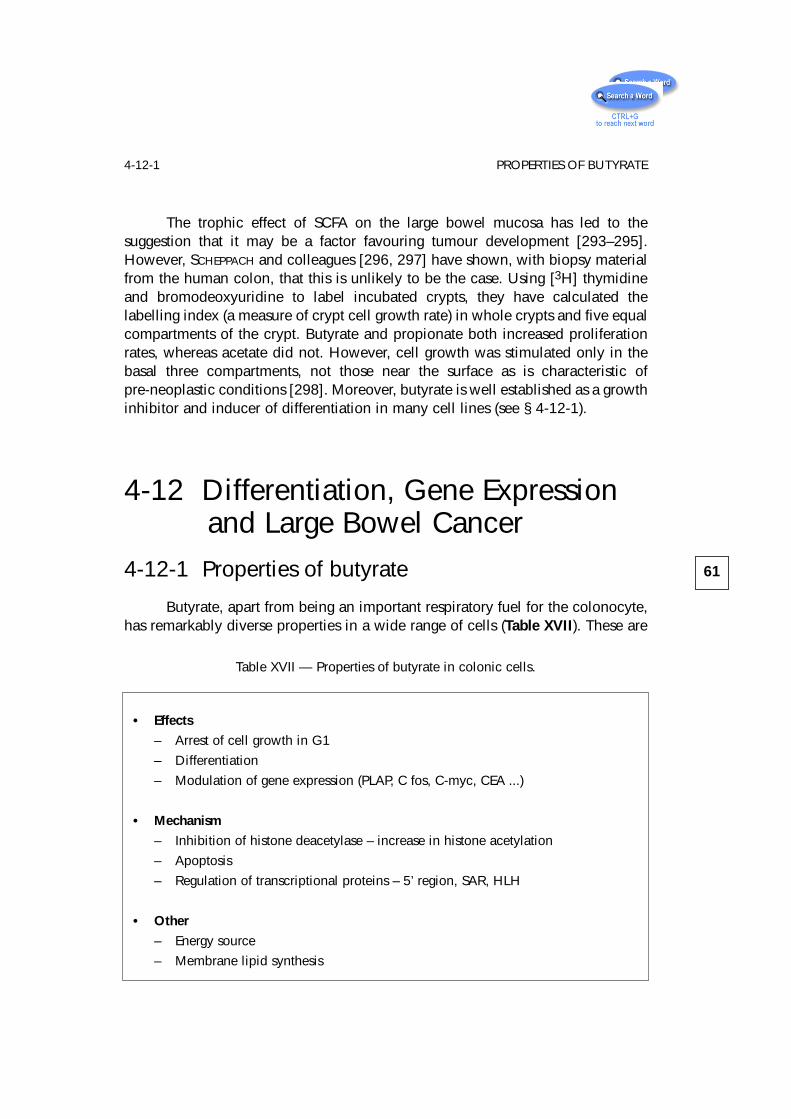
The trophic effect of SCFA on the large bowel mucosa has led to thesuggestion that it may be a factor favouring tumour development [293–295].However, SCHEPPACH and colleagues [296, 297] have shown, with biopsy materialfrom the human colon, that this is unlikely to be the case. Using [3H] thymidineand bromodeoxyuridine to label incubated crypts, they have calculated thelabelling index (a measure of crypt cell growth rate) in whole crypts and five equalcompartments of the crypt. Butyrate and propionate both increased proliferationrates, whereas acetate did not. However, cell growth was stimulated only in thebasal three compartments, not those near the surface as is characteristic ofpre-neoplastic conditions [298]. Moreover, butyrate is well established as a growthinhibitor and inducer of differentiation in many cell lines (see § 4-12-1).
4-12 Differentiation, Gene Expressionand Large Bowel Cancer
4-12-1 Properties of butyrate
Butyrate, apart from being an important respiratory fuel for the colonocyte,has remarkably diverse properties in a wide range of cells (Table XVII). These are
61
4-12-1 PROPERTIES OF BUTYRATE
Table XVII — Properties of butyrate in colonic cells.
• Effects
– Arrest of cell growth in G1
– Differentiation
– Modulation of gene expression (PLAP, C fos, C-myc, CEA ...)
• Mechanism
– Inhibition of histone deacetylase – increase in histone acetylation
– Apoptosis
– Regulation of transcriptional proteins – 5’ region, SAR, HLH
• Other
– Energy source
– Membrane lipid synthesis
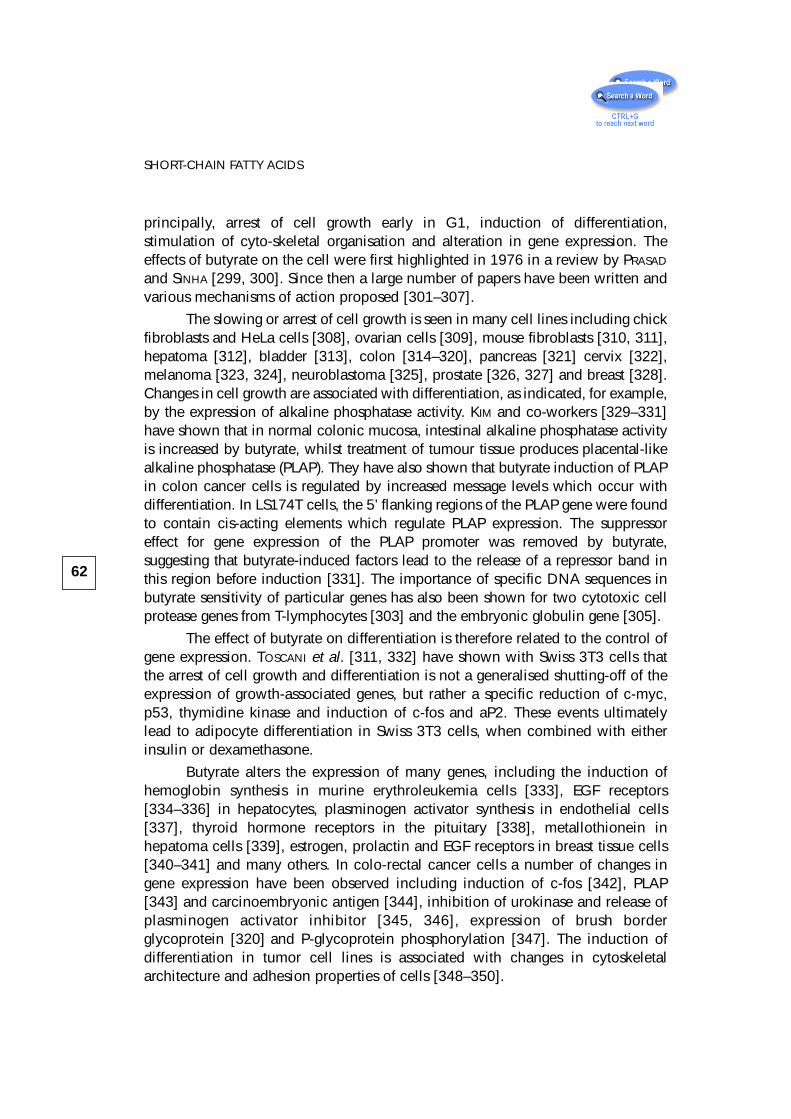
principally, arrest of cell growth early in G1, induction of differentiation,stimulation of cyto-skeletal organisation and alteration in gene expression. Theeffects of butyrate on the cell were first highlighted in 1976 in a review by PRASAD
and SINHA [299, 300]. Since then a large number of papers have been written andvarious mechanisms of action proposed [301–307].
The slowing or arrest of cell growth is seen in many cell lines including chickfibroblasts and HeLa cells [308], ovarian cells [309], mouse fibroblasts [310, 311],hepatoma [312], bladder [313], colon [314–320], pancreas [321] cervix [322],melanoma [323, 324], neuroblastoma [325], prostate [326, 327] and breast [328].Changes in cell growth are associated with differentiation, as indicated, for example,by the expression of alkaline phosphatase activity. KIM and co-workers [329–331]have shown that in normal colonic mucosa, intestinal alkaline phosphatase activityis increased by butyrate, whilst treatment of tumour tissue produces placental-likealkaline phosphatase (PLAP). They have also shown that butyrate induction of PLAPin colon cancer cells is regulated by increased message levels which occur withdifferentiation. In LS174T cells, the 5’ flanking regions of the PLAP gene were foundto contain cis-acting elements which regulate PLAP expression. The suppressoreffect for gene expression of the PLAP promoter was removed by butyrate,suggesting that butyrate-induced factors lead to the release of a repressor band inthis region before induction [331]. The importance of specific DNA sequences inbutyrate sensitivity of particular genes has also been shown for two cytotoxic cellprotease genes from T-lymphocytes [303] and the embryonic globulin gene [305].
The effect of butyrate on differentiation is therefore related to the control ofgene expression. TOSCANI et al. [311, 332] have shown with Swiss 3T3 cells thatthe arrest of cell growth and differentiation is not a generalised shutting-off of theexpression of growth-associated genes, but rather a specific reduction of c-myc,p53, thymidine kinase and induction of c-fos and aP2. These events ultimatelylead to adipocyte differentiation in Swiss 3T3 cells, when combined with eitherinsulin or dexamethasone.
Butyrate alters the expression of many genes, including the induction ofhemoglobin synthesis in murine erythroleukemia cells [333], EGF receptors[334–336] in hepatocytes, plasminogen activator synthesis in endothelial cells[337], thyroid hormone receptors in the pituitary [338], metallothionein inhepatoma cells [339], estrogen, prolactin and EGF receptors in breast tissue cells[340–341] and many others. In colo-rectal cancer cells a number of changes ingene expression have been observed including induction of c-fos [342], PLAP[343] and carcinoembryonic antigen [344], inhibition of urokinase and release ofplasminogen activator inhibitor [345, 346], expression of brush borderglycoprotein [320] and P-glycoprotein phosphorylation [347]. The induction ofdifferentiation in tumor cell lines is associated with changes in cytoskeletalarchitecture and adhesion properties of cells [348–350].
62
SHORT-CHAIN FATTY ACIDS
4-12-2 Cellular Mechanisms
KRUH suggested a number of cellular mechanisms for the action of butyrate[302, 351]. The best known is the effect on histone acetylation which has beenshown in many cell types. SMITH [304] has demonstrated that by inhibiting histonedeacetylase, butyrate allows hyperacetylation of histones to occur. In turn, this“opens up” DNA structure, facilitating access of DNA repair enzymes. He hasgrown human adenocarcinoma cells (HT29) at a range of butyrate concentrationsup to 10 mmol/l and shown inhibition of cellular proliferation, which wasapproximately concentration-dependent. Cells were blocked in G1 phase. Cellsgrown in 5 mmol/l butyrate and exposed to various DNA damaging agents showedincreased resistance to ultraviolet radiation damage and to adriamycin but,surprisingly, increased sensitivity to x-irradiation. Accessibility of DNA toendonucleases was increased and a compensatory increase in ultraviolet repairincision rates seen. In an animal study in which wheat bran was fed, BOFFA et al.[352] demonstrated that butyrate levels in the colonic lumen are positively relatedto colonic epithelial cell histone acetylation and inversely related to cellproliferation. Butyrate thus appears to be able to modulate DNA synthesis in vivo.
However, increase in histone acetylation may not be the entire explanationfor the specificity of butyrate in modulating gene expression. Evidence is nowaccumulating that butyrate acts by a mechanism that involves specific regulatoryDNA sequences. GLAUBER and colleagues [305] have shown, with adult erythroidcells, that 5’ flanking sequences upstream of the embryonic p-gene are a majordeterminant of p-gene expression and mediate the stimulatory action of butyrateon p-gene transcription. Similarly, in T-lymphocytes, FREGEAU et al. [303] haveshown a butyrate sensitive region in the 5’ flanking sequence of a cytotoxic cellprotease gene. A specific effect of butyrate on transcriptional regulatory proteinsand promoter regions seems likely [331, 342, 353]. Furthermore, KLEHR et al. [354]have shown that the stimulatory effect of butyrate on gene expression is greatest ifone, or especially two, scaffold/matrix-attached regions are present adjacent to thegene. They suggest that butyrate induced inhibition of histone deacetylase mayhave consequences for chromatin structure which would, in turn, promotetranscription.
Other possible mechanisms of action suggested by KRUH include inhibitionof chromatin protein phosphorylation, hypermethylation of DNA and chromatinstructure. Recently BUSTIN has shown that butyrate moderates the expression oftwo related genes BRF1 and BRF2 ( butyrate response factor genes) which aremembers of the TIS 11 family of primary response genes, and are associated withthe control of neoplastic growth [355, 356]. PARASKEVA and colleagues [306, 357]have suggested that butyrate causes apoptosis. In cell lines from colorectal cancersand polyps, sodium butyrate in 1–4 mmol/l concentrations induced apoptosis,
63
4-12-2 CELLULAR MECHANISMS
while TGFα did not. Apoptosis in the colon may therefore be triggered as cellsmigrate up the crypt and are exposed to luminal growth factors.
Does all this convert into a mechanism whereby anaerobic bacteria in thegut produce, from dietary carbohydrate, factors which lead to protection fromlarge bowel cancer? Butyrate can induce transformed cells to acquire thephenotype of more differentiated cells but, as YOUNG and GIBSON point out [320,358], butyrate has paradoxical effects on normal and transformed colon epithelialcells. Some of the conflicting results in the literature may be related to theconcentration of butyrate used in the in vitro studies. The most effectiveconcentrations for inducing differentiation are usually no more than 5 mmol/lwhilst high concentrations lead to cell death. However, luminal concentrations ofbutyrate in the human colon can exceed 20 mmol/l (Table XIV) and are usually inthe range 10–30 mmol/l. It is difficult to believe that a naturally occurring fattyacid, ubiquitous in the mammalian hindgut, could promote or select for tumourgrowth. Its origin from fermentation of dietary NSP and RS does however providea link between epidemiological studies which show these carbohydrates to beprotective against large bowel cancer and the cellular mechanisms that occur.
In the 14 years that have elapsed since it was first proposed that butyratewas the link between fibre and protection against large bowel cancer [359], it hasremained the most likely candidate to fulfil this role. In addition, it is an importantenergy source for the colonic epithelium, substrate for lipid synthesis and itsproduction by bacteria is therefore of major importance to health.
4-13 Metabolism of SCFA
4-13-1 Acetate
Acetate is an essential metabolic fuel in ruminant animals because allglucose reaching the rumen is fermented by the resident bacteria. In man, itsimportance is less certain because it derives from the hindgut and as such mustrepresent a secondary fuel for the tissues, after carbohydrate absorbed from thesmall bowel. Acetate is always found in human venous blood [215, 216, 220] withfasting levels around 50 µmol/l rising to 100–300 µmol/l after meals containingfermentable carbohydrate. Oral metronidazole has little effect, despite suppressinghydrogen and methane production [216]. Acetate is rapidly cleared from the bloodwith a half life of only a few minutes [215, 360] and is metabolised by skeletal[216, 361] and cardiac muscle [362, 363] and brain [364]. Blood acetate isderived primarily from the gut [216, 365]. Patients who have no large intestinehave very low blood acetate levels. However, liver synthesis probably occurs
64
SHORT-CHAIN FATTY ACIDS
when blood levels fall below a certain critical level [215, 366, 367], as seen instarvation for example [216]. Acetate spares fatty acid oxidation in man. Free fattyacid levels fall when oral acetate or alcohol, which is an immediate precursor ofacetate, is given [361, 367, 368]. Acetate either orally or intravenously has littleeffect on glucose metabolism and does not stimulate insulin release in man [369,370].
4–13–2 Propionate
Propionate metabolism has been extensively studied in ruminants where itis a major glucose precursor [371, 372]. Much less is known about its role in man.Propionate can be found in portal blood, although some may be metabolised inthe colonic epithelium and may be a differentiating factor, but with less powerthan butyrate [314]. Propionate supplemented diets have been shown to lowerblood cholesterol in rats [373, 374] and pigs [375–378] but in man the effects areless clear. In a double-blind placebo controlled study of ten female volunteers fed7.5 g sodium propionate daily for seven weeks [379], there was no change inserum cholesterol but HDL cholesterol increased as did triglycerides. There werefalls in fasting blood glucose levels and maximum insulin responses to standardglucose loads. In a similar study, lasting one week, again no effect on cholesterolwas seen but glucose levels were lowered [380]. In another study nine healthymales, whose initial cholesterols were all > 5.5 mmol/l, were given 5.4 gpropionate daily for 15 days and showed a fall in total cholesterol (to 5.28 ± 0.23mmol/l) and in LDL cholesterol, whilst acetate was without effect [381].
To overcome the objections that oral propionate does not reflect the truephysiology of propionate produced by fermentation in the hindgut, two studiesusing rectal or colonic infusions of propionate have been undertaken [382, 383].Propionate had no effect or slightly raised serum cholesterol in short term studies.Other experiments have shown inhibition of hepatic cholesterol synthesis bypropionate and redistribution of cholesterol from plasma to liver [373, 374, 384].There is also extensive hepatic metabolism of SCFA [385].
Thus SCFA have many roles in the human large intestine and in metabolism.Following on from this, a number of clinical uses are developing includingincorporation of SCFA into parenteral infusions during bowel rest and post-surgicalprocedures involving gut anastomoses. They also have a role in ulcerative colitisand diversion colitis (see Chapter 6).
65
4-13-2 PROPIONATE
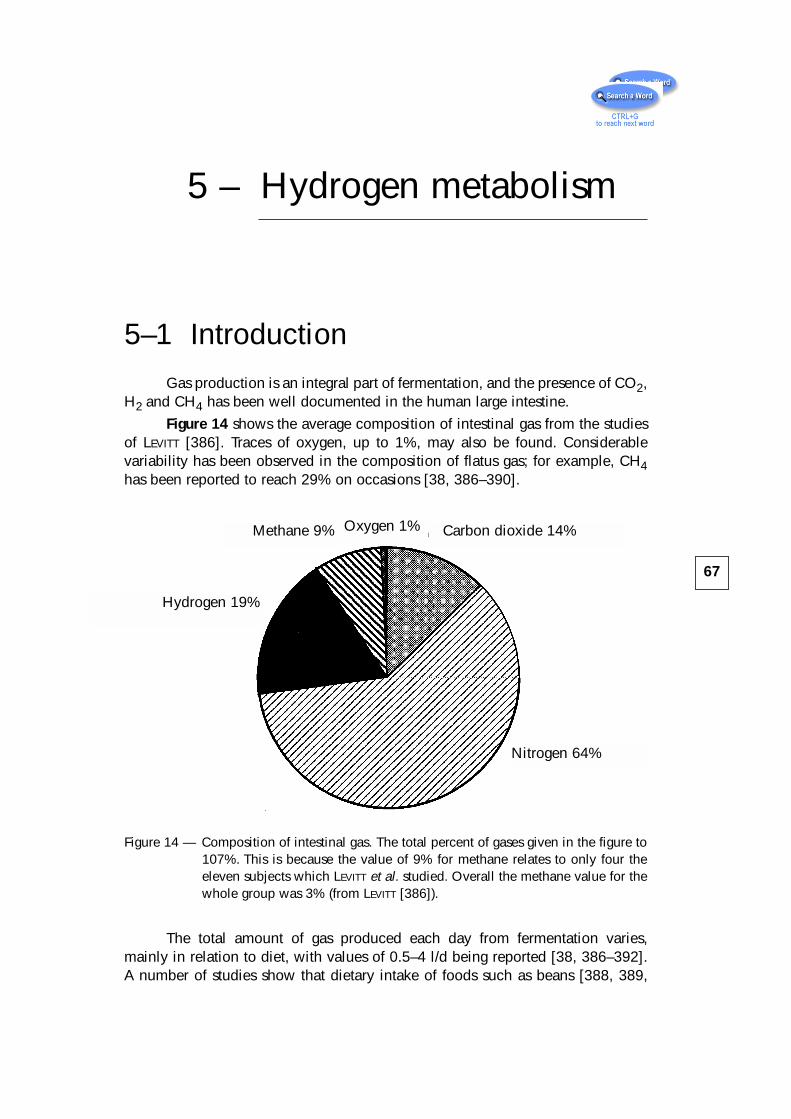
5 – Hydrogen metabolism
5–1 IntroductionGas production is an integral part of fermentation, and the presence of CO2,
H2 and CH4 has been well documented in the human large intestine.
Figure 14 shows the average composition of intestinal gas from the studiesof LEVITT [386]. Traces of oxygen, up to 1%, may also be found. Considerablevariability has been observed in the composition of flatus gas; for example, CH4has been reported to reach 29% on occasions [38, 386–390].
Figure 14 — Composition of intestinal gas. The total percent of gases given in the figure to107%. This is because the value of 9% for methane relates to only four theeleven subjects which LEVITT et al. studied. Overall the methane value for thewhole group was 3% (from LEVITT [386]).
The total amount of gas produced each day from fermentation varies,mainly in relation to diet, with values of 0.5–4 l/d being reported [38, 386–392].A number of studies show that dietary intake of foods such as beans [388, 389,
67
Methane 9% Carbon dioxide 14%
Hydrogen 19%
Nitrogen 64%
Oxygen 1%
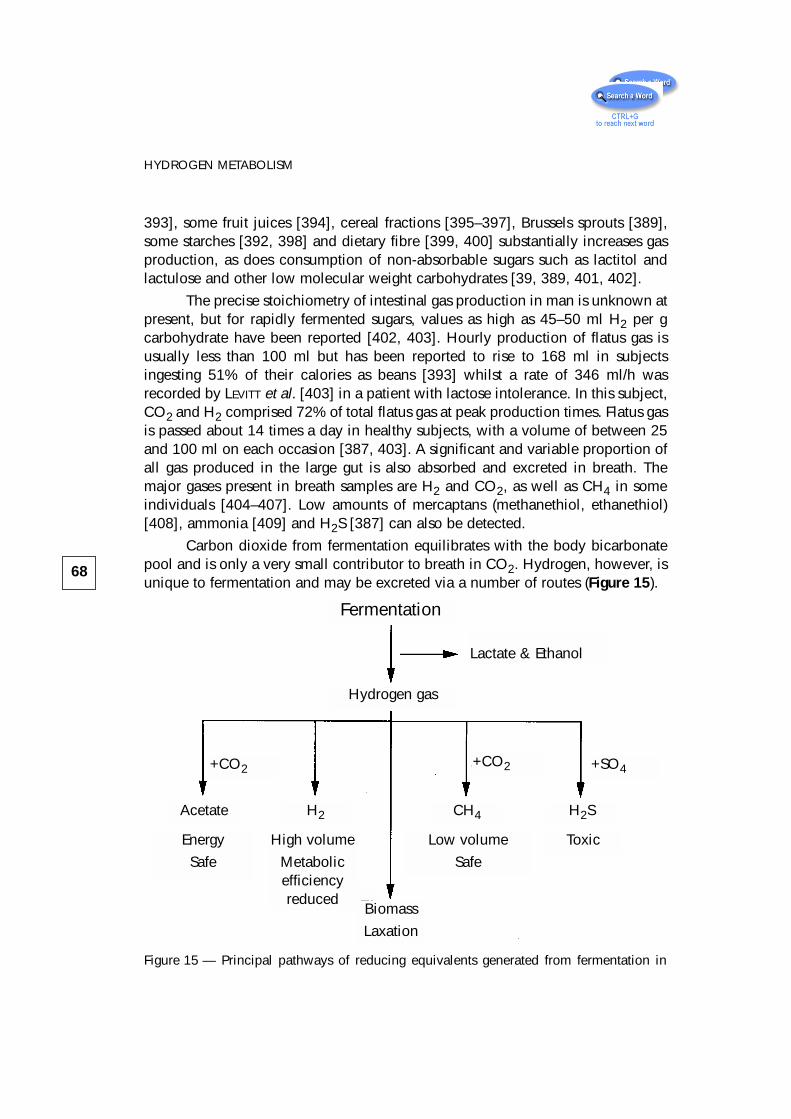
393], some fruit juices [394], cereal fractions [395–397], Brussels sprouts [389],some starches [392, 398] and dietary fibre [399, 400] substantially increases gasproduction, as does consumption of non-absorbable sugars such as lactitol andlactulose and other low molecular weight carbohydrates [39, 389, 401, 402].
The precise stoichiometry of intestinal gas production in man is unknown atpresent, but for rapidly fermented sugars, values as high as 45–50 ml H2 per gcarbohydrate have been reported [402, 403]. Hourly production of flatus gas isusually less than 100 ml but has been reported to rise to 168 ml in subjectsingesting 51% of their calories as beans [393] whilst a rate of 346 ml/h wasrecorded by LEVITT et al. [403] in a patient with lactose intolerance. In this subject,CO2 and H2 comprised 72% of total flatus gas at peak production times. Flatus gasis passed about 14 times a day in healthy subjects, with a volume of between 25and 100 ml on each occasion [387, 403]. A significant and variable proportion ofall gas produced in the large gut is also absorbed and excreted in breath. Themajor gases present in breath samples are H2 and CO2, as well as CH4 in someindividuals [404–407]. Low amounts of mercaptans (methanethiol, ethanethiol)[408], ammonia [409] and H2S [387] can also be detected.
Carbon dioxide from fermentation equilibrates with the body bicarbonatepool and is only a very small contributor to breath in CO2. Hydrogen, however, isunique to fermentation and may be excreted via a number of routes (Figure 15).
68
HYDROGEN METABOLISM
Fermentation
Toxic
Lactate & Ethanol
Hydrogen gas
Low volume
Safe
High volume
Metabolicefficiencyreduced
Energy
Safe
+SO4+CO2+CO2
Acetate H2 CH4 H2S
Biomass
Laxation
Figure 15 — Principal pathways of reducing equivalents generated from fermentation in
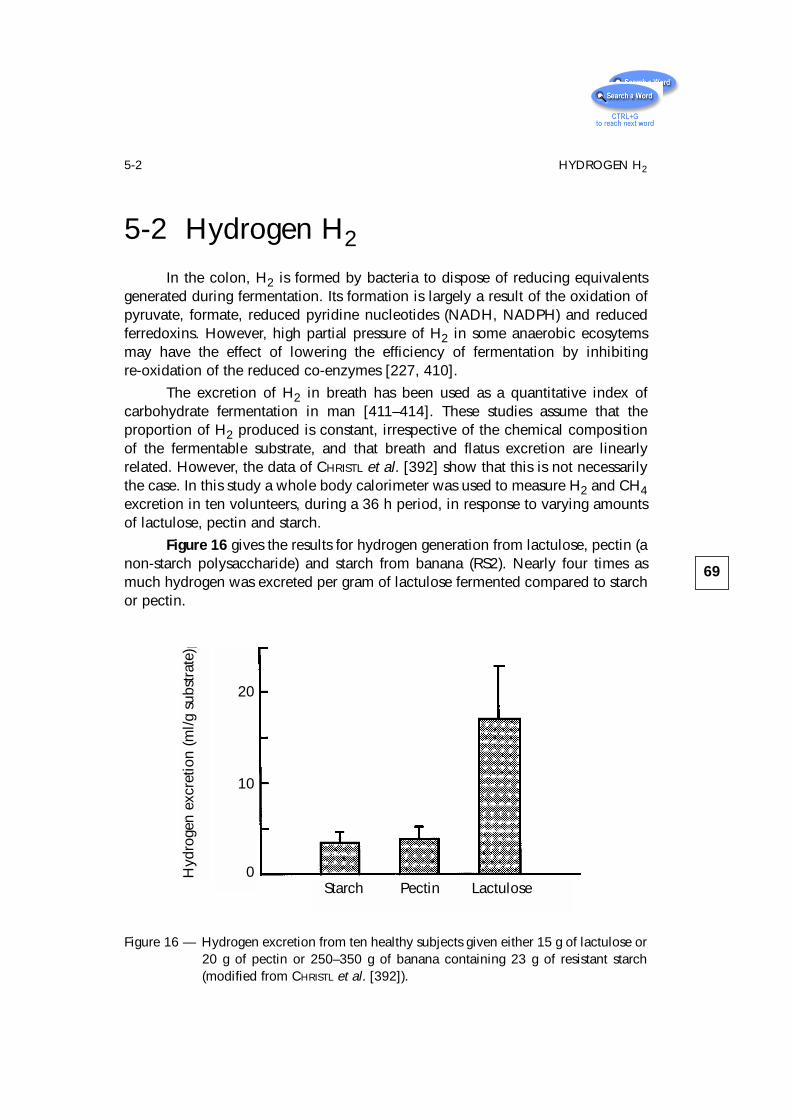
5-2 Hydrogen H2
In the colon, H2 is formed by bacteria to dispose of reducing equivalentsgenerated during fermentation. Its formation is largely a result of the oxidation ofpyruvate, formate, reduced pyridine nucleotides (NADH, NADPH) and reducedferredoxins. However, high partial pressure of H2 in some anaerobic ecosytemsmay have the effect of lowering the efficiency of fermentation by inhibitingre-oxidation of the reduced co-enzymes [227, 410].
The excretion of H2 in breath has been used as a quantitative index ofcarbohydrate fermentation in man [411–414]. These studies assume that theproportion of H2 produced is constant, irrespective of the chemical compositionof the fermentable substrate, and that breath and flatus excretion are linearlyrelated. However, the data of CHRISTL et al. [392] show that this is not necessarilythe case. In this study a whole body calorimeter was used to measure H2 and CH4excretion in ten volunteers, during a 36 h period, in response to varying amountsof lactulose, pectin and starch.
Figure 16 gives the results for hydrogen generation from lactulose, pectin (anon-starch polysaccharide) and starch from banana (RS2). Nearly four times asmuch hydrogen was excreted per gram of lactulose fermented compared to starchor pectin.
69
5-2 HYDROGEN H2
Figure 16 — Hydrogen excretion from ten healthy subjects given either 15 g of lactulose or20 g of pectin or 250–350 g of banana containing 23 g of resistant starch(modified from CHRISTL et al. [392]).
20
10
0Hyd
roge
n ex
cret
ion
(ml/g
sub
stra
te)
Starch Pectin Lactulose
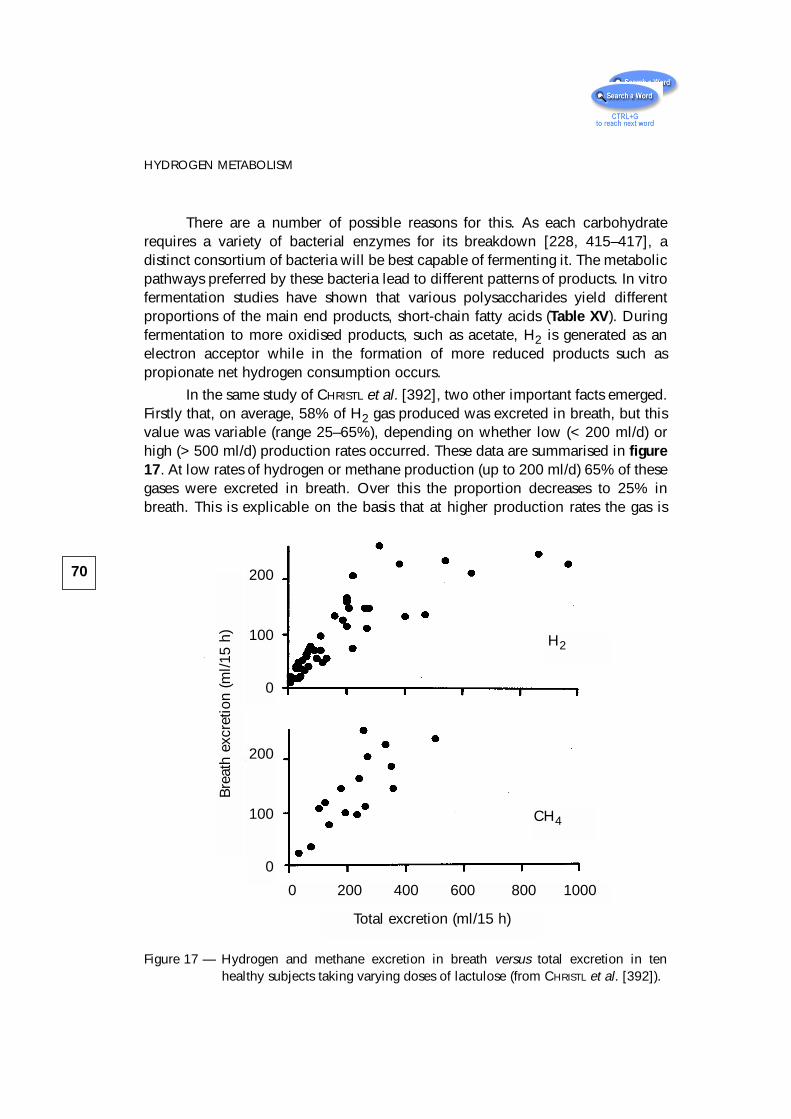
There are a number of possible reasons for this. As each carbohydraterequires a variety of bacterial enzymes for its breakdown [228, 415–417], adistinct consortium of bacteria will be best capable of fermenting it. The metabolicpathways preferred by these bacteria lead to different patterns of products. In vitrofermentation studies have shown that various polysaccharides yield differentproportions of the main end products, short-chain fatty acids (Table XV). Duringfermentation to more oxidised products, such as acetate, H2 is generated as anelectron acceptor while in the formation of more reduced products such aspropionate net hydrogen consumption occurs.
In the same study of CHRISTL et al. [392], two other important facts emerged.Firstly that, on average, 58% of H2 gas produced was excreted in breath, but thisvalue was variable (range 25–65%), depending on whether low (< 200 ml/d) orhigh (> 500 ml/d) production rates occurred. These data are summarised in figure17. At low rates of hydrogen or methane production (up to 200 ml/d) 65% of thesegases were excreted in breath. Over this the proportion decreases to 25% inbreath. This is explicable on the basis that at higher production rates the gas is
70
HYDROGEN METABOLISM
Figure 17 — Hydrogen and methane excretion in breath versus total excretion in tenhealthy subjects taking varying doses of lactulose (from CHRISTL et al. [392]).
Bre
ath
excr
etio
n (m
l/15
h)
200
100
0
200
100
0
0 200 400 600 800 1000
Total excretion (ml/15 h)
H2
CH4
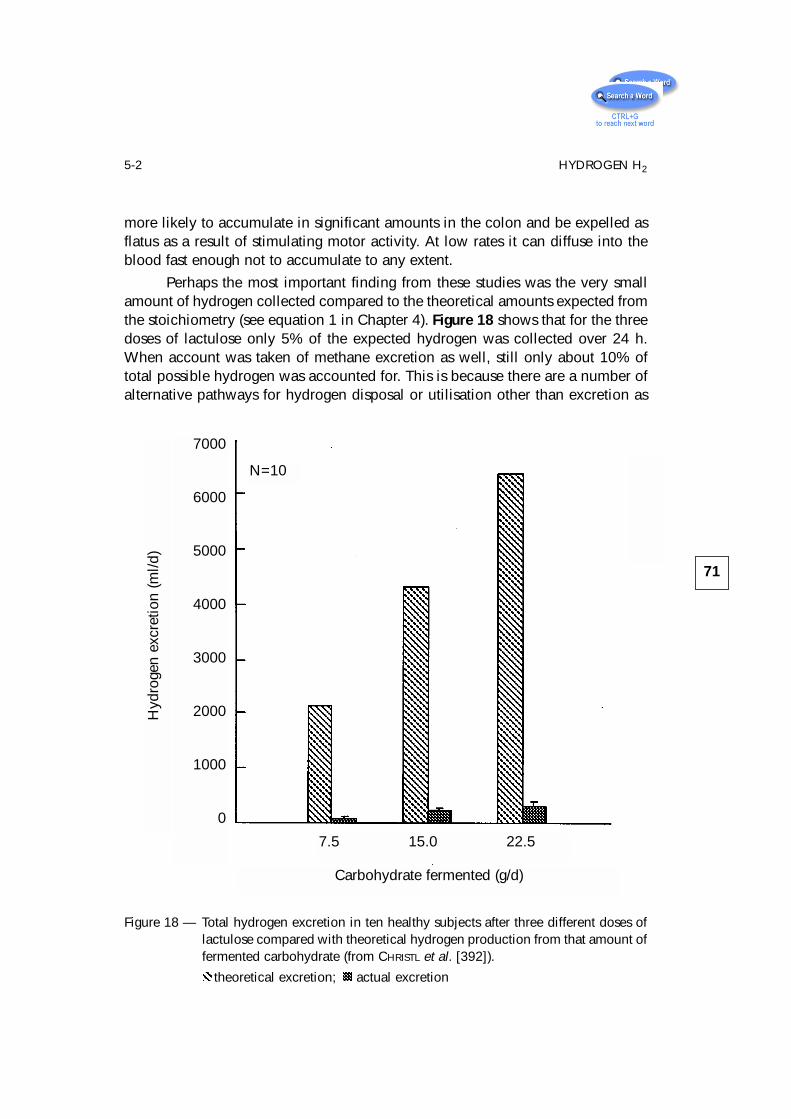
more likely to accumulate in significant amounts in the colon and be expelled asflatus as a result of stimulating motor activity. At low rates it can diffuse into theblood fast enough not to accumulate to any extent.
Perhaps the most important finding from these studies was the very smallamount of hydrogen collected compared to the theoretical amounts expected fromthe stoichiometry (see equation 1 in Chapter 4). Figure 18 shows that for the threedoses of lactulose only 5% of the expected hydrogen was collected over 24 h.When account was taken of methane excretion as well, still only about 10% oftotal possible hydrogen was accounted for. This is because there are a number ofalternative pathways for hydrogen disposal or utilisation other than excretion as
71
5-2 HYDROGEN H2
Figure 18 — Total hydrogen excretion in ten healthy subjects after three different doses oflactulose compared with theoretical hydrogen production from that amount offermented carbohydrate (from CHRISTL et al. [392]).
theoretical excretion; actual excretion
N=10
Hyd
roge
n ex
cret
ion
(ml/d
)
7000
6000
5000
4000
3000
2000
1000
0
Carbohydrate fermented (g/d)
7.5 15.0 22.5
hydrogen gas. As figure 15 shows, these include the formation of methane,reduction of sulphate to sulphide, acetogenesis, lactate and ethanol formationand, perhaps most importantly, the incorporation of reducing equivalent intobiomass.
All of these observations make the interpretation of breath hydrogen, awidely used test in gastroenterological clinical practice, difficult to interpret. Theamount of hydrogen that appears in breath in relation to the grams of substratefermented will vary depending on the type of substrate, on the disposition ofhydrogen excretion between breath and flatus and on the activity of the variousalternative pathways of hydrogen disposal.
Breath hydrogen is also used as a transit marker in gastrointestinal studies,using lactulose as the fermentable carbohydrate source [418]. The intervalbetween ingestion of lactulose and first appearance of H2 varies between 30 and100 min and is related to the dose used; larger doses giving faster mean transittimes (MTT) [418, 419]. Similarly, higher molecular weight substances also giveslower apparent MTT [399]. It is not therefore a true measure of transit time, andother methods are required to determine the average rate of passage for completemeals to the caecum [420, 421]. A small proportion (about 5%) of subjects do notproduce any detectable H2 in breath following ingestion of fermentablecarbohydrate [422, 423] and this may be related to changes in colonic luminal pHduring fermentation [424].
5-3 MethaneCH4 formation in man is altogether more enigmatic than H2 production. In
studies of Western populations, only 30-50% of healthy subjects producedetectable CH4 in their breath [401, 404, 425–429]. Children under the age of twodo not excrete CH4, although the proportion of producers gradually rises untiladult levels are reached at about the age of ten, and there is a strong associationin CH4 excretor status amongst family members [407, 430]. An unexpectedly highbreath CH4 level occurs in patients with large bowel cancer. Between 80% and90% of these patients have detectable CH4 in breath compared with only about40% of controls. Resection of the tumour causes the frequency of excretion toreturn to normal healthy population levels. Moreover, the proportion of CH4producers is also increased in patients with pre-malignant bowel conditions suchas polyps [425–427, 431]. Certain pathological conditions of the large intestinewould therefore appear to promote CH4 production. The presence of haem hasbeen suggested as an important factor, but luminal haemoglobin in the presenceof tumour does not appear to influence CH4 excretor status [432].
72
HYDROGEN METABOLISM
Methanogenic bacteria (MB) in the large bowel have an obligaterequirement for H2. The principal CH4-producing species is Methanobrevibactersmithii which reduces CO2 with H2, according to the following equation [155,433–435]:
4H2 + CO2 CH4 + 2 H2O.
Methanosphaera stadtmaniae can also be isolated from some faecal samples andthis species combines methanol with H2 as shown in the equation [434, 436]:
H2 + CH3 OH CH4 + H2O.
In the rumen, methanogenesis has an important effect on the end productsof fermentation, by removing H2 produced from reduced pyridine nucleotides.This removal of H2 results in an increase in the formation of more oxidisedmetabolities such as acetate and a decrease in propionate [437]. In contrast to therumen, methanogenesis does not appear significantly to affect SCFA production inman. Although high concentrations of ethanol may be detected in the proximalcolon, lactate and succinate do not accumulate in the large gut, and the molarratios of acetate, propionate and butyrate are similar in methanogenic andnon-methanogenic individuals [225, 438]. In this case, the operation of alternativemethods of hydrogen disposal may be of some significance (see below).
Unlike H2, CH4 production does not seem to change perceptibly withvariations in diet [389, 393, 400, 404, 422]. Intestinal intubation and suddendeath victim studies indicate that CH4 production predominantly occurs in thedistal colon [26, 439].
From the host viewpoint, the reduction of 4 mol of H2 to produce 1 mol ofCH4, which is relatively harmless and easily expelled, may be of some clinicalimportance from the viewpoint of gas accumulation in the colon.
5-4 Sulphate and Sulphide
An alternative pathway for disposal of the H2 generated from colonicfermentation is through the activities of dissimilatory sulphate-reducing bacteria(SRB). They utilise H2 according to the equation :
4 H2 + SO42- + H+ SH- + 4 H2O.
The growth of SRB in the presence of sulphate, reducing it to sulphide, isthe principal taxonomic characteristic of SRB, although the genera themselves arebiologically diverse and quite unrelated to each other. SRB are able to multiply inanaerobic regions of marine and estuarine sediments and muds derived frombrackish water. SRB can also be found in the intestinal contents of humans and
73
5-4 SULPHATE AND SULPHIDE
experimental animals, and were first isolated from human faeces in 1977 [440],the principal genus being Desulfovibrio, accounting for 64–81% of all SRBisolated in more recent studies [230, 441, 442]. These strains are able to usegaseous hydrogen as an electron-donor for the reduction of sulphate to sulphide,and account for substantial consumption of hydrogen within the colon. SRB havea preference for growth in the distal colon, shown initially in an in vitro model ofthe colon, using a three-stage continuous-culture system [443] and confirmed invivo at autopsy [26]. Levels of luminal sulphide are maximal in the rectosigmoidregion [26, 441], and may help explain the predilection of ulcerative colitis for thedistal colon.
GIBSON and colleagues [158, 444, 445] have shown that sulphate-reducingbacteria occur in the human gut and are carried principally by people who do notexcrete methane in breath [441, 446]. In in vitro studies, SRB outcompetemethanogens for H2 [158]. SRB require sulphate as an electron acceptor andproduce SH-. Feeding sulphate to healthy methanogenic individuals causesinhibition of methane excretion and the growth of SRB in those subjects carryinglow numbers of SRB initially [447]. In vitro, SRB growth is modulated by sulphateavailability even in the form of mucus [441–443].
Faecal samples donated by healthy volunteers living in the UnitedKingdom and South Africa have been used to determine interactions betweencolonic SRB and MB [442, 448]. Although the Africans were predominantly CH4producers, a strong inverse relationship between methanogenesis and SO4
2-
reduction was found to occur in samples from both populations. Subsequentstudies with faecal slurries confirmed that the bacteria competed for the mutualgrowth substrate H2 [158]. In methanogenic individuals, H2 did not accumulateduring 48h in vitro incubation of faecal slurries—however, significant CH4production occurred. In their non-methanogenic counterparts, H2 levels againremained low, but H2S was a major product. Mixing of the two types of slurrydemonstrated that colonic SRB were able to directly outcompete MB for theavailable H2. Although many different electron donors are potentially available inthe large gut to serve sulphate reduction, species belonging to the generaDesulfovibrio and Desulfobulbus are particularly efficient H2 utilising bacteria[444]. In a competitive environment such as the colon where H2 is a limitingsubstrate, SRB are able to lower the partial pressure of H2 to levels below thoseat which methanogens are able to effectively compete. For this process to occur,a sufficient supply of electron acceptor (SO4
2-) must be available. Pure culturestudies have shown that SRB have a much greater substrate affinity for H2 thanmethanogens (for Desulfovibrio vulgaris Ks = 1 mmol/l; for Methanobrevibactersmithii Ks = 6 mmol/l) [449].
The critical role of SO42- availability in this relationship was demonstrated
74
HYDROGEN METABOLISM
by CHRISTL et al. [447]. In this study, six methanogenic volunteers were fed aSO4
2- enhanced diet for 10 days (15 mmol/d). During this time, SO42- reduction
and methanogenesis were continuously monitored and compared with controlperiods (10 days) either side of the test. In half of the volunteers, the addition ofSO4
2- resulted in a rapid decrease in methanogenesis and concomitantstimulation of dissimilatory SO4
2- reducing activities. In the other persons,however, the increased availability of SO4
2- had no effect on CH4 production.These studies suggest that at least two types of methanogenic person exist: onegroup harbours populations of SRB that are apparently inactive and probablylimited by a reduced supply of electron acceptor, although these bacteria are ableto grow and outcompete MB for H2 when SO4
2- becomes available. In the othergroup, SRB are absent. Concentrations of SO4
2- vary markedly in diet (range 2–9mmol/d) [450]. Foods with a high sulphate content include fermented beveragesand dried fruits [451]. Endogenous sources of SO4
2- may also make somecontribution to the available pool. For example, some host secretions containhighly sulphated glycoproteins, particularly colonic mucins, which areextensively degraded by the gut flora to release this anion in a free form [156,443, 452–455].
Dissimilatory sulphate reduction is a clinically undesirable method ofhydrogen disposal. The common end product of SRB metabolism, H2S, is highlytoxic to the colonic mucosal barrier, and impairs cellular metabolism [456, 457].Coincidentally, the majority of gut disorders arise in the distal colon, where highestnumbers and activities of SRB occur .
From the foregoing, it is clear that an inverse relationship betweenSO4
2- reduction and methanogenesis exists in the large bowel. SO42- availability
undoubtedly plays a key role in hydrogen utilisation. However, other factors suchas pH, bacterial distribution in the colon and nutritional status of the individual arealso likely to be significant.
5-5 Acetogenesis
The situation is further complicated by the existence of other potentialpathways of H2 disposal by colonic bacteria [448]. For example, homoacetogenicbacteria also grow in the large gut [458, 459]. These organisms are able tocombine 4 mol of H2 with 1 mol of CO2 to produce acetate. Energetically,however, acetogenesis is a less favourable route of hydrogen disposal than eithersulphate reduction or methanogenesis and acetogenic bacteria, under normalcircumstances, are outcompeted by SRB or MB for H2. Thus, significant levels of
75
5-5 ACETOGENESIS
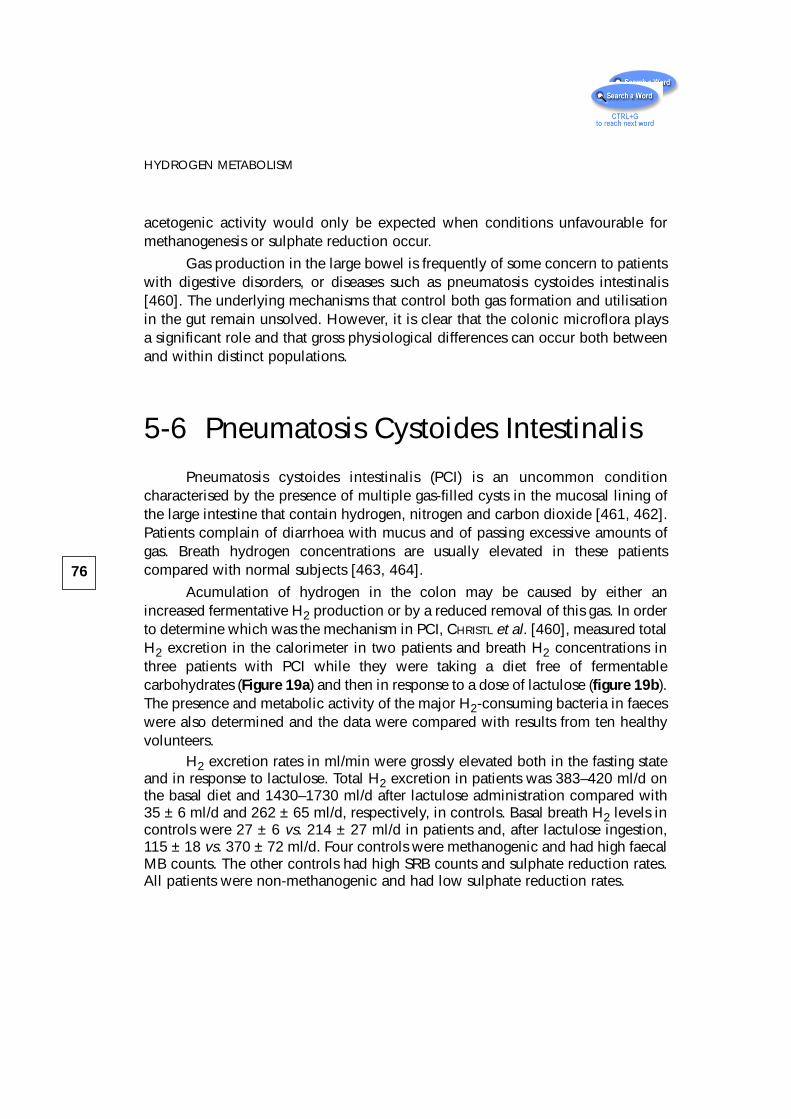
acetogenic activity would only be expected when conditions unfavourable formethanogenesis or sulphate reduction occur.
Gas production in the large bowel is frequently of some concern to patientswith digestive disorders, or diseases such as pneumatosis cystoides intestinalis[460]. The underlying mechanisms that control both gas formation and utilisationin the gut remain unsolved. However, it is clear that the colonic microflora playsa significant role and that gross physiological differences can occur both betweenand within distinct populations.
5-6 Pneumatosis Cystoides IntestinalisPneumatosis cystoides intestinalis (PCI) is an uncommon condition
characterised by the presence of multiple gas-filled cysts in the mucosal lining ofthe large intestine that contain hydrogen, nitrogen and carbon dioxide [461, 462].Patients complain of diarrhoea with mucus and of passing excessive amounts ofgas. Breath hydrogen concentrations are usually elevated in these patientscompared with normal subjects [463, 464].
Acumulation of hydrogen in the colon may be caused by either anincreased fermentative H2 production or by a reduced removal of this gas. In orderto determine which was the mechanism in PCI, CHRISTL et al. [460], measured totalH2 excretion in the calorimeter in two patients and breath H2 concentrations inthree patients with PCI while they were taking a diet free of fermentablecarbohydrates (Figure 19a) and then in response to a dose of lactulose (figure 19b).The presence and metabolic activity of the major H2-consuming bacteria in faeceswere also determined and the data were compared with results from ten healthyvolunteers.
H2 excretion rates in ml/min were grossly elevated both in the fasting stateand in response to lactulose. Total H2 excretion in patients was 383–420 ml/d onthe basal diet and 1430–1730 ml/d after lactulose administration compared with35 ± 6 ml/d and 262 ± 65 ml/d, respectively, in controls. Basal breath H2 levels incontrols were 27 ± 6 vs. 214 ± 27 ml/d in patients and, after lactulose ingestion,115 ± 18 vs. 370 ± 72 ml/d. Four controls were methanogenic and had high faecalMB counts. The other controls had high SRB counts and sulphate reduction rates.All patients were non-methanogenic and had low sulphate reduction rates.
76
HYDROGEN METABOLISM
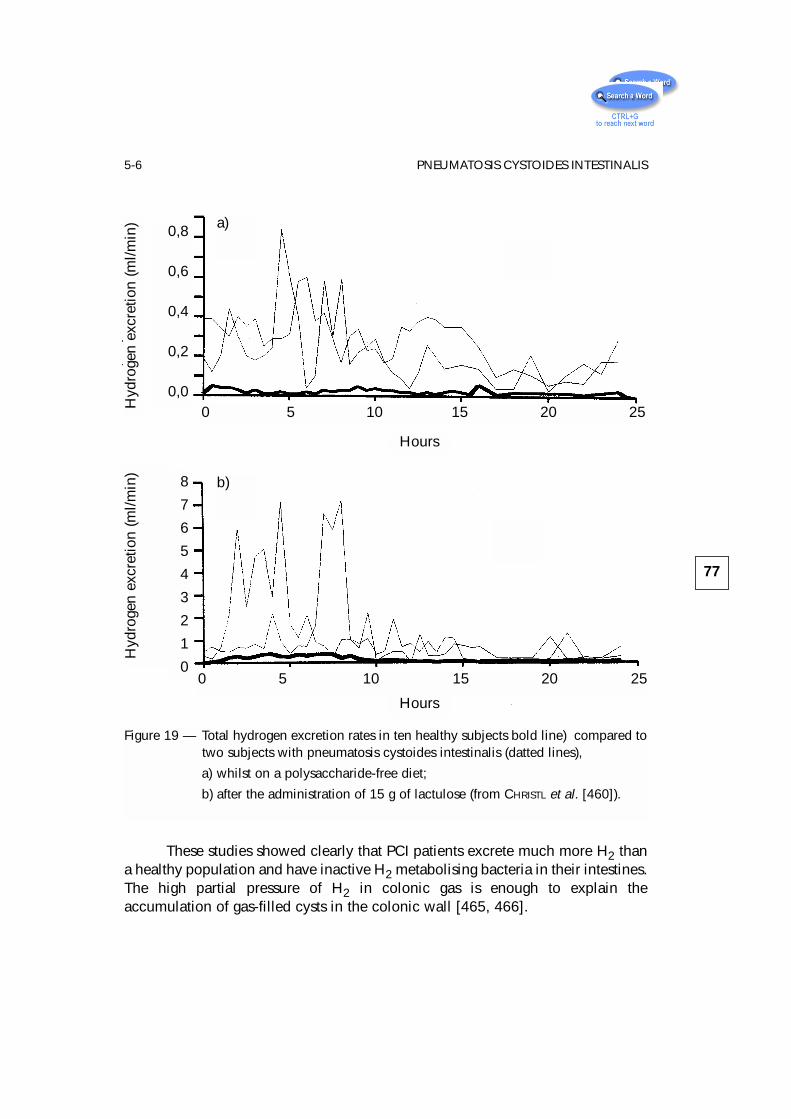
These studies showed clearly that PCI patients excrete much more H2 thana healthy population and have inactive H2 metabolising bacteria in their intestines.The high partial pressure of H2 in colonic gas is enough to explain theaccumulation of gas-filled cysts in the colonic wall [465, 466].
77
5-6 PNEUMATOSIS CYSTOIDES INTESTINALIS
Hyd
roge
n ex
cret
ion
(ml/m
in) 0,8
0,6
0,4
0,2
0,0
Hours
0 5 10 15 20 25
Hyd
roge
n ex
cret
ion
(ml/m
in)
Hours
0 5 10 15 20 25
8
7
6
5
4
3
2
1
0
Figure 19 — Total hydrogen excretion rates in ten healthy subjects bold line) compared totwo subjects with pneumatosis cystoides intestinalis (datted lines),
a) whilst on a polysaccharide-free diet;
b) after the administration of 15 g of lactulose (from CHRISTL et al. [460]).
a)
b)
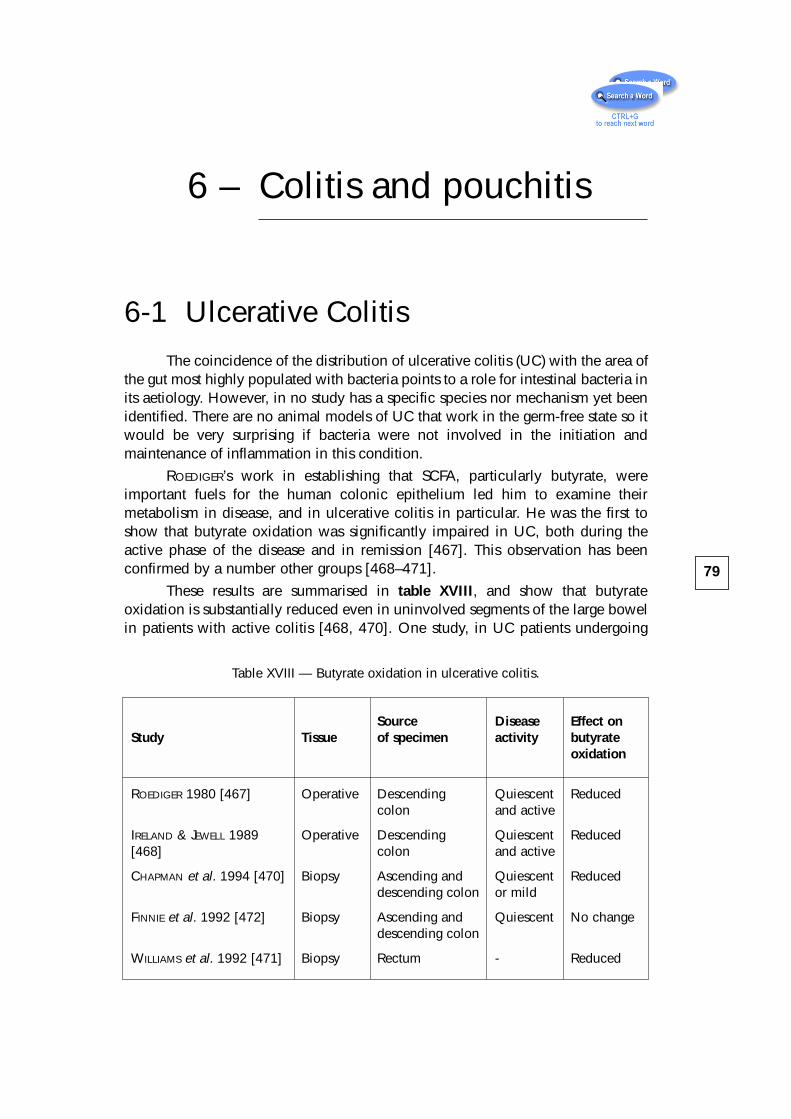
6 – Colitis and pouchitis
6-1 Ulcerative ColitisThe coincidence of the distribution of ulcerative colitis (UC) with the area of
the gut most highly populated with bacteria points to a role for intestinal bacteria inits aetiology. However, in no study has a specific species nor mechanism yet beenidentified. There are no animal models of UC that work in the germ-free state so itwould be very surprising if bacteria were not involved in the initiation andmaintenance of inflammation in this condition.
ROEDIGER’s work in establishing that SCFA, particularly butyrate, wereimportant fuels for the human colonic epithelium led him to examine theirmetabolism in disease, and in ulcerative colitis in particular. He was the first toshow that butyrate oxidation was significantly impaired in UC, both during theactive phase of the disease and in remission [467]. This observation has beenconfirmed by a number other groups [468–471].
These results are summarised in table XVIII, and show that butyrateoxidation is substantially reduced even in uninvolved segments of the large bowelin patients with active colitis [468, 470]. One study, in UC patients undergoing
79
Table XVIII — Butyrate oxidation in ulcerative colitis.
Source Disease Effect onStudy Tissue of specimen activity butyrate
oxidation
ROEDIGER 1980 [467] Operative Descending Quiescent Reducedcolon and active
IRELAND & JEWELL 1989 Operative Descending Quiescent Reduced[468] colon and active
CHAPMAN et al. 1994 [470] Biopsy Ascending and Quiescent Reduceddescending colon or mild
FINNIE et al. 1992 [472] Biopsy Ascending and Quiescent No changedescending colon
WILLIAMS et al. 1992 [471] Biopsy Rectum - Reduced
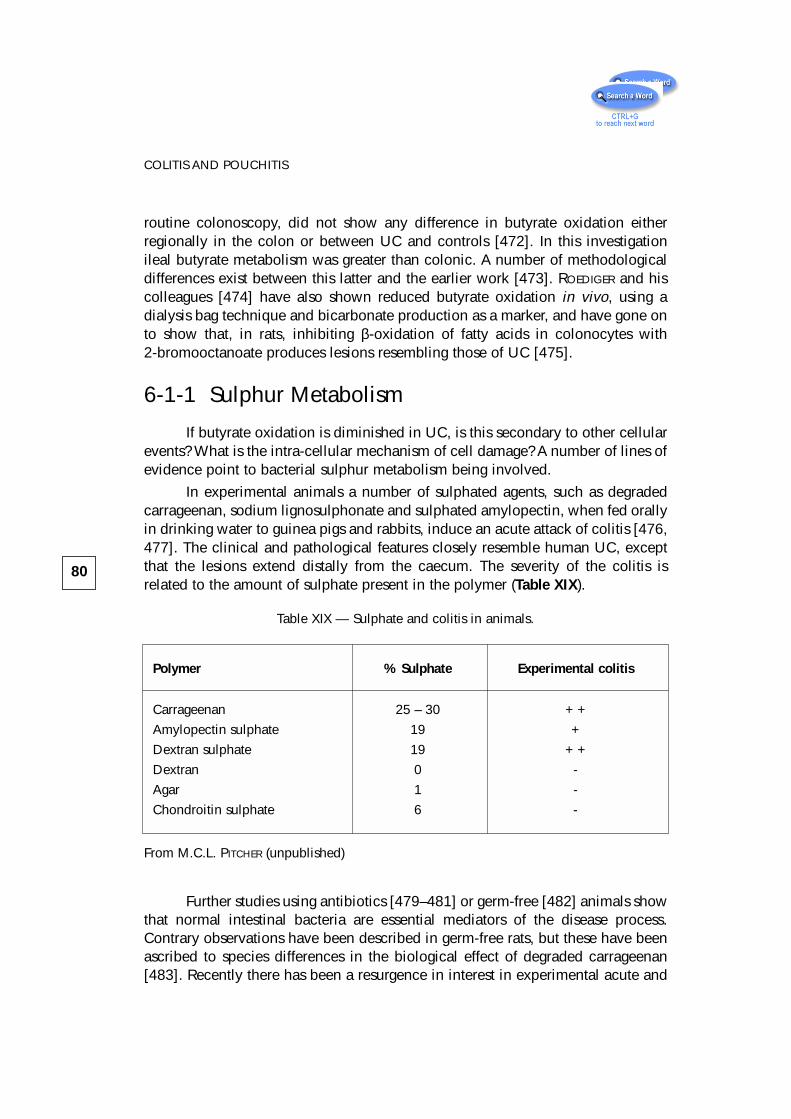
routine colonoscopy, did not show any difference in butyrate oxidation eitherregionally in the colon or between UC and controls [472]. In this investigationileal butyrate metabolism was greater than colonic. A number of methodologicaldifferences exist between this latter and the earlier work [473]. ROEDIGER and hiscolleagues [474] have also shown reduced butyrate oxidation in vivo, using adialysis bag technique and bicarbonate production as a marker, and have gone onto show that, in rats, inhibiting β-oxidation of fatty acids in colonocytes with2-bromooctanoate produces lesions resembling those of UC [475].
6-1-1 Sulphur Metabolism
If butyrate oxidation is diminished in UC, is this secondary to other cellularevents? What is the intra-cellular mechanism of cell damage? A number of lines ofevidence point to bacterial sulphur metabolism being involved.
In experimental animals a number of sulphated agents, such as degradedcarrageenan, sodium lignosulphonate and sulphated amylopectin, when fed orallyin drinking water to guinea pigs and rabbits, induce an acute attack of colitis [476,477]. The clinical and pathological features closely resemble human UC, exceptthat the lesions extend distally from the caecum. The severity of the colitis isrelated to the amount of sulphate present in the polymer (Table XIX).
Further studies using antibiotics [479–481] or germ-free [482] animals showthat normal intestinal bacteria are essential mediators of the disease process.Contrary observations have been described in germ-free rats, but these have beenascribed to species differences in the biological effect of degraded carrageenan[483]. Recently there has been a resurgence in interest in experimental acute and
80
COLITIS AND POUCHITIS
Table XIX — Sulphate and colitis in animals.
Polymer % Sulphate Experimental colitis
Carrageenan 25 – 30 + +
Amylopectin sulphate 19 +
Dextran sulphate 19 + +
Dextran 0 -
Agar 1 -
Chondroitin sulphate 6 -
From M.C.L. PITCHER (unpublished)
chronic colitis in mice and hamsters using the dextran-sulphate model, in whichthe pathology is largely confined to the mucosa of the distal colon [484, 485].Populations of intestinal anaerobes increased significantly after administration ofdextran-sulphate sodium (DSS), an effect nullified with metronidazolepre-treatment with attendent protection from colonic ulceration [486]. It isconceivable that in the carrageenan and DSS models the processing of sulphate, adietary component, by colonic bacteria yields a product, as yet undefined, thatcauses immune activation and resultant gastrointestinal damage. This would placeUC in the category of immune disorder diseases. An alternative possibility,however, is that a product of bacterial metabolism is directly affecting intracellularmetabolism in the colonocyte, leading to a defect in butyrate oxidation. Thismetabolite could be sulphide, produced by sulphate-reducing bacteria amongstothers.
Studies by PITCHER and colleagues [487] in 29 UC patients have shownthat, whilst 95% carry SRB in the active phase of the disease, only 55% do so inquiescent disease. The mean log10 counts/g of viable SRB were 3 logs higher inthe active disease group than those in remission. Faecal sulphide concentrationwas higher in those UC patients who were not taking 5-ASA (5-amino salicylicacid).
In the animal models of UC a protective effect of salicylates has beenobserved. Sulfasalazine reduced the numbers of animals with carrageenan-induced mucosal inflammation by 50%, yet appeared to have no impact on theintestinal microflora [482]. More recently, sulfasalazine and olsalazine have bothbeen found to be effective in preventing deaths in athymic mice, a strain moresensitive to DSS-induced distal colitis than the conventional rat, and a dose-response effect was observed in terms of survival [488, 489]. Clinical response tosulfasalazine treatment has also been demonstrated in DSS-induced colitis inconventional BALB/c mice [490], although two studies of chronic DSS-inducedcolitis using conventional rats have reported opposite findings with bothattenuation and no effect on colonic inflammation with sulfasalazine [491, 492].Some preliminary results, after sub-group analysis of the most recent data fromPITCHER’s laboratory, have shown that there may be an effect of salicylates inreducing both sulphate reduction rates and faecal sulphide levels in those patientsreceiving these drugs [493].
So does SH-, or do other reduced sulphur compounds, produce theobserved metabolic defect in UC cells? ROEDIGER has shown that fatty acidoxidation can be inhibited by a range of S-containing compounds [494, 495]. Ofthese, the mercapto-acids (2-mercaptoacetate and 3-mercaptopropionate) andsodium sulphite at levels of 1–5 mmol/l selectively diminished fatty acid oxidationby 30–50% without substantially altering glucose oxidation, which reflect themetabolic changes in UC. Selective impairment of butyrate oxidation to CO2 and
81
6-1-1 SULPHUR METABOLISM
acetoacetate has more recently been demonstrated with sodium sulphide in ratcolonocytes at concentrations as low as 0.1–0.5 mmol/l NaHS [496].
The effect of reducing sulphur compounds on butyrate oxidation has alsobeen investigated in healthy human colonic epithelial cells [494]. At aconcentration of 2 mmol/l, the order of suppression of fatty acid oxidation at allsites of the colon was hydrogen sulphide > methanethiol > mercaptoacetate, andwas most pronounced in the distal colon. Suppression was maximal with 2 mMNaHS which inhibited butyrate oxidation by 75% in the distal colon and 43% inthe ascending colon. ROEDIGER concluded that the metabolic effects of anionicsulphide (HS-) on butyrate oxidation along the length of the colon closely mirrorthe metabolic and regional abnormalities observed in active UC and may beinvolved in pathogenesis. Evidence in support of this contention has come fromobservation of the relationship between luminal sodium sulphide perfused into ratcolon and damage to the colonic epithelium [497, 498]. This effect is significantat a sulphide concentration of 0.2 mM—a level which is physiological for humanfaeces—producing apoptosis, goblet cell loss, superficial mucosal ulceration andimpairment of fatty acid oxidation (10–30 mM SH-).
Preliminary attempts to define the site of sulphide-induced inhibition ofbutyrate oxidation in the colonocyte have localised a metabolic block at the levelof FAD-linked oxidation by butyryl-CoA dehydrogenase [496]. No effect is seen onNAD-linked oxidation which is supported by a recent mRNA analysis formitochondrial NAD/NADH-dependent dehydrogenases in colonic biopsies frompatients with acute UC in which no evidence of enzyme deficiency was found[499].
ROEDIGER’s observations have recently been complemented by a study ofbutyrate uptake in isolated membrane vesicles of the rat distal colon [500].Intravesicular butyrate uptake was inhibited by 20 mmol/l mercaptopropionateand further increments in concentration produced a dose-response effect,indicating competitive inhibition with the SCFA ion-exchange transporter. Thus, onpresent evidence, it may be concluded that reducing sulphur compounds aredetrimental to colonic metabolism firstly by impairing the transport of n-butyrateinto the colonocyte and then by inhibition of n-butyrate oxidation withinmitochondria. These mechanisms point to reducing sulphur compounds within thecolonic lumen, and hydrogen sulphide in particular, to be candidates for theinitiation of ulcerative colitis.
82
COLITIS AND POUCHITIS
6-1-2 Faecal SCFA in UC
Although ROEDIGER et al. [501] reported increased levels of SCFA in faecesof UC patients, in subsequent studies this relationship has not been so clearlydemonstrated. VERNIA [502] studied 18 UC patients in whom total SCFA were87 ± 11 mmol/kg, 20 patients with CROHN’s 132 ± 13, and 16 healthy controls133 ± 12. In a subsequent paper [503] SCFA were found to be high in quiescentand mild UC: 163 ± 64 and 148 ± 63 mmol/kg respectively, but significantly lowerin severe disease: 65 ± 47 mmol/kg. Butyrate levels were particularly low in severeUC: 4.3 ± 5.0 mmol/kg compared to controls 13.7 ± 8.4, the inference being thatin severe disease there is a relative butyrate deficiency in addition to impairedbutyrate oxidation.
However, SCFA levels in faeces are not a particularly sensitive guide toSCFA metabolism in the colon and, in general, the worse the diarrhoea the lowerthe concentration becomes [191]. Information on production rate would be moreuseful but is difficult to obtain.
VERNIA’s group also noted increasing lactate concentrations in UC whichcorrelated closely with disease severity [503]. High luminal levels of lactate caninduce diarrhoea and may lead to mucosal inflammation. Lactate production isfavoured during fermentation by high substrate availability and low pH. However,recent studies have suggested that the lactate may be of mucosal origin [504]. It isunwise, therefore, to draw too many conclusions from the study of faecal SCFAs.
6–1–3 SCFA Enemas
The suggestion that diminished butyrate oxidation in UC might be importantin the inflammatory process, coupled to observations of low SCFA in the stool ofUC patients with severe disease, has prompted a number of groups to try usingSCFA to treat UC (Table XX).
The first such report [505] was of an open trial using a solution of 80 mmol/lacetate, 30 mmol/l propionate and 40 mmol/l butyrate in twice daily enemas inpatients with distal disease. Of the ten patients who completed the 6-week study,nine were improved. BREUER is now (1994) [506] conducting a multicentrerandomised placebo-controlled study in the United States Mid-West using thesame SCFA mixture versus saline. Preliminary results show 53% of UC patientsimproved compared to 26% of those on placebo.
The effect of enemas containing butyrate alone (100 mmol/l) has beenreported by SCHEPPACH [507]. Ten patients with left-sided UC who wereunresponsive to, or intolerant of, standard treatment were given either butyrate orsodium chloride enemas twice daily for two weeks, each in a randomised single
83
6-1-3 SCFA ENEMAS
blind cross-over study. After butyrate administration, stool frequency, rectalinflammation and upper crypt labelling index all fell significantly. Early reports ofsimilar studies in progress also look equally promising [509-511], althoughSTEINHART’s updated report [512] shows no benefit from a nightly enema ofbutyrate given for 21 days to 19 UC patients. Many of these were already beingtreated with steroids and 5-ASA preparations which may have masked any benefitsof the enemas.
In the only comparative study of SCFA enemas with conventional treatment,SENAGORE [508] compared hydrocortisone, 5-ASA and SCFA enemas in 45 patientswith distal UC. The SCFA enema comprised acetate, propionate and butyrate andwas given twice daily for 6 weeks. All treatments were effective with 12 out of 14UC patients on SCFA showing a benefit. The lack of potential side effects fromSCFA compared with steroid and 5-ASA is clearly a potential advantage.
Thus, it appears that SCFA will prove to be an effective treatment for manyUC patients. Where does this leave the sulphur story? If S-compounds inhibitβ-oxidation in the way that ROEDIGER suggests, then high concentrations of butyratemight be able to overcome the block, simply by mass action. A direct attack onSRB and attempts to reduce SH- production in the colon might also be effective
84
COLITIS AND POUCHITIS
Table XX — SCFA enemas in ulcerative colitis.
Study Design N Formula Outcome
BREUER 1991 [505] O 6w x2 12 80:30:40 Improved
SCHEPPACH 1992 [507](1) P 2w x2 10 B 100 Improved
SENAGORE 1992 [508] M 6w x2 14 60:30:40 Improved
VERNIA 1993 [509] P 6w x2 20 80:30:40 Improved
VERNIA 1995 [510] P 6w x1 40 80:30:40 Improved
BREUER 1994 [506](1) P 6w x2 17 80:30:40 Improved
STEINHART 1995 [511] P 6w x1 19 B 80 No change
O = open trial; P = placebo controlled; M = multiple arms; w = weeks;
Formula = acetate:propionate:butyrate (mmol/l); B = butyrate alone (mmol/l).
(1) Since this table was compiled two abstracts have been published of double-blindplacebo controlled (saline) studies in distal ulcerative colitis. In that of BREUER et al.(Gastroenterology 1996;110:A873) there was clinical and histological improvementwhich did not reach statistical significance. In the study of SCHEPPACH et al.(Gastroenterology 1996;110:A1010) there was significant clinical and histologicalimprovement in both treated and placebo groups.
unless there is an inherited disorder of S-metabolism in the colonocyte of UCpatients [513]. This might explain why not everyone who carries SRB gets UC.Nevertheless, reduction of SH- in the colonic lumen should offer an effectivetherapeutic approach.
6-2 Diversion colitisIn 1981, GLOTZER et al. [514] described a condition in which mucosal
inflammation occurred in segments of the large intestine from which the faecalstream had been diverted by proximal colostomy. This “diversion colitis”resembled UC in many ways but the inflammation is cured by reanastomosing thebowel and thus allowing the faecal stream back into the defunctioned colon [514,515]. Various causes have been postulated, including changes in the bacterial flora[516, 517] but the most likely is loss of an essential trophic or nutritional factorfrom the faecal stream, which is probably SCFA [517]. Diversion colitis parallels anumber of other colitides in which SCFA production is reduced, such as occurs instarvation and famine, or utilisation impairment in UC [518].
HARIG et al. [519] tested these theories in four patients with diversion colitis.They showed by breath hydrogen testing that no fermentative flora were present inthe excluded segment, and neither were there any recognised pathogenic bacteria.Total SCFA concentration in material aspirated from the excluded segments was 0,4.0 and 0.8 mmol/l for acetic, propionic and butyric acids respectively. They thentreated the patients with SCFA enemas comprising 60 mmol/l acetate, 30 mmol/lpropionate and 40 mmol/l butyrate, twice daily for 2–6 weeks. All subjects showedclinical improvement and disappearance of histological changes of inflammation.Control periods using either no enemas or saline did not lead to any improvement.
A double-blind study was then undertaken by GUILLEMOT et al. [520] in 13patients who were given the same enema mixture as in HARIG’s study, but for twoweeks only. No improvement in either endoscopic appearances or histology of themucosa was observed. It is therefore probable that treatment for longer than twoweeks is needed. Further trials are awaited, but at this stage the evidence suggeststhat in these patients absence of SCFA from the bowel lumen is damaging.
85
6-2 DIVERSION COLITIS
6-3 PouchitisPouchitis is another inflammatory condition of the intestine, this time
occurring in the distal ileal loops which are used to fashion an artificial rectalreservoir in patients who have had their large bowel and rectum removed for UC.It is very common after colectomy and is associated with reduced SCFA levels inluminal contents [521, 522], e.g. 56 ± 13 (SEM) mmol/l pouchitis versus 139 ± 8mmol/l healthy pouch (N = 6). SCFA production from faecal homogenatesincubated in vitro is also reduced, but L-lactate levels are increased three-fold. Nobacteriological differences have been observed, and the condition resolves rapidlywith metronidazole treatment.
There are sporadic reports of the use of SCFA to treat pouchitis. One groupused SCFA enemas in two patients for four weeks without benefit [523] whereasanother have used butyrate suppositories [524] also without great benefit. In thesesame patients, however, glutamine suppositories led to improvement in 60% ofpatients. Glutamine is the primary fuel for the ileal mucosa, rather than butyrate orother SCFA.
86
COLITIS AND POUCHITIS
7 – Bowel habitand constipation
7-1 Bowel habit7-1-1 Frequency
Most adults living on Western style diets pass one stool/day, with 95% of thepopulation going between three times/day and three times/week. The frequency ofdefaecation is greater in early life at four times/day in the neonatal period (range 1–9),with breast-fed babies having a higher rate than bottle-fed babies. The adult patternof once a day is reached by the age of four years [525]. As old age (over 70 years)approaches, there is a tendency for bowel habit to become less frequent. Indeveloping countries the modal frequency is nearer twice a day.
7-1-2 Consistency
In the normal population, faecal form and consistency varies from hard,small, fragmented droppings through cylindrically shaped stools to softporridge-like amorphous material. It has been measured by a variety of meansincluding visual assessment [526], subjective evaluation [527, 528] and by using apenetrometer [529]. Stool consistency is not uniform and may vary within a singlemotion. In general, as daily stool weight increases so stools become softer and lesswell formed. Consistency is related to water content, which is normally 70–80%.Men pass softer stools than women. Constipated subjects generally pass harderstools with a water content of less than 70% [527, 530]. It is the hardness anddryness of stools that is thought to cause discomfort on defaecation.
7-1-3 Stool Weight
In the United Kingdom, daily stool weight is about 110 g/d with a range40–260 g/d. Men pass significantly more than women and the young more than theelderly [13]. Figure 20 shows the distribution; 47% of men and 51% of womenhave stool weights less than 100 g/d, and 17% of women and 1% of men pass lessthan 50 g/d.
87
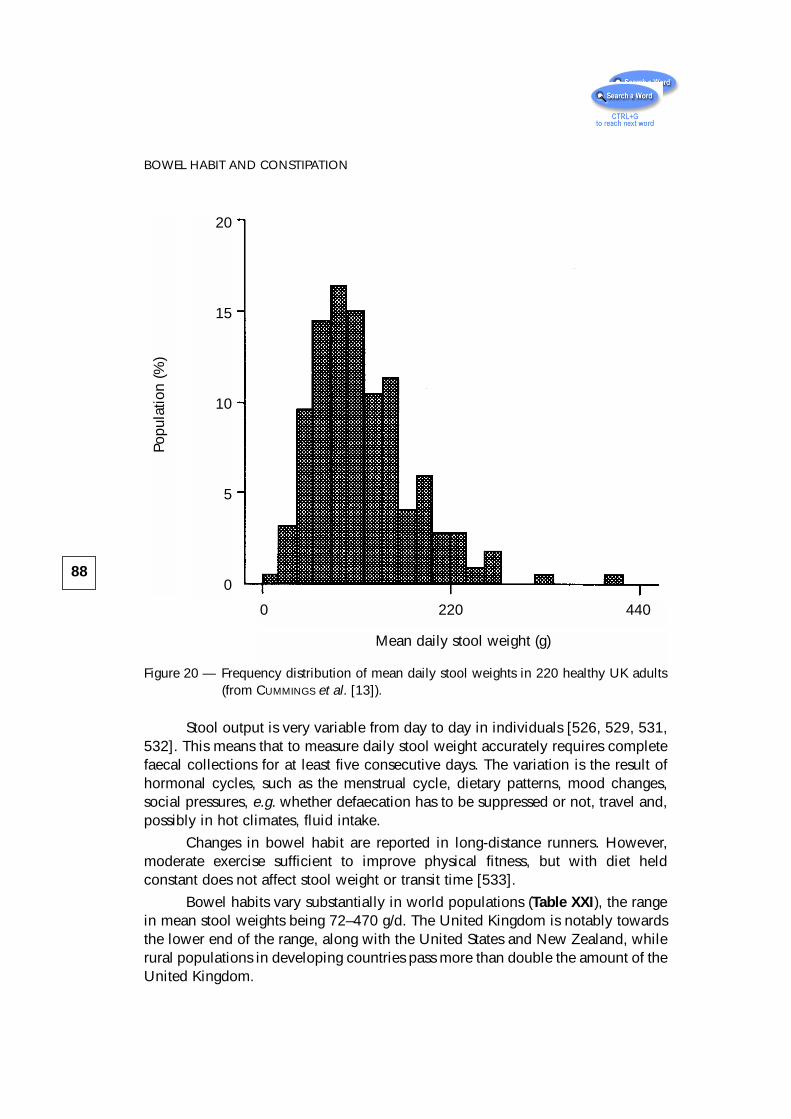
Figure 20 — Frequency distribution of mean daily stool weights in 220 healthy UK adults(from CUMMINGS et al. [13]).
Stool output is very variable from day to day in individuals [526, 529, 531,532]. This means that to measure daily stool weight accurately requires completefaecal collections for at least five consecutive days. The variation is the result ofhormonal cycles, such as the menstrual cycle, dietary patterns, mood changes,social pressures, e.g. whether defaecation has to be suppressed or not, travel and,possibly in hot climates, fluid intake.
Changes in bowel habit are reported in long-distance runners. However,moderate exercise sufficient to improve physical fitness, but with diet heldconstant does not affect stool weight or transit time [533].
Bowel habits vary substantially in world populations (Table XXI), the rangein mean stool weights being 72–470 g/d. The United Kingdom is notably towardsthe lower end of the range, along with the United States and New Zealand, whilerural populations in developing countries pass more than double the amount of theUnited Kingdom.
88
BOWEL HABIT AND CONSTIPATIONPo
pula
tion
(%)
20
15
10
5
0
0 220 440
Mean daily stool weight (g)
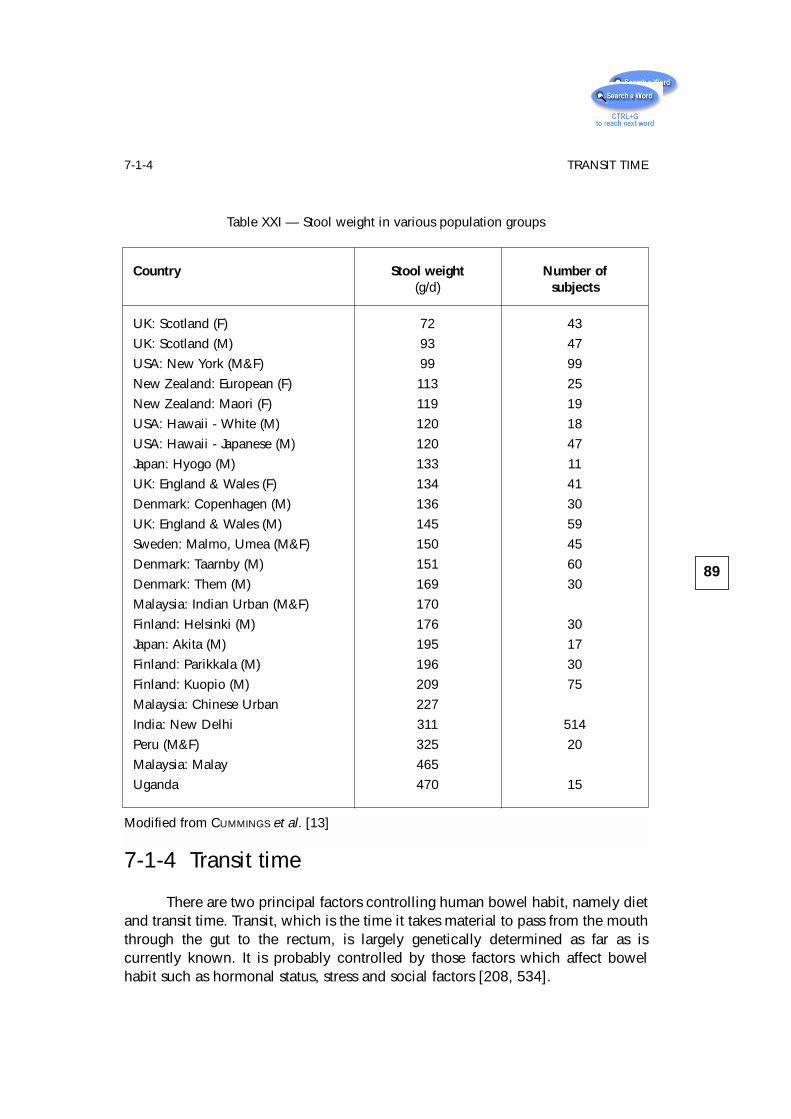
7-1-4 Transit time
There are two principal factors controlling human bowel habit, namely dietand transit time. Transit, which is the time it takes material to pass from the mouththrough the gut to the rectum, is largely genetically determined as far as iscurrently known. It is probably controlled by those factors which affect bowelhabit such as hormonal status, stress and social factors [208, 534].
89
7-1-4 TRANSIT TIME
Table XXI — Stool weight in various population groups
Country Stool weight Number of (g/d) subjects
UK: Scotland (F) 72 43
UK: Scotland (M) 93 47
USA: New York (M&F) 99 99
New Zealand: European (F) 113 25
New Zealand: Maori (F) 119 19
USA: Hawaii - White (M) 120 18
USA: Hawaii - Japanese (M) 120 47
Japan: Hyogo (M) 133 11
UK: England & Wales (F) 134 41
Denmark: Copenhagen (M) 136 30
UK: England & Wales (M) 145 59
Sweden: Malmo, Umea (M&F) 150 45
Denmark: Taarnby (M) 151 60
Denmark: Them (M) 169 30
Malaysia: Indian Urban (M&F) 170
Finland: Helsinki (M) 176 30
Japan: Akita (M) 195 17
Finland: Parikkala (M) 196 30
Finland: Kuopio (M) 209 75
Malaysia: Chinese Urban 227
India: New Delhi 311 514
Peru (M&F) 325 20
Malaysia: Malay 465
Uganda 470 15
Modified from CUMMINGS et al. [13]
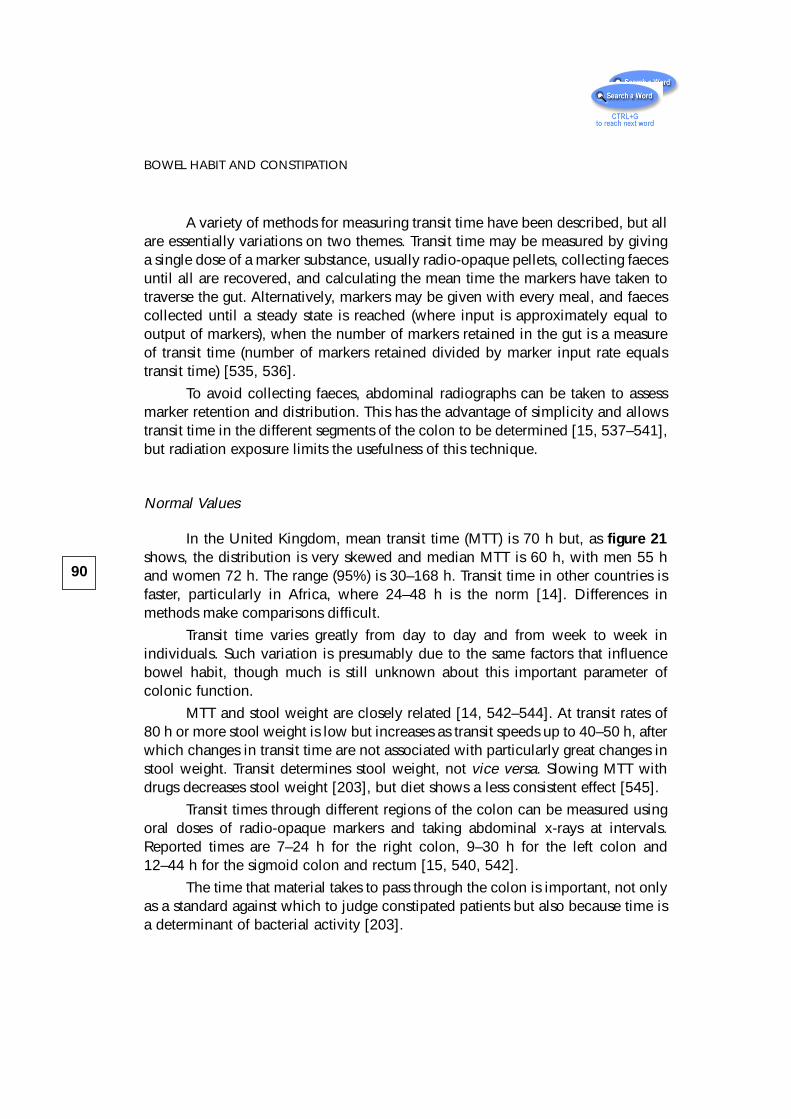
A variety of methods for measuring transit time have been described, but allare essentially variations on two themes. Transit time may be measured by givinga single dose of a marker substance, usually radio-opaque pellets, collecting faecesuntil all are recovered, and calculating the mean time the markers have taken totraverse the gut. Alternatively, markers may be given with every meal, and faecescollected until a steady state is reached (where input is approximately equal tooutput of markers), when the number of markers retained in the gut is a measureof transit time (number of markers retained divided by marker input rate equalstransit time) [535, 536].
To avoid collecting faeces, abdominal radiographs can be taken to assessmarker retention and distribution. This has the advantage of simplicity and allowstransit time in the different segments of the colon to be determined [15, 537–541],but radiation exposure limits the usefulness of this technique.
Normal Values
In the United Kingdom, mean transit time (MTT) is 70 h but, as figure 21shows, the distribution is very skewed and median MTT is 60 h, with men 55 hand women 72 h. The range (95%) is 30–168 h. Transit time in other countries isfaster, particularly in Africa, where 24–48 h is the norm [14]. Differences inmethods make comparisons difficult.
Transit time varies greatly from day to day and from week to week inindividuals. Such variation is presumably due to the same factors that influencebowel habit, though much is still unknown about this important parameter ofcolonic function.
MTT and stool weight are closely related [14, 542–544]. At transit rates of80 h or more stool weight is low but increases as transit speeds up to 40–50 h, afterwhich changes in transit time are not associated with particularly great changes instool weight. Transit determines stool weight, not vice versa. Slowing MTT withdrugs decreases stool weight [203], but diet shows a less consistent effect [545].
Transit times through different regions of the colon can be measured usingoral doses of radio-opaque markers and taking abdominal x-rays at intervals.Reported times are 7–24 h for the right colon, 9–30 h for the left colon and12–44 h for the sigmoid colon and rectum [15, 540, 542].
The time that material takes to pass through the colon is important, not onlyas a standard against which to judge constipated patients but also because time isa determinant of bacterial activity [203].
90
BOWEL HABIT AND CONSTIPATION
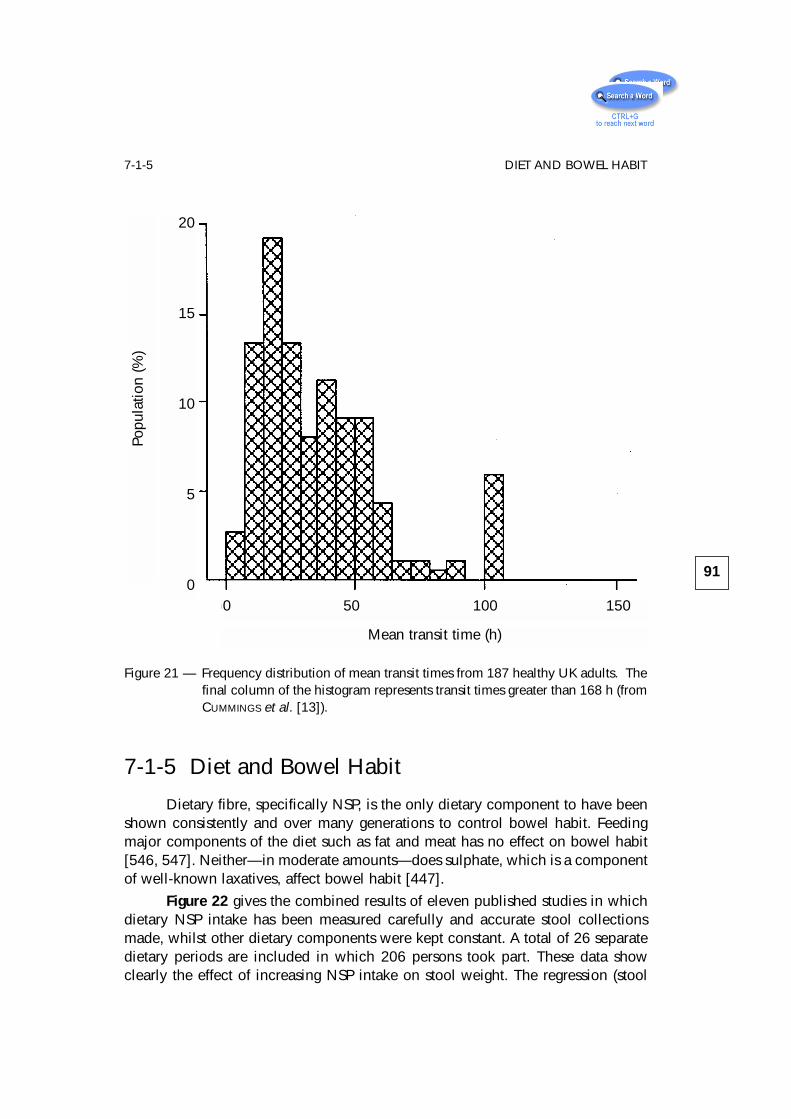
Figure 21 — Frequency distribution of mean transit times from 187 healthy UK adults. Thefinal column of the histogram represents transit times greater than 168 h (fromCUMMINGS et al. [13]).
7-1-5 Diet and Bowel Habit
Dietary fibre, specifically NSP, is the only dietary component to have beenshown consistently and over many generations to control bowel habit. Feedingmajor components of the diet such as fat and meat has no effect on bowel habit[546, 547]. Neither—in moderate amounts—does sulphate, which is a componentof well-known laxatives, affect bowel habit [447].
Figure 22 gives the combined results of eleven published studies in whichdietary NSP intake has been measured carefully and accurate stool collectionsmade, whilst other dietary components were kept constant. A total of 26 separatedietary periods are included in which 206 persons took part. These data showclearly the effect of increasing NSP intake on stool weight. The regression (stool
91
7-1-5 DIET AND BOWEL HABIT
Popu
latio
n (%
)
20
15
10
5
00 50 100 150
Mean transit time (h)
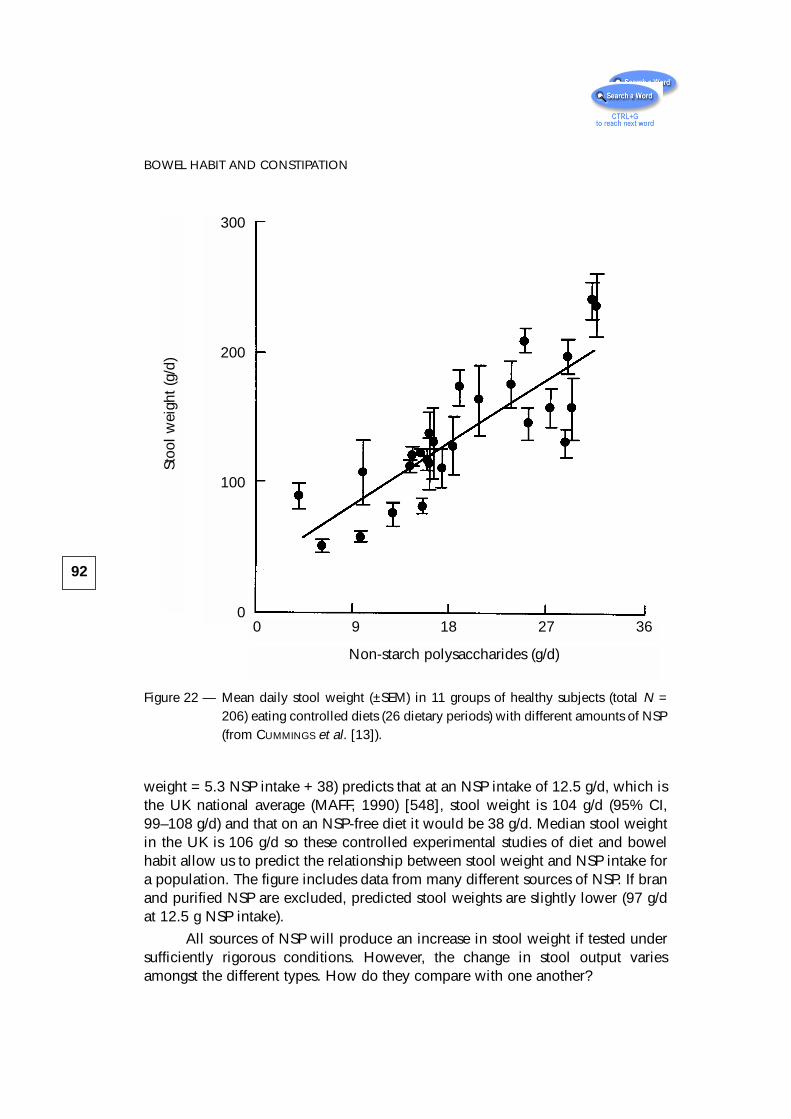
weight = 5.3 NSP intake + 38) predicts that at an NSP intake of 12.5 g/d, which isthe UK national average (MAFF, 1990) [548], stool weight is 104 g/d (95% CI,99–108 g/d) and that on an NSP-free diet it would be 38 g/d. Median stool weightin the UK is 106 g/d so these controlled experimental studies of diet and bowelhabit allow us to predict the relationship between stool weight and NSP intake fora population. The figure includes data from many different sources of NSP. If branand purified NSP are excluded, predicted stool weights are slightly lower (97 g/dat 12.5 g NSP intake).
All sources of NSP will produce an increase in stool weight if tested undersufficiently rigorous conditions. However, the change in stool output variesamongst the different types. How do they compare with one another?
92
BOWEL HABIT AND CONSTIPATION
Figure 22 — Mean daily stool weight (±SEM) in 11 groups of healthy subjects (total N =206) eating controlled diets (26 dietary periods) with different amounts of NSP(from CUMMINGS et al. [13]).
0 9 18 27 36
Stoo
l wei
ght (
g/d)
300
200
100
0
Non-starch polysaccharides (g/d)
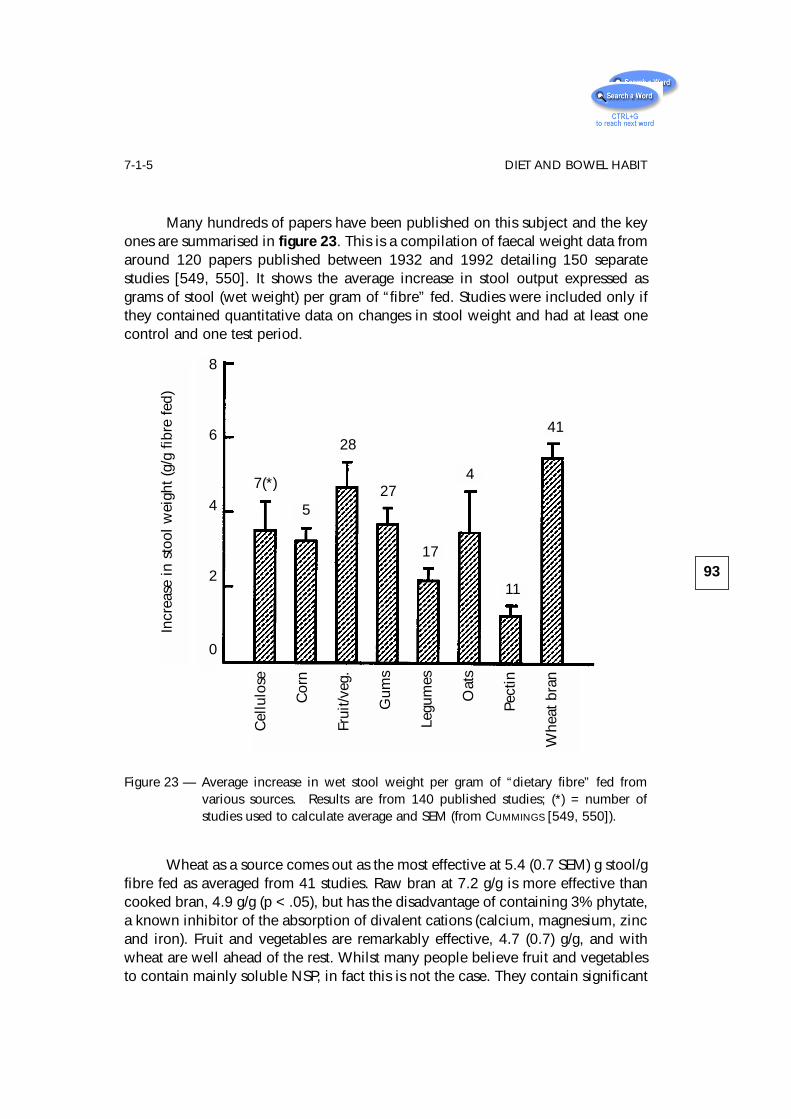
Many hundreds of papers have been published on this subject and the keyones are summarised in figure 23. This is a compilation of faecal weight data fromaround 120 papers published between 1932 and 1992 detailing 150 separatestudies [549, 550]. It shows the average increase in stool output expressed asgrams of stool (wet weight) per gram of “fibre” fed. Studies were included only ifthey contained quantitative data on changes in stool weight and had at least onecontrol and one test period.
Figure 23 — Average increase in wet stool weight per gram of “dietary fibre” fed fromvarious sources. Results are from 140 published studies; (*) = number ofstudies used to calculate average and SEM (from CUMMINGS [549, 550]).
Wheat as a source comes out as the most effective at 5.4 (0.7 SEM) g stool/gfibre fed as averaged from 41 studies. Raw bran at 7.2 g/g is more effective thancooked bran, 4.9 g/g (p < .05), but has the disadvantage of containing 3% phytate,a known inhibitor of the absorption of divalent cations (calcium, magnesium, zincand iron). Fruit and vegetables are remarkably effective, 4.7 (0.7) g/g, and withwheat are well ahead of the rest. Whilst many people believe fruit and vegetablesto contain mainly soluble NSP, in fact this is not the case. They contain significant
93
7-1-5 DIET AND BOWEL HABITIn
crea
se in
sto
ol w
eigh
t (g/
g fib
re fe
d)
8
6
4
2
0
7(*)
5
28
27
17
4
11
41
Cel
lulo
se
Cor
n
Frui
t/veg
.
Gum
s
Legu
mes
Oat
s
Pect
in
Whe
at b
ran
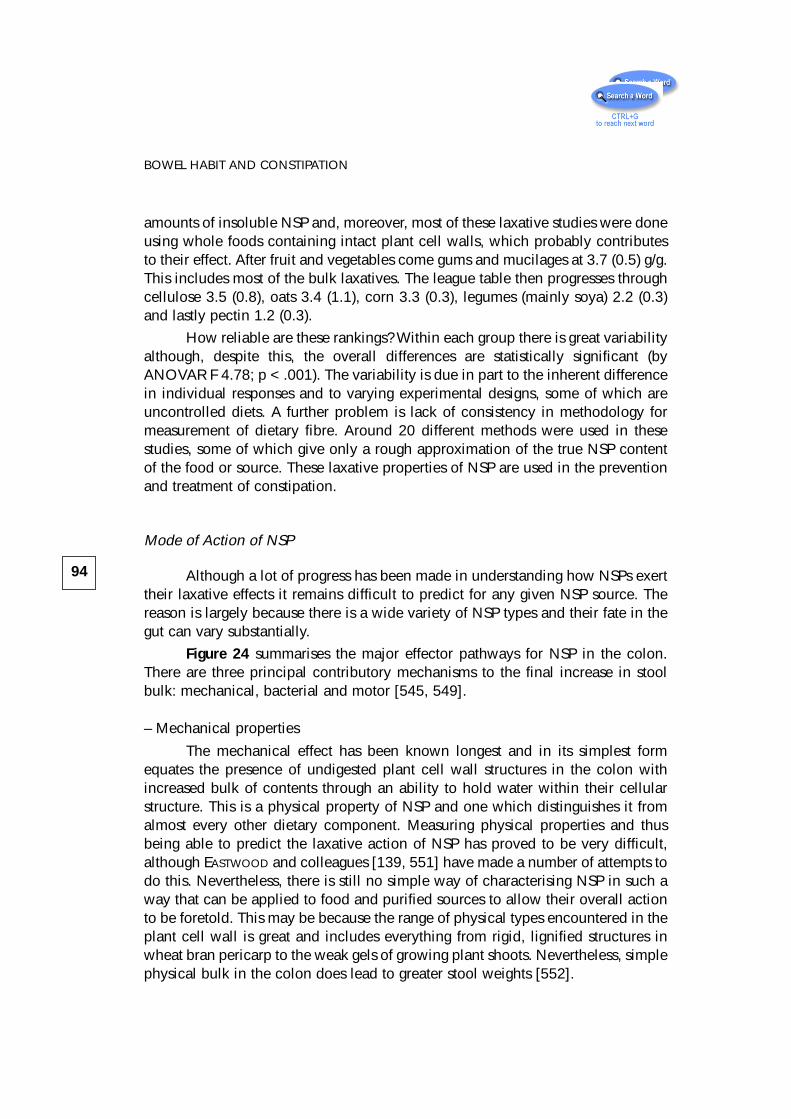
amounts of insoluble NSP and, moreover, most of these laxative studies were doneusing whole foods containing intact plant cell walls, which probably contributesto their effect. After fruit and vegetables come gums and mucilages at 3.7 (0.5) g/g.This includes most of the bulk laxatives. The league table then progresses throughcellulose 3.5 (0.8), oats 3.4 (1.1), corn 3.3 (0.3), legumes (mainly soya) 2.2 (0.3)and lastly pectin 1.2 (0.3).
How reliable are these rankings? Within each group there is great variabilityalthough, despite this, the overall differences are statistically significant (byANOVAR F 4.78; p < .001). The variability is due in part to the inherent differencein individual responses and to varying experimental designs, some of which areuncontrolled diets. A further problem is lack of consistency in methodology formeasurement of dietary fibre. Around 20 different methods were used in thesestudies, some of which give only a rough approximation of the true NSP contentof the food or source. These laxative properties of NSP are used in the preventionand treatment of constipation.
Mode of Action of NSP
Although a lot of progress has been made in understanding how NSPs exerttheir laxative effects it remains difficult to predict for any given NSP source. Thereason is largely because there is a wide variety of NSP types and their fate in thegut can vary substantially.
Figure 24 summarises the major effector pathways for NSP in the colon.There are three principal contributory mechanisms to the final increase in stoolbulk: mechanical, bacterial and motor [545, 549].
– Mechanical properties
The mechanical effect has been known longest and in its simplest formequates the presence of undigested plant cell wall structures in the colon withincreased bulk of contents through an ability to hold water within their cellularstructure. This is a physical property of NSP and one which distinguishes it fromalmost every other dietary component. Measuring physical properties and thusbeing able to predict the laxative action of NSP has proved to be very difficult,although EASTWOOD and colleagues [139, 551] have made a number of attempts todo this. Nevertheless, there is still no simple way of characterising NSP in such away that can be applied to food and purified sources to allow their overall actionto be foretold. This may be because the range of physical types encountered in theplant cell wall is great and includes everything from rigid, lignified structures inwheat bran pericarp to the weak gels of growing plant shoots. Nevertheless, simplephysical bulk in the colon does lead to greater stool weights [552].
94
BOWEL HABIT AND CONSTIPATION
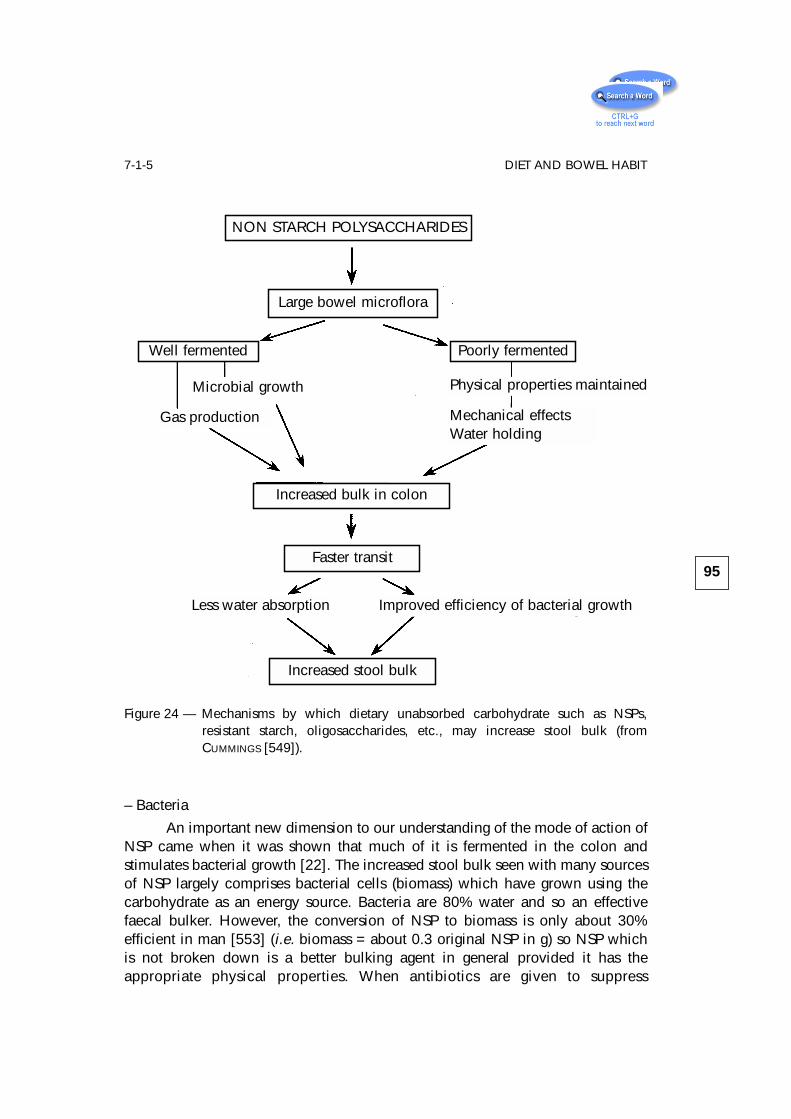
– Bacteria
An important new dimension to our understanding of the mode of action ofNSP came when it was shown that much of it is fermented in the colon andstimulates bacterial growth [22]. The increased stool bulk seen with many sourcesof NSP largely comprises bacterial cells (biomass) which have grown using thecarbohydrate as an energy source. Bacteria are 80% water and so an effectivefaecal bulker. However, the conversion of NSP to biomass is only about 30%efficient in man [553] (i.e. biomass = about 0.3 original NSP in g) so NSP whichis not broken down is a better bulking agent in general provided it has theappropriate physical properties. When antibiotics are given to suppress
95
7-1-5 DIET AND BOWEL HABIT
Figure 24 — Mechanisms by which dietary unabsorbed carbohydrate such as NSPs,resistant starch, oligosaccharides, etc., may increase stool bulk (fromCUMMINGS [549]).
NON STARCH POLYSACCHARIDES
Large bowel microflora
Increased bulk in colon
Faster transit
Increased stool bulk
Poorly fermentedWell fermented
Physical properties maintained
Mechanical effectsWater holding
Microbial growth
Gas production
Less water absorption Improved efficiency of bacterial growth
fermentation, and presumably bacterial growth, faecal NSP excretion (measured asneutral detergent fibre) rises and so does faecal bulk [554].
Many sources of NSP are only partly fermented, and others are fermented atdifferent rates. Attempts to relate this to faecal bulking properties have been madewith some success. Rapidly fermented NSPs, such as pectin and guar, seem to bepoor laxative agents, whilst more slowly and incompletely fermented sources,such as ispaghula, are better [551, 555–557]. In general it is accepted thatinsoluble NSP, usually from grains and seeds, is better at faecal bulking thansoluble NSP from other sources.
Bacterial fermentation also produces gas which may contribute to faecalbulk.
– Motor effects
The third important controlling factor in the faecal bulking effect of NSP inman is motor activity or transit. Increased bulk of gut contents stimulates fastertransit, which in turn will reduce the desiccation of stool. Equally importantly,faster transit improves the yield of biomass from carbohydrate because of reducedrequirements for maintenance energy by bacteria [558, 559]. Thus faster transitleads to greater stool weight—a relationship established in many studies [203].
Dangers of NSP
The dangers of eating fibre are few. Because fibre is fermented in the colon,gas is produced and therefore patients who increase their fibre intake too quicklywill experience abdominal distension, bloating, pain and increased flatus. A slowbuild-up in dose allows the bacteria and gut to adjust. Other complications of fibretherapy, such as intestinal obstruction and mineral malabsorption, are largelytheoretical. However, because of the phytic acid content of raw bran and All Bran,these products should be used with caution in patients whose mineral balancemay be precarious such as those who are young, elderly, or pregnant [560]. Highfibre diets (and bulk laxatives) are not suitable for the treatment of constipation dueto neurological disorders or obstructive lesions of the gut and are ineffective in themore severe forms of constipation associated with disordered defaecatory reflexes,very slow transit and where there is immobility and faecal impaction in the elderly.
96
BOWEL HABIT AND CONSTIPATION
7-2 ConstipationConstipation is a disorder of motor activity of the large bowel. For more
detailed information, any of a number of recent reviews should be consulted [6,561–563]. Although traditionally defined in terms of bowel regularity, stoolconsistency and weight, in practice the main symptom in constipation is strainingon defaecation. In addition, abdominal discomfort, distension and incompleterectal emptying are all considered part of the condition [528, 564, 565].Constipation may present as a very infrequent bowel habit, some patients passinga stool only weekly or even monthly. When people are questioned about theirbowel habit, however, a number will complain of constipation but neverthelesspass a stool daily [528, 564, 566]. Stool frequency is thus not an infallible guideto the diagnosis of constipation. Clinically, a change in bowel habit is equally asimportant as defining defaecation pattern frequency.
Despite the belief that constipation is characterised by low stool weight(among other criteria), stool collections are seldom made in constipated subjects.In a meta analysis of data from eight groups of subjects who complained ofconstipation, mean daily stool weight for the whole series (n = 209) is 48.6 g/d[549]. As some of these subjects, chosen from various clinical trials, probablyrepresent the more extreme end of the spectrum of constipation, the true meanmay be higher. Thus, stool weight in constipation is low, but the range overlapssubstantially with what is generally regarded as normal. It is not surprising,therefore, that constipation is a common complaint in many countries.
Total gut transit time is prolonged in many patients with constipation [530,567]. Absolute values are not readily available, however, because the manytechniques using radio-opaque pellets adopt widely differing criteria for arriving ata transit time value. Thus, the dividing point between normal and constipatedwhole gut transit times, reported as between 67 and 120 h, is dependent on themethod of measurement and the population studied [540, 568, 569]. Anotherdifficulty in setting a dividing line between normality and constipation is that manyconstipated patients have transit times well within the normal range, whatevermethod is chosen [570, 571]; a safe cut-off point is probably 120 h.
Studies of transit through the major regions of the large intestine haveproved useful in distinguishing different types of constipation. Several patternshave been described, including generalised slowing throughout the whole colon(colonic inertia, slow transit constipation) seen in young women and in responseto drugs or systemic disease [572]. Right-sided slowing is most often seen inulcerative colitis [573] and in some lesions of the central nervous system [574].Delay on the left side or in the rectosigmoid region is associated with disorders ofdefaecation and has been called “outlet obstruction” [571, 575, 576].
97
7-2 CONSTIPATION
7-2--1 Constipation and Diet
An inappropriate diet is one of the major causes of constipation and diet isthe first therapy to initiate in new cases which do not have another treatable cause.Diets which lead to constipation include: those characteristic of Western culture(i.e. low NSP), diets in old age where food intake is reduced (and activity also),therapeutic diets such as those for slimmers, gluten-free diets, traditional diabeticdiets, and “low residue” diets, the diets of those suffering from anorexia nervosaand bulimia, diets eaten during travel and on holiday, and enteral/parenteralfeeding regimes.
NSPs are the major dietary component to affect bowel habit, so how muchis required to treat constipation? Intakes in the UK are around 12–13 g/d[577–582], although in some populations [583] intakes are higher, as they are invegetarians.
In constipation there is no universal dose of NSP. The amount required isthat which will produce a satisfactory bowel habit, usually one soft stool daily, oron alternate days. The aim should be to increase the patient’s intake of NSP up to24 g/d. Those who fail to respond to larger doses should be looked at carefully fororganic causes of constipation. Simple dietary constipation usually responds toquite modest increases in fibre intake.
Dietary NSP intake can be increased by:
– increasing bread intake to about 200 g (six slices) per day and changing to100% wholemeal;
– eating a wholewheat or rye based breakfast cereal such as Shredded Wheat,Weetabix, rye or bran flakes;
– increasing fruit and vegetable intake;
– eating more legumes such as peas, beans and lentils;
– if necessary, an occasional dose of a concentrated fibre food such as bran andAll Bran, although there are some disadvantages here.
7-2-2 Bulk Laxatives
In addition to diet, bulk laxatives are a useful adjunct to the treatment ofconstipation. Bulk laxatives are very concentrated sources of NSP but how goodare they at altering bowel habit?
Three out of the four most commonly used sources are not plant cell wallmaterial. Ispaghula and sterculia are two chemically contrasting polysaccharides.Ispaghula is a seed mucilage from the Plantago family and is mainly a watersoluble arabinoxylan [551, 555, 584, 585]. Sterculia, a plant gum, is also water
98
BOWEL HABIT AND CONSTIPATION
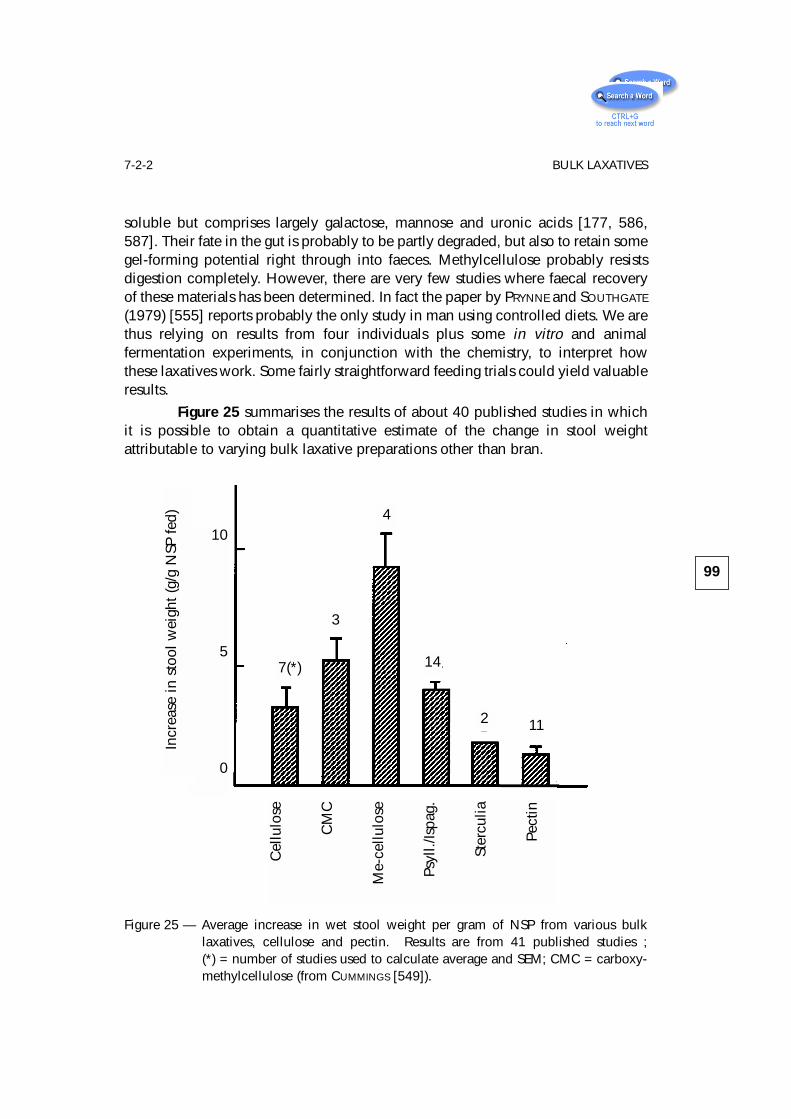
soluble but comprises largely galactose, mannose and uronic acids [177, 586,587]. Their fate in the gut is probably to be partly degraded, but also to retain somegel-forming potential right through into faeces. Methylcellulose probably resistsdigestion completely. However, there are very few studies where faecal recoveryof these materials has been determined. In fact the paper by PRYNNE and SOUTHGATE
(1979) [555] reports probably the only study in man using controlled diets. We arethus relying on results from four individuals plus some in vitro and animalfermentation experiments, in conjunction with the chemistry, to interpret howthese laxatives work. Some fairly straightforward feeding trials could yield valuableresults.
Figure 25 summarises the results of about 40 published studies in whichit is possible to obtain a quantitative estimate of the change in stool weightattributable to varying bulk laxative preparations other than bran.
99
7-2-2 BULK LAXATIVES
Figure 25 — Average increase in wet stool weight per gram of NSP from various bulklaxatives, cellulose and pectin. Results are from 41 published studies ;(*) = number of studies used to calculate average and SEM; CMC = carboxy-methylcellulose (from CUMMINGS [549]).
10
5
0
Incr
ease
in s
tool
wei
ght (
g/g
NSP
fed)
7(*)
3
4
14
2 11
Cel
lulo
se
CM
C
Me-
cellu
lose
Psyl
l./Is
pag.
Ster
culia
Pect
in
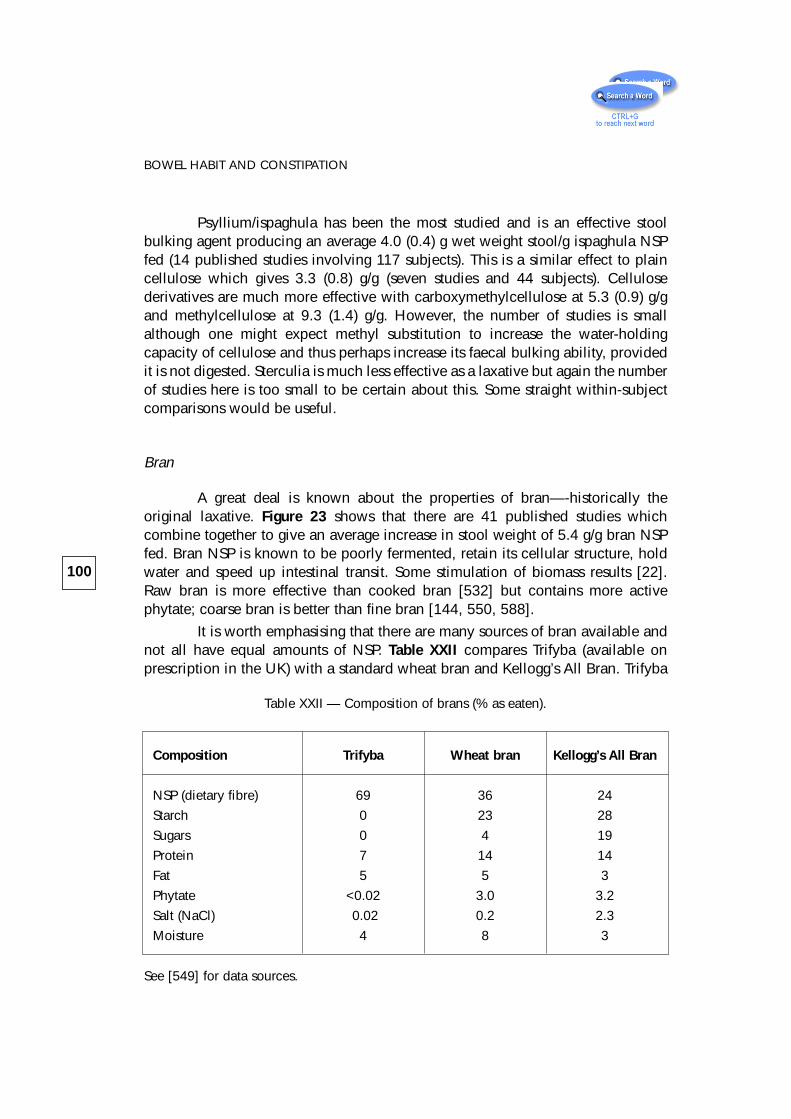
Psyllium/ispaghula has been the most studied and is an effective stoolbulking agent producing an average 4.0 (0.4) g wet weight stool/g ispaghula NSPfed (14 published studies involving 117 subjects). This is a similar effect to plaincellulose which gives 3.3 (0.8) g/g (seven studies and 44 subjects). Cellulosederivatives are much more effective with carboxymethylcellulose at 5.3 (0.9) g/gand methylcellulose at 9.3 (1.4) g/g. However, the number of studies is smallalthough one might expect methyl substitution to increase the water-holdingcapacity of cellulose and thus perhaps increase its faecal bulking ability, providedit is not digested. Sterculia is much less effective as a laxative but again the numberof studies here is too small to be certain about this. Some straight within-subjectcomparisons would be useful.
Bran
A great deal is known about the properties of bran—-historically theoriginal laxative. Figure 23 shows that there are 41 published studies whichcombine together to give an average increase in stool weight of 5.4 g/g bran NSPfed. Bran NSP is known to be poorly fermented, retain its cellular structure, holdwater and speed up intestinal transit. Some stimulation of biomass results [22].Raw bran is more effective than cooked bran [532] but contains more activephytate; coarse bran is better than fine bran [144, 550, 588].
It is worth emphasising that there are many sources of bran available andnot all have equal amounts of NSP. Table XXII compares Trifyba (available onprescription in the UK) with a standard wheat bran and Kellogg’s All Bran. Trifyba
100
BOWEL HABIT AND CONSTIPATION
Table XXII — Composition of brans (% as eaten).
Composition Trifyba Wheat bran Kellogg’s All Bran
NSP (dietary fibre) 69 36 24
Starch 0 23 28
Sugars 0 4 19
Protein 7 14 14
Fat 5 5 3
Phytate <0.02 3.0 3.2
Salt (NaCl) 0.02 0.2 2.3
Moisture 4 8 3
See [549] for data sources.
is a useful addition to the formulary because it has a high NSP content (three timesthat of Kellogg’s bran) and is virtually phytate free. All Bran contains nearly 20%sugars and is one of the highest sources of phytate in the diet. Presently there arefew published studies of the efficacy of Trifyba. Some direct comparisons with theother bulk laxatives would be useful.
7-2-3 Other Laxative Dietary Constituents
Finally it is worth noting that NSPs are not the only part of the diet to havelaxative properties.
There are of course specific laxative substances present in foods such asprunes (diphenylisatin) and sulphate ion is cathartic if taken in sufficient amounts.However, the diet also contains other carbohydrates which escape digestion in thesmall bowel, and are fermented in the colon. The principal types are resistantstarch, which is laxative in man (see chapter 3) and oligosaccharides such asfructooligosaccharides found in onions, leeks, garlic and chicory [52],polydextrose and of course the non-absorbable disaccharides lactulose andlactitol.
101
7-2-3 OTHER LAXATIVE DIETARY CONSTITUENTS

8 – Diet and Large BowelCancer
8-1 IntroductionLarge bowel cancer is one of the commonest causes of cancer death in
Western countries. In areas where previously there was a low incidence, such asJapan, rates are beginning to rise as the traditional Japanese diet changes towardsa more Western type. Large bowel cancer is, above all other cancers, the one forwhich there is most evidence of diet being involved in its cause and also in itsprevention. Furthermore, the genetic abnormalities associated with these tumoursare better defined than for many of the other common cancers and thus it offersone of the greatest hopes for a public health prevention strategy through dietarymodification.
In England and Wales in 1992, colorectal cancer was responsible for 11.6%of all cancer deaths (8,749) in men and 12.6% in women (8,654). In men it wasthe second commonest cause of cancer death after lung and third commonest afterbreast and lung in women (Table XXIII).
In many European countries the data are similar (see IARC Cancer Incidencein Five Continents 1992) [590]. For example, in Maastricht—a region close to theborders of Belgium—between 1986 and 1988, colorectal cancer was secondcommonest in both men and women, being 13.4% and 16.4% of incidencerespectively (Table XXIV). Across Europe the major causes of cancer death arelung, colorectal, breast, prostate and stomach, with lymphoma, bladder, uterus,ovary, pancreas and kidney somewhat further behind. Three out of five of thesemajor cancers are related to diet. Outside Europe, the pattern is very similar inNorth America but in countries such as China oesophageal cancer is commonwhilst in Africa cancer of the liver and cervix, together with the oesophagus, aremore prevalent.
In England and Wales between 1979 and 1992 total cancer deaths fromprostate rose very substantially, breast modestly and colorectal slightly, whilstgastric cancer declined. Gastric cancer rates are declining all over the world inconjunction, it is felt, with reduced salt intake and intakes of preserved foods. Allthis is largely due to better refrigeration and means of transporting and storingfoods.
Trends in cancer incidence in Europe are shown in table XXV.
103
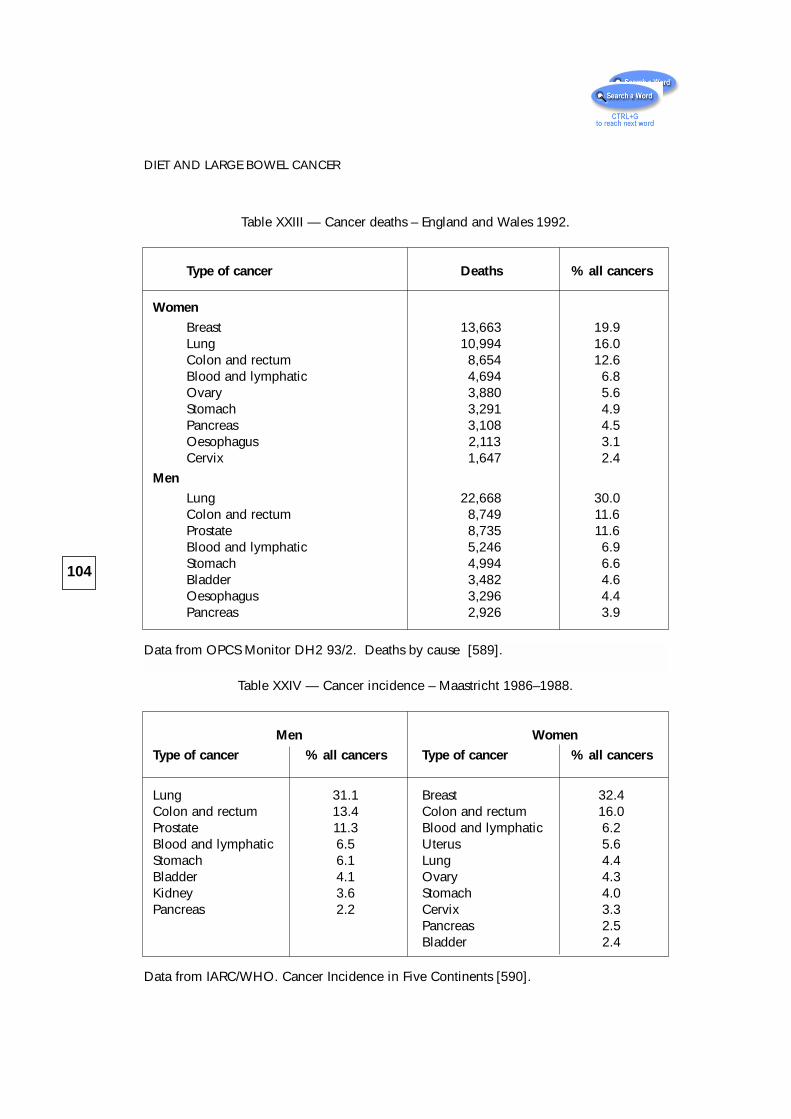
104
DIET AND LARGE BOWEL CANCER
Table XXIII — Cancer deaths – England and Wales 1992.
Type of cancer Deaths % all cancers
Women
Breast 13,663 19.9Lung 10,994 16.0Colon and rectum 8,654 12.6Blood and lymphatic 4,694 6.8Ovary 3,880 5.6Stomach 3,291 4.9Pancreas 3,108 4.5Oesophagus 2,113 3.1Cervix 1,647 2.4
Men
Lung 22,668 30.0Colon and rectum 8,749 11.6Prostate 8,735 11.6Blood and lymphatic 5,246 6.9Stomach 4,994 6.6Bladder 3,482 4.6Oesophagus 3,296 4.4Pancreas 2,926 3.9
Table XXIV — Cancer incidence – Maastricht 1986–1988.
Men Women
Type of cancer % all cancers Type of cancer % all cancers
Lung 31.1 Breast 32.4Colon and rectum 13.4 Colon and rectum 16.0Prostate 11.3 Blood and lymphatic 6.2Blood and lymphatic 6.5 Uterus 5.6Stomach 6.1 Lung 4.4Bladder 4.1 Ovary 4.3Kidney 3.6 Stomach 4.0Pancreas 2.2 Cervix 3.3
Pancreas 2.5Bladder 2.4
Data from OPCS Monitor DH2 93/2. Deaths by cause [589].
Data from IARC/WHO. Cancer Incidence in Five Continents [590].
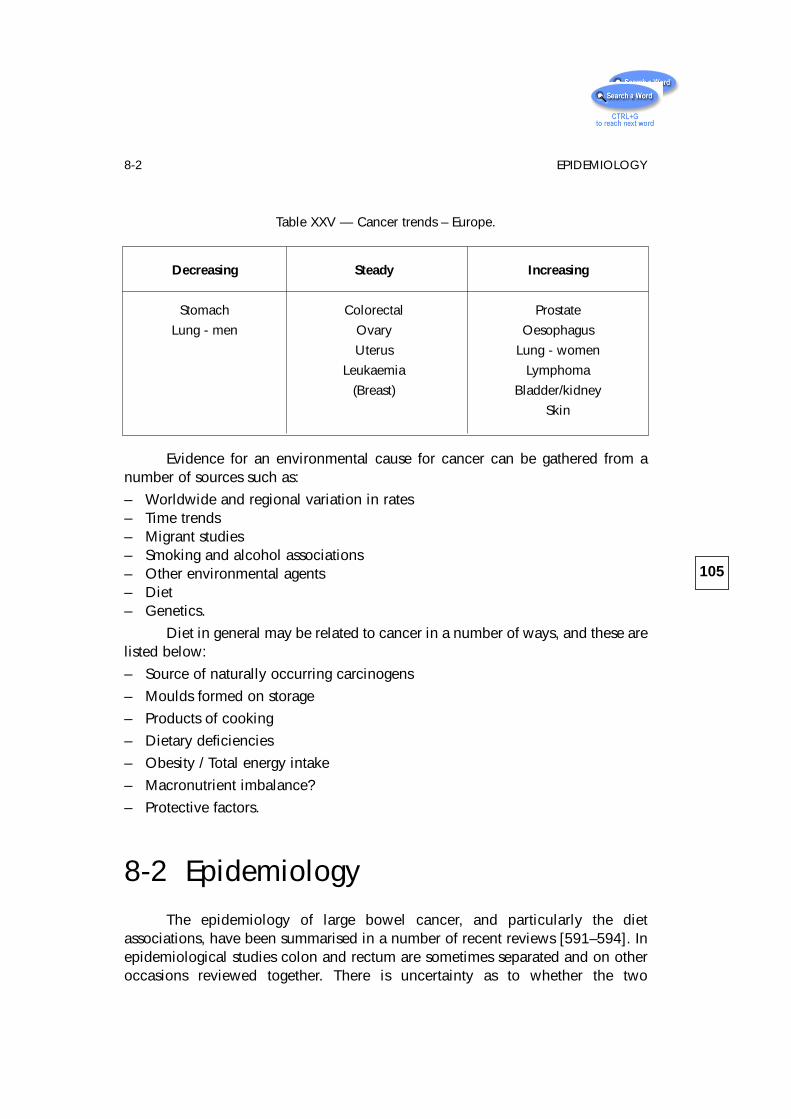
Evidence for an environmental cause for cancer can be gathered from anumber of sources such as:
– Worldwide and regional variation in rates– Time trends– Migrant studies– Smoking and alcohol associations– Other environmental agents– Diet– Genetics.
Diet in general may be related to cancer in a number of ways, and these arelisted below:
– Source of naturally occurring carcinogens
– Moulds formed on storage
– Products of cooking
– Dietary deficiencies
– Obesity / Total energy intake
– Macronutrient imbalance?
– Protective factors.
8-2 EpidemiologyThe epidemiology of large bowel cancer, and particularly the diet
associations, have been summarised in a number of recent reviews [591–594]. Inepidemiological studies colon and rectum are sometimes separated and on otheroccasions reviewed together. There is uncertainty as to whether the two
105
8-2 EPIDEMIOLOGY
Table XXV — Cancer trends – Europe.
Decreasing Steady Increasing
Stomach Colorectal Prostate
Lung - men Ovary Oesophagus
Uterus Lung - women
Leukaemia Lymphoma
(Breast) Bladder/kidney
Skin
anatomical locations have different etiologies. It is likely they share a number ofcommon causes but there seem to be differences in the patterns of distribution ofcolon and rectum amongst populations and also between the sexes. For example,rectosigmoid tumours are commoner in Western industrialised nations whereas incountries with low rates of colorectal cancer right sided colonic lesions tend to bemore common. There is also the suggestion that rectal cancer is more stronglyassociated with alcohol consumption, particularly beer drinking [595, 596].
The principal dietary associations with large bowel cancer are fat and meat,which increase risk, and with cereal foods and fruit and vegetables, which reducerisk. The results of case control studies, of which more than 50 have beenpublished for colorectal cancer, are less consistent, possibly because of themethodological problems with these studies. The majority, however, show anincreased risk for meat consumption with possibly a particular assocation with redmeat and not with fish and seafood. Dairy products and eggs show no clear riskbut vegetables and fruit are consistently protective. With regard to dietary fibre,intakes tend to be lower in populations with increased risk of bowel cancer butfibre intake data are notoriously unreliable and poorly obtained [597]. If starchintakes were to be taken into account in addition [199] then the picture mightbecome much clearer. In BINGHAM’s (1990) [597] review of over 30 case controlstudies looking at dietary fibre intakes and colorectal cancer, there was aprotective effect although this was most especially associated with fruit andvegetable consumption. An increasingly observed association with colorectalcancer is that of energy intake and body weight. Increased energy and overweightseem to be associated with increased risk. Conversely, studies of physical activitysuggest it may be protective [598–600].
8-3 GeneticsThe publication in 1986 by HERRERA et al. [601] of a case report in which a
deletion in the long arm of chromosome 5 was associated with multiple intestinalpolyps, mental abnormality and large bowel cancer, led to an intensive search forgenetic abnormalities in this tumour. Since then a number of exciting discoverieshave been made, particularly by BODMER et al. [602] and VOGELSTEIN’s group[603–605], such that there are now a number of well established chromosomeabnormalities found in this condition (Table XXVI). The role of many of these genesis becoming clear and, not surprisingly, they are mostly involved with the controlof cell growth, differentiation and DNA repair. Perhaps, equally importantly, whathas emerged from the genetic studies is that a single gene defect does not lead tolarge bowel cancer although the 5q21 abnormality found in familial adenomatous
106
DIET AND LARGE BOWEL CANCER
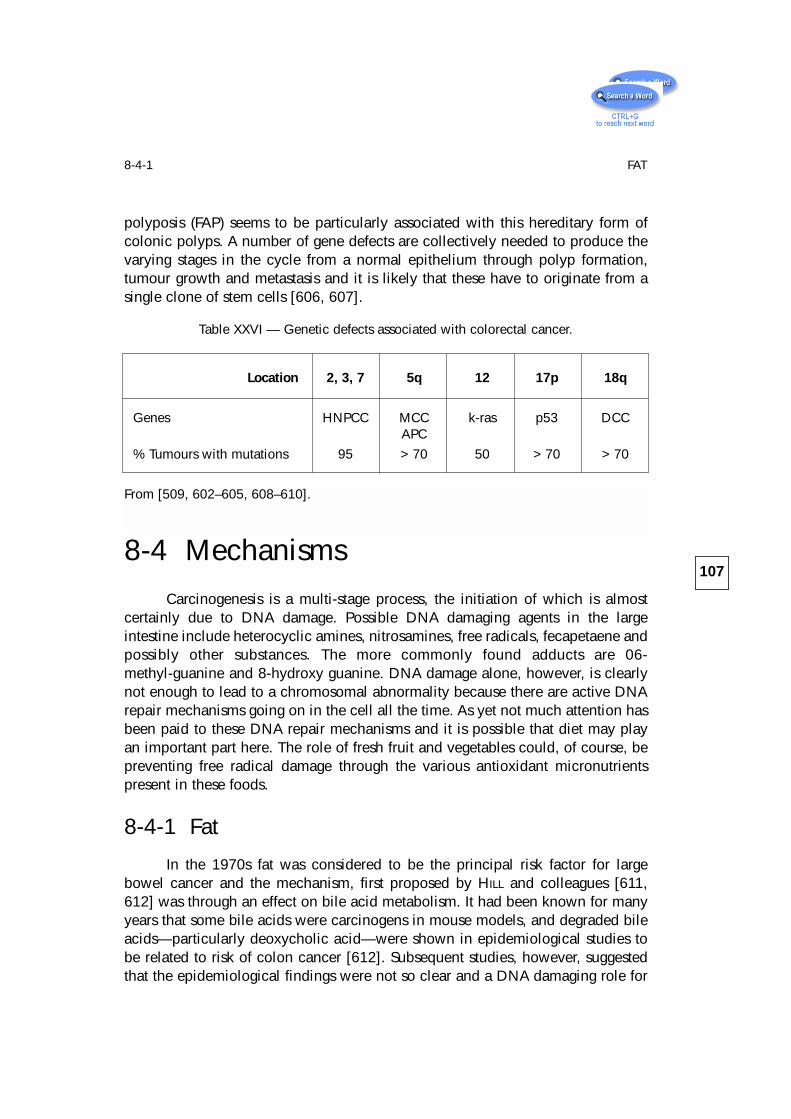
polyposis (FAP) seems to be particularly associated with this hereditary form ofcolonic polyps. A number of gene defects are collectively needed to produce thevarying stages in the cycle from a normal epithelium through polyp formation,tumour growth and metastasis and it is likely that these have to originate from asingle clone of stem cells [606, 607].
8-4 MechanismsCarcinogenesis is a multi-stage process, the initiation of which is almost
certainly due to DNA damage. Possible DNA damaging agents in the largeintestine include heterocyclic amines, nitrosamines, free radicals, fecapetaene andpossibly other substances. The more commonly found adducts are 06-methyl-guanine and 8-hydroxy guanine. DNA damage alone, however, is clearlynot enough to lead to a chromosomal abnormality because there are active DNArepair mechanisms going on in the cell all the time. As yet not much attention hasbeen paid to these DNA repair mechanisms and it is possible that diet may playan important part here. The role of fresh fruit and vegetables could, of course, bepreventing free radical damage through the various antioxidant micronutrientspresent in these foods.
8-4-1 Fat
In the 1970s fat was considered to be the principal risk factor for largebowel cancer and the mechanism, first proposed by HILL and colleagues [611,612] was through an effect on bile acid metabolism. It had been known for manyyears that some bile acids were carcinogens in mouse models, and degraded bileacids—particularly deoxycholic acid—were shown in epidemiological studies tobe related to risk of colon cancer [612]. Subsequent studies, however, suggestedthat the epidemiological findings were not so clear and a DNA damaging role for
107
8-4-1 FAT
Table XXVI — Genetic defects associated with colorectal cancer.
Location 2, 3, 7 5q 12 17p 18q
Genes HNPCC MCC k-ras p53 DCCAPC
% Tumours with mutations 95 > 70 50 > 70 > 70
From [509, 602–605, 608–610].
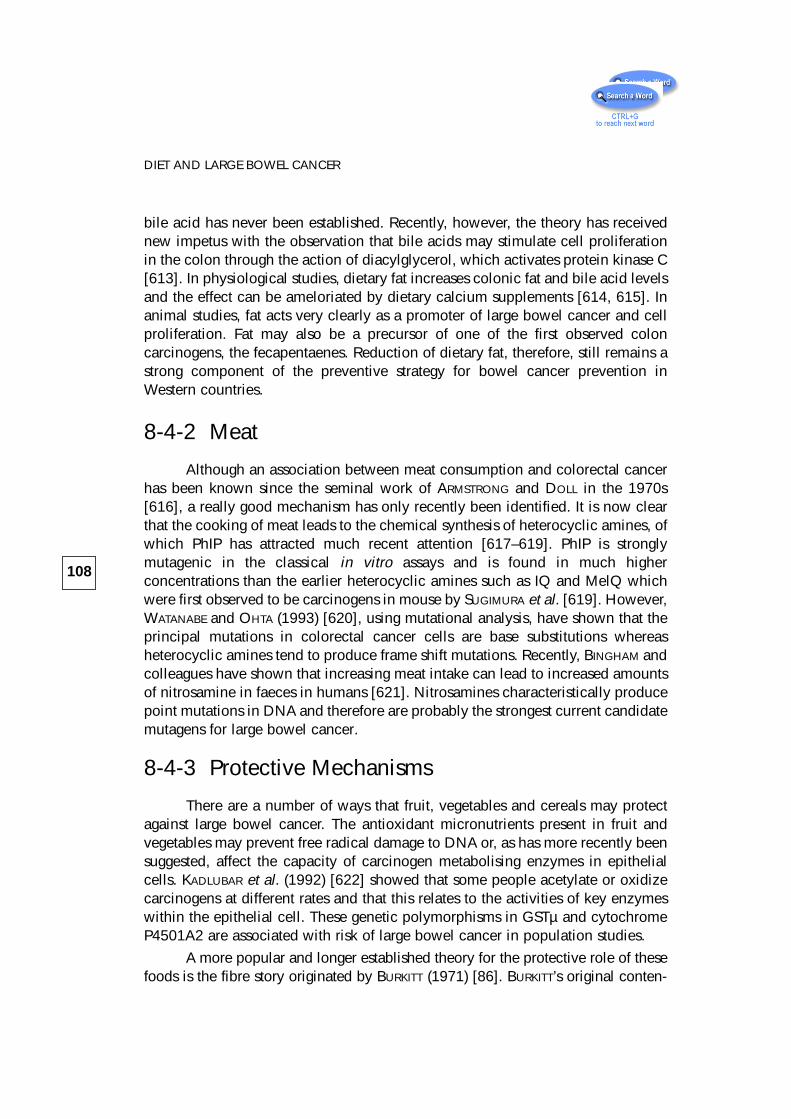
bile acid has never been established. Recently, however, the theory has receivednew impetus with the observation that bile acids may stimulate cell proliferationin the colon through the action of diacylglycerol, which activates protein kinase C[613]. In physiological studies, dietary fat increases colonic fat and bile acid levelsand the effect can be ameloriated by dietary calcium supplements [614, 615]. Inanimal studies, fat acts very clearly as a promoter of large bowel cancer and cellproliferation. Fat may also be a precursor of one of the first observed coloncarcinogens, the fecapentaenes. Reduction of dietary fat, therefore, still remains astrong component of the preventive strategy for bowel cancer prevention inWestern countries.
8-4-2 Meat
Although an association between meat consumption and colorectal cancerhas been known since the seminal work of ARMSTRONG and DOLL in the 1970s[616], a really good mechanism has only recently been identified. It is now clearthat the cooking of meat leads to the chemical synthesis of heterocyclic amines, ofwhich PhIP has attracted much recent attention [617–619]. PhIP is stronglymutagenic in the classical in vitro assays and is found in much higherconcentrations than the earlier heterocyclic amines such as IQ and MelQ whichwere first observed to be carcinogens in mouse by SUGIMURA et al. [619]. However,WATANABE and OHTA (1993) [620], using mutational analysis, have shown that theprincipal mutations in colorectal cancer cells are base substitutions whereasheterocyclic amines tend to produce frame shift mutations. Recently, BINGHAM andcolleagues have shown that increasing meat intake can lead to increased amountsof nitrosamine in faeces in humans [621]. Nitrosamines characteristically producepoint mutations in DNA and therefore are probably the strongest current candidatemutagens for large bowel cancer.
8-4-3 Protective Mechanisms
There are a number of ways that fruit, vegetables and cereals may protectagainst large bowel cancer. The antioxidant micronutrients present in fruit andvegetables may prevent free radical damage to DNA or, as has more recently beensuggested, affect the capacity of carcinogen metabolising enzymes in epithelialcells. KADLUBAR et al. (1992) [622] showed that some people acetylate or oxidizecarcinogens at different rates and that this relates to the activities of key enzymeswithin the epithelial cell. These genetic polymorphisms in GSTµ and cytochromeP4501A2 are associated with risk of large bowel cancer in population studies.
A more popular and longer established theory for the protective role of thesefoods is the fibre story originated by BURKITT (1971) [86]. BURKITT’s original conten-
108
DIET AND LARGE BOWEL CANCER
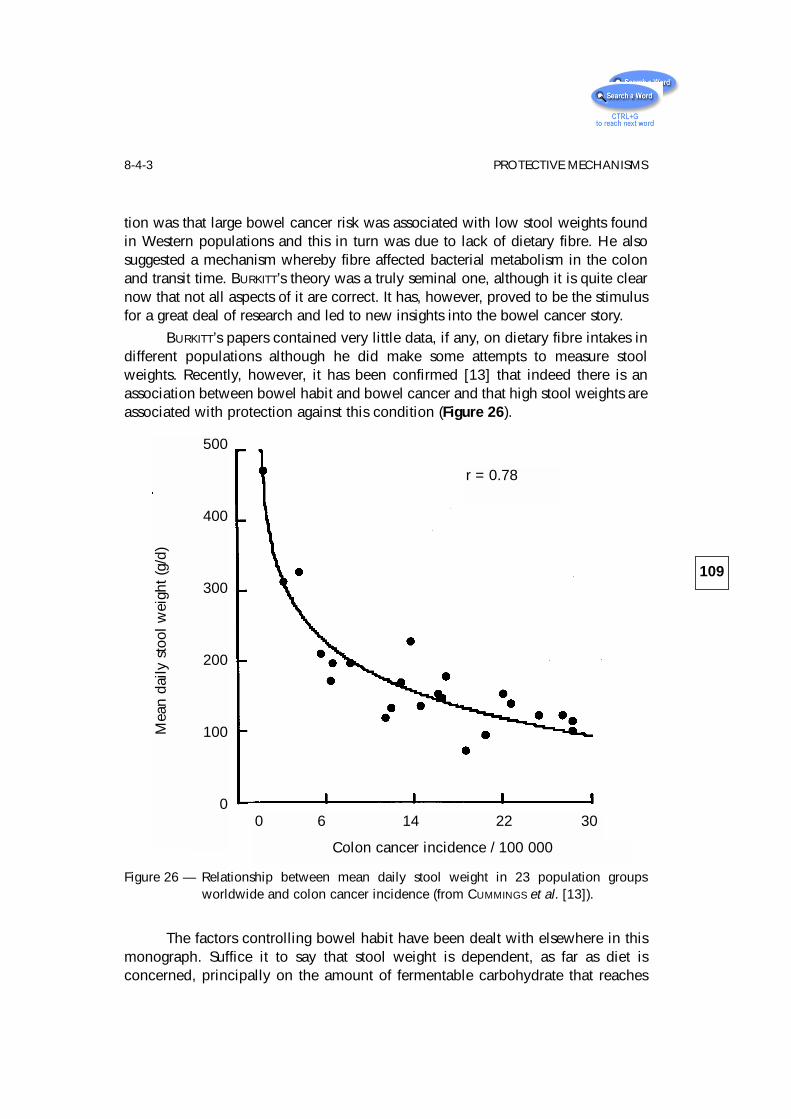
tion was that large bowel cancer risk was associated with low stool weights foundin Western populations and this in turn was due to lack of dietary fibre. He alsosuggested a mechanism whereby fibre affected bacterial metabolism in the colonand transit time. BURKITT’s theory was a truly seminal one, although it is quite clearnow that not all aspects of it are correct. It has, however, proved to be the stimulusfor a great deal of research and led to new insights into the bowel cancer story.
BURKITT’s papers contained very little data, if any, on dietary fibre intakes indifferent populations although he did make some attempts to measure stoolweights. Recently, however, it has been confirmed [13] that indeed there is anassociation between bowel habit and bowel cancer and that high stool weights areassociated with protection against this condition (Figure 26).
Figure 26 — Relationship between mean daily stool weight in 23 population groupsworldwide and colon cancer incidence (from CUMMINGS et al. [13]).
The factors controlling bowel habit have been dealt with elsewhere in thismonograph. Suffice it to say that stool weight is dependent, as far as diet isconcerned, principally on the amount of fermentable carbohydrate that reaches
109
8-4-3 PROTECTIVE MECHANISMS
500
400
300
200
100
00 6 14 22 30
Colon cancer incidence / 100 000
Mea
n da
ily s
tool
wei
ght (
g/d)
r = 0.78
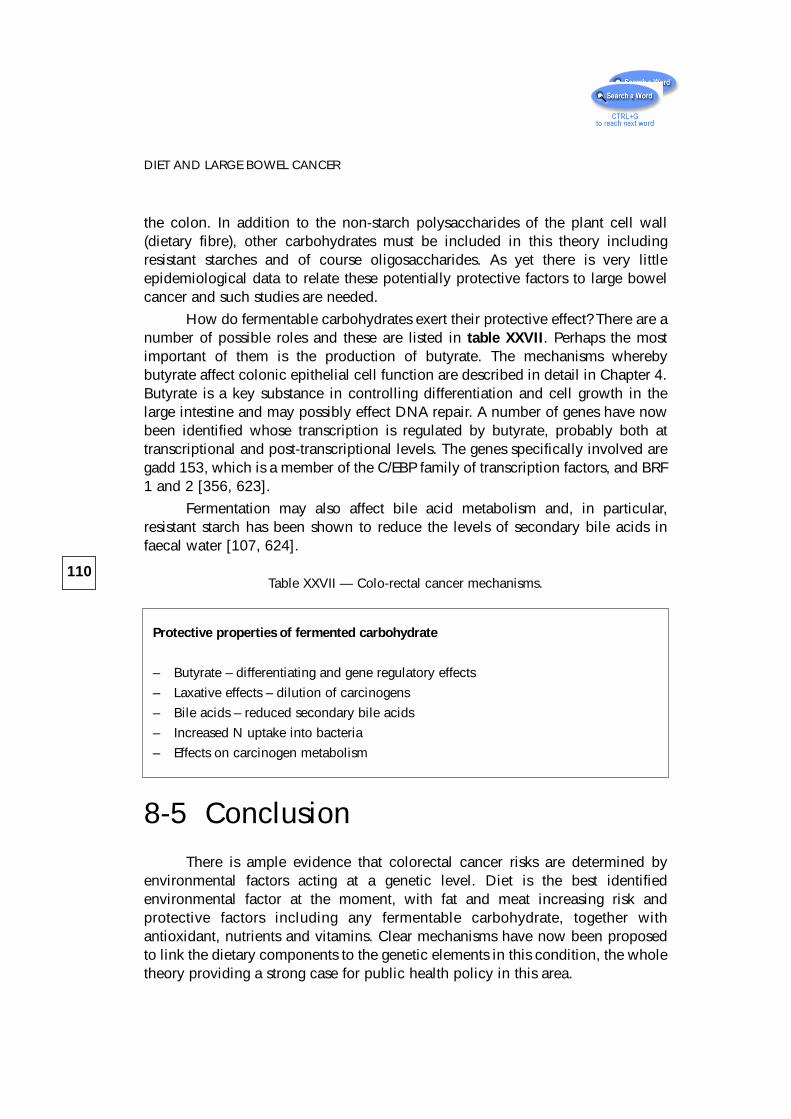
the colon. In addition to the non-starch polysaccharides of the plant cell wall(dietary fibre), other carbohydrates must be included in this theory includingresistant starches and of course oligosaccharides. As yet there is very littleepidemiological data to relate these potentially protective factors to large bowelcancer and such studies are needed.
How do fermentable carbohydrates exert their protective effect? There are anumber of possible roles and these are listed in table XXVII. Perhaps the mostimportant of them is the production of butyrate. The mechanisms wherebybutyrate affect colonic epithelial cell function are described in detail in Chapter 4.Butyrate is a key substance in controlling differentiation and cell growth in thelarge intestine and may possibly effect DNA repair. A number of genes have nowbeen identified whose transcription is regulated by butyrate, probably both attranscriptional and post-transcriptional levels. The genes specifically involved aregadd 153, which is a member of the C/EBP family of transcription factors, and BRF1 and 2 [356, 623].
Fermentation may also affect bile acid metabolism and, in particular,resistant starch has been shown to reduce the levels of secondary bile acids infaecal water [107, 624].
8-5 ConclusionThere is ample evidence that colorectal cancer risks are determined by
environmental factors acting at a genetic level. Diet is the best identifiedenvironmental factor at the moment, with fat and meat increasing risk andprotective factors including any fermentable carbohydrate, together withantioxidant, nutrients and vitamins. Clear mechanisms have now been proposedto link the dietary components to the genetic elements in this condition, the wholetheory providing a strong case for public health policy in this area.
110
DIET AND LARGE BOWEL CANCER
Table XXVII — Colo-rectal cancer mechanisms.
Protective properties of fermented carbohydrate
– Butyrate – differentiating and gene regulatory effects
– Laxative effects – dilution of carcinogens
– Bile acids – reduced secondary bile acids
– Increased N uptake into bacteria
– Effects on carcinogen metabolism
References
1 HUNGATE R.E., PHILLIPS G.D., MCGREGOR A., HUNGATE D.O., BUECHNER H.K. Microbialfermentation in certain mammals. Science 1959;130:1192-1194.
2 CUMMINGS J.H., BANWELL J.G., SEGAL I., COLEMAN N., ENGLYST H.N., MACFARLANE G.T.The amount and composition of large bowel contents in man. Gastroenterology1990;98:A408.
3 CUMMINGS J.H. Fermentation in the human large intestine: evidence and implicationsfor health. Lancet 1983;1:1206-1209.
4 CUMMINGS J.H., MACFARLANE G.T. The control and consequences of bacterialfermentation in the human colon. J. Appl. Bacteriol. 1991;70:443-459.
5 MCNEIL N.I. The contribution of the large intestine to energy supplies in man. Am. J.Clin. Nutr. 1984;39:338-342.
6 PHILLIPS S.F., PEMBERTON J.H., SHORTER R.G., eds. The large intestine: physiology,pathophysiology and disease. New York: Raven Press, 1991:905.
7 GIBSON G.R., MACFARLANE G.T., eds. Human colonic bacteria: role in nutrition,physiology and pathophysiology. Boca Raton, Florida: CRC Press, 1995:292.
8 CUMMINGS J.H., ROMBEAU J.L., SAKATA T., eds. Physiological and clinical aspects ofshort chain fatty acids. Cambridge: Cambridge University Press, 1995:575.
9 ROWLAND I.R. Role of the gut flora in toxicity and cancer. London: Academic Press,1988:517.
10 WRONG O.M., EDMONDS C.J., CHADWICK V.S., eds. The large intestine: its role inmammalian nutrition and homeostasis. Lancaster, UK: MTP Press, 1981:217.
11 KASPER H., GOEBELL H., eds. Colon and Nutrition. Lancaster, UK: MTP Press, 1982:310 (Falk Symposium; 32).
12 RITCHIE J.K. The health of ileostomists. Gut 1971;12:536-540.
13 CUMMINGS J.H., BINGHAM S.A., HEATON K.W., EASTWOOD M.A. Fecal weight, coloncancer risk and dietary intake of non-starch polysaccharides (dietary fiber).Gastroenterology 1992;103:1783-1789.
14 BURKITT D.P., WALKER A.R.P., PAINTER N.S. Effect of dietary fibre on stools and transittimes, and its role in the causation of disease. Lancet 1972;2:1408-1412.
15 METCALF A.M., PHILLIPS S.F., ZINSMEISTER A.R., MACCARTY R.L., BEART R.W., WOLFF B.G.Simplified assessment of segmental colonic transit. Gastroenterology1987;92:40-47.
16 FINEGOLD S.M., SUTTER V.L. Fecal flora in different populations, with special referenceto diet. Am. J. Clin. Nutr. 1978;31:S116-S122.
17 FINEGOLD S.M., SUTTER V.L., MATTISEN G.E. Normal indigenous intestinal flora. In:HENTGES D.J., ed. Human Intestinal Microflora in Health and Disease. New York:Academic Press, 1983: 3-31.
18 DRASAR B.S, HILL M.J. Human intestinal flora. London: Academic Press, 1974.
111
19 MOORE W.E.C., HOLDEMAN L.V. Human fecal flora: the normal flora of 20Japanese-Hawaiians. Appl. Microbiol. 1974;27:961-979.
20 MACFARLANE G.T., GIBSON G.R., DRASAR B.S., CUMMINGS J.H. Metabolic significanceof the gut microflora. In: WHITEHEAD R., ed. Gastrointestinal and OesophagealPathology. 2nd ed. Edinburgh: Churchill Livingstone, 1995: 249-274.
21 SILVESTER K.R., ENGLYST H.N., CUMMINGS J.H. Ileal recovery of starch from whole dietscontaining resistant starch measured in vitro and fermentation of ileal effluent.Am. J. Clin. Nutr. 1995;62:403-411.
22 STEPHEN A.M., CUMMINGS J.H. Mechanism of action of dietary fibre in the humancolon. Nature 1980;284:283-284.
23 PHILLIPS S.F., GILLER J. The contribution of the colon to electrolyte and waterconservation in man. J. Lab. Clin. Med. 1973;81:733-746.
24 WRONG O., METCALFE-GIBSON A., MORRISON R.B.I., NG S.T., HOWARD A.V. In vivodialysis of faeces as a method of stool analysis. I. Technique and results innormal subjects. Clin. Sci. 1965;28:357-.
25 CUMMINGS J.H. Nutritional management of diseases of the stomach and bowel. In:GARROW J.S., JAMES W.P.T, eds. Davidson and Passmore’s Human Nutrition &Dietetics. 9th ed. Edinburgh: Churchill Livingstone, 1993: 480-506.
26 MACFARLANE G.T., GIBSON G.R., CUMMINGS J.H. Comparison of fermentation reactionsin different regions of the human colon. J. Appl. Bacteriol. 1992;72:57-64.
27 CUMMINGS J.H., ENGLYST H.N. Fermentation in the large intestine and the availablesubstrates. Am. J. Clin. Nutr. 1987;45:1243-1255.
28 CUMMINGS J.H., GIBSON G.R., MACFARLANE G.T. Quantitative estimates of fermentationin the hind gut of man. In: SKADHAUGE E., NORGAARD P., eds. InternationalSymposium on Comparative Aspects of the Physiology of Digestion in Ruminantand Hindgut Fermenters. Acta Vet. Scan., 1989: 76-82.
29 ENGLYST H., WIGGINS H.S., CUMMINGS J.H. Determination of the non-starchpolysaccharides in plant foods by gas liquid chromatography of constituentsugars as alditol acetates. Analyst 1982;107:307-318.
30 ENGLYST H.N., KINGMAN S.M., CUMMINGS J.H. Classification and measurement ofnutritionally important starch fractions. Eur. J. Clin. Nutr. 1992;46:S33-S50.
31 ENGLYST H.N., CUMMINGS J.H. Resistant starch, a ‘new’ food component: aclassification of starch for nutritional purposes. In: MORTON I.D., ed. Cereals in aEuropean Context. First European Conference on Food Science & Technology.Chichester, UK: Ellis Horwood, 1987: 221-233.
32 ENGLYST H.N., KINGMAN S.M. Dietary fiber and resistant starch: a nutritionalclassification of plant polysaccharides. In: KRITCHEVSKY D., BONFIELD C., ANDERSON
J.W., eds. Dietary Fiber: Chemistry, Physiology and Health Effects. New York:Plenum, 1990: 48-65.
33 ROBERFROID M. Dietary fiber, inulin and oligofructose: a review comparing theirphysiological effects. Crit. Rev. Food Sci. Nutr. 1993;33 (2):103-148.
112
REFERENCES
34 Department of Health. Dietary sugars and human disease. London: HMSO, 1989(Reports on health and social subjects; 37).
35 HILL J.O., PRENTICE A.M. Sugar and body weight regulation. Am. J. Clin. Nutr.1995;62:264S-274S.
36 CLYDESDALE F.M., ed. Nutritional and health aspects of sugars. Am. J. Clin. Nutr.1995;62(1(S)):161S-296S.
37 SOUTHGATE D.A.T. Digestion and metabolism of sugars. Am. J. Clin. Nutr.1995;62:203S-211S.
38 CALLOWAY D.H., MURPHY E.L. The use of expired air to measure intestinal gasformation. Ann. New York Acad. Sci. 1968;150:82-95.
39 TADESSE K., SMITH D,. EASTWOOD M.A. Breath hydrogen (H2) and methane (CH4)excretion patterns in normal man and in clinical practice. Q. J. Exp. Physiol.1980;65:85-97.
40 OKU T. Dietary fiber and new sugars. In: BABA S., AKERELE O., KAWAGUCHI Y., eds.Natural Resources and Human Health - Plants of Medicinal and NutritionalValue. Amsterdam: Elsevier, 1992: 159-172.
41 YAZAWA K., IMAI K., TAMURA Z. Oligosaccharides and polysaccharides specificallyutilisable by bifidobacteria. Chem. Pharm. Bull. 1978;26:3306-3311.
42 YAZAWA K., TAMURA Z. Search for sugar sources for selective increase of bifido-bacteria. Bifidobact. Microflora 1982;1:39-44.
43 ROBERFROID M., GIBSON G.R., DELZENNE N. The biochemistry of oligofructose, anon-digestible fiber: an approach to calculate its caloric value. Nutr. Rev.1993;51:137-146.
44 VAN LOO J., COUSSEMENT P., DE LEENHEER L., HOEBREGS H., SMITS G. On the presenceof inulin and oligofructose as natural ingredients in the Western diet. Crit. Rev.Food Sci. Nutr. 1995;35(6):525-552.
45 HIDAKA H., EIDA T. The production of oligosaccharides utilizing sugar transfer action.Bio Industry 1984;1:5-13.
46 MCCANCE R.A., LAWRENCE R.D. The carbohydrate content of foods. London: HMSO,1929 (Special Report Series of the Medical Research Council; 135).
47 NILSSON U., OSTE R., JAGERSTAD M., BIRKHED D. Cereal fructans: in vitro and in vivostudies on availability in rats and humans. J. Nutr. 1988;118:1325-1330.
48 OKU T., TOKUNAGA T., HOSOYA N. Non-digestibility of a new sweetener “Neosugar”in the rat. J. Nutr. 1984;114:1574-1581.
49 BACH-KNUDSEN K.E., HESSOV I. Recovery of inulin from Jerusalem artichoke(Helianthus tuberosus L.) in the small intestine of man. Br. J. Nutr.1995;74:101-103.
50 RUMESSEN J.J., BODE S., HAMBERG O., GUDMAND-HOYER E. Fructans of Jerusalemartichokes: intestinal transport, absorption, fermentation and influence on bloodglucose, insulin and C-peptide responses in healthy subjects. Am. J. Clin. Nutr.1990;52:675-681.
51 HEUPKE W., BLANCKENBURG K. Die Verdauung des Inulins. Dtsch. Arch. Klin. Med.1934;176:182-187.
113
REFERENCES
52 GIBSON G.R., BEATTY E.R., WANG X., CUMMINGS J.H. Selective stimulation ofBifidobacteria in the human colon by oligofructose and inulin. Gastroenterology1995;108:975-982.
53 HIDAKA H., EIDA T., TAKIZAWA T., TOKUNAGA T., TASHIRO Y. Effects offructooligosaccharides on intestinal flora and human health. Bifidobact.Microflora 1986;5:37-50.
54 WANG X., GIBSON G.R. Effects of the in vitro fermentation of oligofructose and inulinby bacteria growing in the human large intestine. J. Appl. Bacteriol.1993;75:373-380.
55 MITSUOKA T., HIDAKA H., EIDA T. Effect of fructooligosaccharides on intestinalmicroflora. Nahrung 1987;31:5-6.
56 GIBSON G.R., WANG X. Regulatory effects of bifidobacteria on the growth of othercolonic bacteria. J. Appl. Bacteriol. 1994;77:412-420.
57 KOK N., ROBERFROID M., DELZENNE N. Involvement of lipogenesis in the lower VLDLsecretion induced by oligofructose in rats. Br. J. Nutr. 1996;75:327-337.
58 FIORDALISO M., KOK N., DESAGER J.P. et al. Dietary oligofructose lowers triglycerides,phospholipids and cholesterol in serum and very low density lipoproteins of rats.Lipids 1995;30:163-167.
59 YAMASHITA K., KAWAI K., ITAKURA M. Effects of fructo-oligosaccharides on bloodglucose and serum lipids in diabetic subjects. Nutr. Res. 1984;4:961-966.
60 BILIADERIS C.G. The structure and interactions of starch with food constituents. Can.J. Physiol. Pharmacol. 1991;69:60-78.
61 CUMMINGS J.H., ENGLYST H.N. Gastrointestinal effects of food carbohydrate. Am. J.Clin. Nutr. 1995;61:938S-945S.
62 ENGLYST H.N,. VEENSTRA J., HUDSON G.J. Measurement of rapidly available glucose(RAG) in plant foods: a potential in vitro predictor of the glycaemic response. Br.J. Nutr. 1996;75:327-337.
63 WAHLQVIST M.L., WILMSHURST E.G., MURTON C.R., RICHARDSON E.N. The effect ofchain length on glucose absorption and the related metabolic response. Am. J.Clin. Nutr. 1978;31:1998-2001.
64 WONG S., O’DEA K. Importance of physical form rather than viscosity in determiningthe rate of starch hydrolysis in legumes. Am. J. Clin. Nutr. 1983;37:66-70.
65 CRAPO P.A., REAVEN G., OLEFSKY J. Plasma glucose and insulin responses to orallyadministered simple and complex carbohydrates. Diabetes 1976;25:741-747.
66 WURSCH P., DEL VEDOVO S., KOELLREUTTER B. Cell structure and starch nature as keydeterminants of the digestion rate of starch in legumes. Am. J. Clin. Nutr.1986;43:25-29.
67 HERMANSEN K., RASMUSSEN O., ARNFRED J., WINTHER E., SCHMITZ O. Differentialglycaemic effects of potato, rice and spaghetti in type 1 (insulin dependent)diabetic patients at constant insulinaemia. Diabetalogia 1986;29:358-361.
114
REFERENCES
68 HEATON K.W., MARCUS S.N., EMMETT P.M., BILTON C.H. Particle size of wheat, maizeand oat test meals: effects on plasma glucose and insulin responses and on therate of starch digestion in vitro. Am. J. Clin. Nutr. 1988;47:675-682.
69 VAN DE WESTHUIZEN J., MBIZVO M., JONES J.J. Unrefined carbohydrate and glucosetolerance. Lancet 1972;ii:719.
70 HOLM J., BJORCK I., OSTROWSKA S., et al. Digestibility of amylose-lipid complexes invitro and in vivo. Starch/Starke 1983;35:294-297.
71 SHAINKIN R., BIRK Y. Alpha-amylase inhibitors from wheat. Isolation andcharacterisation. Biochim. Biophys. Acta 1970;221:502-513.
72 DUNAIF G., SCHNEEMAN B.O. The effect of dietary fiber on human pancreatic activityin vitro. Am. J. Clin. Nutr. 1981;34:1034-1035.
73 READ N.W., WELCH I.M., AUSTEN C.J. et al. Swallowing food without chewing: asimple way to reduce postprandial glycaemia. Br. J. Nutr. 1986;55:43-47.
74 CHAPMAN R.W., SILLERY J.K. GRAHAM M.M., SAUNDERS D.R. Absorption of starch byhealthy ileostomates: effect of transit time and of carbohydrate load. Am. J. Clin.Nutr. 1985;41:1244-1248.
75 ENGLYST H.N., CUMMINGS J.H. Digestion of the polysaccharides of some cereal foodsin the human small intestine. Am. J. Clin. Nutr. 1985;42:778-787.
76 ENGLYST H.N., CUMMINGS J.H. Digestion of the polysaccharides of banana (Musaparadisiaca sapientum) in man. Am. J. Clin. Nutr. 1986;44:42-50.
77 ENGLYST H.N., CUMMINGS J.H. Digestion of the polysaccharides of potato in the smallintestine of man. Am. J. Clin. Nutr. 1987;45:423-431.
78 ENGLYST H.N., KINGMAN S.M., HUDSON G.J., CUMMINGS J.H. Measurement of resistantstarch in vitro and in vivo. Br. J. Nutr. 1996;75:749-755.
79 WOLEVER T.M.S., COHEN Z., THOMPSON L.U. et al. Ileal loss of available carbohydratein man: comparison of a breath hydrogen method with direct measurementusing a human ileostomy model. Am. J. Gastroenterol. 1986;81:115-122.
80 STEPHEN A.M., HADDAD A.C., PHILLIPS S.F. Passage of carbohydrate into the colon.Direct measurements in humans. Gastroenterology 1983;85:589-595.
81 LEVINE A.S., LEVITT M.D. Malabsorption of starch moiety of oats, corn and potatoes.Gastroenterology 1981;80:1209.
82 LEVITT M.D., HIRSCH P., FETZER C.A., SHEAHAN M., LEVINE A.S. H2 excretion afteringestion of complex carbohydrates. Gastroenterology 1987;92:383-389.
83 CUMMINGS J.H., ENGLYST H.N. Measurement of starch fermentation in the humanlarge intestine. Can. J. Physiol. Pharmacol. 1991;69:121-129.
84 TROWELL H. Dietary fibre and coronary heart disease. Eur. J. Clin. Biol. Res.1972;17:345-349.
85 HIGGINSON J., OETTLÉ A.G. Cancer incidence in the Bantu and “Cape Colored” racesof South Africa: report of a cancer survey in the Transvaal (1953-55). J. Natl.Cancer Inst. 1960;24:589-671.
86 BURKITT D.P. Epidemiology of cancer of the colon and rectum. Cancer 1971;28:3-13.
115
REFERENCES
87 TROWELL H.C. Non-Infective Diseases in Africa. London: Edward Arnold, 1960.
88 CLEAVE T.L., CAMPBELL A.D. Diabetes, Coronary Thrombosis and the SaccharineDisease. Bristol: John Wright, 1966.
89 PAINTER N.S. Diverticular disease of the colon: a disease of this century. Lancet1969;2:586-588.
90 BURKITT D.P. Hemorrhoids, varicose veins and deep venous thrombosis:epidemiologic features and suggested causative factors. Can. J. Surg.1975;18:483-488.
91 CUMMINGS J.H. Progress report: dietary fibre. Gut 1973;14:69-81.
92 REILLY R.W., KIRSNER J.B., eds. Fiber Deficiency and Colonic Disorders. New York:Plenum, 1975.
93 SPILLER G.A., AMEN R.J., eds. Fiber in Human Nutrition. New York: Plenum, 1976.
94 WILLIAMS R.D., OLMSTED W.H. The manner in which food controls the bulk of faeces.Ann. Intern. Med. 1936;10:717.
95 WILLIAMS R.D., OLMSTED W.H. The effect of cellulose, hemicellulose and lignin onthe weight of the stool: a contribution to the study of laxation in man. J. Nutr.1936;11:433.
96 STORY J.A., KRITCHEVSKY D. Dietary fiber and lipid metabolism. In: SPILLER G.A., AMEN
R.J., eds. Fiber in Human Nutrition. New York: Plenum, 1976: 171-184.
97 SPILLER G.A., ed. CRC Handbook of Dietary Fiber in Human Nutrition. 2d ed. BocaRaton, Florida: CRC Press, 1993:
98 KRITCHEVSKY D., BONFIELD C., eds. Dietary fiber in health and disease. St. Paul,Minnesota: Eagan Press, 1995:1-486.
99 SOUTHGATE D.A.T. Determination of carbohydrates in foods. II. Unavailablecarbohydrates. J. Sci. Food Agric. 1969;20:331-335.
100 VAN SOEST P.J., MCQUEEN R.W. The chemistry and estimation of fibre. Proc. Nutr.Soc. 1973;32:123-130.
101 TROWELL H., BURKITT D., HEATON K.W., eds. Dietary Fibre, Fibre-Depleted Foods andDisease. London: Academic Press, 1985.
102 TROWELL H. Dietary fibre: a paradigm. In: TROWELL H., BURKITT D., HEATON K.W., eds.Dietary Fibre, Fibre-Depleted Foods and Diseases. London: Academic Press,1985: 1-20.
103 MCCANCE R.A., WIDDOWSON E.M. The chemical composition of foods. London:HMSO, 1940 (Special Report Series of the Medical Research Council; 235).
104 SELVENDRAN R.R., ROBERTSON J.A. The chemistry of dietary fibre - an holistic view ofthe cell wall matrix. In: SOUTHGATE D.A.T., WALDRON K., JOHNSON I.T., FENWICK
G.R., eds. Dietary Fibre: Chemical and Biological Aspects. Cambridge, UK:Royal Society of Chemistry, 1990: 27-43.
105 CUMMINGS J.H. Dietary fibre. Br. Med. Bull. 1981;37:65-70.
106 CUMMINGS J.H., EDWARDS C., GEE J.M., NAGENGAST F.M., MATHERS J.C. Physiologicaleffects of resistant starch in the large bowel. In: ASP N.-G., VAN AMELSVOORT
116
REFERENCES
J.M.M., HAUTVAST J.G.A.J., eds. Proceedings of the concluding plenary meetingof EURESTA. Den Haag: European Commission - DG XII, 1995 (EuropeanFlair-Concerted Action Publication No.11 (Cost 911)).
107 VAN MUNSTER I.P., TANGERMAN A., NAGENGAST F.M. The effect of resistant starch oncolonic fermentation, bile acid metabolism and mucosal proliferation. Dig. Dis.Sci. 1994;39:834-842.
108 PHILLIPS J., MUIR J.G., BIRKETT A., et al. Effect of resistant starch on fecal bulk andfermentation-dependent events in humans. Am. J. Clin. Nutr. 1995;62:121-130.
109 CUMMINGS J.H., BEATTY E.R., KINGMAN S.M., BINGHAM S.A., ENGLYST H.N. Digestionand physiological properties of resistant starch in the human large bowel. Br. J.Nutr. 1996;75:733-747.
110 PROSKY L., ASP N.-G., FURDA I., DEVRIES J.W., SCHWEIZER T.F., HARLAND B.F. Vitaminsand other nutrients. Determination of total dietary fiber in foods, food productsand total diets: interlaboratory study. J. Assoc. Off. Anal. Chem. 1984;67:1044-1052.
111 PROSKY L., ASP N.-G., FURDA I., DEVRIES J.W., SCHWEIZER T.F., HARLAND B.F. Vitaminsand other nutrients. Determination of total dietary fiber in foods and foodproducts: collaborative study. J. Assoc. Off. Anal. Chem. 1985;68:677-679.
112 PROSKY L., ASP N.-G., SCHWEIZER T.F., DEVRIES J.W., FURDA I. Determination ofinsoluble, soluble and total dietary fiber in foods and food products:interlaboratory study. J. Assoc. Off. Anal. Chem. 1988;71:1017-1023.
113 LEE S.C., PROSKY L., DEVRIES J.W. Determination of total, soluble and insoluble dietaryfiber in foods – enzymatic-gravimetric method, MES-TRIS buffer: collaborationstudy. J. AOAC Int. 1992;75:395-416.
114 PROSKY L., ASP N.-G., SCHWEIZER T.F., DEVRIES J.W., FURDA I. Determination ofinsoluble and soluble dietary fiber in foods and food products: collaborativestudy. J. AOAC Int. 1992;75:360-367.
115 JAMES W.P.T., THEANDER O., eds. The Analysis of Dietary Fibre in Food. New York:Marcel Dekker, 1981.
116 MONGEAU R., BRASSARD R. Collaborative study of a rapid gravimetric method. CerealFoods World 1990;35:319-324.
117 MONGEAU R., BRASSARD R. A rapid method for the determination of soluble andinsoluble dietary fiber: comparison with AOAC total dietary fiber procedure andEnglyst’s method. J. Food Sci. 1986;51:1333-1336.
118 SCHWEIZER T.F., WALTER E., VENETZ P. Collaborative study for the enzymatic, gravi-metric determination of total dietary fibre in foods. Mitt. Geb. Lebensmittel-unters. Hyg. 1988;79:57-68.
119 CUMMINGS J.H., ENGLYST H.N., WOOD R. Determination of dietary fibre in cereals andcereal products - collaborative trials. Part I: Initial trial. J. Assoc. Public Anal.1985;23:1-35.
120 WOOD R., ENGLYST H.N., SOUTHGATE D.A.T., CUMMINGS J.H. Determination of dietaryfibre. Collaborative trials. Part IV. A comparison of the Englyst and Prosky
117
REFERENCES
(AOAC) procedures for the determination of soluble, insoluble and total dietaryfibre. J. Assoc. Public Anal. 1993;29:57-141.
121 ENGLYST H.N., QUIGLEY M.E., ENGLYST K.N., BRAVO L., HUDSON G.J. Dietary Fibre;Measurement by the Englyst NSP proceedure, Measurement by the AOACproceedure, Explanation of the differences. J. Assoc. Public Anal. 1996; in press.
122 JERACI J.L., VAN SOEST P.J. Improved methods for analysis and biologicalcharacterization of fiber. In: FURDA I., BRINE C.J., eds. New Developments inDietary Fiber. New York: Plenum, 1990: 245-263.
123 MEUSER F., SUCKOW P., KULIKOWSKI W. Verfahren zur Bestimmung von unloslichenund loslichen Ballaststoffen in Lebensmitteln. Z. Lebensmittelunters. Forsch.1985;181:101-106.
124 THEANDER O., AMAN P. Studies on dietary fibre. A method for the analysis andchemical characterisation of total dietary fibre. J. Sci. Food Agric. 1982;33:340-344.
125 THEANDER O., WESTERLUND E. Studies on dietary fiber. 3. Improved procedures foranalysis of dietary fiber. J. Agric. food Chem. 1986;34:330-336.
126 THEANDER O., AMAN P. Studies on dietary fibres. I. Analysis and chemicalcharacterisation of water-soluble and water-insoluble dietary fibres. Swed. J.Agric. Res. 1979;9:97-106.
127 ENGLYST H.N., HUDSON G.J. Colorimetric method for routine measurement of dietaryfibre as non-starch polysaccharides. A comparison with gas-liquidchromatography. Food Chem. 1987;24:63-76.
128 ENGLYST H.N., CUMMINGS J.H. Improved method for measurement of dietary fiber asnon-starch polysaccharides in plant foods. J. Assoc. Off. Anal. Chem.1988;71:808-814.
129 ENGLYST H.N., CUMMINGS J.H., Wood R. Determination of dietary fibre in cereals andcereal products - collaborative trials. Part II: Study of a modified Englystprocedure. J. Assoc. Public Anal. 1987;25:59-71.
130 ENGLYST N.H., CUMMINGS J.H., WOOD R. Determination of dietary fibre in cereals andcereal products - collaborative trials. Part III: Study of further simplifiedprocedures. J. Assoc. Public Anal. 1987;25:73-110.
131 SOUTHGATE D.A.T., HUDSON G.J., ENGLYST H. The analysis of dietary fibre - the choicesfor the analyst. J. Sci. Food. Agric. 1978;29:979-988.
132 ENGLYST H., WIGGINS H. Measurement of the carbohydrate component of dietaryfibre (non-starch polysaccharides). Gut 1979;20:A935.
133 QUIGLEY M.E., ENGLYST H.N. Determination of neutral sugars and hexosamines byhigh-performance liquid chromatography with pulsed amperometric detection.Analyst 1992;117:1715-1718.
134 Quigley M.E., Englyst H.N. Determination of the uronic acid constituents ofnon-starch polysaccharides by high-performance liquid chromatography withpulsed amperometric detection. Analyst 1994;119:1511-1518.
118
REFERENCES
135 ENGLYST H.N., QUIGLEY M.E., HUDSON G.J. Determination of dietary fibre asnon-starch polysaccharides with gas-liquid chromatographic, high-performanceliquid chromatographic or spectrophotometric measurement of constituentsugars. Analyst 1994;119:1497-1509.
136 ASP N.-G., SCHWEIZER T.F., SOUTHGATE D.A.T., THEANDER O. Dietary fibre analysis. In:SCHWEIZER T.F., EDWARDS C.A., eds. Dietary Fibre - A Component of Food.Nutritional Function in Health and Disease. Springer-Verlag, 1992: 57-101.
137 CUMMINGS J.H., FROLICH W., eds. Dietary fibre intakes in Europe: a survey conductedby members of the Management Committee of COST 92. Metabolic andPhysiological Aspects of Dietary Fibre in Food. Brussels: ECSP-EEC-EAEC,1993:1-89.
138 BINGHAM S. The dietary assessment of individuals: methods, accuracy, new techni-ques and recommendations. Nut. Abst. Rev. 1987;57:706-742.
139 ADIOTOMRE J.A., EASTWOOD M.A., EDWARDS C.A., BRYDON W.G. Dietary fiber: in vitromethods that anticipate nutrition and metabolic activity in humans. Am. J. Clin.Nutr. 1990;52:128-134.
140 SOUTHGATE D.A.T., WALDRON K., JOHNSON I.T., FENWICK G.R., eds. Dietary Fibre:Chemical and Biological Aspects. Cambridge: Royal Society of Chemistry, 1990.
141 EASTWOOD M.A. Vegetable fibre: its physical properties. Proc. Nutr. Soc.1973;32:137-143.
142 MCCONNELL A.A., EASTWOOD M.A., MITCHELL W.D. Physical characteristics ofvegetable foodstuffs that could influence bowel function. J. Sci. Food Agric.1974;25:1457-1464.
143 ROBERTSON J.A., EASTWOOD M.A. An examination of factors which may affect thewater holding capacity of dietary fibre. Br. J. Nutr. 1981;45:83-88.
144 BRODRIBB A.J.M., GROVES C. Effect of bran particle size on stool weight. Gut1978;19:60-63.
145 STEPHEN A.M., CUMMINGS J.H. Water-holding by dietary fibre in vitro and itsrelationship to faecal output in man. Gut 1979;20:722-729.
146 GIBSON J.A., SLADEN G.E., DAWSON A.M. Protein absorption and ammoniaproduction: the effects of dietary protein and removal of the colon. Br. J. Nutr.1976;35:61-65.
147 CHACKO A., CUMMINGS J.H. Nitrogen losses from the human small bowel: obligatorylosses and the effect of physical form of food. Gut 1988;29:809-815.
148 SILVESTER K.R., CUMMINGS J.H. Does digestibility of meat protein help explain largebowel cancer risk? Nutr. Cancer 1995;24:279-288.
149 FLORIN T.H.J., NEALE G., CUMMINGS J.H. The effect of dietary nitrate on nitrate andnitrite excretion in man. Br. J. Nutr. 1990;64:387-397.
150 SANDBERG A.S., ANDERSSON G.H., HALLGREN B., HASSELBLAD K., ISAKSSON B.Experimental model for in vivo determination of nutrients in the small intestine.Br. J. Nutr. 1981;45:283-294.
119
REFERENCES
151 SANDBERG A.S., AHDERINNE R., ANDERSSON H., HALLGREN B., HULTEN I. The effect ofcitrus pectin on the absorption of nutrients in the small intestine. Hum. Nutr.Clin. Nutr. 1983;37C:171-183.
152 SMITH A.C., PODOLSKY D.K., eds. Colonic mucin glycoproteins in health and disease.Philadelphia: WB Saunders Company, 1986:815-837. (Mendeloff A., ed. Clinicsin gastroenterology; vol. 15).
153 HOSKINS L.C., BOULDING E.T. Mucin degradation in human colon ecosystems. J. Clin.Invest. 1981;67:163-172.
154 HOSKINS L.C., AGUSTINES M., MCKEE W.B., BOULDING E.T., KRIARIS M., NIEDERMEYER G.Mucin degradation in human colon ecosystems. Isolation and properties of fecalstrains that degrade ABH blood group antigens and oligosaccharides from mucinglycoproteins. J. Clin. Invest. 1985;75:944-953.
155 MILLER T.L., WEAVER G.A., WOLIN M.J. Methanogens and anaerobes in a colonsegment isolated from the normal fecal stream. Appl. Environ. Microbiol.1984;48:449-450.
156 ROBERTON A.M., STANLEY R.A. In vitro utilization of mucin by Bacteroides fragilis.Appl. Environ. Microbiol. 1982;43:325-330.
157 SALYERS A.A., O’BRIEN M., KOTARSKI S.F. Utilization of chrondroitin sulfate byBacteroides thetaiotaomicron growing in carbohydrate-limited continuousculture. J. Bacteriol. 1982;150:1008-1015.
158 GIBSON G.R., CUMMINGS J.H., MACFARLANE G.T. Competition for hydrogen betweensulphate-reducing bacteria and methanogenic bacteria from the human largeintestine. J. Appl. Bacteriol. 1988;65:241-247.
159 CUMMINGS J.H. Short chain fatty acids in the human colon. Gut 1981;22:763-779.
160 ROCHE A.F., SILVERMAN E., eds. Short-Chain Fatty Acids: Metabolism and ClinicalImportance. Columbus, Ohio: Ross Laboratories, 1991.
161 BINDER H.J., CUMMINGS J.H., SOERGEL K.H., eds. Short-Chain Fatty Acids. Dordrecht,The Netherlands: Kluwer Academic, 1994 (Falk Symposium; 73).
162 BUGAUT M. Occurrence, absorption and metabolism of short-chain fatty acids in thedigestive tract of mammals. Comp. Biochem. Physiol. 1987;86:439-472.
163 BUGAUT M., BENTEJAC M. Biological effects of short-chain fatty acids in nonruminantmammals. Annu. Rev. Nutr. 1993;13:217-241.
164 CUMMINGS J.H,. POMARE E.W., BRANCH W.J., NAYLOR C.P.E., MACFARLANE G.T. Shortchain fatty acids in human large intestine, portal, hepatic and venous blood. Gut1987;28:1221-1227.
165 WEAVER G.A., KRAUSER J.A., MILLER T.L., WOLIN M.J. Short chain fatty acid distributionsof enema samples from a sigmoidoscopy population: an association of highacetate and low butyrate ratios with adenomatous polyps and colon cancer. Gut1988;29:1539-1543.
166 MITCHELL B.L., LAWSON M.J., DAVIES M. et al. Volatile fatty acids in the humanintestine: studies in surgical patients. Nutr. Res. 1985;5:1089-1092.
120
REFERENCES
167 ELSDEN S.R., HITCHCOCK M.W.S., MARSHALL R.A., PHILLIPSON A.T. Volatile acid in thedigesta of ruminants and other animals. J. Exp. Biol. 1946;22:191-202.
168 BREVES G., STUCK K. Short-chain fatty acids in the hindgut. In: CUMMINGS J.H,ROMBEAU J.L., SAKATA T., eds. Physiological and Clinical Aspects of Short-ChainFatty Acids. Cambridge, UK: Cambridge University Press, 1995: 73-.
169 ODELSON D.A., BREZNAK J.A. Volatile fatty acid production by the hindgut microbiotaof xylophagous termites. Appl. Environ. Microbiol. 1983;45:1602-1613.
170 MCBURNEY M.I. Passage of starch into the colon of humans: quantitation andimplications. Can. J. Physiol. Pharmacol. 1991;69:130-136.
171 TITGEMEYER E.C., BOURQUIN L.D., FAHEY G.C.J., GARLEB K.A. Fermentability of variousfiber sources by human fecal bacteria in vitro. Am. J. Clin. Nutr.1991;53:1418-1424.
172 ENGLYST H.N., HAY S., MACFARLANE G.T. Polysaccharide breakdown by mixedpopulations of human faecal bacteria. FEMS Microbiol. Ecol. 1987;95:163-171.
173 WEAVER G.A., KRAUSE J.A., MILLER T.L., WOLIN M.J. Constancy of glucose and starchfermentations by two different human faecal microbial communities. Gut1989;30:19.
174 WEAVER G.A., KRAUSE J.A., MILLER T.L., WOLIN M.J. Cornstarch fermentation by thecolonic microbial community yields more butyrate than does cabbage fiberfermentation; cornstarch fermentation rates correlate negatively withmethanogenesis. Am. J. Clin. Nutr. 1992;55:70-77.
175 MCBURNEY M.I., THOMPSON L.U. Effect of human faecal inoculum on in vitrofermentation variables. B. J. Nutr. 1987;58:233.
176 MCBURNEY M.I., THOMPSON L.U. In vitro fermentabilities of purified fibersupplements. J. Food Sci. 1989;54:347-350.
177 GIBSON G.R., MACFARLANE S., CUMMINGS J.H. The fermentability of polysaccharides bymixed human faecal bacteria in relation to their suitability as bulk forminglaxatives. Lett. Appl. Microbiol. 1990;11:251-254.
178 MACFARLANE G.T., ENGLYST H.N. Starch utilization by the human large intestinalmicroflora. J. Appl. Bacteriol.1986;60:195-201.
179 ETTERLIN C., MCKEOWN A., BINGHAM S.A., ELIA M., MACFARLANE G.T., CUMMINGS J.H.D-Lactate and acetate as markers of fermentation in man. Gastroenterology1992;102:A551.
180 TORRES-PINEDO R., LAVASTIDA M., RIVERA C.L., RODRIGUEZ H., ORTIZ A. Studies on infantdiarrhea. 1. A comparison of the effects of milk feeding and intravenous therapyupon the composition and volume of the stool and urine. J. Clin. Invest.1966;45:469-480.
181 WEIJERS H.A., VAN DE KAMER J.H., DICKE W.K., IJSSELING J. Diarrhoea caused bydeficiency of sugar splitting enzymes. Acta Paediatr. Scand. 1961;50:55-71.
182 WEIJERS H.A., VAN DE KAMER J.H. Aetiology and diagnosis of fermentative diarrhoeas.Acta Paediatr. Scand. 1963;52:329-337.
121
REFERENCES
183 Hoverstad T., Carlstedt-Duke B., Lingaas E. et al. Influence of ampicillin,clindamycin, and metronidazole on faecal excretion of short chain fatty acids inhealthy subjects. Scan. J. Gastroenterol. 1986;21:621-626.
184 HOVERSTAD T., CARLSTEDT-DUKE B., LINGAAS E. et al. Influence of oral intake of sevendifferent antibiotics on faecal short chain fatty acid excretion in healthy subjects.Scan. J. Gastroenterol. 1986;21:997-1003.
185 HEIMDAHL A., NORD C.E. Effect of erythromycin and clindamycin on the indigenoushuman anaerobic flora and new colonization of the gastrointestinal tract. Eur. J.Clin. Microbiol. 1982;1:38-48.
186 EDWARDS CA., DUERDEN BI., READ N.W. The effect of clindamycin on the ability of acontinuous culture of colonic bacteria to ferment carbohydrate. Gut1986;27:411-417.
187 CLAUSEN M.R., BONNEN H., TVEDE M., MORTENSEN P.B. Colonic fermentation to shortchain fatty acids is decreased in antibiotic-associated diarrhea. Gastroenterology1991;101:1497-1504.
188 RUBINSTEIN R., HOWARD A.V., WRONG O.M. In vivo dialysis of faeces as a method ofstool analysis. IV. The organic anion component. Clin. Sci. 1969;37:549-564.
189 WILSON D.R., ING T.S., METCALFE-GIBSON A., WRONG O.M. In vivo dialysis of faecesas a method of stool analysis. III. The effect of intestinal antibiotics. Clin. Sci.1968;34:211-221.
190 SAUNDERS D.R., WIGGINS H.S. Conservation of mannitol, lactulose and raffinose bythe human colon. Am. J. Physiol. 1981;241:G397-G402.
191 CUMMINGS J.H., JAMES W.P.T., WIGGINS H.S. Role of the colon in ileal resectiondiarrhoea. Lancet 1973;i:344-347.
192 GROVE E.W., OLMSTED W.H., KOENIG K. The effect of diet and catharsis on the lowervolatile fatty acids in the stools of normal men. J. Biol. Chem. 1929/30;85:127-136.
193 CUMMINGS J.H., HILL M.J., JENKINS D..JA, PEARSON J.R, WIGGINS H.S. Changes in faecalcomposition and colonic function due to cereal fibre. Am. J. Clin. Nutr.1976;29:1468-1473.
194 OLMSTED W.H., CURTIS G., TIMM O.K. Stool volatile fatty acids. IV. The influence offeeding ban pentosan and fibre to man. J. Biol. Chem. 1935;108:645-652.
195 SPILLER G.A., CHERNOFF M.C., HILL R.A., GATES J.E., NASSAR J.J., SHIPLEY E.A. Effect ofpurified cellulose, pectin, and a low-residue diet on fecal volatile fatty acids,transit time and fecal weight in humans. Am. J. Clin. Nutr. 1980;33:754-759.
196 FLEMING S.E., RODRIGUEZ M.A. Influence of dietary fibre in faecal excretion of volatilefatty acids by human adults. J. Nutr. 1983;113:1613-1626.
197 FLEMING S.E. Influence of dietary fiber on the production, absorption, or excretion ofshort chain fatty acids in humans. In: SPILLER G.A., ed. CRC Handbook of DietaryFiber in Human Nutrition. 2d ed. Boca Raton, Florida: CRC Press, 1993:387-412.
122
REFERENCES
198 SCHEPPACH W., FABIAN C., SACHS M., KASPER H. The effect of starch malabsorption onfecal short chain fatty acid excretion in man. Scan. J. Gastroenterol.1988;23:755-759.
199 CASSIDY A., BINGHAM S.A., CUMMINGS J.H. Starch intake and colorectal cancer risk: aninternational comparison. Br. J. Cancer 1994;69:937-942.
200 MACFARLANE G.T., GIBSON G.T. Microbiological aspects of short chain fatty acidproduction in the large bowel. In: CUMMINGS J.H., ROMBEAU J.L., SAKATA T., eds.Physiological and Clinical Aspects of Short-Chain Fatty Acids. Cambridge:Cambridge University Press, 1995: 87-106.
201 ISAACSON H.R., HINDS F.C., BRYANT M.P., OWENS F.N. Efficiency of energy utilizationby mixed rumen bacteria in continuous culture. J. Dairy Sci. 1975;58:1645-1659.
202 OWENS F.N., ISAACSON H.R. Ruminal microbial yields: factors influencing synthesisand bypass. Fed. Proc. 1977;36:198-202.
203 STEPHEN A.M., WIGGINS H.S., CUMMINGS J.H. Effect of changing transit time oncolonic microbial metabolism in man. Gut 1987;28:601-609.
204 ALLISON C., MCFARLAN C., MACFARLANE G.T. Studies on mixed populations of humanintestinal bacteria grown in single and multistage continuous culture systems.Appl. Environ. Microbiol. 1989;55:672-678.
205 MACFARLANE G.T., CUMMINGS J.H., MACFARLANE S., GIBSON G.R. Influence of retentiontime on degradation of pancreatic enzymes by human colonic bacteria grown ina 3-stage continuous culture system. J. Appl. Bacteriol. 1989;67:521-527.
206 CUMMINGS J.H. Short-chain fatty acids. In: GIBSON G.R., MACFARLANE G.T., eds.Human Colonic Bacteria: Role in Nutrition, Physiology and Pathology. BocaRaton, Florida: CRC Press, 1995: 101-130.
207 DAVIGNON J., SIMMONDS W.J., AHRENS E.H. Usefulness of chromic oxide as an internalstandard for balance studies in formula-fed patients and for assessment ofcolonic function. J. Clin. Invest. 1968;47:127-138.
208 CUMMINGS J.H. Diet and transit through the gut. J. Plant Foods 1978;3:83-95.
209 CUMMINGS J.H., HILL M.J., BONE E.S., BRANCH W.J,. JENKINS D.J.A. The effect of meatprotein and dietary fiber on colonic function and metabolism. Part II. Bacterialmetabolites in faeces and urine. Am. J. Clin. Nutr. 1979;32:2094-2101.
210 MACY I.G. Nutrition and Chemical Growth in Childhood. Baltimore: C.C.Thomas,1942 (vol. 1, Evaluation).
211 BERGMAN E.N. Production and utilization of metabolites by the alimentary tract asmeasured in portal and hepatic blood. In: MCDONALD I.W., WARNER A.C.I., eds.Digestion and metabolism in the ruminant. Armidale, New South Wales(Australia): University of New England, 1975: 292-305.
212 BERGMAN E.N. Energy contributions of volatile fatty acids from the gastrointestinaltract in various species. Physiol. Rev. 1990;70:567-590.
123
REFERENCES
213 DANKERT J., ZIJLSTRA J.B., WOLTHERS B.G. Volatile fatty acids in human peripheral andportal blood: quantitative determination by vacuum distillation and gaschromatography. Clin. Chim. Acta 1981;110:301-307.
214 PETERS S.G., POMARE E.W., FISHER C.A. Portal and peripheral blood short chain fattyacid concentrations after caecal lactulose instillation at surgery. Gut1992;33:1249-1252.
215 SKUTCHES C.L., HOLROYDE C.P., MYERS R.N., PAUL P., REICHARD G.A. Plasma acetateturnover and oxidation. J. Clin. Invest. 1979;64:708-713.
216 SCHEPPACH W., POMARE E.W., ELIA M., CUMMINGS J.H. The contribution of the largeintestine to blood acetate in man. Clin. Sci. 1991;80:177-182.
217 SCHENK W.G., MCDONALD J.C., MCDONALD K., DRAPONAS T. Direct measurement ofhepatic flow in surgical patients. Ann. Surg. 1962;156:463-469.
218 NORRYD C., DENCKER H., LUNDERQUIST A., OLIN T., TYLEN U. Superior mesenteric arteryblood flow during digestion in man. Acta Chir. Scand. 1975;141:197-202.
219 QAMAR M.I., READ A.E. Effects of ingestion of carbohydrate, fat, protein and water onthe mesenteric blood flow in man. Scand. J. Gastroenterol. 1988;23:26-30.
220 POMARE E.W., BRANCH W.J., CUMMINGS J.H. Carbohydrate fermentation in the humancolon and its relation to acetate concentration in venous blood. J. Clin. Invest.1985;75:1448-1454.
221 BRIDGES S.R., ANDERSON J.W., DEAKINS D.D., DILLON D.W., WOOD C.L. Oat branincreases serum acetate of hypercholesterolemic men. Am. J. Clin. Nutr.1992;56:455-459.
222 NEILSEN L.G., OWEN-ASH K., THOR E. Gas chromatographic method for plasmaacetate analysis in acetate intolerance studies. Clin. Chem. 1978;24:348-350.
223 AKANJI A.O., HUMPHREYS S., THURSFIELD V., HOCKADAY, T.D.R. The relationship ofplasma acetate with glucose and other blood intermediary metabolites innon-diabetic and diabetic subjects. Clin. Chim. Acta 1989;185:25-34.
224 LIVESEY G., ELIA M. Short chain fatty acids as an energy source in the colon:metabolism and clinical implications. In: CUMMINGS J.H., ROMBEAU J.L., SAKATA T.,eds. Physiological and Clinical Aspects of Short-Chain Fatty Acids. Cambridge,UK: Cambridge University Press, 1995: 427-482.
225 WOLIN M.J., MILLER T.L. Carbohydrate fermentation. In: HENTGES D.J., ed. HumanIntestinal Microflora in Health and Disease. New York: Academic Press, 1983:147-166.
226 WOLIN M.J. A theoretical rumen fermentation balance. J. Dairy Sci.1960;43:1452-1459.
227 WOLIN M.J. Fermentation in the rumen and human large intestine. Science1981;213:1463-1468.
228 MILLER T.L., WOLIN M.J. Fermentations by saccharolytic intestinal bacteria. Am. J.Clin. Nutr. 1979;32:164-172.
124
REFERENCES
229 MATHERS J.C., ANNISON E.F. Stoichiometry of polysaccharide fermentation in the largeintestine. In: Chemistry and Nutrition of Dietary Fibre and Beyond: AustralianPerspectives. Australia: Australian Nutrition Society, 1993: 123-135 (OccasionalPublication No. 1).
230 GIBSON G.R., MACFARLANE G.T., CUMMINGS J.H. Sulphate reducing bacteria andhydrogen metabolism in the human large intestine. Gut 1993;34:437-439.
231 WALTER J.H., LEONARD J.V., THOMPSON G.N., BARTLETT K., HALLIDAY D. Contribution ofaminoacid catabolism to propionate production in methylmalonic acidaemia.Lancet 1989;i:1298-1299.
232 BREVES G., SCHULZE E., SALLMANN H.P., GADEKEN D. The application of 13C labelledshort chain fatty acids to measure acetate and propionate production rates in thelarge intestines: studies in a pig model. Z. Gastroenterol. 1993;31:179-182.
233 FREEMAN K., FOY T., FESTE A.S., REEDS P.J., LIFSCHITZ C.L. Colonic acetate in thecirculating acetate pool of the infant pig. Paediatr. Res. 1993;34:318-322.
234 KIEN C.L., KEPNER J., GROTJOHN K., AULT K., MCLEAD R.E. Stable isotope model forestimating colonic acetate production in premature infants. Gastroenterology1992;102:1458-1466.
235 MACFARLANE G.T., GIBSON G.R., BEATTY E.R., CUMMINGS J.H. Estimation of short-chainfatty acid production from protein by human intestinal bacteria based onbranched chain fatty acid measurements. FEMS Microbiol. Ecol. 1992; 101:81-88.
236 MCNEIL N.I., CUMMINGS J.H., JAMES W.P.T. Short chain fatty acid absorption by thehuman large intestine. Gut 1978;19:819-822.
237 RUPPIN H., BAR-MEIR S., SOERGEL K.H., WOOD C.M., SCHMITT M.G. Absorption ofshort-chain fatty acids by the colon. Gastroenterology 1980;78:1500-1507.
238 DAWSON A.M., HOLDSWORTH C.D., WEBB J. Absorption of short chain fatty acids inman. Proc. Soc. Exp. Biol. Med. 1964;117:97-100.
239 MCNEIL N.I., CUMMINGS J.H., JAMES W.P.T. Rectal absorption of short chain fatty acidsin the absence of chloride. Gut 1979;20:400-403.
240 GABEL G., MARTENS H. Transport of Na+ and Cl- across the forestomach epithelium:mechanisms and interactions with short chain fatty acids. In: TSUDA T., SASAKI Y.,KAWASHIMA R., eds. Physiological Aspects of Digestion and Metabolism inRuminants. Proceedings of the Seventh International Symposium on RuminantPhysiology. New York: Academic Press, 1991: 129.
241 MARTENS H., LEONHARD S., GABEL G. Minerals and digestion: exchanges in thedigestive tract. In: JOUANY J.P., ed. Rumen Microbial Metabolism and RuminantDigestion. Versailles: INRA Editions, 1991: 199.
242 SOERGEL K.H., HARIG J.M., LOO F.D., RAMASWAMY K., WOOD C.M. Colonic fermentationand absorption of SCFA in man. Acta Vet. Scand. 1989;Suppl. 86:107-115.
243 VON ENGELHARDT W. Absorption of short-chain fatty acids from the large intestine. In:CUMMINGS J.H., ROMBEAU J.L., SAKATA T., eds. Physiological and Clinical Aspectsof Short-Chain Fatty Acids. Cambridge, UK: Cambridge University Press, 1995:149-170.
125
REFERENCES
244 ARGENZIO R.A., SOUTHWORTH M., LOWE J.E., STEVENS C.E. Interrelationship of Na,HCO3 volatile fatty acid transport by equine large intestine. Am. J. Physiol.1977;233:E468-E469.
245 ARGENZIO R.A., WHIPP S.C. Inter-relationship of sodium, chloride, bicarbonate andacetate transport by the colon of the pig. J. Physiol. 1979;295:365-381.
246 RUBSAMEN K., VON ENGELHARDT W. Absorption of Na, H ions and short chain fattyacids from the sheep colon. Pflügers Arch. 1981;391:141-146.
247 UMESAKI Y., YAJIMA T., YOKOKURA T., MUTAI M. Effect of organic acid absorption onbicarbonate transport in rat colon. Pflügers Arch. 1979;379:43-47.
248 MASCOLO N., RAJENDRAN V.M., BINDER H.J. Mechanism of short chain fatty aciduptake by apical membrane vesicles of rat distal colon. Gastroenterology1991;101:331-338.
249 HARIG J.M., KNAUP S.M., SHOSHARA J., DUDEJA P.K., RAMASWAMY K., BRASITUS T.A.Transport of N-butyrate into human colonic luminal membrane vesicles.Gastroenterology 1990;98:A543.
250 STEVENS C.E., STETTLER B.K. Factors affecting the transport of volatile fatty acids acrossrumen epithelium. Am. J. Physiol. 1966;210:365-372.
251 LONNERHOLM G., SELKING O., WISTRAND P.J. Amount and distribution of carbonicanhydrases CA I and CA II in the gastrointestinal tract. Gastroenterology1985;88:1151-1161.
252 CHARNEY A.N., WAGNER J.D., BIRNBAUM G.J., JOHNSTONE J.N. Functional role ofcarbonic anhydrase in intestinal electrolyte transport. Am. J. Physiol.1986;251:G682-G687.
253 VON ENGELHARDT W., GROS G., BURMESTER M., HANSEN K., BECKER G., RECHKEMMER G.Functional role of bicarbonate in propionate transport across guinea pig largeintestine. J. Physiol. 1994;477:365-371.
254 PARSONS D.S., PATERSON C.R. Fluid and solute transport across rat colonic mucosa. Q.J. Exp. Physiol. 1965;50:220-231.
255 ARGENZIO R.A., MILLER N., VON ENGELHARDT W. Effect of volatile fatty acids on waterand ion absorption from the goat colon. Am. J. Physiol. 1975;229:997-1002.
256 CRUMP M.H., ARGENZIO R.A., WHIPP S.C. Effects of acetate on absorption of soluteand water from the pig colon. Am. J. Vet. Res. 1980;41:1565-1568.
257 ROEDIGER W.E.W., MOORE A. The effect of short-chain fatty acids on sodiumabsorption in the isolated human colon perfused through the vascular bed. Dig.Dis. Sci. 1981;26:100-106.
258 UMESAKI Y., YAJIMA T., TOHYAMA K., MUTAI M. Characterization of acetate uptake bythe colonic epithelial cells of the rat. Pflügers Arch. 1980;388:205-209.
259 ROEDIGER W.E.W., DEAKIN E.J., RADCLIFFE B.C., NANCE S. Anion control of sodiumabsorption in the colon. J. Exp. Physiol. 1986;71:195-204.
260 ROEDIGER W.E.W. Short chain fatty acids as metabolic regulators of ion absorption inthe colon. Acta Vet. Scand. 1989;86:116-125.
126
REFERENCES
261 ROEDIGER W.E.W. Role of anaerobic bacteria in the metabolic welfare of the colonicmucosa in man. Gut 1980;21:793-798.
262 ROEDIGER W.E.W. Utilization of nutrients by isolated epithelial cells of the rat colon.Gastroenterology 1982;83:424-429.
263 MARTY J., VERNAY M. Absorption and metabolism of the volatile fatty acids in thehind-gut of the rabbit. Br. J. Nutr. 1984;51:265-277.
264 VERNAY M. Effects of plasma aldosterone on butyrate absorption and metabolism inthe rabbit proximal colon. Comp. Biochem. Physiol. 1987;86A:657-662.
265 ARDAWI M.S.M., NEWSHOLME E.A. Fuel utilisation in colonocytes of the rat. Biochem.J. 1985;231:713-719.
266 FLEMING S.E., FITCH M.D., DE VRIES S., LIU M.L., KIGHT C. Nutrient utilization by cellsisolated from rat jejunum, cecum and colon. J. Nutr. 1991;121:869-878.
267 ROEDIGER W.E.W, KAPANIRIS O., MILLARD S. Lipogenesis from n-butyrate incolonocytes. Action of reducing agent and 5-aminosalicylic acid with relevanceto ulcerative colitis. Mol. Cell. Biochem. 1992;118:113-118.
268 REMESY C., DEMIGNE C. Partition and absorption of volatile fatty acids in thealimentary canal of the rat. Ann. Rech. Vét. 1976;7:39-55.
269 HENNING S.J., HIRD F.J.R. Concentration and metabolism of volatile fatty acids in thefermentive organs of 2 species of kangaroo and the guinea-pig. Br. J. Nutr.1970;24:146-155.
270 HENNING S.J., HIRD F.J.R. Ketogenesis from acetate and butyrate by the caecum andthe colon of rabbits. Biochem. J. 1972;130:785-790.
271 ROEDIGER W.E.W. Cellular metabolism of short-chain fatty acids in colonic epithelialcells. In: ROCHE A.F., SILVERMAN E., eds. Short Chain Fatty Acids: Metabolism andClinical Importance. Columbus, Ohio: Ross Laboratories, 1991: 67-70.
272 BROWN R.C., KELLEHER J., LOSOWSKY M.S. The effect of pectin on the structure andfunction of the rat small intestine. Br. J. Nutr. 1979;42:357-365.
273 JACOBS L.R. Effects of dietary fiber on mucosal growth and cell proliferation in thesmall intestine of the rat: a comparison of oat bran, pectin, and guar with totalfiber deprivation. Am. J. Clin. Nutr. 1983;37:954-960.
274 SIGLEO S., JACKSON M.J., VAHOUNY G.V. Effects of dietary fiber constituents onintestinal morphology and nutrient transport. Am. J. Physiol. 1984;246:G34-G39.
275 JOHNSON I.T., GEE J.M., MAHONEY R.R. Effect of dietary supplements of guar gum andcellulose on intestinal cell proliferation, enzyme levels and sugar transport in therat. Br. J. Nutr. 1984;52:477-487.
276 SAKATA T., YAJIMA T. Influence of short chain fatty acids on the epithelial cell divisionof digestive tract. Q. J. Exp. Physiol. 1984;69:639-648.
277 CASSIDY M.M., LIGHTFOOT F.G., GRAU L.E., STORY J.A., KRITCHEVSKY D., VAHOUNY G.Effect of chronic intake of dietary fibers on the ultrastructural topography of ratjejunum and colon: a scanning electron microscopy study. Am. J. Clin. Nutr.1981;34:218-228.
127
REFERENCES
278 JACOBS L.R., WHITE F.A. Modulation of mucosal cell proliferation in the intestine ofrats fed a wheat bran diet. Am. J. Clin. Nutr. 1983;37:945-953.
279 JACOBS L.R., LUPTON J.R. Effect of dietary fibers on rat large bowel mucosal growthand cell proliferation. Am. J. Physiol. 1984;246:G378-G385.
280 JACOBS L.R., SCHNEEMAN B.O. Effects of dietary wheat bran on rat colonic structureand mucosal cell growth. J. Nutr. 1981;111:798-803.
281 SAKATA T, VON ENGELHARDT W. Stimulatory effect of short chain fatty acids on theepithelial cell proliferation in rat large intestine. Comp. Biochem. Physiol.1983;74A:459-462.
282 GOODLAD R.A., LENTON W., GHATEI M.A., ADRIAN T.E., BLOOM S.R., WRIGHT N.A.Effects of an elemental diet, inert bulk and different types of dietary fibre on theresponse of the intestinal epithelium to refeeding in the rat and relationship toplasma gastrin, enteroglucagon and PYY concentrations. Gut 1987;28:171-180.
283 GOODLAD R.A., RATCLIFFE B., FORDHAM J.P., WRIGHT N.A. Does dietary fibre stimulateintestinal epithelial cell proliferation in germ free rats. Gut 1989;30:820-825.
284 SAKATA T. Short chain fatty acids as the luminal trophic factor. Can. J. Anim. Sci.1984;64:189-190.
285 SAKATA T. Effects of indigestible dietary bulk and short chain fatty acids on the tissueweight and epithelial cell proliferation rate of the digestive tract in rats. J. Nutr.Sci. Vitaminol. 1986;32:355-362.
286 SAKATA T. Stimulatory effect of short chain fatty acids on epithelial cell proliferationin the rat intestine: a possible explanation for trophic effects of fermentable fibre,gut microbes and luminal trophic factors. Br. J. Nutr. 1987;58:95-103.
287 SAKATA T. Depression of intestinal epithelial cell production rate by hindgut bypassin rats. Scand. J. Gastroenterol. 1988;23:1200-1202.
288 JANNE P., CARPENTER Y., WILLEMS G. Colonic mucosal atrophy induced by a liquidelemental diet in rats. Am. J. Dig. Dis. 1977;22:808-812.
289 GOODLAD R.A., WRIGHT N.A. The effects of addition of cellulose or kaolin to anelemental diet on intestinal cell proliferation in the mouse. Br. J. Nutr.1983;50:91-98.
290 KRIPKE S.A., FOX A.D., BERMAN J.M., SETTLE R.G., ROMBEAU J.L. Stimulation of intestinalmucosal growth with intracolonic infusion of short-chain fatty acids. J. Parenter.Enter. Nutr. 1989;13:109-116.
291 KORUDA M.J., ROLANDELLI R.H., BLISS D.Z., HASTINGS J., ROMBEAU J.L., SETTLE R.G.Parenteral nutrition supplemented with short chain fatty acids: effect on thesmall bowel mucosa in normal rats. Am. J. Clin. Nutr. 1990;51:685-689.
292 FRANKEL W.L., ZHANG W., SINGH A. et al. Mediation of the trophic effects ofshort-chain fatty acids on the rat jejunum and colon. Gastroenterology1994;106:375-380.
293 JACOBS L.R., LUPTON J.R. Relationship between colonic luminal pH, cell proliferationand colon carcinogenesis in 1,2-dimethylhydrazine-treated rats fed high fiberdiets. Cancer Res. 1986;46:1727-1734.
128
REFERENCES
294 FREEMAN H.J. Effects of differing concentrations of sodium butyrate on1,2-dimethylhydrazine-induced rat intestinal neoplasia. Gastroenterology1986;91:596-602.
295 WATANABE K., REDDY B.S., WEISBURGER J.H., KRITCHEVSKY D. Effect of dietary alfalfa,pectin and wheat bran on azoxymethane- or methylnitrosourea-induced coloncarcinogenesis in F344 rats. J. Nat. Cancer Inst. 1979;63:141-145.
296 SCHEPPACH W., BARTRAM P., RICHTER A. et al. Effect of short chain fatty acids on thehuman colonic mucosa in vitro. J. Parenter. Enter. Nutr. 1992;16:43-48.
297 SCHEPPACH W.M. Short chain fatty acids are a trophic factor for the human colonicmucosa in vitro. In: Short Chain Fatty Acids: Metabolism and ClinicalImportance. Columbus, Ohio: Ross Laboratories, 1991: 90-93.
298 LIPKIN M., BLATTNER W.A., FRAUMENI J.F.J., LYNCH H.T., DESCHNER E.E., WINAWAR S.Tritiated thymidine labeling distribution in the identification of hereditarypredisposition to colon cancer. Cancer Res. 1983;43:1899-1904.
299 PRASAD K.N., SINHA P.K. Effect of sodium butyrate on mammalian cells in culture: areview. In Vitro 1976;12:125-132.
300 PRASAD K.N. Butyric acid: a small fatty acid with diverse biological functions. LifeSci. 1980;27:1351-1358.
301 KRUH J. Effects of sodium butyrate, a new pharmacological agent, on cells in culture.Mol. Cell. Biochem. 1982;42:65-82.
302 KRUH J., DEFER N., TICHONICKY L. Action moleculaire et cellulaire du butyrate. C.R.Soc. Biol. 1992;186:12-25.
303 FREGEAU C.J., HELGASON C.D., BLEACKLEY R.C. Two cytotoxic cell proteinase genes aredifferentially sensitive to sodium butyrate. Nucleic Acids Res. 1992;20:3113-3119.
304 SMITH P.J. n-Butyrate alters chromatin accessibility to DNA repair enzymes.Carcinogenesis 1986;7:423-429.
305 GLAUBER J.G., WANDERSEE N.J., LITTLE J.A., GINDER G.D. 5’ flanking sequences mediatebutyrate stimulation of embryonic globin gene expression in adult erythroidcells. Mol. Cell. Biol. 1991;11:4690-4697.
306 HAGUE A., MANNING A.M., HANLON K.A., HUSCHISCHA L.I., HART D., PARASKEVA C.Sodium butyrate induces apoptosis in human colonic tumour cell lines in ap53-independent pathway: implications for the possible role of dietary fibre inthe prevention of large bowel cancer. Int. J. Cancer 1993;55:498-505.
307 HAGUE A., ELDER D.J.E., HICKS D.J., PARASKEVA C. Apoptosis in colorectal tomour cells:induction by the short chain fatty acids butyrate, propionate and acetate and bythe biles alt deoxycholate. Int. J. Cancer 1995;60:400-406.
308 HAGOPIAN H.K., RIGGS M.G., SWARTZ L.A., INGRAM V.M. Effect of n-butyrate on DLAsynthesis in chick fibroblasts and HeLa cells. Cell 1977;12:855-860.
309 D’ANNA J.A., TOBEY R.A., GURLEY L.R. Concentration-dependent effects of sodiumbutyrate in Chinese hamster cells: cell-cycle progression, inner histone
129
REFERENCES
acetylation, histone H1 dephosphorylation and induction of an H1-like protein.Biochemistry 1980;19:2656-2671.
310 WINTERSBERGER E., MUDRAK I., WINTERSBERGER U. Butyrate inhibits mouse fibroblasts ata control point in the GI phase. J. Cell. Biochem. 1983;21:239-247.
311 TOSCANI A., SOPRANO D.R., SOPRANO K.J. Molecular analysis of sodiumbutyrate-induced growth arrest. Oncogene Res. 1988;3:223-238.
312 VAN WIJK R., TICHONICKY L., KRUH J. Effect of sodium butyrate on the hepatoma cellcycle: possible use for cell synchronization. In Vitro 1981;17:859-862.
313 FLATOW U., RABSON A.B., HAND P.H., WILLINGHAM M.C., RABSON A.S. Characterizationand tumorigenicity of a butyrate-adapted T24 bladder cancer cell line. CancerInvest. 1989;7:423-435.
314 GAMET L., DAVIAUD D., DENIS-POUXVIEL C., REMESY C., MURAT J.-C. Effects ofshort-chain fatty acids on growth and differentiation of the human colon-cancercell line HT29. Int. J. Cancer 1992;52:286-289.
315 DEXTER D.L., LEV R., MCKENDALL G.R., MITCHELL P., CALABRES P. Sodiumbutyrate-induced alteration of growth properties and glycogen levels in culturedhuman colon carcinoma cells. Histochem. J. 1984;16:137-149.
316 KIM Y.S., TSAO D., SIDDIQUI B. et al. Effects of sodium butyrate and dimethylsulfoxideon biochemical properties of human colon cancer cells. Cancer 1980;45:1185-1192.
317 WHITEHEAD R.H., YOUNG G.P., BHATHAL P.S. Effects of short chain fatty acids on a newhuman colon carcinoma cell line (LIM1215). Gut 1986;27:1457-1463.
318 TSAO D., MORITA A., BELLA A., LUU P., KIM Y.S. Differential effects of sodium butyrate,dimethyl sulfoxide and retinoic acid on membrane-associated antigen, enzymesand glycoproteins of human rectal adenocarcinoma cells. Cancer Res.1982;42:1052-1058.
319 CHUNG Y.S., SONG I.S., ERICKSON R.H., SLEISINGER M.H., KIM Y.S. Effect of growth andsodium butyrate on brush border membrane-associated hydrolases in humancolorectal cancer cell lines. Cancer Res. 1985;45:2976-2982.
320 GIBSON P.R., MOELLER I., KAGELARI O., FOLINO M., YOUNG G.P. Contrasting effects ofbutyrate on the expression of phenotypic markers of differentiation in neoplasticand non-neoplastic colonic epithelial cells in vitro. J. Gastroenterol. Hepatol.1992;7:165-172.
321 BLOOM E.J., SIDDIQUI B., HICKS J.W., KIM Y.S. Effect of sodium butyrate, adifferentiating agent, on cell surface glycoconjugates of a human pancreatic cellline. Pancreas 1989;4:59-64.
322 DYSON J.E.D., DANIEL J., SURREY C.R. The effect of sodium butyrate on the growthcharacteristics of human cervix tumour cells. Br. J. Cancer 1992;65:803-808.
323 NORDENBERG J., WASSERMAN L., BEERY E. et al. Growth inhibition of murine melanomaby butyric acid and dimethylsulfoxide. Exp. Cell Res. 1986;162:77-85.
130
REFERENCES
324 NORDENBERG J., WASSERMAN L., PELED A., MALIK Z., STENZEL K.H., NOVOGRODSKY A.Biochemical and ultrastructural alterations accompany the anti-proliferativeeffect of butyrate on melanoma cells. Br. J. Cancer 1987;55:493-497.
325 RAMA B.N., PRASAD K.N. Modification of the hyperthermic response on neuro-blastoma cells by cAMP and sodium butyrate. Cancer 1986;58:1448-1452.
326 REESE D.H., GRATZNER H.G., BLOCK N.L., POLITANO V.A. Control of growth,morphology and alkaline phosphatase activity by butyrate and relatedshort-chain fatty acids in the retinoid-responsive 9-1C rat prostaticadenocarcinoma cell. Cancer Res. 1985;45:2308-2313.
327 HALGUNSET J., LAMVIK T., ESSPEVIK T. Butyrate effects on growth, morphology andfibronectin production in PC-3 prostatic carcinoma cells. Prostate 1988;12:65-77.
328 GUILBAUD N.F., GAS N., DUPONT M.A., VALETTE A. Effects of differentiation-inducingagents on maturation of human MCF-7 breast cancer cells. J. Cell. Physiol.1990;145:162-172.
329 MORITA A., TSAO D., KIM Y.S. Effect of sodium butyrate on alkaline phosphatase inHRT-18, a human rectal cancer cell line. Cancer Res.1982;42:4540-4545.
330 GUM J.R., KAM W.K., BYRD J.C., HICKS J.W., SLEISINGER M.H., KIM Y.S. Effects of sodiumbutyrate on human colonic adenocarcinoma cells. Induction of placental-likealkaline phosphatase. J. Biol. Chem. 1987;262:1092-1097.
331 KIM Y.S., GUM J.R., HO S.B., DENG G. Colonocyte differentiation and proliferation:overview and the butyrate-induced transcriptional regulation ofoncodevelopmental placental-like alkaline phosphatase gene in colon cancercells. In: BINDER H.J., CUMMINGS J.H., SOERGEL K.H., eds. Short-Chain Fatty Acids.Lancaster, UK: Kluwer Academic, 1994: 119-134. (Falk Symposium; 73).
332 TOSCANI A., SOPRANO D.R., SOPRANO K.J. Sodium butyrate in combination withinsulin or dexamethasone can terminally differentiate actively proliferating Swiss3T3 cells into adipocytes. J. Biol. Chem. 1990;265:5722-5780.
333 LEDER A., LEDER P. Butyric acid, a potent inducer of erythroid differentiation incultural erythroleukemic cells. Cell 1975;5:319-322.
334 GLADHAUG I.P., CHRISTOFFERSEN T. n-Butyrate and dexamethasone synergisticallymodulate the surface expression of epidermal growth factor receptors in culturedrat hepatocytes. FEBS Lett. 1989;243:21-24.
335 GLADHAUG I.P., REFSNES M., CHRISTOFFERSEN T. Regulation of hepatocyte epidermalgrowth factor receptors by n-butyrate and dimethyl sulfoxide:sensitivity tomodulation by the tumor promoter TPA. Anticancer Res. 1989;9:1587-1592.
336 GLADHAUG I.P., REFSNES M., SAND T.-E., CHRISTOFFERSEN T. Effects of butyrate onepidermal growth factor receptor binding, morphology, and DNA synthesis incultured rat hepatocytes. Cancer Res. 1988;48:6560-6564.
337 KOOISTRA T., VAN DEN BERG J., TONS A., PLATENBURG G., RIJKEN D.C., VAN DEN BERG E.Butyrate stimulates tissue-type plasminogen-activator synthesis in culturedhuman endothelial cells. Biochem. J. 1987;247:605-612.
131
REFERENCES
338 CATTINI P.A., KARDAMI E., EBERHARDT N.L. Effect of butyrate on thyroidhormone-mediated gene expression in rat pituitary tumour cells. Mol. Cell.Endocrin. 1988;56:263-270.
339 BiRREN B.W., HERSCHMAN H.R. Regulation of the rat metallothionen-I gene by sodiumbutyrate. Nucleic Acids Res. 1986;14:853-867.
340 ORMANDY C.J., DE FAZIO A., KELLY P.A., SUTHERLAND R.L. Coordinate regulation ofoestrogen and prolactin receptor expression by sodium butyrate in human breastcancer cells. Biochem. Biophys. Res. Commun. 1992;182:740-745.
341 DE FAZIO A., CHIEW Y.-E., DONOGHUE C., LEE C.S.L., SUTHERLAND R.L. Effect of sodiumbutyrate on estrogen receptor and epidermal growth factor receptor geneexpression in human breast cancer cell lines. J. Biol. Chem. 1992;267:18008-18012.
342 SOULEIMANI A., ASSELIN C. Regulation of c-fos expression by sodium butyrate in thehuman colon carcinoma cell line Caco-2. Biochem. Biophys. Res. Commun.1993;193:330-336.
343 Wice B.M., Trugnan G., Pinto M., et al. The intracellular accumulation ofUDP-N-acetyl hexosamines is concomitant with the inability of human coloncancer cells to differentiate. J. Biol. Chem. 1985;260:139-146.
344 SAINI K., STEELE G., THOMAS P. Induction of carcinoembryonic-antigen-geneexpression in human colorectal carcinoma by sodium butyrate. Biochem. J.1990;272:541-544.
345 GIBSON P.R., ROSELLA O., ROSELLA G., YOUNG G.P. Butyrate is a potent inhibitor ofurokinase secretion by colonic epithelium in vitro. Gastroenterology1994;107:410-419.
346 GIBSON P.R., NOV R., FIELDING M., MCINTYRE A., ROSELLA O., MARIADASON J.M., FINCH
C.F., BARKLA D.H., YOUNG G.P. Dietary modulation of urokinase and mucosalhydrolase activities. Gastroenterology 1996;110:A915.
347 BATES S.E., CURRIER S.J., ALVAREZ M., FOJO A.T. Modulation of P-GlycoproteinPhosphorylation and drug transport by sodium butyrate. Biochemistry1992;31:6366-6372.
348 HIGGINS P.J., RYAN M.P. Cytoarchitecture of ras oncogene-expressing tumor cells:butyrate modulation of substrate adhesion, cytoskeletal actin content andsubcellular microfilament distribution. Int. J. Biochem. 1989;21:1143-1151.
349 MALIK H., NORDENBERG J., NOVOGRODSKY A., FUCHS A., MALIK Z. Chemical inducers ofdifferentiation, dimethylsulfoxide, butyric acid and dimethylthiourea, induceselective ultrasctructural patterns in B16 melanoma cells. Biol. Cell 1987;60:33-40.
350 WILSON J.R., WEISER M.M. Colonic cancer cell (HT29) adhesion to laminin is alteredby differentiation: adhesion may involve galactosyltransferase. Exp. Cell Res.1992;201:330-334.
351 KRUH J., DEFER N., TICHONICKY L. Effects of butyrate on cell proliferation and geneexpression. In: CUMMINGS J.H., ROMBEAU J.L., SAKATA T., eds. Physiological andClinical Aspects of Short-Chain Fatty Acids. Cambridge, UK: CambridgeUniversity Press, 1995: 275-288.
132
REFERENCES
352 BOFFA L.C., LUPTON J.R., MARIANI M.R. et al. Modulation of colonic epithelial cellproliferation, histone acetylation, and luminal short chain fatty acids by variationof dietary fiber (wheat bran) in rats. Cancer Res. 1992;52:5906-5912.
353 JOHNSTON L.A., TAPSCOTT S.J., EISEN H. Sodium butyrate inhibits myogenesis byinterfering with the transcriptional activation function of MyoD and Myogenin.Mol. Cell. Biol. 1992;12:5123-5130.
354 KLEHR D., SCHLAKE T., MAASS K., BODE J. Scaffold-attached regions (SAR Elements)mediate transcriptional effects due to butyrate. Biochemistry 1992;31:3222-3229.
355 BUSTIN S.A., NIE X.F., BARNARD R.C. Cloning and characterisation of ERF-1, a memberof the Tis11 family of early-response genes. DNA Cell Biol. 1994;13:449-459.
356 MACLEAN K.N., SEE C.G., McKAY I.A., BUSTIN S.A. The human immediate-early geneBRF1 maps to chromosome 14Q22-Q24. Genomics 1995;30(1):89-90.
357 HAGUE A., ELDER D.J.E., HICKS D.J., PARASKEVA C. Apoptosis in colorectal tumour cells:induction by the short chain fatty acids butyrate, propionate and acetate and bythe bile salt deoxycholate. Int. J. Cancer 1995;60:400-406.
358 YOUNG G.P., GIBSON P.R. Butyrate and the human cancer cell. In: Cummings J.H.,Rombeau J.L., Sakata T., eds. Physiological and Clinical Aspects of Short-chainFatty Acids. Cambridge, UK: Cambridge University Press, 1995: 319-336.
359 CUMMINGS J.H., STEPHEN A.M., BRANCH W.J. Implications of dietary fiber breakdownin the human colon. In: BRUCE W.R., CORREA P., LIPKIN M., TANNENBAUM S.R.,WILKINS T.D., eds. Gastrointestinal Cancer: Endogenous Factors. Cold SpringHarbor Laboratory, 1981: 71-81. (Banbury Report; 7).
360 AKANJI O.A., HOCKADAY T.D.R. Acetate tolerance and the kinetics of acetateutilization in diabetic and nondiabetic subjects. Am. J. Clin. Nutr.1992;51:112-118.
361 LUNDQUIST F., SESTOFT L., DAMGAARD S.E., CLAUSEN J.P., TRAP-JENSEN J. Utilization ofacetate in the human forearm during exercise after ethanol ingestion. J. Clin.Invest. 1973;52:3231-3235.
362 LINDENEG O., MELLEMGAARD K., FABRICIUS J., LUNDQUIST F. Myocardial utilization ofacetate, lactate and free fatty acids after ingestion of ethanol. Clin. Sci.1964;27:427-435.
363 WILLIAMSON J.R. Effects of insulin and starvation on the metabolism of acetate andpyruvate by the perfused rat heart. Biochem. J. 1964;93:97-106.
364 JUHLEN-DANNFELT A. Ethanol effects of substrate utilization by the human brain.Scand. J. Clin. Lab. Invest. 1977;37:443-449.
365 BUCKLEY B.M., WILLIAMSON D.H. Origins of blood acetate in the rat. Biochem. J.1977;166:539-545.
366 SEUFERT C.D., GRAF M., JANSON G., KUHN A., SOLING H.D. Formation of free acetateby isolated perfused livers from normal, starved and diabetic rats. Biochem.Biophys. Res. Commun. 1974;57:901-909.
133
REFERENCES
367 CROUSE J.R., GERSON C.D., DE CARLI L., LIEBER C.S. Role of acetate in the reduction ofplasma free fatty acids produced by ethanol in man. J. Lipid Res. 1968;9:509-512.
368 BOUCHIER I.A.D., DAWSON A.M. The effect of infusions of ethanol on the plasma freefatty acids in man. Clin. Sci. 1964;26:47-54.
369 SCHEPPACH W., CUMMINGS J.H., BRANCH W.J., SCHREZENMEIR J. Effect of gut-derivedacetate on oral glucose tolerance in man. Clin. Sci. 1988;75:355-361.
370 SCHEPPACH W., WIGGINS H.S., HALLIDAY D. et al. Effect of gut-derived acetate onglucose turnover in man. Clin. Sci. 1988;75:363-370.
371 BERGMAN D.N., ROE W.E., KON K. Quantitative aspects of propionate metabolism andgluconeogenesis in sheep. Am. J. Physiol. 1966;211:793-799.
372 Editorial. Propionate and cholesterol homeostasis in animals. Nutr. Rev.1987;45:188-190.
373 CHEN W.-J.L., ANDERSON J.W., JENNINGS D. Propionate may mediate thehypocholesterolemic effects of certain soluble plant fibres in cholesterol-fed rats.Proc. Soc. Exp. Biol. Med. 1984;175:215-218.
374 ILLMAN R.J., TOPPING D.L., MCINTOSH G.H. et al. Hypocholesterolaemic effects ofdietary propionate studies in whole animals and perfused rat liver. Ann. Nutr.Metabol. 1988;32:97-107.
375 BOILA R.J., SALOMONS M.D., MILLIGAN L.P., AHERNE F.X. The effect of dietary propionicacid on cholesterol synthesis in swine. Nutr. Rep. Int. 1981;23:1113-1121.
376 THACKER P.A., BOWLAND J.P. Effects of dietary propionic acid on serum lipids andlipoproteins of pigs fed diets supplemented with soybean meal or canola meal.Can. J. Anim. Sci. 1981;61:439-448.
377 THACKER P.A., SALOMONS M.O., AHERNE F.X., MILLIGAN L.P., BOWLAND J.P. Influence ofpropionic acid on the cholesterol metabolism of pigs fed hypercholesterolemicdiets. Can. J. Anim. Sci. 1981;61:969-975.
378 THACKER P.A., BOWLAND J.P., FENTON M. Effects of vitamin B12 on serum lipids andlipoproteins of pigs fed diets supplemented with propionic acid or calciumpropionate. Can. J. Anim. Sci. 1982;62:527-536.
379 VENTER C.S., VORSTER H.H., CUMMINGS J.H. Effects of dietary propionate oncarbohydrate and lipid metabolism in man. Am. J. Gastroenterol.1989;85:549-553.
380 TODESCO T., RAO V.A., BOSELLO O., JENKINS D.J.A. Propionate lowers blood glucoseand alters lipid metabolism in healthy subjects. Am. J. Clin. Nutr.1991;54:860-865.
381 STEPHEN A. Propionate-sources and effect on lipid metabolism. In: BINDER H.J.,CUMMINGS J., SOERGEL K., eds. Short-Chain Fatty Acids. Lancaster, UK: KluwerAcademic Publishers, 1994: 260-271. (Falk Symposium; 73).
382 WOLEVER T.M.S., BRIGHENTI F., ROYALL D., JENKINS A.L., JENKINS D.J.A. Effect of rectalinfusion of short chain fatty acids in human subjects. Am. J. Gastroenterol.1989;84:1027-1033.
134
REFERENCES
383 WOLEVER T.M.S., SPADAFORA P., ESHUIS H. Interaction between colonic acetate andpropionate in humans. Am. J. Clin. Nutr. 1991;53:681-687.
384 AnDERSON J.W., BRIDGES S.R. Plant fiber metabolites alter hepatic glucose and lipidmetabolism. Diabetes 1981;30(Suppl.1):133A.
385 REMESY C., DEMIGNE C., MORAND C. Metabolism of short-chain fatty acids in the liver.In: CUMMINGS J.H., ROMBEAU J.L., SAKATA T., eds. Physiological and ClinicalAspects of Short-Chain Fatty Acids. Cambridge, UK: Cambridge University Press,1994:171-190.
386 LEVITT M.D. Volume and composition of human intestinal gas determined by meansof an intestinal washout technic. New Engl. J. Med. 1971;284:1394-1398.
387 KIRK E. The quantity and composition of human colonic flatus. Gastroenterology1949;12:782-794.
388 CALLOWAY D.H. Respiratory hydrogen and methane as affected by consumption ofgas-forming foods. Gastroenterology 1966;51:383-389.
389 STEGGERDA F.R. Gastrointestinal gas following food consumption. Ann. New YorkAcad. Sci. 1968;150:57-66.
390 FLEMING S.E., CALLOWAY D.H., Determination of intestinal gas excretion. In: BIRCH
G.G., PARKER K., eds. Dietary fibre. London: Applied Science Publishers,1983:221-254.
391 MARTHINSEN D., FLEMING S.E. Excretion of breath and flatus gases by humansconsuming high-fiber diets. J. Nutr. 1982;112:1133-1143.
392 CHRISTL S.U., MURGATROYD P.R., GIBSON G.R., CUMMINGS J.H. Production, metabolismand excretion of hydrogen in the large intestine. Gastroenterology1992;102:1269-1277.
393 STEGGERDA F.R., RICHARDS E.A., RACKIS J.J. Effects of various soybean products onflatulence in the adult man. Proc. Soc. Exp. Biol. Med. 1966;121:1235-1239.
394 HICKEY C.A., CALLOWAY D.H., MURPHY E.L. Intestinal gas production followingingestion of fruits and fruit juices. Am. J. Dig. Dis. 1972;17:383-389.
395 HICKEY C.A., MURPHY E.L., CALLOWAY D.H. Intestinal gas production followingingestion of commercial wheaat cereals and milling fractions. Cereal Chem.1972;49:276-282.
396 MEYER S., CALLOWAY D.H. Gastrointestinal response to oat and wheat millingfractions in older women. Cereal Chem. 1977;54:110-119.
397 BOND J.H., LEVITT M.D. Effect of dietary fiber on intestinal gas production and smallbowel transit time in man. Am. J. Clin. Nutr. 1978;31:S169-S174.
398 MUIR J.G., LU Z.X., YOUNG G.P., CAMERON-SMITH D., COLLIER G.R., O’DEA K. Resistantstarch in the diet increases breath hydrogen and serum acetate in humansubjects. Am. J. Clin. Nutr. 1995;61:792-799.
399 TADESSE K., EASTWOOD M.A. Metabolism of dietary fibre components in man assessedby breath hydrogen and methane. Br. J. Nutr. 1978;40:393-396.
400 MCKAY L., BRYDON W.G., EASTWOOD M.A., SMITH J.H. The influence of pentose onbreath methane. Am. J. Clin. Nutr. 1981;34:2728-2733.
135
REFERENCES
401 FRITZ M., SIEBERT G., KASPER H. Dose dependence of breath hydrogen and methanein healthy volunteers after ingestion of a commercial disaccharide mixture,Palatinit. Br. J. Nutr. 1985;54:389-400.
402 FRITZ M., KASPER H., SCHREZENMEIR J., SIEBERT G. Effect of acarbose on the productionof hydrogen and methane and on hormonal parameters in young adults understandardized low-fibre mixed diets. Z. Ernahrungswiss. 1985;24:1-18.
403 LEVITT M.D., LASSER R.B., SCHWARTZ J.S., BOND J.H. Studies of a flatulent patient. NewEngl. J. Med. 1976;295:260-262.
404 LEVITT M.D., INGELFINGER F.J. Hydrogen and methane production in man. Ann. NewYork Acad. Sci. 1968;150:75-81.
405 LEVITT M.D. Production and excretion of hydrogen gas in man. New Engl. J. Med.1969;281:122-127.
406 CALLOWAY D.H., COLASITO D.J., MATHEWS R.D. Gases produced by human intestinalmicroflora. Nature 1966; 212:1238-1239.
407 BOND J.H., ENGEL R.R., LEVITT M.D. Factors influencing pulmonary methaneexcretion in man. An indirect method of studying the in situ metabolism of themethane-producing colonic bacteria. J. Exp. Med. 1971;133:572-588.
408 CHEN S., ZIEVE L., MAHADEVAN V. Mercaptans and dimethyl sulfide in the breath ofpatients with cirrhosis of the liver. J. Lab. Clin. Med. 1970;75:628-635.
409 ROBIN E.D., TRAVIS D.M., BROMBERG P.A., FORKNER C.E., TYLER J.M. Ammoniaexcretion by mammalian lung. Science 1959;129:270-271.
410 WOLIN M.M. The rumen fermentation: a model for microbial interactions inanaerobic ecosystems. Adv. Microb. Ecol. 1979;3:49-77.
411 BOND J.H., LEVITT M.D. Use of pulmonary hydrogen (H2) measurements to quantitatecarbohydrate absorption. Study of partially gastrectomized patients. J. Clin.Invest. 1972;51:1219-1225.
412 CALLOWAY D.H., MURPHY E.L., BAUER D. Determination of lactose intolerance bybreath analysis. Am. J. Dig. Dis. 1969;14:811-815.
413 LEVITT M.D., DONALDSON R.M. Use of respiratory hydrogen (H2) excretion to detectcarbohydrate malabsorption. J. Lab. Clin. Med. 1970;75:937-945.
414 METZ G., JENKINS D.J.A., PETERS T.J., NEWMAN A., BLENDIS L.M. Breath hydrogen as adiagnostic method for hypolactasia. Lancet 1975;i:1155-1156.
415 MILLER R.S., HOSKINS L.C. Mucin degradation in human colon ecosystems. Fecalpopulation densities of mucin-degrading bacteria estimated by a “most probablenumber” method. J. Clin. Invest 1981;67:759-765.
416 MACFARLANE G.T., HAY S., MACFARLANE S., GIBSON G.R. Effect of differentcarbohydrates on growth, polysaccharidase and glycosidase production byBacteroides ovatus, in batch and continuous culture. J. Appl. Bacteriol.1990;68:179-187.
417 DEGNAN B.A., MACFARLANE G.T. Comparison of carbohydrate substrate preferences ineight species of bifidobacteria. FEMS Microbiol. Let. 1991;84:151-156.
136
REFERENCES
418 BOND J.H., LEVITT M.D. Investigation of small bowel transit time in man utilisingpulmonary H measurements. J. Lab. Clin. Med. 1974;85:546-559.
419 BROOY L.S.J., MALE P.J., BEAVIS A.K., MISIEWICZ J.J. Assessment of the reproducibility ofthe lactulose H2 breath test as a measure of mouth to caecum transit time. Gut1983;24:893-896.
420 READ N.W., MILES C.A., FISHER D. Transit of a meal through the stomach, smallintestine, and colon in normal subjects and its role in the pathogenesis ofdiarrhoea. Gastroenterology 1980;79:1276-1282.
421 READ N.W., AL-JANABI M.N., BATES T.E. Interpretation of the breath hydrogen profileobtained after ingesting a solid meal containing unabsorbable carbohydrate. Gut1985;26:834-842.
422 BJORNEKLETT A., JENSSEN E. Relationships between hydrogen (H2) and methane (CH4)production in man. Scand. J. Gastroenterol. 1982;17:985-992.
423 ROBB T.A., GOODWIN D.A., DAVIDSON G.P. Faecal hydrogen production in vitro as anindicator for in vivo hydrogen producing capability in the breath hydrogen test.Acta Paediatr. Scand. 1985;74:942-944.
424 PERMAN J.A., MODLER S., OLSON A.C. Role of pH in production of hydrogen fromcarbohydrates by colonic bacterial flora. J. Clin. Invest. 1981;67:643-650.
425 PIQUE J.M., PALLARES M., CUSO E., VILAR-BONET J., GASSULL M.A. Methane productionand colon cancer. Gastroenterology 1984;87:601-605.
426 HAINES A., METZ G., DILAWARI J., BLENDIS L., WIGGINS H. Breath methane in patientswith cancer of the large bowel. Lancet 1977;ii:481-483.
427 MCKAY L.F., EASTWOOD M.A., BRYDON W.G. Methane excretion in man: a study ofbreath, flatus and faeces. Gut 1985;26:69-74.
428 PITT P., DE BRUIJN K.M., BEECHING M.F., GOLDBERG E., BLENDIS L.M. Studies on breathmethane: the effect of ethnic origins and lactulose. Gut 1980;21:951-959.
429 DRASAR B.S., TOMKINS A.M., WIGGINS H., HUDSON M. Breath methane levels andintestinal methanogenesis among rural Nigerians on a local diet. Proc. Nutr. Soc.1984;43:86A.
430 PELED Y., GILAT T., LIBERMAN E., BUJANOVER Y. The development of methane productionin childhood and adolescence. J. Pediatr. Gastroenterol. Nutr. 1985;4:575-579.
431 HOFF G., BJORNEKLETT A., MOEN I.E., JENSSEN E. Epidemiology of polyps in the rectumand sigmoid colon. Evaluation of breath methane and predisposition forcolorectal neoplasia. Scand. J. Gastroenterol. 1986;21:193-198.
432 KARLIN D.A., MASTROMARINO A.J., JONES R.D., STROEHLEIN J.R., LORENTZ O. Fecalskatole and indole and breath methane and hydrogen in patients with largebowel polyps or cancer. J. Cancer Res. Clin. Oncol. 1985;109:135-141.
433 MILLER T.L., WOLIN M.J. Enumeration of Methanobrevibacter smithii in human feces.Arch. Microbiol. 1982;131:14-18.
434 MILLER T.L., WOLIN M.J. Methanosphaera stadtmaniae gen. nov., sp. nov.: a speciesthat forms methane by reducing methanol with hydrogen. Arch. Microbiol.1985;141:116-122.
137
REFERENCES
435 MILLER T.L., WOLIN M.J. Methanogens in human and animal intestinal tracts. Syst.Appl. Microbiol. 1986;7:223-229.
436 MILLER T.L., WOLIN M.J. Oxidation of hydrogen and reduction of methanol tomethane is the sole energy source for a methanogen isolated from human feces.J. Bacteriol. 1983;153:1051-1055.
437 WOLIN M.J. Metabolic interactions among intestinal microorganisma. Am. J. Clin.Nutr. 1974;27:1320-1328.
438 MACFARLANE G.T., CUMMINGS J.H. The colonic flora, fermentation and large boweldigestive function. In: PHILLIPS S.F., PEMBERTON J.H., SHORTER R.G., eds. The LargeIntestine: Physiology, Pathophysiology and Diseases. New York: Raven Press,1990:51-92.
439 FLOURIE B., FLORENT C., JOUANY J.P., THIVEND P., ETANCHAUD F., RAMBAUD J.C. Colonicmetabolism of wheat starch in healthy humans. Effects on fecal outputs andclinical symptoms. Gastroenterology 1986;90:111-119.
440 BEERENS H., ROMOND C. Sulfate-reducing anaerobic bacteria in human feces. Am. J.Clin. Nutr. 1977;30:1770-1776.
441 GIBSON G.R., MACFARLANE S., MACFARLANE G.T. Metabolic interactions involvingsulphate-reducing and methanogenic bacteria in the human large intestine.FEMS Microbiol. Ecol. 1993;12:117-125.
442 GIBSON G.R., CUMMINGS J.H., MACFARLANE G.T. Growth and activities ofsulphate-reducing bacteria in gut contents from healthy subjects and patientswith ulcerative colitis. FEMS Microbiol. Ecol. 1991;86:103-112.
443 GIBSON G.R., CUMMINGS J.H., MACFARLANE G.T. Use of a three-stage continuousculture system to study the effect of mucin on dissimilatory sulfate reduction andmethanogenesis by mixed populations of human gut bacteria. Appl. Environ.Microbiol. 1988;54:2750-2755.
444 GIBSON G.R. A review - The physiology and ecology of sulphate-reducing bacteria.J. Appl. Bacteriol.1990;69:769-797.
445 GIBSON G.R., MACFARLANE G.T., CUMMINGS J.H. Occurrence of sulphate-reducingbacteria in human faeces and the relationship of dissimilatory sulphate reductionto methanogenesis in the large gut. J. Appl. Bacteriol.1988;65:103-111.
446 CHRISTL S.U., GIBSON G.R., CUMMINGS J.H. Methanogenesis in the human largeintestine. Gut 1993;34:573-574.
447 CHRISTL S.U., GIBSON G.R., CUMMINGS J.H. Role of dietary sulphate in the regulationof methanogenesis in the human large intestine. Gut 1992;33:1234-1238.
448 GIBSON G.R., CUMMINGS J.H., MACFARLANE G.T. et al. Alternative pathways forhydrogen disposal during fermentation in the human colon. Gut 1990;31:679-683.
449 KRISTJANSSON J.K., SCHONHEIT P., THAUER R.K. Different Ks values for hydrogen ofmethanogenic bacteria and sulfate-reducing bacteria: an explanation for theaparent inhibition of methanogenesis by sulfate. Arch. Microbiol.1982;131:278-282.
138
REFERENCES
450 FLORIN T.H.J., NEALE G., GIBSON G.R., CHRISTL S.U., CUMMINGS J.H. Metabolism ofdietary sulphate: absorption and excretion in humans. Gut 1991;32:766-773.
451 FLORIN T.H.J., NEALE G., GORETSKI S., CUMMINGS J.H. The sulphate content of foodsand beverages. J. Food Compos. Anal. 1993;6:140-151.
452 MACFARLANE G.T., GIBSON G.R. Formation of glycoprotein degrading enzymes byBacteroides fragilis. FEMS Microbiol. Let. 1991;77:289-294.
453 MACFARLANE G.T., HAY S., GIBSON G.R. Influence of mucin on glycosidase, proteaseand arylamidase activities of human gut bacteria grown in a 3-stage continuousculture system. J. Appl. Bacteriol. 1989;66:407-417.
454 TSAI H.H., SUNDERLAND D., GIBSON G.R., HART C.A., RHODES J.M. A novel mucinsulphatase from human faeces: its identification, purification andcharacterization. Clin. Sci. 1992;82:447-454.
455 VERCELLOTTI J.R., SALYERS A.A., BULLARD W.S., WILKINS T.D. Breakdown of mucin andplant polysaccharides in the human colon. Can. J. Biochem. 1977;55:1190-1196.
456 SMITH L., KRYSZYNA H., SMITH R.P. The effect of methaemoglobin on the inhibition ofcytochrome c oxidase by cyanide, sulfide or azide. Biochem. Pharmacol.1977;22:47-50.
457 FLORIN T.H.J., NEALE G., CUMMINGS J.H. The effect of hydrogen sulphide on isolatedrat colonic epithelium. In : Advances in the Treatment of Ulcerative Colitis(abstracts): 1990: 26 (Falk Symposium; 60).
458 LAJOIE S.F., BANKS S., MILLER T.L., WOLIN M.J. Acetate production from hydrogen and(13C) carbon dioxide by the microflora of human feces. Appl. Environ. Microbiol.1988;54:2723-2727.
459 DURAND M., BERNALIER A. Reductive acetogenesis in animal and human gut. In:CUMMINGS J.H., ROMBEAU J.L., SAKATA T., eds. Physiological and Clinical Aspectsof Short-Chain Fatty Acids. Cambridge, UK: Cambridge University Press, 1995:107-117.
460 CHRISTL S.U., GIBSON G.R., MURGATROYD P.R., SCHEPPACH W., CUMMINGS J.H. Impairedhydrogen metabolism in pneumatosis cystoides intestinalis. Gastroenterology1993;104:392-397.
461 ECKER J.A., WILLIAMS R.G., CLAY K.L. Pneumatosis cystoides intestinalis-bullousemphysema of the intestine. Am. J. Gastroenterol. 1971;56:125-136.
462 FORGACS P., WRIGHT P.H., WYATT A.P. Treatment of intestinalis gas cysts by oxygenbreathing. Lancet 1973;1:579-582.
463 GILLON T., TADESSE K., LOGAN R.F.A., HOLT S., SIRCUS W. Breath hydrogen inpneumatosis cystoides intestinalis. Gut 1979;20:1008-1011.
464 READ N.W., AL-JANABI M.N., CANN P.A. Is raised breath hydrogen related to thepathogenesis of pneumatosis coli? Gut 1984;25:839-845.
465 FLORIN T.H.J., HILLS B.A. Does counterperfusion supersaturation cause gas cysts inpneumatosis cystoides coli, and can breathing heliox reduce them? Lancet1995;345:1220-1222.
139
REFERENCES
466 LEVITT M.D., OLSSON S. Pneumatosis cystoides intestinalis and high breath H2excretion: insights into the role of H2 in this condition. Gastroenterology1995;108:1560-1565.
467 ROEDIGER W.E.W. The colonic epithelium in ulcerative colitis: an energy-deficiencydisease? Lancet 1980;2:712-715.
468 IRELAND A., JEWELL D.P. 5-aminosalicylic acid (5-ASA) has no effect on butyratemetabolism in human colonic epithelial cells. Gastroenterology 1989;98:A176.
469 CHAPMAN M.A.S., GRAHN M., GIAMUNDO P., O’CONNELL P.R., ONWU D., HUTTON M. etal. A new technique to measure mucosal metabolism and its use to map substrateutilisation in the healthy human large bowel. Br. J. Surg. 1993;80:445-449.
470 CHAPMAN M.A.S., GRAHN M.F., BOYLE M.A., HUTTON M., ROGERS J., WILLIAMS N.S.Butyrate oxidation is impaired in the colonic mucosa of sufferers of quiescentulcerative colitis. Gut 1994;35:73-76.
471 WILLIAMS N.N., BRANIGAN A., FITZPATRICK J.M., O’CONNELL P.R. Glutamine and butyricacid metabolism measurement in biopsy specimens (in vivo): a method ofassessing treatment on inflammatory bowel conditions. Gastroenterology1992;102:A713.
472 FINNIE I.A., TAYLOR B.A., RHODES J.M. Ileal and colonic epithelial metabolism inquiescent ulcerative colitis: increased glutamine metabolism in distal colon butno defect in butyrate metabolism. Gut 1994;34:1552-1558.
473 ROEDIGER W.E.W. Colonic epithelial metabolism in ulcerative colitis. Gut1993;34:1646.
474 ROEDIGER W.E.W., LAWSON M.J., KWOK V., KERR GRANT A., PANNALL P.R. Colonicbicarbonate output as a test of disease activity in ulcerative colitis. J. Clin. Pathol.1984;37:704-707.
475 ROEDIGER W.E.W., NANCE S. Metabolic induction of experimental ulcerative colitis byinhibition of fatty acid oxidation. Br. J. Exp. Pathol. 1986;67:773-782.
476 MARCUS R., WATT J. Seaweeds and ulcerative colitis in laboratory animals. Lancet1969;August:489-490. (Letters).
477 MARCUS R., WATT J., PATH M.R.C. Ulcerative disease of the colon in laboratoryanimals induced by pepsin inhibitors. Gastroenterology 1974;67:473-483.
478 ONDERDONK A., HERMOS J., BARTLETT J. The role of the intestinal microflora inexperimental colitis. Am. J. Clin. Nutr. 1977;30:1819-1825.
479 VAN DE WAAIJ D., COHEN B.J., ANVER M.R. Mitigation of experimental inflammatorybowel disease in guinea pigs by selective elimination of the aerobicgram-negative intestinal microflora. Gastroenterology 1974;67:460-472.
480 ONDERDONK A.B., HERMOS J.A., DZINK J.L., BARTLETT J.G. Protective effect ofmetronidazole in experimental ulcerative colitis. Gastroenterology 1978;74:521-526.
481 KITANO A., KOBAYASHI K., OSHIUMI H. et al. Studies of experimental ulcerative colitisinduced by carrageenan in rabbits. Jpn. J. Gastroenterol. 1981;78:2104-2111.
140
REFERENCES
482 ONDERDONK A.B., BARTLETT M.D. Bacteriological studies of experimental ulcerativecolitis. Am. J. Clin. Nutr. 1979;32:258-265.
483 HIRONO I., SUMI Y., KUHARA K., MIYAKAWA M. Effect of degraded Carrageenan on theintestine in germfree rats. Toxicol. Let. 1981;8:207-212.
484 OHKUSA T. Production of experimental ulcerative colitis in hamsters by dextransulfate sodium and change in intestinal microflora. Jpn. J. Gastroenterol.1985;82:1327-1336.
485 OKAYASU I., HATAKEYAMA S., YAMADA M., OHKUSA T., INAGAKI Y., NAKAYA R. A novelmethod in the induction of reliable experimental acute and chronic ulcerativecolitis in mice. Gastroenterology 1990;98:694-702.
486 OHKUSA T., YAMADA M., TAKENAGA TEA. Protective effect of metronidazole inexperimental ulcerative colitis induced by dextran sulfate sodium. Jpn. J.Gastroenterol. 1987;84:2337-2346.
487 PITCHER M.C.L., BEATTY E.R., GIBSON G.R., CUMMINGS J.H. Incidence and activities ofsulphate-reducing bacteria in patients with ulcerative colitis. Gut 1995;36:A63.
488 AXELSSON L.G., LUNDSTROM L., BYLUND-FELLENIUS A.C., MIDTVEDT T. Dextran sulphatesodium induced colitis and sulfasalazine treatment in bacteria-free mice.Gastroenterology 1995;108:A775.
489 AXELSSON L.-G., LANDSTROM E., BYLUND-FELLENIUS A.C. Sulfasalazine and olsalazineare effective for the treatment of dextran sulfate induced colitis in athymic mice.Gastroenterology 1994;106:A648.
490 BYLUND-FELLENIUS A.C., LANDSTROM E., AXELSSON L.-G. Sulfasalazine amelioratescolitis induced by oral administration of dextran sulfate in mice.Gastroenterology 1994;106:A659.
491 CHEN Y., CONNER E.M., GRISHAM M.B. Dextran sulfate sodium induces colitis in ratsby enhancing mucosal permeability: effects of sulfasalazine. Gastroenterology1995;108:A796.
492 YOSHIZUMI M., HIRATA I., SASAKI SEA. Effects of various drugs on chronic colitisinduced by dextran sulfate sodium in rats. Gastroenterology 1995;108:A947.
493 PITCHER M.C.L., BEATTY E.R., CUMMINGS J.H. Salicylates inhibit bacterial sulphideproduction within the colonic lumen in ulcerative colitis. Gut 1995;37:A15.
494 ROEDIGER W.E.W., DUNCAN A., KAPANIRIS O., MILLARD S. Reducing sulfur compoundsof the colon impair colonocyte nutrition: implications for ulcerative colitis.Gastroenterology 1993;104:802-809.
495 DUNCAN A., KAPANIRIS O., ROEDIGER W.E.W. Measurement of mercaptoacetate levelsin anaerobic batch culture of colonic bacteria. FEMS Microbiol. Ecol.1990;74:303-308.
496 ROEDIGER W.E.W., DUNCAN A., KAPANIRIS O., MILLARD S. Sulphide impairment ofsubstrate oxidation in rat colonocytes: a biochemical basis for ulcerative colitis?Clin. Sci. 1993;85:623-627
141
REFERENCES
497 MOORE J.W.E., ROEDIGER W.E.W. Hydrogen sulphide in vivo diminishes fatty acidoxidation in the colonic mucosa; implications for ulcerative colitis. In:Inflammatory Bowel Disease (abstracts), 1995:56 (Falk Symposium; 85).
498 ASLAM M., BATTEN J.J., FLORIN T.H.J., SIDEBOTHAM R.L., BARON J.H. Hydrogen sulphideinduced damage to the colonic mucosal barrier in the rat. Gut 1992;33:F274.
499 MAYALL T., MACPHERSON A., BJARNASON I., FORGACS I., PETERS T. Mitochondrial functionof colonic epithelial cells in inflammatory bowel disease. Gut 1992;33:S24.
500 STEIN J., SCHRÖDER O., MILOVIC V., CASPARY W. Mercaptopropionate inhibits butyrateuptake in isolated apical membrane vesicles of the rat distal colon.Gastroenterology 1995;108:673-679.
501 ROEDIGER W.E.W., HEYWORTH M., WILLOUGHBY P., PIRIS J., MOORE A., TRUELOVE S.C.Luminal ions and short chain fatty acids as markers of functional activity of themucosa in ulcerative colitis. J. Clin. Pathol. 1982;35:323-326.
502 VERNIA P., GNAEDINGER A., HAUCK W., BREUER R.I. Organic anions and the diarrhea ofinflammatory bowel disease. Dig. Dis. Sci. 1988;33:1353-1358.
503 VERNIA P., CAPRILLI R., LATELLA G., BARBETTI F., MAGLIOCCA F.M., CITTADINI M. Fecallactate and ulcerative colitis. Gastroenterology 1988;95:1565-1568.
504 HOVE H., CLAUSEN M.R., MORTENSEN P.B. Lactate and pH in faeces from patients withcolonic adenomas or cancer. Gut 1993;34:625-629.
505 BREUER R.I., BUTO S.K., CHRIST M.L. et al. Rectal irrigation with short chain fatty acidsfor distal ulcerative colitis. Dig. Dis. Sci. 1991;36:185-187.
506 BREUER R.I., CHRIST M.L., LASHNER B.A. et al. Short-chain fatty acid rectal irrigationtherapy for left sided ulcerative colitis: a randomized, placebo-controlled clinicaltrial. In: BINDER H.J., CUMMINGS J., SOERGEL K.H., eds. Short-Chain Fatty Acids. Lan-caster, UK: Kluwer Academic Publishers, 1994: 214-220. (Falk Symposium; 73).
507 SCHEPPACH W., SOMMER H., KIRCHNER T. et al. Effect of butyrate enemas on the colonicmucosa in distal ulcerative colitis. Gastroenterology 1992;103:51-56.
508 SENAGORE A.J., MACKEIGAN J.M., SCHEIDER M., EBROM J.S. Short-chain fatty acidenemas: a cost effective alternative in the treatment of non-specificproctosigmoiditis. Dis. Colon Rectum 1992;35:923-927.
509 VERNIA P., CITTADINI M., MARCHEGGIANO A. et al. Short chain fatty acid (SCFA) enemasin distal ulcerative colitis: a double blind placebo controlled study. In: Short-Chain Fatty Acids (abstracts), 1993: D8 (Falk Symposium; 73).
510 VERNIA P., MARCHEGGIANO A., CAPRILLI R. et al. Short-chain fatty acid topical treatmentin distal ulcerative colitis. Aliment. Pharmacol. Ther. 1995;9:309-313.
511 STEINHART A.H., BAKER J.P., BRZEZINSKI A. Butyrate enemas in the treatment ofrefractory ulcerative proctosigmoiditis. In: Short-Chain Fatty Acids (abstracts),1993: D1 (Falk Symposium; 73).
512 STEINHART A.H., HIRUKI T., BRZEZINSKI A., BAKER J.P. Treatment of left-sided ulcerativecolitis with butyrate enemas: a randomized controlled trial. Gastroenterology1995;108:A921.
142
REFERENCES
513 PITCHER M.C.L., BEATTY E.M., WARING R.H., CUMMINGS J.H. Is there a defect in sulphurmetabolism in ulcerative colitis? Gut 1995;37:A22.
514 GLOTZER D.J., GLICK M.E., GOLDMAN H. Proctitis and colitis following diversion of thefecal stream. Gastroenterology 1981;80:438-441.
515 KORELITZ B.I., CHESKIN L.J., SOHN N., SOMMERS S.C. Proctitis after fecal diversion inCrohn’s disease and its elimination with reanastomosis: implications for surgicalmanagement. Gastroenterology 1984;87:710-713.
516 NEUT C., COLOMBEL J.F., GUILLEMOT F. et al. Impaired bacterial flora in humanexcluded colon. Gut 1989;30:1094-1098.
517 LUSK L.B., REICHEN J., LEVINE J.S. Aphthous ulceration in diversion colitis.Gastroenterology 1984;87:1171-1173.
518 ROEDIGER W.E.W. The starved colon - diminished mucosal nutrition, diminishedabsorption and colitis. Dis. Colon Rectum 1990;33:858-862.
519 HARIG J.M., SOERGEL K.H., KOMOROWSKI R.A., WOOD C.M. Treatment of diversioncolitis with short-chain fatty acid irrigation. New Engl. J. Med. 1989;320:23-28.
520 GUILLEMOT F., COLOMBEL J.F., NEUT C. et al. Treatment of diversion colitis by shortchain fatty acids. Dis. Colon Rectum 1991;34:861-864.
521 WISCHMEYER P.E., TREMAINE W.J., HADDAD A.C., AMBROZE W.L., PEMBERTON J.H., PHILLIPS
S.F. Fecal short chain fatty acids in patients with pouchitis after ileal pouch analanastomosis. Gastroenterology 1991;100:A848.
522 CLAUSEN M.R., TVEDE M., MORTENSEN P.B. Short chain fatty acids in pouch contentsfrom patients with and without pouchitis after ileal pouch-anal anastomosis.Gastroenterology 1992;103:1144-1153.
523 DE SILVA H.J., IRELAND A., KETTLEWELL M., MORTENSEN N., JEWELL D.P. Short chain fattyacid irrigation in severe pouchitis. New Engl. J. Med. 1989;321:1416-1417.
524 WISCHMEYER P., GROTZ R.L., PEMBERTON J.H., PHILLIPS S.F. Treatment of pouchitis afterileo-anal anastomosis with glutamine and butyric acid. Gastroenterology1992;102:A617.
525 WEAVER L.T. Review: Bowel habit from birth to old age. J. Pediatr. Gastroenterol.Nutr. 1988;7:637-640.
526 RENDTORFF R.C., KASHGARIAN M. Stool patterns of healthy adult males. Dis. ColonRectum 1967;10:222-228.
527 BASS P., DENNIS S. The laxative effects of lactulose in normal and constipatedsubjects. J. Clin. Gastroenterol. 1981;3:23-28.
528 THOMPSON W.G., HEATON K.W. Functional bowel disorders in apparently healthypeople. Gastroenterology 1980;79:283-288.
529 DAVIES G.J., CROWDER M., REID B., DICKERSON J.W.T. Bowel function measurements ofindividuals with different eating patterns. Gut 1986;27:164-169.
530 GRAHAM D.Y., MOSER S.E., ESTES M.K. The effect of bran on bowel function inconstipation. Am. J. Gastroenterol. 1982;77:599-603.
143
REFERENCES
531 EASTWOOD M.A., BRYDON W.G., BAIRD J.D. et al. Fecal weight and composition,serum lipids and diet among subjects aged 18 to 80 not seeking health care. Am.J. Clin. Nutr. 1984;40:628-634.
532 WYMAN J.B., HEATON K.W., MANNING A.P., WICKS A.C.B. Variability of colonicfunction in healthy subjects. Gut 1978;19:146-150.
533 BINGHAM S.A., CUMMINGS J.H. Effect of exercise and physical fitness on largeintestinal function. Gastroenterology 1989;97:1389-1399.
534 TUCKER D.M., SANDSTEAD H.H., LOGAN G.M. et al. Dietary fiber and personalityfactors as determinants of stool output. Gastroenterology 1981;81:879-883.
535 CUMMINGS J.H., JENKINS D.J.A, WIGGINS H.S. Measurement of the mean transit time ofdietary residue through the human gut. Gut 1976;17:210-218.
536 HINTON J.M., LENNARD-JONES J.E., YOUNG A.C. A new method for studying gut transittimes using radio-opaque markers. Gut 1969;10:842-847.
537 CASSANO C.C., DEL VECCHIO E., CAPURSO L. I tempi di transito gastrointestinali. Radiol.Pract. 1968;18:207-223.
538 EASTWOOD H.D.H. Bowel transit studies in the elderly: radio-opaque markers in theinvestigation of constipation. Gerontol. Clin. 1972;14:154-159.
539 HINTON J.M., LENNARD-JONES J.E. Constipation: definition and classification. Postgrad.Med. J. 1968;44:720-723.
540 ABRAHAMSON H., ANTOV S., BOSAEUS I. Gastrointestinal and colonic segmental transittime evaluated by a single abdominal x-ray in healthy subjects and constipatedpatients. Scand. J. Gastroenterol. 1988;23:72-80.
541 CHAUSSADE S., ROCHE H., KHYARI A., COUTURIER D., GUERRE J. Mesure du temps detransit colique (TTC): description et validation d’une nouvelle technique.Gastroenterol. Clin. Biol. 1986;10:385-389.
542 CHAUSSADE S., KHYARI A., ROCHE H. et al. Determination of total and segmentalcolonic transit time in constipated patients. Results in 91 patients with a newsimplified method. Dig. Dis. Sci. 1989;34:1168-1172.
543 STASSE-WOLTHUIS M., KATAN M.B., HAUTVAST J.G.A.J. Fecal weight, transit time andrecommendations for dietary fiber intake. Am. J. Clin. Nutr. 1978;31:909-910.
544 SPILLER G.A. Suggestions for a basis on which to determine a desirable intake ofdietary fiber. In: SPILLER G.A., ed. CRC Handbook of Dietary Fiber in HumanNutrition. Boca Raton, Florida: CRC Press, 1986: 281-283.
545 CUMMINGS J.H. Constipation, dietary fibre and the control of large bowel function.Postgrad. Med. J. 1984;60:811-819.
546 CUMMINGS J.H., HILL M.J., JIVRAJ T., HOUSTON H., BRANCH W.J., JENKINS D.J.A. Theeffect of meat protein and dietary fiber on colonic function. Part I. Changes inbowel habit, bile acid excretion and calcium absorption. Am. J. Clin. Nutr.1979;32:2086-2093.
547 CUMMINGS J.H., WIGGINS H.S., JENKINS D.J.A. et al. Influence of diets high and low inanimal fat on bowel habit, gastrointestinal transit time, fecal microflora, bile acidand fat excretions. J. Clin. Invest. 1978;61:953-963.
144
REFERENCES
548 Ministry of Agriculture Fisheries and Food. Annual Report of the National FoodSurvey. London: HMSO, 1990.
549 CUMMINGS J.H. Non-starch polysaccharides (dietary fibre) including bulk laxatives inconstipation. In: KAMM M.A., LENNARD-JONES J.E., eds. Constipation. Petersfield,UK: Wrightson Biomedical Publishing, 1994: 307-314.
550 CUMMINGS J.H. The effect of dietary fiber on fecal weight and composition. In: SPILLER
G.A., ed. CRC Handbook of Dietary Fiber in Human Nutrition. 2d ed. BocaRaton, Florida: CRC Press, 1993: 263-349.
551 TOMLIN J., READ N.W. The relation between bacterial degradation of viscouspolysaccharides and stool output in human beings. Br. J. Nutr. 1988;60:467-475.
552 TOMLIN J., READ N.W. Laxative properties of indigestible plastic particles. Br. Med. J.1988;297:1175-1176.
553 CUMMINGS J.H. Dietary fibre and the intestinal microflora. In: HALLGREN B., ed.Nutrition and the Intestinal Flora. Stockholm: Swedish Nutrition Foundation,1983: 77-86.
554 KURPAD A.V., SHETTY P.S. Effects of antimicrobial therapy on faecal bulking. Gut1986;27:55-58.
555 PRYNNE C.J., SOUTHGATE D.A.T. The effects of a supplement of dietary fibre on faecalexcretion by human subjects. Br. J. Nutr. 1979;41:495-503.
556 CUMMINGS J.H., SOUTHGATE D.A.T., BRANCH W., HOUSTON H., JENKINS D.J.A., JAMES
W.P.T. The colonic response to dietary fibre from carrot, cabbage, apple, branand guar gum. Lancet 1978;i:5-9.
557 TOMLIN J., READ N.W. A comparative study of the effects on colon function causedby feeding ispaghula husk and polydextrose. Aliment. Pharmacol. Ther.1988;2:513-519.
558 HESPELL R.B. Efficiency of growth by ruminal bacteria. Fed. Proc. 1979;38:2707-2712.
559 HESPELL R.B., BRYANT M.P. Efficiency of rumen microbial growth: influence of sometheoretical and experimental factors on ATP. J. Anim. Sci. 1979;49:1640-1659.
560 GREGORY J., FOSTER K., TYLER H. T., WISEMAN M. The dietary and nutritional survey ofBritish adults. Office of Population Censuses and Surveys. London: HMSO,Publications Centre 1990.
561 KAMM M.A., LENNARD-JONES J.E., eds. Constipation. Petersfield, UK: WrightsonBiomedical Publishing, 1994.
562 CUMMINGS J.H. Constipation. In: MISIEWICZ J.J., POUNDER R.E., VENABLES C.W., eds.Diseases of the Gut and Pancreas. 2d ed. Oxford: Blackwell ScientificPublications, 1994: 51-70.
563 DEVROEDE G. Constipation. In: SLEISENGER M.H., FORDTRAN J.S., eds. GastrointestinalDisease: Pathophysiology, Diagnosis, Management. 5th ed. Philadelphia, USA:W.B. Saunders, 1994: 837-887.
564 SANDLER R.S., DROSSMAN D.A. Bowel habits in young adults not seeking health care.Dig. Dis. Sci. 1987;32:841-845.
145
REFERENCES
565 MOORE-GILLON V. Constipation: what does the patient mean? J. R. Soc. Med.1984;77:108-110.
566 SANDLER R.S., JORDAN M.C., SHELTON B.J. Demographic and dietary determinants ofconstipation in the US population. Am. J. Public Health 1990;80:185-189.
567 FOTHERBY K.J., HUNTER J.O. Idiopathic slow-transit constipation: whole gut transittimes, measured by a new simplified method, are not shortened by opioidantagonists. Aliment. Pharmacol. Ther. 1987;1:331-338.
568 PRESTON D.M., LENNARD-JONES J.E. Severe chronic constipation of young women:‘idiopathic slow transit constipation’. Gut 1986;27:41-48.
569 BARRETT J.A. Management of constipation. Gen. Med. Suppl.: Constipation1989;(March):14-18.
570 ROE A.M., BARTOLO D.C.C., MORTENSEN N.J.M. Diagnosis and surgical managementof intractable constipation. Br. J. Surg. 1986;73:854-861.
571 WALD A. Colonic transit and anorectal monometry in chronic idiopathicconstipation. Arch. Intern. Med. 1986;146:1713-1716.
572 WATIER A., DEVROEDE G., DURANCEAU A. Constipation with colonic inertia: amanifestation of systemic disease? Dig. Dis. Sci. 1983;28:1025-1033.
573 RAO S.S.C., READ N.W., BROWN C., BRUCE C., HOLDSWORTH C.D. Studies on themechanism of bowel disturbance in ulcerative colitis. Gastroenterology 1987;93:934-940.
574 WEBER J., DENIS P., MIHOUT B., et al. Effect of brain-stem lesions on colonic andanorectal motility. Study of three patients. Dig. Dis. Sci. 1985;30:419-425.
575 MARTELLI H., DEVROEDE G., ARHAN P., DUGUAY C. Mechanisms of idiopathicconstipation: outlet obstruction. Gastroenterology 1978;75:623-631.
576 SCHANG J.C., DEVROEDE G., DUGUAY C., HEMOND M., HEBERT M. Constipation parinertie colique et obstruction distale: étude électromyographique. Gastroentérol.Clin. Biol. 1985;9:480-485.
577 BINGHAM S., MCNEIL N.I., CUMMINGS J.H. The diet of individuals: a study ofrandomly-chosen cross section of British adults in a Cambridgeshire village. Br.J. Nutr. 1981;45:23-35.
578 BINGHAM S. Dietary fibre intake studies: problems, methods and results. In: TROWELL
H.S., BURKITT D.P., HEATON K.W., eds. Dietary fibre – fibre-depleted foods anddisease. 2d ed. London: Academic Press, 1985: 77-104.
579 BINGHAM S. Aspects of dietary fibre methodology. Br. Nutr. Found. Bull.1985;10:90-103.
580 BINGHAM S. Dietary fibre consumption and its association with large bowel cancerin man. Med. Oncol. Tumour Pharmacother. 1985;2:149-155.
581 BINGHAM S. Definitions and intakes of dietary fibre. Am. J. Clin. Nutr.1987;45:1226-1231.
582 BINGHAM S., PETT S., DAY K.C. NSP intake of a representative sample of British adults.J. Hum. Nutr. Diet. 1990;3:333-337.
146
REFERENCES
583 EMMETT P.M., SYMES C.L., HEATON K.W. Dietary intake and sources of non-starchpolysaccharide in English men and women. Eur. J. Clin. Nutr. 1993;47:20-30.
584 RASMUSSEN H.S., HOLTUG K., ANDERSEN J.R., KRAG E., MORTENSEN P.B. The influence ofispaghula husk and lactulose on the in vivo and the in vitro production capacityof short-chain fatty acids in humans. Scand. J. Gastroenterol. 1987;22:406-410.
585 EDWARDS C.A., BOWEN J., BRYDON W.G., EASTWOOD M.A. The effects of ispaghula onrat caecal fermentation and stool output. Br. J. Nutr. 1992;68:473-482.
586 EASTWOOD M.A., BRYDON W.G., ANDERSON D.M.W. The effects of dietary gum karaya(sterculia) in man. Toxicol. Lett. 1983;17:159-166.
587 RAYMOND W.R., NAGEL C.W. Microbial degradation of gum karaya. Carbohydr. Res.1973;30:293-312.
588 EASTWOOD M.A., SMITH A.N. Hydrophilic colloids in colonic motility. In: BERTACCINI
G., ed. Handbook of Experimental Pharmacology. Berlin: Springer-Verlag, 1982:323-346. (vol 59/II).
589 OPCS. Office of Population Censuses & Surveys, 1993. (OPCS Monitor DH2 93/2).
590 IARC/WHO, eds. Cancer Incidence in Five Continents. Lyon, France: InternationalAgency for Research on Cancer. 1992. (IARC Scientific Publications No. 120).
591 POTTER J.D. Reconciling the epidemiology, physiology and molecular biology ofcolon cancer. J. Am. Med. Ass. 1992;268:1573-1577.
592 FEARON E.R., VOGELSTEIN B. A genetic model for colorectal tumorigenesis. Cell1990;61:759-767.
593 BINGHAM S.A. Diet and large bowel cancer. J. R. Soc. Med. 1990;83:420-422.
594 TROCK B., LANZA E., GREENWALD P. Dietary fiber, vegetables and colon cancer. Criticalreview and meta analysis of the epidemiologic evidence. J. Natl. Cancer Inst.1990;82:650-661.
595 IARC, ed. Alcohol drinking. IARC Monogr. Carcinog. Risks Hum. 1988;44:1-416.
596 RIBOLI E., CORNEE J., MACQUART-MOULIN G., KAAKS R., CASAGRANDE C., GUYADER M.Cancer and polyps of the colorectum and lifetime consumption of beer and otheralcoholic beverages. Am. J. Epidemiol. 1991;134:157-166.
597 BINGHAM S.A. Mechanisms and experimental and epidemiological evidence relatingdietary fibre (non-starch polysaccharides) and starch to protection against largebowel cancer. Proc. Nutr. Soc. 1990;49:153-171.
598 GERHARDSSON M., NORELL S.E., KIVIRANTA H., PEDERSEN N.L., AHLBOM A. Sedentary jobsand colon cancer. Am. J. Epidemiol. 1986;123:775-780.
599 GERHARDSSON M., FLODERUS B., NORELL S.E. Physical activity and colon cancer risk.Int. J. Epidemiol. 1988;17:743-746.
600 GERHARDSSON M., STEINECK G., HAGMAN U., RIEGER A., NORELL S.E. Physical activityand colon cancer: a case-referent study in Stockholm. Int. J. Cancer1990;46:985-989.
601 HERRERA L., KAKATI S., GIBAS L., PIETRZAK E., SANDBERG A.A. Brief clinical report:Gardner syndrome in a man with an interstitial deletion of 5q. Am. J. Med.Genet. 1986;25:473-476.
147
REFERENCES
602 BODMER W.F., BAILEY C.J., BODMER J. et al. Localization of the gene for familialadenomatous polyposis on chromosome 5. Nature 1987;328:614-616.
603 KINZLER K.W., NILBERT M.C., SU L.K. et al. Identification of FAP locus genes fromchromosome 5q21. Science 1991;253:661-665.
604 NISHISHO I., NAKAAMURA Y., MIYOSHI Y. et al. Mutations of chromosome 5q21 genesin FAP and colorectal cancer patients. Science 1991;253:665-669.
605 SOLOMON E., VOSS R., HALL V. et al. Chromosome 5 allele loss in human colorectalcarcinomas. Nature 1987;328:616-618.
606 GRIFFITHS D.F.R., SACCO P., WILLIAMS D., WILLIAMS G.T., WILLIAMS E.D. The clonalorigin of experimental large bowel tumours. Br. J. Cancer 1989;59:385-387.
607 FULLER C.E., DAVIES R.P., WILLIAMS G.T., WILLIAMS E.D. Crypt restricted heterogeneityof goblet cell mucus glycoprotein in histologically normal human colonicmucosa: a potential marker of somatic mutation. Br. J. Cancer 1990;61:382-384.
608 VOGELSTEIN B., FEARON E.R., HAMILTON S.R. et al. Genetic alterations duringcolorectal-tumor development. New Engl. J. Med. 1988;319:525-532.
609 AALTONEN L.A., PELTOMAKI P., LEACH F.S. et al. Clues to the pathogenesis of familialcolorectal cancer. Science 1993;260(5109):812-816.
610 PELTOMAKI P., AALTONEN L.A., SISTONEN P. et al. Genetic mapping of a locuspredisposing to human colorectal cancer. Science 1993;260(5109):810-812.
611 Hill M.J., CROWTHER J.S., DRASAR B.S., HAWKSWORTH G., ARIES V., WILLIAMS R.E.O.Bacteria and aetiology of cancer of the large bowel. Lancet 1971;1:95-100.
612 HILL M.J., DRASAR B.S., WILLIAMS R.E.O. et al. Faecal bile acids and clostridia inpatients with cancer of the large bowel. Lancet 1975;1:535-539.
613 REDDY B.S., SIMI B., ENGLE A. Biochemical epidemiology of colon cancer: effect oftypes of dietary fiber on colonic diacylglycerols in women. Gastroenterology1994;106:883-889.
614 NEWMARK H.L., WARGOVICH M.J., BRUCE W.R. Colon cancer and dietary fat,phosphate and calcium: a hypothesis. J. Natl. Cancer Inst. 1984;72:1323-1325.
615 WELBERG J.M.M., KLEIBEUKER J.H., VAN DER MEER R., MULDER N.H., DE VRIES E.G.E.Calcium and the prevention of colon cancer. Scand. J. Gastroenterol.1991;26(Suppl. 188):52-59.
616 ARMSTRONG B., DOLL R. Environmental factors and cancer incidence and mortality indifferent countries, with special reference to dietary practices. Int. J. Cancer1975;15:617-631.
617 FELTON J.S., KNIZE M.G., SHEN N.H. et al. The isolation and identification of a newmutagen from fried ground beef: 2-amino-1-methyl-6-phenylimidazo[4,5-b]pyridine (PhIP). Carcinogenesis 1986;7(7):1081-1086.
618 GROSS G.A. Simple methods for quantifying mutagenic heterocyclic aromatic aminesin food products. Carcinogenesis 1990;11(9):1597-1603.
619 SUGIMURA T., NAGAO M., WAKABAYASHI K. Heterocyclic amines in cooked foods:candidates for causation of common cancers. J. Natl. Cancer Inst.1994;86(Editorial):2-4.
148
REFERENCES
620 WATANABE M., OHTA T. Analysis of mutational specificity induced by heterocyclicamines in the lacZ gene of Escherichia coli. Carcinogenesis 1993;14:1149-1153.
621 BINGHAM S.A., PIGNATELLI B., POLLOCK J.R.A. et al. Does increased endogenousformation of N-nitrosocompounds in the human colon explain the associationbetween red meat and colon cancer? Carcinogenesis 1996;17:513-523.
622 KADLUBAR F.F., BUTLER M.A., KADERLIK K.R., CHOU H.-C., LANG N.P. Polymorphismsfor aromatic amine metabolism in humans: relevance for human carcinogenesis.Environ. Health Perspect. 1992;98:69-74.
623 MACLEAN K.N., SEE C.G., MCKAY I.A., BUSTIN S.A. The human immediate early geneBRFI maps to chromosome 14Q22-Q24. Genomics 1995;30(1):89-90.
624 VAN MUNSTER I.P., NAGENGAST F.M., TANGERMAN A. The effect of resistant starch onfecal bile acids, cytotoxicity and colonic mucosal proliferation.Gastroenterology 1993;104:A460.
149
REFERENCES