The influence of salinity on Mg/Ca in planktic foraminifers – Evidence from cultures, core-top...
18
The influence of salinity on Mg/Ca in planktic foraminifers – Evidence from cultures, core-top sediments and complementary d 18 O Ba ¨rbel Ho ¨ nisch a,⇑ , Katherine A. Allen a , David W. Lea b , Howard J. Spero c , Stephen M. Eggins d , Jennifer Arbuszewski e , Peter deMenocal a , Yair Rosenthal f , Ann D. Russell c , Henry Elderfield g a Department of Earth and Environmental Sciences and Lamont-Doherty Earth Observatory of Columbia University, Palisades, NY 10964, USA b Department of Earth Science and the Marine Science Institute, University of California, Santa Barbara, CA 93106, USA c Department of Geology, University of California, Davis, CA 95616, USA d Research School of Earth Sciences, The Australian National University, Canberra, ACT, Australia e Woods Hole Oceanographic Institution, Woods Hole, MA 02543, USA f Institute of Marine and Coastal Science, Rutgers University, New Brunswick, NJ 08901, USA g Department of Earth Sciences, University of Cambridge, Cambridge CB2 3EQ, UK Received 25 March 2013; accepted in revised form 21 July 2013; available online 29 July 2013 Abstract The Mg/Ca ratio in foraminiferal calcite is one of the principal proxies used for paleoceanographic temperature recon- structions, but recent core-top sediment observations suggest that salinity may exert a significant secondary control on plank- tic foraminifers. This study compiles new and published laboratory culture experiment data from the planktic foraminifers Orbulina universa, Globigerinoides sacculifer and Globigerinoides ruber, in which salinity was varied but temperature, pH and light were held constant. Combining new data with results from previous culture studies yields a Mg/Ca-sensitivity to salinity of 4.4 ± 2.3%, 4.7 ± 1.2%, and 3.3 ± 1.7% per salinity unit (95% confidence), respectively, for the three foraminifer species studied here. Comparison of these sensitivities with core-top data suggests that the much larger sensitivity (27 ± 4% per salinity unit) derived from Atlantic core-top sediments in previous studies is not a direct effect of salinity. Rather, we suggest that the dissolution correction often applied to Mg/Ca data can lead to significant overestimation of tem- peratures. We are able to reconcile culture calibrations with core-top observations by combining evidence for seasonal occur- rence and latitude-specific habitat depth preferences with corresponding variations in physico-chemical environmental parameters. Although both Mg/Ca and d 18 O yield temperature estimates that fall within the bounds of hydrographic obser- vations, discrepancies between the two proxies highlight unresolved challenges with the use of paired Mg/Ca and d 18 O anal- yses to reconstruct paleo-salinity patterns across ocean basins. The first step towards resolving these challenges requires a better spatially and seasonally resolved d 18 O sw archive than is currently available. Nonetheless, site-specific reconstructions of salinity change through time may be valid. Ó 2013 Elsevier Ltd. All rights reserved. 1. INTRODUCTION The oxygen isotopic composition (d 18 O foram ) and Mg/Ca ratios of planktic foraminifer tests are among the most com- monly applied proxies for reconstructing past ocean temper- ature. The theoretical basis for d 18 O in marine carbonates as a temperature proxy is rooted in the temperature-dependent bonding characteristics of oxygen isotopes (Urey, 1947). Application of the d 18 O foram proxy in sediment and labora- tory studies requires accounting for variations in the oxygen isotopic composition of seawater (d 18 O sw ), photosynthetic 0016-7037/$ - see front matter Ó 2013 Elsevier Ltd. All rights reserved. http://dx.doi.org/10.1016/j.gca.2013.07.028 ⇑ Corresponding author. Tel.: +1 845 365 8828. E-mail address: [email protected] (B. Ho ¨ nisch). www.elsevier.com/locate/gca Available online at www.sciencedirect.com ScienceDirect Geochimica et Cosmochimica Acta 121 (2013) 196–213
Transcript of The influence of salinity on Mg/Ca in planktic foraminifers – Evidence from cultures, core-top...
Available online at www.sciencedirect.com
www.elsevier.com/locate/gca
ScienceDirect
Geochimica et Cosmochimica Acta 121 (2013) 196–213
The influence of salinity on Mg/Ca in plankticforaminifers – Evidence from cultures, core-top
sediments and complementary d18O
Barbel Honisch a,⇑, Katherine A. Allen a, David W. Lea b, Howard J. Spero c,Stephen M. Eggins d, Jennifer Arbuszewski e, Peter deMenocal a, Yair Rosenthal f,
Ann D. Russell c, Henry Elderfield g
a Department of Earth and Environmental Sciences and Lamont-Doherty Earth Observatory of Columbia University, Palisades, NY 10964, USAb Department of Earth Science and the Marine Science Institute, University of California, Santa Barbara, CA 93106, USA
c Department of Geology, University of California, Davis, CA 95616, USAd Research School of Earth Sciences, The Australian National University, Canberra, ACT, Australia
e Woods Hole Oceanographic Institution, Woods Hole, MA 02543, USAf Institute of Marine and Coastal Science, Rutgers University, New Brunswick, NJ 08901, USA
g Department of Earth Sciences, University of Cambridge, Cambridge CB2 3EQ, UK
Received 25 March 2013; accepted in revised form 21 July 2013; available online 29 July 2013
Abstract
The Mg/Ca ratio in foraminiferal calcite is one of the principal proxies used for paleoceanographic temperature recon-structions, but recent core-top sediment observations suggest that salinity may exert a significant secondary control on plank-tic foraminifers. This study compiles new and published laboratory culture experiment data from the planktic foraminifersOrbulina universa, Globigerinoides sacculifer and Globigerinoides ruber, in which salinity was varied but temperature, pHand light were held constant. Combining new data with results from previous culture studies yields a Mg/Ca-sensitivity tosalinity of 4.4 ± 2.3%, 4.7 ± 1.2%, and 3.3 ± 1.7% per salinity unit (95% confidence), respectively, for the three foraminiferspecies studied here. Comparison of these sensitivities with core-top data suggests that the much larger sensitivity(27 ± 4% per salinity unit) derived from Atlantic core-top sediments in previous studies is not a direct effect of salinity.Rather, we suggest that the dissolution correction often applied to Mg/Ca data can lead to significant overestimation of tem-peratures. We are able to reconcile culture calibrations with core-top observations by combining evidence for seasonal occur-rence and latitude-specific habitat depth preferences with corresponding variations in physico-chemical environmentalparameters. Although both Mg/Ca and d18O yield temperature estimates that fall within the bounds of hydrographic obser-vations, discrepancies between the two proxies highlight unresolved challenges with the use of paired Mg/Ca and d18O anal-yses to reconstruct paleo-salinity patterns across ocean basins. The first step towards resolving these challenges requires abetter spatially and seasonally resolved d18Osw archive than is currently available. Nonetheless, site-specific reconstructionsof salinity change through time may be valid.� 2013 Elsevier Ltd. All rights reserved.
1. INTRODUCTION
The oxygen isotopic composition (d18Oforam) and Mg/Caratios of planktic foraminifer tests are among the most com-
0016-7037/$ - see front matter � 2013 Elsevier Ltd. All rights reserved.
http://dx.doi.org/10.1016/j.gca.2013.07.028
⇑ Corresponding author. Tel.: +1 845 365 8828.E-mail address: [email protected] (B. Honisch).
monly applied proxies for reconstructing past ocean temper-ature. The theoretical basis for d18O in marine carbonates asa temperature proxy is rooted in the temperature-dependentbonding characteristics of oxygen isotopes (Urey, 1947).Application of the d18Oforam proxy in sediment and labora-tory studies requires accounting for variations in the oxygenisotopic composition of seawater (d18Osw), photosynthetic
B. Honisch et al. / Geochimica et Cosmochimica Acta 121 (2013) 196–213 197
activity in symbiont-bearing species, and marine carbonatechemistry (for a summary, see Bemis et al., 1998). In con-trast, the mechanism underlying the temperature sensitivityof Mg/Ca is not as well understood. The substitution ofMg2+ into marine calcites is thermodynamically favored athigher temperatures (Chave, 1954; Mucci, 1987; Oomoriet al., 1987; Koziol and Newton, 1995), but the observedtemperature response in foraminiferal calcite is much largerthan predicted by theory (i.e. 9% per �C versus 1–3% per �C,Lea et al., 1999; Anand et al., 2003). In addition, plankticforaminifers discriminate heavily against the incorporationof Mg2+ into their calcite skeletons, such that their Mg/Caratio is 1–2 orders of magnitude lower (e.g., Lea et al.,1999) than inorganically precipitated calcite (Oomori et al.,1987). The discrepancy between theory and observationsindicates that the empirical relationship is influenced byadditional environmental parameters and/or physiologicalvital effects.
Laboratory culture experiments that isolate the effects ofindividual environmental parameters have been used toidentify secondary controls on Mg/Ca uptake into plankticforaminifer tests. For instance, Lea et al. (1999) observed anegative relationship between seawater-pH and Mg/Ca up-take, although it was later determined that this effect isgreater at lower-than-modern seawater-pH (Russell et al.,2004). Laboratory culture experiments have also estab-lished that salinity exerts a small effect on Mg/Ca, which in-creases by 4–8% per salinity unit (Nurnberg et al., 1996; Leaet al., 1999; Kısakurek et al., 2008; Duenas-Bohorquezet al., 2011). Recent core-top sediment studies, however,suggest that the Mg/Ca sensitivity to salinity is much great-er than that measured in culture experiments, up to 59% persalinity unit (Ferguson et al., 2008; Mathien-Blard andBassinot, 2009; Arbuszewski et al., 2010). Although databy Ferguson et al. (2008) have been questioned due to thepresence of a Mg-rich post-depositional calcite precipitateon Mediterranean foraminifer tests (Hoogakker et al.,2009; Mathien-Blard and Bassinot, 2009), the comprehen-sive study by Arbuszewski et al. (2010) suggests a large27% sensitivity to salinity for the tropical planktic foramin-ifer Globigerinoides ruber where ambient salinity exceeds 35.This latter assessment was based on a comparison of Mg/Ca and d18Oforam data obtained from the same samples ofpooled foraminifera tests, in which d18Oforam compositionsappeared to agree with mean annual SST (Arbuszewskiet al., 2010). Arbuszewski et al. (2010) quantified the salin-ity effect by calculating ‘Mg-excess’: i.e. that part of the Mg/Ca-signal that deviates from d18Oforam-temperature esti-mates. They also derived an independent Mg/Ca sensitivityto temperature of 4.8 ± 0.8% per �C, which is �50% of thetemperature sensitivity observed in culture experiments andless than 20% of their inferred salinity control.
In this study we present data from a suite of new cultureexperiments to verify and extend previous experimentalresults used to establish the salinity dependence offoraminiferal Mg/Ca. Because our new data corroborate pre-vious laboratory results, we present a detailed analysis ofalternative ecophysiological explanations for the core-topsediment results of Arbuszewski et al. (2010) and Mathien-Blard and Bassinot (2009), which is based on known
temperature, salinity and biological effects on these proxies.Instead of a strong salinity effect on Mg/Ca, we find that bothMg/Ca and d18Oforam-derived temperatures of G. ruber areconsistent with its preference for growth during the warmsummer season at higher latitudes.
2. METHODS
2.1. Planktic foraminifer culturing
The temperate-subtropical Orbulina universa and tropi-cal Globigerinoides sacculifer and G. ruber (pink) were cul-tured at the Wrigley Institute for Environmental Studies(WIES) on Santa Catalina Island, California, in July/Au-gust 2008, and at the University of Puerto Rico’s MarineSciences Center on Isla Magueyez (MSCIM) during Marchand April 2010, respectively. The experiments are the sameas described in Allen et al. (2011, 2012). Juvenile foramini-fers were hand-collected by SCUBA divers either 3 (WIES)or 13 km (MSCIM) offshore and at 3–5 m water depth.Immediately after collection foraminifers were brought tothe laboratory, where each individual was identified andits largest test dimension measured by light microscopy. Ifthe foraminifers did not already hold prey in their spines,they were fed a 1-day old brine shrimp (Artemia salina).Specimens were then transferred into individual culture jarsthat contained the experimental seawater. Jars were sealedwith Parafilm� and tight-fitting lids to prevent gas exchangeand evaporation.
The seawater used in these experiments was collected atthe dive sites, filtered (0.45 lm), and salinity modified byeither adding deionized water to reduce salinity or by par-tial evaporation under a heat lamp to increase salinity.Salinity was measured with an Orion Star Thermo Scien-tific conductivity meter (salinity resolution = ±0.1) andranged between 29.9 and 35.4 in the O. universa experi-ments, and between 33.0 and 40.0 in the G. sacculifer
and G. ruber experiments. In addition to salinity, we alsomeasured alkalinity and pH at the beginning and end ofeach experiment using a Metrohm 809 open cell auto-titrator and pH meter calibrated against NIST buffersand Dickson-certified alkalinity standards. The culturejars were then placed in circulating temperature-con-trolled water baths, where temperature was kept at22 ± 0.3 �C in the O. universa experiments and at26 ± 0.3 �C in the G. sacculifer and G. ruber experiments(Table 1). These conditions are similar to the seawatertemperature measured during foraminifer collection atthe respective sites. The constancy of the temperature inthe baths was monitored by HOBO TidbiT� temperatureloggers every 5 min. Because all three species are symbi-ont-bearing, the baths were illuminated on a 12-h light/dark cycle with cool-white fluorescent lamps, whose out-put (>300 lmol photons m�2 s�1) exceeds the light satura-tion level (Pmax) of the symbionts (Jørgensen et al., 1985;Rink et al., 1998). Light levels were monitored with a Bio-spherical Instruments QSL-2200 scalar PAR irradiancesensor. Foraminifers were observed daily with a hand lensand fed a freshly hatched brine shrimp every other dayuntil each individual underwent gametogenesis. At that
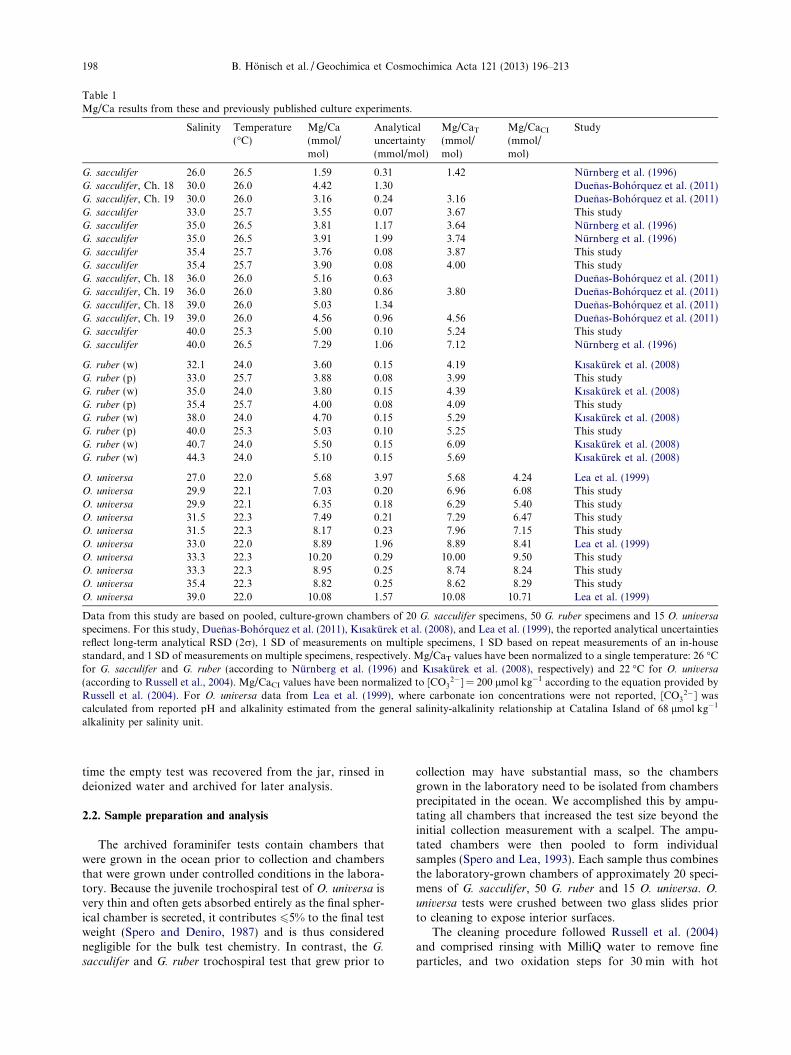
Table 1Mg/Ca results from these and previously published culture experiments.
Salinity Temperature(�C)
Mg/Ca(mmol/mol)
Analyticaluncertainty(mmol/mol)
Mg/CaT
(mmol/mol)
Mg/CaCI
(mmol/mol)
Study
G. sacculifer 26.0 26.5 1.59 0.31 1.42 Nurnberg et al. (1996)G. sacculifer, Ch. 18 30.0 26.0 4.42 1.30 Duenas-Bohorquez et al. (2011)G. sacculifer, Ch. 19 30.0 26.0 3.16 0.24 3.16 Duenas-Bohorquez et al. (2011)G. sacculifer 33.0 25.7 3.55 0.07 3.67 This studyG. sacculifer 35.0 26.5 3.81 1.17 3.64 Nurnberg et al. (1996)G. sacculifer 35.0 26.5 3.91 1.99 3.74 Nurnberg et al. (1996)G. sacculifer 35.4 25.7 3.76 0.08 3.87 This studyG. sacculifer 35.4 25.7 3.90 0.08 4.00 This studyG. sacculifer, Ch. 18 36.0 26.0 5.16 0.63 Duenas-Bohorquez et al. (2011)G. sacculifer, Ch. 19 36.0 26.0 3.80 0.86 3.80 Duenas-Bohorquez et al. (2011)G. sacculifer, Ch. 18 39.0 26.0 5.03 1.34 Duenas-Bohorquez et al. (2011)G. sacculifer, Ch. 19 39.0 26.0 4.56 0.96 4.56 Duenas-Bohorquez et al. (2011)G. sacculifer 40.0 25.3 5.00 0.10 5.24 This studyG. sacculifer 40.0 26.5 7.29 1.06 7.12 Nurnberg et al. (1996)
G. ruber (w) 32.1 24.0 3.60 0.15 4.19 Kısakurek et al. (2008)G. ruber (p) 33.0 25.7 3.88 0.08 3.99 This studyG. ruber (w) 35.0 24.0 3.80 0.15 4.39 Kısakurek et al. (2008)G. ruber (p) 35.4 25.7 4.00 0.08 4.09 This studyG. ruber (w) 38.0 24.0 4.70 0.15 5.29 Kısakurek et al. (2008)G. ruber (p) 40.0 25.3 5.03 0.10 5.25 This studyG. ruber (w) 40.7 24.0 5.50 0.15 6.09 Kısakurek et al. (2008)G. ruber (w) 44.3 24.0 5.10 0.15 5.69 Kısakurek et al. (2008)
O. universa 27.0 22.0 5.68 3.97 5.68 4.24 Lea et al. (1999)O. universa 29.9 22.1 7.03 0.20 6.96 6.08 This studyO. universa 29.9 22.1 6.35 0.18 6.29 5.40 This studyO. universa 31.5 22.3 7.49 0.21 7.29 6.47 This studyO. universa 31.5 22.3 8.17 0.23 7.96 7.15 This studyO. universa 33.0 22.0 8.89 1.96 8.89 8.41 Lea et al. (1999)O. universa 33.3 22.3 10.20 0.29 10.00 9.50 This studyO. universa 33.3 22.3 8.95 0.25 8.74 8.24 This studyO. universa 35.4 22.3 8.82 0.25 8.62 8.29 This studyO. universa 39.0 22.0 10.08 1.57 10.08 10.71 Lea et al. (1999)
Data from this study are based on pooled, culture-grown chambers of 20 G. sacculifer specimens, 50 G. ruber specimens and 15 O. universa
specimens. For this study, Duenas-Bohorquez et al. (2011), Kısakurek et al. (2008), and Lea et al. (1999), the reported analytical uncertaintiesreflect long-term analytical RSD (2r), 1 SD of measurements on multiple specimens, 1 SD based on repeat measurements of an in-housestandard, and 1 SD of measurements on multiple specimens, respectively. Mg/CaT values have been normalized to a single temperature: 26 �Cfor G. sacculifer and G. ruber (according to Nurnberg et al. (1996) and Kısakurek et al. (2008), respectively) and 22 �C for O. universa
(according to Russell et al., 2004). Mg/CaCI values have been normalized to [CO32�] = 200 lmol kg�1 according to the equation provided by
Russell et al. (2004). For O. universa data from Lea et al. (1999), where carbonate ion concentrations were not reported, [CO32�] was
calculated from reported pH and alkalinity estimated from the general salinity-alkalinity relationship at Catalina Island of 68 lmol kg�1
alkalinity per salinity unit.
198 B. Honisch et al. / Geochimica et Cosmochimica Acta 121 (2013) 196–213
time the empty test was recovered from the jar, rinsed indeionized water and archived for later analysis.
2.2. Sample preparation and analysis
The archived foraminifer tests contain chambers thatwere grown in the ocean prior to collection and chambersthat were grown under controlled conditions in the labora-tory. Because the juvenile trochospiral test of O. universa isvery thin and often gets absorbed entirely as the final spher-ical chamber is secreted, it contributes 65% to the final testweight (Spero and Deniro, 1987) and is thus considerednegligible for the bulk test chemistry. In contrast, the G.
sacculifer and G. ruber trochospiral test that grew prior to
collection may have substantial mass, so the chambersgrown in the laboratory need to be isolated from chambersprecipitated in the ocean. We accomplished this by ampu-tating all chambers that increased the test size beyond theinitial collection measurement with a scalpel. The ampu-tated chambers were then pooled to form individualsamples (Spero and Lea, 1993). Each sample thus combinesthe laboratory-grown chambers of approximately 20 speci-mens of G. sacculifer, 50 G. ruber and 15 O. universa. O.
universa tests were crushed between two glass slides priorto cleaning to expose interior surfaces.
The cleaning procedure followed Russell et al. (2004)and comprised rinsing with MilliQ water to remove fineparticles, and two oxidation steps for 30 min with hot
B. Honisch et al. / Geochimica et Cosmochimica Acta 121 (2013) 196–213 199
(70 �C), buffered H2O2 (equal parts 0.1 N NaOH, 30% v/vH2O2, Optima grade) to remove organic matter. This strongH2O2 treatment is applied to oxidize the much higher con-centration of organic matter in cultured foraminifer testscompared to fossil tests (Pak et al., 2004; Russell et al.,2004), which would leave Mg/Ca erroneously elevated ifnot removed (Barker et al., 2003). Following oxidation,samples were rinsed 5 times with MilliQ and leached 3 timeswith 0.001 N HNO3 to remove any re-adsorbed ions.
Elemental analyses of O. universa tests were carried outby Inductively Coupled Plasma Mass Spectrometry (ICP-MS, PerkinElmer SCIEX Elan DRC II) in the GodwinLaboratory at Cambridge University (Yu et al., 2005; Allenet al., 2011) and G. sacculifer and G. ruber samples wereanalyzed on a Sector-Field Inductively Coupled PlasmaMass Spectrometer (Thermo Scientific Element XR) atRutgers University (Tali Babila, pers. comm., Allen et al.,2012). Consistency standards were prepared gravimetricallywith MilliQ and measured every 3–5 samples (Yu et al.,2005). The long-term relative standard deviation (RSD,2r) for Mg/Ca in the Cambridge and Rutgers laboratoriesis 2.8% and 2.0%, respectively.
3. RESULTS
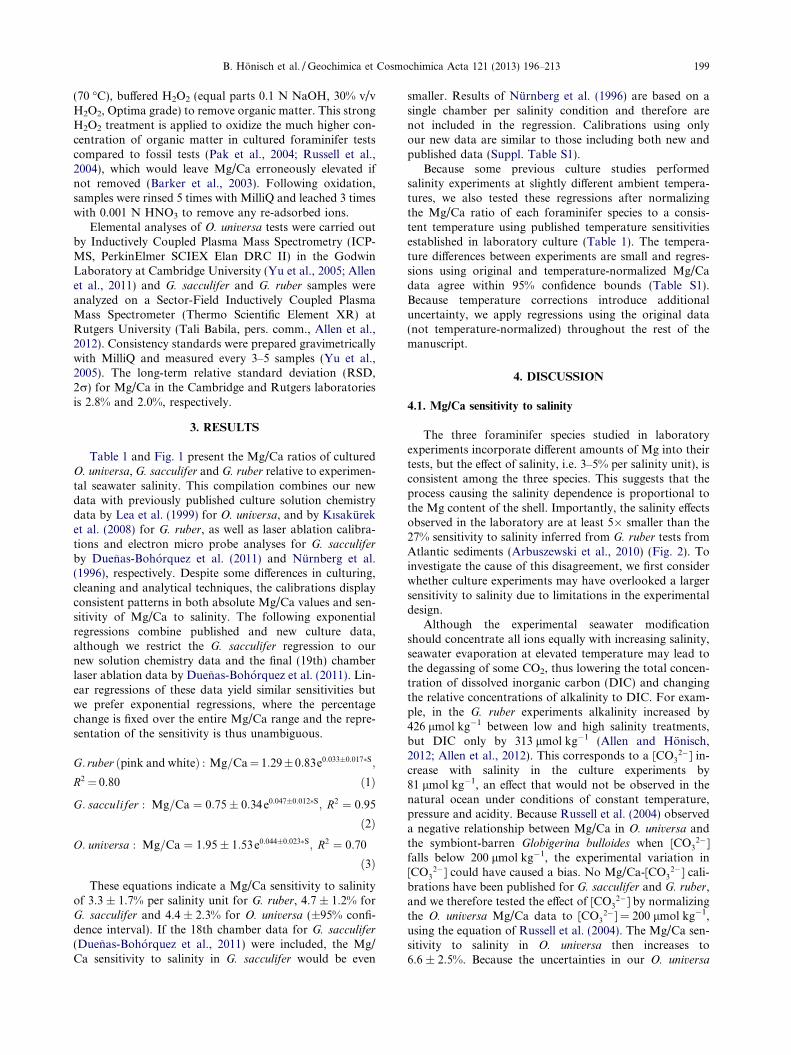
Table 1 and Fig. 1 present the Mg/Ca ratios of culturedO. universa, G. sacculifer and G. ruber relative to experimen-tal seawater salinity. This compilation combines our newdata with previously published culture solution chemistrydata by Lea et al. (1999) for O. universa, and by Kısakureket al. (2008) for G. ruber, as well as laser ablation calibra-tions and electron micro probe analyses for G. sacculifer
by Duenas-Bohorquez et al. (2011) and Nurnberg et al.(1996), respectively. Despite some differences in culturing,cleaning and analytical techniques, the calibrations displayconsistent patterns in both absolute Mg/Ca values and sen-sitivity of Mg/Ca to salinity. The following exponentialregressions combine published and new culture data,although we restrict the G. sacculifer regression to ournew solution chemistry data and the final (19th) chamberlaser ablation data by Duenas-Bohorquez et al. (2011). Lin-ear regressions of these data yield similar sensitivities butwe prefer exponential regressions, where the percentagechange is fixed over the entire Mg/Ca range and the repre-sentation of the sensitivity is thus unambiguous.
G: ruber ðpink and whiteÞ : Mg=Ca¼ 1:29�0:83e0:033�0:017�S;
R2 ¼ 0:80 ð1Þ
G: sacculifer : Mg=Ca ¼ 0:75� 0:34 e0:047�0:012�S; R2 ¼ 0:95
ð2ÞO: universa : Mg=Ca ¼ 1:95� 1:53e0:044�0:023�S; R2 ¼ 0:70
ð3Þ
These equations indicate a Mg/Ca sensitivity to salinityof 3.3 ± 1.7% per salinity unit for G. ruber, 4.7 ± 1.2% forG. sacculifer and 4.4 ± 2.3% for O. universa (±95% confi-dence interval). If the 18th chamber data for G. sacculifer
(Duenas-Bohorquez et al., 2011) were included, the Mg/Ca sensitivity to salinity in G. sacculifer would be even
smaller. Results of Nurnberg et al. (1996) are based on asingle chamber per salinity condition and therefore arenot included in the regression. Calibrations using onlyour new data are similar to those including both new andpublished data (Suppl. Table S1).
Because some previous culture studies performedsalinity experiments at slightly different ambient tempera-tures, we also tested these regressions after normalizingthe Mg/Ca ratio of each foraminifer species to a consis-tent temperature using published temperature sensitivitiesestablished in laboratory culture (Table 1). The tempera-ture differences between experiments are small and regres-sions using original and temperature-normalized Mg/Cadata agree within 95% confidence bounds (Table S1).Because temperature corrections introduce additionaluncertainty, we apply regressions using the original data(not temperature-normalized) throughout the rest of themanuscript.
4. DISCUSSION
4.1. Mg/Ca sensitivity to salinity
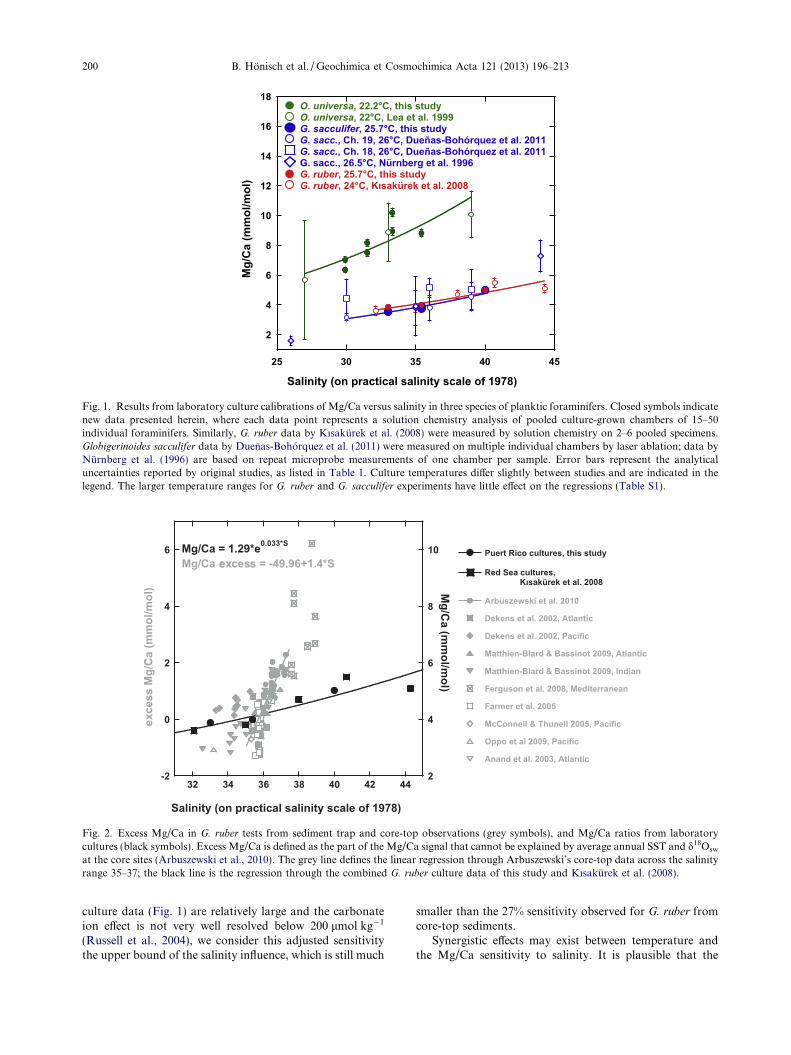
The three foraminifer species studied in laboratoryexperiments incorporate different amounts of Mg into theirtests, but the effect of salinity, i.e. 3–5% per salinity unit), isconsistent among the three species. This suggests that theprocess causing the salinity dependence is proportional tothe Mg content of the shell. Importantly, the salinity effectsobserved in the laboratory are at least 5� smaller than the27% sensitivity to salinity inferred from G. ruber tests fromAtlantic sediments (Arbuszewski et al., 2010) (Fig. 2). Toinvestigate the cause of this disagreement, we first considerwhether culture experiments may have overlooked a largersensitivity to salinity due to limitations in the experimentaldesign.
Although the experimental seawater modificationshould concentrate all ions equally with increasing salinity,seawater evaporation at elevated temperature may lead tothe degassing of some CO2, thus lowering the total concen-tration of dissolved inorganic carbon (DIC) and changingthe relative concentrations of alkalinity to DIC. For exam-ple, in the G. ruber experiments alkalinity increased by426 lmol kg�1 between low and high salinity treatments,but DIC only by 313 lmol kg�1 (Allen and Honisch,2012; Allen et al., 2012). This corresponds to a [CO3
2�] in-crease with salinity in the culture experiments by81 lmol kg�1, an effect that would not be observed in thenatural ocean under conditions of constant temperature,pressure and acidity. Because Russell et al. (2004) observeda negative relationship between Mg/Ca in O. universa andthe symbiont-barren Globigerina bulloides when [CO3
2�]falls below 200 lmol kg�1, the experimental variation in[CO3
2�] could have caused a bias. No Mg/Ca-[CO32�] cali-
brations have been published for G. sacculifer and G. ruber,and we therefore tested the effect of [CO3
2�] by normalizingthe O. universa Mg/Ca data to [CO3
2�] = 200 lmol kg�1,using the equation of Russell et al. (2004). The Mg/Ca sen-sitivity to salinity in O. universa then increases to6.6 ± 2.5%. Because the uncertainties in our O. universa
2
4
6
8
10
12
14
16
18
25 30 35 40 45
Mg/
Ca
(mm
ol/m
ol)
Salinity (on practical salinity scale of 1978)
O. universaO. universaG. sacculiferG. sacc.G. sacc.
G. ruberG. ruber
Fig. 1. Results from laboratory culture calibrations of Mg/Ca versus salinity in three species of planktic foraminifers. Closed symbols indicatenew data presented herein, where each data point represents a solution chemistry analysis of pooled culture-grown chambers of 15–50individual foraminifers. Similarly, G. ruber data by Kısakurek et al. (2008) were measured by solution chemistry on 2–6 pooled specimens.Globigerinoides sacculifer data by Duenas-Bohorquez et al. (2011) were measured on multiple individual chambers by laser ablation; data byNurnberg et al. (1996) are based on repeat microprobe measurements of one chamber per sample. Error bars represent the analyticaluncertainties reported by original studies, as listed in Table 1. Culture temperatures differ slightly between studies and are indicated in thelegend. The larger temperature ranges for G. ruber and G. sacculifer experiments have little effect on the regressions (Table S1).
-2
0
2
4
6
2
4
6
8
10
32 34 36 38 40 42 44
Arbuszewski et al. 2010
Dekens et al. 2002, Atlantic
Dekens et al. 2002, Pacific
Matthien-Blard & Bassinot 2009, Atlantic
Matthien-Blard & Bassinot 2009, Indian
Ferguson et al. 2008, Mediterranean
Farmer et al. 2005
McConnell & Thunell 2005, Pacific
Oppo et al 2009, Pacific
Anand et al. 2003, Atlantic
ruber combined
G. ruber (p)
Kisak?rek
exce
ss M
g/C
a (m
mol
/mol
) Mg/C
a (mm
ol/mol)
Salinity (on practical salinity scale of 1978)
Puert Rico cultures, this study
Red Sea cultures,
Mg/Ca = 1.29*e0.033*S
Mg/Ca eexcess = -49.96+1.4*S
Fig. 2. Excess Mg/Ca in G. ruber tests from sediment trap and core-top observations (grey symbols), and Mg/Ca ratios from laboratorycultures (black symbols). Excess Mg/Ca is defined as the part of the Mg/Ca signal that cannot be explained by average annual SST and d18Osw
at the core sites (Arbuszewski et al., 2010). The grey line defines the linear regression through Arbuszewski’s core-top data across the salinityrange 35–37; the black line is the regression through the combined G. ruber culture data of this study and Kısakurek et al. (2008).
200 B. Honisch et al. / Geochimica et Cosmochimica Acta 121 (2013) 196–213
culture data (Fig. 1) are relatively large and the carbonateion effect is not very well resolved below 200 lmol kg�1
(Russell et al., 2004), we consider this adjusted sensitivitythe upper bound of the salinity influence, which is still much
smaller than the 27% sensitivity observed for G. ruber fromcore-top sediments.
Synergistic effects may exist between temperature andthe Mg/Ca sensitivity to salinity. It is plausible that the
B. Honisch et al. / Geochimica et Cosmochimica Acta 121 (2013) 196–213 201
mechanism responsible for lowering [Mg] in the calcifyingfluid is reduced under higher Mg activities in seawater,resulting in even greater Mg incorporation at higher tem-peratures under elevated salinity. Testing such effects wouldrequire an experimental design where both salinity and tem-perature are varied systematically, but such experimentshave not yet been conducted. The existence of a synergistictemperature-salinity effect cannot be ruled out at this time;however, in the absence of a theoretical basis or empiricalevidence for such an influence on Mg/Ca we will assumethat temperature-salinity amplifications do not play a sig-nificant role here.
We therefore conclude that the design of the cultureexperiments is unlikely to have caused underestimation ofthe salinity effect on Mg/Ca, and that the culture data can-not be reconciled with the core-top data in this way.
4.2. Comparison with core-top sediments
Recognizing that geochemical data from core-top sed-iments are subject to multiple uncertainties, Arbuszewskiet al. (2010) and Mathien-Blard and Bassinot (2009)established comprehensive core-top data sets of Mg/Caand d18Oforam in tests of the tropical-subtropical, symbi-ont-bearing G. ruber. To gain insight into the controlson these temperature proxies, both studies comparedMg/Ca and d18Oforam from the same samples and assumedthat the oxygen isotopic composition recorded in G. ruber
tests can be used as a reference for evaluating the Mg/Catemperature computation (e.g., Mulitza et al., 1998; Peet-ers et al., 2002; Schmidt and Mulitza, 2002). Here we fol-low a different approach and do not try to align theproxies with mean annual SST, but rather apply experi-mentally determined sensitivities to these proxies in orderto compare the difference between proxy estimates andoceanographic data, and to assess the ecophysiology ofG. ruber. From now on we will refer to Mg/Ca tempera-tures estimates as ‘Mg/Ca-Ts’ and to d18Oforam tempera-ture estimates as ‘d18Oforam-Ts’.
To identify which parameter(s) could be responsible forthe observed Mg/Ca difference in salinity sensitivity be-tween cultured and core-top specimens, we review the cali-brations and assumptions applied by Arbuszewski et al.(2010) and Mathien-Blard and Bassinot (2009). Bothstudies assumed that G. ruber lives in the surface ocean(0–50 m), but each made different choices regarding fora-minifer size, dissolution correction and d18Osw estimation.For instance, Arbuszewski et al. (2010) analyzed tests inthe 250–355 lm size class, cleaned them following theprocedures outlined by Boyle and Keigwin (1985/1986)and Barker et al. (2003) including a reductive cleaning step,applied a depth-dependent dissolution correction (Dekenset al., 2002) to their Mg/Ca-Ts, and used a linear regressionfor Atlantic sea surface salinity (SSS) and d18Osw data(Schmidt et al., 1999) to estimate the local sea surfaced18Osw. In comparison, Mathien-Blard and Bassinot(2009) selected tests in the 250–315 lm size class, cleanedthem following the procedure of Barker et al. (2003) (i.e.without a reductive cleaning step), applied a Mg/Ca tem-perature calibration without dissolution correction (Anand
et al., 2003), and selected local sea surface d18Osw from thegridded data set of LeGrande and Schmidt (2006). Theequations used for translating foraminiferal d18Oforam totemperature yield relatively similar results, where Arbu-szewski et al. (2010) used the low light equation establishedfor O. universa (Bemis et al., 1998) and Mathien-Blard andBassinot (2009) the Uvigerina equation of (Shackleton,1974). Following Arbuszewski et al. (2010), Mg/Ca datafrom Mathien-Blard and Bassinot (2009) were reduced by10% to account for the lack of a reductive cleaning step.In the following discussion we will first evaluate the effectof the depth correction on Mg/Ca, then infer potentialdepth habitats from Mg/Ca-Ts, followed by an evaluationof the choice of d18Osw and the d18Oforam-temperature equa-tion. We conclude our assessment with an analysis of sea-sonal habitat preferences of G. ruber.
4.2.1. Depth correction on Mg/Ca
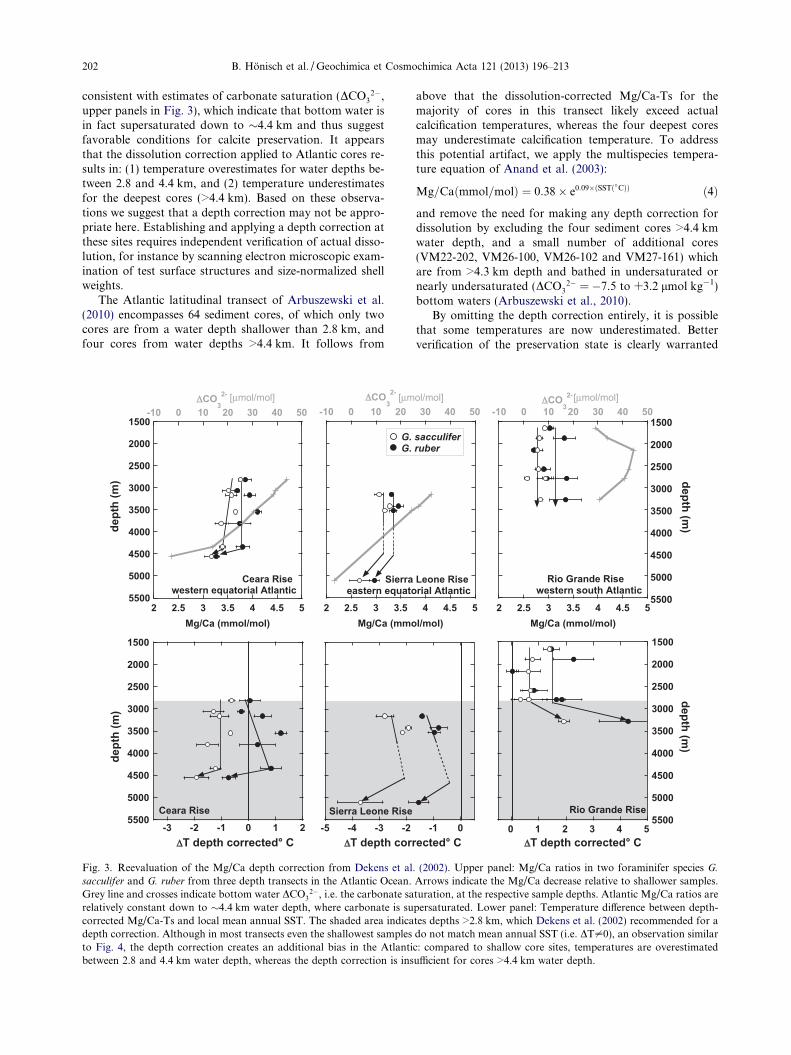
The depth correction applied by Arbuszewski et al.(2010) is based on the longstanding observation that Mg/Ca in planktic foraminifer tests is prone to partial dissolu-tion in the sediment (Savin and Douglas, 1973; Lorenset al., 1977; Russell et al., 1994; Brown and Elderfield,1996; Rosenthal et al., 2000; Rosenthal and Lohmann,2002; Dyez and Ravelo, 2013). Arbuszewski et al. (2010)used the approach of Dekens et al. (2002), who assessed dis-solution using specimens picked from core-top sedimentsalong several depth transects. Dekens et al. (2002) per-formed a multivariate best-fit analysis and derived a Mg/Ca-temperature calibration for G. ruber that has subse-quently been verified by the sediment trap calibration ofAnand et al. (2003) but the Dekens calibration includes adepth correction for samples obtained deeper than 2.8 kmin the Atlantic Ocean. We reevaluate this depth correctionapplied to G. ruber and G. sacculifer based on the depthtransects studied by Dekens et al. (2002). Fig. 3 shows theoriginal Mg/Ca data, which display relatively constantMg/Ca values in the Atlantic Ocean, where a significant de-crease in Mg/Ca is only observed in the deepest cores of theCeara Rise (at 4.4 km water depth) and the Sierra LeoneRise (at 5.1 km water depth). Similar observations havebeen made by Rosenthal and Boyle (1993), who studiedMg/Ca in the same three foraminifer species from the SierraLeone Rise and observed no change in Mg/Ca above4.5 km water depth. In contrast, Regenberg et al. (2006)found clear evidence for decreasing Mg/Ca in Caribbeancore-tops >3000 m water depth. Because the Caribbean isan enclosed basin, we focus our evaluation on open oceanrecords here.
The depth-corrected Mg/Ca-Ts for G. ruber andG. sacculifer from Dekens et al. (2002) are shown in thelower panels of Fig. 3 as a deviation from local SST: i.e.DTdepth corrected == TTMg/Ca depth corrected– SST. Alldepth-corrected data in the Atlantic (i.e. water depths>2.8 km but above 4.4 km) produce higher temperatureestimates than sediments unaffected by dissolution from<2.8 km water depth. Furthermore, Mg/Ca-Ts from thedeepest cores (>4.5 km water depth) are cooler than theshallowest samples from the same transect, indicating theapplied correction is too small. This observation is
202 B. Honisch et al. / Geochimica et Cosmochimica Acta 121 (2013) 196–213
consistent with estimates of carbonate saturation (DCO32�,
upper panels in Fig. 3), which indicate that bottom water isin fact supersaturated down to �4.4 km and thus suggestfavorable conditions for calcite preservation. It appearsthat the dissolution correction applied to Atlantic cores re-sults in: (1) temperature overestimates for water depths be-tween 2.8 and 4.4 km, and (2) temperature underestimatesfor the deepest cores (>4.4 km). Based on these observa-tions we suggest that a depth correction may not be appro-priate here. Establishing and applying a depth correction atthese sites requires independent verification of actual disso-lution, for instance by scanning electron microscopic exam-ination of test surface structures and size-normalized shellweights.
The Atlantic latitudinal transect of Arbuszewski et al.(2010) encompasses 64 sediment cores, of which only twocores are from a water depth shallower than 2.8 km, andfour cores from water depths >4.4 km. It follows from
-3 -2 -1 0 1 2Ceara Rise
1500
2000
2500
3000
3500
4000
4500
5000
5500
T depth corrected° C T depth corr
dept
h (m
)
-5 -4 -3 -2Sierra Leone Rise
2 2.5 3 3.5
-10 0 10 20
Mg/Ca (mmo
CO32-
G. G.
Sierraeastern equato
1500
2000
2500
3000
3500
4000
4500
5000
55002 2.5 3 3.5 4 4.5 5
-10 0 10 20 30 40 50
dept
h (m
)
Mg/Ca (mmol/mol)
CO32-
Ceara Risewestern equatorial Atlantic
[µmol/mol] [µm
Fig. 3. Reevaluation of the Mg/Ca depth correction from Dekens et alsacculifer and G. ruber from three depth transects in the Atlantic Ocean.Grey line and crosses indicate bottom water DCO3
2�, i.e. the carbonate sarelatively constant down to �4.4 km water depth, where carbonate is sucorrected Mg/Ca-Ts and local mean annual SST. The shaded area indicadepth correction. Although in most transects even the shallowest samplesto Fig. 4, the depth correction creates an additional bias in the Atlantibetween 2.8 and 4.4 km water depth, whereas the depth correction is ins
above that the dissolution-corrected Mg/Ca-Ts for themajority of cores in this transect likely exceed actualcalcification temperatures, whereas the four deepest coresmay underestimate calcification temperature. To addressthis potential artifact, we apply the multispecies tempera-ture equation of Anand et al. (2003):
Mg=Caðmmol=molÞ ¼ 0:38� e0:09�ðSSTð�CÞÞ ð4Þ
and remove the need for making any depth correction fordissolution by excluding the four sediment cores >4.4 kmwater depth, and a small number of additional cores(VM22-202, VM26-100, VM26-102 and VM27-161) whichare from >4.3 km depth and bathed in undersaturated ornearly undersaturated (DCO3
2� = �7.5 to +3.2 lmol kg�1)bottom waters (Arbuszewski et al., 2010).
By omitting the depth correction entirely, it is possiblethat some temperatures are now underestimated. Betterverification of the preservation state is clearly warranted
ected° C T depth corrected° C-1 0 0 1 2 3 4 5
1500
2000
2500
3000
3500
4000
4500
5000
5500
depth (m)
Rio Grande Rise
4 4.5 5
30 40 50
l/mol)
sacculiferruber
Leone Riserial Atlantic
1500
2000
2500
3000
3500
4000
4500
5000
55002 2.5 3 3.5 4 4.5 5
-10 0 10 20 30 40 50
depth (m)
Mg/Ca (mmol/mol)
CO32-
Rio Grande Risewestern south Atlantic
ol/mol] [µmol/mol]
. (2002). Upper panel: Mg/Ca ratios in two foraminifer species G.
Arrows indicate the Mg/Ca decrease relative to shallower samples.turation, at the respective sample depths. Atlantic Mg/Ca ratios arepersaturated. Lower panel: Temperature difference between depth-tes depths >2.8 km, which Dekens et al. (2002) recommended for ado not match mean annual SST (i.e. DT–0), an observation similarc: compared to shallow core sites, temperatures are overestimatedufficient for cores >4.4 km water depth.
B. Honisch et al. / Geochimica et Cosmochimica Acta 121 (2013) 196–213 203
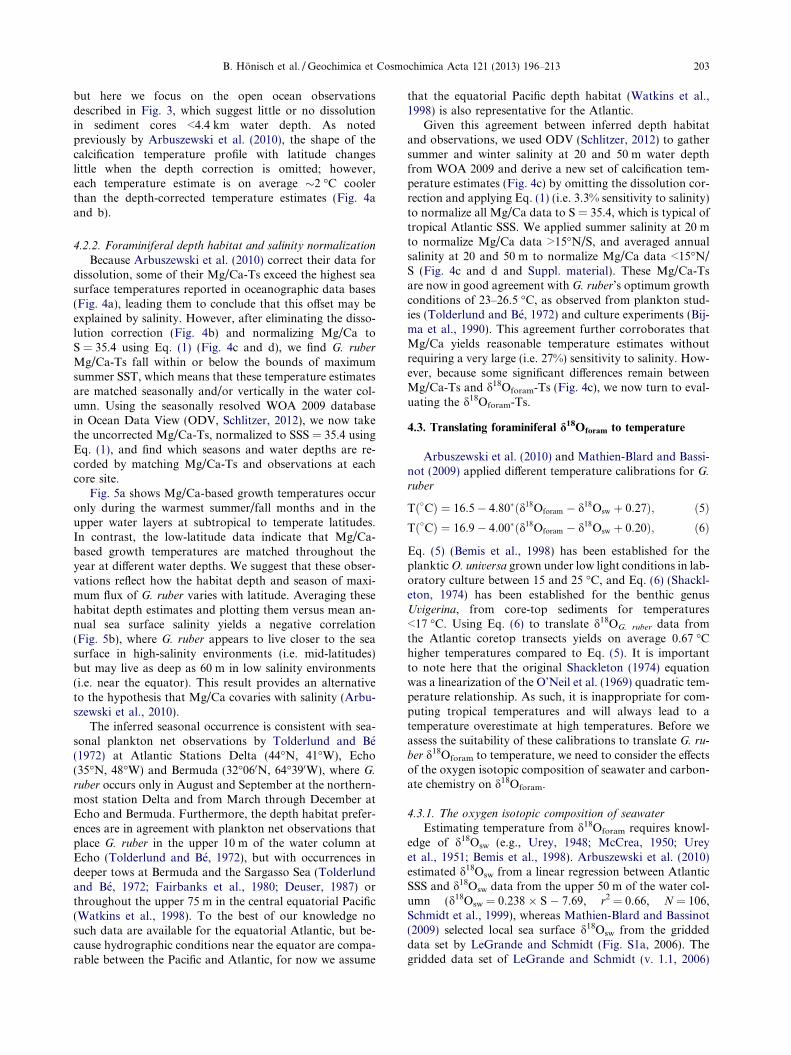
but here we focus on the open ocean observationsdescribed in Fig. 3, which suggest little or no dissolutionin sediment cores <4.4 km water depth. As notedpreviously by Arbuszewski et al. (2010), the shape of thecalcification temperature profile with latitude changeslittle when the depth correction is omitted; however,each temperature estimate is on average �2 �C coolerthan the depth-corrected temperature estimates (Fig. 4aand b).
4.2.2. Foraminiferal depth habitat and salinity normalization
Because Arbuszewski et al. (2010) correct their data fordissolution, some of their Mg/Ca-Ts exceed the highest seasurface temperatures reported in oceanographic data bases(Fig. 4a), leading them to conclude that this offset may beexplained by salinity. However, after eliminating the disso-lution correction (Fig. 4b) and normalizing Mg/Ca toS = 35.4 using Eq. (1) (Fig. 4c and d), we find G. ruber
Mg/Ca-Ts fall within or below the bounds of maximumsummer SST, which means that these temperature estimatesare matched seasonally and/or vertically in the water col-umn. Using the seasonally resolved WOA 2009 databasein Ocean Data View (ODV, Schlitzer, 2012), we now takethe uncorrected Mg/Ca-Ts, normalized to SSS = 35.4 usingEq. (1), and find which seasons and water depths are re-corded by matching Mg/Ca-Ts and observations at eachcore site.
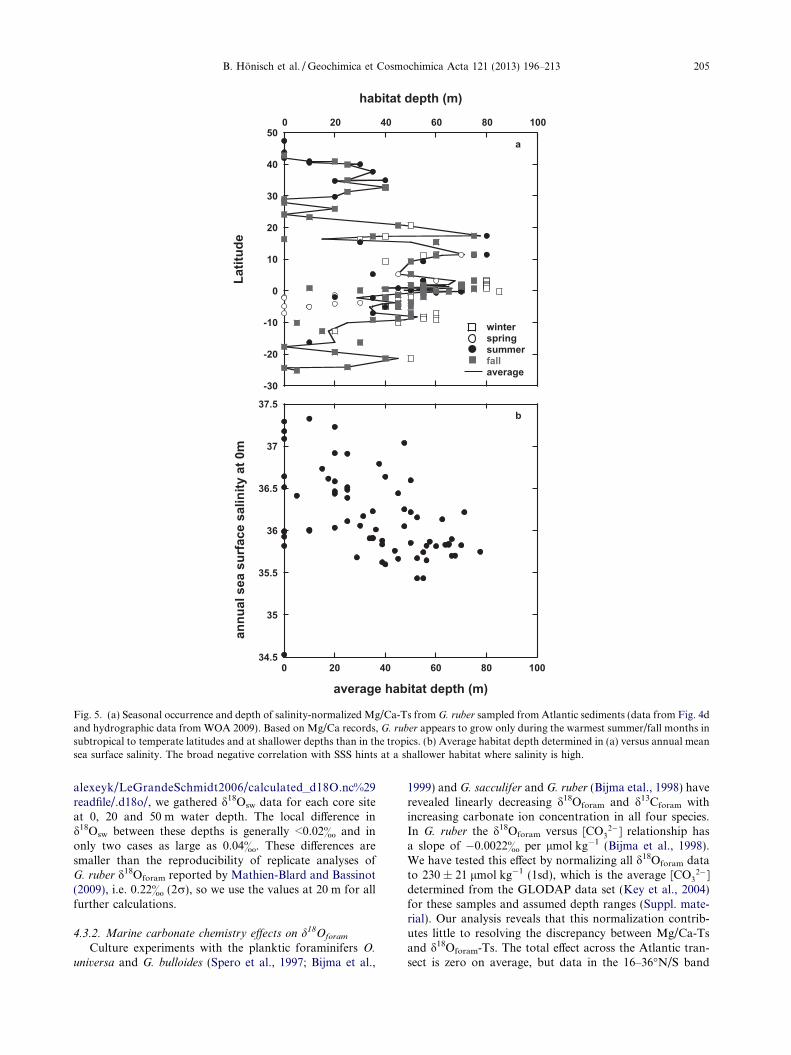
Fig. 5a shows Mg/Ca-based growth temperatures occuronly during the warmest summer/fall months and in theupper water layers at subtropical to temperate latitudes.In contrast, the low-latitude data indicate that Mg/Ca-based growth temperatures are matched throughout theyear at different water depths. We suggest that these obser-vations reflect how the habitat depth and season of maxi-mum flux of G. ruber varies with latitude. Averaging thesehabitat depth estimates and plotting them versus mean an-nual sea surface salinity yields a negative correlation(Fig. 5b), where G. ruber appears to live closer to the seasurface in high-salinity environments (i.e. mid-latitudes)but may live as deep as 60 m in low salinity environments(i.e. near the equator). This result provides an alternativeto the hypothesis that Mg/Ca covaries with salinity (Arbu-szewski et al., 2010).
The inferred seasonal occurrence is consistent with sea-sonal plankton net observations by Tolderlund and Be(1972) at Atlantic Stations Delta (44�N, 41�W), Echo(35�N, 48�W) and Bermuda (32�060N, 64�390W), where G.
ruber occurs only in August and September at the northern-most station Delta and from March through December atEcho and Bermuda. Furthermore, the depth habitat prefer-ences are in agreement with plankton net observations thatplace G. ruber in the upper 10 m of the water column atEcho (Tolderlund and Be, 1972), but with occurrences indeeper tows at Bermuda and the Sargasso Sea (Tolderlundand Be, 1972; Fairbanks et al., 1980; Deuser, 1987) orthroughout the upper 75 m in the central equatorial Pacific(Watkins et al., 1998). To the best of our knowledge nosuch data are available for the equatorial Atlantic, but be-cause hydrographic conditions near the equator are compa-rable between the Pacific and Atlantic, for now we assume
that the equatorial Pacific depth habitat (Watkins et al.,1998) is also representative for the Atlantic.
Given this agreement between inferred depth habitatand observations, we used ODV (Schlitzer, 2012) to gathersummer and winter salinity at 20 and 50 m water depthfrom WOA 2009 and derive a new set of calcification tem-perature estimates (Fig. 4c) by omitting the dissolution cor-rection and applying Eq. (1) (i.e. 3.3% sensitivity to salinity)to normalize all Mg/Ca data to S = 35.4, which is typical oftropical Atlantic SSS. We applied summer salinity at 20 mto normalize Mg/Ca data >15�N/S, and averaged annualsalinity at 20 and 50 m to normalize Mg/Ca data <15�N/S (Fig. 4c and d and Suppl. material). These Mg/Ca-Tsare now in good agreement with G. ruber’s optimum growthconditions of 23–26.5 �C, as observed from plankton stud-ies (Tolderlund and Be, 1972) and culture experiments (Bij-ma et al., 1990). This agreement further corroborates thatMg/Ca yields reasonable temperature estimates withoutrequiring a very large (i.e. 27%) sensitivity to salinity. How-ever, because some significant differences remain betweenMg/Ca-Ts and d18Oforam-Ts (Fig. 4c), we now turn to eval-uating the d18Oforam-Ts.
4.3. Translating foraminiferal d18Oforam to temperature
Arbuszewski et al. (2010) and Mathien-Blard and Bassi-not (2009) applied different temperature calibrations for G.
ruber
Tð�CÞ ¼ 16:5� 4:80�ðd18Oforam � d18Osw þ 0:27Þ; ð5ÞTð�CÞ ¼ 16:9� 4:00�ðd18Oforam � d18Osw þ 0:20Þ; ð6Þ
Eq. (5) (Bemis et al., 1998) has been established for theplanktic O. universa grown under low light conditions in lab-oratory culture between 15 and 25 �C, and Eq. (6) (Shackl-eton, 1974) has been established for the benthic genusUvigerina, from core-top sediments for temperatures<17 �C. Using Eq. (6) to translate d18OG. ruber data fromthe Atlantic coretop transects yields on average 0.67 �Chigher temperatures compared to Eq. (5). It is importantto note here that the original Shackleton (1974) equationwas a linearization of the O’Neil et al. (1969) quadratic tem-perature relationship. As such, it is inappropriate for com-puting tropical temperatures and will always lead to atemperature overestimate at high temperatures. Before weassess the suitability of these calibrations to translate G. ru-
ber d18Oforam to temperature, we need to consider the effectsof the oxygen isotopic composition of seawater and carbon-ate chemistry on d18Oforam.
4.3.1. The oxygen isotopic composition of seawater
Estimating temperature from d18Oforam requires knowl-edge of d18Osw (e.g., Urey, 1948; McCrea, 1950; Ureyet al., 1951; Bemis et al., 1998). Arbuszewski et al. (2010)estimated d18Osw from a linear regression between AtlanticSSS and d18Osw data from the upper 50 m of the water col-umn (d18Osw = 0.238 � S � 7.69, r2 = 0.66, N = 106,Schmidt et al., 1999), whereas Mathien-Blard and Bassinot(2009) selected local sea surface d18Osw from the griddeddata set by LeGrande and Schmidt (Fig. S1a, 2006). Thegridded data set of LeGrande and Schmidt (v. 1.1, 2006)
16 18 20 22 24 26 28 30 32
b d
2
2
Latitude
16 18 20 22 24 26 28 30 32-30
-20
-10
0
10
20
30
40
50
- dissolution correction
- linear 18O--sw vs. S relationship- LL equation
- no diss. correction
- gridded 18O--sw vs. S relationship- LL equation
- CO3
2- normalized
- no diss. correction- normalized to S=35.4
- gridded 18O--sw vs. S relationship- HL equation
- CO3
2- normalized
- no diss. correction- normalized to S=35.4
- gridded 18O--sw vs. S relationship
- CO3
2- normalized
18O
M
g/C
a
16 18 20 22 24 26 28 30 32
c
16 18 20 22 24 26 28 30 32-30
-20
-10
0
10
20
30
40
50
Latit
ude
SST annualSST summerSST winter
a
18O-TMg/Ca-T
Fig. 4. Temperature estimates from d18O and Mg/Ca in G. ruber tests from Atlantic sediments (a–d), with upper boxes indicatingnormalizations applied to each proxy. The optimal growth temperature for G. ruber (23–26.5 �C, Tolderlund and Be, 1972; Bijma et al., 1990)is indicated in (b–d) by shading. Mg/Ca data are from Arbuszewski et al. (dots, 2010) and Mathien-Blard and Bassinot (triangles, 2009). (a)Mg/Ca-Ts obtained by applying a depth correction to all original values >2.8 km water depth (Dekens et al., 2002), and d18Oforam-Ts using theLL equation (Eq. (5), Bemis et al., 1998) and a linear regression between d18Osw and salinity (Arbuszewski et al., 2010) to translateforaminiferal d18O to temperature. (b) Same Mg/Ca data but no depth correction was applied. Temperature estimates from d18Oforam arebased on the LL-equation as in (a), but are normalized to [CO3
2�] = 230 lmol kg�1, and use d18Osw based on the gridded data set afterLeGrande and Schmidt (2006). The bracket highlights estimates that exceed maximum sea surface temperatures in the 12�N–10�S latitudinalband. (c) Same Mg/Ca-Ts as in (b) but Mg/Ca was normalized to salinity = 35.4 (Eq. (1)). d18Oforam-Ts were translated using the high lightequation (Eq. (7), Bemis et al., 1998). In contrast to (b), the d18Oforam-Ts fall within or below the local SST bounds near the equator but thedifference to Mg/Ca-Ts is greater in the extratropics. (d) Same Mg/Ca-Ts as in (c), d18Oforam-Ts between 12�N and 10�S are based on the highlight equation (bracket, Eq. (7)), d18Oforam-Ts >12�N and >10�S are based on the LL equation (Eq. (5)). Open d18O symbols in (d) highlightSouth Atlantic data, many of which show a negative deviation from this foraminifer species’ optimum growth temperature despite theseasonal presence of optimum temperatures at the core sites. Horizontal bars in (d) show averages for 2r uncertainties for temperatureestimates from d18Oforam (black) and Mg/Ca (red). Sea surface temperatures (SST) have been determined for the summer and winter seasonand the annual average at each core site (black and grey lines). In contrast to (a), temperature estimates from both proxies in (c, d) are presentseasonally in the water column.
204 B. Honisch et al. / Geochimica et Cosmochimica Acta 121 (2013) 196–213
is derived from the same global data base as Schmidt et al.(1999); the authors noted, however, that d18Osw to salinityrelationships are only regionally coherent and may varyon seasonal, annual and inter-annual timescales.
A simple cross plot of the d18Osw estimates derived fromthe linear regression versus d18Osw estimates from the grid-ded data set of LeGrande and Schmidt (2006) (Fig. S1b)shows that both estimates agree within error (±0.26&
and ±0.15&, respectively) but that the d18Osw values fromthe gridded data set are consistently greater than estimatesfrom the linear regression in the 16–36�N/S band by about0.1&. Although the uncertainty of d18Osw estimates is large(Fig. S1b), this latitudinal band is where Arbuszewski et al.(2010) found the highest salinity effect and the greatest devi-
ation between Mg/Ca-Ts and d18Oforam-Ts. In comparison,the study of Mathien-Blard and Bassinot (2009) includesonly three samples from this mid-latitude band, and focusesprimarily on higher latitudes. This analysis suggests uncer-tainty in d18Osw contributes to the discrepancy betweend18Oforam-Ts and Mg/Ca-Ts. d18Oforam values may beslightly undercorrected in the 16–36�N/S band andd18Oforam temperatures underestimated by up to 0.5 �C.
Given that LeGrande and Schmidt (2006) provide amore differentiated and better constrained assessment of re-gional d18Osw, we have applied estimates from their griddeddata set to the core-top transect of Arbuszewski et al.(2010) (Fig. 4b and c). Using the data library clone athttp://granger.ldeo.columbia.edu/expert/%28/data/free/
0 20 40 60 80 100
-30
-20
-10
0
10
20
30
40
50
habitat depth (m)
Latit
ude
winter spring summer fall average
a
0 20 40 60 80 10034.5
35
35.5
36
36.5
37
37.5
average habitat depth (m)
annu
al s
ea s
urfa
ce s
alin
ity a
t 0m
b
Fig. 5. (a) Seasonal occurrence and depth of salinity-normalized Mg/Ca-Ts from G. ruber sampled from Atlantic sediments (data from Fig. 4dand hydrographic data from WOA 2009). Based on Mg/Ca records, G. ruber appears to grow only during the warmest summer/fall months insubtropical to temperate latitudes and at shallower depths than in the tropics. (b) Average habitat depth determined in (a) versus annual meansea surface salinity. The broad negative correlation with SSS hints at a shallower habitat where salinity is high.
B. Honisch et al. / Geochimica et Cosmochimica Acta 121 (2013) 196–213 205
alexeyk/LeGrandeSchmidt2006/calculated_d18O.nc%29readfile/.d18o/, we gathered d18Osw data for each core siteat 0, 20 and 50 m water depth. The local difference ind18Osw between these depths is generally <0.02& and inonly two cases as large as 0.04&. These differences aresmaller than the reproducibility of replicate analyses ofG. ruber d18Oforam reported by Mathien-Blard and Bassinot(2009), i.e. 0.22& (2r), so we use the values at 20 m for allfurther calculations.
4.3.2. Marine carbonate chemistry effects on d18Oforam
Culture experiments with the planktic foraminifers O.
universa and G. bulloides (Spero et al., 1997; Bijma et al.,
1999) and G. sacculifer and G. ruber (Bijma etal., 1998) haverevealed linearly decreasing d18Oforam and d13Cforam withincreasing carbonate ion concentration in all four species.In G. ruber the d18Oforam versus [CO3
2�] relationship hasa slope of �0.0022& per lmol kg�1 (Bijma et al., 1998).We have tested this effect by normalizing all d18Oforam datato 230 ± 21 lmol kg�1 (1sd), which is the average [CO3
2�]determined from the GLODAP data set (Key et al., 2004)for these samples and assumed depth ranges (Suppl. mate-rial). Our analysis reveals that this normalization contrib-utes little to resolving the discrepancy between Mg/Ca-Tsand d18Oforam-Ts. The total effect across the Atlantic tran-sect is zero on average, but data in the 16–36�N/S band
206 B. Honisch et al. / Geochimica et Cosmochimica Acta 121 (2013) 196–213
are up to 0.5 �C cooler and data >36�N and <16�N/S areup to 0.33 �C warmer than the average (Fig. 4b and Suppl.material). The net effect of this normalization slightly in-creases the offset between Mg/Ca-Ts and d18Oforam-Ts, ex-cept for three samples >36�N, where the offset becomessmaller (Fig. 4b).
4.4. Remaining differences between Mg/Ca and d18Oforam
temperature estimates
Using the O. universa low light equation (Eq. (5)) andgridded d18Osw to translate the [CO3
2�]-normalizedd18Oforam data to temperature yields good agreement withthe Mg/Ca-T data north of 15�N (r2 = 0.82), but withinthe 12�N–10�S band the Mg/Ca-Ts fall below annual SST.In contrast, the d18Oforam-Ts tend to exceed annual SST,with several values exceeding the warmest summer tempera-tures observed in this 12�N–10�S band by up to 1.1 �C(Fig. 4b). South of 10�S the d18Oforam-Ts systematically fallbelow G. ruber’s optimum growth temperature of 23–26.5 �C (Tolderlund and Be, 1972; Bijma et al., 1990). Givenboth annual and summer SSTs of 23–26 �C are observed, it issurprising that G. ruber should prefer to grow at T < 22 �C atthese sites. These discrepancies need to be explained, and inthe absence of known geochemical effects on Mg/Ca, we willcontinue to focus on potential uncertainties on the d18Oforam
reconstructions, in particular equatorial and South Atlanticd18Osw, possible mixing with glacial-age foraminifers, andthe temperature equation used to translate d18Oforam.
4.4.1. Insufficient d18Osw data coverage
The d18Osw database of Schmidt et al. (1999) has verylimited data coverage near core sites in the equatorial andSouth Atlantic (Fig. S1a). The few available d18Osw datain those latitudes were collected close to the African andSouth American coastlines. This is different in the NorthAtlantic, where a greater number of data are available clo-ser to the core-top transect. In the South Atlantic it is nota-ble that neither the linear regression of Arbuszewski et al.(2010), nor the gridded data set of LeGrande and Schmidt(2006) yields d18Osw data higher than 1.02 ± 0.15& but thedatabase of Schmidt et al. (1999) does list a few d18Osw dataas high as 1.44 ± 0.05& on the western side of the SouthAtlantic Ocean (Fig. S1a). A 0.4& underestimate ofd18Osw translates to a �2 �C underestimate of growth tem-perature, which could bring the South Atlantic Mg/Ca-Tand d18Oforam-Ts into agreement, but it is unclear how farthose higher values may extend eastward. We have triedwithout success to gain access to water samples and unpub-lished d18Osw data that would improve the data coveragenear the core transect. The situation near the equator issimilar, with the linear regression and gridded data setyielding d18Osw data in the range of 0.75–0.87&, whereasmeasured d18Osw data range between 0.48& and 0.98&.The lowest data (0.48–0.69&) are from the eastern equato-rial Atlantic, where many of the core sites are located(Fig. S1a). If d18Osw near south equatorial core sites wereoverestimated, this would result in d18Oforam-Ts that aretoo warm. Although this is speculative, it highlights theneed for improved characterization of d18Osw.
4.4.2. Potential mixing with glacial-age foraminifers
In addition to uncertainties in d18Osw, Lohmann (1995)has reported the mixing of glacial age foraminifers into RioGrande Rise core-top sediments, where sedimentation ratesare as low as 0.5 cm/ky. Similarly, Billups and Spero (1996)showed that a core-top sample from an even higher sedi-mentation rate core (1.5 cm/ky) in the central equatorialAtlantic at 5�N, 20.5�W (2930 m depth) contained >20%glacial G. sacculifer. Stott and Tang (1996) made similarobservations in equatorial and south Atlantic cores, whereindividual G. ruber and G. sacculifer from core-top sampleshad >10% glacial d18O values. Although the data shown inFig. 4 are from sediment cores retrieved somewhat furthereast of the Rio Grande Rise, they are near the core sitestudied by Billups and Spero (1996) and Stott and Tang(1996). Given the relatively deep water depths between3300 and 3900 m of the cores in this database (Suppl. mate-rial), it is likely that comparable low sedimentation rateswould be found in cores from the South Atlantic gyre. Ifmixing with glacial age tests is an issue at these core sites,the added ice volume effect on glacial d18Osw (�+1.1&)would create a much larger bias on d18Oforam-Ts than onMg/Ca-Ts. Single test d18Oforam analyses on G. saccculifer
and G. ruber suggest this effect could produce an apparentcooling of 0.5–1 �C (Billups and Spero, 1996; Stott andTang, 1996). In comparison, 2–3 �C lower glacial tempera-ture translates to 18–27% lower Mg/Ca, which is partlycompensated by higher glacial salinity by 1 unit or +3–5% Mg/Ca. This leads to an average glacial Mg/Ca �18%lower than modern, and consequently a diminishing�0.2 �C apparent cooling if bioturbation mixed 10% glacialtests into core-top sediments.
4.4.3. Light effects on d18Oforam in symbiont-bearing species
To date, no culture calibration has been established ford18Oforam in tests of G. ruber; Arbuszewski et al. (2010)therefore chose an O. universa equation established in lab-oratory culture under low light conditions (Eq. (5), Bemiset al., 1998), whereas Mathien-Blard and Bassinot (2009)used Shackleton’s (1974) core-top calibration for the ben-thic foraminifer genus Uvigerina (Eq. (6)). Both calibrationsyield relatively similar results but their adequacy for G. ru-
ber has not yet been discussed; we revisit the O. universa
equation here.Bemis et al. (1998) cultured the symbiont-bearing O. uni-
versa under two different light intensities: under light-satu-rating conditions >380 lmol photons m�2 s�1 (high light,HL) and below the light compensation level at 20–30 lmolphotons m�2 s�1 (low light, LL, Eq. (5)) (Rink et al., 1998).The resulting temperature equations differ in their y-axisintercepts, which has been explained by the effect of symbi-ont photosynthetic activity on elevating the carbonate ionconcentration in the foraminiferal microenvironment (Be-mis et al., 1998). The HL equation is:
Tð�CÞ ¼ 14:9� 4:80� ðd18Oforam � d18Osw þ 0:27Þ ð7Þ
Bemis et al. (1998) compared these equations to previouscalibrations, including a suite of Atlantic G. ruber core-topdata from Wang et al. (1995). They noted that where an-nual SST is warmest, i.e. at the equator, G. ruber data are
B. Honisch et al. / Geochimica et Cosmochimica Acta 121 (2013) 196–213 207
best described by the HL equation, and where annual SST<25 �C, G. ruber data are better described by the LL equa-tion. Similarly, Thunell et al. (1999) found good agreementbetween the HL equation and G. ruber collected from sed-iment trap material in the Guaymas Basin, Gulf of Califor-nia. We therefore decided to investigate potentialdifferences in surface-ocean light intensity across the latitu-dinal transect.
Using the Giovanni online data system of the GoddardEarth Sciences Data and Information Services Center(http://disc.sci.gsfc.nasa.gov/giovanni/overview/index.html)to read local photosynthetic active radiation (PAR) anddiffuse light attenuation coefficients at 490 nm fromSeaWIFS annual data, we determined light intensity at 20and 60 m water depth at each core site (Fig. S2, Suppl.material). Whereas light intensity at 20 m exceeds 200 lmolphotons m�2 s�1 at all latitudes, light intensity at 60 mwater depth falls below 50 lmol photons m�2 s�1 near theequator. Following photosynthesis measurements byJørgensen et al. (1985) and Rink et al. (1998), any light level>150 lmol photons m�2 s�1 exceeds light saturation of thesymbiont populations associated with O. universa and G.
sacculifer and would thus suggest using the HL equation,whereas any light level <50 lmol photons m�2 s�1 falls nearor below light saturation and thus would suggest using theLL equation. Based on this light regime, one would predictthe HL equation should produce the best temperature esti-mates everywhere except for the equator, where using theLL equation should yield better estimates. However, apply-ing the HL equation to extratropical samples yieldsd18Oforam-Ts that fall below the optimum growth tempera-ture of G. ruber and even further below Mg/Ca-Ts (Fig. 4c).Assigning the use of the HL and LL equations to samplesbased on irradiance levels therefore clearly leads to resultsthat are difficult to reconcile (see also Wang et al., 1995;Thunell et al., 1999). Unfortunately, no such light experi-ments are available for G. ruber. However, applying theO. universa HL equation to the equatorial G. ruber samplesdecreases d18Oforam-Ts by 1.6 �C and improves the agree-ment with Mg/Ca (Fig. 5c). Because the latitudinal light re-gime provides no support for the use of the HL equationnear the equator, we looked for alternative clues as towhy application of an equation with a lower y-intercept(i.e. the HL equation) may be warranted at low latitudes.
4.4.4. Size effects on d18Oforam in G. ruber
Here we focus on the 250–355 lm size fraction chosenby Arbuszewski et al. (2010) for foraminiferal sampling.In a recent test-size study on G. ruber in the Gulf of Mexico,Richey et al. (2012) observed a linear decrease in d18Oforam
with test size that translates to a +0.7–1.2 �C temperaturebias per 100 lm size increase. In contrast, the Mg/Ca ratioof G. ruber is constant in small tests and only increased intests larger than 355 lm diameter, for which the inferredtemperature bias is only half as large as in d18Oforam. Sim-ilar observations have been reported by Elderfield et al.(2002), but they observed a gradual increase in both proxieswith test size. It is not clear what causes these composition-size relationships but differences in depth habitat and/orseasonal occurrence are likely candidates (Spero et al.,
2003; Honisch and Hemming, 2004; Richey et al., 2012).Importantly, Spero and Lea (1993) observed that the sym-biont-bearing G. sacculifer grows larger tests with increas-ing light levels, suggesting that the size effect observed byRichey et al. (2012) may also be related to light levels andthat the use of the HL temperature equation on d18Oforam
in larger G. ruber may be more appropriate.Given the relatively wide size range studied by Arbu-
szewski et al. (2010) and the higher G. ruber growth ratesobserved under optimal growth conditions (Bijma et al.,1990), we investigated whether the size distribution withinthe 250–355 lm fraction varies along the Atlantic coretransect. We selected four core-top samples from Arbu-szewski’s Atlantic transect, covering 1–40�N, and mea-sured the average sizes of 30 randomly selected G. ruber
(sensu stricto) tests under a microscope. Although itshould be noted that the original size distribution mayhave been slightly different from ours (the samples arenow already depleted in G. ruber tests), tests from equato-rial regions are on average 80 lm larger compared tohigher latitudes (Fig. S3). This size difference hints at apotential bias in test geochemistry. Comparison with thesize effect on d18Oforam observed by Richey et al. (2012)suggests that this size difference could explain about halfor more of the difference between the HL and LL equa-tion, and that the use of the HL equation is more appro-priate in the 12�N–10�S band (see also Thunell et al.,1999). Given these observations we recommend that pale-oreconstructions should be based on sieve size ranges thatare restricted to 50-lm increments (e.g., 250–300 lm, 300–355 lm), so that any involuntary bias towards selectingthe largest tests in a sample is minimized.
4.5. Seasonality of G. ruber growth
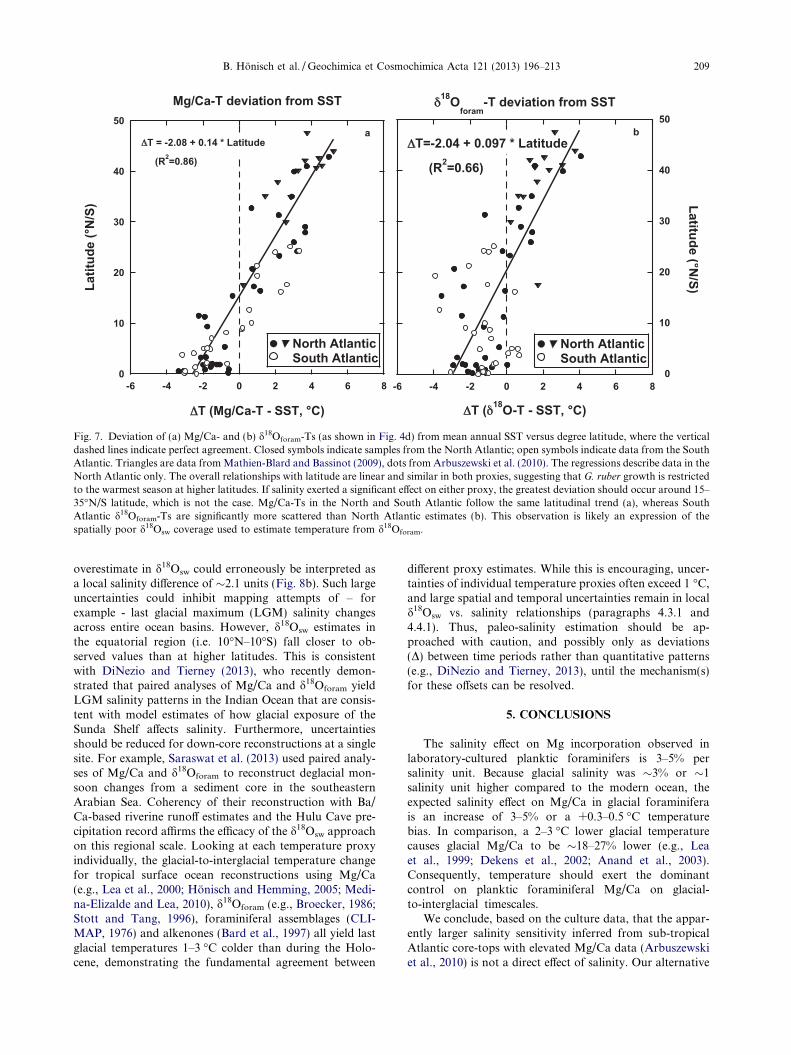
Our comparison of the Mg/Ca and d18O proxies in theNorth Atlantic shows that agreement between the twoproxies can be improved (R2 = 0.70) if known geochemicalproxy sensitivities are applied (Fig. 6). The benefit of thisapproach lies in the potential to unravel biological controlsthat cannot be studied in laboratory culture, where waterdepth is invariant and foraminiferal reproductive successcannot be quantified. The seasonality of G. ruber growthhas been observed with plankton nets at some locations(Tolderlund and Be, 1972; Watkins et al., 1998), and itcan now be corroborated by comparison of core-top proxytemperature estimates with hydrographic observations ofmean annual SST (Fig. 7). The proxy deviation from SSTis here expressed as DTMg/Ca = Mg/Ca-T – SST andDTd18O = d18Oforam-T – SST and yields up to +5 �C inmid latitudes and �3 �C near the equator. Althoughassumptions of habitat depth and season were part of ourapproach to normalize proxy records to common salinityand [CO3
2�], the effect of those normalizations is muchsmaller (<1 �C, Fig. 4) than the deviation of both DTMg/
Ca and DTd18O from mean annual SST. Despite remainingdifferences, we suggest that the agreement between thetwo proxy records is significant and indicates the seasonalpreference of G. ruber for warmer summer months at higherlatitudes. A similar seasonal bias for G. ruber Mg/Ca
208 B. Honisch et al. / Geochimica et Cosmochimica Acta 121 (2013) 196–213
temperatures was also proposed for Caribbean fossilassemblages during glacial cycles (Schmidt et al., 2006).
Near the equator, however, we cannot determine withcertainty whether proxy records indicate greater habitatdepth, or whether they may be biased by post-depositionaldissolution. Applying a dissolution correction only to equa-torial samples would further improve the agreement be-tween the Mg/Ca and d18Oforam estimates (Fig. 4d).
4.6. Deconvolving d18Oforam into temperature and salinity
contributions
Paleosalinity estimates have been determined by remov-ing the temperature component from d18Oforam recordsusing Mg/Ca-Ts and the ice volume component using glo-bal sealevel estimates. Calculated paleo-d18Osw are thentranslated to salinity via a modern d18Osw-salinity relation-ship (e.g., Flower et al., 2004; Schmidt et al., 2004; Weldeabet al., 2007). Based on the observations made herein, we re-visit this approach.
The line of argument applied in this study uses Mg/Cato estimate foraminiferal growth temperatures, which werethen used to determine G. ruber’s depth and season ofgrowth. The correlations shown in Fig. 7a and b suggesta stronger relationship with latitude for Mg/Ca-Ts thanfor d18Oforam-Ts. Fig. 4d shows the same differences be-tween the two proxy estimates for individual core sites.We have identified uncertainty in d18Osw and bioturbationas potential sources for uncertainty in the d18Oforam-Ts.However, determining which proxy may be biased dependson the approach. If we had used d18Oforam instead of Mg/Ca to determine G. ruber’s growth temperature, which is
16
18
20
22
24
26
28
30
16 18 20 22
T Mg/
Ca
T1
North AtlanticSouth Atlantic
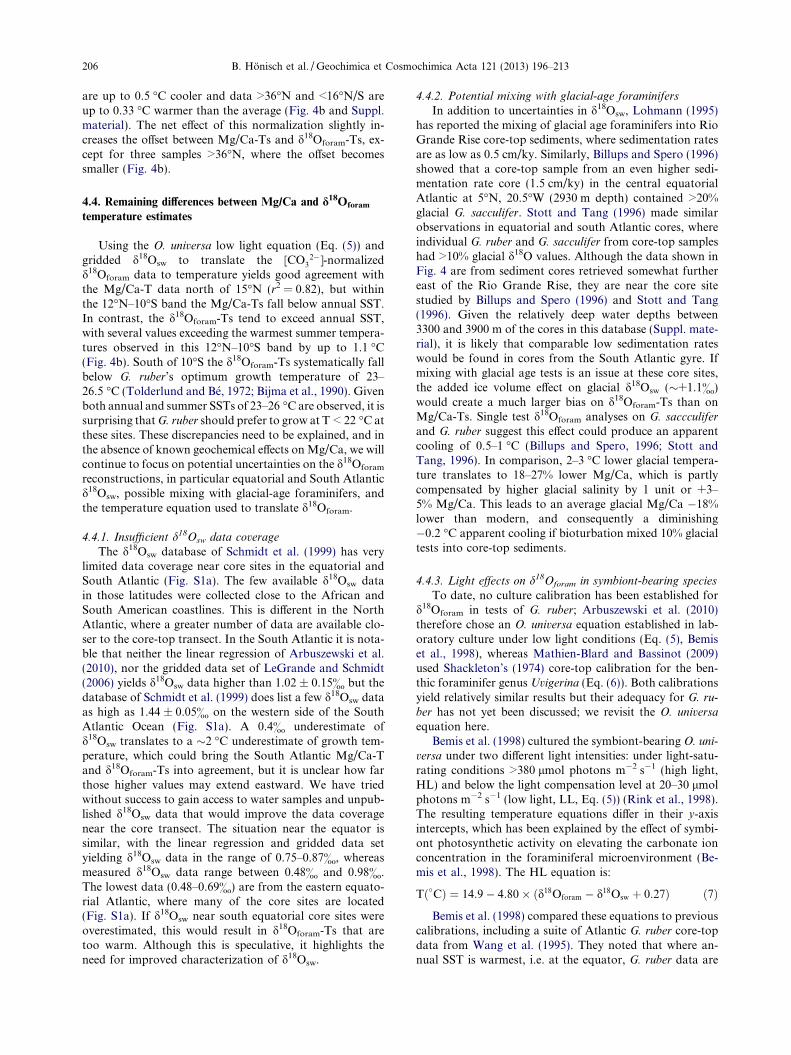
Fig. 6. Comparison of temperature estimates from Mg/Ca and d18Ofora
regression, the cross indicates the relative uncertainty of each data point,of the local d18Oseawater estimate on Td18O. While these estimates are reasd18Oforam-Ts. South Atlantic data (small open symbols) show significantlytext and Fig. 7 for comparison of greater uncertainty in South Atlantic
the approach originally taken by Arbuszewski et al.(2010) and Mathien-Blard and Bassinot (2009), we wouldneed to search for parameters that could explain deviationsof Mg/Ca-Ts from d18Oforam-Ts. With our current state ofknowledge we cannot identify whether one proxy is moreor less biased than the other, as both proxies yield temper-atures that are observed in the water column at the respec-tive core sites. Arbuszewski et al. (2010) aimed to resolvethis issue by performing multi-variate regressions that linkmean annual temperature and salinity to Mg/Ca, d18Oforam
and DCO32�:
Mean annual SST ð�CÞ ¼ 16:06þ 4:62�lnðMg=CaÞ� 3:42�d18Oforam � 0:1�DCO3
2�;
ð8ÞMean annual SST ¼ 34:28þ 1:97�lnðMg=CaÞ
þ 0:59�d18Oforam ð9Þ
Although the results appear promising when comparedto modern hydrographic data, the temperature and salinitysensitivities of Mg/Ca and d18Oforam in these regressions donot agree with observations from laboratory cultures (Eqs.()()()()()()()(1)–(7), this study, Bemis et al., 1998; Lea et al.,1999; Kısakurek et al., 2008), plankton nets (Anand et al.,2003) or core-top calibrations (Shackleton, 1974; Dekenset al., 2002). Furthermore, because both proxies are usedin both regressions, neither proxy may subsequently be usedindependently to verify the regression’s accuracy.
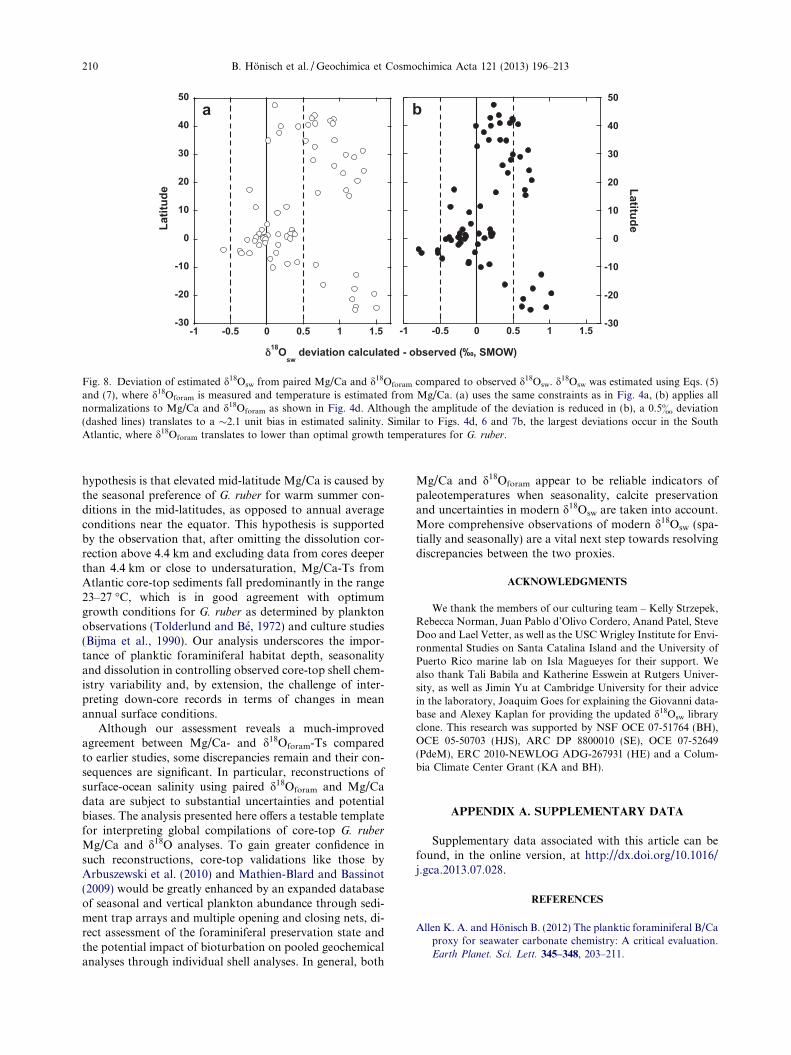
We have tried to reconcile the two proxy estimates, butdifferences remain (Figs. 4d, 6 and 7) that limit the ability touse paired analyses of Mg/Ca and d18Oforam to reconstructpast salinity (Fig. 8). For instance, a 0.5& under- or
24 26 28 30
8O
TMg/Ca
= 1.031 * T18O
m proxies (data from Fig. 4d). The black line describes the linearwhich includes the analytical uncertainty of each measurement andonably well aligned, Mg/Ca-Ts are generally elevated compared togreater scatter than North Atlantic data (large closed symbols). See
d18Oforam-Ts compared to Mg/Ca-Ts.
0
10
20
30
40
50
-6 -4 -2 0 2 4 6 8
Mg/Ca-T deviation from SST
T = -2.08 + 0.14 * Latitude
(R2=0.86)
North Atlantic South Atlantic
a
0
10
20
30
40
50
-6 -4 -2 0 2 4 6 8
18Oforam
-T deviation from SST
T ( 18
T=-2.04 + 0.097 * Latitude
(R2=0.66)
b
North Atlantic South Atlantic
Fig. 7. Deviation of (a) Mg/Ca- and (b) d18Oforam-Ts (as shown in Fig. 4d) from mean annual SST versus degree latitude, where the verticaldashed lines indicate perfect agreement. Closed symbols indicate samples from the North Atlantic; open symbols indicate data from the SouthAtlantic. Triangles are data from Mathien-Blard and Bassinot (2009), dots from Arbuszewski et al. (2010). The regressions describe data in theNorth Atlantic only. The overall relationships with latitude are linear and similar in both proxies, suggesting that G. ruber growth is restrictedto the warmest season at higher latitudes. If salinity exerted a significant effect on either proxy, the greatest deviation should occur around 15–35�N/S latitude, which is not the case. Mg/Ca-Ts in the North and South Atlantic follow the same latitudinal trend (a), whereas SouthAtlantic d18Oforam-Ts are significantly more scattered than North Atlantic estimates (b). This observation is likely an expression of thespatially poor d18Osw coverage used to estimate temperature from d18Oforam.
B. Honisch et al. / Geochimica et Cosmochimica Acta 121 (2013) 196–213 209
overestimate in d18Osw could erroneously be interpreted asa local salinity difference of �2.1 units (Fig. 8b). Such largeuncertainties could inhibit mapping attempts of – forexample - last glacial maximum (LGM) salinity changesacross entire ocean basins. However, d18Osw estimates inthe equatorial region (i.e. 10�N–10�S) fall closer to ob-served values than at higher latitudes. This is consistentwith DiNezio and Tierney (2013), who recently demon-strated that paired analyses of Mg/Ca and d18Oforam yieldLGM salinity patterns in the Indian Ocean that are consis-tent with model estimates of how glacial exposure of theSunda Shelf affects salinity. Furthermore, uncertaintiesshould be reduced for down-core reconstructions at a singlesite. For example, Saraswat et al. (2013) used paired analy-ses of Mg/Ca and d18Oforam to reconstruct deglacial mon-soon changes from a sediment core in the southeasternArabian Sea. Coherency of their reconstruction with Ba/Ca-based riverine runoff estimates and the Hulu Cave pre-cipitation record affirms the efficacy of the d18Osw approachon this regional scale. Looking at each temperature proxyindividually, the glacial-to-interglacial temperature changefor tropical surface ocean reconstructions using Mg/Ca(e.g., Lea et al., 2000; Honisch and Hemming, 2005; Medi-na-Elizalde and Lea, 2010), d18Oforam (e.g., Broecker, 1986;Stott and Tang, 1996), foraminiferal assemblages (CLI-MAP, 1976) and alkenones (Bard et al., 1997) all yield lastglacial temperatures 1–3 �C colder than during the Holo-cene, demonstrating the fundamental agreement between
different proxy estimates. While this is encouraging, uncer-tainties of individual temperature proxies often exceed 1 �C,and large spatial and temporal uncertainties remain in locald18Osw vs. salinity relationships (paragraphs 4.3.1 and4.4.1). Thus, paleo-salinity estimation should be ap-proached with caution, and possibly only as deviations(D) between time periods rather than quantitative patterns(e.g., DiNezio and Tierney, 2013), until the mechanism(s)for these offsets can be resolved.
5. CONCLUSIONS
The salinity effect on Mg incorporation observed inlaboratory-cultured planktic foraminifers is 3–5% persalinity unit. Because glacial salinity was �3% or �1salinity unit higher compared to the modern ocean, theexpected salinity effect on Mg/Ca in glacial foraminiferais an increase of 3–5% or a +0.3–0.5 �C temperaturebias. In comparison, a 2–3 �C lower glacial temperaturecauses glacial Mg/Ca to be �18–27% lower (e.g., Leaet al., 1999; Dekens et al., 2002; Anand et al., 2003).Consequently, temperature should exert the dominantcontrol on planktic foraminiferal Mg/Ca on glacial-to-interglacial timescales.
We conclude, based on the culture data, that the appar-ently larger salinity sensitivity inferred from sub-tropicalAtlantic core-tops with elevated Mg/Ca data (Arbuszewskiet al., 2010) is not a direct effect of salinity. Our alternative
-30
-20
-10
0
10
20
30
40
50
-1 -0.5 0 0.5 1 1.5
Latitude
b
-30
-20
-10
0
10
20
30
40
50
-1 -0.5 0 0.5 1 1.5
Latit
ude
a
18Osw
Fig. 8. Deviation of estimated d18Osw from paired Mg/Ca and d18Oforam compared to observed d18Osw. d18Osw was estimated using Eqs. (5)and (7), where d18Oforam is measured and temperature is estimated from Mg/Ca. (a) uses the same constraints as in Fig. 4a, (b) applies allnormalizations to Mg/Ca and d18Oforam as shown in Fig. 4d. Although the amplitude of the deviation is reduced in (b), a 0.5& deviation(dashed lines) translates to a �2.1 unit bias in estimated salinity. Similar to Figs. 4d, 6 and 7b, the largest deviations occur in the SouthAtlantic, where d18Oforam translates to lower than optimal growth temperatures for G. ruber.
210 B. Honisch et al. / Geochimica et Cosmochimica Acta 121 (2013) 196–213
hypothesis is that elevated mid-latitude Mg/Ca is caused bythe seasonal preference of G. ruber for warm summer con-ditions in the mid-latitudes, as opposed to annual averageconditions near the equator. This hypothesis is supportedby the observation that, after omitting the dissolution cor-rection above 4.4 km and excluding data from cores deeperthan 4.4 km or close to undersaturation, Mg/Ca-Ts fromAtlantic core-top sediments fall predominantly in the range23–27 �C, which is in good agreement with optimumgrowth conditions for G. ruber as determined by planktonobservations (Tolderlund and Be, 1972) and culture studies(Bijma et al., 1990). Our analysis underscores the impor-tance of planktic foraminiferal habitat depth, seasonalityand dissolution in controlling observed core-top shell chem-istry variability and, by extension, the challenge of inter-preting down-core records in terms of changes in meanannual surface conditions.
Although our assessment reveals a much-improvedagreement between Mg/Ca- and d18Oforam-Ts comparedto earlier studies, some discrepancies remain and their con-sequences are significant. In particular, reconstructions ofsurface-ocean salinity using paired d18Oforam and Mg/Cadata are subject to substantial uncertainties and potentialbiases. The analysis presented here offers a testable templatefor interpreting global compilations of core-top G. ruber
Mg/Ca and d18O analyses. To gain greater confidence insuch reconstructions, core-top validations like those byArbuszewski et al. (2010) and Mathien-Blard and Bassinot(2009) would be greatly enhanced by an expanded databaseof seasonal and vertical plankton abundance through sedi-ment trap arrays and multiple opening and closing nets, di-rect assessment of the foraminiferal preservation state andthe potential impact of bioturbation on pooled geochemicalanalyses through individual shell analyses. In general, both
Mg/Ca and d18Oforam appear to be reliable indicators ofpaleotemperatures when seasonality, calcite preservationand uncertainties in modern d18Osw are taken into account.More comprehensive observations of modern d18Osw (spa-tially and seasonally) are a vital next step towards resolvingdiscrepancies between the two proxies.
ACKNOWLEDGMENTS
We thank the members of our culturing team – Kelly Strzepek,Rebecca Norman, Juan Pablo d’Olivo Cordero, Anand Patel, SteveDoo and Lael Vetter, as well as the USC Wrigley Institute for Envi-ronmental Studies on Santa Catalina Island and the University ofPuerto Rico marine lab on Isla Magueyes for their support. Wealso thank Tali Babila and Katherine Esswein at Rutgers Univer-sity, as well as Jimin Yu at Cambridge University for their advicein the laboratory, Joaquim Goes for explaining the Giovanni data-base and Alexey Kaplan for providing the updated d18Osw libraryclone. This research was supported by NSF OCE 07-51764 (BH),OCE 05-50703 (HJS), ARC DP 8800010 (SE), OCE 07-52649(PdeM), ERC 2010-NEWLOG ADG-267931 (HE) and a Colum-bia Climate Center Grant (KA and BH).
APPENDIX A. SUPPLEMENTARY DATA
Supplementary data associated with this article can befound, in the online version, at http://dx.doi.org/10.1016/j.gca.2013.07.028.
REFERENCES
Allen K. A. and Honisch B. (2012) The planktic foraminiferal B/Caproxy for seawater carbonate chemistry: A critical evaluation.Earth Planet. Sci. Lett. 345–348, 203–211.
B. Honisch et al. / Geochimica et Cosmochimica Acta 121 (2013) 196–213 211
Allen K. A., Honisch B., Eggins S. M., Yu J. M., Spero H. J. andElderfield H. (2011) Controls on boron incorporation incultured tests of the planktic foraminifer Orbulina universa.Earth Planet. Sci. Lett. 309, 291–301.
Allen K. A., Honisch B., Eggins S. M. and Rosenthal Y. (2012)Environmental controls on B/Ca in calcite tests of the tropicalplanktic foraminifer species Globigerinoides ruber and Globige-
rinoides sacculifer. Earth Planet. Sci. Lett. 351–352, 270–280.Anand P., Elderfield H. and Conte M. H. (2003) Calibration of
Mg/Ca thermometry in planktonic foraminifera from a sedi-ment trap time series. Paleoceanography 18, 15.
Arbuszewski J., deMenocal P., Kaplan A. and Farmer E. C. (2010)On the fidelity of shell-derived delta O-18(seawater) estimates.Earth Planet. Sci. Lett. 300, 185–196.
Bard E., Rostek F. and Sonzogni C. (1997) Interhemisphericsynchrony of the last deglaciation inferred from alkenonepalaeothermometry. Nature 385, 707–710.
Barker S., Greaves M. and Elderfield H. (2003) A study of cleaningprocedures used for foraminiferal Mg/Ca paleothermometry.Geochem. Geophys. Geosyst. 4.
Bemis B. E., Spero H. J., Bijma J. and Lea D. W. (1998)Reevaluation of the oxygen isotopic composition of planktonicforaminifera: Experimental results and revised paleotempera-ture equations. Paleoceanography 13, 150–160.
Bijma J., Faber, Jr., W. W. and Hemleben C. (1990) Temperatureand salinity limits for growth and survival of some planktonicforaminifers in laboratory cultures. J. Foramin. Res. 20, 95–116.
Bijma J., Spero H. J., Lea D. W. (1998). Oceanic carbonatechemistry and foraminiferal isotopes: New laboratory results.In Sixth International Conference on Paleoceanography.
Bijma J., Spero H. J. and Lea D. W. (1999) Reassessingforaminiferal stable isotope geochemistry: Impact of the oce-anic carbonate system (experimental results). In Use of Proxies
in Paleoceanography: Examples from the South Atlantic (eds. G.Fischer and G. Wefer). Springer-Verlag, Berlin, Heidelberg, pp.489–512.
Billups K. and Spero H. J. (1996) Reconstructing the stable isotopegeochemistry and paleotemperatures of the equatorial Atlanticduring the last 150,000 years: Results from individual foram-inifera. Paleoceanography 11, 217–238.
Boyle E. A. and Keigwin L. D. (1985) Comparison of Atlantic andPacific paleochemical records for the last 215,000 years:Changes in deep ocean circulation and chemical inventories.Earth Planet. Sci. Lett. 76, 135–150.
Broecker W. S. (1986) Oxygen isotope constraints on surface oceantemperatures. Quat. Res. 26, 121–134.
Brown S. and Elderfield H. (1996) Variations in Mg/Ca and Sr/Caratios of planktonic foraminifera caused by postdepositionaldissolution: Evidence of shallow Mg-dependent dissolution.Paleoceanography 11, 543–551.
Chave K. E. (1954) Aspects of the biogeochemistry of magnesium1. Calcareous marine organisms. J. Geol. 62, 266–283.
CLIMAP (1976) The surface of the ice-age earth. Science 191,1131–1137.
Dekens P. S., Lea D. W., Pak D. K. and Spero H. J. (2002) Coretop calibration of Mg/Ca in tropical foraminifera: Refiningpaleotemperature estimation. Geochem. Geophys. Geosyst. 3.http://dx.doi.org/10.1029/2001GC000200.
Deuser W. G. (1987) Seasonal variations in isotopic compositionand deep-water fluxes of the tests of perennially abundantplanktonic foraminifera in the Sargasso Sea – Results fromsediment-trap collections and their paleoceanographic signifi-cance. J. Foramin. Res. 17, 14–27.
DiNezio P.N. and Tierney J.E. (2013) The effect of sea level onglacial Indo-Pacific climate, Nature Geoscience 6, 485–491.
Duenas-Bohorquez A., da Rocha R. E., Kuroyanagi A., de NooijerL. J., Bijma J. and Reichart G. J. (2011) Interindividualvariability and ontogenetic effects on Mg and Sr incorporationin the planktonic foraminifer Globigerinoides sacculifer. Geo-
chim. Cosmochim. Acta 75, 520–532.Dyez K. A. and Ravelo A. C. (2013) Late Pleistocene tropical
Pacific temperature sensitivity to radiative greenhouse gasforcing. Geology 41, 23–26.
Elderfield H., Vautravers M. and Cooper M. (2002) The relation-ship between shell size and Mg/Ca, Sr/Ca, d18O, and d13C ofspecies of planktonic foraminifera. Geochem. Geophys. Geosyst.
3. http://dx.doi.org/10.1029/2001GC000194.Fairbanks R. G., Wiebe P. H. and Be A. W. H. (1980) Vertical
distribution and isotopic composition of living planktonicforaminifera in the western North Atlantic. Science 207, 61–63.
Ferguson J. E., Henderson G. M., Kucera M. and Rickaby R. E.M. (2008) Systematic change of foraminiferal Mg/Ca ratiosacross a strong salinity gradient. Earth Planet. Sci. Lett. 265,153–166.
Flower B. P., Hastings D. W., Hill H. W. and Quinn T. M. (2004)Phasing of deglacial warming and laurentide ice sheet meltwaterin the Gulf of Mexico. Geology 32, 597–600.
Honisch B. and Hemming N. G. (2004) Ground-truthing the boronisotope paleo-pH proxy in planktonic foraminifera shells:Partial dissolution and shell size effects. Paleoceanography 19.http://dx.doi.org/10.1029/2004PA001026.
Honisch B. and Hemming N. G. (2005) Surface ocean pH responseto variations in pCO2 through two full glacial cycles. Earth
Planet. Sci. Lett. 236, 305–314.Hoogakker B. A. A., Klinkhammer G. P., Elderfield H., Rohling
E. J. and Hayward C. (2009) Mg/Ca paleothermometry in highsalinity environments. Earth Planet. Sci. Lett. 284, 583–589.
Jørgensen B. B., Erez J., Revsbech N. P. and Cohen Y. (1985)Symbiotic photosynthesis in a planktonic foraminiferan, Glob-
igerinoides sacculifer (Brady), studied with microelectrodes.Limnol. Oceanogr. 30, 1253–1267.
Key R. M., Kozyr A., Sabine C. L., Lee K., Wanninkhof R.,Bullister J. L., Feely R. A., Millero F. J., Mordy C. and PengT.-H. (2004) A global ocean carbon climatology: Results fromGLODAP. Global Biogeochem. Cycles 18. http://dx.doi.org/10.1029/2004GB002247.
Kısakurek B., Eisenhauer A., Bohm F., Garbe-Schonberg D. andErez J. (2008) Controls on shell Mg/Ca and Sr/Ca in culturedplanktonic foraminiferan, Globigerinoides ruber (white). Earth
Planet. Sci. Lett. 273, 260–269.Koziol A. M. and Newton R. C. (1995) Experimental determina-
tion of the reactions magnesite plus quartz equals enstatite plusCO2 and magnesite equals periclase plus CO2, and enthalpies offormation of enstatite and magnesite. Am. Mineral. 80, 1252–1260.
Lea D. W., Mashiotta T. A. and Spero H. J. (1999) Controls onmagnesium and strontium uptake in planktonic foraminiferadetermined by live culturing. Geochim. Cosmochim. Acta 63,2369–2379.
Lea D. W., Pak D. K. and Spero H. J. (2000) Climate impact oflate quaternary equatorial Pacific sea surface temperaturevariations. Science 289, 1719–1724.
LeGrande A. N. and Schmidt G. A. (2006) Global gridded data setof the oxygen isotopic composition of seawater. Geophys. Res.
Lett. 33.Lohmann G. P. (1995) A model for variation in the chemistry of
planktonic foraminifera due to secondary calcification andselective dissolution. Paleoceanography 10, 445–457.
Lorens R. B., Williams D. F. and Bender M. L. (1977) The earlynonstructural diagenesis of foraminiferal calcite. J. Sediment.
Petrol., 1602–1609.
212 B. Honisch et al. / Geochimica et Cosmochimica Acta 121 (2013) 196–213
Mathien-Blard E. and Bassinot F. (2009) Salinity bias on theforaminifera Mg/Ca thermometry: Correction procedure andimplications for past ocean hydrographic reconstructions.Geochem. Geophys. Geosyst. 10, Q12011.
McCrea J. M. (1950) On the isotopic chemistry of carbonates and apaleotemperature scale. J. Chem. Phys. 18, 849–857.
Medina-Elizalde M. and Lea D. W. (2010) Late Pliocene equatorialPacific. Paleoceanography 25, PA2208.
Mucci A. (1987) Influence of temperature on the composition ofmagnesian calcite overgrowths precipitated from seawater.Geochim. Cosmochim. Acta 51, 1977–1984.
Mulitza S., Wolff T., Patzold, J.r., Hale W. and Wefer G. (1998)Temperature sensitivity of planktic foraminifera and itsinfluence on the oxygen isotope record. Mar. Micropaleontol.
33, 223–240.Nurnberg D., Bijma J. and Hemleben C. (1996) Assessing the
reliability of magnesium in foraminiferal calcite as a proxy forwater mass temperatures. Geochim. Cosmochim. Acta, 803–814.
O’Neil J. R., Clayton R. N. and Mayeda T. K. (1969) Oxygenisotope fractionation in divalent metal carbonates. J. Chem.
Phys., 5547–5558.Oomori T., Kaneshima H., Maezato Y. and Kitano Y. (1987)
Distribution coefficient of Mg2+ ions between calcite andsolution at 10–50 �C. Mar. Chem. 20, 327–336.
Pak D. K., Lea D. W. and Kennett J. P. (2004) Seasonal andinterannual variation in Santa Barbara Basin water tempera-tures observed in sediment trap foraminiferal Mg/Ca. Geochem.
Geophys. Geosyst. 5, Q12008.Peeters F. J. C., Brummer G.-J. A. and Ganssen G. (2002) The
effect of upwelling on the distribution and stable isotopecomposition of Globigerina bulloides and Globigerinoides ruber
(planktic foraminifera) in modern surface waters of the NWArabian Sea. Global Planet. Change 34, 269–291.
Regenberg M., Nurnberg D., Steph S., Groeneveld J., Garbe-Schonberg D., Tiedemann R. and Dullo W.-C. (2006) Assessingthe effect of dissolution on planktonic foraminiferal Mg/Caratios: Evidence from Caribbean core tops. Geochem. Geophys.
Geosyst. 7.Richey J. N., Poore R. Z., Flower B. P. and Hollander D. J. (2012)
Ecological controls on the shell geochemistry of pink and whiteGlobigerinoides ruber in the northern Gulf of Mexico: Implica-tions for paleoceanographic reconstruction. Mar. Micropaleon-
tol. 82–83, 28–37.Rink S., Kuhl M., Bijma J. and Spero H. J. (1998) Microsensor
studies of photosynthesis and respiration in the symbioticforaminifer Orbulina universa. Mar. Biol. 131, 583–595.
Rosenthal Y. and Boyle E. A. (1993) Factors controlling thefluoride content of planktonic foraminifera – An evaluation ofits paleoceanographic applicability. Geochim. Cosmochim. Acta
57, 335–346.Rosenthal Y. and Lohmann G. P. (2002) Accurate estimation of
sea surface temperatures using dissolution-corrected calibra-tions for Mg/Ca paleothermometry. Paleoceanography 17, 16-11–16-16.
Rosenthal Y., Lohmann G. P., Lohmann K. C. and Sherell R. M.(2000) Incorporation and preservation of Mg in Globigerinoides
sacculifer: Implications for reconstructing the temperature and18O/16O of seawater. Paleoceanography 15, 135–145.
Russell A. D., Emerson S., Mix A. C., Nelson B. K. and Lea D. W.(1994). U/Ca in G. sacculifer from Atlantic, Caribbean, andPacific cores over last 30 kyr. In Ocean Sciences Meeting.
Russell A. D., Honisch B., Spero H. J. and Lea D. W. (2004)Effects of changes in seawater carbonate ion concentration andtemperature on shell U/Ca, Mg/Ca, and Sr/Ca of planktonicforaminifera. Geochim. Cosmochim. Acta 68, 4347–4361.
Saraswat R., Lea D. W., Nigam R., Mackensen A. and Naik D. K.(2013) Deglaciation in the tropical Indian Ocean driven byinterplay between the regional monsoon and global telecon-nections. Earth Planet. Sci. Lett 375, 166–175.
Savin S. M. and Douglas R. G. (1973) Stable isotope andmagnesium geochemistry of recent planktonic foraminiferafrom the South Pacific. Geol. Soc. Am. Bull. 84, 2327–2342.
Schlitzer R. (2012). Ocean Data View. http://odv.awi.deSchmidt G. A. and Mulitza S. (2002) Global calibration of
ecological models for planktic foraminifera from coretopcarbonate oxygen-18. Mar. Micropaleontol. 44, 125–140.
Schmidt G.A., Bigg G.R. and Rohling E.J. (1999) Global Seawater
Oxygen-18 Database.Schmidt M. W., Spero H. J. and Lea D. W. (2004) Links between
salinity variation in the Caribbean and North Atlantic thermo-haline circulation. Nature 428, 160–163.
Schmidt M. W., Vautravers M. J. and Spero H. J. (2006) WesternCaribbean sea surface temperatures during the late Quaternary.Geochem. Geophys. Geosyst. 7, 17.
Shackleton N. J. (1974) Attainment of isotopic equilibrium between
ocean water and benthonic foraminifera genus Uvigerina: Isotopic
changes in the ocean during the last glacial, Les methodes
quantitatives d’etude des variations du climat au cours du
Pleistocene. Cent. Natl. de la Rech. Sci, Gif-sur Yvette, France,pp. 203–209.
Spero H. J. and Deniro M. J. (1987) The influence of symbiontphotosynthesis on the d18O and d13C values of planktonicforaminiferal shell calcite. Symbiosis 4, 213–228.
Spero H. J. and Lea D. W. (1993) Intraspecific stable isotopevariability in the planktic foraminifera Globigerinoides sacculif-
er: Results from laboratory experiments. Mar. Micropaleontol.
22, 221–234.Spero H. J., Bijma J., Lea D. W. and Bemis B. E. (1997) Effect of
seawater carbonate concentration on foraminiferal carbon andoxygen isotopes. Nature 390, 497–500.
Spero H. J., Mielke K. M., Kalve E. M., Lea D. W. and Pak D. K.(2003) Multispecies approach to reconstructing eastern equa-torial Pacific thermocline hydrography during the past 360 kyr.Paleoceanography 18.
Stott L. D. and Tang C. M. (1996) Reassessment of foraminiferal-based tropical sea surface delta O-18 paleotemperatures.Paleoceanography 11, 37–56.
Thunell R., Tappa E., Pride C. and Kincaid E. (1999) Sea-surfacetemperature anomalies associated with the 1997–1998 El Ninorecorded in the oxygen isotope composition of planktonicforaminifera. Geology 27, 843–846.
Tolderlund D. S. and Be A. W. H. (1972) Seasonal distribution ofplanktonic foraminifera in the western North Atlantic. Micro-
paleontology 17, 297–329.Urey H. C. (1947) The thermodynamic properties of isotopic
substances. J. Chem. Soc., 562–581.Urey H. C. (1948) Oxygen isotopes in nature and in the laboratory.
Science 108, 489–496.Urey H. C., Lowenstam H. A., Epstein S. and McKinney C. R.
(1951) Measurement of paleotemperatures and temperaturesof the upper Cretaceous of England, Denmark, and theSoutheastern United States. Bull. Geol. Soc. Am. 62, 399–416.
Wang L., Sarnthein M., Duplessy J. C., Erlenkeuser H., Jung S.and Pflaumann U. (1995) Paleo sea surface salinities in the low-latitude Atlantic: The d18O record of Globigerinoides ruber
(white). Paleoceanography 10, 749–761.Watkins J. M., Mix A. C. and Wilson J. (1998) Living planktic
foraminifera in the central tropical Pacific Ocean: Articulatingthe equatorial ‘cold tongue’ during La Nina, 1992. Mar.
Micropaleontol. 33, 157–174.
B. Honisch et al. / Geochimica et Cosmochimica Acta 121 (2013) 196–213 213
Weldeab S., Lea D. W., Schneider R. R. and Andersen N. (2007)155,000 years of West African monsoon and ocean thermalevolution. Science 316, 1303–1307.
Yu J., Day J., Greaves M. and Elderfield H. (2005) Determinationof multi-element/calcium ratios in foraminiferal calcite byquadropole ICP-MS and its application for paleoceanographic
studies. Geochem. Geophys. Geosyst. 6. http://dx.doi.org/10.1029/2005GC000964.
Associate editor: Claire Rollion-Bard