The Backbone Dynamics of the Amyloid Precursor Protein Transmembrane Helix Provides a Rationale for...
41
Subscriber access provided by FORDHAM UNIVERSITY Journal of the American Chemical Society is published by the American Chemical Society. 1155 Sixteenth Street N.W., Washington, DC 20036 Published by American Chemical Society. Copyright © American Chemical Society. However, no copyright claim is made to original U.S. Government works, or works produced by employees of any Commonwealth realm Crown government in the course of their duties. Article The Backbone Dynamics of the Amyloid Precursor Protein Transmembrane Helix Provides a Rationale for the Sequential Cleavage Mechanism of #-Secretase Oxana Pester, Paul J. Barrett, Daniel Hornburg, Philipp Hornburg, Rasmus Proebstle, Simon Widmaier, Christoph Kutzner, Milena Duerrbaum, Aphrodite Kapurniotu, Charles R. Sanders, Christina Scharnagl, and Dieter Langosch J. Am. Chem. Soc., Just Accepted Manuscript • DOI: 10.1021/ja3112093 • Publication Date (Web): 24 Dec 2012 Downloaded from http://pubs.acs.org on January 16, 2013 Just Accepted “Just Accepted” manuscripts have been peer-reviewed and accepted for publication. They are posted online prior to technical editing, formatting for publication and author proofing. The American Chemical Society provides “Just Accepted” as a free service to the research community to expedite the dissemination of scientific material as soon as possible after acceptance. “Just Accepted” manuscripts appear in full in PDF format accompanied by an HTML abstract. “Just Accepted” manuscripts have been fully peer reviewed, but should not be considered the official version of record. They are accessible to all readers and citable by the Digital Object Identifier (DOI®). “Just Accepted” is an optional service offered to authors. Therefore, the “Just Accepted” Web site may not include all articles that will be published in the journal. After a manuscript is technically edited and formatted, it will be removed from the “Just Accepted” Web site and published as an ASAP article. Note that technical editing may introduce minor changes to the manuscript text and/or graphics which could affect content, and all legal disclaimers and ethical guidelines that apply to the journal pertain. ACS cannot be held responsible for errors or consequences arising from the use of information contained in these “Just Accepted” manuscripts.
Transcript of The Backbone Dynamics of the Amyloid Precursor Protein Transmembrane Helix Provides a Rationale for...
Subscriber access provided by FORDHAM UNIVERSITY
Journal of the American Chemical Society is published by the American ChemicalSociety. 1155 Sixteenth Street N.W., Washington, DC 20036Published by American Chemical Society. Copyright © American Chemical Society.However, no copyright claim is made to original U.S. Government works, or worksproduced by employees of any Commonwealth realm Crown government in the courseof their duties.
Article
The Backbone Dynamics of the Amyloid PrecursorProtein Transmembrane Helix Provides a Rationale for
the Sequential Cleavage Mechanism of #-SecretaseOxana Pester, Paul J. Barrett, Daniel Hornburg, Philipp Hornburg, Rasmus
Proebstle, Simon Widmaier, Christoph Kutzner, Milena Duerrbaum, AphroditeKapurniotu, Charles R. Sanders, Christina Scharnagl, and Dieter Langosch
J. Am. Chem. Soc., Just Accepted Manuscript • DOI: 10.1021/ja3112093 • Publication Date (Web): 24 Dec 2012
Downloaded from http://pubs.acs.org on January 16, 2013
Just Accepted
“Just Accepted” manuscripts have been peer-reviewed and accepted for publication. They are postedonline prior to technical editing, formatting for publication and author proofing. The American ChemicalSociety provides “Just Accepted” as a free service to the research community to expedite thedissemination of scientific material as soon as possible after acceptance. “Just Accepted” manuscriptsappear in full in PDF format accompanied by an HTML abstract. “Just Accepted” manuscripts have beenfully peer reviewed, but should not be considered the official version of record. They are accessible to allreaders and citable by the Digital Object Identifier (DOI®). “Just Accepted” is an optional service offeredto authors. Therefore, the “Just Accepted” Web site may not include all articles that will be publishedin the journal. After a manuscript is technically edited and formatted, it will be removed from the “JustAccepted” Web site and published as an ASAP article. Note that technical editing may introduce minorchanges to the manuscript text and/or graphics which could affect content, and all legal disclaimersand ethical guidelines that apply to the journal pertain. ACS cannot be held responsible for errorsor consequences arising from the use of information contained in these “Just Accepted” manuscripts.
1
The Backbone Dynamics of the Amyloid Precursor Protein
Transmembrane Helix Provides a Rationale for the Sequential Cleavage
Mechanism of γ-Secretase
Oxana Pester1,2, Paul J. Barrett3, Daniel Hornburg1,2, Philipp Hornburg1, Rasmus
Pröbstle1, Simon Widmaier1,2, Christoph Kutzner1, Milena Dürrbaum1, Aphrodite
Kapurniotu4, Charles R. Sanders3, Christina Scharnagl5, and Dieter Langosch1*
1Lehrstuhl Chemie der Biopolymere, Technische Universität München, Weihenstephaner
Berg 3, 85354 Freising, and Munich Center For Integrated Protein Science (CIPSM),
Germany 3 Department of Biochemistry and Center for Structural Biology, Vanderbilt University
School of Medicine, Nashville, Tennessee USA 37232-8725. 4 Fachgebiet Peptidbiochemie, Technische Universität München, Emil-Erlenmeyer-
Forum 5, 85354 Freising, Germany. 5 Fakultät für Physik E14, Technische Universität München, Maximus-von-Imhof-Forum
4, 85354 Freising, Germany
2 Present addresses:
Oxana Pester, Roche Diagnostics GmbH, Nonnenwald 2, 82377 Penzberg, Germany.
Daniel Hornburg, Max Planck Institute of Biochemistry, Am Klopferspitz 18, 82152
Martinsried, Germany.
Simon Widmaier, Karlsruhe Institute of Technology, Hermann-von-Helmholtz-Platz 1,
76344 Eggenstein-Leopoldshafen, Germany.
* to whom correspondence should be addressed:
Tel.: +49-8161-71-3500; Fax: +49-8161-71-4404; E-mail: [email protected]
Page 1 of 40
ACS Paragon Plus Environment
Journal of the American Chemical Society
123456789101112131415161718192021222324252627282930313233343536373839404142434445464748495051525354555657585960
2
Abstract
The etiology of Alzheimer’s disease depends on the relative abundance of different
amyloid-β (Αβ) peptide species. These peptides are produced by sequential proteolytic
cleavage within the transmembrane helix of the 99 residue C-terminal fragment of the
amyloid precursor protein (C99) by the intramembrane protease γ-secretase.
Intramembrane proteolysis is thought to require local unfolding of the substrate helix,
which has been proposed to be cleaved as a homodimer. Here, we investigated the
backbone dynamics of the substrate helix. Amide exchange experiments of monomeric
recombinant C99 and of synthetic transmembrane domain peptides reveal that the N-
terminal Gly-rich homodimerization domain exchanges much faster than the C-terminal
cleavage region. MD simulations corroborate the differential backbone dynamics,
indicate a bending motion at a di-glycine motif connecting dimerization and cleavage
regions, and detect significantly different H-bond stabilities at the initial cleavage sites.
Our results are consistent with the following hypotheses about cleavage of the substrate.
First, the GlyGly hinge may precisely position the substrate within γ-secretase such that
its catalytic center must start proteolysis at the known initial cleavage sites. Second, the
ratio of cleavage products formed by subsequent sequential proteolysis could be
influenced by differential extents of solvation and by the stabilities of H-bonds at
alternate initial sites. Third, the flexibility of the Gly-rich domain may facilitate substrate
movement within the enzyme during sequential proteolysis. Fourth, dimerization may
affect substrate processing by decreasing the dynamics of the dimerization region and by
increasing that of the C-terminal part of the cleavage region.
Page 2 of 40
ACS Paragon Plus Environment
Journal of the American Chemical Society
123456789101112131415161718192021222324252627282930313233343536373839404142434445464748495051525354555657585960
3
Abbreviations. AD, Alzheimer’s disease; APP, Amyloid Precursor Protein; CD, circular
dichroism; COM, center of mass; (d)TFE, (mono-deuterated) 2,2,2-trifluoroethanol;
DHX, deuterium/hydrogen-exchange, ESI-MS, electrospray ionization mass
spectrometry; HDX, hydrogen/deuterium-exchange; LMPG, lyso-
myristoylphosphatidylglycerol; MD, molecular dynamics; MEM, maximum entropy
method; P/L, peptide/lipid; DLPC, di-lauryl-phosphatidylcholine; DLPE, di-lauryl-
phosphatidylethanolamine; DLPS, di-lauryl-phosphatidylserine; POPC,
phosphatidylcholine; PMF, potential of mean force; RMSF, root mean square fluctuation;
TMD, transmembrane domain; SD, standard deviation.
Page 3 of 40
ACS Paragon Plus Environment
Journal of the American Chemical Society
123456789101112131415161718192021222324252627282930313233343536373839404142434445464748495051525354555657585960
4
Introduction
The amyloid precursor protein (APP) is a single-span membrane protein whose
proteolysis by β-secretase produces the C-terminal fragment C99. C99 includes the
transmembrane domain (TMD) which is subject to further proteolysis by γ-secretase.
Cleavage at multiple sites in the TMD produces the amyloid beta (Aβ) peptides that form
toxic oligomers and amyloid plaques, one of the hallmarks of Alzheimer’s disease. Thus,
proteolysis of APP is believed to play a fundamental role in the etiology of the disease 1-3.
The C99 TMD forms an α−helix. Cleavage by γ-secretase is believed to be initiated at
either the ε48 (linking T48 and L49) or ε49 (L49/V50) sites and continued by release of
tri- and tetra-peptides after proteolysis at alternate ζ- (ζ45 = Ι45/V46; ζ46 = V46/Ι47) and
γ-sites (γ37 = G37/G38; γ38 = G38/V39; γ40 = V40/I41; γ42 = A42/T43), resulting in
two distinct product lines. Successive cleavage leads to release of the most abundant
Αβ40 and the minor Αβ42 and Aβ38 peptides plus minor species, both longer and shorter
4-7. This 3- to 4-residue stepwise cleavage pattern suggests that the substrate TMD
remains essentially helical during processing. Proteolysis is thought to take place within
the lumen of the aspartate protease presenilin, the catalytic subunit of the γ-secretase
complex 8. Proteolysis by aspartate proteases requires proton transfer from one catalytic
Asp to the carbonyl oxygen of the scissile bond as well as nucleophilic attack of a water
molecule which is H-bonded to another catalytic Asp, at the C1 atom of the same
carbonyl. Formation of this tetrahedral intermediate is followed by cleavage of the amide
bond 9.
It is generally thought that helices cannot be cleaved without first being locally unraveled 10. Therefore, it has been proposed that the APP TMD helix has to unwind locally at the
cleavage sites to expose the carbonyl. Recent NMR structures were determined for both
monomeric C99 and for a homodimeric TMD-containing fragment of C99, both in
micelles. The relevance of the monomeric structure to membrane bilayer conditions was
directly confirmed by EPR studies of the protein in bilayers 11. In both structures, the
TMD is fully helical except for a flexible bend centered around G37G38 11,12. The helical
Page 4 of 40
ACS Paragon Plus Environment
Journal of the American Chemical Society
123456789101112131415161718192021222324252627282930313233343536373839404142434445464748495051525354555657585960
5
segment leading up to this bend (sites 29-37, which we refer to in this paper as the “TM-
N helix”) is believed to include sites that drive both homodimerization 13-17 and
cholesterol binding 11, perhaps competitively. The helical TM segment starting at G38
and terminating at L52 is here referred to as the “TM-C helix” and contains the various
sites for cleavage. A bioinformatic analysis suggested that the cleavage sites of different
known γ-secretase substrate TMDs exhibit low helix-forming propensities resulting from
an accumulation of potentially helix-destabilizing amino acid types like Ile, Val, and Thr 18. Indeed, helix-destabilizing amino acids have been reported to facilitate cleavage of the
substrate TMDs of other intramembrane protease including site-2 protease 19, rhomboids 20,21, and signal peptide peptidase 22,23. Thus, the TM-C helix may be subject to transient
unraveling that simply was not detected in the NMR structural studies 11,12. In agreement
with the idea of local unfolding, NMR and FTIR studies of a synthetic fragment (E22 –
V64, Αβ numbering) in DMPC/DMPG vesicles by Smith and co-workers showed that the
APP TMD unravels downstream of the ε-site 15. A more recent ssNMR study by Tycko
and co-workers of an APP TMD peptide (K19-K55) was performed in various lipids. In
DOPG, the region around the γ-sites was fully helical while mixtures of helical and non-
helical conformations of this region were found in neuronal lipid mixtures 24.
The APP TMD-C helix contains two consecutive GxxxG motifs starting at G29. A
GxxxG motif frequently forms the interface of homodimerizing TMDs 25. Indeed,
mutating G29 and/or G33 within the APP TMD decreased self-interaction of the helix
which was correlated to decreased Αβ40 and Αβ42 production and enhanced Aβ38
formation 26,27. It was therefore proposed that monomerization of the dimer by mutating
Gly facilitates read-through of γ-secretase; an interpretation which implies that the
substrate forms a homodimeric structure within presenilin 26. However, it is not yet
known with certainty whether C99 binds to the active site of γ-secretase as a monomer, a
dimer, or both. Modeling the interface of the wild-type sequence suggested that the
G29xxxG33xxxG37 motif (the Gly zipper) forms the dimer interface 15,17,26,28, which has
been supported by NMR experiments 14,15. Other models suggest it is the G38xxxA42
motif is at the interface 17,29. Taken together, these experimental studies support a
consensus view where the interface of the APP TMD helix homodimer includes the Gly
Page 5 of 40
ACS Paragon Plus Environment
Journal of the American Chemical Society
123456789101112131415161718192021222324252627282930313233343536373839404142434445464748495051525354555657585960
6
zipper and is characterized by a right-handed crossing angle of the helices. We note that
the helices interact in a left-handed crossing angle in the most recent NMR structure of
the dimer, where the interface is formed by a heptad-repeat motif of residues involving
G38 and A42 12. It is possible, therefore, that C99 populates both monomeric and at least
two different dimeric states, depending on conditions.
Since a systematic analysis of TMD helix backbone dynamics and its potential
dependence on dimerization has not been available, we here examined the APP TMD
helix by recording amide exchange kinetics of monomeric recombinant C99 and of
synthetic TMD peptides. Surprisingly, we find that the backbone dynamics of the
dimerization region TM-N is higher than that of the TM-C helix, even though the sites for
γ-secretase cleavage reside in the latter segment. Molecular dynamics (MD) simulations
support this finding and suggest that dimerization decreases the dynamics of the
dimerization region and enhances the dynamics of the cleavage domain.
Materials and Methods
Amide H/D Exchange Rate Measurements of C99 with NMR Spectoscopy. C99 with
a C-terminal tag containing His6 was recombinantly expressed in uniformly 15N-labeled
form and purified into lyso-myristoylphosphatidylglycerol (LMPG) micelles as described
previously14, followed by adjustment of the pH to 6.5. To initiate amide hydrogen-to-
deuterium (H/D) exchange a 500 µL micellarU-15N-C99 sample in H2O was mixed with 5
mL of 100% D2O in 100 mM Imidazole, pH 6.5. The sample was then concentrated back
to 500 µL using a 30 kDa cutoff filter. Final C99 samples contained 0.2 mM U-15N-C99
in 10% LMPG (w/v), 100 mM Imidazole, pH 6.5 in ca. 90% D2O. 900 MHz 1H,15N-
TROSY NMR spectra were recorded serially at times points 0 h, 2 h, 8 h, 16 h, and 24 h
after mixing with the D2O, with the goal being to monitor the disappearance of peaks due
to H/D exchange as a function of time. The 0 hour time point was recorded on a matched
sample in H2O.
NMR acquisition parameters were the same for the all spectra collected, with 128 scans
and 256 increments for each. To quantify the extent of exchange for each backbone amide
Page 6 of 40
ACS Paragon Plus Environment
Journal of the American Chemical Society
123456789101112131415161718192021222324252627282930313233343536373839404142434445464748495051525354555657585960
7
resonance, peak intensity was monitored at each time point and compared to the intensity
for the reference sample prior to D2O addition (time = 0 h). For each NMR experiment
the total acquisition time was approximately 6 h, such that the temporal resolution of
observed H/D exchange process is low. For this reason, we limited our analysis to
comparison of the exchange states represented by the TROSY spectra collected over the
2-8 h and 16-22 h time ranges (see Fig. 1). Previously completed NMR resonance
assignments14 allowed the data to be interpreted in a site-specific manner.
From the experimental ratio r of populations at t = 16 h with respect to t0 = 0 h, an
estimate of the exchange rate is: kHX = (1-r(t))/(t-t0). To compare these values with the
MD-derived rates in Fig. 5 C, we scaled their logarithmic values linearly between -3 and
+2.
Peptide Synthesis. Peptides were synthesized by Fmoc chemistry (A28-55, A28-44 and
A37-55 were from PSL, Heidelberg, Germany, AL-peptides were from Dr. Sven
Rothemund, IZKF, Leipzig, Germany) and were >90 % pure as judged by mass
spectrometry.
Membrane Reconstitution of AL-Peptides. Deuterated AL-peptides were incorporated
at a molar peptide/lipid ratio of ~0.02 into liposomal membranes composed of dilauryl-
phosphatidylcholine (DLPC), dilauryl-phosphatidylethanolamine (DLPE), and dilauryl-
phosphatidylserine (DLPS) at a 3:1:1 molar ratio in 50 mM ND4Ac, pD 7.5. The lipids
were dissolved in 800 µl cyclohexane and combined with peptide solutions in deuterated
hexafluoroisopropanol at a 20:1 (v/v) ratio, mixed, and lyophilized. Hydrating the
lyophilsate with 400 µl 50 mM ND4Ac, pD 7.5 and subsequent sonication gave the
liposomes. The peptide/lipid ratios were determined as described 30.
CD Spectroscopy. For CD spectroscopy in solution, peptides were dissolved in 80%
(v/v) 2,2,2-trifluoroethanol (TFE) and 10 mM NH4Ac, pH 5 at 30 µM. For each sample,
10 accumulated CD spectra from 185-260 nm were obtained using a Jasco J-710 CD
spectrometer with a 0.1 data pitch, 1 sec response, 100 nm/min scan velocity, 100
mdeg/cm sensitivity, and a path length of either 0.5 mm or 1 mm. Mean molar residue
Page 7 of 40
ACS Paragon Plus Environment
Journal of the American Chemical Society
123456789101112131415161718192021222324252627282930313233343536373839404142434445464748495051525354555657585960
8
ellipticities were calculated based on peptide concentrations as determined by UV
spectroscopy using extinction coefficients of 5,600 M-1cm-1 for Trp. Secondary structure
contents were estimated by deconvoluting the CD spectra using the program
CDNN/PEPFIT that is based on peptide-derived reference spectra 31. CD experiments of
peptides incorporated into liposomes were recorded from 190-260 nm with 20
accumulated CD spectra at 70°C and a path length of 0.5 mm. Acquisition parameters
were the same as for peptide solutions.
ESI-MS-Monitored DHX Experiments for Synthetic Peptides and Related Data
Analysis. Solutions of deuterated peptide (100 µM in 80% (v/v) dTFE in 10 mM ND4Ac)
were diluted 1:20 with protonated solvent (80% (v/v) TFE in 10 mM NH4Ac, pH 5.0
unless specified otherwise) to a 5 µM final peptide concentration at 20°C. Aliquots were
removed after 0, 10 s, 20 s, and 30 s and quenched by chilling on ice and by adding
0.5% (v/v) formic acid to lower the pH to ~2.6. Time points > 40 s were recorded in
continuous mode by injecting reaction mixtures into the ion source of the mass
spectrometer for 4 h32. The DHX kinetics of AL-peptides in liposomes was recorded at
70°C in discontinuous mode. Mass spectra were acquired in positive-ion mode using a
Waters Q-ToF Ultima with one scan/second and evaluated as described 33. For continuous
measurements, 5 scans were accumulated and smoothed, and centered mass/charge ratios
were obtained for intervals of ten seconds. The triply charged isotope patterns were
smoothed with the Savitzky-Golay algorithm with 25 measuring points and a data pitch
of 5. The numbers of remaining deuterons was calculated as described 33. The
distributions of DHX rate constants were calculated from the DHX kinetics using a
maximum entropy method (kindly provided by Dr. A. Marshall)32 or by fitting with a 3-
exponential function.
Molecular Dynamics Simulations and Trajectory Analysis. Solvent simulations were
performed in 80% (v/v) TFE/water as described 34 using the CHARMM force field 35.
The monomer with initial ideal α-helical backbone conformation was solvated in a
rectangular solvent box (10.3 nm x 6.0 nm x 6.0 nm) containing 2314 water and 2314
TFE molecules and 6 neutralizing chloride ions. Peptide termini were charged. Peptide
Page 8 of 40
ACS Paragon Plus Environment
Journal of the American Chemical Society
123456789101112131415161718192021222324252627282930313233343536373839404142434445464748495051525354555657585960
9
and solvent were equilibrated for 12 ns with gradual release of constraints on backbone
atoms (1 ns with a force constant k = 5 kcal/(mol Å2), 1 ns with k = 2 kcal/(mol Å2), 10
ns without restraints) followed by 150 nsec of free dynamics at constant temperature and
pressure (T= 293 K, p = 0.1 MPa). The dimer was constructed using the program CHI 36.
One cluster with a right-handed crossing angle and G29, G33 and G37 of both helices in
close contact was averaged and used as the starting structure. This dimer was solvated in
a cubic solvent box of 10.3 nm side length (7165 water and 7165 TFE molecules, 12
chloride ions) and subjected to 15 ns equilibration. For the first 3 ns positional constraints
were imposed on all backbone atoms (1 ns with k = 5 kcal/(mol Å2), 2 ns with k = 2
kcal/(mol Å2) followed by 2 ns where only the Gly residues in the interface were
constrained with k = 1 kcal/(mol Å2). Finally all constraints were cleared and the
equilibration monitored for 10 ns before recording free dynamics for 95 ns.
For membrane simulations, monomer or dimer were inserted into a rectangular patch of
POPC molecules (10 x 10 nm, 260 lipids) with water boxes extending for 2 nm to either
side of the bilayer (∼36 waters/lipid) and containing 6 or 12 neutralizing Cl- ions for
monomer and dimer, respectively. For the first 7.2 ns, positional constraints were
imposed on all backbone atoms (0.2 ns with k = 5 kcal/(mol Å2) on backbone atoms, k =
2 kcal/(mol Å2) on lipids, water, ions; 5 ns with k = 5 kcal/(mol Å2) on backbone atoms, k
= 2 kcal/(mol Å2) on water and ions; 2 ns with k = 2 kcal/(mol Å2) on backbone atoms, k
= 2 kcal/(mol Å2) on water and ions). Finally, all constraints were cleared and the
equilibration monitored for ~40 ns before recording free dynamics for 110 ns (dimer) or
100 ns (monomer). Free dynamics was calculated with the use of the SHAKE algorithm,
periodic boundary conditions, and particle mesh Ewald electrostatics (short-range real-
space interactions were cut off at 1.2 nm using a switching function between 0.8 and 1.2
nm). The temperature was kept constant (310 K) using a Langevin thermostat and a
Nose-Hoover piston was employed for pressure control (NPT, 0.1 MPa). The CHARMM
protein 35 and lipid 37 force field was used. An integration step of 1 ps was used for the
first ~4 ns after which the reversible multiple time-step algorithm 38 was employed to
integrate the equations of motion with time steps of 1 fs for bonded forces, 2 fs for short-
range non-bonded forces and 4 fs for long-range electrostatic forces. All simulations were
performed with the program NAMD 39. Structures were saved every ps for analysis.
Page 9 of 40
ACS Paragon Plus Environment
Journal of the American Chemical Society
123456789101112131415161718192021222324252627282930313233343536373839404142434445464748495051525354555657585960
10
To assess the convergence of the simulations, the mean distance between all pairs of
average backbone structures taken from nonoverlapping time windows were analyzed as
function of sequence position and window size 34,40. For the hydrophobic core of the
TMDs mean distances <0.03 nm (monomer) or <0.06 nm (dimer) were reached within 30
ns. Larger deviations up to 0.1 nm indicate deficient sampling of an enlarged
conformational space in the C- and N-terminal parts resulting from helix fraying
(residues 28-30 and 52-55). In the case of the membrane simulations, the membrane-
thickness, measured as the distance between two least-square planes through the
phosphate atoms in upper and lower leaflets, was constant after the equilibration phase
(4.14 nm ± 0.04 nm). The area per lipid was 0.66 ± 0.03 nm2,which matches experimental
data 41. The cell dimensions did not fluctuate more than 3% in the bilayer plane and 1%
normal to the bilayer.
Analysis of H-bond populations, H-bond length distributions, secondary structure, helix
bending, rotation and crossing angles, and root mean-square fluctuations was carried out
with routines provided with the CHARMM software 42. For analysis of helix bending,
TM-N and TM-C helices were defined using the Cα atoms of residues 31-36 and 41-48,
respectively.
An intrahelical H-bond is considered as closed if the H...O distance is below 0.26 nm and
the N-H … O angle is in the range of 180°±60°. The free energy profiles W(di) (potential
of mean force, PMF) of the intrahelical H-bonds were calculated from the distribution of
the closest distances di between backbone carbonyl oxygens at position i and amide
hydrogens at positions i+4 (α-H-bond) or i+3 (310 H-bond). The PMF W(di) follows from
the probability P(di) to observe a given distance di: W(di) = - RT ln [P(di) / P(di,0)] (RT =
0.6 kcal/mol, di,0 = most probable distance). For a Gaussian distribution, the PMF
resembles a harmonic potential characterized by a force constant kPMF(i) which is related
to the variance σi2 of the length distribution: kPMF(i) = 1/σi
2 . Since the length
distributions differ only slightly from Gaussians (correlation > 95% in most of the cases)
we calculated the corresponding force constants directly from the variances σi2 without fit
of the PMF to a parabolic function.
Page 10 of 40
ACS Paragon Plus Environment
Journal of the American Chemical Society
123456789101112131415161718192021222324252627282930313233343536373839404142434445464748495051525354555657585960
11
Statistical uncertainties were calculated by dividing the trajectories into non-overlapping
windows of 30 ns length and evaluating the standard deviations (SD) of the mean values
(66% confidence interval).
Calculation of DHX rates from MD simulations. The exchange rate kDX for an amide
deuteron is determined by (1) the probability fop by which an amide H-bond opens, and
(2) the concentration of exchange catalyst [OH-]: kDX (i) = fop (i) kB (i) [OH-](i). kB is the
rate constant for base-catalyzed DHX in poly-D,L-alanine at the experimental
temperature T=293 K, corrected for effects of neighboring side chains others than Ala 43.
The factor fop (i) is derived from the MD simulations and denotes the probability by
which an amide H to has a distance dHO > 0.3 nm to the closest intrahelical (α or 310) H-
bond accepting carbonyl oxygens 34,44,45. In bulk water [OH-] is directly related to the
pH-value and the autoprotolysis constant KW of H2O: [OH-]bulk /cø = KW /10-pH (cø = 1
mol/l). Several factors contribute to the deviation of local [OH-](i) around each amide
hydrogen from the bulk value: (1) the 80% TFE (v/v) solution contains water only as a
cosolvent with 1/5 of the molarity of bulk water; (2) hydrophobic side chains promote
local dehydration 46,47, and (3) preferential solvation by TFE 48,49 increases the local
dehydration in a side-chain specific manner. Under the assumption that the water
dissociation equilibrium as well as the pH will not change in 80% TFE, the ratio of local
and bulk hydroxide concentration is given by the ratio of the concentration of water
molecules: [OH-] (i) / [OH-]bulk = ( [HOH] (i) / [HOH]bulk)2. From the MD simulations
we calculated the number of water molecules within a distance < 0.7 nm of amide
hydrogens 46. To obtain the local water concentration we take the volume excluded by the
peptide into account. If the numbers of molecules counted are nHOH and nTFE ,
respectively, the volume Vsolv occupied by solvent molecules (water and TFE) around the
amide H is Vsolv = nHOH Vm,HOH + nTFE Vm,TFE with the molecular volumes Vm,HOH = 31.56
Å3 and
Vm,TFE = 116.28 Å3
48). We observed that the local hydroxide concentration at the
hydrophobic peptide cores is only 1/10 to 1/100 of the bulk concentration while it could
exceed the bulk value by a factor of ~10 near the charged termini. The presence of TFE
can exert additional effects: (1) The rates for H- or D- transfer reactions (e.g. kB and
water dissociation rate) might be influenced by the changed electrostatics. (2) Local
Page 11 of 40
ACS Paragon Plus Environment
Journal of the American Chemical Society
123456789101112131415161718192021222324252627282930313233343536373839404142434445464748495051525354555657585960
12
concentrations might be different from local activities. These TFE effects are contained in
a correction factor δ common for all peptides. A value δ = 0.01 was found to be optimal
as it minimizes the reduced chi-square value χ2red
50 between experimental and calculated
DHX kinetics for previously investigated LV-peptides 34 as well as for A28-55 and
derivatives to values in the order of 10-1 to 10-2. Fig. S2 shows the results for L16, LV16,
and A28-55.
Results
The rationale of the present study was to determine the backbone dynamics of the APP
TMD helix by recording amide exchange kinetics, which is a powerful way to analyze
the conformational equilibria along a protein sequence. The exchange kinetics of amides
that are potentially involved in intramolecular H-bonding report local and transient
unfolding of secondary structure 30,33,51,52. MD simulations provide insights into the H-
bond dynamics along the backbone as well as into solvation 34,44. Both determine the
local exchange rates which can be calculated from the simulations to complement the
experimental analysis.
Monitoring Backbone Amide Hydrogen/Deuterium-Exchange for C99 in Detergent
Micelles. C99 was recombinantly expressed in uniformly 15N-labeled form and purified
into LMPG micelles. LMPG is a close analog of natural phospholipids and is generally
regarded as a mild detergent. C99 dimerizes with only very modest affinity in LMPG
micelles 14,53 and hydrogen/deuterium exchange (HDX) studies were carried out using a
high (1000:1) LMPG:C99 mole ratio in which only the monomeric form of the protein
was present 11. An aliquot of concentrated U-15N-C99 stock solution was diluted into D2O
and 1H,15N-TROSY spectra were recorded at time intervals, allowing monitoring of the
disappearance of the backbone amide 1H,15N cross peaks due to replacement of the amide
protons with deuterons (Fig. 1). Because each TROSY spectrum required 6 h of
acquisition time, exact quantification of amide exchange rates from these data is not
possible. However, comparison of data from the 2 and 16 h time points provides a very
clear assessment of the relative rates of amide exchange in C99 in the micelles (Fig. 2).
Page 12 of 40
ACS Paragon Plus Environment
Journal of the American Chemical Society
123456789101112131415161718192021222324252627282930313233343536373839404142434445464748495051525354555657585960
13
C99 contains three domains in which DHX rates are relatively rapid, reaching completion
at 16 h. These are (i) the N-terminus (through Q15, Aβ numbering), (ii) the loop that
connects a short surface-associated helix with the N-terminus of the TMD (G25-K28),
and (iii) the long connector between the end of the TMD and the surface-associated helix
at the extreme C-terminus. Within these segments are sites that are completely exchanged
even at 2 h and other sites for which significant retention of protons are seen at 2 h. These
results are consistent with the results of previous NMR studies of micellar C99 and of the
isolated intracellular domain in solution having suggested that these segments do not
adopt stable secondary tertiary structure, although there some local transient structure is
evident 14,54,55. Further, based on significant protection from exchange even after 16 h at
318 K the exchange data are consistent with the presence of both a surface-associated α-
helix just prior to the TMD (K16 to D23) and one formed by the 11 residues at the
extreme C-terminus11. We note that the C-terminal purification tag of C99 used in this
work 14 might attenuate exchange at the extreme C-terminus. However, recent EPR
studies of C99 in lipid vesicles confirm that the C-terminus is surface-associated even
when a C-terminal tag is not present11.
The exchange data for the TMD (G29 through L52) is complex. While exchange is at no
position complete at 16 h, the N-terminal portion of the TMD (TM-N) extending from
G29 to V40 shows much lower protection (most evident for the 16 h data of Fig. 2) than
the I41 to I47 segment of TM-C that includes γ- and ζ-cleavage-sites. Some evidence for
“fraying” of TM-C is evident in the transition from I47 (at which protection is high even
after 16 h) to the end of this domain at L52. These results indicate significantly greater
helix backbone dynamics at, and/or greater access of water to, sites located in TM-N
compared to TM-C, except near the frayed C-terminus of the TMD.
Monitoring Backbone Amide Deuterium/Hydrogen-Exchange for Synthetic APP
TMD Peptides in Isotropic Solution. Here, we analyzed the secondary structures and
DHX kinetics of synthetic peptides that either represent the full APP TMD or contain
mainly the homodimerization (A28-44) or cleavage (A37-55) domains, respectively (Fig.
Page 13 of 40
ACS Paragon Plus Environment
Journal of the American Chemical Society
123456789101112131415161718192021222324252627282930313233343536373839404142434445464748495051525354555657585960
14
3 A, A28-55). The helical APP TMD is thought to be located within a water-filled cavity
at the active site of presenilin 56,57. Since hydrophobic peptides precipitate in water, we
dissolved the APP TMDs in 80% (v/v) trifluoroethanol (TFE) in aqueous buffer as
exercised previously with other TMD peptides 30,33,58. The TFE water mixture mimics the
aqueous environment while maintaining helicity and preventing aggregation. Circular
dichroism (CD) spectroscopy revealed that A28-55 and A37-55 form ~70% helix while
the helicity of A28-44 is decreased to ~55% in favor of random coil (Fig. 3 B). DHX
kinetics were recorded in the same solvent at a concentration of 5 µM where the TMD
remains monomeric as shown by fluorescence resonance transfer experiments of labeled
peptides (Fig. S1). Deuterium-to-hydrogen exchange (DHX) of exhaustively (>95%)
deuterated peptides were continuously monitored by determining the molecular masses of
the triply charged peptide ions using electrospray ionization mass spectrometry (ESI-
MS). As exemplified by A28-55 spectra, the isotope envelopes gradually shift with
incubation time towards lower mass/charge values (Fig. 3 C). A gradual mass shift is
diagnostic of uncorrelated exchange which suggests fast local, rather than slower global,
helix unfolding 59. Kinetics were normalized to the respective numbers of potentially H-
bonded amides and follow the rank order A28-44 >> A37-55 ≥ A28-55 (Fig. 3 D). For
quantitative evaluation, the kinetics were deconvoluted by employing a maximum
entropy (MEM) method. This procedure returns a distribution of exchange rate constants
for each peptide60. The distribution of A28-55 rate constants shows two major
populations of deuterons exchanging within the incubation time (Fig. 3 D, inset). The
mean rate constants of the more slowly exchanging deuterons peak at log (k/h-1) = 0.36
(corresponding to a mean half-time of DHX of t1/2 = 96 min) while the faster deuterons
peak at log (k/h-1) = 1.27 (t1/2 = 2.2 min). While the slow peak of the complete A28-55
TMD closely matches the main peak seen with the A37-55 fragment, the fast A28-55
peak corresponds to the major peak of A28-44. Flat regions represent either deuterons
that do not exchange within 240 min (t1/2 > 12 h, log (k/h-1) < -1.2) or very fast deuterons
(t1/2 < 5 s, log (k/h-1) > 2.7), respectively. While a quantitative comparison of the full
A28-55 TMD and its fragments is difficult due to the different lengths of the peptides, it
is evident that the fragment harboring the dimerization domain (A28-44) exchanges
considerably faster than the one containing the cleavage domain (A37-55), as seen with
Page 14 of 40
ACS Paragon Plus Environment
Journal of the American Chemical Society
123456789101112131415161718192021222324252627282930313233343536373839404142434445464748495051525354555657585960
15
the full length protein in LMPG micelles. The good agreement obtained with C99 in
micelles and isolated TMD peptides in solution shows that the experimental design yields
self-consistent results. The recombinant protein would not be stable in our TFE/water
mixture, nor in water alone.
Next, the dynamics of the cleavage region was mapped using a set of hybrid peptides.
These hybrids are based on an invariant oligo-Leu host sequence that forms a rather rigid
α−helix 30,34. Eight C-terminal Leu of the parental L19 peptide were replaced by different
octa-residue fragments that cover the APP cleavage region and comprise γ-, ζ-, or ε-sites,
respectively (Fig. 4 A). Thus, the DHX kinetics of these hybrid peptides are thought to
reflect the backbone dynamics around the respective cleavage sites. The free C-termini of
the TMD fragments mimic the free C-termini of fragments that form after proteolysis of
C99 at γ-, ε-, or ζ-sites. Since CD spectroscopy revealed that some of the hybrid peptides
did not form stable secondary structures in 80% TFE, we reconstituted them into
liposomal membranes. CD spectroscopy determined the helicity of the hybrid peptides in
the membranes to follow the rank order L19 > AL39-46 ≈ AL42-49 ≈ AL45-52 > AL35-
42 (Fig. 4 B). DHX kinetics were recorded over 240 min where ~9 to ~11 potentially H-
bonded amide deuterons exchanged. Since three non-H-bonded amide-deuterons at the
helix N-termini exchange within the dead-time of the experiment, another ~9 to ~11
remaining deuterons were protected by the bilayer (AL-peptides contain 23 amides) (Fig.
4 C). Assuming that exchange can occur with similar efficiency at both termini of a
membrane-spanning helix and that the N-terminal Trp residue is located at the headgroup
/ acyl chain boundary leads us to the conclusion that ~3 to ~4 H-bonded deuterons are
likely to exchange at the N-termini and ~6 to ~7 deuterons at the C-termini. Accordingly,
the APP octa-peptide amides seem to exchange almost completely within 240 min. For
quantitative evaluation, the kinetics of exchangeable deuterons were fit with a triple
exponential function, which describes some of them better than the MEM (Table S1).
This fitting procedure subdivides each peptide’s amide deuterons into three classes (A, B,
C) that exchange with different rate constants (kA, kB, kC) plus a class D that does not
exchange within 240 min (Table S1). For a better comparison of the numbers of
deuterons within classes A, B, and C, we averaged the DHX rate constants of each class
Page 15 of 40
ACS Paragon Plus Environment
Journal of the American Chemical Society
123456789101112131415161718192021222324252627282930313233343536373839404142434445464748495051525354555657585960
16
over all peptides and recalculated the respective numbers of deuterons. Now, the numbers
of the fastest deuterons (~4 to ~7 in class A) follow the rank order AL35-42 > AL39-42 >
AL42-49 ≈ AL45-52 > L19 (Table S1). Fig. 4 D visualizes the differences between the
numbers of class A, B, C, and D deuterons of the hybrid peptides and L19. These
differences show that i) AL39-46, AL42-49, and AL45-52 contain more class B deuterons
than AL35-42 and that ii) AL42-49 contains most class C deuterons. Since AL39-46,
AL42-49, and AL45-52 contain one or two Thr, the shift of fast class A deuterons into
intermediate class B and slow class C deuteron populations may relate to Thr
backbonding.
Modeling Backbone Dynamics and Homodimerization of the APP TMD. MD
simulations of the A28-55 helix were performed in 80% (v/v) TFE in water, i.e. in a
solvent matching the experimental conditions of peptide DHX. The objective was to
obtain detailed insights into helix dynamics at the carbonyl carbon (C1), which is
attacked by acidified water during proteolysis, and into H-bonding at the carbonyl
oxygen, which is the target of one catalytic presenilin Asp.
In order to validate our MD simulations, we first calculated the global exchange kinetics
and compared them to the experimental observation. Previously, calculation of exchange
rates from MD using H-bond occupancies were moderately successful 34,44. Here, a
significant improvement was made by using the local water concentration around the
amide to calculate the local hydroxide concentration rather than using the hydroxide
concentration of bulk water. (see Materials & Methods). The close agreement between
predicted and experimental exchange kinetics of A28-55 is documented by a chi-square
value of 0.06 (Fig. S2); this demonstrates that the results obtained by modeling agree
very well with the experimental data.
First, we characterized the global helix conformation (Fig. 5 A). The helix bends at a
hinge near G37G38 where its TM-N and TM-C parts move relative to each other within a
ns timescale. The average bending angle is 20° and ~40% of the conformations show a
Page 16 of 40
ACS Paragon Plus Environment
Journal of the American Chemical Society
123456789101112131415161718192021222324252627282930313233343536373839404142434445464748495051525354555657585960
17
kink >20°. The rotation of TM-N relative to TM-C is largely anisotropic and mostly
“over the hinge” so that G37 and G38 are at the concave side of the bend.
Second, we determined the occupancy of intrahelical H-bonds, which indicates ≥ 80% α-
helical structure (O(i) to HN(i+4) bonding) from G29 to G33 and from G38 to V50. A
significant drop in α-helicity from L34 to G37 is partially compensated for by pure 310-
helix (O(i) to HN(i+3) bonding) (Fig. 5 B). Helicity tends to be lower within TM-N
compared to TM-C. Of note, the stretch from V40 to A42 harboring γ-sites is somewhat
less α-helical than ζ- and ε-sites. The amide hydrogens and side-chain hydroxyls of T43
and T48 form simultaneous H-bonds to the carbonyl oxygens of their respective i-4
residues in >97% of all frames. This suggests helix stabilization by side chain / main
chain backbonding.
Third, we determined the site-specific backbone dynamics of the TMD i) by calculating
block-averaged root mean square fluctuations (RMSF) of the C1 atoms around their
positions in the average structure and ii) by computing local exchange rates. Both sets of
values correlate better with each other for pairs of residues at positions i and i-1 than for
other pairs of residues. Together, both values describe the dynamics of the amide bond
between neighboring residues. The results corroborate that the backbone dynamics of
TM-N is generally higher than that of TM-C and that both are connected by the highly
dynamic G37G38 hinge. The helix termini exhibit the highest dynamics while the region
from residue 44-50 is likely to correspond to the seven deuterons that do not exchange on
the time-scale of the peptide DHX experiment (Fig. 5 C). To compare MD- and NMR-
derived exchange kinetics, we estimated NMR exchange rates from the intensity ratios at
16 h (see: Fig. 2). Both sets of position-specific exchange rates show similar trends
although they differ at some points which could be due to different access of the catalytic
hydroxide ions to amides within LMPG micelles and isotropic solvent, respectively.
Differences within TM-N could also result from interaction of TM-N with the short
preceding interfacial helix in C99 11. In any case, the data suggest a gradient of
decreasing amide bond dynamics from the hinge region toward the ε-sites.
Page 17 of 40
ACS Paragon Plus Environment
Journal of the American Chemical Society
123456789101112131415161718192021222324252627282930313233343536373839404142434445464748495051525354555657585960
18
Fourth, the dynamics of intra-helical H-bonds was mapped by calculating the free energy
profiles W(di) (that correspond to the potential of mean force, PMF) from the distribution
of the closest distance di between carbonyl O(i) and the potential amide H-bond donors at
positions i+3 and i+4. The force constants thus obtained describe the full dynamics of H-
bonds while DHX rates are computed from the abundance of amides that only exchange
when the O … H-N distances and angles exceed given limits (see Materials & Methods).
Lower force constants, indicating more strongly fluctuating H-bonds, are seen within
TM-N compared to TM-C (Fig. 5 C). The force constants were compared to values from
LV model TMDs that were previously designed for different backbone dynamics 30,34. In
general, the APP TMD exhibits a more uneven distribution of force constants compared
to L16 (K3WL16K3) and LV16 (K3W(LV)8K3). Specifically, the H-bonds extending from
the carbonyl oxygens of G38, V40 to A42, and L49 are characterized by values close to
the more dynamic LV16 while H-bonds of T43 to T48 are similar to the ones of the more
rigid L16 or more stable than those.
Fifth, we simulated an APP TMD homodimer to assess the potential impact of helix-helix
interaction on helix dynamics. To this end, we constructed initial dimer models from the
A28-55 helix by short global-searching MD simulations in vacuo 36. By averaging the
similar structures of one cluster we obtained a dimer where G29, G33, and G37 are close
to an interface between a right-handed pair of helices (Ω = -19°). This model is close to
most dimer structures proposed earlier 15,17,26,28 and was subjected to MD simulation in
80% (v/v) TFE in water. The simulation produced two slightly different dimer structures
(see legend of Fig. 6 for details). Average Cα – Cα' distances of Gly residues of the
G29xxxG33xxxG37 motif are <0.55 nm (at 50% occupancy throughout the trajectory)
while a few extra residues contact each other at distances from 0.55 to 0.60 nm, including
V40 and I41 (Fig. 6 A). The side chains of T43 and T48 are not part of the interface and
backbond to the carbonyl oxygens of their respective i-4 residues in >97% of all frames.
The average helix-bending is reduced to 16°, only 25% of the structures bend >20°, and
“over-the-hinge bending” with G37G38 on the concave side is preserved. The helices in
the dimer do not deviate significantly from monomeric helices in terms of amide H-bond
occupancies and connectivities (data not shown). However, the H-bond length
Page 18 of 40
ACS Paragon Plus Environment
Journal of the American Chemical Society
123456789101112131415161718192021222324252627282930313233343536373839404142434445464748495051525354555657585960
19
fluctuations, that represent a more sensitive measure of backbone dynamics, reveal that
most H-bonds of dimer subunits fluctuate less within TM-N and more within TM-C
compared to the monomer (Fig. 6 B). To uncover the potential cause underlying these
differences, we assessed solvation of the helix backbones by counting the average
numbers of solvent H-bond donors within 0.5 nm of main-chain carbonyl oxygens (Fig. 6
C). The Gly residues of the G29xxxG33xxxG37 motif are less solvated than equivalent
sites of the monomeric helix while the dimer exhibits more efficient solvation
downstream of L49, in particular at V50M51, which might weaken H-bonds within TM-
C.
Sixth, monomer and homodimer were subjected to MD simulation in a solvated
membrane patch consisting of phosphatidylcholine (POPC). In the membrane, the
monomer helix adopts a mean tilt angle of 13 ± 4° and induces moderate positive
mismatch as membrane thickness increases by 0.4 nm for lipids within 1.0 nm around the
TMD. Compared to the peptides in solvent, helix-bending in the membrane is drastically
reduced (Fig. 7 A). Monomeric and dimeric helices have a major population with a
bending angle of ∼10°. Minor populations (monomer, 4%; dimer, 8%) show bending
>20°. Like in the solvent system, larger bending is asymmetric and occurs mainly in
direction of the helical face including the G37G38 hinge. The dimer interface (Fig. 7 A)
is more symmetric and shorter compared to the one in solvent. Only G29, A30, G33, and
L34 are connected to residues of the partner helix over Cα – Cα' distances from 0.45 to
0.55 nm while G37 contacts L34 at a distance from 0.55 to 0.60 nm. The membrane
strongly rigidifies the monomeric TM-N helix as indicated by the H-bond strength
measured by the force constants that change by ~10 kcal/(Å2 mole) at the positions of
Gly residues (Fig. 7 B, upper panel); on the other hand, the membrane has only a minor
impact on TM-C dynamics (Fig. 7 B, lower panel). In line with this, membrane-
embedding decreases monomer backbone solvation within TM-N. Solvation changes
very little for most of TM-C, which is also scarcely solvated in aqueous solvent; however,
the membrane enhances solvation at the C-terminus (Fig. 7 B, lower panel). Dimerization
stabilizes TM-N to a lesser extent in the membrane compared to solvent and stabilizes
TM-C at V44 and I45. A feature that is conserved between solvent and membrane is
Page 19 of 40
ACS Paragon Plus Environment
Journal of the American Chemical Society
123456789101112131415161718192021222324252627282930313233343536373839404142434445464748495051525354555657585960
20
destabilization of helices in the dimer from I47 to V50 (Fig. 7 C, upper and lower
panels). Also, helix destabilization close to the C-terminus is paralleled by increased
solvation of terminal regions at, or close to, Lys residues (Fig. 7 D, upper and lower
panels). A novel feature not seen in solvent is destabilization at K28 along with increased
solvation.
Taken together, modelling confirms that the APP TMD contains a dynamic
homodimerization/cholesterol-binding domain that is connected by a highly flexible
linker to a less dynamic cleavage domain. Homodimerization tends to dampen H-bond
fluctuations within the former while increasing H-bond fluctuations within the latter.
Discussion
Our results reveal that a highly dynamic dimerization, TM-N, and a less dynamic
cleavage, TM-C, domain of the APP TMD connect at G37G38 which is the most flexible
site in the TMD with the exception of the frayed helix termini. The hinge has previously
been detected in monomeric C99 11 and in a dimeric APP fragment (G12-K55) 12. It has
been proposed that the hinge might precisely position the TMD within a curved lumen of
presenilin 11. Thereby, the ε-sites may be positioned such that they are close to the active
site for initial cleavage. What could be the functional significance of the pronounced TM-
N dynamics? We envision four, not mutually exclusive, scenarios. First, if the G37G38
hinge is initially positioned at a curved site within presenilin, sequential proteolysis
would require sliding of the TMD past this curved site, a process that would be facilitated
by a flexible TM-N domain. Second, a flexible helix could improve cholesterol and drug
binding to this region 11,61. Third, a higher backbone dynamics could enhance the rate of
dimerization by increasing the probability by which randomly colliding helices enter a
stable association; a similar mechanism has been suggested for interactions between
partially unstructured proteins 62. Finally, high backbone dynamics could facilitate the
release of peptides from presenilin following cleavage at γ-sites since a flexible helix may
readily convert to extended water-soluble structures. Given that substrate helix unraveling
is considered to promote proteolysis, one surprising finding of this study was the
Page 20 of 40
ACS Paragon Plus Environment
Journal of the American Chemical Society
123456789101112131415161718192021222324252627282930313233343536373839404142434445464748495051525354555657585960
21
relatively low and unevenly distributed helix dynamics of the cleavage region. What are
the implications of these data for cleavage? Our C99 HDX experiments and TMD
simulations reveal that backbone dynamics strongly increases downstream of the ε-sites
which agrees with earlier data obtained by NMR spectroscopy 15. This local unraveling at
the helix C-terminus results from absent H-bonds and side-chain / side-chain interactions
between the respective i and i+3,4 residues as well as from increased solvation. It is
plausible, that this fraying of the substrate helix promotes the initial endoproteolytic cuts
at ε-sites. The newly formed C-termini of the resulting C48 and C49 fragments would
then be frayed themselves which would facilitate ζ-cleavages; this, in turn, would
produce frayed C45 and C46 fragments etc. The order of DHX kinetics seen with the
octa-peptide fragments (AL-peptides, Fig. 4 C) suggests that, once initiated, sequential
cleavage becomes more facile as it proceeds from the C-terminus towards the γ-sites. One
may wonder why the efficiency of sequential cleavage drops strongly upstream of the γ40
site 4-7. Previously, this has been ascribed to steric hindrance as a result of helix-helix
interaction. The substrate was proposed to be cleaved as a dimer since mutating the Gly
residues within the G29xxxG33xxxG37 motif led to shorter cleavage products concurrent
with decreasing self-interaction of the TMD 13,27. Also, movement of the substrate helix
could be prohibited after cleavage at γ-sites due to interaction of K28 with presenilin 63 or
Aβ fragments containing the relatively hydrophilic TM-N could readily detach from the
enzyme. In addition, our results suggest that cleavage may be reduced by rigidification of
the TM-N helix after dimerization.
Do our results reveal why different Aβ peptide variants are produced with different
abundance? Experimental studies have shown that Αβ40 is more abundant than Αβ42 and
Aβ38 and that shorter sequences are rare 4-7. One factor defining the Αβ40/Αβ42 ratio
could be differential cleavability at γ40 and γ42 sites. Our data indicate similar dynamics
at both sites in terms of the C1 dynamics (Fig. 5 B), H-bond occupancy (Fig. 5 B), H-
bond length fluctuations (Fig. 5 D and 6 D), and local exchange rates at the respective i+4
residues V44 and V46 (Fig. 5 C). It is presently unclear how the efficiency of proteolysis
depends on these properties and our data do not indicate that the Αβ40/Αβ42 ratio
Page 21 of 40
ACS Paragon Plus Environment
Journal of the American Chemical Society
123456789101112131415161718192021222324252627282930313233343536373839404142434445464748495051525354555657585960
22
depends on the local TMD dynamics. However, the situation may be different at ε-sites
where cleavage is initiated. A close inspection of our data reveals that i) the L49 amide
exchanges faster, ii) the L49 C1 carbon fluctuates more strongly (Fig. 5 B), iii) the H-
bond extending from the L49 carbonyl oxygen is more dynamic (Fig. 5 D and 6 B), and
that iv) the L49 carbonyl oxygen is better solvated (Fig. 6 C) compared to the values seen
at T48. These differences may favor cleavage at ε49 over ε48 and thus facilitate entry
into the product line generating Αβ40. Differences in H-bond dynamics are also seen at
respective positions of the L16 and LV16 controls. Therefore, they may not only arise
from sequence-specific local changes in helix stability but also from the more sequence-
independent C-terminal helix fraying. In any case, the differences between T48 and L49
may facilitate the initial cut at ε49, thereby enhancing Aβ40 production.
What could be the impact of TMD dimerization on TMD processing? Apart from steric
hindrance, as discussed above, dimerization could affect proteolysis more directly. This is
suggested by our simulations of a dimer that conforms to most experimentally supported
models 13-17 although alternative models exist 12. Dimerization increases the level of
solvation at V50M51L52 carbonyl oxygens (Fig. 6 C). Increased solvation is suited to
destabilize upstream regions 64, as revealed by stronger amide H-bond fluctuations within
TM-C (Fig. 6 B), which could generally promote cleavage. This destabilization is also
evident from longer H-bonds in the dimer compared to the monomer in the recent NMR
structure 12. For comparison, we also simulated monomer and dimer in a POPC
membrane patch. The membrane has a strong stabilizing effect within TM-N but little
impact on TM-C. TM-N stabilization is strongest at Gly residues, this coincides which
the observation that desolvation by the membrane is most significant at Gly sites. This
suggests that helix flexibility around Gly is not only related to missing intrahelical side-
chain – side-chain interactions; rather, Gly can destabilize a helix in aqueous solvent by
enhancing backbone solvation. The effect of dimerization on solvation at the C-terminus
and on dynamics of the cleavage region is qualitatively similar in the membrane and in
solvent. Since solvation by dimerization is somewhat less pronounced in the membrane,
however, the strongest impact of dimerization on the dynamics of the cleavage region is
probably felt in the aqueous lumen of presenilin.
Page 22 of 40
ACS Paragon Plus Environment
Journal of the American Chemical Society
123456789101112131415161718192021222324252627282930313233343536373839404142434445464748495051525354555657585960
23
It is clear that embedding of the substrate helix within presenilin 8 could also affect its
dynamics and hydration. Thus, our results obtained with free substrate should be
interpreted with caution. Indeed, the Αβ40/Αβ42 ratio is influenced by hereditary
presenilin mutations that lead to early-onset AD 65-67 and by drugs that may intercalate
between enzyme and substrate 68,69. On the other hand, other disease-causing point
mutations that change the Αβ42/Αβ40 ratio are located within the APP TMD 27,70,71.
Thus, the efficiency by which the different sites are cleaved results from a complex
interplay of substrate and enzyme.
Conclusion
In sum, processing of the APP TMD could depend on its primary structure at several
stages. The hinge between the APP TMD dimerization and cleavage domains may
precisely position the substrate within presenilin such that its catalytic center can initially
only access the ε-sites. The ratio of cleavage products could be influenced by different
extents of solvation and of H-bond stabilities at alternate ε-sites. Substrate movement
during sequential proteolysis may facilitated by the flexibility of the TM-N helix. Finally,
dimerization may affect substrate processing by decreasing the dynamics of the
dimerization region while increasing that of the C-terminal part of the cleavage region.
Page 23 of 40
ACS Paragon Plus Environment
Journal of the American Chemical Society
123456789101112131415161718192021222324252627282930313233343536373839404142434445464748495051525354555657585960
24
Acknowledgements
We thank Dr. Steven Verhelst for critical reading of the manuscript and his valuable
comments and Matthias Mörch and Walter Stelzer for help with graphics. This work was
supported by grant LA699/14-1 of the Deutsche Forschungsgemeinschaft, by grant
01GI0724 of the Bundesministerium für Forschung und Technologie, the State of Bavaria
and the Center of Integrative Protein Science Munich (CIPSM) (DL) and by US NIH
grants PO1 GM080513 (CRS) and F31 NS077681 (to PJB). We also thank the Leibniz
Rechenzentrum, Garching, for computing resources.
SUPPORTING INFORMATION AVAILABLE
Additional data are shown in Figs. S1 and S2 and Table S1. This material is available free
of charge via the internet at http://pubs.acs.org.
References
(1) Haass, C.; Selkoe, D. J. Nat Rev Mol Cell Biol 2007, 8, 101.
(2) Lichtenthaler, S. F.; Haass, C.; Steiner, H. J Neurochem 2011, 117, 779.
(3) Kaden, D.; Munter, L. M.; Reif, B.; Multhaup, G. Eur J Cell Biol 2011, 91,
234.
(4) Funamoto, S.; Morishima-Kawashima, M.; Tanimura, Y.; Hirotani, N.;
Saido, T. C.; Ihara, Y. Biochemistry 2004, 43, 13532.
(5) Qi-Takahara, Y.; Morishima-Kawashima, M.; Tanimura, Y.; Dolios, G.;
Hirotani, N.; Horikoshi, Y.; Kametani, F.; Maeda, M.; Saido, T. C.; Wang, R.; Ihara, Y. J
Neurosci 2005, 25, 436.
(6) Takami, M.; Nagashima, Y.; Sano, Y.; Ishihara, S.; Morishima-Kawashima,
M.; Funamoto, S.; Ihara, Y. J. Neurosci. 2009, 29, 13042.
(7) Fukumori, A.; Fluhrer, R.; Steiner, H.; Haass, C. J Neurosci 2010, 30,
7853.
Page 24 of 40
ACS Paragon Plus Environment
Journal of the American Chemical Society
123456789101112131415161718192021222324252627282930313233343536373839404142434445464748495051525354555657585960
25
(8) Lazarov, V. K.; Fraering, P. C.; Ye, W.; Wolfe, M. S.; Selkoe, D. J.; Li, H.
Proc Natl Acad Sci U S A 2006, 103, 6889.
(9) Singh, R.; Barman, A.; Prabhakar, R. J Phys Chem B 2009, 113, 2990.
(10) Li, M.; Phylip, L. H.; Lees, W. E.; Winther, J. R.; Dunn, B. M.; Wlodawer,
A.; Kay, J.; Gustchina, A. Nat Struct Biol 2000, 7, 113.
(11) Barrett, P. J.; Song, Y.; Van Horn, W. D.; Hustedt, E. J.; Schafer, J. M.;
Hadziselimovic, A.; Beel, A. J.; Sanders, C. R. Science 2012, 336, 1168.
(12) Nadezhdin, K. D.; Bocharova, O. V.; Bocharov, E. V.; Arseniev, A. S.
FEBS Lett 2012, 586, 1687.
(13) Munter, L. M.; Voigt, P.; Harmeier, A.; Kaden, D.; Gottschalk, K. E.;
Weise, C.; Pipkorn, R.; Schaefer, M.; Langosch, D.; Multhaup, G. EMBO J 2007, 26,
1702.
(14) Beel, A. J.; Mobley, C. K.; Kim, H. J.; Tian, F.; Hadziselimovic, A.; Jap,
B.; Prestegard, J. H.; Sanders, C. R. Biochemistry 2008, 47, 9428.
(15) Sato, T.; Tang, T. C.; Reubins, G.; Fei, J. Z.; Fujimoto, T.; Kienlen-
Campard, P.; Constantinescu, S. N.; Octave, J. N.; Aimoto, S.; Smith, S. O. Proc Natl
Acad Sci U S A 2009, 106, 1421.
(16) Miyashita, N.; Straub, J. E.; Thirumalai, D.; Sugita, Y. J Am Chem Soc
2009, 131, 3438.
(17) Wang, H.; Barreyro, L.; Provasi, D.; Djemil, I.; Torres-Arancivia, C.;
Filizola, M.; Ubarretxena-Belandia, I. J Mol Biol 2011, 408, 879.
(18) Beel, A. J.; Sanders, C. R. Cell. Mol. Life Sci. 2008, 65, 1311.
(19) Ye, J.; Dave, U. P.; Grishin, N. V.; Goldstein, J. L.; Brown, M. S. Proc.
Natl. Acad. Sci. U S A 2000, 97, 5123.
(20) Urban, S.; Freeman, M. Molecular Cell 2003, 11, 1425.
(21) Akiyama, Y.; Maegawa, S. Mol Microbiol 2007, 64, 1028.
(22) Lemberg, M. K.; Martoglio, B. FEBS Letters 2004, 564, 213.
(23) Fluhrer, R.; Martin, L.; Klier, B.; Haug-Kroeper, M.; Grammer, G.;
Nuscher, B.; Haass, C. J. Biol. Chem. 2012, 287, 5156.
(24) Lu, J. X.; Yau, W. M.; Tycko, R. Biophys J 2011, 100, 711.
(25) Langosch, D.; Arkin, I. T. Protein Sci. 2009, 18, 1343.
Page 25 of 40
ACS Paragon Plus Environment
Journal of the American Chemical Society
123456789101112131415161718192021222324252627282930313233343536373839404142434445464748495051525354555657585960
26
(26) Munter, L. M.; Voigt, P.; Harmeier, A.; Kaden, D.; Gottschalk, K. E.;
Weise, C.; Pipkorn, R.; Schaefer, M.; Langosch, D.; Multhaup, G. EMBO J. 2007, 26,
1702.
(27) Page, R. M.; Gutsmiedl, A.; Fukumori, A.; Winkler, E.; Haass, C.; Steiner,
H. J Biol Chem 2010, 285, 17798.
(28) Kienlen-Campard, P.; Tasiaux, B.; Hees, J. v.; Li, M.; Huysseune, S.; Sato,
T.; Fei, J. Z.; Aimoto, S.; Courtoy, P. J.; Smith, S. O.; Constantinescu, S. N.; Octave, J.-N.
J. Biol. Chem. 2008, 283, 7733.
(29) Gorman, P. M.; Kim, S.; Guo, M.; Melnyk, R. A.; McLaurin, J.; Fraser, P.
E.; Bowie, J. U.; Chakrabartty, A. BMC Neurosci 2008, 9, 17.
(30) Poschner, B. C.; Quint, S.; Hofmann, M.; Langosch, D. J. Mol. Biol. 2009,
386, 733.
(31) Poschner, B.; Reed, J.; Langosch, D.; Hofmann, M. W. Analyt.
Biochemistry 2007, 363, 306.
(32) Hofmann, M. W.; Poschner, B. C.; Hauser, S.; Langosch, D. Biochemistry
2007, 46, 4204.
(33) Stelzer, W.; Poschner, B. C.; Stalz, H.; Heck, A. J.; Langosch, D. Biophys.
J. 2008, 95, 1326.
(34) Quint, S.; Widmaier, S.; Minde, D.; Langosch, D.; Scharnagl, C. Biophys.
J. 2010, 99, 2541.
(35) MacKerell, A. D.; Bashford, D.; Bellott; Dunbrack, R. L.; Evanseck, J. D.;
Field, M. J.; Fischer, S.; Gao, J.; Guo, H.; Ha, S.; Joseph-McCarthy, D.; Kuchnir, L.;
Kuczera, K.; Lau, F. T. K.; Mattos, C.; Michnick, S.; Ngo, T.; Nguyen, D. T.; Prodhom,
B.; Reiher, W. E.; Roux, B.; Schlenkrich, M.; Smith, J. C.; Stote, R.; Straub, J.; Watanabe,
M.; Wiórkiewicz-Kuczera, J.; Yin, D.; Karplus, M. J Phys Chem B 1998, 102, 3586.
(36) Adams, P. D.; Engelman, D. M.; Brünger, A. T. Proteins 1996, 26, 257.
(37) Feller, S. E.; MacKerell, A. D. J. Phys.Chem.B 2000, 104, 7510.
(38) Tuckerman, M.; Berne, B. J. J. Chem. Phys. 1992, 97, 1990.
(39) Phillips, J. C.; Braun, R.; Wang, W.; Gumbart, J.; Tajkhorshid, E.; Villa,
E.; Chipot, C.; Skeel, R. D.; Kalé, L.; Schulten, K. J. Comp. Chem. 2005, 1781.
Page 26 of 40
ACS Paragon Plus Environment
Journal of the American Chemical Society
123456789101112131415161718192021222324252627282930313233343536373839404142434445464748495051525354555657585960
27
(40) Faraldo-Gomez, J. D.; Forrest, L. R.; Baaden, M.; Bond, P. J.; Domene, C.;
Patargias, G.; Cuthbertson, J.; Sansom, M. S. Proteins 2004, 57, 783.
(41) Kucerka, N.; Nieh, M. P.; Katsaras, J. Biochim Biophys Acta 2011, 1808,
2761.
(42) Brooks, B. R.; Brooks, C. L., 3rd; Mackerell, A. D., Jr.; Nilsson, L.;
Petrella, R. J.; Roux, B.; Won, Y.; Archontis, G.; Bartels, C.; Boresch, S.; Caflisch, A.;
Caves, L.; Cui, Q.; Dinner, A. R.; Feig, M.; Fischer, S.; Gao, J.; Hodoscek, M.; Im, W.;
Kuczera, K.; Lazaridis, T.; Ma, J.; Ovchinnikov, V.; Paci, E.; Pastor, R. W.; Post, C. B.;
Pu, J. Z.; Schaefer, M.; Tidor, B.; Venable, R. M.; Woodcock, H. L.; Wu, X.; Yang, W.;
York, D. M.; Karplus, M. J Comput Chem 2009, 30, 1545.
(43) Teilum, K.; Kragelund, B. B.; Poulsen, F. M. Application of Hydrogen
Exchange Kinetics to Studies of Protein Folding. In Protein Folding Handbook, Wiley-
VCH Verlag GmbH, 2008; pp. 634, Weinheim, Germany.
(44) Sessions, R. B.; Gibbs, N.; Dempsey, C. E. Biophys J 1998, 74, 138.
(45) Dempsey, C. E. Progr. Nucl. Magn. Res. Spectr. 2001, 39, 135.
(46) Fernandez, A.; Berry, R. S. Biophys J 2002, 83, 2475.
(47) Fernandez, A.; Scheraga, H. A. Proc Natl Acad Sci U S A 2003, 100, 113.
(48) Mehrnejad, F.; Naderi-Manesh, H.; Ranjbar, B. Proteins 2007, 67, 931.
(49) Roccatano, D.; Colombo, G.; Fioroni, M.; Mark, A. E. Proc Natl Acad Sci
U S A 2002, 99, 12179.
(50) Bevington, P. R.; Robinson, D. K. Data reduction and error analysis for
the physical science; McGraw-Hill Higher Education, 1969, New York, USA.
(51) Bahar, I.; Wallqvist, A.; Covell, D. G.; Jernigan, R. L. Biochemistry 1998,
37, 1067.
(52) Demmers, J. A.; Haverkamp, J.; Heck, A. J.; Koeppe, R. E., 2nd; Killian, J.
A. Proc. Natl. Acad. Sci. U S A 2000, 97, 3189.
(53) Zhuang, T.; Jap, B. K.; Sanders, C. R. J Am Chem Soc 2011, 133, 20571.
(54) Kroenke, C. D.; Ziemnicka-Kotula, D.; Xu, J.; Kotula, L.; Palmer, A. G.,
3rd Biochemistry 1997, 36, 8145.
(55) Ramelot, T. A.; Gentile, L. N.; Nicholson, L. K. Biochemistry 2000, 39,
2714.
Page 27 of 40
ACS Paragon Plus Environment
Journal of the American Chemical Society
123456789101112131415161718192021222324252627282930313233343536373839404142434445464748495051525354555657585960
28
(56) Tolia, A.; Chavez-Gutierrez, L.; De Strooper, B. J Biol Chem 2006, 281,
27633.
(57) Sato, C.; Morohashi, Y.; Tomita, T.; Iwatsubo, T. J Neurosci 2006, 26,
12081.
(58) Stelzer, W.; Langosch, D. Protein Sci 2012, 21, 1097.
(59) Xiao, H.; Hoerner, J. K.; Eyles, S. J.; Dobo, A.; Voigtman, E.; Mel'Cuk, A.
I.; Kaltashov, I. A. Prot. Sci. 2005, 14, 543.
(60) Zhang, Z.; Li, W.; Logan, T. M.; Li, M.; Marshall, A. G. Protein Sci. 1997,
6, 2203.
(61) Richter, L.; Munter, L. M.; Ness, J.; Hildebrand, P. W.; Dasari, M.;
Unterreitmeier, S.; Bulic, B.; Beyermann, M.; Gust, R.; Reif, B.; Weggen, S.; Langosch,
D.; Multhaup, G. Proc Natl Acad Sci U S A 2010, 107, 14597.
(62) Zhou, H. X. Trends Biochem Sci 2012, 37, 43.
(63) Kukar, T. L.; Ladd, T. B.; Robertson, P.; Pintchovski, S. A.; Moore, B.;
Bann, M. A.; Ren, Z.; Jansen-West, K.; Malphrus, K.; Eggert, S.; Maruyama, H.; Cottrell,
B. A.; Das, P.; Basi, G. S.; Koo, E. H.; Golde, T. E. J. Biol. Chem. 2011, 286, 39804.
(64) Sanbonmatsu, K. Y.; Garcia, A. E. Proteins 2002, 46, 225.
(65) Selkoe, D. J. Physiol Rev 2001, 81, 741.
(66) Tanzi, R. E.; Bertram, L. Cell 2005, 120, 545.
(67) Goedert, M.; Spillantini, M. G. Science 2006, 314, 777.
(68) Weggen, S.; Eriksen, J. L.; Das, P.; Sagi, S. A.; Wang, R.; Pietrzik, C. U.;
Findlay, K. A.; Smith, T. E.; Murphy, M. P.; Bulter, T.; Kang, D. E.; Marquez-Sterling,
N.; Golde, T. E.; Koo, E. H. Nature 2001, 414, 212.
(69) Heneka, M. T.; Kummer, M. P.; Weggen, S.; Bulic, B.; Multhaup, G.;
Munter, L.; Hull, M.; Pflanzner, T.; Pietrzik, C. U. Curr Alzheimer Res 2011, 8, 115.
(70) Kumar-Singh, S.; De Jonghe, C.; Cruts, M.; Kleinert, R.; Wang, R.;
Mercken, M.; De Strooper, B.; Vanderstichele, H.; Lofgren, A.; Vanderhoeven, I.;
Backhovens, H.; Vanmechelen, E.; Kroisel, P. M.; Van Broeckhoven, C. Hum Mol Genet
2000, 9, 2589.
(71) Munter, L. M.; Botev, A.; Richter, L.; Hildebrand, P. W.; Althoff, V.;
Weise, C.; Kaden, D.; Multhaup, G. J Biol Chem 2010, 285, 21636.
Page 28 of 40
ACS Paragon Plus Environment
Journal of the American Chemical Society
123456789101112131415161718192021222324252627282930313233343536373839404142434445464748495051525354555657585960
29
Figure legends
Figure 1. Use of NMR to monitor exchange of C99 backbone amide protons for
deuterons as a function of time. This figure depicts the overlay of five 900 MHz 1H,15N-TROSY NMR spectra of C99, collected at different points of time following
dilution of C99 into D2O. The black spectrum shows the reference spectrum collected in
an H2O solution. Red, green, purple, and cyan spectra reveal the state of changes after 2,
8, 16, and 24 h, respectively. All NMR resonances that could be accurately assigned are
labeled. It should be noted that because each spectrum required 6 h of acquisition time,
the actual time reflected by the data is a window spanning the designated time plus 6 h,
with the observed spectra being weighted towards the early part of the 6 hour window
because of the way the 2-D NMR data is collected (most of the signal is detected in the
early increments of the 2D experiment).
Figure 2. Time dependent replacement of amide protons with deuterons upon
dilution of C99 into D2O solution. The intensity ratio is for the peak intensity observed
after exchange with D2O for 2 (red bars) or 16 (blue bars) h relative to a non-exchanged
“time = 0” reference sample. Negative bars indicate that the peaks had disappeared
completely, while the absence of either a positive or negative bar indicates that data was
not measured for that site because of difficulties due to peak overlap or assignment. The
known topology of C99 is shown below each graph, with helical regions indicated by
large, colored rectangles and dynamic loops indicated by grey, small rectangles. The
numbering given in the upper line refers to full-length APP numbering while the lower
line gives Aβ numbering. Data was collected for 0.2 mM U-15N-C99 in 10% LMPG
micelles at pH 6.5 and 45°C.
Figure 3. Secondary structure and backbone dynamics of the APP TMD helix. A)
Sequences of the predicted APP TMD (arrows indicate cleavage sites leading to the Aβ40
and Aβ42 product lines, respectively) and the model peptides used here. All peptides
contain an additional N-terminal KKW(K) sequence for better solubility and
quantification; A28-44 contains a non-natural C-terminal KKK sequence. B) Averaged
Page 29 of 40
ACS Paragon Plus Environment
Journal of the American Chemical Society
123456789101112131415161718192021222324252627282930313233343536373839404142434445464748495051525354555657585960
30
CD spectra and calculated secondary structure contents (inset). n = 3-6, means±SD. C)
Representative mass spectra of the triply charged A28-55 ion from different time points
of a DHX experiment. D) DHX kinetics where the absolute numbers of remaining
deuterons were normalized to the maximum numbers of H-bonded amide deuterons in an
ideal α-helix (A28-44 and A37-55, 19 D; A28-55, 27 D). Data points at t=0 min
correspond to the numbers of amide deuterons seen after exchange under quench
conditions. Data were fit with a MEM assuming Dt = 0 min equaling the maximum numbers
of potentially H-bonded amide deuterons (continuous lines). n = 3, SD ≤ 0.3 D (error bars
not shown). Inset, distribution of exchange rate constants determined by fitting the data
with MEM.
Figure 4. Secondary structure and backbone dynamics of hybrid peptides. A)
Peptide sequences. B) CD spectra and calculated secondary structure contents (inset) of
AL-peptides in DLPC/DLPS/DLPE (3/1/1) membranes at P/L ~0.03 in 50 mM ND4Ac,
pD 7.5 at 70°C. C) DHX kinetics of AL-peptides recorded in liposomal
DLPC/DLPS/DLPE (3/1/1) membranes at P/L ~0.03 in 50 mM NH4Ac, pH 7.5 at 70°C.
Data points at t=0 min correspond to the numbers of amide deuterons seen after exchange
under quench conditions. Lines connecting the data points were obtained by fitting the
kinetics with a triple exponential function that was characterized by a reduced chi-square
value <0.1 for all peptides. n = 3, means±SD. D) A representation of the numbers of
deuterons within the kinetically distinct classes A, B, C, and class D, which represents
deuterons that do not exchange within 4 h. To make them comparable, the numbers were
calculated after averaging the respective DHX rate constants over all peptides (Table S1).
Black bars represent the numbers found for the L19 reference. To facilitate the
comparison between AL peptides, we plot the differences between the numbers seen with
AL-peptides and L19.
Figure 5. The backbone dynamics of the APP TMD helix probed by MD simulation.
A) Overall helix backbone conformation. The superposition (left graph) was obtained by
overlaying backbone traces from consecutive frames taken every 1.5 ns, each of which
was oriented with a rigid body fit of residues 29-37 to the Cα atoms of an ideal α−helix
Page 30 of 40
ACS Paragon Plus Environment
Journal of the American Chemical Society
123456789101112131415161718192021222324252627282930313233343536373839404142434445464748495051525354555657585960
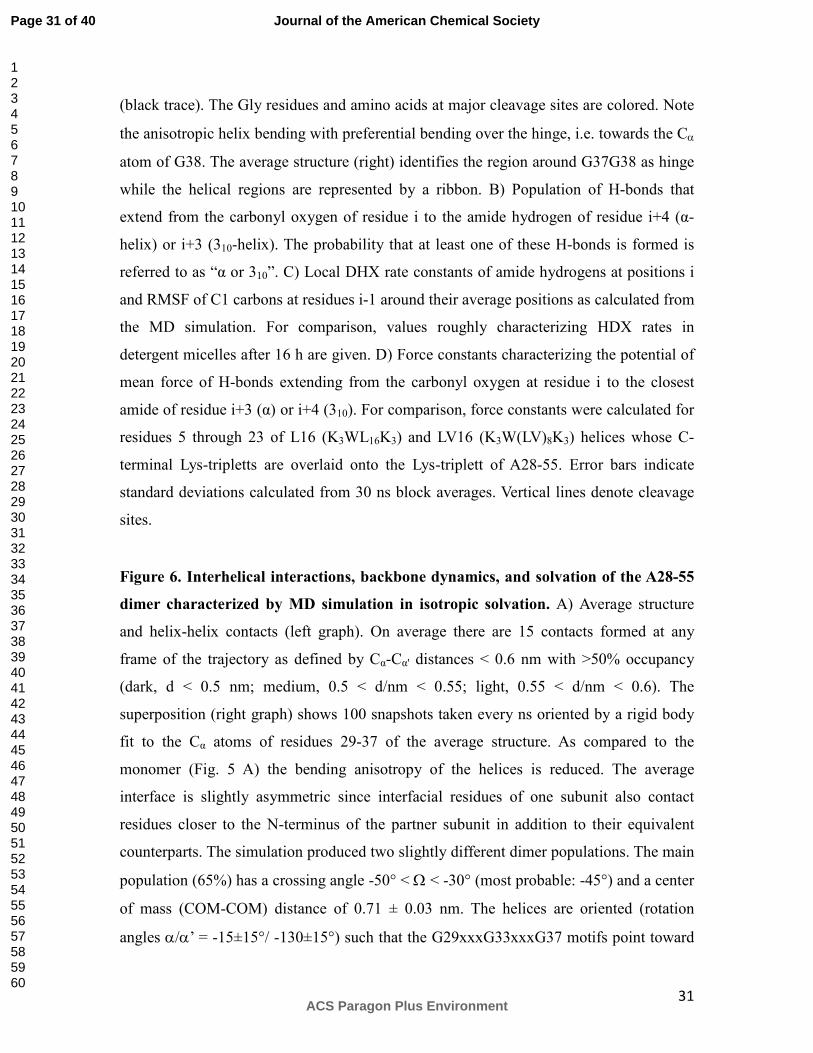
31
(black trace). The Gly residues and amino acids at major cleavage sites are colored. Note
the anisotropic helix bending with preferential bending over the hinge, i.e. towards the Cα
atom of G38. The average structure (right) identifies the region around G37G38 as hinge
while the helical regions are represented by a ribbon. B) Population of H-bonds that
extend from the carbonyl oxygen of residue i to the amide hydrogen of residue i+4 (α-
helix) or i+3 (310-helix). The probability that at least one of these H-bonds is formed is
referred to as “α or 310”. C) Local DHX rate constants of amide hydrogens at positions i
and RMSF of C1 carbons at residues i-1 around their average positions as calculated from
the MD simulation. For comparison, values roughly characterizing HDX rates in
detergent micelles after 16 h are given. D) Force constants characterizing the potential of
mean force of H-bonds extending from the carbonyl oxygen at residue i to the closest
amide of residue i+3 (α) or i+4 (310). For comparison, force constants were calculated for
residues 5 through 23 of L16 (K3WL16K3) and LV16 (K3W(LV)8K3) helices whose C-
terminal Lys-tripletts are overlaid onto the Lys-triplett of A28-55. Error bars indicate
standard deviations calculated from 30 ns block averages. Vertical lines denote cleavage
sites.
Figure 6. Interhelical interactions, backbone dynamics, and solvation of the A28-55
dimer characterized by MD simulation in isotropic solvation. A) Average structure
and helix-helix contacts (left graph). On average there are 15 contacts formed at any
frame of the trajectory as defined by Cα-Cα' distances < 0.6 nm with >50% occupancy
(dark, d < 0.5 nm; medium, 0.5 < d/nm < 0.55; light, 0.55 < d/nm < 0.6). The
superposition (right graph) shows 100 snapshots taken every ns oriented by a rigid body
fit to the Cα atoms of residues 29-37 of the average structure. As compared to the
monomer (Fig. 5 A) the bending anisotropy of the helices is reduced. The average
interface is slightly asymmetric since interfacial residues of one subunit also contact
residues closer to the N-terminus of the partner subunit in addition to their equivalent
counterparts. The simulation produced two slightly different dimer populations. The main
population (65%) has a crossing angle -50° < Ω < -30° (most probable: -45°) and a center
of mass (COM-COM) distance of 0.71 ± 0.03 nm. The helices are oriented (rotation
angles α/α’ = -15±15°/ -130±15°) such that the G29xxxG33xxxG37 motifs point toward
Page 31 of 40
ACS Paragon Plus Environment
Journal of the American Chemical Society
123456789101112131415161718192021222324252627282930313233343536373839404142434445464748495051525354555657585960
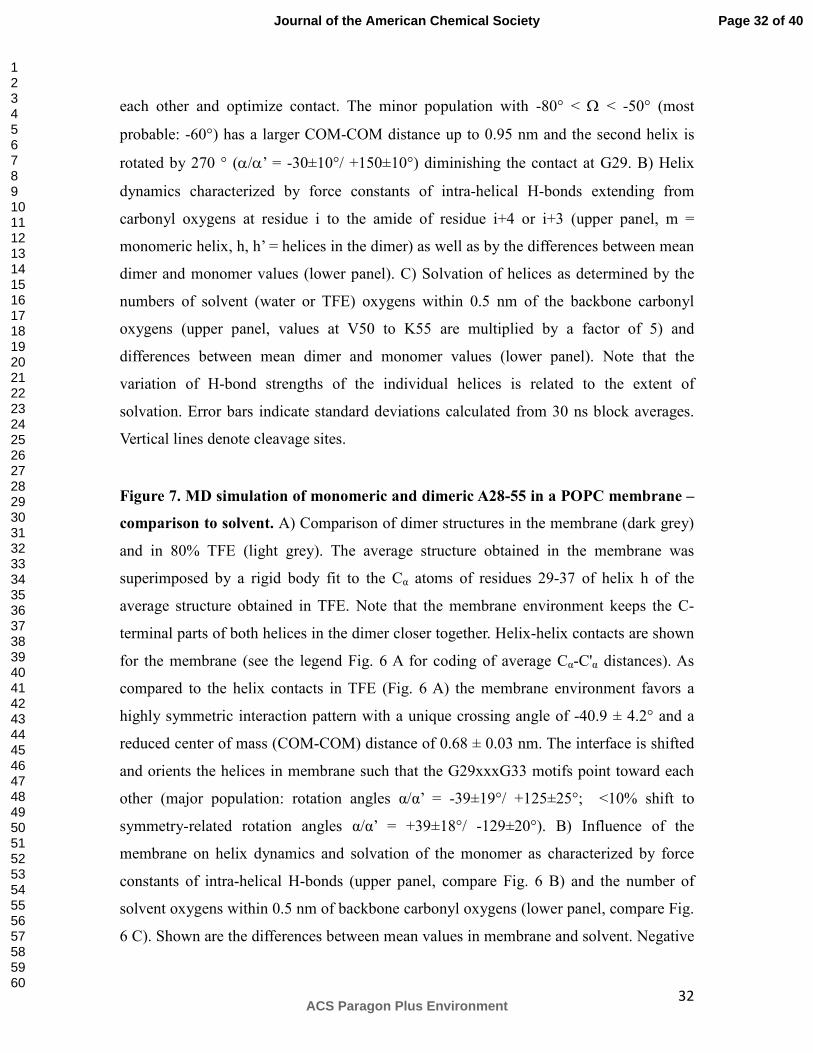
32
each other and optimize contact. The minor population with -80° < Ω < -50° (most
probable: -60°) has a larger COM-COM distance up to 0.95 nm and the second helix is
rotated by 270 ° (α/α’ = -30±10°/ +150±10°) diminishing the contact at G29. B) Helix
dynamics characterized by force constants of intra-helical H-bonds extending from
carbonyl oxygens at residue i to the amide of residue i+4 or i+3 (upper panel, m =
monomeric helix, h, h’ = helices in the dimer) as well as by the differences between mean
dimer and monomer values (lower panel). C) Solvation of helices as determined by the
numbers of solvent (water or TFE) oxygens within 0.5 nm of the backbone carbonyl
oxygens (upper panel, values at V50 to K55 are multiplied by a factor of 5) and
differences between mean dimer and monomer values (lower panel). Note that the
variation of H-bond strengths of the individual helices is related to the extent of
solvation. Error bars indicate standard deviations calculated from 30 ns block averages.
Vertical lines denote cleavage sites.
Figure 7. MD simulation of monomeric and dimeric A28-55 in a POPC membrane –
comparison to solvent. A) Comparison of dimer structures in the membrane (dark grey)
and in 80% TFE (light grey). The average structure obtained in the membrane was
superimposed by a rigid body fit to the Cα atoms of residues 29-37 of helix h of the
average structure obtained in TFE. Note that the membrane environment keeps the C-
terminal parts of both helices in the dimer closer together. Helix-helix contacts are shown
for the membrane (see the legend Fig. 6 A for coding of average Cα-C'α distances). As
compared to the helix contacts in TFE (Fig. 6 A) the membrane environment favors a
highly symmetric interaction pattern with a unique crossing angle of -40.9 ± 4.2° and a
reduced center of mass (COM-COM) distance of 0.68 ± 0.03 nm. The interface is shifted
and orients the helices in membrane such that the G29xxxG33 motifs point toward each
other (major population: rotation angles α/α’ = -39±19°/ +125±25°; <10% shift to
symmetry-related rotation angles α/α’ = +39±18°/ -129±20°). B) Influence of the
membrane on helix dynamics and solvation of the monomer as characterized by force
constants of intra-helical H-bonds (upper panel, compare Fig. 6 B) and the number of
solvent oxygens within 0.5 nm of backbone carbonyl oxygens (lower panel, compare Fig.
6 C). Shown are the differences between mean values in membrane and solvent. Negative
Page 32 of 40
ACS Paragon Plus Environment
Journal of the American Chemical Society
123456789101112131415161718192021222324252627282930313233343536373839404142434445464748495051525354555657585960
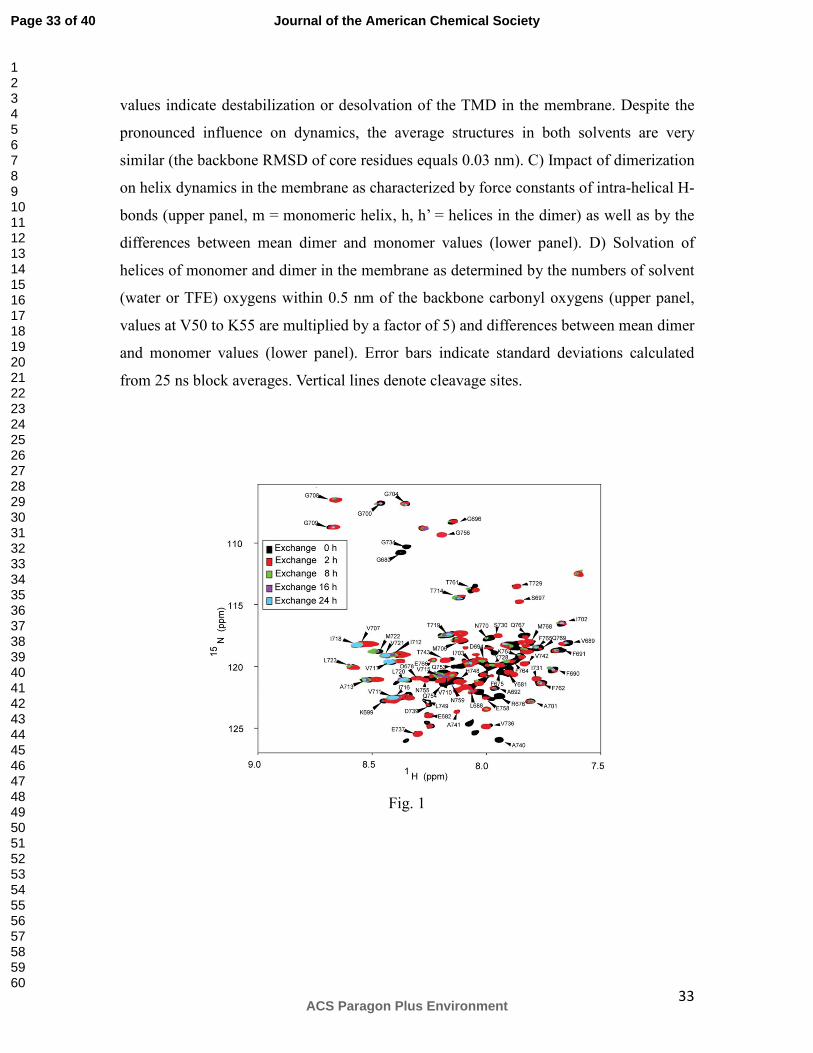
33
values indicate destabilization or desolvation of the TMD in the membrane. Despite the
pronounced influence on dynamics, the average structures in both solvents are very
similar (the backbone RMSD of core residues equals 0.03 nm). C) Impact of dimerization
on helix dynamics in the membrane as characterized by force constants of intra-helical H-
bonds (upper panel, m = monomeric helix, h, h’ = helices in the dimer) as well as by the
differences between mean dimer and monomer values (lower panel). D) Solvation of
helices of monomer and dimer in the membrane as determined by the numbers of solvent
(water or TFE) oxygens within 0.5 nm of the backbone carbonyl oxygens (upper panel,
values at V50 to K55 are multiplied by a factor of 5) and differences between mean dimer
and monomer values (lower panel). Error bars indicate standard deviations calculated
from 25 ns block averages. Vertical lines denote cleavage sites.
Fig. 1
Page 33 of 40
ACS Paragon Plus Environment
Journal of the American Chemical Society
123456789101112131415161718192021222324252627282930313233343536373839404142434445464748495051525354555657585960
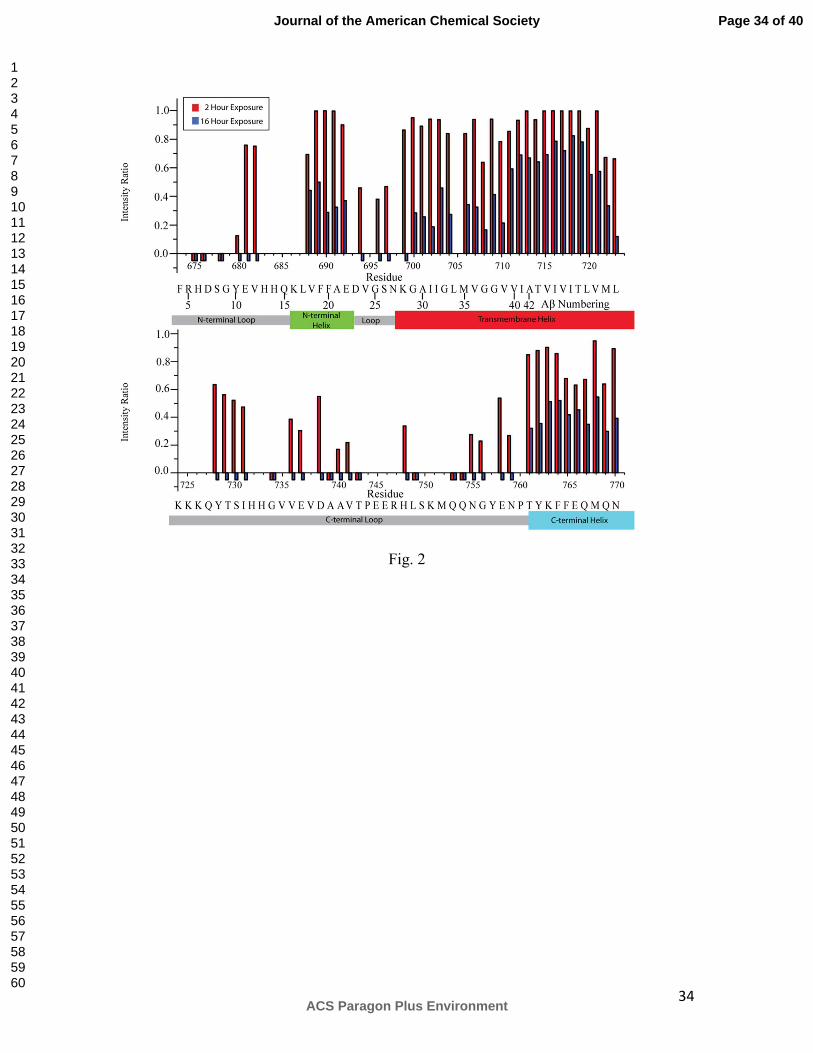
34
Fig. 2
Page 34 of 40
ACS Paragon Plus Environment
Journal of the American Chemical Society
123456789101112131415161718192021222324252627282930313233343536373839404142434445464748495051525354555657585960
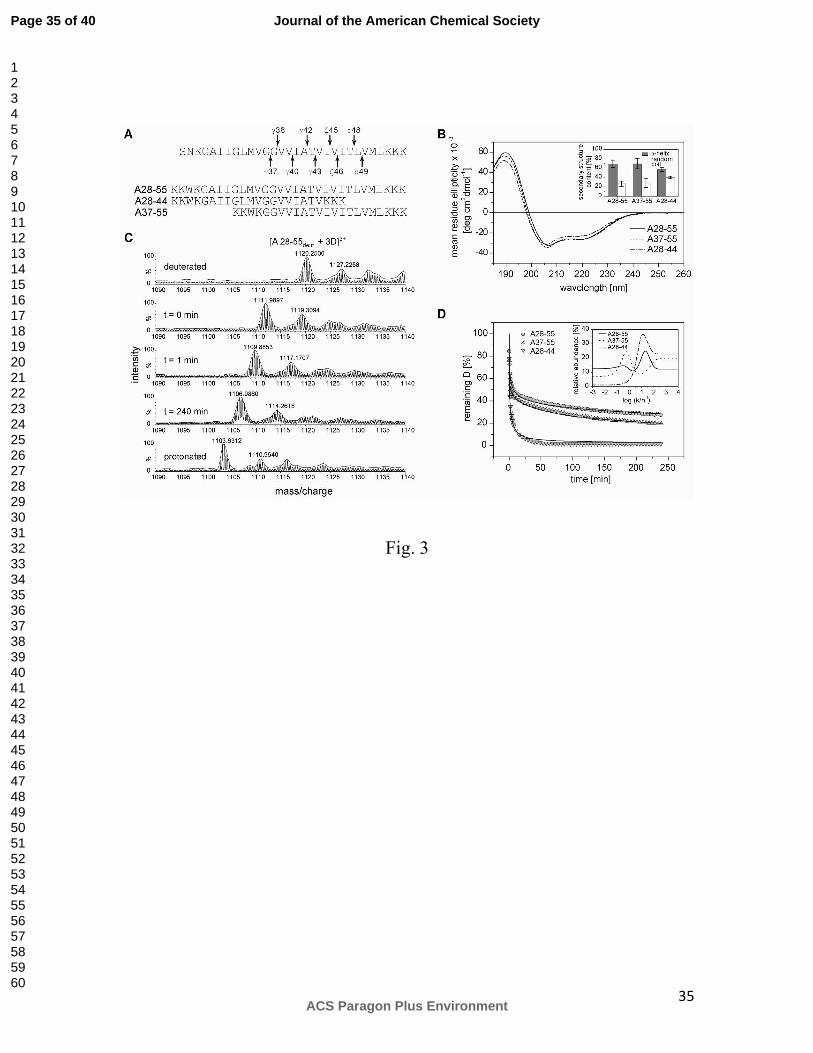
35
Fig. 3
Page 35 of 40
ACS Paragon Plus Environment
Journal of the American Chemical Society
123456789101112131415161718192021222324252627282930313233343536373839404142434445464748495051525354555657585960
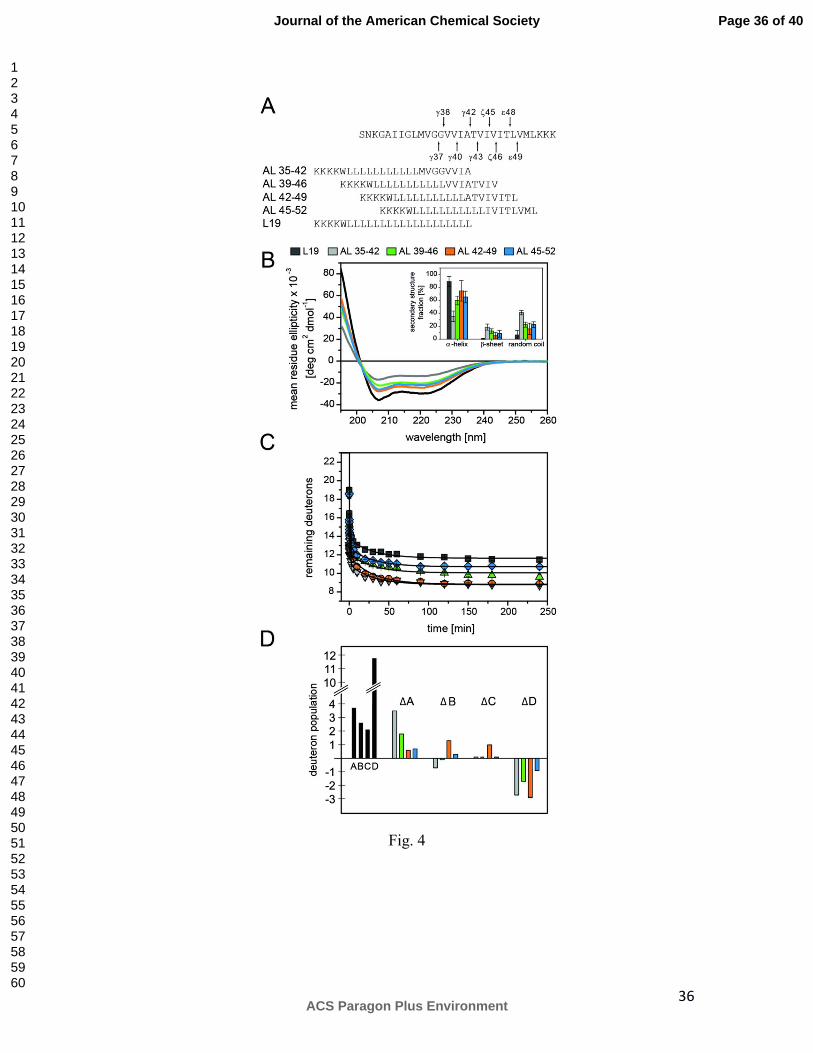
36
Fig. 4
Page 36 of 40
ACS Paragon Plus Environment
Journal of the American Chemical Society
123456789101112131415161718192021222324252627282930313233343536373839404142434445464748495051525354555657585960
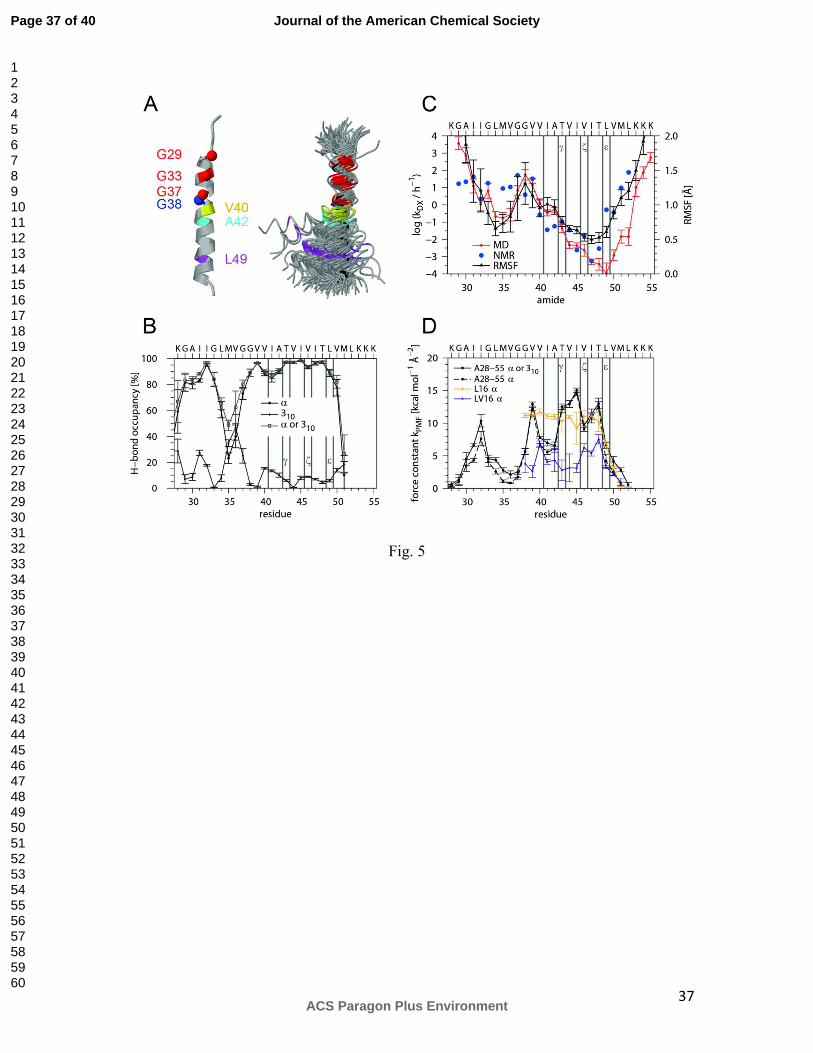
37
Fig. 5
Page 37 of 40
ACS Paragon Plus Environment
Journal of the American Chemical Society
123456789101112131415161718192021222324252627282930313233343536373839404142434445464748495051525354555657585960
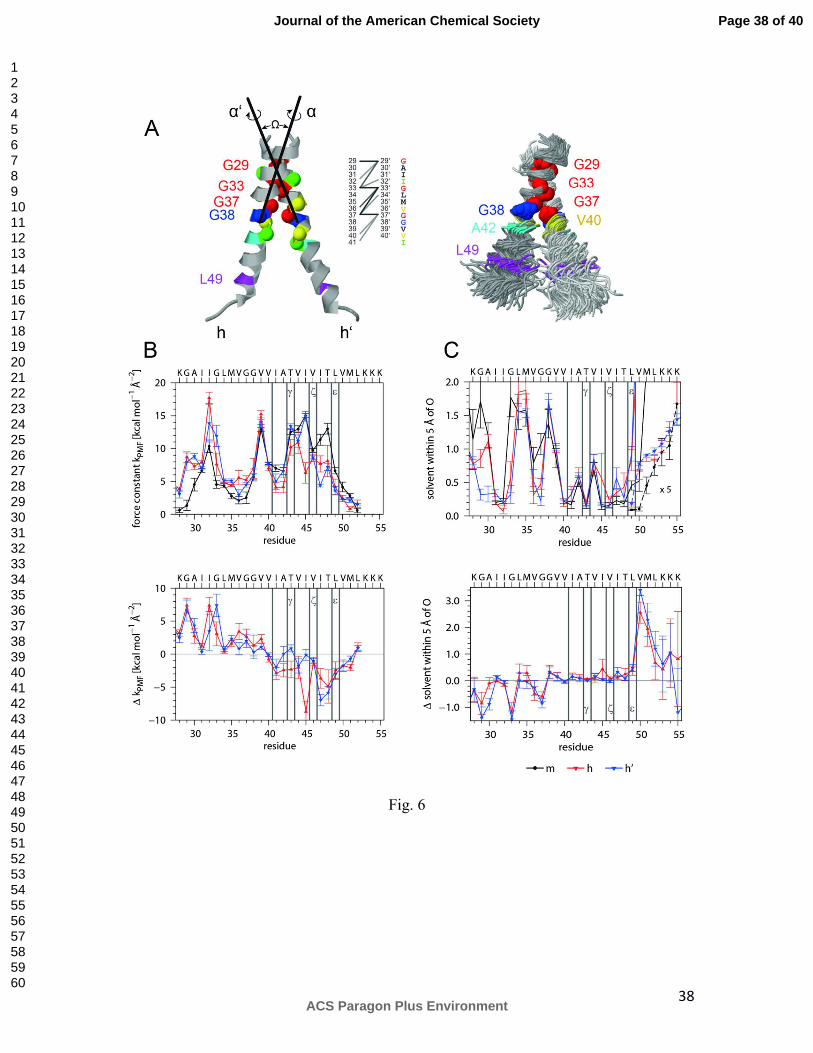
38
Fig. 6
Page 38 of 40
ACS Paragon Plus Environment
Journal of the American Chemical Society
123456789101112131415161718192021222324252627282930313233343536373839404142434445464748495051525354555657585960
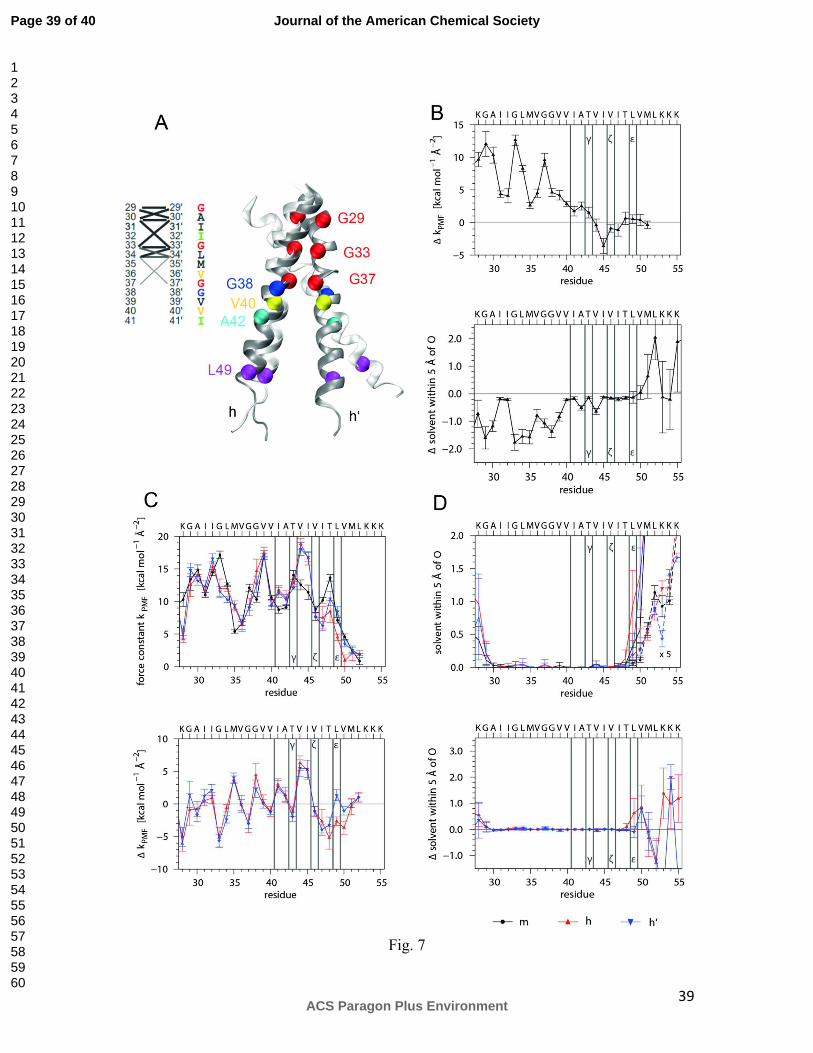
39
Fig. 7
Page 39 of 40
ACS Paragon Plus Environment
Journal of the American Chemical Society
123456789101112131415161718192021222324252627282930313233343536373839404142434445464748495051525354555657585960
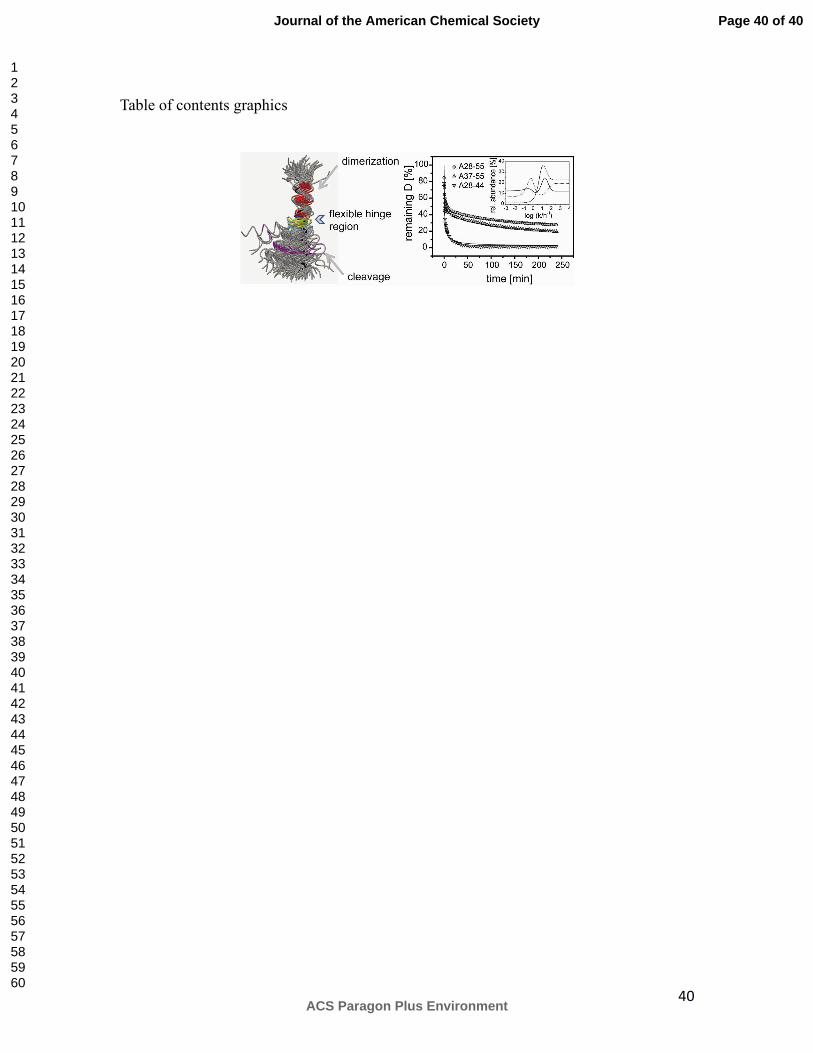
40
Table of contents graphics
Page 40 of 40
ACS Paragon Plus Environment
Journal of the American Chemical Society
123456789101112131415161718192021222324252627282930313233343536373839404142434445464748495051525354555657585960