Symmetry and scale orient Min protein patterns in shaped ... · 10-μm-thick layer of PDMS was...
10
Symmetry and scale orient Min protein patterns in shaped bacterial sculptures Fabai Wu, Bas G. C. van Schie, Juan E. Keymer † and Cees Dekker * The boundary of a cell defines the shape and scale of its subcellular organization. However, the effects of the cell’s spatial boundaries as well as the geometry sensing and scale adaptation of intracellular molecular networks remain largely unexplored. Here, we show that living bacterial cells can be ‘sculpted’ into defined shapes, such as squares and rectangles, which are used to explore the spatial adaptation of Min proteins that oscillate pole-to-pole in rod-shaped Escherichia coli to assist cell division. In a wide geometric parameter space, ranging from 2 × 1 × 1 to 11 × 6 × 1 μm 3 , Min proteins exhibit versatile oscillation patterns, sustaining rotational, longitudinal, diagonal, stripe and even transversal modes. These patterns are found to directly capture the symmetry and scale of the cell boundary, and the Min concentration gradients scale with the cell size within a characteristic length range of 3–6 μm. Numerical simulations reveal that local microscopic Turing kinetics of Min proteins can yield global symmetry selection, gradient scaling and an adaptive range, when and only when facilitated by the three-dimensional confinement of the cell boundary. These findings cannot be explained by previous geometry-sensing models based on the longest distance, membrane area or curvature, and reveal that spatial boundaries can facilitate simple molecular interactions to result in far more versatile functions than previously understood. P attern formation is central to the wealth of nature’s intrigue. In search for its origin, Alan Turing theoretically showed that the simple reaction and diffusion of two chemicals is adequate to spontaneously form reproducible spatial patterns 1 . Reaction– diffusion theory subsequently inspired broad applications in physics and chemistry and bridged molecular interactions to morphogenesis and cellular organization in biology 1–8 . Reaction–diffusion systems are, however, little understood in the context of a boundary geome- try, which is of particular importance in embryos and cells, where spatial patterns such as protein gradients are established within their envelope to dictate the locations for fundamental cellular pro- cesses such as cell division 5,9–11 . In this study, we demonstrate how reaction–diffusion patterns of Min proteins can sense and adapt to the morphological features of bacterial cells, an ability that is essen- tial for spatial regulation for cell division and its robustness against variations in cell size and shape 12–14 . Min proteins in many bacteria, including rod-shaped Escherichia coli, exhibit a fascinating phenomenon: they oscillate pole-to-pole along the cell length, resulting in a time-averaged concentration minimum of division inhibitors at the mid-plane 10,11 (Fig. 1b). This oscillatory dynamics is believed to arise autonomously from the ability of MinD proteins to cooperatively bind to the cytoplasmic membrane and the ability of MinE proteins to unbind MinD from the membrane 15,16 (Fig. 1a), actions that, respectively, exemplify the self-activation and inhibition kinetics of reaction–diffusion theory 3,4,7 . The self-organizing nature of dynamic Min patterns has been elegantly demonstrated by travelling waves and oscillations reconstituted in vitro 17–21 , albeit exhibiting an approximately tenfold larger length scale compared to Min oscillations in vivo due to factors that remain unclear. Various spatial cues have been hypothesized to account for the consistent pole-to-pole orientation of the Min oscillations 7,18,19,22–24 , including the longest travel distance through the cytosol 22 or along the membrane 19 , a characteristic polar membrane area 18 and a high membrane curvature at the poles 24 (Fig. 1c). Furthermore, it is unclear how Min gradients quantitatively adapt to cell size variability and growth. Here, we identify the rules of geometry sensing and scale adaptation by systematically studying the dynamic behaviour of Min proteins in live cells within spatial boundaries across a broad geometric parameter space. Bacterial cells can be sculpted into defined shapes Bacteria maintain their cell shape by a well-regulated process of pep- tidoglycan insertion into the cell wall 25 . Previous studies have shown that curved agarose micro-chambers can alter the growth of filamentous cells of E. coli such that they adopt a certain degree of curvature 26 , and that sub-micrometre constraints imposed by silicon slits can induce E. coli to grow into a variety of squeezed shapes 27 . These methods have been applied to elucidate interesting mechanisms of growth and division in bacteria 13,28 . The diversity and reproduci- bility of the cell shapes produced by these methods are, however, limited, as wild-type pathways for cell wall synthesis are used. Spheroplasts generated by lysozyme, on the other hand, appear to abolish the dynamic activities of proteins such as Min oscillations 24 . For this study, we developed a new ‘cell-sculpting’ method to shape living bacterial cells into user-defined geometries (Fig. 1d). This allowed a quantitative and systematic study on the effect of shape and scale. Cells were inoculated into nanofabricated poly- dimethylsiloxane (PDMS) chambers with various lateral shapes and a fixed depth of 1.15 ± 0.05 μm (Supplementary Fig. 1). The 10-μm-thick layer of PDMS was supported by a thin cover glass for microscopy, and the microchambers with cells were covered by a 5% agarose pad supplemented with growth medium, A22 and cephalexin. A22 inhibits rod-shape maintenance by antagonizing the dynamics of bacterial actin MreB, which regulates peptidoglycan insertion patterns. Cephalexin prevents the cell wall constriction that would otherwise lead to cell division. Under these growth conditions, E. coli cells exhibit a surprising plasticity, growing into Department of Bionanoscience, Kavli Institute of Nanoscience, Delft University of Technology, Lorentzweg 1, Delft 2628 CJ, The Netherlands. † Present address: IEB & Department of Ecology, School of Biological Sciences, P. Catholic University, Casilla 114-D, Santiago, Chile. *e-mail: [email protected] ARTICLES PUBLISHED ONLINE: 22 JUNE 2015 | DOI: 10.1038/NNANO.2015.126 NATURE NANOTECHNOLOGY | ADVANCE ONLINE PUBLICATION | www.nature.com/naturenanotechnology 1 © 2015 Macmillan Publishers Limited. All rights reserved
Transcript of Symmetry and scale orient Min protein patterns in shaped ... · 10-μm-thick layer of PDMS was...
Symmetry and scale orient Min protein patterns inshaped bacterial sculpturesFabai Wu, Bas G. C. van Schie, Juan E. Keymer† and Cees Dekker*
The boundary of a cell defines the shape and scale of its subcellular organization. However, the effects of the cell’s spatialboundaries as well as the geometry sensing and scale adaptation of intracellular molecular networks remain largelyunexplored. Here, we show that living bacterial cells can be ‘sculpted’ into defined shapes, such as squares and rectangles,which are used to explore the spatial adaptation of Min proteins that oscillate pole-to-pole in rod-shaped Escherichia coli toassist cell division. In a wide geometric parameter space, ranging from 2 × 1 × 1 to 11 × 6 × 1 μm3, Min proteins exhibitversatile oscillation patterns, sustaining rotational, longitudinal, diagonal, stripe and even transversal modes. Thesepatterns are found to directly capture the symmetry and scale of the cell boundary, and the Min concentration gradientsscale with the cell size within a characteristic length range of 3–6 μm. Numerical simulations reveal that localmicroscopic Turing kinetics of Min proteins can yield global symmetry selection, gradient scaling and an adaptive range,when and only when facilitated by the three-dimensional confinement of the cell boundary. These findings cannotbe explained by previous geometry-sensing models based on the longest distance, membrane area or curvature, andreveal that spatial boundaries can facilitate simple molecular interactions to result in far more versatile functions thanpreviously understood.
Pattern formation is central to the wealth of nature’s intrigue. Insearch for its origin, Alan Turing theoretically showed that thesimple reaction and diffusion of two chemicals is adequate to
spontaneously form reproducible spatial patterns1. Reaction–diffusion theory subsequently inspired broad applications in physicsand chemistry and bridged molecular interactions to morphogenesisand cellular organization in biology1–8. Reaction–diffusion systemsare, however, little understood in the context of a boundary geome-try, which is of particular importance in embryos and cells, wherespatial patterns such as protein gradients are established withintheir envelope to dictate the locations for fundamental cellular pro-cesses such as cell division5,9–11. In this study, we demonstrate howreaction–diffusion patterns of Min proteins can sense and adapt tothe morphological features of bacterial cells, an ability that is essen-tial for spatial regulation for cell division and its robustness againstvariations in cell size and shape12–14.
Min proteins in many bacteria, including rod-shaped Escherichiacoli, exhibit a fascinating phenomenon: they oscillate pole-to-polealong the cell length, resulting in a time-averaged concentrationminimum of division inhibitors at the mid-plane10,11 (Fig. 1b).This oscillatory dynamics is believed to arise autonomously fromthe ability of MinD proteins to cooperatively bind to the cytoplasmicmembrane and the ability of MinE proteins to unbind MinD fromthe membrane15,16 (Fig. 1a), actions that, respectively, exemplify theself-activation and inhibition kinetics of reaction–diffusiontheory3,4,7. The self-organizing nature of dynamic Min patternshas been elegantly demonstrated by travelling waves and oscillationsreconstituted in vitro17–21, albeit exhibiting an approximately tenfoldlarger length scale compared to Min oscillations in vivo due tofactors that remain unclear.
Various spatial cues have been hypothesized to account for theconsistent pole-to-pole orientation of the Min oscillations7,18,19,22–24,including the longest travel distance through the cytosol22 oralong the membrane19, a characteristic polar membrane area18 and
a high membrane curvature at the poles24 (Fig. 1c). Furthermore,it is unclear how Min gradients quantitatively adapt to cell sizevariability and growth. Here, we identify the rules of geometrysensing and scale adaptation by systematically studying thedynamic behaviour of Min proteins in live cells within spatialboundaries across a broad geometric parameter space.
Bacterial cells can be sculpted into defined shapesBacteria maintain their cell shape by a well-regulated process of pep-tidoglycan insertion into the cell wall25. Previous studies have shownthat curved agarose micro-chambers can alter the growth offilamentous cells of E. coli such that they adopt a certain degree ofcurvature26, and that sub-micrometre constraints imposed by siliconslits can induce E. coli to grow into a variety of squeezed shapes27.These methods have been applied to elucidate interesting mechanismsof growth and division in bacteria13,28. The diversity and reproduci-bility of the cell shapes produced by these methods are, however,limited, as wild-type pathways for cell wall synthesis are used.Spheroplasts generated by lysozyme, on the other hand, appear toabolish the dynamic activities of proteins such as Min oscillations24.
For this study, we developed a new ‘cell-sculpting’ method toshape living bacterial cells into user-defined geometries (Fig. 1d).This allowed a quantitative and systematic study on the effect ofshape and scale. Cells were inoculated into nanofabricated poly-dimethylsiloxane (PDMS) chambers with various lateral shapesand a fixed depth of 1.15 ± 0.05 μm (Supplementary Fig. 1). The10-μm-thick layer of PDMS was supported by a thin cover glass formicroscopy, and the microchambers with cells were covered by a5% agarose pad supplemented with growth medium, A22 andcephalexin. A22 inhibits rod-shape maintenance by antagonizingthe dynamics of bacterial actin MreB, which regulates peptidoglycaninsertion patterns. Cephalexin prevents the cell wall constrictionthat would otherwise lead to cell division. Under these growthconditions, E. coli cells exhibit a surprising plasticity, growing into
Department of Bionanoscience, Kavli Institute of Nanoscience, Delft University of Technology, Lorentzweg 1, Delft 2628 CJ, The Netherlands. †Presentaddress: IEB & Department of Ecology, School of Biological Sciences, P. Catholic University, Casilla 114-D, Santiago, Chile. *e-mail: [email protected]
ARTICLESPUBLISHED ONLINE: 22 JUNE 2015 | DOI: 10.1038/NNANO.2015.126
NATURE NANOTECHNOLOGY | ADVANCE ONLINE PUBLICATION | www.nature.com/naturenanotechnology 1
© 2015 Macmillan Publishers Limited. All rights reserved
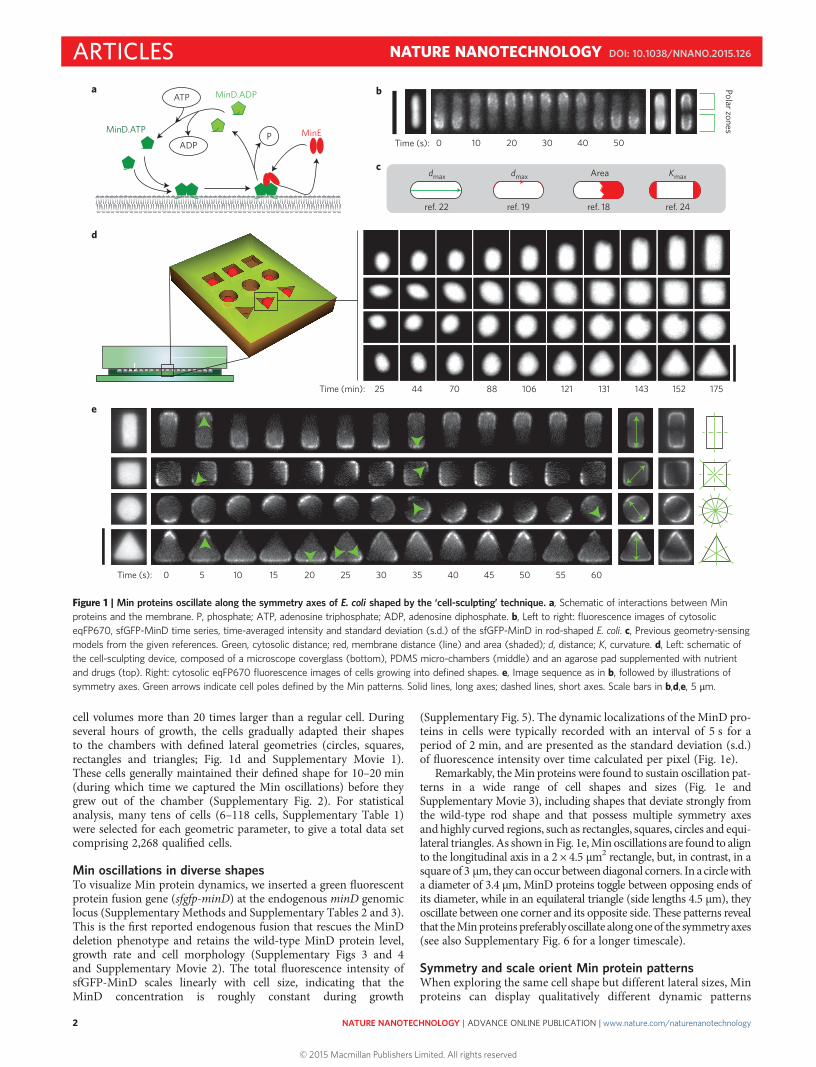
cell volumes more than 20 times larger than a regular cell. Duringseveral hours of growth, the cells gradually adapted their shapesto the chambers with defined lateral geometries (circles, squares,rectangles and triangles; Fig. 1d and Supplementary Movie 1).These cells generally maintained their defined shape for 10–20 min(during which time we captured the Min oscillations) before theygrew out of the chamber (Supplementary Fig. 2). For statisticalanalysis, many tens of cells (6–118 cells, Supplementary Table 1)were selected for each geometric parameter, to give a total data setcomprising 2,268 qualified cells.
Min oscillations in diverse shapesTo visualize Min protein dynamics, we inserted a green fluorescentprotein fusion gene (sfgfp-minD) at the endogenous minD genomiclocus (Supplementary Methods and Supplementary Tables 2 and 3).This is the first reported endogenous fusion that rescues the MinDdeletion phenotype and retains the wild-type MinD protein level,growth rate and cell morphology (Supplementary Figs 3 and 4and Supplementary Movie 2). The total fluorescence intensity ofsfGFP-MinD scales linearly with cell size, indicating that theMinD concentration is roughly constant during growth
(Supplementary Fig. 5). The dynamic localizations of the MinD pro-teins in cells were typically recorded with an interval of 5 s for aperiod of 2 min, and are presented as the standard deviation (s.d.)of fluorescence intensity over time calculated per pixel (Fig. 1e).
Remarkably, theMin proteins were found to sustain oscillation pat-terns in a wide range of cell shapes and sizes (Fig. 1e andSupplementary Movie 3), including shapes that deviate strongly fromthe wild-type rod shape and that possess multiple symmetry axesand highly curved regions, such as rectangles, squares, circles and equi-lateral triangles. As shown in Fig. 1e,Min oscillations are found to alignto the longitudinal axis in a 2 × 4.5 μm2 rectangle, but, in contrast, in asquare of 3 μm, they canoccur betweendiagonal corners. In acirclewitha diameter of 3.4 μm, MinD proteins toggle between opposing ends ofits diameter, while in an equilateral triangle (side lengths 4.5 μm), theyoscillate between one corner and its opposite side. These patterns revealthat theMinproteins preferablyoscillate alongoneof the symmetryaxes(see also Supplementary Fig. 6 for a longer timescale).
Symmetry and scale orient Min protein patternsWhen exploring the same cell shape but different lateral sizes, Minproteins can display qualitatively different dynamic patterns
d
Time (min): 25 44 70 88 106 121 131 143 152 175
Time (s): 0 5 10 15 20 25 30 35 40 45 50 55 60
e
Time (s): 0 10 20 30 40 50
a Polar zones
ref. 24
Kmaxdmax
ref. 19 ref. 18
Areadmax
ref. 22
b
c
MinD.ATP MinEP
ATP
ADP
MinD.ADP
Figure 1 | Min proteins oscillate along the symmetry axes of E. coli shaped by the ‘cell-sculpting’ technique. a, Schematic of interactions between Minproteins and the membrane. P, phosphate; ATP, adenosine triphosphate; ADP, adenosine diphosphate. b, Left to right: fluorescence images of cytosoliceqFP670, sfGFP-MinD time series, time-averaged intensity and standard deviation (s.d.) of the sfGFP-MinD in rod-shaped E. coli. c, Previous geometry-sensingmodels from the given references. Green, cytosolic distance; red, membrane distance (line) and area (shaded); d, distance; K, curvature. d, Left: schematic ofthe cell-sculpting device, composed of a microscope coverglass (bottom), PDMS micro-chambers (middle) and an agarose pad supplemented with nutrientand drugs (top). Right: cytosolic eqFP670 fluorescence images of cells growing into defined shapes. e, Image sequence as in b, followed by illustrations ofsymmetry axes. Green arrows indicate cell poles defined by the Min patterns. Solid lines, long axes; dashed lines, short axes. Scale bars in b,d,e, 5 μm.
ARTICLES NATURE NANOTECHNOLOGY DOI: 10.1038/NNANO.2015.126
NATURE NANOTECHNOLOGY | ADVANCE ONLINE PUBLICATION | www.nature.com/naturenanotechnology2
© 2015 Macmillan Publishers Limited. All rights reserved
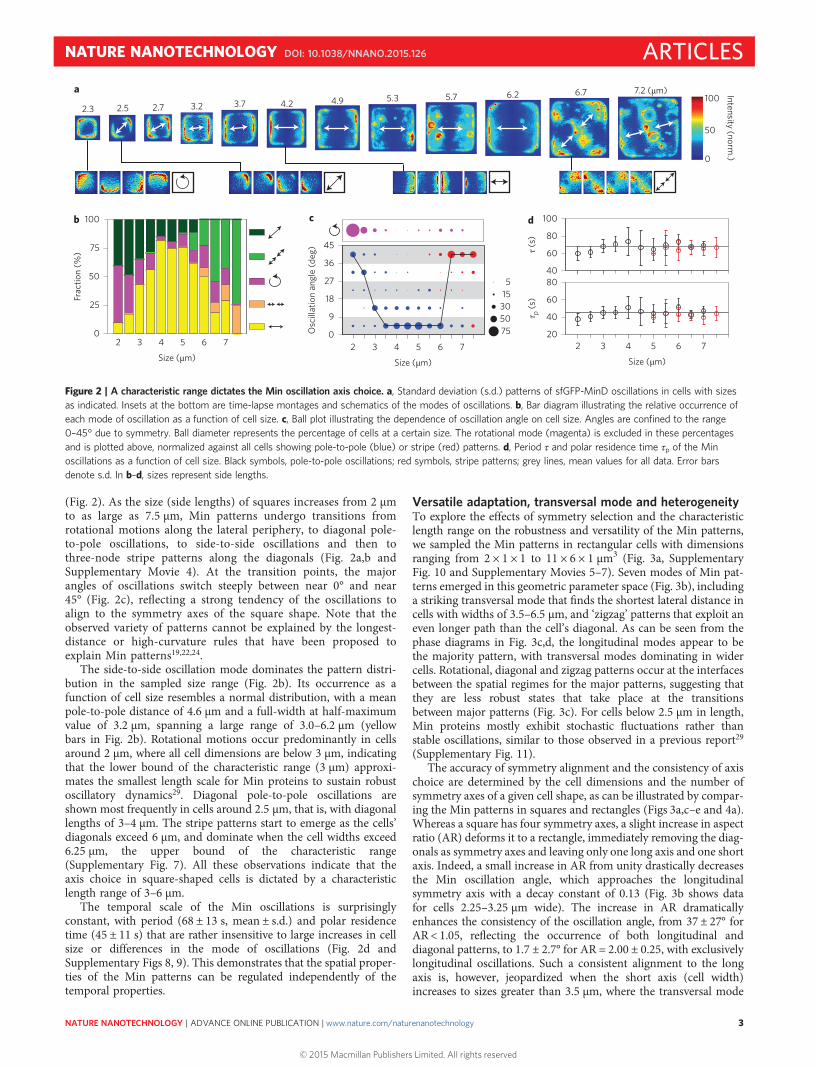
(Fig. 2). As the size (side lengths) of squares increases from 2 μmto as large as 7.5 μm, Min patterns undergo transitions fromrotational motions along the lateral periphery, to diagonal pole-to-pole oscillations, to side-to-side oscillations and then tothree-node stripe patterns along the diagonals (Fig. 2a,b andSupplementary Movie 4). At the transition points, the majorangles of oscillations switch steeply between near 0° and near45° (Fig. 2c), reflecting a strong tendency of the oscillations toalign to the symmetry axes of the square shape. Note that theobserved variety of patterns cannot be explained by the longest-distance or high-curvature rules that have been proposed toexplain Min patterns19,22,24.
The side-to-side oscillation mode dominates the pattern distri-bution in the sampled size range (Fig. 2b). Its occurrence as afunction of cell size resembles a normal distribution, with a meanpole-to-pole distance of 4.6 μm and a full-width at half-maximumvalue of 3.2 μm, spanning a large range of 3.0–6.2 μm (yellowbars in Fig. 2b). Rotational motions occur predominantly in cellsaround 2 μm, where all cell dimensions are below 3 μm, indicatingthat the lower bound of the characteristic range (3 μm) approxi-mates the smallest length scale for Min proteins to sustain robustoscillatory dynamics29. Diagonal pole-to-pole oscillations areshown most frequently in cells around 2.5 μm, that is, with diagonallengths of 3–4 μm. The stripe patterns start to emerge as the cells’diagonals exceed 6 μm, and dominate when the cell widths exceed6.25 μm, the upper bound of the characteristic range(Supplementary Fig. 7). All these observations indicate that theaxis choice in square-shaped cells is dictated by a characteristiclength range of 3–6 μm.
The temporal scale of the Min oscillations is surprisinglyconstant, with period (68 ± 13 s, mean ± s.d.) and polar residencetime (45 ± 11 s) that are rather insensitive to large increases in cellsize or differences in the mode of oscillations (Fig. 2d andSupplementary Figs 8, 9). This demonstrates that the spatial proper-ties of the Min patterns can be regulated independently of thetemporal properties.
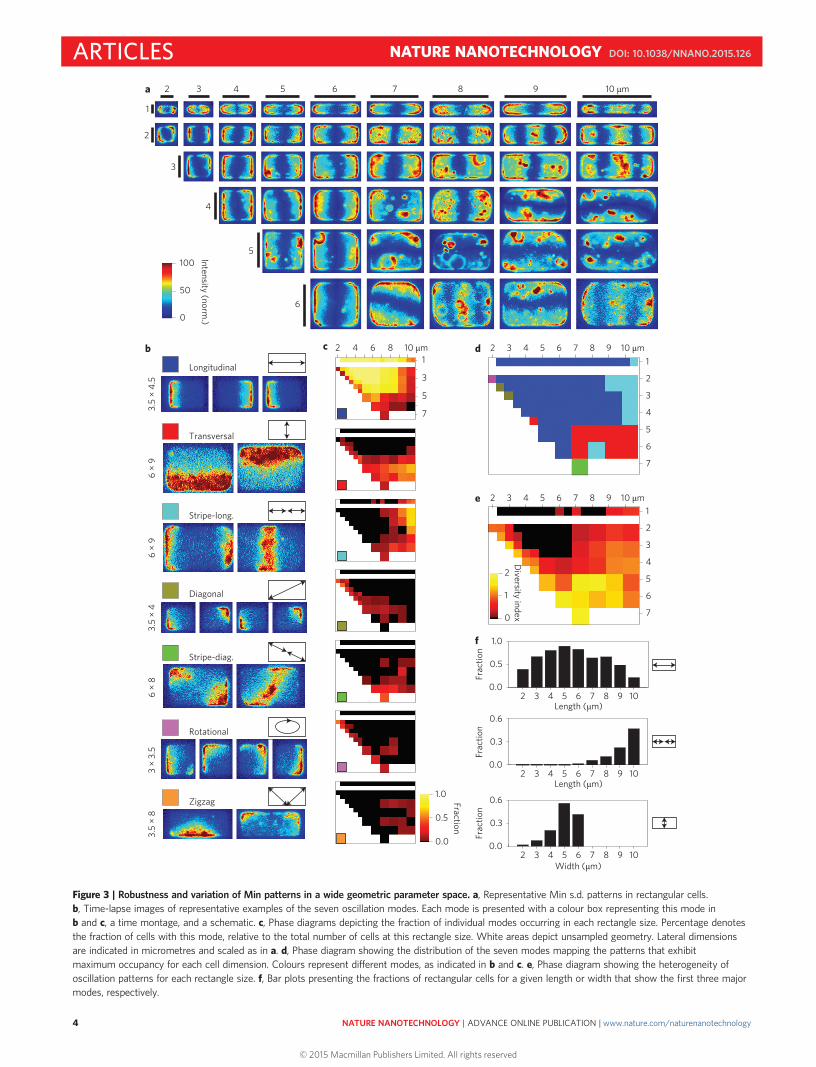
Versatile adaptation, transversal mode and heterogeneityTo explore the effects of symmetry selection and the characteristiclength range on the robustness and versatility of the Min patterns,we sampled the Min patterns in rectangular cells with dimensionsranging from 2 × 1 × 1 to 11 × 6 × 1 μm3 (Fig. 3a, SupplementaryFig. 10 and Supplementary Movies 5–7). Seven modes of Min pat-terns emerged in this geometric parameter space (Fig. 3b), includinga striking transversal mode that finds the shortest lateral distance incells with widths of 3.5–6.5 μm, and ‘zigzag’ patterns that exploit aneven longer path than the cell’s diagonal. As can be seen from thephase diagrams in Fig. 3c,d, the longitudinal modes appear to bethe majority pattern, with transversal modes dominating in widercells. Rotational, diagonal and zigzag patterns occur at the interfacesbetween the spatial regimes for the major patterns, suggesting thatthey are less robust states that take place at the transitionsbetween major patterns (Fig. 3c). For cells below 2.5 μm in length,Min proteins mostly exhibit stochastic fluctuations rather thanstable oscillations, similar to those observed in a previous report29
(Supplementary Fig. 11).The accuracy of symmetry alignment and the consistency of axis
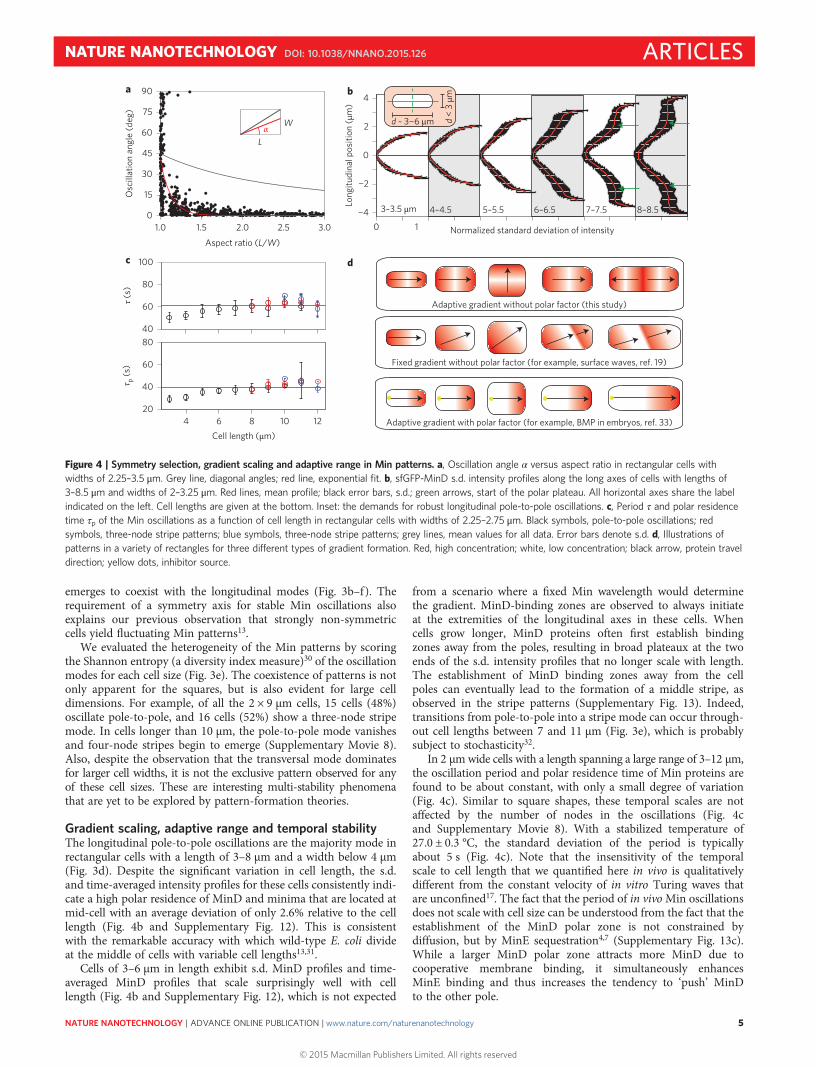
choice are determined by the cell dimensions and the number ofsymmetry axes of a given cell shape, as can be illustrated by compar-ing the Min patterns in squares and rectangles (Figs 3a,c–e and 4a).Whereas a square has four symmetry axes, a slight increase in aspectratio (AR) deforms it to a rectangle, immediately removing the diag-onals as symmetry axes and leaving only one long axis and one shortaxis. Indeed, a small increase in AR from unity drastically decreasesthe Min oscillation angle, which approaches the longitudinalsymmetry axis with a decay constant of 0.13 (Fig. 3b shows datafor cells 2.25–3.25 μm wide). The increase in AR dramaticallyenhances the consistency of the oscillation angle, from 37 ± 27° forAR < 1.05, reflecting the occurrence of both longitudinal anddiagonal patterns, to 1.7 ± 2.7° for AR = 2.00 ± 0.25, with exclusivelylongitudinal oscillations. Such a consistent alignment to the longaxis is, however, jeopardized when the short axis (cell width)increases to sizes greater than 3.5 μm, where the transversal mode
Intensity (norm.)0
50
100a
cb d
Size (μm)
2.3 3.2 3.7 4.2 4.9 5.3 5.7 6.2 6.7 7.2 (μm)
100
75
50
25
0
Frac
tion
(%)
0
9
18
27
36
45
515
305075O
scill
atio
n an
gle
(deg
)
Size (μm)
2 3 4 5 6 72 3 4 5 6 7Size (μm)
2 3 4 5 6 720
40
60
80
τ p (s
)
2.5 2.7
τ (s)
40
60
80
100
Figure 2 | A characteristic range dictates the Min oscillation axis choice. a, Standard deviation (s.d.) patterns of sfGFP-MinD oscillations in cells with sizesas indicated. Insets at the bottom are time-lapse montages and schematics of the modes of oscillations. b, Bar diagram illustrating the relative occurrence ofeach mode of oscillation as a function of cell size. c, Ball plot illustrating the dependence of oscillation angle on cell size. Angles are confined to the range0–45° due to symmetry. Ball diameter represents the percentage of cells at a certain size. The rotational mode (magenta) is excluded in these percentagesand is plotted above, normalized against all cells showing pole-to-pole (blue) or stripe (red) patterns. d, Period τ and polar residence time τp of the Minoscillations as a function of cell size. Black symbols, pole-to-pole oscillations; red symbols, stripe patterns; grey lines, mean values for all data. Error barsdenote s.d. In b–d, sizes represent side lengths.
NATURE NANOTECHNOLOGY DOI: 10.1038/NNANO.2015.126 ARTICLES
NATURE NANOTECHNOLOGY | ADVANCE ONLINE PUBLICATION | www.nature.com/naturenanotechnology 3
© 2015 Macmillan Publishers Limited. All rights reserved
2 3 4 5 6 7 8 9 10 μm
2
3
4
5
6
1
a
b d
f
0.0
1.0
0.5
0
50
100
2 4 6 8 103 5 7 9
Frac
tion
Frac
tion
Frac
tion
Intensity (norm.)
6 ×
96
× 9
3.5
× 4.
5 3
.5 ×
8
3 ×
3.5
6 ×
8 3.
5 ×
4
Longitudinal
Transversal
Stripe-long.
Diagonal
Stripe-diag.
Rotational
Zigzag
c 2 4 6 8 10 μm
3
5
1
7
2 3 4 5 6 7 8 9 10 μm
2
3
4
5
6
7
1
2 3 4 5 6 7 8 9 10 μm
2
3
4
5
6
7
1e
0
2
1
Fraction
Diversity index
0.0
0.5
1.0
0.0
0.3
0.6
0.0
0.3
0.6
Length (μm)
2 4 6 8 103 5 7 9Length (μm)
2 4 6 8 103 5 7 9Width (μm)
Figure 3 | Robustness and variation of Min patterns in a wide geometric parameter space. a, Representative Min s.d. patterns in rectangular cells.b, Time-lapse images of representative examples of the seven oscillation modes. Each mode is presented with a colour box representing this mode inb and c, a time montage, and a schematic. c, Phase diagrams depicting the fraction of individual modes occurring in each rectangle size. Percentage denotesthe fraction of cells with this mode, relative to the total number of cells at this rectangle size. White areas depict unsampled geometry. Lateral dimensionsare indicated in micrometres and scaled as in a. d, Phase diagram showing the distribution of the seven modes mapping the patterns that exhibitmaximum occupancy for each cell dimension. Colours represent different modes, as indicated in b and c. e, Phase diagram showing the heterogeneity ofoscillation patterns for each rectangle size. f, Bar plots presenting the fractions of rectangular cells for a given length or width that show the first three majormodes, respectively.
ARTICLES NATURE NANOTECHNOLOGY DOI: 10.1038/NNANO.2015.126
NATURE NANOTECHNOLOGY | ADVANCE ONLINE PUBLICATION | www.nature.com/naturenanotechnology4
© 2015 Macmillan Publishers Limited. All rights reserved
emerges to coexist with the longitudinal modes (Fig. 3b–f ). Therequirement of a symmetry axis for stable Min oscillations alsoexplains our previous observation that strongly non-symmetriccells yield fluctuating Min patterns13.
We evaluated the heterogeneity of the Min patterns by scoringthe Shannon entropy (a diversity index measure)30 of the oscillationmodes for each cell size (Fig. 3e). The coexistence of patterns is notonly apparent for the squares, but is also evident for large celldimensions. For example, of all the 2 × 9 μm cells, 15 cells (48%)oscillate pole-to-pole, and 16 cells (52%) show a three-node stripemode. In cells longer than 10 μm, the pole-to-pole mode vanishesand four-node stripes begin to emerge (Supplementary Movie 8).Also, despite the observation that the transversal mode dominatesfor larger cell widths, it is not the exclusive pattern observed for anyof these cell sizes. These are interesting multi-stability phenomenathat are yet to be explored by pattern-formation theories.
Gradient scaling, adaptive range and temporal stabilityThe longitudinal pole-to-pole oscillations are the majority mode inrectangular cells with a length of 3–8 μm and a width below 4 μm(Fig. 3d). Despite the significant variation in cell length, the s.d.and time-averaged intensity profiles for these cells consistently indi-cate a high polar residence of MinD and minima that are located atmid-cell with an average deviation of only 2.6% relative to the celllength (Fig. 4b and Supplementary Fig. 12). This is consistentwith the remarkable accuracy with which wild-type E. coli divideat the middle of cells with variable cell lengths13,31.
Cells of 3–6 μm in length exhibit s.d. MinD profiles and time-averaged MinD profiles that scale surprisingly well with celllength (Fig. 4b and Supplementary Fig. 12), which is not expected
from a scenario where a fixed Min wavelength would determinethe gradient. MinD-binding zones are observed to always initiateat the extremities of the longitudinal axes in these cells. Whencells grow longer, MinD proteins often first establish bindingzones away from the poles, resulting in broad plateaux at the twoends of the s.d. intensity profiles that no longer scale with length.The establishment of MinD binding zones away from the cellpoles can eventually lead to the formation of a middle stripe, asobserved in the stripe patterns (Supplementary Fig. 13). Indeed,transitions from pole-to-pole into a stripe mode can occur through-out cell lengths between 7 and 11 μm (Fig. 3e), which is probablysubject to stochasticity32.
In 2 μmwide cells with a length spanning a large range of 3–12 μm,the oscillation period and polar residence time of Min proteins arefound to be about constant, with only a small degree of variation(Fig. 4c). Similar to square shapes, these temporal scales are notaffected by the number of nodes in the oscillations (Fig. 4cand Supplementary Movie 8). With a stabilized temperature of27.0 ± 0.3 °C, the standard deviation of the period is typicallyabout 5 s (Fig. 4c). Note that the insensitivity of the temporalscale to cell length that we quantified here in vivo is qualitativelydifferent from the constant velocity of in vitro Turing waves thatare unconfined17. The fact that the period of in vivoMin oscillationsdoes not scale with cell size can be understood from the fact that theestablishment of the MinD polar zone is not constrained bydiffusion, but by MinE sequestration4,7 (Supplementary Fig. 13c).While a larger MinD polar zone attracts more MinD due tocooperative membrane binding, it simultaneously enhancesMinE binding and thus increases the tendency to ‘push’ MinDto the other pole.
Osc
illat
ion
angl
e (d
eg)
a
d
b
1.0 1.5 2.0 2.5 3.00
15
30
45
60
75
90
Aspect ratio (L/W)
L
Wα
c
Normalized standard deviation of intensity0 1
Long
itudi
nal p
ositi
on (μ
m)
0
2
4
−2
−4
Fixed gradient without polar factor (for example, surface waves, ref. 19)
Adaptive gradient without polar factor (this study)
3–3.5 μm 4–4.5 5–5.5 6–6.5 7–7.5 8–8.5
Adaptive gradient with polar factor (for example, BMP in embryos, ref. 33)
d ~ 3−6 μm d <
3 μm
4 6 8 10 1220
40
60
8040
60
80
100
Cell length (μm)
τ p (s
)τ (
s)
Figure 4 | Symmetry selection, gradient scaling and adaptive range in Min patterns. a, Oscillation angle α versus aspect ratio in rectangular cells withwidths of 2.25–3.5 μm. Grey line, diagonal angles; red line, exponential fit. b, sfGFP-MinD s.d. intensity profiles along the long axes of cells with lengths of3–8.5 μm and widths of 2–3.25 μm. Red lines, mean profile; black error bars, s.d.; green arrows, start of the polar plateau. All horizontal axes share the labelindicated on the left. Cell lengths are given at the bottom. Inset: the demands for robust longitudinal pole-to-pole oscillations. c, Period τ and polar residencetime τp of the Min oscillations as a function of cell length in rectangular cells with widths of 2.25–2.75 μm. Black symbols, pole-to-pole oscillations; redsymbols, three-node stripe patterns; blue symbols, three-node stripe patterns; grey lines, mean values for all data. Error bars denote s.d. d, Illustrations ofpatterns in a variety of rectangles for three different types of gradient formation. Red, high concentration; white, low concentration; black arrow, protein traveldirection; yellow dots, inhibitor source.
NATURE NANOTECHNOLOGY DOI: 10.1038/NNANO.2015.126 ARTICLES
NATURE NANOTECHNOLOGY | ADVANCE ONLINE PUBLICATION | www.nature.com/naturenanotechnology 5
© 2015 Macmillan Publishers Limited. All rights reserved
What underlies the symmetry alignment and adaptive scaling ofthe Min protein patterns? These features have not been examined inprevious Turing-type models, which generally exhibit a fixed wave-length1–3,6,17,19. To achieve symmetry alignment, spatial confine-ment seems required, as in vitro Min surface waves travel alongthe diagonals of rectangular lipid patches19, and are apparentlyinsensitive to the symmetry axes (Fig. 4d, middle panel).Interestingly, recent in vitro work on Min proteins in partly con-fined microwells also showed transversal oscillations20, althoughwith a different length scale and with different pattern dynamicscompared to the in vivo behaviour observed here. The adaptiverange could potentially be assisted by extra chemical or mechanicalcues18,24, but such scenarios do not fit our data quantitatively(Supplementary Discussion and Supplementary Fig. 14).Mechanisms proposed for pattern scaling in developing embryosrely on production-degradation feedbacks, active transport ofmorphogen ligands by a polarized source of inhibitors (Fig. 4d,bottom panel) or the physiological state of cells in tissues, whichdo not apply to our intracellular scenario33–36. With currentexplanations lacking, we thus ask whether symmetry alignment
and adaptive scaling are features that are yet to be uncoveredfrom the Min reaction–diffusion mechanism.
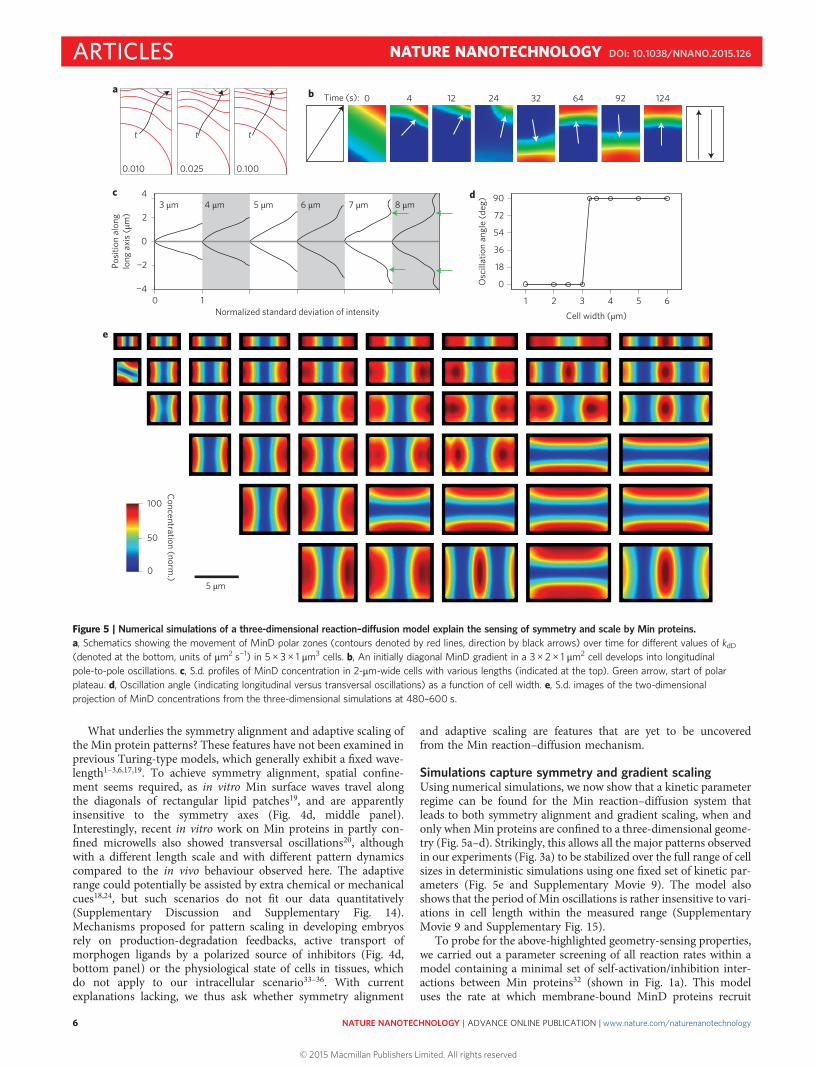
Simulations capture symmetry and gradient scalingUsing numerical simulations, we now show that a kinetic parameterregime can be found for the Min reaction–diffusion system thatleads to both symmetry alignment and gradient scaling, when andonly whenMin proteins are confined to a three-dimensional geome-try (Fig. 5a–d). Strikingly, this allows all the major patterns observedin our experiments (Fig. 3a) to be stabilized over the full range of cellsizes in deterministic simulations using one fixed set of kinetic par-ameters (Fig. 5e and Supplementary Movie 9). The model alsoshows that the period of Min oscillations is rather insensitive to vari-ations in cell length within the measured range (SupplementaryMovie 9 and Supplementary Fig. 15).
To probe for the above-highlighted geometry-sensing properties,we carried out a parameter screening of all reaction rates within amodel containing a minimal set of self-activation/inhibition inter-actions between Min proteins32 (shown in Fig. 1a). This modeluses the rate at which membrane-bound MinD proteins recruit
a
e
5 μm 0
50
100
Concentration (norm.)
0.010
t
0.025
t
0.100
t
0
4 μm 5 μm 6 μm 7 μm 8 μm
4 12 24 32 64 92 124Time (s):b
c
Normalized standard deviation of intensity0 1
Posit
ion
alon
glo
ng a
xis (
μm)
0
2
4
−2
−4
3 μmd
1 2 3 4 5 6
0
18
36
54
72
90
Cell width (μm)
Osc
illat
ion
angl
e (d
eg)
Figure 5 | Numerical simulations of a three-dimensional reaction–diffusion model explain the sensing of symmetry and scale by Min proteins.a, Schematics showing the movement of MinD polar zones (contours denoted by red lines, direction by black arrows) over time for different values of kdD(denoted at the bottom, units of μm2 s−1) in 5 × 3 × 1 μm3 cells. b, An initially diagonal MinD gradient in a 3 × 2 × 1 μm2 cell develops into longitudinalpole-to-pole oscillations. c, S.d. profiles of MinD concentration in 2-μm-wide cells with various lengths (indicated at the top). Green arrow, start of polarplateau. d, Oscillation angle (indicating longitudinal versus transversal oscillations) as a function of cell width. e, S.d. images of the two-dimensionalprojection of MinD concentrations from the three-dimensional simulations at 480–600 s.
ARTICLES NATURE NANOTECHNOLOGY DOI: 10.1038/NNANO.2015.126
NATURE NANOTECHNOLOGY | ADVANCE ONLINE PUBLICATION | www.nature.com/naturenanotechnology6
© 2015 Macmillan Publishers Limited. All rights reserved
cytosolic MinD to constrain the strength of polar-zone binding,a finite ADP–ATP nucleotide exchange rate of MinD to delayreattachment4 and sequestering of the polar MinD by MinE thatallows the detached MinD to escape and reattach to the membraneat a distance7,37. Parameter constraints for this model that led torobust oscillatory behaviour were previously determined byHalatek and Frey using two-dimensional elliptic geometries7.
To explore the microscopic origin of the symmetry selection, wecarried out simulations starting from an asymmetric MinD polarzone (Fig. 5a and Supplementary Movie 10). We found that theorientation of polar zone development is most affected by theMinD self-recruitment rate (kdD). With a sufficiently high kdD, aninitial diagonal MinD gradient (for example, in a 3 × 2 × 1 μm3
rectangle) is found to rapidly align to the longitudinal axis within afew pole-to-pole oscillation cycles (Fig. 5b, Supplementary Fig. 16and Supplementary Movies 11 and 12), whereas lowering the kdDleads to a higher stability for diagonal, non-symmetric oscillationsin this rectangular shape (Supplementary Fig. 16). Importantly,symmetry selection is only achieved through oscillations in athree-dimensionally confined volume, thus explaining the lack ofsymmetry in unconfined two-dimensional surface waves19.
Gradient scaling of longitudinal oscillations in 3- to 6-μm-longcells is determined by multiple kinetic parameters (includingkdD = 0.05 μm2 s–1). Importantly, fitting the 3–6 μm scaling rangesimultaneously yields transversal oscillations in cells wider than3 μm and sustainable longitudinal stripes in cells longer than 6 μm(Fig. 5c,d). The presence of a finite scaling range requires kdDto be within a quite narrow window of 0.03–0.10 μm2 s–1. ForkdD < 0.03 μm2 s–1, polar plateaux do not appear in the s.d. gradientsfor cells of any lengths, whereas for kdD > 0.10 μm2 s–1, the gradientsdo not scale. A previous theoretical suggestion7 that transitions frompole-to-pole into stripes are not robust for kdD below 0.10 μm2 s–1
is in line with our experimental observation of a variable length(7–11 μm) where such transitions happen (Fig. 3f ). Altogether,the analyses indicate that transitions between oscillation modesare intrinsically coupled to the scaling property of the concentrationgradients. In future work, our deterministic simulations can beextended to analyse the robustness and heterogeneity of patternsagainst internal and external fluctuations32,38 and to unravel therole ofmore detailedmolecular interactions such as a conformationalswitch and membrane binding of MinE39,40.
ConclusionsTaken together, the key mechanism revealed by our experiments isthat Min proteins orient their oscillation patterns by sensing boththe symmetry and scale of the cellular geometry. We find thatMin proteins explore cellular space to select the symmetry axes ina given geometry, while the characteristic length range of 3–6 μmfurther restricts the choice among these axes (Fig. 4a,b,d). Thisrange is defined by the lengths to which Min proteins can scaletheir concentration gradients. Notably, 3–6 μm coincides with thelengths of wild-type E. coli cells undergoing cytokinesis, indicatingan evolved optimality of Min system in adaptation to the size ofE. coli. As it is essential for the binary fission process to distributethe cellular material equally to its progeny, the sensing of both sym-metry and scale by the Min proteins are indispensible for their roleas a spatial regulator for cell division. The diverse patterns uncov-ered in our study provide valuable insight on how Min homologuesadapt to bacteria with diverse morphologies and modes of div-ision41,42. For example, the transversal mode may well be orche-strated by Min homologues found in γ-proteobacterial symbiontsthat divide along their long axis41.
Our numerical simulations revealed that the symmetry selectionand characteristic length range both derive from the self-activation/inhibition kinetics responsible for the oscillatory dynamics of Minproteins in the three-dimensional confinement of a cell. This type
of microscopic interaction has been found to underlie a broadspectrum of Turing reaction–diffusion patterns, includingintracellular polar protein networks and actin waves in eukaryoticcells5,43,44, suggesting that the ability to sense global features ofbiological boundaries may be intrinsic tomany spatial patterns in cells.
The bacterial cell sculpting reported here reveals that spatialboundaries can facilitate simple molecular interactions and result infar more versatile functions than previously understood. We expectthat it can also be applied to unravel the fundamental mechanismsof intracellular spatial organization, including protein/RNA/lipidlocalization, cytoskeletal dynamics and chromosome organization45.
MethodsMethods and any associated references are available in the onlineversion of the paper.
Received 3 November 2014; accepted 19 May 2015;published online 22 June 2015; corrected online 25 June 2015
References1. Turing, A. M. The chemical basis of morphogenesis. Phil. Trans. R. Soc. Lond. B
237, 37–72 (1952).2. Gierer, A. & Meinhardt, H. A theory of biological pattern formation. Kybernetik
12, 30–39 (1972).3. Meinhardt, H. & de Boer, P. A. J. Pattern formation in Escherichia coli: a model
for the pole-to-pole oscillations of Min proteins and the localization of thedivision site. Proc. Natl Acad. Sci. USA 98, 14202–14207 (2001).
4. Huang, K. C., Meir, Y. &Wingreen, N. S. Dynamic structures in Escherichia coli:spontaneous formation of MinE rings and MinD polar zones. Proc. Natl Acad.Sci. USA 100, 12724–12728 (2003).
5. Goryachev, A. B. & Pokhilko, A. V. Dynamics of Cdc42 network embodies aTuring-type mechanism of yeast cell polarity. FEBS Lett. 582, 1437–1443 (2008).
6. Kondo, S. & Miura, T. Reaction-diffusion model as a framework forunderstanding biological pattern formation. Science 329, 1616–1620 (2010).
7. Halatek, J. & Frey, E. Highly canalized MinD transfer and MinE sequestrationexplain the rigin of robust MinCDE-protein dynamics. Cell Rep. 1,741–752 (2012).
8. Noorduin, W. L., Grinthal, A., Mahadevan, L. & Aizenberg, J. Rationallydesigned complex, hierarchical microarchitectures. Science 340, 832–837 (2013).
9. Moseley, J. B. & Nurse, P. Cell division intersects with cell geometry. Cell 142,184–188 (2010).
10. Raskin, D. M. & de Boer, P. A. J. Rapid pole-to-pole oscillation of a proteinrequired for directing division to the middle of Escherichia coli. Proc. Natl Acad.Sci. USA 96, 4971–4976 (1999).
11. Hu, Z. & Lutkenhaus, J. Topological regulation of cell division in Escherichia coliinvolves rapid pole to pole oscillation of the division inhibitor MinC under thecontrol of MinD and MinE. Mol. Microbiol. 34, 82–90 (1999).
12. Ben-Jacob, E. Bacterial self-organization: co-enhancement of complexificationand adaptability in a dynamic environment. Phil. Trans. R. Soc. Lond. A 361,1283–1312 (2003).
13. Männik, J. et al. Robustness and accuracy of cell division in Escherichia coli indiverse cell shapes. Proc. Natl Acad. Sci. USA 109, 6957–6962 (2012).
14. Young, K. D. The selective value of bacterial shape.Microbiol. Mol. Biol. Rev. 70,660–703 (2006).
15. Hu, Z. & Lutkenhaus, J. Topological regulation of cell division in E. coli:spatiotemporal oscillation of MinD requires stimulation of its ATPase byMinE and phospholipid. Mol. Cell 7, 1337–1343 (2001).
16. Lackner, L. L., Raskin, D. M. & de Boer, P. A. J. ATP-dependent interactionsbetween Escherichia coli Min proteins and the phospholipid membrane in vitro.J. Bacteriol. 185, 735–749 (2003).
17. Loose, M., Fischer-Friedrich, E., Ries, J., Kruse, K. & Schwille, P. Spatialregulators for bacterial cell division self-organize into surface waves in vitro.Science 320, 789–792 (2008).
18. Ivanov, V. & Mizuuchi, K. Multiple modes of interconverting dynamic patternformation by bacterial cell division proteins. Proc. Natl Acad. Sci. USA 107,8071–8078 (2010).
19. Schweizer, J. et al. Geometry sensing by self-organized protein patterns. Proc.Natl Acad. Sci. USA 109, 15283–15288 (2012).
20. Zieske, K. & Schwille, P. Reconstitution of self-organizing protein gradients asspatial cues in cell-free systems. eLife 3, e03949 (2014).
21. Vecchiarelli, A. G., Li, M., Mizuuchi, M. & Mizuuchi, K. Differential affinities ofMinD and MinE to anionic phospholipid influence Min patterning dynamics invitro. Mol. Microbiol. 93, 453–463 (2014).
22. Corbin, B. D., Yu, X-C. & Margolin, W. Exploring intracellular space:function of the Min system in round-shaped Escherichia coli. EMBO J. 21,1998–2008 (2002).
NATURE NANOTECHNOLOGY DOI: 10.1038/NNANO.2015.126 ARTICLES
NATURE NANOTECHNOLOGY | ADVANCE ONLINE PUBLICATION | www.nature.com/naturenanotechnology 7
© 2015 Macmillan Publishers Limited. All rights reserved
23. Varma, A., Huang, K. C. & Young, K. D. The Min system as a general cellgeometry detection mechanism: branch lengths in Y-shaped Escherichia colicells affect Min oscillation patterns and division dynamics. J. Bacteriol. 190,2106–2117 (2008).
24. Renner, L. D. & Weibel, D. B. Cardiolipin microdomains localize to negativelycurved regions of Escherichia coli membranes. Proc. Natl Acad. Sci. USA 108,6264–6269 (2011).
25. Typas, A., Banzhaf, M., Gross, C. A. & Vollmer, W. From the regulation ofpeptidoglycan synthesis to bacterial growth and morphology. Nature Rev.Microbiol. 10, 123–136 (2012).
26. Takeuchi, S., DiLuzio, W. R., Weibel, D. B. & Whitesides, G. M. Controlling theshape of filamentous cells of Escherichia coli. Nano Lett. 5, 1819–1823 (2005).
27. Männik, J., Driessen, R., Galajda, P., Keymer, J. E. & Dekker, C. Bacterial growthand motility in sub-micron constrictions. Proc. Natl Acad. Sci. USA 106,14861–14866 (2009).
28. Cabeen, M. T. et al. Bacterial cell curvature through mechanical control of cellgrowth. EMBO J. 28, 1208–1219 (2009).
29. Fischer-Friedrich, E., Meacci, G., Lutkenhaus, J., Chaté, H. & Kruse, K.Intra- and intercellular fluctuations in Min-protein dynamics decrease withcell length. Proc. Natl Acad. Sci. USA 107, 6134–6139 (2010).
30. Shannon, C. E. A mathematical theory of communication. Bell Syst. Tech. J. 27,379–423 (1948).
31. Yu, X-C. & Margolin, W. FtsZ ring clusters in min and partition mutants: role ofboth the Min system and the nucleoid in regulating FtsZ ring localization. Mol.Microbiol. 32, 315–326 (1999).
32. Fange, D. & Elf, J. Noise-induced Min phenotypes in E. coli. PLoS Comput. Biol.2, e80 (2006).
33. Ben-Zvi, D., Shilo, B-Z., Fainsod, A. & Barkai, N. Scaling of the BMP activationgradient in Xenopus embryos. Nature 453, 1205–1211 (2008).
34. Ben-Zvi, D. & Barkai, N. Scaling of morphogen gradients by an expansion-repression integral feedback control. Proc. Natl Acad. Sci. USA 107,6924–6929 (2010).
35. Lauschke, V. M., Tsiairis, C. D., Francois, P. & Aulehla, A. Scaling ofembryonic patterning based on phase-gradient encoding. Nature 493,101–105 (2013).
36. Averbukh, I., Ben-Zvi, D., Mishra, S. & Barkai, N. Scaling morphogengradients during tissue growth by a cell division rule. Development 141,2150–2156 (2014).
37. Loose, M., Fischer-Friedrich, E., Herold, C., Kruse, K. & Schwille, P. Min proteinpatterns emerge from rapid rebinding and membrane interaction of MinE.Nature Struct. Mol. Biol. 18, 577–583 (2011).
38. Hoffmann, M. & Schwarz, U. S. Oscillations of Min-proteins in micropatternedenvironments: a three-dimensional particle-based stochastic simulationapproach. Soft Matter 10, 2388–2396 (2014).
39. Hsieh, C-W. et al. Direct MinE–membrane interaction contributes to the properlocalization of MinDE in E. coli. Mol. Microbiol. 75, 499–512 (2010).
40. Park, K-T. et al. The Min oscillator uses MinD-dependent conformationalchanges in MinE to spatially regulate cytokinesis. Cell 146, 396–407 (2011).
41. Leisch, N. et al. Growth in width and FtsZ ring longitudinal positioning in agammaproteobacterial symbiont. Curr. Biol. 22, R831–R832 (2012).
42. Pende, N. et al. Size-independent symmetric division in extraordinarily longcells. Nature Commun. 5, 4803 (2014).
43. Vicker, M. G. F-actin assembly in Dictyostelium cell locomotion and shapeoscillations propagates as a self-organized reaction-diffusion wave. FEBS Lett.510, 5–9 (2002).
44. Chau, A. H., Walter, J. M., Gerardin, J., Tang, C. & Lim, W. A. Designingsynthetic regulatory networks capable of self-organizing cell polarization. Cell151, 320–332 (2012).
45. Shapiro, L., McAdams, H. H. & Losick, R. Why and how bacteria localizeproteins. Science 326, 1225–1228 (2009).
AcknowledgementsThe authors thank E. van Rijn, D. de Graaff, W. Postek, J. van der Does, J. Kerssenmakersand Z. Huang for technical assistance, Y. Caspi, Y-L. Shih, A. Lindert, L. Rothfield,A. Meyer and C. Plesa for materials, E. Frey and J. Halatek for discussions on their model,C. Danelon and F. Hol for discussions, and the CSHL Computational Cell Biology SummerSchool and VirtualCell (NIH grant P41-GM103313). This work was partly supportedby the Netherlands Organisation for Scientific Research (NWO/OCW) as part of theFrontiers of Nanoscience programme, NanoNextNL programme 3B (F.W.) and EuropeanResearch Council NanoforBio no. 247072 (C.D.).
Author contributionsF.W., J.E.K. and C.D. conceived the experiments, discussed the work and wrote the paper.F.W. and B.v.S performed the experiments. F.W. analysed the data, derived themechanismsand carried out computer simulations.
Additional informationSupplementary information is available in the online version of the paper. Reprints andpermissions information is available online at www.nature.com/reprints. Correspondence andrequests for materials should be addressed to C.D.
Competing financial interestsThe authors declare no competing financial interests.
ARTICLES NATURE NANOTECHNOLOGY DOI: 10.1038/NNANO.2015.126
NATURE NANOTECHNOLOGY | ADVANCE ONLINE PUBLICATION | www.nature.com/naturenanotechnology8
© 2015 Macmillan Publishers Limited. All rights reserved
MethodsMask nanofabrication. A silicon wafer (universitywafer.com) was spin-coated withresist NEB-22 (Sumitomo Chemical)46. Predesigned features were patterned throughan electron-beam lithography system (Leica EBPG 5000+) with a beam step size of20 nm. The exposed resist was removed by solvent Microposit MF-322 solution(Rohm and Haas) and the exposed wafer surface was etched using an AMS BoschEtcher. The remaining resist was removed using oxygen plasma.
PDMS microchamber patterning. The patterned silicon wafer was silanized bytridecafluoro-1,1,2,2-tetrahydroocytaltrichloro-silane (97%, ABCR), and used as amold for creating microchambers. A 5-μl mixture of Sylgard elastomer 184 (base-to-curing agent ratio 5:1) was applied onto the microstructures of the siliconsurface and subsequently covered with a clean microscope coverglass (thickness0.13–0.17 µm) to spread the mixture throughout the area of the glass. The waferattached to the coverglass was baked in an oven at 70 °C for 3 hours until the solventwas fully evaporated, which resulted in a ∼10-μm-thick layer of polydimethylsiloxane(PDMS) between the coverglass and the silicon substrate. The coverglass with thepatterned PDMS layer was subsequently recovered from the silicon wafer. Forinspection under a scanning electron microscope (Phillips XL 30), the resultingsilicon mold and PDMS structures were deposited with 10-nm-thick gold using aTemescal deposition system.
Cell-sculpting technique. An E. coli bacterial culture incubated overnight at30 °C was back-diluted to OD600 = 0.02 in fresh M9 medium supplemented with4 µM A22 (Merk Chemicals), and incubated for 3.5 hours at 30 °C. 1 µl of thebacterial culture was then pipetted onto the PDMS chambers on a coverglass thatwas clamped onto a custom-made baseplate. The droplet was then immediatelycovered by a 4.8% agarose pad containing M9 broth, 0.4% glucose, 0.25% proteinhydrolysate amicase, 4 µM A22 and 25 µg ml−1 cephalexin (Sigma-Aldrich). A thinpiece of tissue wetted with water was placed above the device to keep the humidity ata high level, and a piece of stretched parafilm was used to enclose the device toprevent drying but allow air exchange. The base-plate was subsequently mountedonto the microscope stage and incubated at 26 °C during the course ofthe experiments.
Fluorescence imaging. Fluorescence imaging was carried out using Nikon Ti-Emicroscope with CFI Apo TIRF objective with an NA of 1.49. The microscope wasenclosed by a custom-made chamber that was pre-heated overnight and kept at26–27 °C. For excitation of sfGFP or NirFP signal, cells were illuminated by a Nikon-Intensilight illumination lamp through a GFP filter cube (λex/λbs/λem = 450–490/495/500–550 nm) or a RFP filter cube (λex/λbs/λem = 540–580/585/592–668). Thefluorescence signal was recorded by an Andor iXon EMCCD camera. The MinDdynamics were imaged with a frame time-interval of 5 s for 25 frames.
Bacterial strain construction and characterization. Bacterial strains wereconstructed via λ\Red recombination47,48 and P1 phage transduction.All primers, strains and plasmids used in this study are listed in SupplementaryTables 2 and 3. Protein expression levels are characterized through westernblot analysis using MinD and FtsZ antibodies. For more details please seeSupplementary Information.
Image analysis. Analysis of fluorescent microscopy images was carried out usingMatlab. For more details please see Supplementary Information.
Shape selection and data binning. All rectangular and square-shaped cells wereselected for data analysis using the following criteria: (1) cell area covering morethan 90% of the smallest rectangle that the cell shape can fit in, and (2) diagonal lineshaving a length difference smaller than 5%. Cell widths and lengths were binned to0.50 µm (for example, 4.00 ± 0.25 µm) for statistical analysis unless specifiedotherwise. Additional criteria for square shapes are: (1) an aspect ratio smaller than1.05, and (2) a difference between measured length and width smaller than thediffraction limit of around 0.25 µm. For statistics on square shapes, the denoted sizesare the average length of the sides. Larger cell sizes—that is, with a width or lengthabove 4.75 µm—are binned to 1.0 µm, as shown in the phase diagrams (Fig. 3d).
Note that due to the multi-fold symmetry of the square shape, all square-shapecells were rotated or reflected to show side-to-side oscillations horizontally, anddiagonal oscillations no bigger than +45° with respect to the horizontal axis. Thus,for analyses on the Min patterns in the square shapes, the oscillation angles are set tovalues between 0° and 45°. However, for consistency in comparison to the 7 modesof the oscillations in rectangular shapes (in Fig. 3), the side-to-side mode wasgrouped into longitudinal and transversal modes according to the quantified smalllength–width difference in square shapes. Hence, for example, in the case of3.00 ± 0.25 µm squares, whereas the fraction of side-to-side mode is higher than thefraction of the diagonal mode (Fig. 2b), the diagonal mode seems to occur morefrequently than the individual fraction of either longitudinal mode or transversalmode (Fig. 3d).
Numerical simulations. The detailed set of interactions between MinD, MinE, ATPand the cytoplasmic membrane, and the set of reaction-diffusion equations are listedin Supplementary Methods. The reaction kinetic parameters used to reproducesymmetry selection, gradient scaling, and all the major patterns are listed inSupplementary Table 4. The MinD/MinE concentration ratio and diffusionrates are set to be identical with the simulations in the Halatek–Frey model7,where the choices of these values are explained. Based on the set of interactionsand kinetic parameters, a reaction diagram was constructed between a cytosoliccompartment and the cytoplasmic membrane in the software VirtualCell49.Three-dimensional compartments were constructed and latticed with a grid spacingof dx = dy = dz = 0.08 µm. The height of all objects was fixed to be z = 1.00 µm.For more details please see Supplementary Information.
References46. Huang, Z., Pedaci, F., van Oene, M., Wiggin, M. J. & Dekker, N. H. Electron
beam fabrication of birefringent microcylinders. ACS Nano 5, 1418–1427 (2011).47. Datsenko, K. A. &Wanner, B. L. One-step inactivation of chromosomal genes in
Escherichia coli K-12 using PCR products. Proc. Natl Acad. Sci. USA 97,6640–6645 (2000).
48. Wu, F., van Rijn, E., van Schie, B. G. C., Keymer, J. E. & Dekker, C. Multicolorimaging of bacterial nucleoid and division proteins with blue, orange and near-infrared fluorescent proteins. Front. Microbiol. 6, 607 (2015).
49. Loew, L. M. & Schaff, J. C. The virtual cell: a software environment forcomputational cell biology. Trends Biotechnol. 19, 401–406 (2001).
NATURE NANOTECHNOLOGY DOI: 10.1038/NNANO.2015.126 ARTICLES
NATURE NANOTECHNOLOGY | www.nature.com/naturenanotechnology
© 2015 Macmillan Publishers Limited. All rights reserved

In the version of this Article previously published online the Methods section was inadvertently omitted. This has been corrected for all versions of the Article.
Erratum: Symmetry and scale orient Min protein patterns in shaped bacterial sculpturesFabai Wu, Bas G. C. van Schie, Juan E. Keymer and Cees Dekker
Nature Nanotechnology http://dx.doi.org/10.1038/nnano.2015.126 (2015); published online 22 June 2015; corrected online 25 June 2015.
© 2015 Macmillan Publishers Limited. All rights reserved