Supporting Information - Proceedings of the National ... · Supporting Information ... 6B2), CD11b...
6
Supporting Information Nassar et al. 10.1073/pnas.1614926114 SI Materials and Methods Mice. C57BL/6JOlaHsd (B6) were purchased from Harlan. Gas6 -/ - mice were kindly provided by Greg Lemke, Salk Institute, La Jolla, CA. For most of the studies described in this work, littermate controls of Gas6 +/ + and Gas6 -/ - mice were used. The identity of the mice used for experiments was confirmed by genotyping with the following PCR primers: forward, GAGTGCCGTGATTCTGGTC; middle, CCACTAAGGAAACAATAACTG; and reverse, ATCT- CTCGTGGGATCATT. The mice were maintained under SPF conditions and analyzed between 8 and 12 wk of age unless described elsewhere in the text. All animal protocols were approved by the Hebrew University Institutional Animal Care and Ethics Com- mittee. Germ-free (GF) or SPF adult male outbred Swiss Webster mice (a widely used mouse strain in GF experiments) were maintained in sterile isolators at the Weizmann Institute. For cohousing experiments GF mice were housed with SPF mates for 2 mo. All GF studies were approved by the Institutional Animal Care and Use Committee of the Weizmann Institute of Science. Antibodies and Reagents. The following fluorochrome-conjugated monoclonal antibodies and the corresponding isotype controls were purchased from BioLegend: I-A/I-E (M5/114.15.2), CD45.2 (104), B220 (RA3-6B2), CD86 (PO3), CD45.1 (A20), Gr-1 (RB6- 8C5), Ly6G (1A8), Ly6C (HK1.4), CD3 (17A2), B220 (RA3- 6B2), CD11b (M1/70), CD8α (53-6.7), FOXP3 (MF-14), and CD11c (N418). Primary antibodies for Western blot analysis were purchased from R&D Systems: goat anti-MERTK (AF591) and goat anti-GAS6 (AF986); Santa Cruz Biotechnology: goat anti-AXL (sc-1096) and goat anti-Actin (sc-1616); and Millipore: rabbit anti-protein S (AB15928). Horseradish peroxidase (HRP)- conjugated secondary antibodies were purchased from Abcam: donkey anti-goat IgG H&L (ab7125) and goat anti-rabbit IgG H&L (ab97080). CFSE was purchased from Molecular Probes. Escherichia coli LPS were purchased from Sigma. The 7-AAD viability staining solution was purchased from BioLegend. Immunofluorescence Staining. The murine maxilla was fixed overnight at 4 °C in 4% (vol/vol) paraformaldehyde/PBS solution, and then washed for 1 wk in EDTA 0.5 M/PBS that was changed every other day. The tissue was cryopreserved in 30% sucrose (overnight at 4 °C), embedded in OCT, and cryosectioned into 10-μm-thick sections. The cross-sections, as well as the separated epithelium, were washed three times in PBS, blocked in a blocking buffer [5% (vol/vol) FCS, 0.1% Triton X-100 in PBS] for 1 h at room temperature, and incubated with primary antibodies: goat anti-Gas6 (clone sc-1935, Santa Cruz Biotechnology), rabbit anti-PROS1 (clone 2428718, Millipore), rat anti-CD31 (clone 550274, BioLegend), and goat anti-Axl (clone sc- 1096, Santa Cruz Biotechnology) overnight at 4 °C. Following three washing steps in PBS, the samples were incubated with a secondary antibody: donkey anti-goat IgG, donkey anti-rat IgG, or donkey anti-rabbit IgG (Jackson ImmunoResearch) diluted 1:100 in blocking buffer for 1 h at RT, washed three times, stained with Hoechst, and mounted. As a negative staining control, primary antibody was omitted and replaced by blocking buffer. Signals were visualized and digital images were obtained using an Olympus BX51 fluorescence microscope. For detection of Gas6 in DCs, cervical LN cells were pooled from eight Gas6 +/+ or Gas6 -/- mice and DCs were sorted using flow cytometry based on the expression of MHCII and CD11c. The sorted DCs were treated with 0.5 M NaCl, 0.5% acetic acid solution at pH 3 for 90 s to remove the antibodies used for sorting and washed with complete medium. DCs (2.5 × 10 5 cells) were directly placed on prepolyornithine (0.5 mg/mL, Sigma) sterile cover slides, allowed to adhere overnight at 37 °C in 5% CO 2 , and fixed in 4% PFA. The slides were washed three times in PBS and blocked with blocking buffer (3% FBS, 0.2% Triton X-100 in PBS) for 1 h at room temperature, followed by incubation with primary antibodies goat anti-Gas6 clone sc-1935 (Santa Cruz Biotechnology) and rat anti-MHCII clone M5/114.15.2 (BioLegend) overnight at 4 °C. The slides were then washed three times in PBS, incubated with fluorophore-coupled secondary antibody: donkey anti-goat IgG and donkey anti-rat IgG (Jackson ImmunoResearch), diluted 1:100 in blocking buffer for 1 h at room temperature, washed three times in PBS, dipped in Hoechst for nuclear stain- ing, and mounted with Fluoromount G (Southern Biotech). Im- ages were taken using a Nikon C2 confocal LASER scanning microscope. RNA Extraction and Real-Time PCR. For RNA isolation the maxilla was homogenized in 1 mL TRI reagent (Sigma) using an electric homogenizer, and RNA was extracted according to the manu- facturer’s instructions. cDNA synthesis was performed using the qScript cDNA Synthesis Kit (Quanta-BioSciences). Real-time qPCR reactions (20 μL volume) were performed using Power SYBR Green PCR Master Mix (Quanta-BioSciences). The fol- lowing reaction conditions were used: 10 min at 95 °C, 40 cycles of 15 s at 95 °C, and 60 s at 60 °C. The samples were normalized to the TATA box binding protein (TBP) as control mRNA, by change in cycling threshold (ΔC T ) method and calculated based on 2 -ΔΔCT . To detect IFN-α, universal primers were designed to amplify effectively the majority of IFN-a subtypes (11 of 13 known subtypes). Analysis of T Cells in the LNs. Cervical LNs were collected from Gas6 +/+ or Gas6 -/- mice and treated with collagenase type II (1 mg/mL) and DNase I (1 mg/mL) solution in PBS plus 2% (vol/vol) FCS for 20 min at 37 °C in a shaker bath. A total of 20 μL of 0.5 M EDTA per 2 mL sample was added to the digested LNs and incubated for an additional 10 min. Foxp3 + T cells in the LN cell population were identified using the Foxp3 Fix/ Perm Buffer Set (BioLegend) stained with CD3, CD4, and Foxp3 antibodies according to the manufacturer’s instructions. To quantify IL-17A + cells, the LN cells were incubated with PMA (1 μg/mL)/ionomycin (1 μg/mL) and Golgi Plug (2 μL/mL) for 8 h and then stained with CD3, CD4, and IL-17A (intracel- lularly) antibodies. The stained samples were run in the LSR II (BD Biosciences) flow cytometer and analyzed using FlowJo software (Tree Star). Isolation and Processing of Gingival Tissue. The gingiva were ex- cised, minced, and treated with collagenase type II (2 mg/mL; Worthington Biochemicals) and DNase I (1 mg/mL; Roche) solution in PBS plus 2% (vol/vol) FCS for 25 min at 37 °C in a shaker bath. A total of 20 μL of 0.5 M EDTA per 2-mL sample was added to the digested tissues and incubated for an additional 10 min. The cells were washed, filtered with a 70-μM filter, and stained with antibodies as indicated in the text. In some exper- iments, Foxp3 staining was performed using the Foxp3 Fix/Perm Buffer Set (BioLegend) according to the manufacturer’s in- structions. For the identification of IL-17A-producing CD4 + T cells, gingival cells were stimulated with PMA (1 μg/mL)/ion- omycin (1 μg/mL) and Golgi Plug (2 μL/mL) for 8 h and the cells were stained with CD45, CD3, CD4 ,and IL-17A (intracellularly) antibodies. Nassar et al. www.pnas.org/cgi/content/short/1614926114 1 of 6
Transcript of Supporting Information - Proceedings of the National ... · Supporting Information ... 6B2), CD11b...
Supporting InformationNassar et al. 10.1073/pnas.1614926114SI Materials and MethodsMice. C57BL/6JOlaHsd (B6) were purchased from Harlan.Gas6−/−mice were kindly provided by Greg Lemke, Salk Institute, LaJolla, CA. For most of the studies described in this work, littermatecontrols of Gas6+/+ and Gas6−/− mice were used. The identity of themice used for experiments was confirmed by genotyping with thefollowing PCR primers: forward, GAGTGCCGTGATTCTGGTC;middle, CCACTAAGGAAACAATAACTG; and reverse, ATCT-CTCGTGGGATCATT. The mice were maintained under SPFconditions and analyzed between 8 and 12 wk of age unless describedelsewhere in the text. All animal protocols were approved by theHebrew University Institutional Animal Care and Ethics Com-mittee. Germ-free (GF) or SPF adult male outbred Swiss Webstermice (a widely used mouse strain in GF experiments) weremaintained in sterile isolators at the Weizmann Institute. Forcohousing experiments GF mice were housed with SPF mates for2 mo. All GF studies were approved by the Institutional AnimalCare and Use Committee of the Weizmann Institute of Science.
Antibodies and Reagents. The following fluorochrome-conjugatedmonoclonal antibodies and the corresponding isotype controlswere purchased from BioLegend: I-A/I-E (M5/114.15.2), CD45.2(104), B220 (RA3-6B2), CD86 (PO3), CD45.1 (A20), Gr-1 (RB6-8C5), Ly6G (1A8), Ly6C (HK1.4), CD3 (17A2), B220 (RA3-6B2), CD11b (M1/70), CD8α (53-6.7), FOXP3 (MF-14), andCD11c (N418). Primary antibodies for Western blot analysiswere purchased from R&D Systems: goat anti-MERTK (AF591)and goat anti-GAS6 (AF986); Santa Cruz Biotechnology: goatanti-AXL (sc-1096) and goat anti-Actin (sc-1616); and Millipore:rabbit anti-protein S (AB15928). Horseradish peroxidase (HRP)-conjugated secondary antibodies were purchased from Abcam:donkey anti-goat IgG H&L (ab7125) and goat anti-rabbit IgGH&L (ab97080). CFSE was purchased from Molecular Probes.Escherichia coli LPS were purchased from Sigma. The 7-AADviability staining solution was purchased from BioLegend.
Immunofluorescence Staining.Themurinemaxilla was fixed overnightat 4 °C in 4% (vol/vol) paraformaldehyde/PBS solution, and thenwashed for 1 wk in EDTA 0.5 M/PBS that was changed every otherday. The tissue was cryopreserved in 30% sucrose (overnight at 4 °C),embedded in OCT, and cryosectioned into 10-μm-thick sections. Thecross-sections, as well as the separated epithelium, were washed threetimes in PBS, blocked in a blocking buffer [5% (vol/vol) FCS, 0.1%Triton X-100 in PBS] for 1 h at room temperature, and incubatedwith primary antibodies: goat anti-Gas6 (clone sc-1935, Santa CruzBiotechnology), rabbit anti-PROS1 (clone 2428718, Millipore), ratanti-CD31 (clone 550274, BioLegend), and goat anti-Axl (clone sc-1096, Santa Cruz Biotechnology) overnight at 4 °C. Followingthree washing steps in PBS, the samples were incubated with asecondary antibody: donkey anti-goat IgG, donkey anti-rat IgG, ordonkey anti-rabbit IgG (Jackson ImmunoResearch) diluted 1:100in blocking buffer for 1 h at RT, washed three times, stainedwith Hoechst, and mounted. As a negative staining control,primary antibody was omitted and replaced by blocking buffer.Signals were visualized and digital images were obtained using anOlympus BX51 fluorescence microscope.For detection of Gas6 in DCs, cervical LN cells were pooled
from eight Gas6+/+ or Gas6−/− mice and DCs were sorted usingflow cytometry based on the expression of MHCII and CD11c.The sorted DCs were treated with 0.5 M NaCl, 0.5% acetic acidsolution at pH 3 for 90 s to remove the antibodies used forsorting and washed with complete medium. DCs (2.5 × 10⁵ cells)
were directly placed on prepolyornithine (0.5 mg/mL, Sigma)sterile cover slides, allowed to adhere overnight at 37 °C in 5%CO2, and fixed in 4% PFA. The slides were washed three timesin PBS and blocked with blocking buffer (3% FBS, 0.2% TritonX-100 in PBS) for 1 h at room temperature, followed by incubationwith primary antibodies goat anti-Gas6 clone sc-1935 (Santa CruzBiotechnology) and rat anti-MHCII cloneM5/114.15.2 (BioLegend)overnight at 4 °C. The slides were then washed three times in PBS,incubated with fluorophore-coupled secondary antibody: donkeyanti-goat IgG and donkey anti-rat IgG (Jackson ImmunoResearch),diluted 1:100 in blocking buffer for 1 h at room temperature,washed three times in PBS, dipped in Hoechst for nuclear stain-ing, and mounted with Fluoromount G (Southern Biotech). Im-ages were taken using a Nikon C2 confocal LASER scanningmicroscope.
RNA Extraction and Real-Time PCR. For RNA isolation the maxillawas homogenized in 1 mL TRI reagent (Sigma) using an electrichomogenizer, and RNA was extracted according to the manu-facturer’s instructions. cDNA synthesis was performed using theqScript cDNA Synthesis Kit (Quanta-BioSciences). Real-timeqPCR reactions (20 μL volume) were performed using PowerSYBR Green PCR Master Mix (Quanta-BioSciences). The fol-lowing reaction conditions were used: 10 min at 95 °C, 40 cyclesof 15 s at 95 °C, and 60 s at 60 °C. The samples were normalizedto the TATA box binding protein (TBP) as control mRNA, bychange in cycling threshold (ΔCT) method and calculated basedon 2-ΔΔCT. To detect IFN-α, universal primers were designedto amplify effectively the majority of IFN-a subtypes (11 of 13known subtypes).
Analysis of T Cells in the LNs. Cervical LNs were collected fromGas6+/+ or Gas6−/− mice and treated with collagenase type II(1 mg/mL) and DNase I (1 mg/mL) solution in PBS plus 2%(vol/vol) FCS for 20 min at 37 °C in a shaker bath. A total of20 μL of 0.5 M EDTA per 2 mL sample was added to the digestedLNs and incubated for an additional 10 min. Foxp3+ T cells inthe LN cell population were identified using the Foxp3 Fix/Perm Buffer Set (BioLegend) stained with CD3, CD4, andFoxp3 antibodies according to the manufacturer’s instructions.To quantify IL-17A+ cells, the LN cells were incubated withPMA (1 μg/mL)/ionomycin (1 μg/mL) and Golgi Plug (2 μL/mL)for 8 h and then stained with CD3, CD4, and IL-17A (intracel-lularly) antibodies. The stained samples were run in the LSR II(BD Biosciences) flow cytometer and analyzed using FlowJosoftware (Tree Star).
Isolation and Processing of Gingival Tissue. The gingiva were ex-cised, minced, and treated with collagenase type II (2 mg/mL;Worthington Biochemicals) and DNase I (1 mg/mL; Roche)solution in PBS plus 2% (vol/vol) FCS for 25 min at 37 °C in ashaker bath. A total of 20 μL of 0.5 M EDTA per 2-mL samplewas added to the digested tissues and incubated for an additional10 min. The cells were washed, filtered with a 70-μM filter, andstained with antibodies as indicated in the text. In some exper-iments, Foxp3 staining was performed using the Foxp3 Fix/PermBuffer Set (BioLegend) according to the manufacturer’s in-structions. For the identification of IL-17A-producing CD4+ Tcells, gingival cells were stimulated with PMA (1 μg/mL)/ion-omycin (1 μg/mL) and Golgi Plug (2 μL/mL) for 8 h and the cellswere stained with CD45, CD3, CD4 ,and IL-17A (intracellularly)antibodies.
Nassar et al. www.pnas.org/cgi/content/short/1614926114 1 of 6
Preparation and Simulation of BMDCs. The femur was isolated fromthe mice, cleaned from soft tissues in RPMI 1640, and soaked in70% ethanol for 1 min for sterilization. The femur was thenwashed with sterile PBS and the bone ends was removed by sterilescissors. Bone marrow (BM) cells eluted from the bone byflushing them several times using a sterile syringe filled withRPMI 1640, and the cells were then washed, treated with ACKsolution for 3 min on ice, washed again, and counted. BM cells(5 × 10⁵ cells per well) in 24-well plates (Nunc) were cultured withcomplete RPMI media [450 mL RPMI 1640, 50 mL FCS, 5 mLL-glutamine, 50 μM β-mercaptoethanol, penicillin (100 units/mL),streptomycin (100 μg/mL), and gentamicin (50 μg/mL)] supple-mented with GM-SCF (20 ng/mL) for 4 d to induce their differ-entiation into BMDCs (CD11C+MHCIIhigh). The cultures werethen exposed to LPS (Sigma) (100 ng/mL) for 24 h and super-natants were collected to quantify IL-6 by ELISA (BioLegend).The stimulated BMDCs were washed and stained with the notedantibodies for analysis of their maturation state by flow cytometry.For cytokine production, the BDMCs were cocultured with OT-IICD4+ T cells, purified by negative selection with the EasyStepmouse CD4+ T-cell enrichment kit, for 3 d in the presence of LPS(100 ng/mL) and OVA223–239 peptide (1 μg/mL). The levels of IL-17A were measured in the supernatant by ELISA (BioLegend)according to the manufacturer’s instructions.
Cultivation of Oral Microbiota. Oral cavity of anesthetized indi-vidual Gas6+/+ or Gas6−/− littermate control mice were swabbedfor 30 s and the swabs were then inserted into Eppendorf tubescontaining 100 μL of Wilkins-Chalgren medium (Oxoid). Thesamples were serially diluted and plated on blood agar for 2 d
under anaerobic conditions at 37 °C and colonies were enu-merated to determine the colony-forming units (cfus) of totalcultivatable oral anaerobic bacteria.
In Vivo BM Reconstitution Assays. Eight-week-old recipient CD45.2+
Gas6−/− or CD45.1+ B6 mice were lethally irradiated with 950 rad,and 24 h later the mice were injected i.v. with 5 × 10⁶ BM cellsobtained from either congenic CD45.2+ Gas6−/− or CD45.1+ B6mice to allow identification of donor-derived cells. The chimerismwas verified in the blood as indicated in the text.
Western Blot. Gingival tissues were isolated and homogenized inice-cold lysis buffer (50mMTris pH 7.5, 150mMNaCl, 1%TritonX-100, 0.5% Nonidet P-40, 0.1% SDS, 0.5 mM EDTA) sup-plemented with a protease inhibitor mixture (Sigma). Followinglysate incubation for 30 min on ice, tissue debris were removed bycentrifugation (15,000 × g for 30 min at 4 °C) and protein con-centration in the supernatant was determined using Pierce BSAProtein Assay Kit (Thermo Scientific). Samples of 20 μg of totalprotein were loaded onto 10% acrylamide gel and subject toSDS/PAGE. Proteins were transferred to a PVDF membrane(Millipore), the membrane was blocked in 5% skim milk for30 min at room temperature, and reacted with primary antibodyovernight at 4 °C. The membrane was then washed three times inTBST for 10 min at room temperature, incubated with secondaryHRP-conjugated antibody in blocking buffer for 1 h at roomtemperature and washed three times in TBST before the blotswere reacted with ECL substrate (Western blot detection kit,Advansta). Images were captured using a ChemiDoc MP ImageSystem (Bio-Rad).
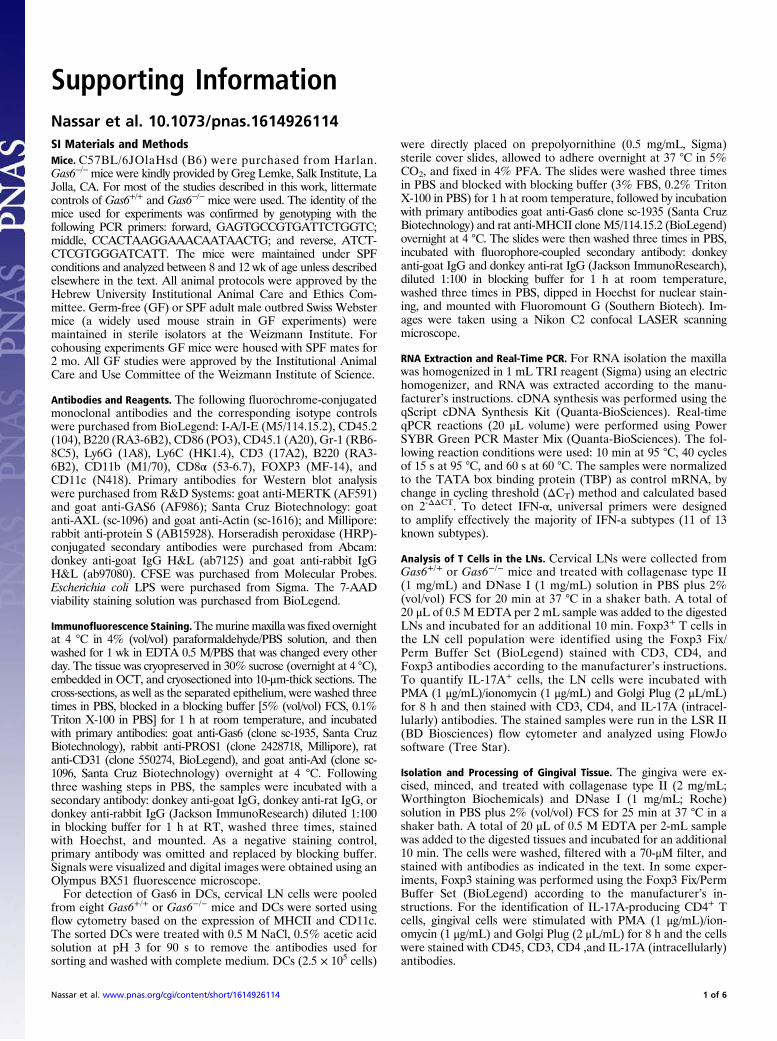
Fig. S1. Additional validations for expression of GAS6, PROS1, and AXL in the murine gingiva. (A) Schematic presentation (Left), H&E (Center), and outline ofnuclei (Right) stainings of gingival cross-sections demarcating the epithelium (Ep) and lamina propria (LP) by dotted lines. (B) Quantification of Gas6 expressionin the gingiva by RT-qPCR in WT and Gas6−/− mice. (C) Western blot analysis showing the presence of PROS1 in the gingival epithelium and lamina propria.PROS1-expressing cell line was used as a positive control. Representative data of one of two independent experiments are shown. (D) Western blot analysisshowing the presence of AXL in the gingival epithelium and lamina propria. Representative data of one of two independent experiments are shown.
Nassar et al. www.pnas.org/cgi/content/short/1614926114 2 of 6
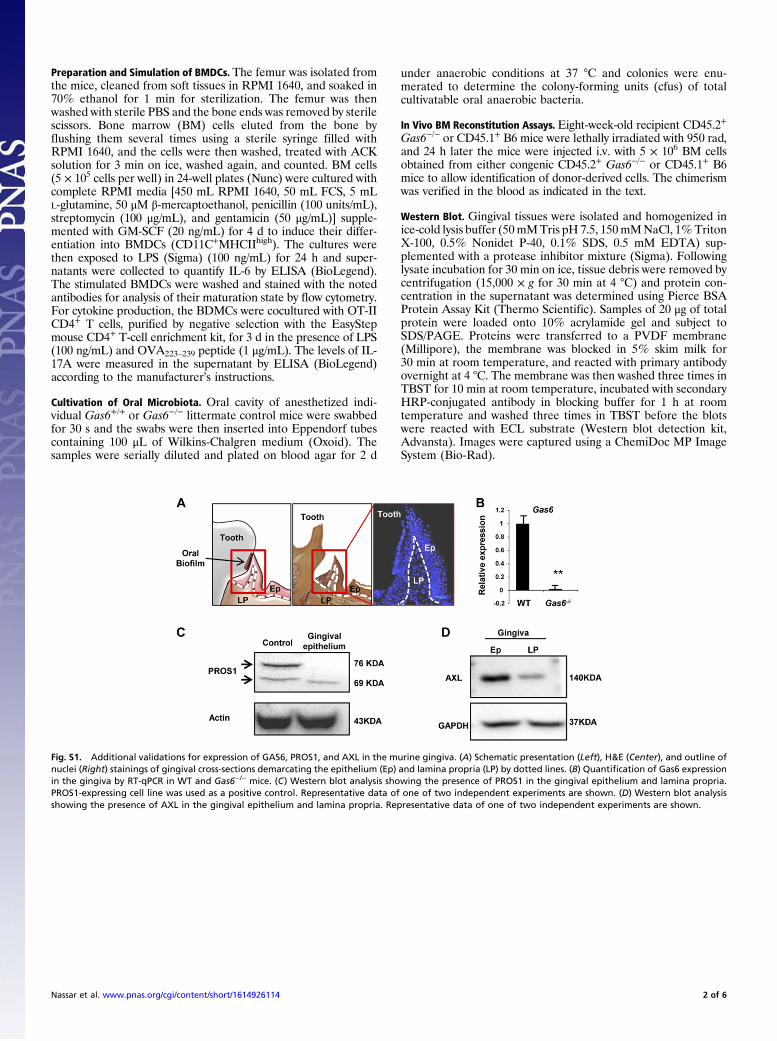
Fig. S2. Characterization of gingival immune cells at steady state. (A) Gating strategy to identify various immune cells in the gingival mucosa followingexclusion of dead cells using 7-AAD. (B) Bar graphs illustrating the MFI of MHCII and CD86 on gingival DCs in Gas6+/+ and Gas6−/− mice (n = 5) at steady state.
Fig. S3. An alteration in oral and gut microbiota of Gas6−/− mice. (A) Bacterial composition of certain bacterial families in oral swabs taken from Gas6+/+,Gas6−/−, and Gas6−/+ mice. Bar graph presents the average relative frequency of each family examined and represent the mean of five mice ± SEM. (B) Fecessamples were taken from adult Gas6+/+ and Gas6−/− mice and total bacteria were calculated by RT-qPCR. Graphs present the 16S/18S ratio in each group andrepresent the mean of five mice ± SEM. (C) Bacterial composition of certain bacterial families were quantified using specific primers for their ribosomal 16Sgenes. Data present the average relative frequency of each family examined and represent the mean of four mice ± SEM.
Nassar et al. www.pnas.org/cgi/content/short/1614926114 3 of 6
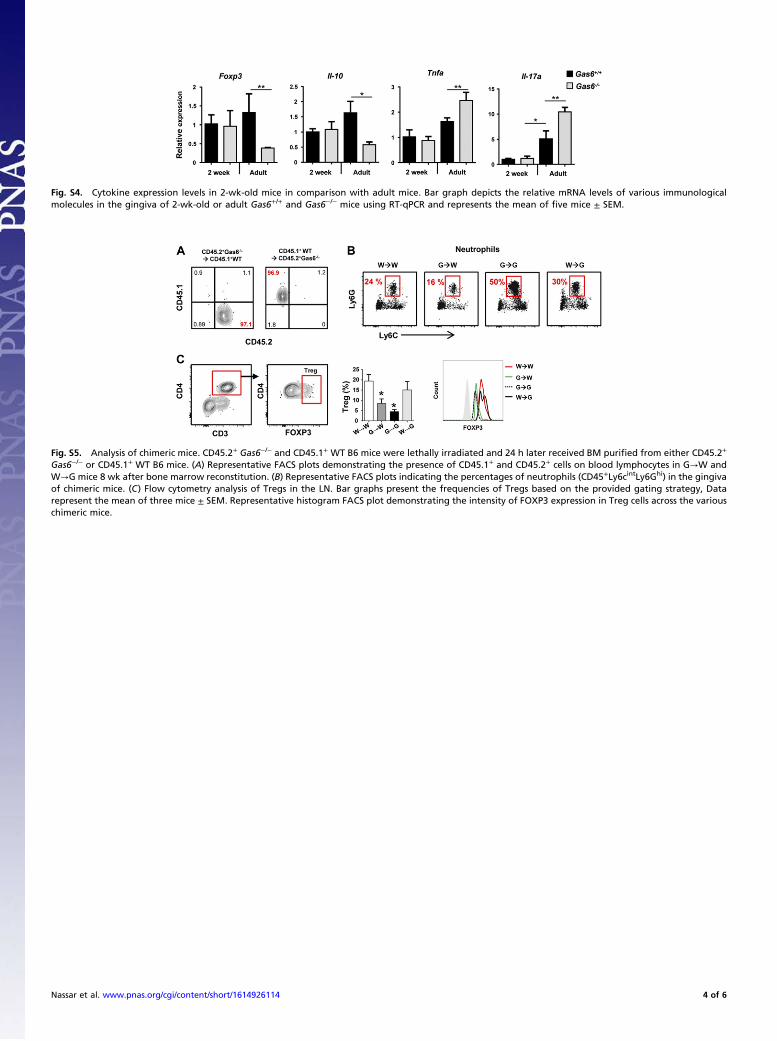
Fig. S4. Cytokine expression levels in 2-wk-old mice in comparison with adult mice. Bar graph depicts the relative mRNA levels of various immunologicalmolecules in the gingiva of 2-wk-old or adult Gas6+/+ and Gas6−/− mice using RT-qPCR and represents the mean of five mice ± SEM.
Fig. S5. Analysis of chimeric mice. CD45.2+ Gas6−/− and CD45.1+ WT B6 mice were lethally irradiated and 24 h later received BM purified from either CD45.2+
Gas6−/− or CD45.1+ WT B6 mice. (A) Representative FACS plots demonstrating the presence of CD45.1+ and CD45.2+ cells on blood lymphocytes in G→W andW→G mice 8 wk after bone marrow reconstitution. (B) Representative FACS plots indicating the percentages of neutrophils (CD45+Ly6cintLy6Ghi) in the gingivaof chimeric mice. (C) Flow cytometry analysis of Tregs in the LN. Bar graphs present the frequencies of Tregs based on the provided gating strategy, Datarepresent the mean of three mice ± SEM. Representative histogram FACS plot demonstrating the intensity of FOXP3 expression in Treg cells across the variouschimeric mice.
Nassar et al. www.pnas.org/cgi/content/short/1614926114 4 of 6
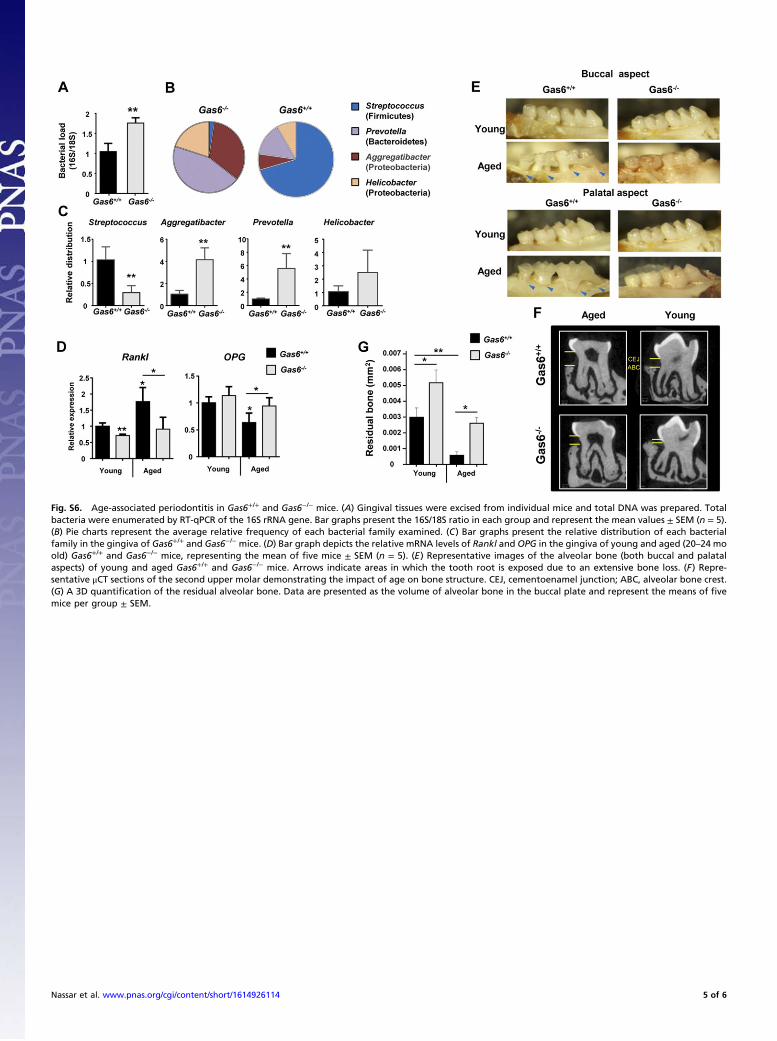
Fig. S6. Age-associated periodontitis in Gas6+/+ and Gas6−/− mice. (A) Gingival tissues were excised from individual mice and total DNA was prepared. Totalbacteria were enumerated by RT-qPCR of the 16S rRNA gene. Bar graphs present the 16S/18S ratio in each group and represent the mean values ± SEM (n = 5).(B) Pie charts represent the average relative frequency of each bacterial family examined. (C) Bar graphs present the relative distribution of each bacterialfamily in the gingiva of Gas6+/+ and Gas6−/− mice. (D) Bar graph depicts the relative mRNA levels of Rankl and OPG in the gingiva of young and aged (20–24 moold) Gas6+/+ and Gas6−/− mice, representing the mean of five mice ± SEM (n = 5). (E) Representative images of the alveolar bone (both buccal and palatalaspects) of young and aged Gas6+/+ and Gas6−/− mice. Arrows indicate areas in which the tooth root is exposed due to an extensive bone loss. (F) Repre-sentative μCT sections of the second upper molar demonstrating the impact of age on bone structure. CEJ, cementoenamel junction; ABC, alveolar bone crest.(G) A 3D quantification of the residual alveolar bone. Data are presented as the volume of alveolar bone in the buccal plate and represent the means of fivemice per group ± SEM.
Nassar et al. www.pnas.org/cgi/content/short/1614926114 5 of 6
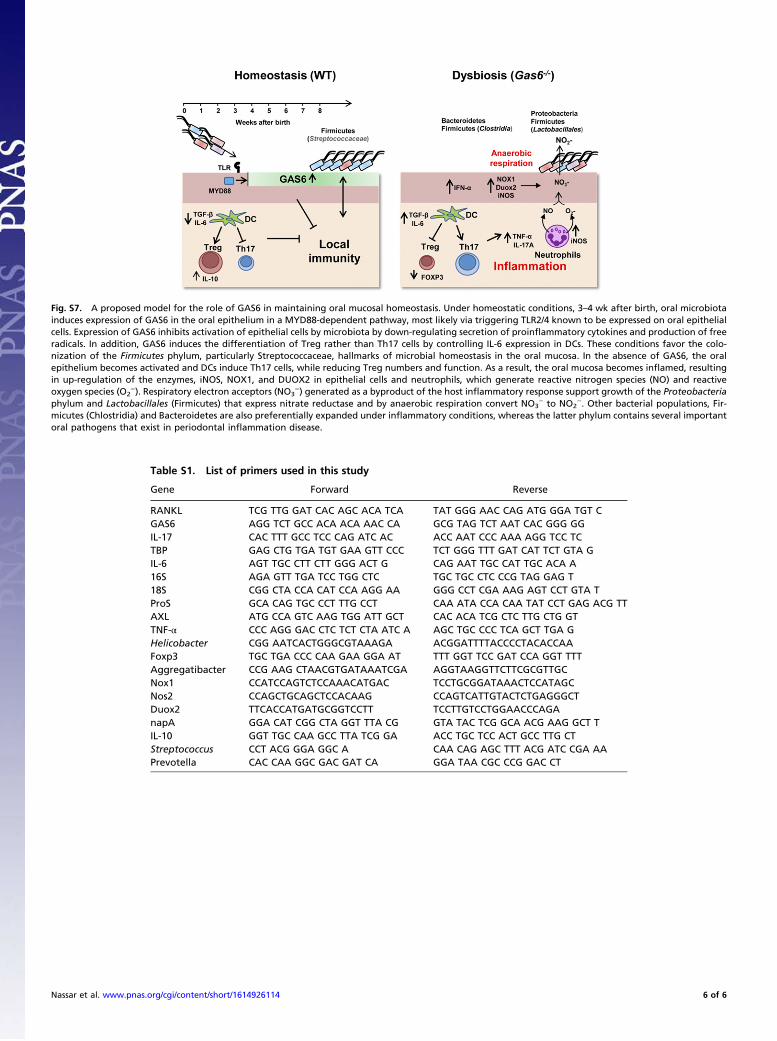
Fig. S7. A proposed model for the role of GAS6 in maintaining oral mucosal homeostasis. Under homeostatic conditions, 3–4 wk after birth, oral microbiotainduces expression of GAS6 in the oral epithelium in a MYD88-dependent pathway, most likely via triggering TLR2/4 known to be expressed on oral epithelialcells. Expression of GAS6 inhibits activation of epithelial cells by microbiota by down-regulating secretion of proinflammatory cytokines and production of freeradicals. In addition, GAS6 induces the differentiation of Treg rather than Th17 cells by controlling IL-6 expression in DCs. These conditions favor the colo-nization of the Firmicutes phylum, particularly Streptococcaceae, hallmarks of microbial homeostasis in the oral mucosa. In the absence of GAS6, the oralepithelium becomes activated and DCs induce Th17 cells, while reducing Treg numbers and function. As a result, the oral mucosa becomes inflamed, resultingin up-regulation of the enzymes, iNOS, NOX1, and DUOX2 in epithelial cells and neutrophils, which generate reactive nitrogen species (NO) and reactiveoxygen species (O2
−). Respiratory electron acceptors (NO3−) generated as a byproduct of the host inflammatory response support growth of the Proteobacteria
phylum and Lactobacillales (Firmicutes) that express nitrate reductase and by anaerobic respiration convert NO3− to NO2
−. Other bacterial populations, Fir-micutes (Chlostridia) and Bacteroidetes are also preferentially expanded under inflammatory conditions, whereas the latter phylum contains several importantoral pathogens that exist in periodontal inflammation disease.
Table S1. List of primers used in this study
Gene Forward Reverse
RANKL TCG TTG GAT CAC AGC ACA TCA TAT GGG AAC CAG ATG GGA TGT CGAS6 AGG TCT GCC ACA ACA AAC CA GCG TAG TCT AAT CAC GGG GGIL-17 CAC TTT GCC TCC CAG ATC AC ACC AAT CCC AAA AGG TCC TCTBP GAG CTG TGA TGT GAA GTT CCC TCT GGG TTT GAT CAT TCT GTA GIL-6 AGT TGC CTT CTT GGG ACT G CAG AAT TGC CAT TGC ACA A16S AGA GTT TGA TCC TGG CTC TGC TGC CTC CCG TAG GAG T18S CGG CTA CCA CAT CCA AGG AA GGG CCT CGA AAG AGT CCT GTA TProS GCA CAG TGC CCT TTG CCT CAA ATA CCA CAA TAT CCT GAG ACG TTAXL ATG CCA GTC AAG TGG ATT GCT CAC ACA TCG CTC TTG CTG GTTNF-α CCC AGG GAC CTC TCT CTA ATC A AGC TGC CCC TCA GCT TGA GHelicobacter CGG AATCACTGGGCGTAAAGA ACGGATTTTACCCCTACACCAAFoxp3 TGC TGA CCC CAA GAA GGA AT TTT GGT TCC GAT CCA GGT TTTAggregatibacter CCG AAG CTAACGTGATAAATCGA AGGTAAGGTTCTTCGCGTTGCNox1 CCATCCAGTCTCCAAACATGAC TCCTGCGGATAAACTCCATAGCNos2 CCAGCTGCAGCTCCACAAG CCAGTCATTGTACTCTGAGGGCTDuox2 TTCACCATGATGCGGTCCTT TCCTTGTCCTGGAACCCAGAnapA GGA CAT CGG CTA GGT TTA CG GTA TAC TCG GCA ACG AAG GCT TIL-10 GGT TGC CAA GCC TTA TCG GA ACC TGC TCC ACT GCC TTG CTStreptococcus CCT ACG GGA GGC A CAA CAG AGC TTT ACG ATC CGA AAPrevotella CAC CAA GGC GAC GAT CA GGA TAA CGC CCG GAC CT
Nassar et al. www.pnas.org/cgi/content/short/1614926114 6 of 6


![Supporting Information - Royal Society of Chemistry · Supporting Information N-Heterocyclic Carbene-Catalyzed [3+2] Annulation of Bromoenals with 3-Aminooxindoles: Highly Enantioselective](https://static.fdocument.org/doc/165x107/5f0dee5b7e708231d43cc95a/supporting-information-royal-society-of-supporting-information-n-heterocyclic.jpg)