Supporting Information · Supporting Information Supplementary Figure 1. ... Tumor bearing mice...
17
Supporting Information Supplementary Figure 1. RT-PCR for (a) IFN-γ and (b) IDO1 RNA transcripts in tumor tissues following Taxol treatment. Female BALB/c mice bearing s.c. 4T1.2 tumors were treated with TAXOL i.v. once every 3 days for 5 times at a PTX dose of 10 mg kg -1 . Tumor tissues were harvested 6 days following the last injection. Tissues were homogenized and RNA was extracted, and RT-PCR was performed. GAPDH was used as a housekeeping gene and the relative folds of gene induction in treatment groups were calculated in comparison with PBS control group. The Bars represent means ± s.e.m. *P < 0.05 (vs Control, N = 3).
Transcript of Supporting Information · Supporting Information Supplementary Figure 1. ... Tumor bearing mice...

Supporting Information
Supplementary Figure 1. RT-PCR for (a) IFN-γ and (b) IDO1 RNA transcripts in tumor tissues following Taxol treatment. Female BALB/c mice bearing s.c. 4T1.2 tumors were treated with TAXOL i.v. once every 3 days for 5 times at a PTX dose of 10 mg kg-1. Tumor tissues were harvested 6 days following the last injection. Tissues were homogenized and RNA was extracted, and RT-PCR was performed. GAPDH was used as a housekeeping gene and the relative folds of gene induction in treatment groups were calculated in comparison with PBS control group. The Bars represent means ± s.e.m. *P < 0.05 (vs Control, N = 3).

Supplementary Figure 2. Synthesis schemes of PEG2k−Fmoc−NLG(L) (4) and PEG2k−Fmoc−NLG(S) (5) conjugates.
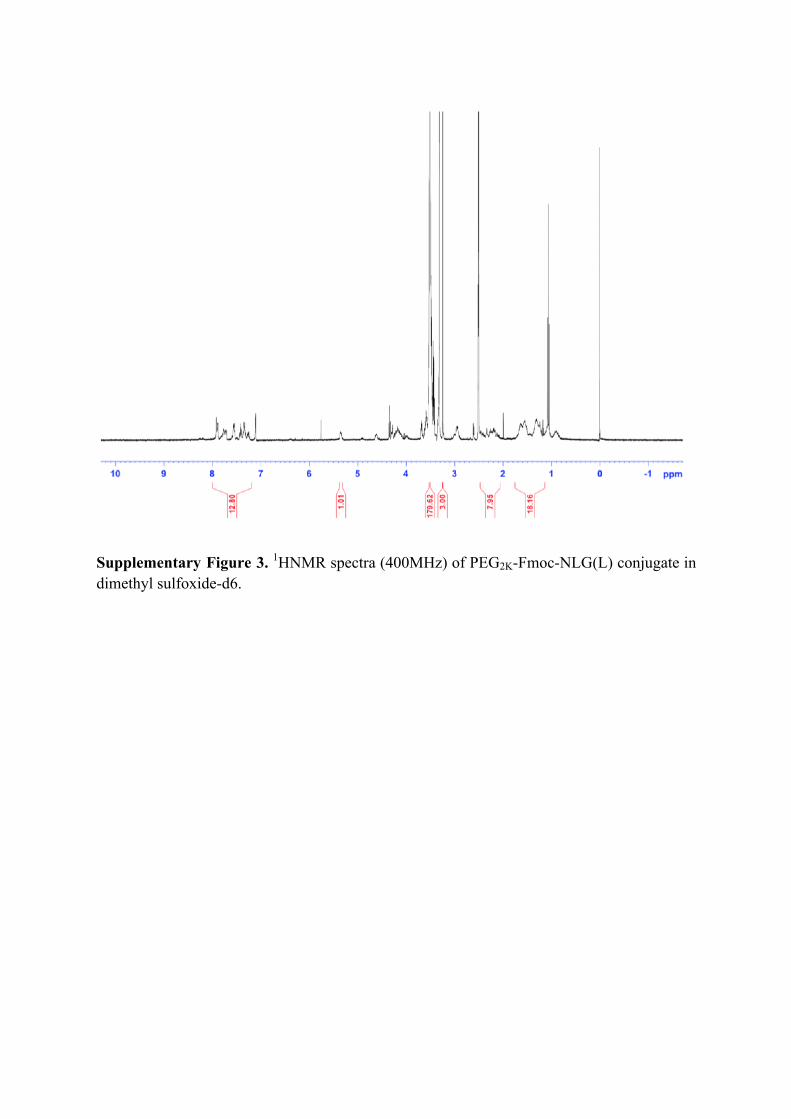
Supplementary Figure 3. 1HNMR spectra (400MHz) of PEG2K-Fmoc-NLG(L) conjugate in dimethyl sulfoxide-d6.

Supplementary Figure 4. 1HNMR spectra(400MHz) of PEG2K-Fmoc-NLG(S) conjugate in dimethyl sulfoxide-d6.
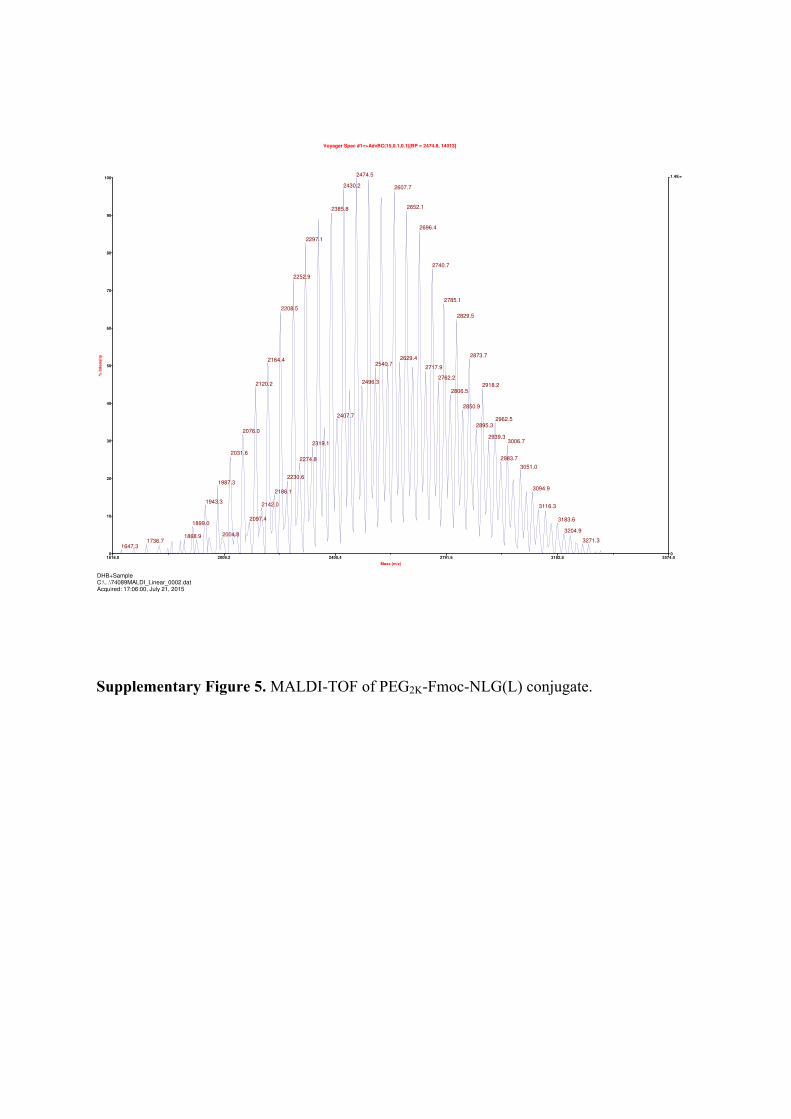
Supplementary Figure 5. MALDI-TOF of PEG2K-Fmoc-NLG(L) conjugate.
Acquired: 17:06:00, July 21, 2015C:\...\74089MALDI_Linear_0002.datDHB+Sample
1618.0 2009.2 2400.4 2791.6 3182.8 3574.0
Mass (m/z)
0
1.4E+4
0
10
20
30
40
50
60
70
80
90
100
% I
nte
nsit
y
Voyager Spec #1=>AdvBC(15,0.1,0.1)[BP = 2474.8, 14013]
2474.5
2430.2 2607.7
2652.12385.8
2696.4
2297.1
2740.7
2252.9
2785.1
2208.5
2829.5
2873.72629.42164.42540.7
2717.9
2762.22496.32120.2 2918.2
2806.5
2850.9
2407.72962.5
2895.32076.0
2939.33006.72319.1
2031.62983.72274.8
3051.0
2230.61987.3
3094.92186.1
1943.3 2142.0 3116.3
2097.4 3183.61899.0
3204.92004.81868.9
3271.31736.71647.3
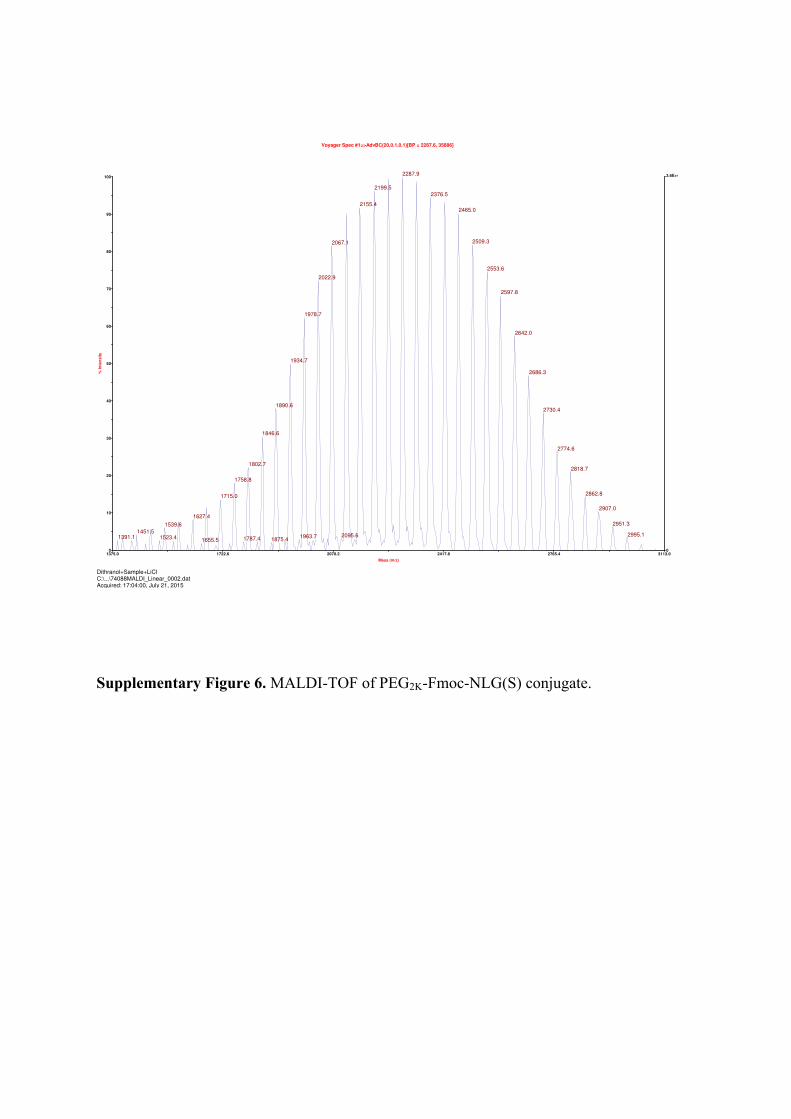
Supplementary Figure 6. MALDI-TOF of PEG2K-Fmoc-NLG(S) conjugate.
Acquired: 17:04:00, July 21, 2015C:\...\74088MALDI_Linear_0002.datDithranol+Sample+LiCl
1375.0 1722.6 2070.2 2417.8 2765.4 3113.0
Mass (m/z)
0
3.6E+4
0
10
20
30
40
50
60
70
80
90
100
% I
nte
nsit
y
Voyager Spec #1=>AdvBC(20,0.1,0.1)[BP = 2287.6, 35886]
2287.9
2199.52376.5
2155.42465.0
2509.32067.1
2553.6
2022.9
2597.8
1978.7
2642.0
1934.7
2686.3
1890.62730.4
1846.6
2774.6
1802.72818.7
1758.8
2862.81715.0
2907.0
1627.4
2951.31539.61451.5
2995.12095.61963.71391.1 1523.4 1787.4 1875.41655.5

Supplementary Figure 7. PEG2k-Fmoc-NLG maintains the IDO-inhibitory effect of NLG919. HeLa cells were treated with IFN-γ (50 ng ml-1) and various concentrations of PEG2k-Fmoc-NLG(L), PEG2k-Fmoc-NLG(S) or NLG919 for 2 days. The Kyn concentrations in the supernatants of cell culture were examined by LS-MS. Values reported are the means ± s.e.m from triplicate wells.
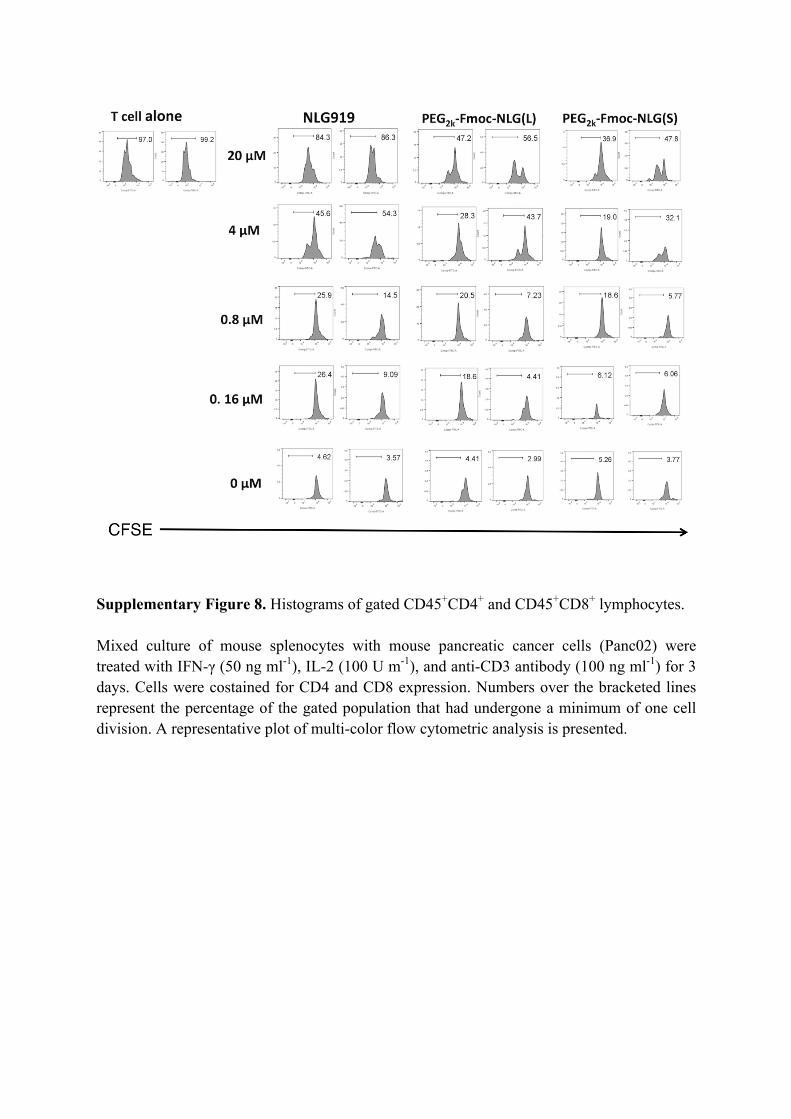
Supplementary Figure 8. Histograms of gated CD45+CD4+ and CD45+CD8+ lymphocytes. Mixed culture of mouse splenocytes with mouse pancreatic cancer cells (Panc02) were treated with IFN-γ (50 ng ml-1), IL-2 (100 U m-1), and anti-CD3 antibody (100 ng ml-1) for 3 days. Cells were costained for CD4 and CD8 expression. Numbers over the bracketed lines represent the percentage of the gated population that had undergone a minimum of one cell division. A representative plot of multi-color flow cytometric analysis is presented.
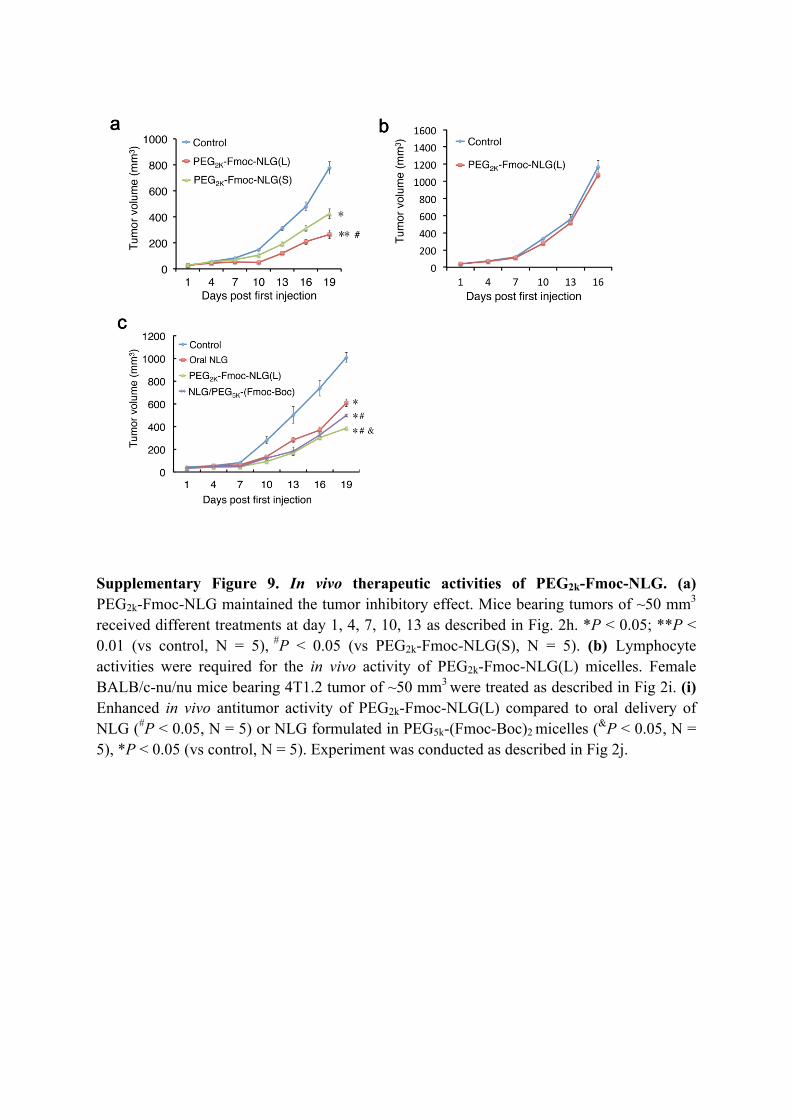
Supplementary Figure 9. In vivo therapeutic activities of PEG2k-Fmoc-NLG. (a) PEG2k-Fmoc-NLG maintained the tumor inhibitory effect. Mice bearing tumors of ~50 mm3 received different treatments at day 1, 4, 7, 10, 13 as described in Fig. 2h. *P < 0.05; **P < 0.01 (vs control, N = 5), #P < 0.05 (vs PEG2k-Fmoc-NLG(S), N = 5). (b) Lymphocyte activities were required for the in vivo activity of PEG2k-Fmoc-NLG(L) micelles. Female BALB/c-nu/nu mice bearing 4T1.2 tumor of ~50 mm3 were treated as described in Fig 2i. (i) Enhanced in vivo antitumor activity of PEG2k-Fmoc-NLG(L) compared to oral delivery of NLG (#P < 0.05, N = 5) or NLG formulated in PEG5k-(Fmoc-Boc)2 micelles (&P < 0.05, N = 5), *P < 0.05 (vs control, N = 5). Experiment was conducted as described in Fig 2j.

Supplementary Figure 10. In vivo antitumor activity of PTX-loaded PEG2k-Fmoc-NLG micelles. (a) In vivo antitumor activity of various PTX formulations in 4T1.2 tumor model. Experiment was conducted as described in Fig. 5a. Actual tumor sizes were plotted. **P < 0.01 (all treatment groups vs control group), #P < 0.05 (PTX/PEG2k-Fmoc-NLG(L) vs Taxol ), &P < 0.05 (PTX/PEG2k-Fmoc-NLG(L) vs PTX/PEG2k-Fmoc-NLG(S)). N= 5. (b) Dose-escalation study on the antitumor activity of PTX-loaded PEG2k-Fmoc-NLG(L) micelles was performed as described in Fig. 5b. PTX dose was 5, 10, and 20 mg kg-1, respectively. **P < 0.01 (all treatment groups vs control), #P < 0.05 (20 mg PTX per kg vs 5 mg PTX per kg). N= 5. (c) Antitumor activity of PTX/PEG2k-Fmoc-NLG(L) in a 4T1.2 tumor model in comparison to a combination of oral NLG with i.v. Abraxane, PEG2k-Fmoc-NLG(L) plus Abraxane or PEG5k-(Fmoc-Boc)2) micelles co-loaded with PTX and NLG. Experiment was performed as described in Fig. 5c. *P < 0.01 (all treatment groups vs control), #P < 0.05 (PTX/PEG2k-Fmoc-NLG(L) or PEG2k-Fmoc-NLG(L) + Abraxane vs oral NLG + Abraxane), &P < 0.05 (PTX/PEG2k-Fmoc-NLG(L) or PEG2k-Fmoc-NLG(L) + Abraxane vs (PTX+NLG)/PEG5k-(Fmoc-Boc)2), ΦP < 0.05 (PTX/PEG2k-Fmoc-NLG(L) vs PEG2k-Fmoc-NLG(L) + Abraxane), N = 5. (d) Antitumor activity of PTX/PEG2k-Fmoc-NLG(L) in a murine melanoma (B16) model. Experiment was performed as described in Fig. 5d. PTX dose was 10 mg kg-1. **P < 0.01 (all treatment groups vs control), #P < 0.05 (PTX/PEG2k-Fmoc-NLG(L) vs Taxol), N = 5.

Supplementary Figure 11. Kaplan-Meier survival curves for BALB/c mice bearing 4T1.2 murine breast cancer (N=5).

Supplementary Figure 12. Changes of body weights in mice receiving different treatments.

Supplementary Figure 13. Tumor-associated macrophages (TAMs) in mouse tumors. The percentages of TAM populations with specific macrophage markers (a) M1-type (CD11b+/F4/80+/CD86+) and b) M2-type (CD11b+/F4/80+/CD206+)) in tumor tissues were detected by flow cytometry.

Supplementary Figure 14. Flow cytometry analysis of immune cell subsets in tumor tissues with different treatments. (a-d) T cell infiltration in mouse tumors treated with Taxol,

PEG2k-Fmoc-NLG(L) or PTX/PEG2k-Fmoc-NLG(L) at a PTX dosage of 10mg kg-1. The relative abundance of CD4+, CD8+ (a), IFN-γ positive intratumoral CD4+ T cells (b), IFN-γ positive intratumoral CD8+ T cells (c), and granzyme B-positive CD8+ T cells (d) in tumor tissues were detected by flow cytometry. (e) Flow cytometry gating and histogram analysis of FoxP3+ T regulatory cells in mouse tumors. (f-g) Tumor-associated macrophages (TAMs) in mouse tumors. The percentages of TAM populations with specific macrophage markers (M1-type (CD11b+/F4/80+/CD86+) and M2-type (CD11b+/F4/80+/CD206+)) in tumor tissues were detected by flow cytometry. (h) Flow cytometry gating and histograms analysis of CD11b+/Gr-1+ MDSC cells in mouse tumors. Double positive cells contain two populations, including Gr-1highCD11b+ granulocytic (G-MDSC) and Gr-1intCD11b+ monocytic (M-MDSC) MDSC subsets. The Bars represent means ± s.e.m. (*p<0.05, **p<0.01, N = 3)

Supplementary Figure 15. H&E staining of tumor tissues.
Tumor bearing mice were treated with Taxol, PEG2k-Fmoc-NLG(L) and PTX/PEG2k-Fmoc-NLG(L) every 3 days for 5 times. Tumor tissues were harvested 1 day after last treatment. Nuclei and cytoplasm were stained by hematoxylin and eosin, respectively.

Supplementary Figure 16. PTX/PEG2k-Fmoc-NLG(L) decreased kynurenine concentrations in blood in 4T1.2 tumor-bearing mice. Female BALB/c mice bearing s.c. 4T1.2 tumors were treated with TAXOL or PTX/PEG2k-Fmoc-NLG(L) i.v. once every 3 days for 5 times at a PTX dose of 10mg kg-1. Blood samples were harvested 1 day after the last injection and kynurenine/tryptophan ratios were examined by LC/MS. Data are mean values ± s.e.m. of 3 experiments. *P < 0.05 (vs Taxol, N = 3).