SUPPLEMENTARY MATERIALS SUPPLEMENTARY...
15
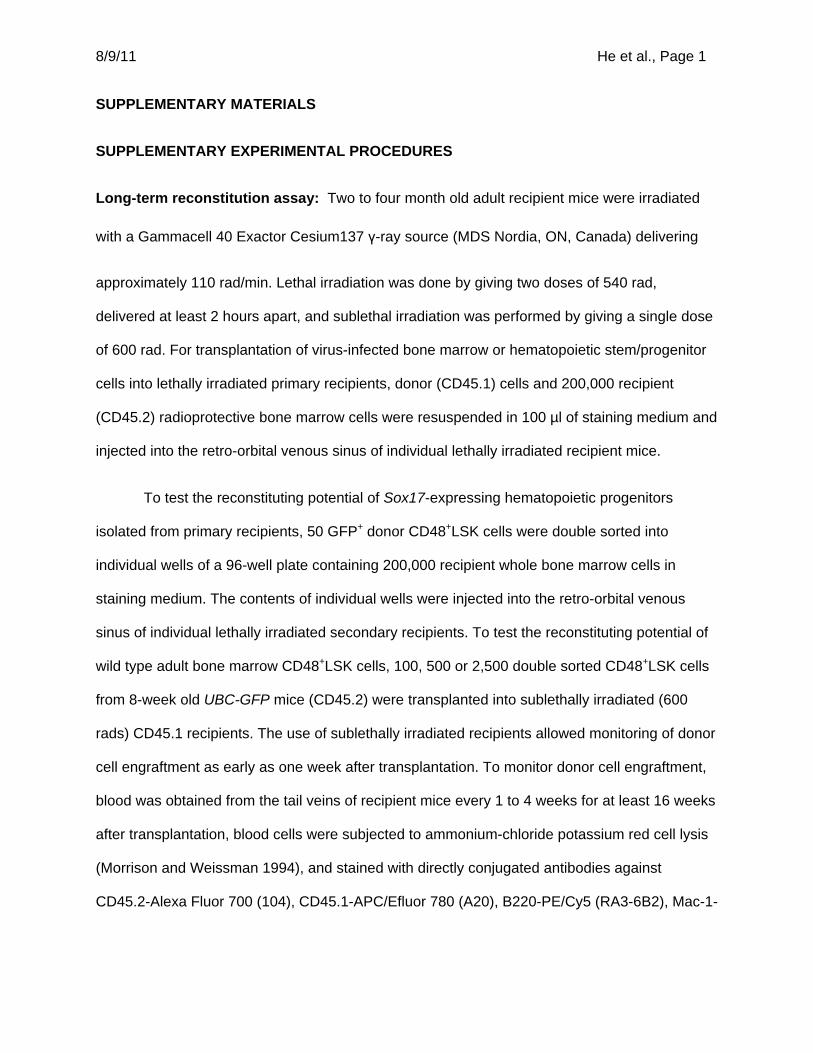
8/9/11 He et al., Page 1 SUPPLEMENTARY MATERIALS SUPPLEMENTARY EXPERIMENTAL PROCEDURES Long-term reconstitution assay: Two to four month old adult recipient mice were irradiated with a Gammacell 40 Exactor Cesium137 γ-ray source (MDS Nordia, ON, Canada) delivering approximately 110 rad/min. Lethal irradiation was done by giving two doses of 540 rad, delivered at least 2 hours apart, and sublethal irradiation was performed by giving a single dose of 600 rad. For transplantation of virus-infected bone marrow or hematopoietic stem/progenitor cells into lethally irradiated primary recipients, donor (CD45.1) cells and 200,000 recipient (CD45.2) radioprotective bone marrow cells were resuspended in 100 μl of staining medium and injected into the retro-orbital venous sinus of individual lethally irradiated recipient mice. To test the reconstituting potential of Sox17-expressing hematopoietic progenitors isolated from primary recipients, 50 GFP + donor CD48 + LSK cells were double sorted into individual wells of a 96-well plate containing 200,000 recipient whole bone marrow cells in staining medium. The contents of individual wells were injected into the retro-orbital venous sinus of individual lethally irradiated secondary recipients. To test the reconstituting potential of wild type adult bone marrow CD48 + LSK cells, 100, 500 or 2,500 double sorted CD48 + LSK cells from 8-week old UBC-GFP mice (CD45.2) were transplanted into sublethally irradiated (600 rads) CD45.1 recipients. The use of sublethally irradiated recipients allowed monitoring of donor cell engraftment as early as one week after transplantation. To monitor donor cell engraftment, blood was obtained from the tail veins of recipient mice every 1 to 4 weeks for at least 16 weeks after transplantation, blood cells were subjected to ammonium-chloride potassium red cell lysis (Morrison and Weissman 1994), and stained with directly conjugated antibodies against CD45.2-Alexa Fluor 700 (104), CD45.1-APC/Efluor 780 (A20), B220-PE/Cy5 (RA3-6B2), Mac-1-
Transcript of SUPPLEMENTARY MATERIALS SUPPLEMENTARY...
8/9/11 He et al., Page 1
SUPPLEMENTARY MATERIALS
SUPPLEMENTARY EXPERIMENTAL PROCEDURES
Long-term reconstitution assay: Two to four month old adult recipient mice were irradiated
with a Gammacell 40 Exactor Cesium137 γ-ray source (MDS Nordia, ON, Canada) delivering
approximately 110 rad/min. Lethal irradiation was done by giving two doses of 540 rad,
delivered at least 2 hours apart, and sublethal irradiation was performed by giving a single dose
of 600 rad. For transplantation of virus-infected bone marrow or hematopoietic stem/progenitor
cells into lethally irradiated primary recipients, donor (CD45.1) cells and 200,000 recipient
(CD45.2) radioprotective bone marrow cells were resuspended in 100 µl of staining medium and
injected into the retro-orbital venous sinus of individual lethally irradiated recipient mice.
To test the reconstituting potential of Sox17-expressing hematopoietic progenitors
isolated from primary recipients, 50 GFP+ donor CD48+LSK cells were double sorted into
individual wells of a 96-well plate containing 200,000 recipient whole bone marrow cells in
staining medium. The contents of individual wells were injected into the retro-orbital venous
sinus of individual lethally irradiated secondary recipients. To test the reconstituting potential of
wild type adult bone marrow CD48+LSK cells, 100, 500 or 2,500 double sorted CD48+LSK cells
from 8-week old UBC-GFP mice (CD45.2) were transplanted into sublethally irradiated (600
rads) CD45.1 recipients. The use of sublethally irradiated recipients allowed monitoring of donor
cell engraftment as early as one week after transplantation. To monitor donor cell engraftment,
blood was obtained from the tail veins of recipient mice every 1 to 4 weeks for at least 16 weeks
after transplantation, blood cells were subjected to ammonium-chloride potassium red cell lysis
(Morrison and Weissman 1994), and stained with directly conjugated antibodies against
CD45.2-Alexa Fluor 700 (104), CD45.1-APC/Efluor 780 (A20), B220-PE/Cy5 (RA3-6B2), Mac-1-
8/9/11 He et al., Page 2
PE (M1/70), CD3e-APC (145-2c11), and Gr-1-PE/Cy7 (RB6-8C5) to examine donor cell
chimerism.
Generation of MSCV-Sox17 and MSCV-Sox17his retrovirus: To generate C-terminal 6xhis
tagged mouse Sox17, full length mouse Sox17 cDNA was PCR amplified from mouse brain
cDNA. AseI and XhoI sites were added to the 5’ and 3’ ends respectively and the sequence was
inserted into NdeI/XhoI digested pET23b vector (EMD chemicals, Gibbstown, NJ) to generate
the pET23-mSox17-6xhis vector. A Sox17-6xhis fragment was then isolated using FspI/BsaAI
double digestion and inserted into HpaI digested mouse stem cell virus (MSCV) based pMIG
(MSCV-GFP) vector (Van Parijs et al. 1999), immediately upstream of the internal ribosome
entry site (IRES) to generate the MSCV-Sox17his vector. The MSCV-Sox17 vector was
generated similarly except a short linker containing an in-frame stop codon and a FspI site was
inserted into the pET-23-mSox17-6xhis vector before the 6xhis tag to generate pET23-
mSox17STOP, and a FspI fragment containing Sox17 was then inserted into HpaI digested
pMIG to generate the MSCV-Sox17 vector.
Preparation of high-titer virus was carried out by transfecting 293T cells with control
(MSCV-GFP) or Sox17-encoding MSCV vector together with the pCL-Eco packaging vector
(Naviaux et al. 1996) using standard calcium phosphate methods as previously described (He et
al. 2009). Cells were allowed to produce virus for 24-48 hours, then viral supernatants were
collected, 0.45 micron filtered, and stored at –80°C. Virus titer was determined by infecting
2x10⁵ 3T3 cells using 1, 10 or 100 µl of viral supernatant. A viral titer of 2-5x10⁶/ml was routinely
obtained.
Cytology, histology and immunohistochemistry: For Wright-Giemsa staining of blood
smears, bone marrow, spleen, and liver cells, freshly prepared blood smears and cytospun
slides were air-dried, fixed in methanol for 5 min, stained in Wright-Giemsa staining solution
8/9/11 He et al., Page 3
(Sigma, St. Louis, MO) for 2 minutes, developed in 8.3mM phosphate buffer (pH=6.8) for 2-5
min, dipped 10 times in deionized water, dehydrated through an ethanol gradient and mounted
in Permount (Fisher Scientific, Waltham MA).
For histological analysis of hematopoietic tissues, spleen, liver, lung and lymph node
samples were fixed in 10% neutral buffered formalin and paraffin embedded. Five micron
sections were cut on a Leica microtome and stained with hematoxylin and eosin following
standard protocols. Immunohistochemical staining for Von Willebrand’s Factor (VWF) on tissue
sections was performed using a DAKO Autostainer (DAKO, Carpinteria, CA) using DAKO
Envision+ and diaminobenzadine (DAB) as the chromogen. De-paraffinized sections of formalin
fixed tissue at 5µm thickness were labeled with rabbit polyclonal anti-VWF (1:500, DAKO) for 60
minutes after microwave citric acid epitope retrieval. Immunofluorescent staining of VWF on
sorted GFP+CD41+ cells was performed by fixing the sorted cells in 4% paraformaldehyde in 1x
phosphate buffered saline (PBS) for 10 min on ice, followed by washing three times with 1x PBS
and cytospinning onto microscope slides. Rehydrated slides were blocked/permeabilized with
1xPBS containing 1% Triton X-100 and 10% goat serum. Slides were stained with anti-VWF
(1:500) at 4°C overnight. After washing, slides were incubated with secondary antibodies
conjugated with Alexa Fluor 555 (Invitrogen) together with DAPI for 1 hour at room temperature.
All images were collected using an Olympus BX-71 inverted microscope with 20x and 40x dry
objectives. Histology was analyzed by a hematopathologist and classified according to the
Bethesda protocols for the classification of hematopoietic neoplasms in mice (Kogan et al. 2002;
Morse et al. 2002).
Microarray analysis: Total RNA (~5ng) was isolated from 3-5 independent, freshly isolated
aliquots of 10,000 E16.5 fetal liver HSCs, 10,000 fetal liver CD48+LSK cells, 10,000 adult bone
marrow HSCs, 10,000 adult bone marrow CD48+LSK cells, 10,000 Sox17-expressing
CD48+LSK cells isolated from primary recipients 12 weeks after transplantation of MSCV-
8/9/11 He et al., Page 4
Sox17-infected bone marrow cells, or 10,000 HSCs isolated from 8-week old Sox17-transgenic
mice that were treated with doxycycline for 5 days to induce transgene expression. Total RNA
was extracted using Trizol with 25 µg/ml linear acrylamide (Ambion, Austin, TX). The extracted
RNA (10 µl volume) was treated with 2 Units of RNase-free recombinant DNase I (Ambion) for
15 min at 25˚C, followed by 15 min at 37˚C to remove any contaminating genomic DNA. The
DNA-free RNA samples were purified using the RNA Clean & Concentrator™-5 from Zymo
Research (Orange, CA) and eluted in 10 µl of nuclease-free water. Purified RNA was reverse
transcribed and amplified using the WT-Ovation™ Pico RNA Amplification system (NuGEN
Technologies, San Carlos, CA) following the manufacturer’s instructions. Sense strand cDNA
was generated using WT-Ovation™ Exon Module (NuGEN), and fragmented and labeled using
the FL-Ovation™DNA Biotin Module V2 (NuGEN). 2.5 µg of labeled cDNA were hybridized to
Affymetrix Mouse Gene ST 1.0 microarrays. The chips were hybridized and scanned according
to the manufacturer's instructions. Expression values for all genes were calculated using the
robust multi-array average (RMA) method (Irizarry et al. 2003).
For the identification of genes with differential expression between groups, the raw
expression data were analyzed using Expander v5.1 software (Shamir et al. 2005), and genes
with fold changes greater than 2 and p-values less than 0.05 (t-test, using log2 transformed
expression values) between sample groups were considered to be significantly changed. The
complete list of differentially expressed genes between Sox17-expressing and control
CD48+LSK cells is in Suppl. Table 3; the complete list of differentially expressed genes between
Sox17-transgenic and control HSCs is in Suppl. Table 4
For Gene Set Enrichment Analysis (GSEA), normalized expression data were assessed
by GSEA 2.0.6 software as described (Mootha et al. 2003; Subramanian et al. 2005). The
complete gene expression profiles of Sox17-expressing and control CD48+LSK cells (or Sox17-
transgenic and control HSCs) were used as the background data set and the following gene
8/9/11 He et al., Page 5
sets were used as the foreground: complete C2-curated gene sets from the Broad Institute
(http://www.broadinstitute.org/gsea/index.jsp), WNT-signaling gene set and WNT-targets gene
set curated by the Broad Institute, HSC or short-term progenitor (CD48+LSK cell)-specific gene
sets, and a fetal liver HSC-specific gene set. We generated HSC or short-term progenitor
(CD48+LSK cell)-specific gene sets by comparing adult bone marrow HSCs versus bone
marrow CD48+LSK cells (p<0.05, fold change >2). We generated a fetal liver HSC-specific gene
set by comparing fetal liver HSCs versus adult bone marrow HSCs (p<0.05, fold change >2).
See Suppl. Table 2 for the complete list of genes included in the cell type-specific gene sets.
Gene Ontology (GO) and Pathway analysis were performed in Expander v5.1 software
(Shamir et al. 2005). Enrichement of GO terms or KEGG pathways were searched in three sets
of genes: genes that were significantly changed for more than 2-fold in CD48+LSK progenitors
after viral Sox17 over-expression, genes that were significantly changed in HSCs after
transgenic Sox17 over-expression, and genes that are significantly changed for more than 2-
fold in both circumstances. The lists of significantly enriched GO terms and KEGG pathways
downstream of Sox17 were summarized in Suppl. Table 5.
Quantitative RT-PCR: Quantitative (real-time) RT-PCR was performed as described previously
(Molofsky et al. 2003). Three replicates of 10,000 E16.5 fetal liver HSCs, 10,000 HSCs from
Sox17-transgenic mice that were administered with doxycycline for 5 days, and 10,000 Sox17-
expressing or control CD48+LSK cells from reconstituted primary recipients were sorted into
Trizol. RNA was isolated using chloroform extraction and isopropanol precipitation. cDNA was
made with random primers and SuperScript III reverse transcriptase (Invitrogen). Quantitative
PCR was performed with cDNA from 100-500 cell equivalents using a SYBR Green Kit and a
LightCycler 480 (Roche Applied Science). Primers used to amplify Sox17 and microarray
candidate genes are listed in Suppl. Table 1.
8/9/11 He et al., Page 6
Western blotting: Western blotting was performed as previously described (He et al. 2009).
For western blotting of protein from virus infected 3T3 cells and whole splenocytes, MSCV-
GFP, MSCV-Sox17 or MSCV-Sox17his virus infected 3T3 cells, or whole splenocytes isolated
from primary recipients reconstituted with control or Sox17 virus infected whole bone marrow
cells were homogenized in ice-cold RIPA buffer supplemented with protease inhibitor cocktail
(complete mini tablet, Roche), by brief sonication using a Virsonic-100 ultrasonic cell disruptor
(VirTis; Gardiner, NY). The cell homogenates were then spun down for 10 minutes at 4°C at
16,000g and the supernatant was quantified colorimetrically (BioRad protein assay; Bio-Rad,
Hercules, CA). 10 µg of protein per lane were separated on a 4-20% gradient Bis-Tris gel and
transferred for 2 hours to PVDF membranes (Bio-Rad) on ice. For western blotting of protein
from flow cytometrically isolated LSK cells, 50,000 E12 LSK cells, 50,000 E13.5 LSK cells,
50,000 LSK cells from primary recipients of MSCV-Sox17 or MSCV-Sox17his virus infected
adult hematopoietic cells, 50,000 LSK cells from Sox17-transgenic mice that were administered
doxycycline for 5 days, and 50,000 LSK cells from control adult mouse bone marrow were
double sorted into ice-cold staining medium. Cells were pelleted by centrifugation at 2000xg for
10 min, washed once with 1xPBS to remove residual serum proteins, then homogenized in ice-
cold RIPA buffer supplemented with protease inhibitor cocktail. The total protein was separated
on a 4-20% gradient Bis-Tris gel and transferred for 2 hours to PVDF membranes (Bio-Rad) on
ice. Primary antibodies were mouse monoclonal anti-β-actin (A1978; Sigma), polyclonal goat-
anti-SOX17 (AF1924; R&D system, Minneapolis, MN), and rabbit polyclonal anti-histone H3
(ab1791; Abcam, Cambridge, MA). Horseradish peroxidase (HRP)-conjugated secondary
antibodies, and SuperSignal West Femto Chemiluminescent Substrate (Thermo Scientific,
Rockford, IL) were used to visualize the primary antibody staining. Quantification of SOX17
protein expression level in each sample was performed by scanning the western blots, and
measuring the density of respective protein bands in ImageJ software (http://rsbweb.nih.gov/ij/).
8/9/11 He et al., Page 7
Statistics: All experiments were performed at least three times and all data are expressed as
mean±SD. Statistical comparisons between samples were performed in Excel using Student’s t-
test. Unless otherwise indicated, a p-value less than 0.05 was considered statistically
significant. The survival analysis of primary and secondary recipients was performed in
Graphpad Prism 5 software, and the p-values for log-rank test between individual curves are
presented.
SUPPLEMENTARY FIGURE LEGENDS
Supplementary figure 1: Infection by MSCV-Sox17 or MSCV-Sox17his retrovirus, but not
MSCV-GFP control retrovirus, leads to increased Sox17 expression. A). Schematic
representations of MSCV-GFP, MSCV-Sox17 and MSCV-Sox17his viruses. B) Western blotting
for SOX17 protein in control or Sox17 virus infected 3T3 cells, or splenocytes isolated from
primary recipients reconstituted with control or Sox17 virus infected bone marrow cells. SOX17
protein could only be detected in cells infected with MSCV-Sox17 or MSCV-Sox17his virus, but
not in cells infected with MSCV-GFP virus. Note that multiple bands were observed on the
SOX17 western blots and that the number and precise migration of the bands varied somewhat
among different cell types, suggesting that SOX17 may undergo different post-translational
modifications or may use alternative start sites in different cell types (Kanai et al. 1996). C).
Quantitative RT-PCR comparing the expression level of Sox17 transcripts in E16.5 fetal liver
HSCs, LSK cells isolated from primary recipients of MSCV-Sox17 or MSCV-Sox17his virus
infected adult hematopoietic cells, and HSCs isolated from Sox17-transgenic mice treated with
doxycycline for 5 days. D) Western blotting for SOX17 protein in 50,000 flow cytometrically
isolated E12 fetal liver LSK cells, E13.5 fetal liver LSK cells, LSK cells isolated from primary
recipients of MSCV-Sox17 or MSCV-Sox17his virus infected adult hematopoietic cells, LSK
8/9/11 He et al., Page 8
cells isolated from adult Sox17 transgenic mice treated with doxycycline for 5 days, and LSK
cells isolated from control adult mice. Multiple protein bands with sizes between 50 and 60 kD
(as expected for SOX17 (Kanai et al. 1996)) were detected in E12 and E13.5 LSK cells and in
adult LSK cells after ectopic Sox17 over-expression but not in control adult LSK cells. It was
unclear whether the different sizes of the SOX17 protein bands detected in different samples
reflected different post-translational modifications of SOX17 protein in fetal and adult
hematopoietic cells. Numbers on top of each lane quantitate band intensity in each lane as
measured by densitometry relative to E12 fetal liver LSK cells. Numbers without parentheses
indicate quantification based on only the bottom two bands. Numbers within parentheses
indicate quantification of all bands.
Supplementary figure 2: Representative flow-cytometry plots demonstrating the gating
schemes used to detect donor (GFP+) red blood cells (RBCs), platelets (PLT), myeloid
cells (Mac-1+ or Gr-1+), B cells (B220+) or T cells (CD3+) in the peripheral blood of primary
recipient mice at 16 weeks after transplantation. A-G) Representative flow-cytometry plots
showing GFP+ blood cells in primary recipient mice reconstituted by uninfected, MSCV-GFP-
infected, or MSCV-Sox17-infected bone marrow cells. Note the lower expression of Gr-1 by
Sox17-expressing Mac-1+ myeloid cells, similar to myeloid lineage cells in fetal liver (Fig. 3F).
For erythroid cell (RBC) and platelet (PLT) analysis, whole blood (unlysed) was used. For
analysis of all white blood cell (WBC) lineages, red blood cells were lysed prior to antibody
staining.
Supplementary figure 3: Adult bone marrow CD48+LSK cells were only able to give
transient multilineage reconstitution of irradiated mice. A-F) 100, 500 or 2500 adult bone
8/9/11 He et al., Page 9
marrow CD48+LSK cells from UBC-GFP mice were transplanted into 600 rad sublethally
irradiated recipients, and peripheral blood GFP+ cell chimerism was monitored up to 16 weeks.
Adult CD48+LSK cells gave transient multilineage reconstitution of the myeloid (A, B; Mac-1+ or
Gr-1+), B (C; B220+), T (D, CD3+), erythroid (E, Ter119+) and platelet (F, CD41+) lineages. G)
Summary of recipient reconstitution patterns by donor cells.
Supplementary figure 4: Sorting strategy for isolation of adult hematopoietic stem and
progenitor cell populations as well as viral infection efficiency. A-E) Sorting strategy for
isolation of adult bone marrow HSCs, MPPs, CD48+LSK cells, GMPs, and Pre-MegE cells. F)
Viral infection efficiency of cultured adult hematopoietic stem and progenitor cells as determined
at 48 hours after infection.
Supplementary figure 5: Ectopic Sox17-expression significantly increased the long-term
reconstituting potential of adult HSCs but not GMPs or Pre-MegE progenitors. A) 500
control or MSCV-Sox17-infected adult bone marrow HSCs were transplanted into lethally
irradiated recipients along with 200,000 recipient cells. Sox17-expressing HSCs showed
significantly increased long-term reconstitution in the myeloid (Mac-1+ or Gr-1+), erythroid
(Ter119+), and platelet (CD41+) lineages as compared to control virus infected cells at 16 weeks
after transplantation (*, p<0.05). The number to the right of each plot indicates the percentage of
cells within the indicated lineage that were GFP+ (mean±SD) at 16-weeks after transplantation.
Black lines represent individual mice infected with control virus while green lines indicate
individual mice infected with MSCV-Sox17 virus. B, C) 500 control or MSCV-Sox17-infected
bone marrow GMPs or Pre-MegEs were transplanted into lethally irradiated recipients along
with 200,000 recipient cells. Neither control nor Sox17-expressing cells from these populations
8/9/11 He et al., Page 10
gave detectable donor cell reconstitution in peripheral blood between 4 and 16 weeks after
transplantation. The numbers of recipients in each experiment can be found in Fig. 6C.
Supplementary figure 6: Sox17-expressing HSCs, MPPs, and CD48+LSK cells were
capable of giving long-term multilineage reconstitution in secondary recipients. A)
200,000 whole bone marrow cells from primary recipients of MSCV-Sox17 virus-infected HSCs,
MPPs, or CD48+LSK cells, together with 200,000 recipient cells were transplanted into
irradiated secondary recipient mice. The contribution of GFP+ donor cells to peripheral blood
was assessed 16 weeks after transplantation. B). Three of three secondary recipients of whole
bone marrow cells isolated from primary recipients of MSCV-Sox17 virus-infected HSCs
exhibited long-term reconstitution in the myeloid, erythroid, and platelet lineages. Five of 10
secondary recipients of whole bone marrow cells from primary recipients of MSCV-Sox17 virus-
infected MPPs exhibited long-term multilineage reconstitution in all blood lineages. Four of 4
secondary recipients of whole bone marrow cells from primary recipients of MSCV-Sox17 virus-
infected CD48+LSK cells exhibited long-term multilineage reconstitution in all blood lineages.
Supplementary figure 7: Ectopic Sox17-expression in adult CD48+LSK cells increased the
expression of genes preferentially expressed by HSCs and reduced the expression of
genes preferentially expressed by restricted progenitors in gene sets independently
generated by others. A-D) GSEA profiles comparing Sox17-expressing (red) and control bone
marrow (blue) CD48+LSK cells using C2-curated gene sets from the Broad Institute
(http://www.broadinstitute.org/gsea/index.jsp). Sox17-expressing CD48+LSK cells showed
significant enrichment of genes preferentially expressed by long-term self-renewing HSCs (as
compared to whole bone marrow cells (A) and depletion of genes that are preferentially
8/9/11 He et al., Page 11
expressed by various fractions of hematopoietic progenitors at various stages of maturation (as
compared to whole bone marrow cells (B-D). These gene sets were assembled by the Broad
Institute based on microarray data published by Ivanova et al. (Ivanova et al. 2002). E-F) GSEA
profiles comparing Sox17-expressing (red) and control bone marrow (blue) CD48+LSK cells
using gene sets for WNT pathway components and WNT target genes curated by the Broad
Institute. Neither gene set was significantly enriched in either the Sox17-expressing or control
CD48+LSK cells.
Supplementary figure 8: Ectopic Sox17 expression in Sox17-transgenic HSCs increased
the expression of genes associated with fetal and adult HSCs and reduced the
expression of genes associated with restricted progenitors. A). Short-term Sox17-
transgene expression significantly increased the frequency of LSK cells in the bone marrow and
spleen of Sox17-transgenic mice. B-D) GSEA profiles comparing HSCs isolated from Sox17-
transgenic (red) and control (blue) mice after 5 days of doxycycline administration. Sox17-
transgenic HSCs showed significant enrichment of fetal HSC (compared to adult bone marrow
HSCs) and adult HSC (compared to bone marrow CD48+LSK cells) gene sets (B, C), and
significant depletion of a progenitor (CD48+LSK cell compared to HSCs) gene set (D). NES
stands for normalized enrichment score. E) Comparison of the gene expression profiles of
Sox17-transgenic and control HSCs revealed 97 significantly upregulated and 7 significantly
down-regulated genes in the Sox17-expressing cells (fold change >2 and p<0.05). Eleven of the
97 upregulated genes were preferentially expressed by fetal HSCs (compared to adult HSCs,
fold >2, p<0.05), while 6 were preferentially expressed by adult HSCs (compared to fetal HSCs,
fold >2, p<0.05); four of the 7 downregulated genes were also downregulated in fetal HSCs
(compared to adult HSCs, fold >2, p<0.05). The complete list of significantly up and down
regulated genes in Sox17-transgenic HSCs can be found in Suppl. Table 4.
8/9/11 He et al., Page 12
Supplementary Figure 9: Long-term ectopic Sox17 expression in adult hematopoietic
cells induced nonlymphoid leukemias. A). H&E staining of representative tissue sections
from primary recipient mice in each treatment. Infiltration of blast cells could be seen in spleen,
liver and lung, resulting in the disruption of normal tissue architecture. Increased numbers of
erythroid cells at various stages of differentiation could also be seen in the spleens of Sox17-
expressing cell recipients (inset). B). The infiltrating blast cells in the spleens of recipients
transplanted with Sox17-expressing cells stained positively for Von Willebrand factor (VWF+,
brown), suggesting they arise from the megakaryocyte lineage. Only resident megakaryoctes
and platelets stained positively for VWF in control spleen sections. C) Wright-Giemsa staining of
cytospin preparations of bone marrow, spleen, and/or liver cell samples from moribund
recipients of Sox17-expressing or control cells showed the presence of leukemic blast cells and
expanded erythroid cells. D) Sox17-expressing GFP+c-kit+CD41+ cells had a morphology similar
to the leukemia blast cells and were also VWF+.
SUPPLEMENTARY TABLES
Supplementary table 1: List of qRT-PCR primers used to assess the expression of
candidate genes from the microarray.
Supplementary table 2: List of customized gene sets used for gene set enrichment
analysis. All gene sets were generated by comparing the global gene expression profiles
between each pair of indicated cell populations, and selected for genes that are significantly
changed (p<0.05, t-test) by more than 2-fold between samples.
8/9/11 He et al., Page 13
Supplementary table 3: Significantly upregulated and downregulated genes in Sox17-
expressing CD48+LSK cells as compared to control bone marrow CD48+LSK cells. Only
genes that were significantly (p<0.05) changed by more than 2-fold between sample groups
were listed. Whether each gene was significantly up or down regulated in HSCs (versus bone
marrow CD48+LSK cells) or fetal HSCs (versus adult bone marrow HSCs) is also indicated.
Supplementary table 4: Significantly upregulated and downregulated genes in Sox17-
transgenic HSCs as compared to littermate control HSCs after 5 days of doxycycline
administration. Only genes that were significantly (p<0.05) changed by more than 2-fold
between sample groups were listed. Whether each gene was significantly up or down regulated
in HSCs (versus bone marrow CD48+LSK cells) or fetal HSCs (versus adult bone marrow
HSCs) is indicated. Whether each gene was significantly up or down regulated in CD48+LSK
cells after retroviral over-expression of Sox17 is also indicated.
Supplementary table 5: Significantly enriched Gene Ontology (GO) terms and KEGG
pathways downstream of Sox17. Only GO terms and KEGG pathways that were significantly
(p<0.05, and p<0.01 respectively) enriched in genes that were changed in CD48+LSK cells
and/or HSCs after ectopic Sox17 expression are listed. Eight KEGG pathway maps were
enriched in genes that were significantly changed in CD48+LSK progenitors after viral Sox17
over-expression, and 2 KEGG pathway maps were enriched in genes that were significantly
changed in HSCs after transgenic Sox17 over-expression. Notably, genes from the “Cytokine-
cytokine receptor interaction” KEGG pathway were significantly enriched in both comparisons.
We identified 65 GO terms that were enriched in genes that were significantly changed in
8/9/11 He et al., Page 14
CD48+LSK progenitors after viral Sox17 over-expression, 13 GO terms that were enriched in
genes that were significantly changed in HSCs after transgenic Sox17 over-expression, and 9
GO terms that were enriched in genes that were significantly changed in both circumstances.
“Regulation of signal transduction” and “regulation of cell proliferation” were enriched GO terms
in both circumstances after ectopic Sox17 expression.
SUPPLEMENTARY REFERENCES
He S, Iwashita T, Buchstaller J, Molofsky AV, Thomas D, Morrison SJ. 2009. Bmi-1 over-expression in neural stem/progenitor cells increases proliferation and neurogenesis in culture but has little effect on these functions in vivo. Dev Biol 328: 257-272.
Irizarry RA, Hobbs B, Collin F, Beazer-Barclay YD, Antonellis KJ, Scherf U, Speed TP. 2003. Exploration, normalization, and summaries of high density oligonucleotide array probe level data. Biostatistics 4: 249-264.
Ivanova NB, Dimos JT, Schaniel C, Hackney JA, Moore KA, Lemischka IR. 2002. A stem cell molecular signature. Science (New York, NY 298: 601-604.
Kanai Y, Kanai-Azuma M, Noce T, Saido TC, Shiroishi T, Hayashi Y, Yazaki K. 1996. Identification of two Sox17 messenger RNA isoforms, with and without the high mobility group box region, and their differential expression in mouse spermatogenesis. J Cell Biol 133: 667-681.
Kogan SC, Ward JM, Anver MR, Berman JJ, Brayton C, Cardiff RD, Carter JS, deCoronado S, Downing JR, Fredrickson TN et al. 2002. Bethesda proposals for classification of nonlymphoid hematopoietic neoplasms in mice. Blood 100: 238-245.
Molofsky AV, Pardal R, Iwashita T, Park IK, Clarke MF, Morrison SJ. 2003. Bmi-1 dependence distinguishes neural stem cell self-renewal from progenitor proliferation. Nature 425: 962-967.
Mootha VK, Lindgren CM, Eriksson KF, Subramanian A, Sihag S, Lehar J, Puigserver P, Carlsson E, Ridderstrale M, Laurila E et al. 2003. PGC-1 alpha-responsive genes involved in oxidative phosphorylation are coordinately downregulated in human diabetes. Nature Genetics 34: 267-273.
Morrison SJ, Weissman IL. 1994. The long-term repopulating subset of hematopoietic stem cells is deterministic and isolatable by phenotype. Immunity 1: 661-673.
Morse HC, Anver MR, Fredrickson TN, Haines DC, Harris AW, Harris NL, Jaffe ES, Kogan SC, MacLennan ICM, Pattengale PK et al. 2002. Bethesda proposals for classification of lymphoid neoplasms in mice. Blood 100: 246-258.
Naviaux RK, Costanzi E, Haas M, Verma IM. 1996. The pCL vector system: rapid production of helper-free, high-titer, recombinant retroviruses. J Virol 70: 5701-5705.
Shamir R, Maron-Katz A, Tanay A, Linhart C, Steinfeld I, Sharan R, Shiloh Y, Elkon R. 2005. EXPANDER--an integrative program suite for microarray data analysis. BMC Bioinformatics 6: 232.
Subramanian A, Tamayo P, Mootha VK, Mukherjee S, Ebert BL, Gillette MA, Paulovich A, Pomeroy SL, Golub TR, Lander ES et al. 2005. Gene set enrichment analysis: A

8/9/11 He et al., Page 15
knowledge-based approach for interpreting genome-wide expression profiles. Proc Natl Acad Sci U S A 102: 15545-15550.
Van Parijs L, Refaeli Y, Lord JD, Nelson BH, Abbas AK, Baltimore D. 1999. Uncoupling IL-2 signals that regulate T cell proliferation, survival, and Fas-mediated activation-induced cell death. Immunity 11: 281-288.