Supplementary Information Trio cooperates with Myh9 to ...
12
Supplementary Information Trio cooperates with Myh9 to regulate neural crest- derived craniofacial development Shuyu Guo, Li Meng, Haojie Liu, Lichan Yuan, Na Zhao, Jieli Ni, Yang Zhang, Jingjing Ben, Yi-ping Li, and Junqing Ma
Transcript of Supplementary Information Trio cooperates with Myh9 to ...
Supplementary Information
Trio cooperates with Myh9 to regulate neural crest-
derived craniofacial development
Shuyu Guo, Li Meng, Haojie Liu, Lichan Yuan, Na Zhao, Jieli Ni,
Yang Zhang, Jingjing Ben, Yi-ping Li, and Junqing Ma
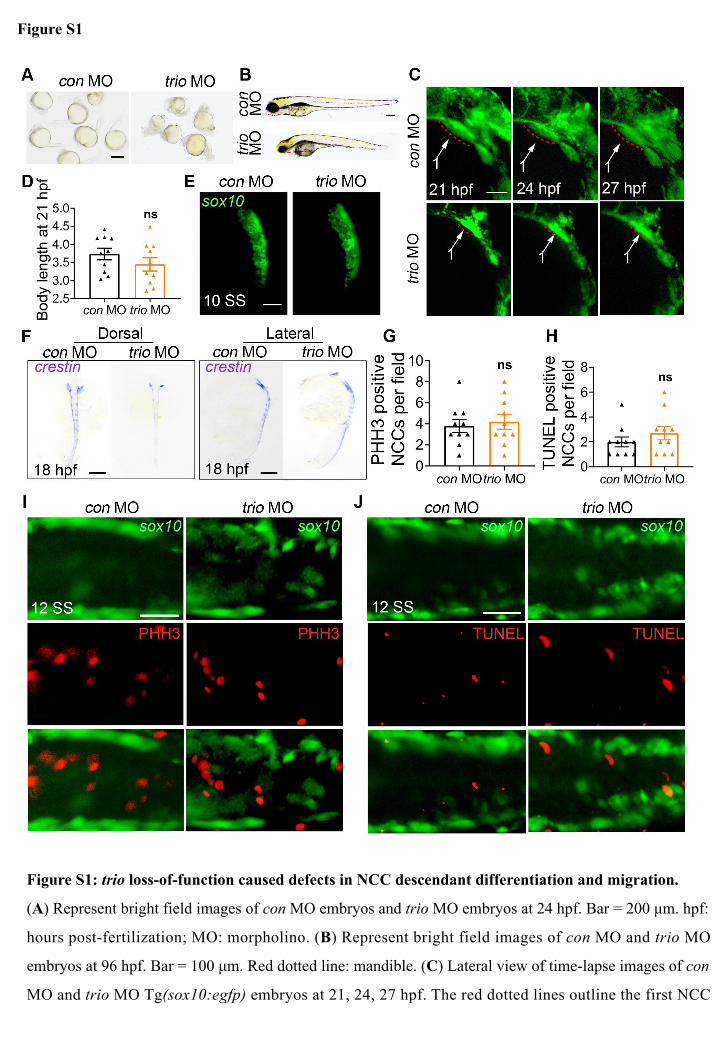
Figure S1: trio loss-of-function caused defects in NCC descendant differentiation and migration.
(A) Represent bright field images of con MO embryos and trio MO embryos at 24 hpf. Bar = 200 μm. hpf:
hours post-fertilization; MO: morpholino. (B) Represent bright field images of con MO and trio MO
embryos at 96 hpf. Bar = 100 μm. Red dotted line: mandible. (C) Lateral view of time-lapse images of con
MO and trio MO Tg(sox10:egfp) embryos at 21, 24, 27 hpf. The red dotted lines outline the first NCC
Figure S1
migratory stream. Bar = 500 μm. (D) Quantification of body length of con MO and trio MO embryos at
21 hpf (n = 10). (E) con MO and trio MO Tg(sox10:egfp) zebrafish at 10 SS. SS: somite stage. Bar = 500
μm. (F) WISH performed for the NCC migration marker crestin in con MO and trio MO zebrafish
embryos. The dorsal and lateral views of 18 hpf embryos show crestin expression in NCC migratory
streams. Bar = 200 μm. WISH: whole-mount in situ hybridization. (G, I) Image and quantitative analysis
of PHH3 staining of con MO and trio MO Tg(sox10:egfp) embryos indicate NCC proliferation in the
dosal neural tube at 12 SS (n = 10). PHH3: phosphohistone H3. Bar = 500 μm. (H, J) Image and
quantitative analysis of TUNEL staining of con MO and trio MO Tg(sox10:egfp) embryos indicate NCC
apoptosis in the dorsal neural tube at 12SS (n = 10). Bar = 500 μm. TUNEL: terminal deoxynucleotidyl
transferase dUTP nick end labeling. All data are represented as mean ± S.E.M (two-tailed t test ns, not
significantly).
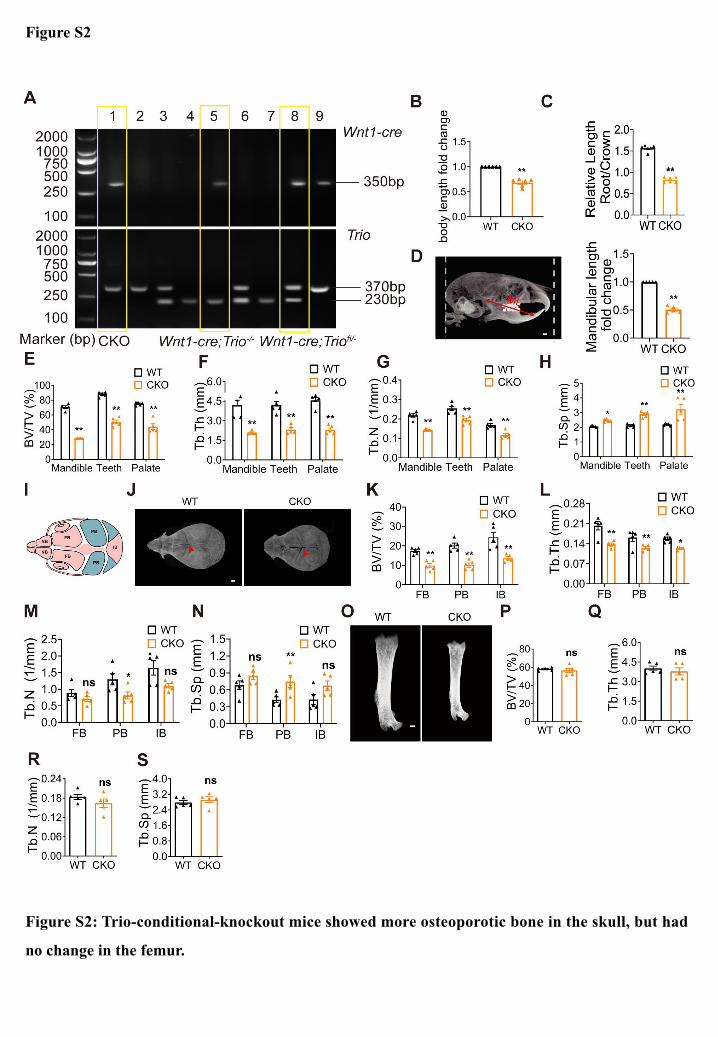
Figure S2
Figure S2: Trio-conditional-knockout mice showed more osteoporotic bone in the skull, but had
no change in the femur.
(A) Mice DNA genotypes of Wnt1-cre and Trio-flox analyzed by PCR. Upper gel represented bands of
Wnt1-cre. The lower gel contained bands of Trio. Wnt1-cre: 350-bp, Trio-flox homozygote (Triofl/fl): 370-
bp, Trio-flox heterozygote (Triofl/-): 370 and 230-bp, Trio wildtype (Trio-/-): 230-bp. Lane 1: Wnt1-
cre;Triofl/fl = CKO, lane 5: Wnt1-cre;Trio-/-, lane 8: Wnt1-cre;Triofl/-. (B) Quantification of body length fold
change of WT and CKO mice (n = 5). (C) Quantification analysis of relative length root/crown of WT and
CKO mice at P21 (n = 6). (D) Longitudinal sketch of skull and quantification of mandibular length (ML)
(n = 5). Bar = 500 μm. (E-H) Quantification of Micro-CT images of the mandible, teeth, palate area
obtained from WT and CKO mice at P21. BV/TV: bone volume fraction, Tb.Th: trabecular thickness;
Tb.N: trabecular number; Tb.Sp: trabecular separation (n = 5). (I) Schematic top view of mice skull. Pink
indicated the origin of neural crest and blue indicated the origin of mesoderm. NB: nasal bone; FB: frontal
bone; PB: parietal bone; IB: interparietal bone. (J) Top scanning of WT and CKO mice skull at P21. CKO
skull displayed incomplete closure of cranial surture (red arrow). (K-N) Quantification of micro-CT
images of frontal bone (FB), parietal bone (PB) and interparietal bone (IB) from WT and CKO mice at
P21. (O) Longitudinal scanning of femur. Bar = 500 μm. (P-S) Quantification of BV/TV, Tb.Th, Tb.N,
Tb.Sp of femur (n = 5).All data are represented as mean ± S.E.M (two-tailed t test *p < 0.05, **p < 0.01,
ns, not significantly).
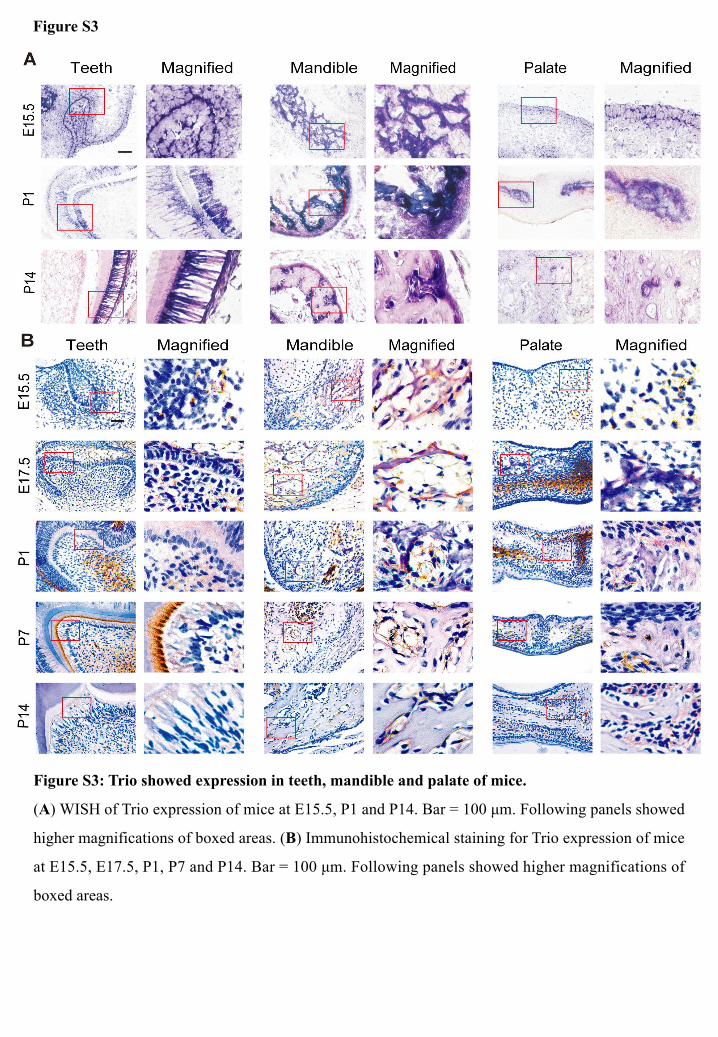
Figure S3: Trio showed expression in teeth, mandible and palate of mice.
(A) WISH of Trio expression of mice at E15.5, P1 and P14. Bar = 100 μm. Following panels showed
higher magnifications of boxed areas. (B) Immunohistochemical staining for Trio expression of mice
at E15.5, E17.5, P1, P7 and P14. Bar = 100 μm. Following panels showed higher magnifications of
boxed areas.
Figure S3
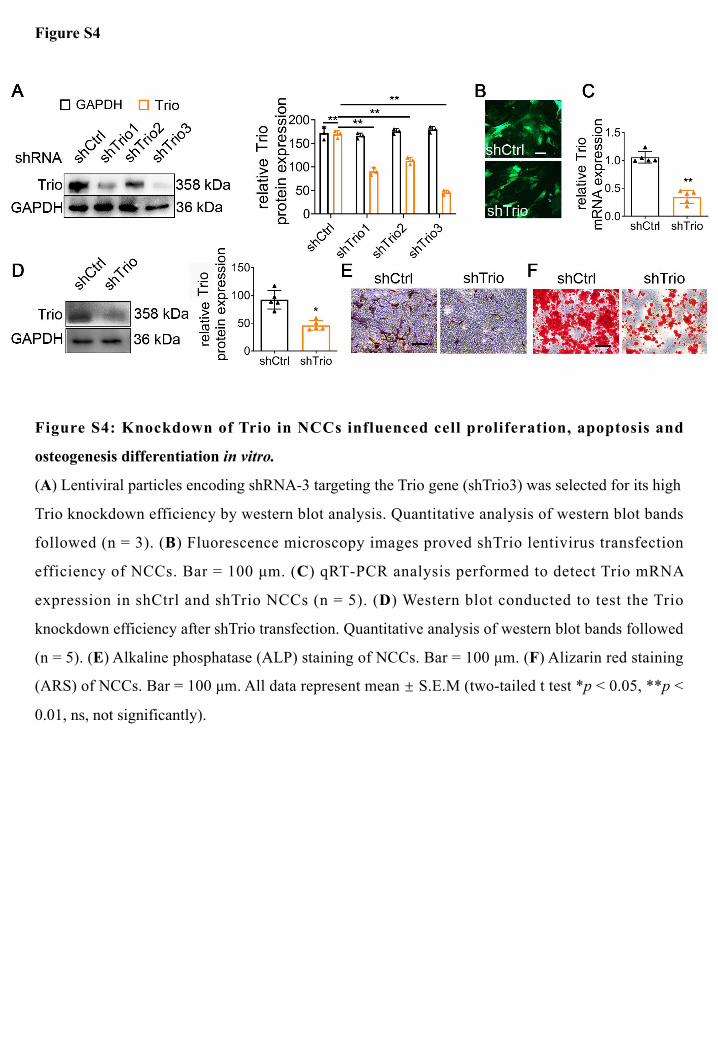
Figure S4: Knockdown of Trio in NCCs influenced cell proliferation, apoptosis and
osteogenesis differentiation in vitro.
(A) Lentiviral particles encoding shRNA-3 targeting the Trio gene (shTrio3) was selected for its high
Trio knockdown efficiency by western blot analysis. Quantitative analysis of western blot bands
followed (n = 3). (B) Fluorescence microscopy images proved shTrio lentivirus transfection
efficiency of NCCs. Bar = 100 μm. (C) qRT-PCR analysis performed to detect Trio mRNA
expression in shCtrl and shTrio NCCs (n = 5). (D) Western blot conducted to test the Trio
knockdown efficiency after shTrio transfection. Quantitative analysis of western blot bands followed
(n = 5). (E) Alkaline phosphatase (ALP) staining of NCCs. Bar = 100 μm. (F) Alizarin red staining
(ARS) of NCCs. Bar = 100 μm. All data represent mean ± S.E.M (two-tailed t test *p < 0.05, **p <
0.01, ns, not significantly).
Figure S4
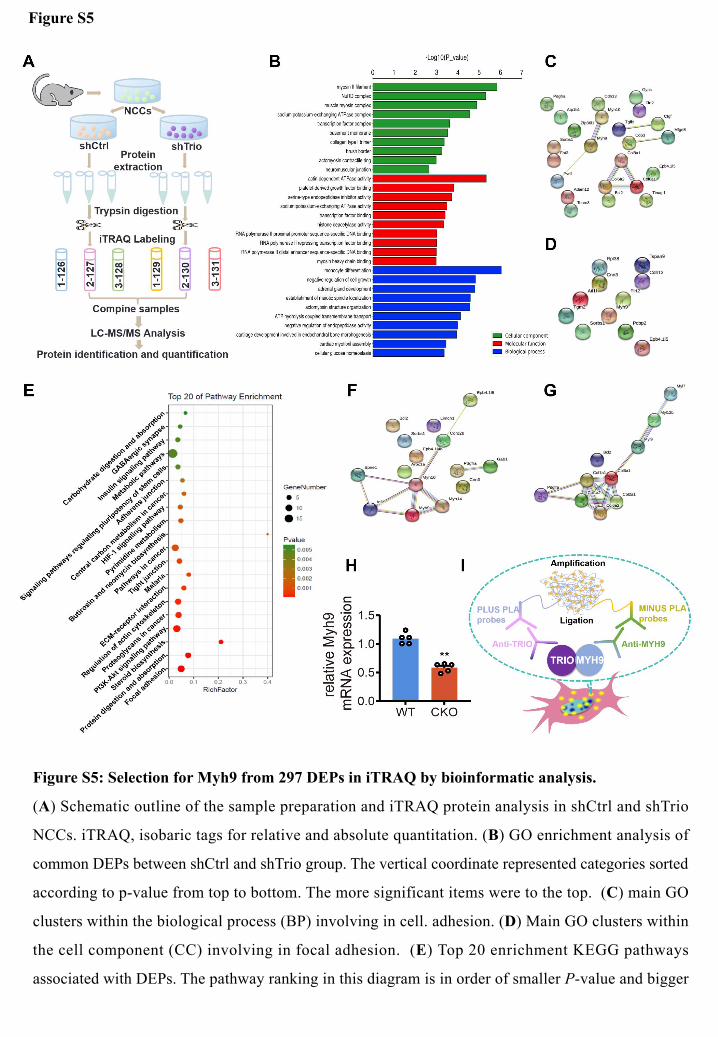
Figure S5: Selection for Myh9 from 297 DEPs in iTRAQ by bioinformatic analysis.
(A) Schematic outline of the sample preparation and iTRAQ protein analysis in shCtrl and shTrio
NCCs. iTRAQ, isobaric tags for relative and absolute quantitation. (B) GO enrichment analysis of
common DEPs between shCtrl and shTrio group. The vertical coordinate represented categories sorted
according to p-value from top to bottom. The more significant items were to the top. (C) main GO
clusters within the biological process (BP) involving in cell. adhesion. (D) Main GO clusters within
the cell component (CC) involving in focal adhesion. (E) Top 20 enrichment KEGG pathways
associated with DEPs. The pathway ranking in this diagram is in order of smaller P-value and bigger
Figure S5

gene number from top to bottom.(F) Main GO clusters within the cell component (CC) involving in
actin-cytoskeleton. (G) Main KEGG clusters involving in focal adhesion. (H) qRT-PCR analysis
performed to detect Myh9 mRNA expression in the first branchial arch of WT and CKO embryos at
E10.5 (n = 5). (I) Schematic of the proximity ligation assay (PLA) in NCCs. All data represent mean
± S.E.M (two-tailed t test **p < 0.01).
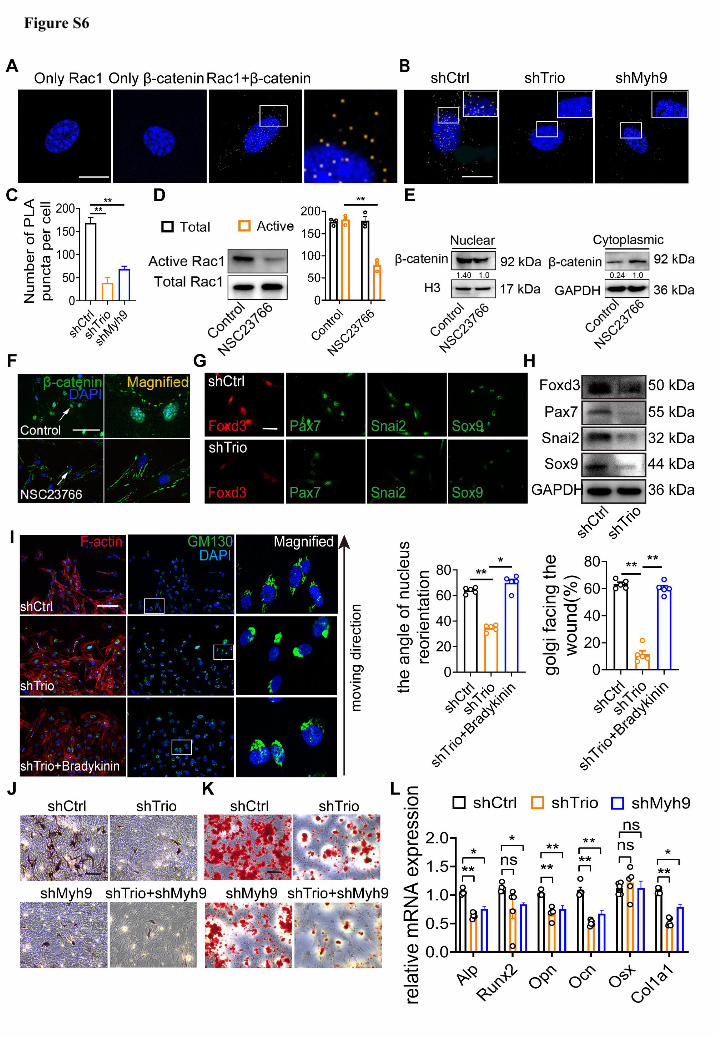
Figure S6
Figure S6: Myh9 assists Trio in regulation of NCC migration via Rac1 and Cdc42 GTPase
activation.
(A) PLA detection and visualization of Rac1 and β-catenin in NCCs. Blue: DAPI nuclear staining.
Yellow spots: PLA signals. Bar = 400 μm. (B) PLA detection and visualization of Rac1 and β-catenin
in the shTrio and shMyh9 NCC groups. Blue: DAPI nuclear staining. Yellow spots: PLA signals. Bar
= 400 μm. (C) Quantification of PLA in (B) (n = 3). (D)Image and quantification of Rac1 pull-down
activation in the Control and NSC23766 NCC groups (n = 3). (E) Western blot of β-catenin in the
nucleus and cytoplasm in the Control and NSC23766 NCC groups. (F) Immunostaining of β-catenin
(green) and DAPI (blue) for nuclear β-catenin expression indicated by a white arrow in the Control
and NSC23766 NCCs. Bar = 100 μm. (G) Immunofluorescence staining for markers of migratory
NCCs (Foxd3, Pax7, Snai2 and Sox9). Bar = 200 μm. (H) Western blot of markers of migratory NCCs
(Foxd3, Pax7, Snai2 and Sox9) in shCtrl and shTrio cells. (I) Immunofluorescence staining of the
Golgi body marker GM130 and F-actin for cell polarization assay. Nuclei were counterstained with
DAPI. Quantification analysis of percentage of the angle of nucleus reorientation and Golgi facing
the wound (n = 5). Bar = 100 μm. (J, K) ALP and ARS staining of shCtrl, shTrio, shMyh9 and shTrio
+ shMyh9 NCCs. Bar = 100 μm. (L) qRT-PCR of marker genes in osteogenic differentiation (Alp,
Runx2, Opn, Ocn, Osx, Col1a1) expression (n = 5). All data represent mean ± S.E.M (two-tailed t test
*p < 0.05, **p < 0.01, ns, not significantly).
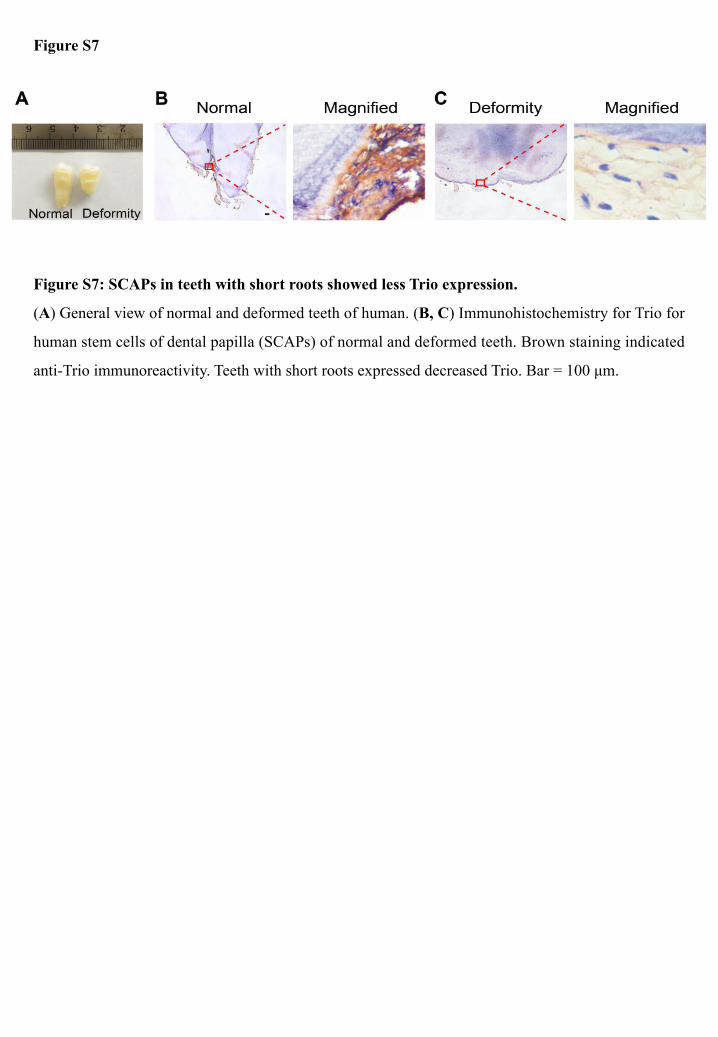
Figure S7: SCAPs in teeth with short roots showed less Trio expression.
(A) General view of normal and deformed teeth of human. (B, C) Immunohistochemistry for Trio for
human stem cells of dental papilla (SCAPs) of normal and deformed teeth. Brown staining indicated
anti-Trio immunoreactivity. Teeth with short roots expressed decreased Trio. Bar = 100 μm.
Figure S7