Sumoylation coordinates the repression of inflammatory … Nasir 03...JOURNAL CLUB 3/15/16 AMJAD...
21
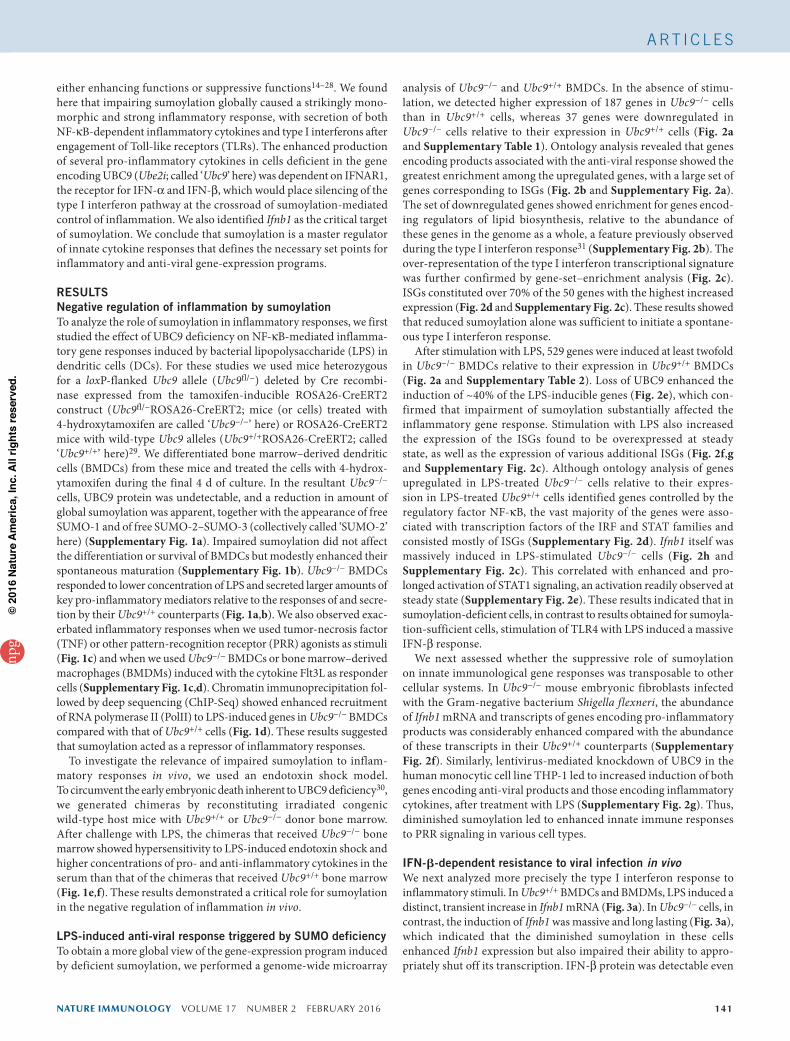
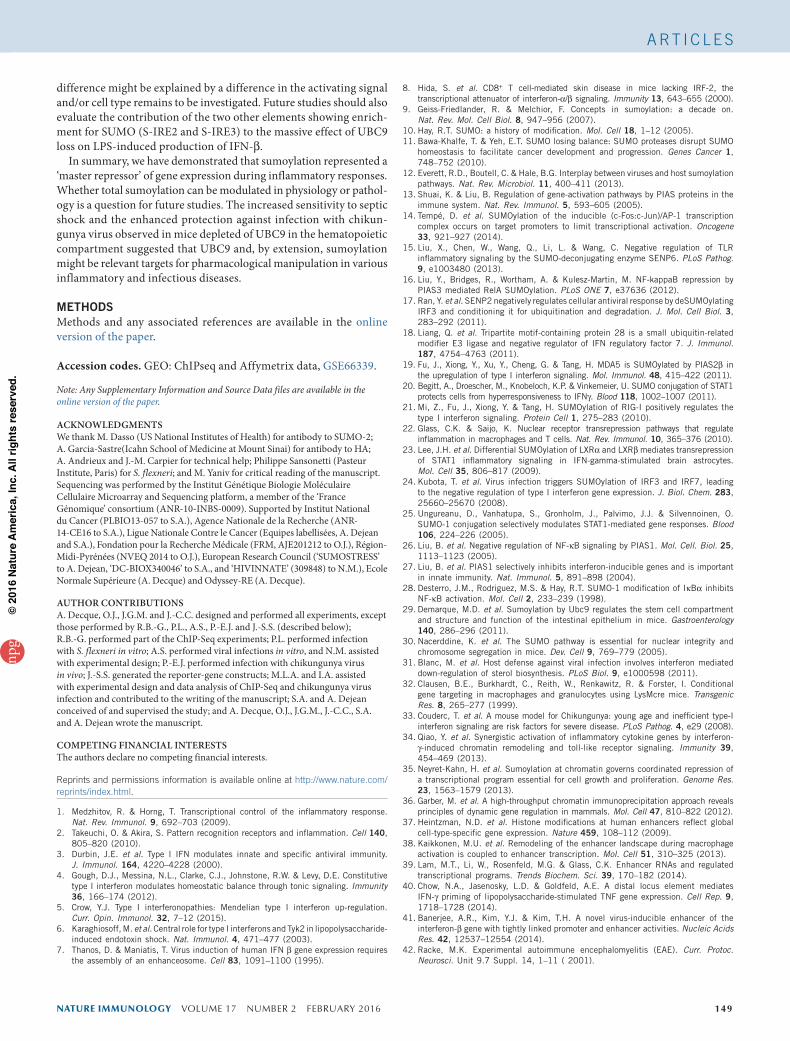
140 VOLUME 17 NUMBER 2 FEBRUARY 2016 NATURE IMMUNOLOGY ARTICLES Inflammatory responses are orchestrated by a diverse array of pro- inflammatory cytokines that are controlled largely by the transcription factor NF-κB pathway. Type I interferons and the products of inter- feron-stimulated genes (ISGs) are also involved in the modulation of inflammation and are dependent mainly on transcription factors of the IRF (‘interferon-regulatory factor’) and STAT (‘signal transducer and activator of transcription’) family 1,2 . Type I interferon is essential in pro- tection against viral infection 3 , and many products of ISGs have direct anti-viral effects. Minute amounts of type I interferons are also produced at steady state. This basal production has been proposed to regulate sev- eral biological processes, including maintenance of the hematopoietic stem cell niche and various functions of cells of the immune system 4 . Dysregulation of type I interferons has been linked to the pathogenesis of several human diseases 5,6 . Although the production of suppressive cytokines is involved in the resolution of inflammation, the molecular mechanisms that negatively control basal and induced expression of genes encoding type I interferons remain largely unknown. Pathogen-induced expression of the gene encoding interferon-β (IFN-β) is one of the best-characterized models of inducible gene expression. Induction of this gene (Ifnb1) requires recruitment of the transcription factors c-Jun, IRF3, IRF7, ATF-2 and NF-κB, which bind the Ifnb1 promoter in a cooperative fashion 7 . IFN-β triggers the induction of ISGs encoding products that contribute to pathogen restriction. In contrast, the molecular mechanisms that regulate the basal production of type I interferons are largely unknown. In the absence of innate stimuli, c-Jun and the NF-κB subunit p65 promote constitutive Ifnb1 expression, whereas homodimers of the NF-κB subunit p50 and IRF2 function as attenuators of Ifnb1 transcription 4 . However, the amount of IFN-β present after loss of p50 has not been measured, and whereas some interferon-inducible genes are upregu- lated in Irf2 −/− mice, the level of Ifnb1 transcripts in Irf2 −/− mice is similar to that in their wild-type littermates 8 . These results indicate that additional negative regulatory pathways of constitutive IFN-β production remain to be identified. Post-translational modifications by the small ubiquitin-like modi- fier SUMO regulate protein function through alterations in protein stability, interaction or activity 9,10 . Higher eukaryotes have three SUMO paralogs, SUMO-1, SUMO-2 and SUMO-3. Sumoylation is catalyzed by a specific cascade composed of the ubiquitin-activating enzyme E1 (a heterodimer of AOS1 and UBA2), the ubiquitin- conjugating enzyme E2 (UBC9) and multiple E3 ubiquitin ligase enzymes. Sumoylated proteins undergo constant cycles of conjugation- deconjugation through the action of various desumoylases, and perturbation of this balance contributes to disease 11 . Sumoylation has emerged as an important process that regulates innate immunity 12,13 , but depending on the substrate, it seems to have 1 Nuclear Organization and Oncogenesis Unit, Institut Pasteur, Paris, France. 2 INSERM, U993, Paris, France. 3 Centre de Recherche, Institut Curie, Paris, France. 4 INSERM, U932, Paris, France. 5 INSERM U1043, Centre de Physiopathologie de Toulouse-Purpan, Université de Toulouse, Université Paul Sabatier, Toulouse, France. 6 Department of Immunology, Weizmann Institute, Rehovot, Israel. 7 Laboratory of Dendritic Cell Immunobiology, Institut Pasteur, INSERM U818, Paris, France. 8 These authors contributed equally to this work. 9 These authors jointly directed this work. Correspondence should be addressed to S.A. ([email protected]) or A.D. ([email protected]). Received 15 April; accepted 2 November; published online 14 December 2015; doi:10.1038/ni.3342 Sumoylation coordinates the repression of inflammatory and anti-viral gene-expression programs during innate sensing Adrien Decque 1,2,8 , Olivier Joffre 3–5,8 , Joao G Magalhaes 3,4,8 , Jack-Christophe Cossec 1,2,8 , Ronnie Blecher-Gonen 6 , Pierre Lapaquette 1,2 , Aymeric Silvin 3,4 , Nicolas Manel 3,4 , Pierre-Emmanuel Joubert 7 , Jacob-Sebastian Seeler 1,2 , Matthew L Albert 7 , Ido Amit 6 , Sebastian Amigorena 3,4,9 & Anne Dejean 1,2,9 Innate sensing of pathogens initiates inflammatory cytokine responses that need to be tightly controlled. We found here that after engagement of Toll-like receptors (TLRs) in myeloid cells, deficient sumoylation caused increased secretion of transcription factor NF-kB–dependent inflammatory cytokines and a massive type I interferon signature. In mice, diminished sumoylation conferred susceptibility to endotoxin shock and resistance to viral infection. Overproduction of several NF- kB-dependent inflammatory cytokines required expression of the type I interferon receptor, which identified type I interferon as a central sumoylation-controlled hub for inflammation. Mechanistically, the small ubiquitin-like modifier SUMO operated from a distal enhancer of the gene encoding interferon-b (Ifnb1) to silence both basal and stimulus-induced activity of the Ifnb1 promoter. Therefore, sumoylation restrained inflammation by silencing Ifnb1 expression and by strictly suppressing an unanticipated priming by type I interferons of the TLR-induced production of inflammatory cytokines. npg © 2016 Nature America, Inc. All rights reserved.
Transcript of Sumoylation coordinates the repression of inflammatory … Nasir 03...JOURNAL CLUB 3/15/16 AMJAD...
140 VOLUME 17 NUMBER 2 FEBRUARY 2016 nature immunology
A rt i c l e s
Inflammatory responses are orchestrated by a diverse array of pro-inflammatory cytokines that are controlled largely by the transcription factor NF-κB pathway. Type I interferons and the products of inter-feron-stimulated genes (ISGs) are also involved in the modulation of inflammation and are dependent mainly on transcription factors of the IRF (‘interferon-regulatory factor’) and STAT (‘signal transducer and activator of transcription’) family1,2. Type I interferon is essential in pro-tection against viral infection3, and many products of ISGs have direct anti-viral effects. Minute amounts of type I interferons are also produced at steady state. This basal production has been proposed to regulate sev-eral biological processes, including maintenance of the hematopoietic stem cell niche and various functions of cells of the immune system4. Dysregulation of type I interferons has been linked to the pathogenesis of several human diseases5,6. Although the production of suppressive cytokines is involved in the resolution of inflammation, the molecular mechanisms that negatively control basal and induced expression of genes encoding type I interferons remain largely unknown.
Pathogen-induced expression of the gene encoding interferon-β (IFN-β) is one of the best-characterized models of inducible gene expression. Induction of this gene (Ifnb1) requires recruitment of the transcription factors c-Jun, IRF3, IRF7, ATF-2 and NF-κB, which bind the Ifnb1 promoter in a cooperative fashion7. IFN-β triggers the induction of ISGs encoding products that contribute to pathogen
restriction. In contrast, the molecular mechanisms that regulate the basal production of type I interferons are largely unknown. In the absence of innate stimuli, c-Jun and the NF-κB subunit p65 promote constitutive Ifnb1 expression, whereas homodimers of the NF-κB subunit p50 and IRF2 function as attenuators of Ifnb1 transcription4. However, the amount of IFN-β present after loss of p50 has not been measured, and whereas some interferon-inducible genes are upregu-lated in Irf2−/− mice, the level of Ifnb1 transcripts in Irf2−/− mice is similar to that in their wild-type littermates8. These results indicate that additional negative regulatory pathways of constitutive IFN-β production remain to be identified.
Post-translational modifications by the small ubiquitin-like modi-fier SUMO regulate protein function through alterations in protein stability, interaction or activity9,10. Higher eukaryotes have three SUMO paralogs, SUMO-1, SUMO-2 and SUMO-3. Sumoylation is catalyzed by a specific cascade composed of the ubiquitin-activating enzyme E1 (a heterodimer of AOS1 and UBA2), the ubiquitin- conjugating enzyme E2 (UBC9) and multiple E3 ubiquitin ligase enzymes. Sumoylated proteins undergo constant cycles of conjugation- deconjugation through the action of various desumoylases, and perturbation of this balance contributes to disease11.
Sumoylation has emerged as an important process that regulates innate immunity12,13, but depending on the substrate, it seems to have
1Nuclear Organization and Oncogenesis Unit, Institut Pasteur, Paris, France. 2INSERM, U993, Paris, France. 3Centre de Recherche, Institut Curie, Paris, France. 4INSERM, U932, Paris, France. 5INSERM U1043, Centre de Physiopathologie de Toulouse-Purpan, Université de Toulouse, Université Paul Sabatier, Toulouse, France. 6Department of Immunology, Weizmann Institute, Rehovot, Israel. 7Laboratory of Dendritic Cell Immunobiology, Institut Pasteur, INSERM U818, Paris, France. 8These authors contributed equally to this work. 9These authors jointly directed this work. Correspondence should be addressed to S.A. ([email protected]) or A.D. ([email protected]).
Received 15 April; accepted 2 November; published online 14 December 2015; doi:10.1038/ni.3342
Sumoylation coordinates the repression of inflammatory and anti-viral gene-expression programs during innate sensingAdrien Decque1,2,8, Olivier Joffre3–5,8, Joao G Magalhaes3,4,8, Jack-Christophe Cossec1,2,8, Ronnie Blecher-Gonen6, Pierre Lapaquette1,2, Aymeric Silvin3,4, Nicolas Manel3,4, Pierre-Emmanuel Joubert7, Jacob-Sebastian Seeler1,2, Matthew L Albert7, Ido Amit6, Sebastian Amigorena3,4,9 & Anne Dejean1,2,9
Innate sensing of pathogens initiates inflammatory cytokine responses that need to be tightly controlled. We found here that after engagement of Toll-like receptors (TLRs) in myeloid cells, deficient sumoylation caused increased secretion of transcription factor NF-kB–dependent inflammatory cytokines and a massive type I interferon signature. In mice, diminished sumoylation conferred susceptibility to endotoxin shock and resistance to viral infection. Overproduction of several NF-kB-dependent inflammatory cytokines required expression of the type I interferon receptor, which identified type I interferon as a central sumoylation-controlled hub for inflammation. Mechanistically, the small ubiquitin-like modifier SUMO operated from a distal enhancer of the gene encoding interferon-b (Ifnb1) to silence both basal and stimulus-induced activity of the Ifnb1 promoter. Therefore, sumoylation restrained inflammation by silencing Ifnb1 expression and by strictly suppressing an unanticipated priming by type I interferons of the TLR-induced production of inflammatory cytokines.
npg
© 2
016
Nat
ure
Am
eric
a, In
c. A
ll rig
hts
rese
rved
.
CGRANTHA
Text Box
JOURNAL CLUB 3/15/16 AMJAD NASIR
nature immunology VOLUME 17 NUMBER 2 FEBRUARY 2016 141
either enhancing functions or suppressive functions14–28. We found here that impairing sumoylation globally caused a strikingly mono-morphic and strong inflammatory response, with secretion of both NF-κB-dependent inflammatory cytokines and type I interferons after engagement of Toll-like receptors (TLRs). The enhanced production of several pro-inflammatory cytokines in cells deficient in the gene encoding UBC9 (Ube2i; called ‘Ubc9’ here) was dependent on IFNAR1, the receptor for IFN-α and IFN-β, which would place silencing of the type I interferon pathway at the crossroad of sumoylation-mediated control of inflammation. We also identified Ifnb1 as the critical target of sumoylation. We conclude that sumoylation is a master regulator of innate cytokine responses that defines the necessary set points for inflammatory and anti-viral gene-expression programs.
RESULTSNegative regulation of inflammation by sumoylationTo analyze the role of sumoylation in inflammatory responses, we first studied the effect of UBC9 deficiency on NF-κB-mediated inflamma-tory gene responses induced by bacterial lipopolysaccharide (LPS) in dendritic cells (DCs). For these studies we used mice heterozygous for a loxP-flanked Ubc9 allele (Ubc9fl/−) deleted by Cre recombi-nase expressed from the tamoxifen-inducible ROSA26-CreERT2 construct (Ubc9fl/−ROSA26-CreERT2; mice (or cells) treated with 4-hydroxytamoxifen are called ‘Ubc9−/−’ here) or ROSA26-CreERT2 mice with wild-type Ubc9 alleles (Ubc9+/+ROSA26-CreERT2; called ‘Ubc9+/+’ here)29. We differentiated bone marrow–derived dendritic cells (BMDCs) from these mice and treated the cells with 4-hydrox-ytamoxifen during the final 4 d of culture. In the resultant Ubc9−/− cells, UBC9 protein was undetectable, and a reduction in amount of global sumoylation was apparent, together with the appearance of free SUMO-1 and of free SUMO-2–SUMO-3 (collectively called ‘SUMO-2’ here) (Supplementary Fig. 1a). Impaired sumoylation did not affect the differentiation or survival of BMDCs but modestly enhanced their spontaneous maturation (Supplementary Fig. 1b). Ubc9−/− BMDCs responded to lower concentration of LPS and secreted larger amounts of key pro-inflammatory mediators relative to the responses of and secre-tion by their Ubc9+/+ counterparts (Fig. 1a,b). We also observed exac-erbated inflammatory responses when we used tumor-necrosis factor (TNF) or other pattern-recognition receptor (PRR) agonists as stimuli (Fig. 1c) and when we used Ubc9−/− BMDCs or bone marrow–derived macrophages (BMDMs) induced with the cytokine Flt3L as responder cells (Supplementary Fig. 1c,d). Chromatin immunoprecipitation fol-lowed by deep sequencing (ChIP-Seq) showed enhanced recruitment of RNA polymerase II (PolII) to LPS-induced genes in Ubc9−/− BMDCs compared with that of Ubc9+/+ cells (Fig. 1d). These results suggested that sumoylation acted as a repressor of inflammatory responses.
To investigate the relevance of impaired sumoylation to inflam-matory responses in vivo, we used an endotoxin shock model. To circumvent the early embryonic death inherent to UBC9 deficiency30, we generated chimeras by reconstituting irradiated congenic wild-type host mice with Ubc9+/+ or Ubc9−/− donor bone marrow. After challenge with LPS, the chimeras that received Ubc9−/− bone marrow showed hypersensitivity to LPS-induced endotoxin shock and higher concentrations of pro- and anti-inflammatory cytokines in the serum than that of the chimeras that received Ubc9+/+ bone marrow (Fig. 1e,f). These results demonstrated a critical role for sumoylation in the negative regulation of inflammation in vivo.
LPS-induced anti-viral response triggered by SUMO deficiencyTo obtain a more global view of the gene-expression program induced by deficient sumoylation, we performed a genome-wide microarray
analysis of Ubc9−/− and Ubc9+/+ BMDCs. In the absence of stimu-lation, we detected higher expression of 187 genes in Ubc9−/− cells than in Ubc9+/+ cells, whereas 37 genes were downregulated in Ubc9−/− cells relative to their expression in Ubc9+/+ cells (Fig. 2a and Supplementary Table 1). Ontology analysis revealed that genes encoding products associated with the anti-viral response showed the greatest enrichment among the upregulated genes, with a large set of genes corresponding to ISGs (Fig. 2b and Supplementary Fig. 2a). The set of downregulated genes showed enrichment for genes encod-ing regulators of lipid biosynthesis, relative to the abundance of these genes in the genome as a whole, a feature previously observed during the type I interferon response31 (Supplementary Fig. 2b). The over-representation of the type I interferon transcriptional signature was further confirmed by gene-set–enrichment analysis (Fig. 2c). ISGs constituted over 70% of the 50 genes with the highest increased expression (Fig. 2d and Supplementary Fig. 2c). These results showed that reduced sumoylation alone was sufficient to initiate a spontane-ous type I interferon response.
After stimulation with LPS, 529 genes were induced at least twofold in Ubc9−/− BMDCs relative to their expression in Ubc9+/+ BMDCs (Fig. 2a and Supplementary Table 2). Loss of UBC9 enhanced the induction of ~40% of the LPS-inducible genes (Fig. 2e), which con-firmed that impairment of sumoylation substantially affected the inflammatory gene response. Stimulation with LPS also increased the expression of the ISGs found to be overexpressed at steady state, as well as the expression of various additional ISGs (Fig. 2f,g and Supplementary Fig. 2c). Although ontology analysis of genes upregulated in LPS-treated Ubc9−/− cells relative to their expres-sion in LPS-treated Ubc9+/+ cells identified genes controlled by the regulatory factor NF-κB, the vast majority of the genes were asso-ciated with transcription factors of the IRF and STAT families and consisted mostly of ISGs (Supplementary Fig. 2d). Ifnb1 itself was massively induced in LPS-stimulated Ubc9−/− cells (Fig. 2h and Supplementary Fig. 2c). This correlated with enhanced and pro-longed activation of STAT1 signaling, an activation readily observed at steady state (Supplementary Fig. 2e). These results indicated that in sumoylation-deficient cells, in contrast to results obtained for sumoyla-tion-sufficient cells, stimulation of TLR4 with LPS induced a massive IFN-β response.
We next assessed whether the suppressive role of sumoylation on innate immunological gene responses was transposable to other cellular systems. In Ubc9−/− mouse embryonic fibroblasts infected with the Gram-negative bacterium Shigella flexneri, the abundance of Ifnb1 mRNA and transcripts of genes encoding pro-inflammatory products was considerably enhanced compared with the abundance of these transcripts in their Ubc9+/+ counterparts (Supplementary Fig. 2f). Similarly, lentivirus-mediated knockdown of UBC9 in the human monocytic cell line THP-1 led to increased induction of both genes encoding anti-viral products and those encoding inflammatory cytokines, after treatment with LPS (Supplementary Fig. 2g). Thus, diminished sumoylation led to enhanced innate immune responses to PRR signaling in various cell types.
IFN-b-dependent resistance to viral infection in vivoWe next analyzed more precisely the type I interferon response to inflammatory stimuli. In Ubc9+/+ BMDCs and BMDMs, LPS induced a distinct, transient increase in Ifnb1 mRNA (Fig. 3a). In Ubc9−/− cells, in contrast, the induction of Ifnb1 was massive and long lasting (Fig. 3a), which indicated that the diminished sumoylation in these cells enhanced Ifnb1 expression but also impaired their ability to appro-priately shut off its transcription. IFN-β protein was detectable even
A rt i c l e s
npg
© 2
016
Nat
ure
Am
eric
a, In
c. A
ll rig
hts
rese
rved
.
142 VOLUME 17 NUMBER 2 FEBRUARY 2016 nature immunology
A rt i c l e s
in unstimulated Ubc9−/− cells and was produced in very large amounts after stimulation with LPS (Fig. 3b). We obtained similar results for the chemokine CCL2, encoded by an ISG (Fig. 3b,c). We also observed that Ubc9−/− cells produced a larger amount of IFN-β than did Ubc9+/+ cells in an in vivo model of endotoxin shock in which LPS responsiveness was restricted to the Ubc9+/+ or Ubc9−/− hematopoietic compartment (Supplementary Fig. 3a,b). Local ChIP analysis of the Ifnb1 locus revealed enhanced recruitment of PolII in LPS-treated Ubc9−/− BMDCs compared with its recruitment in Ubc9+/+ BMDCs (Fig. 3d), which indicated that the effect of deficient sumoylation on Ifnb1 mRNA expression occurred at the transcriptional level. These results showed that diminished sumoylation resulted in constitutive IFN-β production and that IFN-β production was massively increased and prolonged in response to LPS.
To determine if the increased production of IFN-β by UBC9-deficient cells had an effect on anti-viral responses, we first infected Ubc9+/+ or Ubc9−/− BMDCs with H1N1 influenza virus or with the attenuated poxvirus vaccine MVA-B (‘modified vaccinia Ankara’), which encodes human immunodeficiency virus (HIV) antigens. The frequency of infected cells and the quantity of virus per cell were significantly lower in sumoylation-deficient BMDCs than in sumoyla-tion-sufficient BMDCs after infection with influenza virus (Fig. 3e).
After infection with MVA-B, the frequency of infected cells was similar in the presence or absence of sumoylation, but UBC9-deficient cells still resisted the infection better, as indicated by the lower quantity of virus in Ubc9−/− cells than in Ubc9+/+ cells (Fig. 3e). These data showed that UBC9-deficient cells were more resistant to viral infec-tion than were their Ubc9+/+ counterparts.
To test the in vivo relevance of that observation, we generated mice that selectively lacked UBC9 in the myeloid lineage, via myeloid cell–specific deletion of loxP-flanked Ubc9 alleles by Cre recombinase expressed from the Lyz2 promoter (Ubc9fl/flLyz2-Cre)32. Analysis of BMDCs revealed ~65% less UBC9 protein in Ubc9fl/flLyz2-Cre cells than in Ubc9+/+Lyz2-Cre cells and confirmed the exacerbated anti-viral and pro-inflammatory response observed in Ubc9fl/−Lyz2-Cre BMDCs upon stimulation with LPS relative to that in Ubc9+/+Lyz2-Cre BMDCs (Supplementary Fig. 3c,d). Flow cytometry of bone marrow from Ubc9fl/flLyz2-Cre mice revealed no apparent abnormality (Supplementary Fig. 3e). We next infected 9-day-old Ubc9fl/flLyz2-Cre and Ubc9+/+Lyz2-Cre neo-natal mice with the type I interferon–sensitive chikungunya virus33. Whereas 40% of Ubc9+/+Lyz2-Cre mice succumbed to this infection, we observed no mortality in their Ubc9fl/flLyz2-Cre counterparts (Fig. 3f). Moreover, Ubc9fl/flLyz2-Cre mice showed attenuated symptoms associated with this infection (Fig. 3g and Supplementary Fig. 3f),
ba
c d
0 3 6 12 25 500
10
20
30
40
LPS (ng/ml)
CC
L3 (
ng/m
l)
0 3 6 12 25 500
10
20
30
LPS (ng/ml)
CC
L4 (
ng/m
l)
0 3 6 12 25 500
20
40
60
LPS (ng/ml)
IL-6
(ng
/ml)
0 3 6 12 25 500
2
4
6
8
LPS (ng/ml)
TN
F (n
g/m
l)
0 1 6 12 240
20
40
60
Il6 m
RN
A (
rela
tive)
0
10
20
30
40
Tnf m
RN
A (
rela
tive)
0 1 6 12 24
Time (h) Time (h)
0
20
40
60
Ccl
3 m
RN
A (
rela
tive)
0 1 6 12 24
Time (h)
0 1 6 12 24
Time (h)
0
20
40
60
Ccl
4 m
RN
A (
rela
tive)
1 5 50 500
0
1
2
3
TNF (pg/ml)
CC
L4 (
ng/m
l)
0
5
10
15
CC
L4 (
ng/m
l)
Zymosan (µg/ml)
0 0.1 0.3 1 3 10
0
2
4
6
Pam3CSK4 (ng/ml)
CC
L4 (
ng/m
l)
0 7 15 30 60 125
250
500
0 60 125 250 5000
10
20
30
CpG (nM)
CC
L4 (
ng/m
l)
***
**
*
*
***
*
*
*
**
**
**
**
***
**
**
*
*
***
***
***
*
*
*
1 kb
Il6
(4)
(4)
(4)
(4)
Ccl5
5 kb
(4)
(4)
(4)
(4)
–
+
LPS
–
+
–
+Ubc9+/+
LPS
Ubc9–/–
–
+
Ubc9+/+
Ubc9–/–
Ubc9+/+
Ubc9–/–Ubc9+/+
Ubc9–/–
Ubc9+/+
Ubc9–/–
Ubc9+/+
Ubc9–/–
NDND
NDND
NDNDND ND
0
200
400
600
800
IL-6
(ng
/ml)
LPS
PBS0
50
100
150
200T
NF
(pg
/ml)
LPS
PBS0
200
400
600
800
IL-1
0 (p
g/m
l)
LPS
PBS0
100
200
300
400
CC
L3 (
pg/m
l)
LPS
PBS
e f* * * *
Ubc9–/– + PBS
Ubc9–/– + LPSUbc9+/+ + LPS
0 24 48 720
20
40
60
80
100
Time (h)
Sur
viva
l (%
)
**
NDND NDND NDND NDND
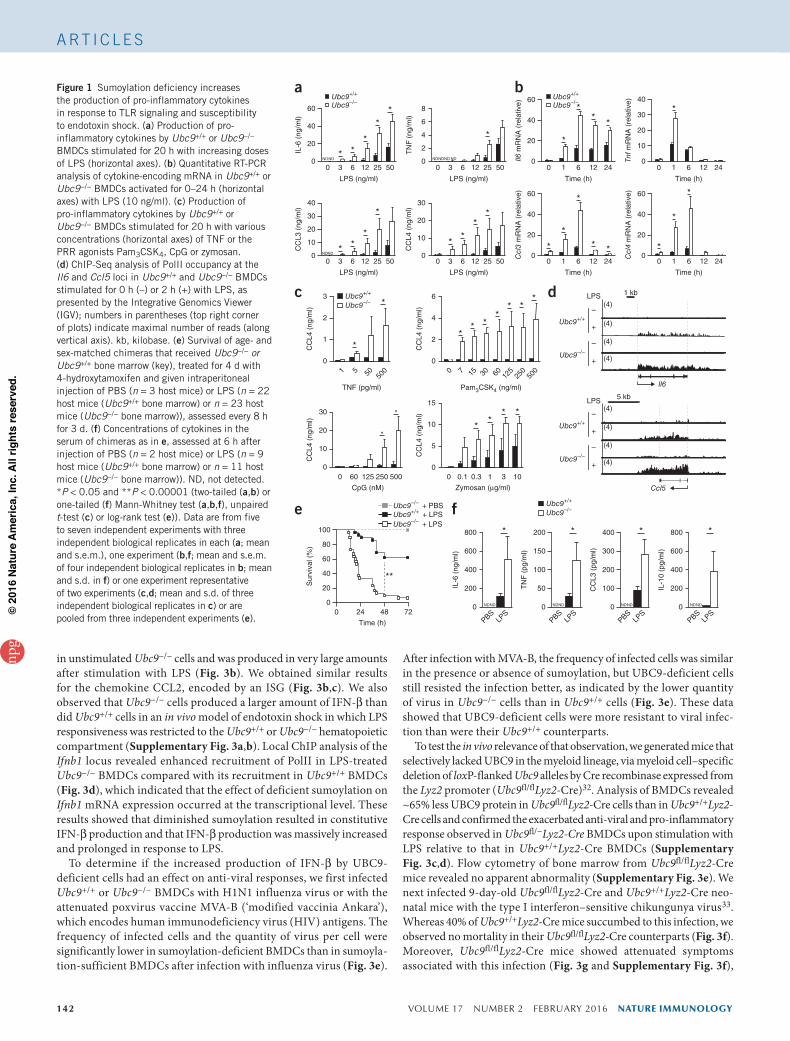
Figure 1 Sumoylation deficiency increases the production of pro-inflammatory cytokines in response to TLR signaling and susceptibility to endotoxin shock. (a) Production of pro-inflammatory cytokines by Ubc9+/+ or Ubc9−/− BMDCs stimulated for 20 h with increasing doses of LPS (horizontal axes). (b) Quantitative RT-PCR analysis of cytokine-encoding mRNA in Ubc9+/+ or Ubc9−/− BMDCs activated for 0–24 h (horizontal axes) with LPS (10 ng/ml). (c) Production of pro-inflammatory cytokines by Ubc9+/+ or Ubc9−/− BMDCs stimulated for 20 h with various concentrations (horizontal axes) of TNF or the PRR agonists Pam3CSK4, CpG or zymosan. (d) ChIP-Seq analysis of PolII occupancy at the Il6 and Ccl5 loci in Ubc9+/+ and Ubc9−/− BMDCs stimulated for 0 h (–) or 2 h (+) with LPS, as presented by the Integrative Genomics Viewer (IGV); numbers in parentheses (top right corner of plots) indicate maximal number of reads (along vertical axis). kb, kilobase. (e) Survival of age- and sex-matched chimeras that received Ubc9−/− or Ubc9+/+ bone marrow (key), treated for 4 d with 4-hydroxytamoxifen and given intraperitoneal injection of PBS (n = 3 host mice) or LPS (n = 22 host mice (Ubc9+/+ bone marrow) or n = 23 host mice (Ubc9−/− bone marrow)), assessed every 8 h for 3 d. (f) Concentrations of cytokines in the serum of chimeras as in e, assessed at 6 h after injection of PBS (n = 2 host mice) or LPS (n = 9 host mice (Ubc9+/+ bone marrow) or n = 11 host mice (Ubc9−/− bone marrow)). ND, not detected. *P < 0.05 and **P < 0.00001 (two-tailed (a,b) or one-tailed (f) Mann-Whitney test (a,b,f), unpaired t-test (c) or log-rank test (e)). Data are from five to seven independent experiments with three independent biological replicates in each (a; mean and s.e.m.), one experiment (b,f; mean and s.e.m. of four independent biological replicates in b; mean and s.d. in f) or one experiment representative of two experiments (c,d; mean and s.d. of three independent biological replicates in c) or are pooled from three independent experiments (e).
npg
© 2
016
Nat
ure
Am
eric
a, In
c. A
ll rig
hts
rese
rved
.
nature immunology VOLUME 17 NUMBER 2 FEBRUARY 2016 143
A rt i c l e s
concomitant with enhanced abundance of Ifnb, ISG and inflammatory cytokine–encoding mRNA in the skin and muscle 3 d after infection, compared with that in Ubc9+/+Lyz2-Cre mice (Fig. 3h). These results indicated that sumoylation exerted a repressive function in innate immunity to viral infection by dampening IFN-β production.
Requirement for IFNAR1 signaling in SUMO-dependent inflammationTo investigate the molecular mechanism(s) underlying the increased inflammatory response observed upon sumoylation deficiency, we analyzed TLR4-induced signaling in BMDCs but failed to detect dif-ferences between Ubc9+/+ cells and Ubc9−/− cells (Supplementary Fig. 4a–c). We then investigated the contribution of IFNAR1 to the inflammatory and anti-viral responses regulated by sumoylation. The spontaneous induction of Ifnb1 mRNA and basal secretion of IFN-β observed in Ubc9−/− cells were almost entirely abrogated in Ubc9−/−Ifnar1−/− cells (Fig. 4a,b). This observation was consistent with the disruption of a positive feedback loop of Ifnb1 expression that was amplified by IFNAR1 signaling in DCs.
In contrast to their constitutive expression, the massive induction of Ifnb1 mRNA and IFN-β protein after treatment with LPS was comparable in Ubc9−/−Ifnar1−/− cells and Ubc9−/− cells (Fig. 4a,b), which indicated that IFNAR1-mediated signaling was dispensable for the enhanced production of IFN-β in Ubc9−/− cells. As expected, the induction of STAT1-dependent ISGs largely required signaling via IFNAR1 (Fig. 4c). Furthermore, the LPS-induced transcription of NF-κB-dependent genes in Ubc9+/+ cells was not altered in the absence of IFNAR1 (Fig. 4d). In contrast, the enhanced induction of mRNA encoding interleukin 6 (IL-6), as well as that of IL-6 pro-tein itself, was abrogated in Ubc9−/− cells in the absence of IFNAR1 (Fig. 4d,e). In addition, the greater abundance of Ccl3 and Nos2 mRNA in Ubc9−/− than in Ubc9+/+ cells was also lost in the absence of IFNAR1 (Fig. 4d). Therefore, the enhanced induction of various NF-κB-dependent genes following treatment with LPS was depend-ent on IFNAR1 expression in Ubc9−/− cells. Type I interferons thus mediated substantial activation of the inflammatory response in Ubc9−/− cells by enhancing their responsiveness to LPS, and Ifnb1
Ifnb1
Tnfsf
10
Pydc3
Ccl12Clic
5Iig
p1Ccl7
Pydc4Slfn
4
Cxcl11Nos
2
Sim. t
o Ifit
3Isg
20Gbp9
Gbp4
Sema6
a
Fcgr1
Ms4
a4c
Phf11
Ms4
a6bSlfn
1
Fam26
fKdr
Trim
30dTg
tp1
BC0949
16
Cmpk2H28
Cxcl9
Dnase
1l3
Pde7b
Serpina
3fKlrk
1
Gbp11
Tagap
Iqgap
2M
x2
Ddx60Oas
3Il2
7
Cyp4a
12b
Tnfsf
8
Enpp4
Ccl2
Cyp4a
12all1
5ra
Phf11
dHdc
Mx1Ifi2
05
2
4
6
8
Exp
ress
ion
(log 2
fold
)
h
–0.8
Enr
ichm
ent s
core
–0.6
–0.4–0.2
0
Rank in ordered data set
P < 0.001
lnterferon signature
cb
4 6 8 10 12 144
6
8
10
12
14
mRNA expression (log2)Ubc9+/+ BMDCs
mR
NA
exp
ress
ion
(log 2
)U
bc9
–/– B
MD
Cs
a
Upr
egul
ated
gen
esD
ownr
egul
ated
gen
es
0 6
400
200
0
200
400
600
LPSstimulation (h)
187
529
351
37
IFN response
Others
Inflammatoryresponse
IFN response
OthersInflammatoryresponse
Ubc9+/+ > Ubc9–/– Ubc9–/– > Ubc9+/+
4 6 8 10 12 144
6
8
10
12
14e f
LPS-inducible
Ubc9-affected
179
112
417
Rank in ordered data set
Ubc9+/+ > Ubc9–/–
–0.8Enr
ichm
ent s
core
–0.6
–0.4–0.2
0
lnterferon signature
P < 0.001
g
Ubc9–/– > Ubc9+/+
mRNA expression (log2)Ubc9+/+ BMDCs
mR
NA
exp
ress
ion
(log 2
)
Ub
c9–/
– BM
DC
s
Ifit3
Sim. t
o Ifit
3Ifit
1Ifi4
4Ifit
2Rtp
4Irf
7Slfn
1Ifi2
05
Cxcl10
Oasl2
Rsad2
H28
Sema6
a
Ramp3
Ms4
a6b
Mpa2
l
Phf11Gbp4
Usp18
Trim
30dM
x2Isg
15Dhfr
Pyhin1Oas
3
Cmpk2
Gbp9
Sim. t
o Phf
11
Cyp4a
12a
Cyp4a
12bTg
tp1
Pydc4
Ddx60
Serpina
3f
Ms4
a4c
Ms4
a6c
Rnf21
3
Gm12
250Tt
c28Oas
2Slfn
4Slfn
8Xaf
1Ifi2
04
Oasl1Vca
nIrg
1Zbp1
H2-Q6
2
4
6
8
dE
xpre
ssio
n (lo
g 2 fo
ld)
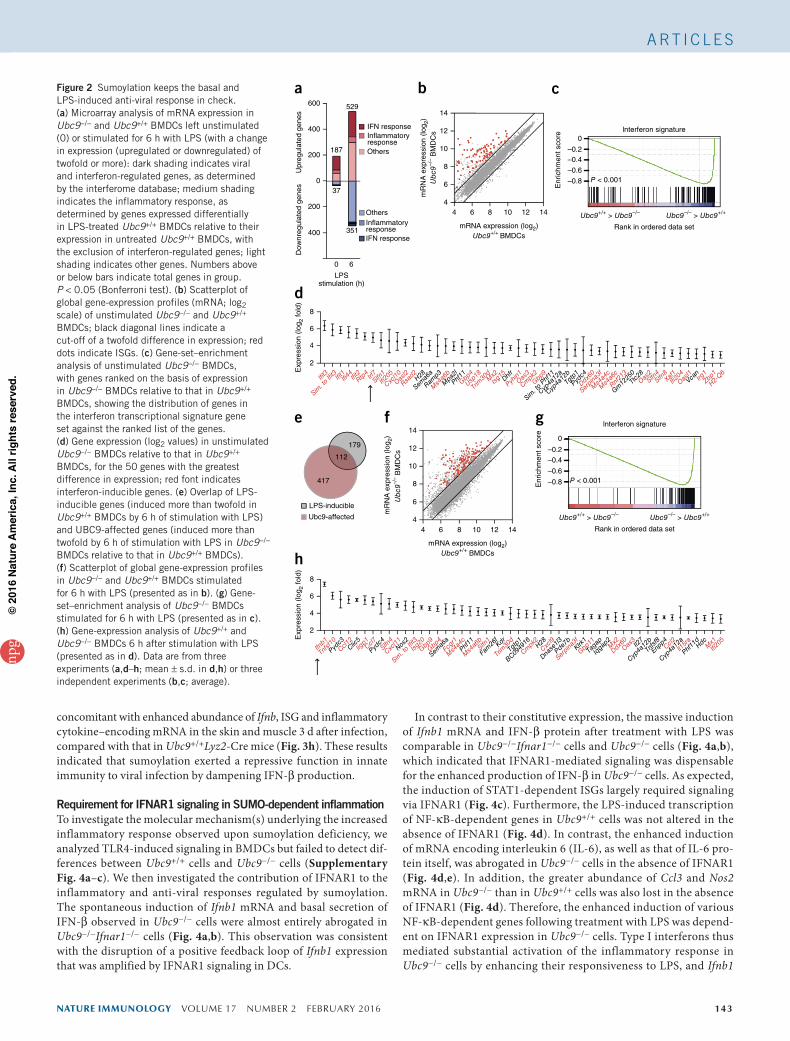
Figure 2 Sumoylation keeps the basal and LPS-induced anti-viral response in check. (a) Microarray analysis of mRNA expression in Ubc9−/− and Ubc9+/+ BMDCs left unstimulated (0) or stimulated for 6 h with LPS (with a change in expression (upregulated or downregulated) of twofold or more): dark shading indicates viral and interferon-regulated genes, as determined by the interferome database; medium shading indicates the inflammatory response, as determined by genes expressed differentially in LPS-treated Ubc9+/+ BMDCs relative to their expression in untreated Ubc9+/+ BMDCs, with the exclusion of interferon-regulated genes; light shading indicates other genes. Numbers above or below bars indicate total genes in group. P < 0.05 (Bonferroni test). (b) Scatterplot of global gene-expression profiles (mRNA; log2 scale) of unstimulated Ubc9−/− and Ubc9+/+ BMDCs; black diagonal lines indicate a cut-off of a twofold difference in expression; red dots indicate ISGs. (c) Gene-set–enrichment analysis of unstimulated Ubc9−/− BMDCs, with genes ranked on the basis of expression in Ubc9−/− BMDCs relative to that in Ubc9+/+ BMDCs, showing the distribution of genes in the interferon transcriptional signature gene set against the ranked list of the genes. (d) Gene expression (log2 values) in unstimulated Ubc9−/− BMDCs relative to that in Ubc9+/+ BMDCs, for the 50 genes with the greatest difference in expression; red font indicates interferon-inducible genes. (e) Overlap of LPS-inducible genes (induced more than twofold in Ubc9+/+ BMDCs by 6 h of stimulation with LPS) and UBC9-affected genes (induced more than twofold by 6 h of stimulation with LPS in Ubc9−/− BMDCs relative to that in Ubc9+/+ BMDCs). (f) Scatterplot of global gene-expression profiles in Ubc9−/− and Ubc9+/+ BMDCs stimulated for 6 h with LPS (presented as in b). (g) Gene-set–enrichment analysis of Ubc9−/− BMDCs stimulated for 6 h with LPS (presented as in c). (h) Gene-expression analysis of Ubc9+/+ and Ubc9−/− BMDCs 6 h after stimulation with LPS (presented as in d). Data are from three experiments (a,d–h; mean ± s.d. in d,h) or three independent experiments (b,c; average).
npg
© 2
016
Nat
ure
Am
eric
a, In
c. A
ll rig
hts
rese
rved
.
144 VOLUME 17 NUMBER 2 FEBRUARY 2016 nature immunology
A rt i c l e s
represented the key target gene affected by sumoylation deficiency. Pre-treatment of Ubc9+/+ BMDCs with recombinant IFN-β did not lead to increased production of inflammatory cytokines after treatment with LPS compared with that of cells not given that pre- treatment (Supplementary Fig. 4d), in accordance with the literature34. These results indicated that although IFN-β was the key sumoyla-tion-controlled nexus for inflammatory responses, its overexpression was not sufficient for full explanation of the phenotype observed in Ubc9−/− cells.
SUMO chromatin landscape after activation by LPSGiven that SUMO is an integral and dynamic component of chroma-tin35, we investigated whether sumoylation regulated innate immune responses at the level of chromatin. We performed ChIP-Seq pro-filing of SUMO-2 in BMDCs left unstimulated or stimulated with LPS and identified 14,208 SUMO-2 peaks in unstimulated cells that showed no change after stimulation with LPS (‘unaffected’ peaks); 887 peaks were increased by stimulation with LPS (‘induced’ peaks), and 2,207 peaks were decreased by stimulation with LPS (‘reduced’
0 5 10 15 20 250
5
10
15
50
150
250
2
Ifnb
1 m
RN
A(r
elat
ive
× 10
2 )
LPS (h)
5 10 15 20 250
5
10
100
200
300
0 2
LPS (h)
a
Ifnb
1 m
RN
A(r
elat
ive
× 1
03 )
Ubc9+/+
BMDMUbc9–/–
BMDM
f
0 5 10
Time after infection (d)
15 200
50
100
MVA HIV MOI MVA HIV MOI
Sur
viva
l (%
)0
2
4
6
Clin
ical
sco
re
g
h
eUbc9+/+
Ubc9+/+ +IFN-βUbc9–/–
0 0.1
H1N1 influenza virusinoculum (µg/ml)
H1N1 influenza virusinoculum (µg/ml)
1 100
20
40
60
0 0.1 1 100
100
200
300
400
HA
MF
I
0 0.2 0.6 1.70
10
20
30
Infe
cted
cel
ls (
%)
0 0.2 0.6 1.70
2,000
4,000
6,000
Gag
MF
I
Skin
Ifnb1 Il6 Ccl3TnfMx1 Isg150
2
4
6
8
mR
NA
(re
lativ
e)
0
1
2
3
4
mR
NA
(re
lativ
e)
Muscle
Ifnb1 Il6 Ccl3TnfMx1 Isg15
* *
**
*
***
*
*
*
** *
**
* *
*
*
**
***
**
*
**
*
*
****
*
**
**
***
** * *
*
Ubc9+/+Lyz2-Cre
Ubc9fl/flLyz2-Cre
Infe
cted
cel
ls (
%)
Ubc9+/+
Lyz2-CreUbc9fl/fl
Lyz2-Cre
Ubc9+/+
Lyz2-Cre
Ubc9fl/fl
Lyz2-Cre
Ubc9+/+
BMDCUbc9–/–
BMDC
Ubc9+/+
Ubc9–/–
d
NC Ifnb1promoter
Ifnb1exon
Ubc9+/+ (no LPS)
Ubc9+/+ + LPS
Ubc9–/– (no LPS)Ubc9–/– + LPS
Pol
II (%
of i
nput
)
0
0.02
0.04
0.06
0.08
*
*
0 3 6 12 25 500
20
40
60
LPS (ng/ml)
CC
L2 (
ng/m
l)
b
0 3 6 12 25 50
100
101
102
103
LPS (ng/ml)
IFN
-β (
pg/m
l)
10–1 ND ND ND ND ND
c
0 7 15 30 60 125
250
500
0
10
20
30
40
Pam3CSK4 (ng/ml)
CC
L2 (
ng/m
l)
0 0.1 0.3 1 3 10
Zymosan (µg/ml)
0
5
10
15
CC
L2 (
ng/m
l)0 60 12
525
050
0
CpG (nM)
0
10
20
30
40
50
CC
L2 (
ng/m
l)
TNF (pg/ml)
1 5 50 5000
10
20
30
40
50
CC
L2 (
ng/m
l)
Ubc9+/+
Ubc9–/–
ND
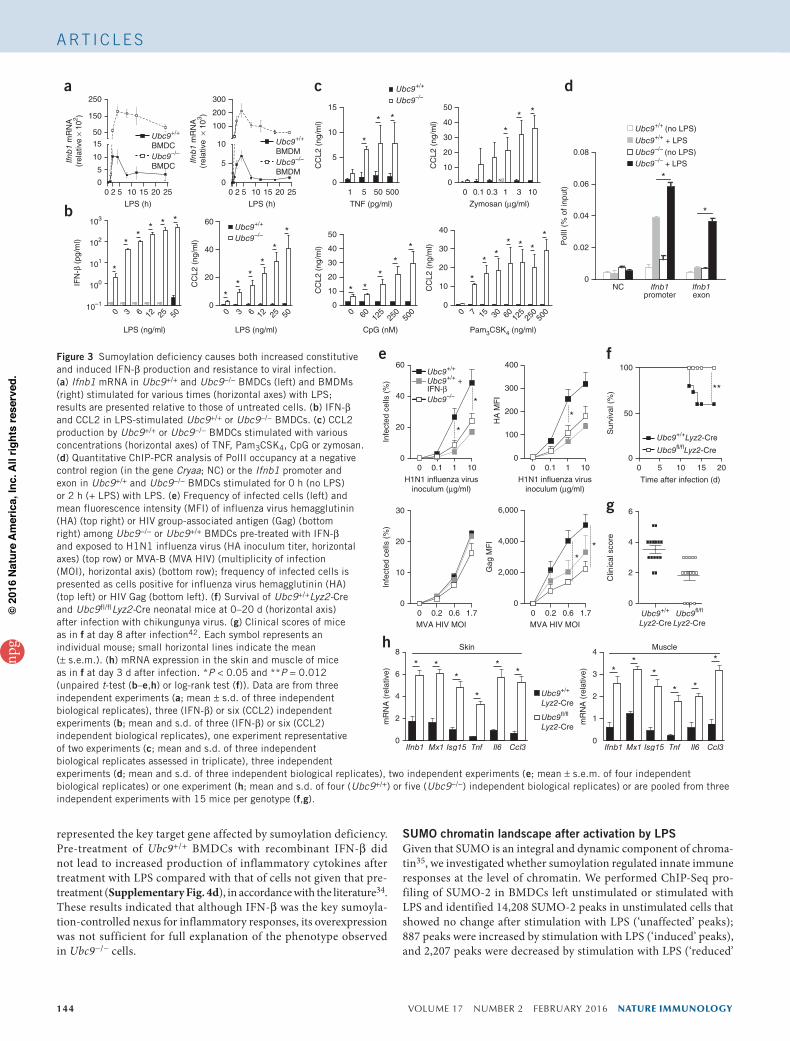
Figure 3 Sumoylation deficiency causes both increased constitutive and induced IFN-β production and resistance to viral infection. (a) Ifnb1 mRNA in Ubc9+/+ and Ubc9−/− BMDCs (left) and BMDMs (right) stimulated for various times (horizontal axes) with LPS; results are presented relative to those of untreated cells. (b) IFN-β and CCL2 in LPS-stimulated Ubc9+/+ or Ubc9−/− BMDCs. (c) CCL2 production by Ubc9+/+ or Ubc9−/− BMDCs stimulated with various concentrations (horizontal axes) of TNF, Pam3CSK4, CpG or zymosan. (d) Quantitative ChIP-PCR analysis of PolII occupancy at a negative control region (in the gene Cryaa; NC) or the Ifnb1 promoter and exon in Ubc9+/+ and Ubc9−/− BMDCs stimulated for 0 h (no LPS) or 2 h (+ LPS) with LPS. (e) Frequency of infected cells (left) and mean fluorescence intensity (MFI) of influenza virus hemagglutinin (HA) (top right) or HIV group-associated antigen (Gag) (bottom right) among Ubc9−/− or Ubc9+/+ BMDCs pre-treated with IFN-β and exposed to H1N1 influenza virus (HA inoculum titer, horizontal axes) (top row) or MVA-B (MVA HIV) (multiplicity of infection (MOI), horizontal axis) (bottom row); frequency of infected cells is presented as cells positive for influenza virus hemagglutinin (HA) (top left) or HIV Gag (bottom left). (f) Survival of Ubc9+/+Lyz2-Cre and Ubc9fl/flLyz2-Cre neonatal mice at 0–20 d (horizontal axis) after infection with chikungunya virus. (g) Clinical scores of mice as in f at day 8 after infection42. Each symbol represents an individual mouse; small horizontal lines indicate the mean (± s.e.m.). (h) mRNA expression in the skin and muscle of mice as in f at day 3 d after infection. *P < 0.05 and **P = 0.012 (unpaired t-test (b–e,h) or log-rank test (f)). Data are from three independent experiments (a; mean ± s.d. of three independent biological replicates), three (IFN-β) or six (CCL2) independent experiments (b; mean and s.d. of three (IFN-β) or six (CCL2) independent biological replicates), one experiment representative of two experiments (c; mean and s.d. of three independent biological replicates assessed in triplicate), three independent experiments (d; mean and s.d. of three independent biological replicates), two independent experiments (e; mean ± s.e.m. of four independent biological replicates) or one experiment (h; mean and s.d. of four (Ubc9+/+) or five (Ubc9−/−) independent biological replicates) or are pooled from three independent experiments with 15 mice per genotype (f,g).
npg
© 2
016
Nat
ure
Am
eric
a, In
c. A
ll rig
hts
rese
rved
.
nature immunology VOLUME 17 NUMBER 2 FEBRUARY 2016 145
A rt i c l e s
peaks) (Supplementary Table 3). Similar ChIP-Seq profiling after 1 h of stimulation with LPS showed a substantial correlation between the data sets obtained at 2 h and those obtained at 1 h (Supplementary Fig. 5a). Integration of the ChIP-Seq profiles with RNA-Seq data from LPS-stimulated BMDCs obtained in the same conditions36 indicated that the distribution of reduced or unaffected SUMO-2 peaks relative to gene expression was similar to that observed for a control set that included all genes expressed (Fig. 5a). In contrast, the class of genes associated with induced SUMO-2 peaks showed enrichment for LPS-induced transcripts relative to the abundance of these transcripts in the genome as a whole (Fig. 5a). Ontology analysis of the LPS-stimulated genes associated with the induced peaks revealed that they were showed significant enrichment for genes encoding products involved in immunological processes, relative to their abundance in the genome as a whole (Fig. 5b and Supplementary Table 4). To characterize the SUMO chromatin landscape further, we aligned the SUMO-2 profile with that of selected transcription factors and histone marks. SUMO-2 seemed to be recruited downstream of the transcription-termination site (TTS) in a subset of genes encoding inflammatory cytokines (Fig. 5c,d). These results suggested that recruitment of SUMO-2 to the TTS might participate in the termination of transcription during the activation of DCs by LPS.
We then investigated whether induced SUMO-2 peaks were also associated with active enhancers. We compared the presence of SUMO-2 peaks at promoters (as defined by presence of the methylated- histone mark H3K4me3 and PolII together) with their presence at enhancers (defined by the presence of the acetylated histone mark H3K27ac and large abundance of H3K4me1 but low abundance of H3K4me3). The fraction of induced SUMO-2 peaks at enhancers was about twofold that at promoters, whereas we observed the inverse situation for unaffected SUMO-2 peaks (Fig. 5e,f). These results indicated that enhancers were ‘preferentially’ targeted by dynamic, stimulus-regulated binding of SUMO-2, compared with the binding of SUMO-2 at promoters.
We next analyzed SUMO-2 profiles of genes whose expression was upregulated in LPS-treated Ubc9−/− cells relative to their expression in LPS-treated Ubc9+/+ cells (Fig. 2a and Supplementary Table 2).
Whereas the proportion of genes marked by SUMO-2 was slightly greater for upregulated genes (52%) than for all genes expressed (41%) (Fig. 5g), the most salient finding of this analysis was the enrichment for induced SUMO-2 peaks at upregulated genes encoding inflamma-tory products (23%) relative to the abundance of such peaks at genes encoding anti-viral products (8%) (Fig. 5g,h). These results suggested that whereas part of the inflammatory response might be regulated by sumoylation at the chromatin level, the substantial upregulation of ISGs triggered by sumoylation deficiency was probably not the consequence of a direct role for SUMO at ISGs.
Finally, to compare the genome-wide profiles of the two SUMO paralogs, we generated ChIP-Seq data sets for SUMO-1 with BMDCs stimulated with LPS for 0 h or 2 h, focusing on increased SUMO bind-ing. Profiling of SUMO-1 revealed 61 induced peaks, whereas 4,511 peaks were not affected by stimulation with LPS (Supplementary Table 5). The SUMO-1 and SUMO-2 patterns showed a substantial correlation in both unstimulated BMDCs and LPS-stimulated BMDCs (Supplementary Fig. 5b). As with SUMO-2, induced SUMO-1 peaks were associated with LPS-induced transcripts (Supplementary Fig. 5c) and were located at the TTSs of a subset of genes encoding products related to immunity, after stimulation with LPS (Fig. 5d). These find-ings suggested a direct role for SUMO-1 and SUMO-2, through recruit-ment to enhancers and/or the TTS, in regulating a subgroup of genes encoding inflammatory products that were ‘super-induced’ in response to stimulation with LPS. Recruitment of SUMO, however, occurred only at a subset of such ‘super-induced’ genes encoding inflammatory prod-ucts, which suggested the involvement of additional mechanisms.
Targeting of distal regulatory elements at the Ifnb1 locus by SUMOBecause IFN-β seemed to be a major regulator of the enhanced immune response triggered by sumoylation deficiency, we inves-tigated the mechanisms by which sumoylation exerted its negative regulatory effect on Ifnb1 expression. We assessed the SUMO chro-matin profile at the Ifnb1 locus in BMDCs. Under basal conditions, ChIP-Seq profiling of SUMO-1 and SUMO-2 identified three distal regions upstream of the Ifnb1 promoter with SUMO peaks; we called these ‘SUMO-Ifnb1 regulatory elements’ (S-IRE1, S-IRE2 and S-IRE3)
Ubc9+/+
Ubc9–/–
Ifnar1–/–
Ubc9–/–Ifnar1–/–
a
1
2100150
200
250
Ifnb
1 (f
old
× 10
2 )
00 4LPS (h)
Ubc9+/+
Ubc9–/–
Ifnar1–/–
Ubc9–/–Ifnar1–/–
**
NS*
*
ND
c
Mx1
(fo
ld)
0 40
10
20
30
40
50 **
NSNS
NS
NS
50
100
150
200
Ccl
2 (f
old)
00 4
**ND
Isg
15 (
fold
)
0 40
1,000
400
100
50
*
**
NDND ND
*
0 4
2
4
50100150200
Cxc
l10
(fol
d ×
102 )
0
**
**ND ND ND
Ubc9+/+
Ubc9–/–
Ifnar1–/–
Ubc9–/–
Ifnar1–/–
b
100
101
102
103
104
LPS (ng/ml)
IFN
-β (
pg/m
l)
50251260
NDNDND ND ND ND ND ND
d
LPS (ng/ml)
50251260
Ubc9+/+
Ubc9–/–
Ifnar1–/–
Ubc9–/–Ifnar1–/–
0
20
40
60
80
IL-6
(ng
/ml)
e
* * *
*
NDNDND
15
20
*NS
150
200 ** Ubc9+/+
Ubc9–/–10
15*
*
Ccl
3 (f
old)
0 40
5
10
Nos
2 (f
old)
0
50
100
0 4NDND ND
Ifnar1–/–
Ubc9–/–Ifnar1–/–
Il6 (
fold
× 1
02 )
0 40
5
NDND ND
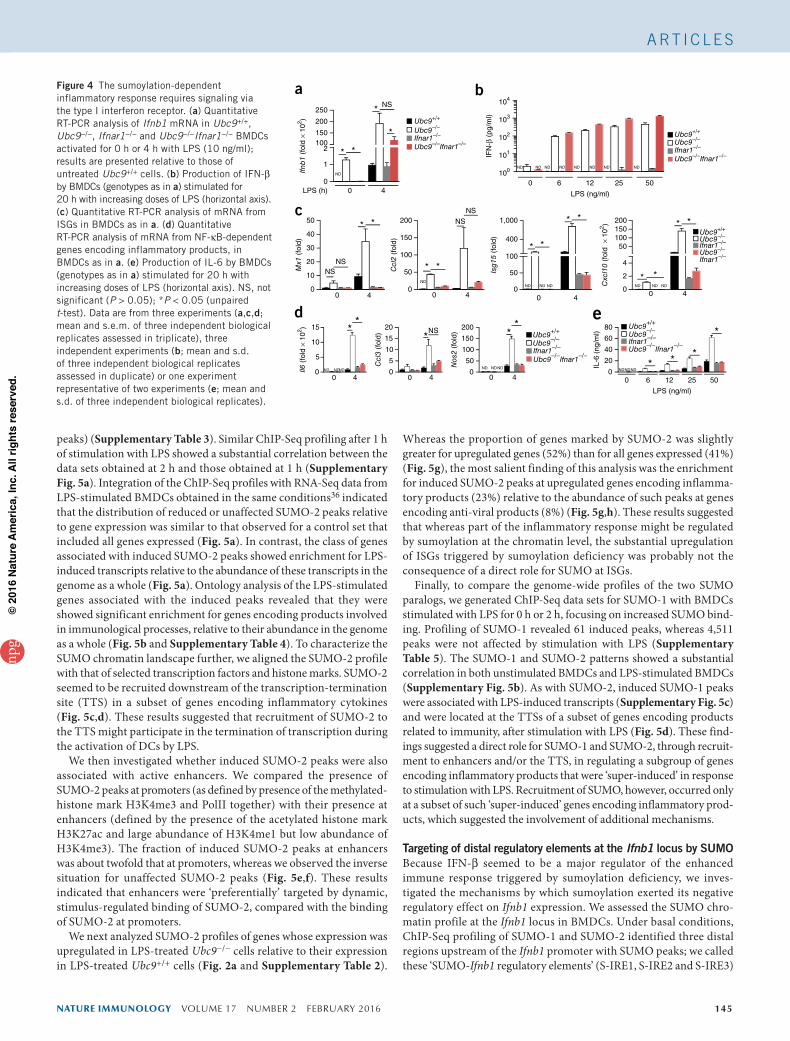
Figure 4 The sumoylation-dependent inflammatory response requires signaling via the type I interferon receptor. (a) Quantitative RT-PCR analysis of Ifnb1 mRNA in Ubc9+/+, Ubc9−/−, Ifnar1−/− and Ubc9−/−Ifnar1−/− BMDCs activated for 0 h or 4 h with LPS (10 ng/ml); results are presented relative to those of untreated Ubc9+/+ cells. (b) Production of IFN-β by BMDCs (genotypes as in a) stimulated for 20 h with increasing doses of LPS (horizontal axis). (c) Quantitative RT-PCR analysis of mRNA from ISGs in BMDCs as in a. (d) Quantitative RT-PCR analysis of mRNA from NF-κB-dependent genes encoding inflammatory products, in BMDCs as in a. (e) Production of IL-6 by BMDCs (genotypes as in a) stimulated for 20 h with increasing doses of LPS (horizontal axis). NS, not significant (P > 0.05); *P < 0.05 (unpaired t-test). Data are from three experiments (a,c,d; mean and s.e.m. of three independent biological replicates assessed in triplicate), three independent experiments (b; mean and s.d. of three independent biological replicates assessed in duplicate) or one experiment representative of two experiments (e; mean and s.d. of three independent biological replicates).
npg
© 2
016
Nat
ure
Am
eric
a, In
c. A
ll rig
hts
rese
rved
.
146 VOLUME 17 NUMBER 2 FEBRUARY 2016 nature immunology
A rt i c l e s
(Fig. 6a). We then compared the SUMO data sets with those of selected transcription factors and histone marks and with DNAse I– hypersensitivity sites (in the ENCODE (Encyclopedia of DNA Elements) database). Transcription factors, including numerous SUMO substrates, were variously present at S-IREs found to coincide with three DNAse I–hypersensitivity sites. S-IRE1 co-existed with constitutive peaks for the hematopoietic ‘pioneer’ transcription factor PU.1 and with LPS-inducible peaks for inflammation-activated transcription factors. We also observed induced recruitment of p65 and IRF1 at S-IRE2 and S-IRE3, respectively. Active enhancers are generally characterized by enrichment for H3K27ac and H3K4me1 in combination with less H3K4me3 abundance37. Whereas S-IRE2 was devoid of all of these marks, S-IRE1 and S-IRE3 shared chroma-tin features of enhancers, although the abundance of H3K4me3 was relatively high at these elements. The three S-IREs showed distinctive binding profiles for a restricted set of transcription factors. Notably, the architectural protein CTCF showed enrichment at S-IRE2 and S-IRE3 but was absent at S-IRE1, whereas C/EBP-β, a factor asso-ciated with de novo enhancer-like regions38, was uniquely present at S-IRE1. These data indicated that SUMO occupied a set of three distal DNA modules in the Ifnb1 locus that probably exert distinct regulatory functions.
We further assessed the potential change in the occupancy by SUMO in chromatin following 2 h of stimulation with LPS. SUMO-1
was released from S-IRE1 and S-IRE3 in LPS-stimulated BMDCs, and we observed a similar release, although smaller, of SUMO-2 from S-IRE2 and S-IRE3 (Fig. 6a,b). Thus, the presence of SUMO at S-IREs ‘anti-correlated’ with activation of Ifnb1 transcription.
We then investigated the effect of sumoylation insufficiency on the chromatin status of the Ifnb1 promoter in Ubc9+/+ and Ubc9−/− BMDCs. After stimulation with LPS, the active chromatin mark H3K4me3 peaked at 4 h and decreased to baseline after 18 h in Ubc9+/+ cells (Fig. 6c). In contrast, in the absence of UBC9, this chromatin showed enhancement for H3K4me3 at 4 h, and this continued to increase substantially under conditions of persistent LPS stimulation (Fig. 6c). Similar increased and sustained enrichment for H3K4me3 and the other active mark H3ac (acetylated histone H3) at Ifnb1 was apparent in LPS-treated Ubc9−/− BMDCs (Supplementary Fig. 6), which correlated with the prolonged transcription of Ifnb1 (Fig. 3a). Collectively, these data suggested that SUMO functioned through distal cis-regulatory genetic elements to ensure a chromatin environ-ment that restrained transcription at the Ifnb1 promoter.
S-IRE1 functions as a SUMO-regulated enhancer of Ifnb1Given the enhancer-like feature of S-IRE1, we investigated whether transcription was associated with this element39. There was rapid production of enhancer RNA (eRNA) from S-IRE1 upon stimula-tion with LPS that remained substantial up to 8 h before decreasing
b
TSS TTS
Control genes
0
16
SU
MO
-2 m
ean
dens
ity (
tag/
50 b
p) USLPS (2 h)
TSS TTS0
16
SU
MO
-2 m
ean
dens
ity (
tag/
50 b
p) US
LPS (2 h)
Overexpressed immunity-related genes with inducible
SUMO-2 peaks
c
Prom
oter
Enhan
cer
0
10
20
30
UnaffectedInduced
SU
MO
-2 p
eaks
(%
)e *
f
Il6
10 kb(70)
(70)
(10)
(10)
(30)
(30)
(15)
(15)
(40)
(40)
H3K27ac
H3K4me1
H3K4me3
–
+
–
+
–
+
p65–
+
SUMO-2–
+
Il12alqej-schip1
5 kb(50)
(50)
(10)
(10)
(20)
(20)
(15)
(15)
(20)
(20)
LPSEnhancers Enhancers
d
LtaTnfLtb
(400)
(400)
(50)
(50)
(40)
(40)
(30)
(30)
1 kb
SUMO-2
+SUMO-1
–
–
–
–
+
PolII
Runx1
+
+
Il1b Gm14047
1 kbLPS
h 10 kb(40)
(40)
(10)
(10)H3K4me3
–
+
SUMO-2–
+
AI607873 I�204 Mndal Mnda I�203 I�202b I�205
LPS
Overexpressed
RepressedUnchanged
a
Induced Reduced Unaffected All
SUMO-2 peak
Gen
es (
frac
tion) 0.8
0.6
0.4
0.2
0
P = 6.2 × 10–59
P = 0.35
P = 0.18
g
All exp
ress
ed g
enes
Up re
gulat
ed g
enes
Inte
rfero
n re
spon
se
Infla
mm
ator
y res
pons
e
020406080
100
Gen
es (
%)
100
10–10
10–20
10–30
Defen
se re
spon
se
Imm
une
syste
m p
roce
ss
Respo
nse
to e
xtern
al sti
mulu
s
Imm
une
resp
onse
Infla
mm
ator
y res
pons
e
Process
P v
alue
InducibleNon-inducibleNone
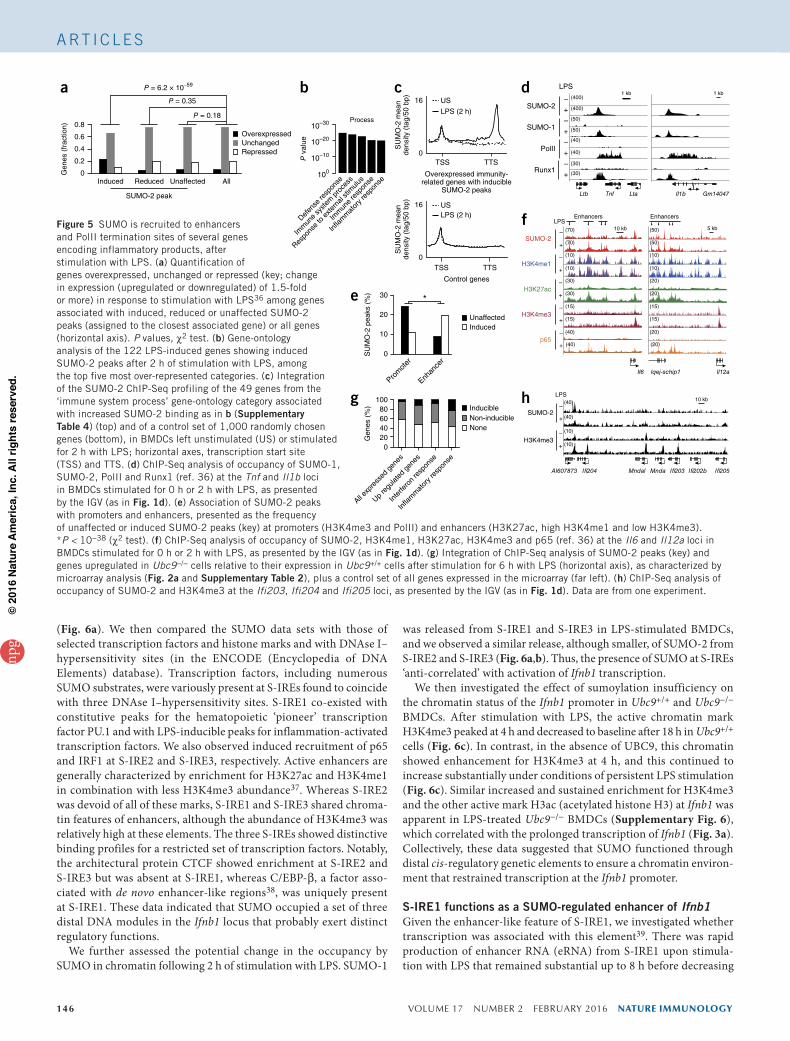
Figure 5 SUMO is recruited to enhancers and PolII termination sites of several genes encoding inflammatory products, after stimulation with LPS. (a) Quantification of genes overexpressed, unchanged or repressed (key; change in expression (upregulated or downregulated) of 1.5-fold or more) in response to stimulation with LPS36 among genes associated with induced, reduced or unaffected SUMO-2 peaks (assigned to the closest associated gene) or all genes (horizontal axis). P values, χ2 test. (b) Gene-ontology analysis of the 122 LPS-induced genes showing induced SUMO-2 peaks after 2 h of stimulation with LPS, among the top five most over-represented categories. (c) Integration of the SUMO-2 ChIP-Seq profiling of the 49 genes from the ‘immune system process’ gene-ontology category associated with increased SUMO-2 binding as in b (Supplementary Table 4) (top) and of a control set of 1,000 randomly chosen genes (bottom), in BMDCs left unstimulated (US) or stimulated for 2 h with LPS; horizontal axes, transcription start site (TSS) and TTS. (d) ChIP-Seq analysis of occupancy of SUMO-1, SUMO-2, PolII and Runx1 (ref. 36) at the Tnf and Il1b loci in BMDCs stimulated for 0 h or 2 h with LPS, as presented by the IGV (as in Fig. 1d). (e) Association of SUMO-2 peaks with promoters and enhancers, presented as the frequency of unaffected or induced SUMO-2 peaks (key) at promoters (H3K4me3 and PolII) and enhancers (H3K27ac, high H3K4me1 and low H3K4me3). *P < 10−38 (χ2 test). (f) ChIP-Seq analysis of occupancy of SUMO-2, H3K4me1, H3K27ac, H3K4me3 and p65 (ref. 36) at the Il6 and Il12a loci in BMDCs stimulated for 0 h or 2 h with LPS, as presented by the IGV (as in Fig. 1d). (g) Integration of ChIP-Seq analysis of SUMO-2 peaks (key) and genes upregulated in Ubc9−/− cells relative to their expression in Ubc9+/+ cells after stimulation for 6 h with LPS (horizontal axis), as characterized by microarray analysis (Fig. 2a and Supplementary Table 2), plus a control set of all genes expressed in the microarray (far left). (h) ChIP-Seq analysis of occupancy of SUMO-2 and H3K4me3 at the Ifi203, Ifi204 and Ifi205 loci, as presented by the IGV (as in Fig. 1d). Data are from one experiment.
npg
© 2
016
Nat
ure
Am
eric
a, In
c. A
ll rig
hts
rese
rved
.
nature immunology VOLUME 17 NUMBER 2 FEBRUARY 2016 147
A rt i c l e s
in Ubc9+/+ BMDCs (Fig. 7a), whereas it decreased sharply by 2 h in Ubc9+/+ BMDMs (Fig. 7b). Loss of UBC9 led to considerably enhanced transient expression of this eRNA following stimulation with LPS in both cell types (Fig. 7a,b). Of note, we observed simi-lar LPS-induced enhanced transcription of S-IRE3 upon loss of UBC9 that continued to increase up to the end of the observa-tion period (Supplementary Fig. 7a). Thus, S-IRE1 drove the expression of an LPS-induced eRNA, and impairment in sumoyla-tion led to its ‘super-induction’.
To next investigate the possibility that the eRNA produced from S-IRE1 might regulate the transcription of Ifnb1, we designed two small interfering RNAs (siRNAs) directed against S-IRE1 eRNA. These significantly reduced its expression and led to a small but reproducible attenuation in Ifnb1 expression after 4 h of stimulation with LPS (Fig. 7c). This indicated that S-IRE1 eRNA regulated Ifnb1 expression following activation of the innate immune response.
We then functionally evaluated the S-IRE1 region for enhancer activ-ity in reporter assays using the mouse macrophage cell line RAW264.7. We cloned a 2.4-kilobase region (corresponding to the SUMO peak) in both orientations and three 2- to 2.1-kilobase negative-control regions (two between the Ifnb1 TSS and S-IRE1, and one ~1 kilobase down-stream of Ifnb1) upstream or downstream of the Ifnb1 promoter and proximal enhancer (at position –219 relative to the transcription start site) driving expression of a luciferase reporter gene. In unstimulated conditions, S-IRE1 conferred substantial activation of the reporter construct (Fig. 7d). After stimulation with LPS, the element at position –219 conferred robust LPS inducibility, and inclusion of S-IRE1 in all three contexts substantially increased luciferase activity (Fig. 7e). The induction conferred by S-IRE1, however, was comparable in unstimu-lated and LPS-stimulated conditions (Fig. 7e), which indicated that
this element, although it strongly enhanced transcriptional activity, did not confer LPS inducibility in our settings. Moreover, deletion of a 488–base pair fragment centered on the DNAse I–hypersensitivity site entirely abolished reporter activity driven by S-IRE1 when placed either upstream or downstream of the luciferase construct with the element at position –219, but it did not impair induction of the gene by LPS (Fig. 7d,e). Finally, we investigated whether the enhancer function of S-IRE1 was regulated by sumoylation. Slightly decreasing the global sumoylation through partial knockdown of UBC9 (Supplementary Fig. 7b) led to a significant increase in S-IRE1-driven transcriptional activity in both unstimulated conditions and stimulated conditions (Fig. 7f). Together with the data reported above, these results indicated that S-IRE1 showed a chromatin signature and functional properties compatible with a role as a SUMO-regulated enhancer that controlled transcription of Ifnb1.
DISCUSSIONAlthough sumoylation serves multiple functions through the modi-fication of a large array of target proteins, we found that diminishing
a
Ifnb1
(2)
(2)(20)
(20)
(15)
(15)
(15)
(15)
SUMO-2
H3K27ac
H3K4me1
H3K4me3
–+
–+–+–+
–15 kb –21 kb –28 kbS-IRE1 S-IRE2 S-IRE3
LPS
(8)
(40)
(40)
p65(8)
STAT1
–+–+
(15)
(15)
(15)
(15)
PU.1
CTCF
–+–+
CD34+DHS
(200)
SUMO-1
–
+
(2)
(2)
(10)
(10)IRF1–+
C/EBP-β–+
(40)
(40)
b BMDC
NC Ifnb1exon
Ifnb1exon
S-IRE10
0.01
0.02
0.03
0.04
SU
MO
-1 (
% o
f inp
ut)
c
Ifnb1–15 kb –21 kb –28 kbS-IRE1 S-IRE2 S-IRE3
0
4
LPS (h)
18
0
4
18
(1)
(1)
(1)
(1)
(1)
(1)
Ubc9+/+
Ubc9–/–
*– LPS
+ LPS
BMDM
NC S-IRE10
0.01
0.02
0.03
SU
MO
-1 (
% o
f inp
ut) *
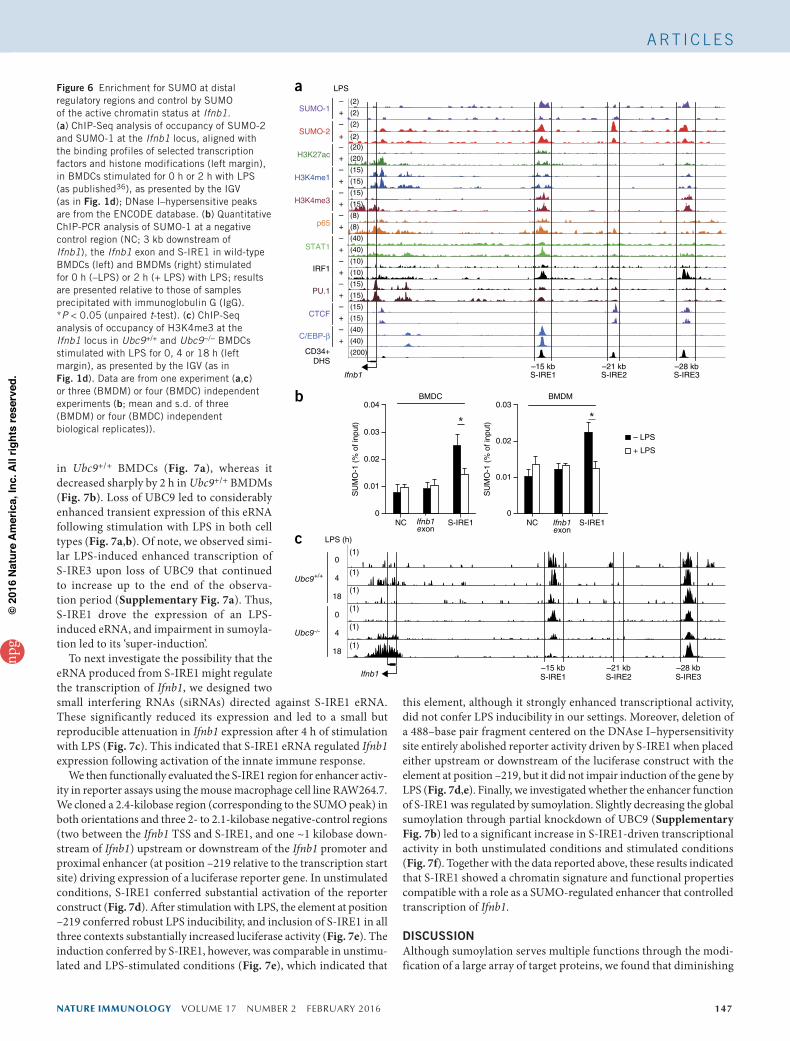
Figure 6 Enrichment for SUMO at distal regulatory regions and control by SUMO of the active chromatin status at Ifnb1. (a) ChIP-Seq analysis of occupancy of SUMO-2 and SUMO-1 at the Ifnb1 locus, aligned with the binding profiles of selected transcription factors and histone modifications (left margin), in BMDCs stimulated for 0 h or 2 h with LPS (as published36), as presented by the IGV (as in Fig. 1d); DNase I–hypersensitive peaks are from the ENCODE database. (b) Quantitative ChIP-PCR analysis of SUMO-1 at a negative control region (NC; 3 kb downstream of Ifnb1), the Ifnb1 exon and S-IRE1 in wild-type BMDCs (left) and BMDMs (right) stimulated for 0 h (–LPS) or 2 h (+ LPS) with LPS; results are presented relative to those of samples precipitated with immunoglobulin G (IgG). *P < 0.05 (unpaired t-test). (c) ChIP-Seq analysis of occupancy of H3K4me3 at the Ifnb1 locus in Ubc9+/+ and Ubc9−/− BMDCs stimulated with LPS for 0, 4 or 18 h (left margin), as presented by the IGV (as in Fig. 1d). Data are from one experiment (a,c) or three (BMDM) or four (BMDC) independent experiments (b; mean and s.d. of three (BMDM) or four (BMDC) independent biological replicates)).
npg
© 2
016
Nat
ure
Am
eric
a, In
c. A
ll rig
hts
rese
rved
.
148 VOLUME 17 NUMBER 2 FEBRUARY 2016 nature immunology
A rt i c l e s
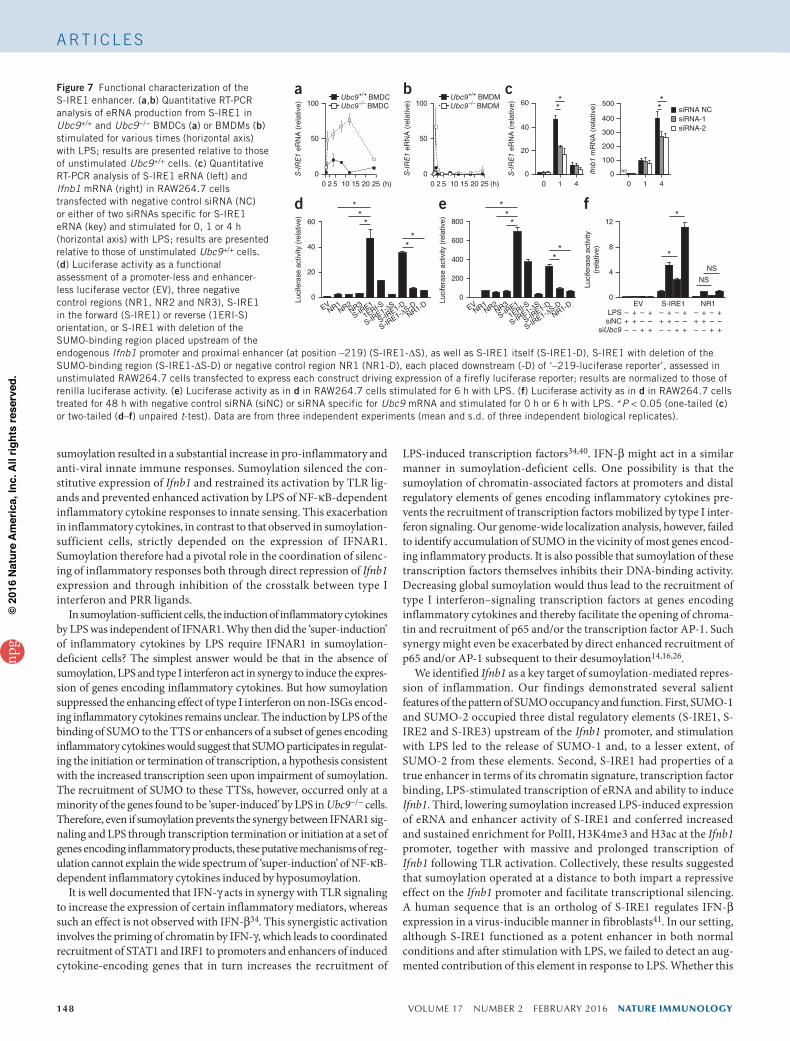
Figure 7 Functional characterization of the S-IRE1 enhancer. (a,b) Quantitative RT-PCR analysis of eRNA production from S-IRE1 in Ubc9+/+ and Ubc9−/− BMDCs (a) or BMDMs (b) stimulated for various times (horizontal axis) with LPS; results are presented relative to those of unstimulated Ubc9+/+ cells. (c) Quantitative RT-PCR analysis of S-IRE1 eRNA (left) and Ifnb1 mRNA (right) in RAW264.7 cells transfected with negative control siRNA (NC) or either of two siRNAs specific for S-IRE1 eRNA (key) and stimulated for 0, 1 or 4 h (horizontal axis) with LPS; results are presented relative to those of unstimulated Ubc9+/+ cells. (d) Luciferase activity as a functional assessment of a promoter-less and enhancer-less luciferase vector (EV), three negative control regions (NR1, NR2 and NR3), S-IRE1 in the forward (S-IRE1) or reverse (1ERI-S) orientation, or S-IRE1 with deletion of the SUMO-binding region placed upstream of the endogenous Ifnb1 promoter and proximal enhancer (at position –219) (S-IRE1-∆S), as well as S-IRE1 itself (S-IRE1-D), S-IRE1 with deletion of the SUMO-binding region (S-IRE1-∆S-D) or negative control region NR1 (NR1-D), each placed downstream (-D) of ‘–219-luciferase reporter’, assessed in unstimulated RAW264.7 cells transfected to express each construct driving expression of a firefly luciferase reporter; results are normalized to those of renilla luciferase activity. (e) Luciferase activity as in d in RAW264.7 cells stimulated for 6 h with LPS. (f) Luciferase activity as in d in RAW264.7 cells treated for 48 h with negative control siRNA (siNC) or siRNA specific for Ubc9 mRNA and stimulated for 0 h or 6 h with LPS. *P < 0.05 (one-tailed (c) or two-tailed (d–f) unpaired t-test). Data are from three independent experiments (mean and s.d. of three independent biological replicates).
sumoylation resulted in a substantial increase in pro-inflammatory and anti-viral innate immune responses. Sumoylation silenced the con-stitutive expression of Ifnb1 and restrained its activation by TLR lig-ands and prevented enhanced activation by LPS of NF-κB-dependent inflammatory cytokine responses to innate sensing. This exacerbation in inflammatory cytokines, in contrast to that observed in sumoylation- sufficient cells, strictly depended on the expression of IFNAR1. Sumoylation therefore had a pivotal role in the coordination of silenc-ing of inflammatory responses both through direct repression of Ifnb1 expression and through inhibition of the crosstalk between type I interferon and PRR ligands.
In sumoylation-sufficient cells, the induction of inflammatory cytokines by LPS was independent of IFNAR1. Why then did the ‘super-induction’ of inflammatory cytokines by LPS require IFNAR1 in sumoylation- deficient cells? The simplest answer would be that in the absence of sumoylation, LPS and type I interferon act in synergy to induce the expres-sion of genes encoding inflammatory cytokines. But how sumoylation suppressed the enhancing effect of type I interferon on non-ISGs encod-ing inflammatory cytokines remains unclear. The induction by LPS of the binding of SUMO to the TTS or enhancers of a subset of genes encoding inflammatory cytokines would suggest that SUMO participates in regulat-ing the initiation or termination of transcription, a hypothesis consistent with the increased transcription seen upon impairment of sumoylation. The recruitment of SUMO to these TTSs, however, occurred only at a minority of the genes found to be ‘super-induced’ by LPS in Ubc9−/− cells. Therefore, even if sumoylation prevents the synergy between IFNAR1 sig-naling and LPS through transcription termination or initiation at a set of genes encoding inflammatory products, these putative mechanisms of reg-ulation cannot explain the wide spectrum of ‘super-induction’ of NF-κB- dependent inflammatory cytokines induced by hyposumoylation.
It is well documented that IFN-γ acts in synergy with TLR signaling to increase the expression of certain inflammatory mediators, whereas such an effect is not observed with IFN-β34. This synergistic activation involves the priming of chromatin by IFN-γ, which leads to coordinated recruitment of STAT1 and IRF1 to promoters and enhancers of induced cytokine-encoding genes that in turn increases the recruitment of
LPS-induced transcription factors34,40. IFN-β might act in a similar manner in sumoylation-deficient cells. One possibility is that the sumoylation of chromatin-associated factors at promoters and distal regulatory elements of genes encoding inflammatory cytokines pre-vents the recruitment of transcription factors mobilized by type I inter-feron signaling. Our genome-wide localization analysis, however, failed to identify accumulation of SUMO in the vicinity of most genes encod-ing inflammatory products. It is also possible that sumoylation of these transcription factors themselves inhibits their DNA-binding activity. Decreasing global sumoylation would thus lead to the recruitment of type I interferon–signaling transcription factors at genes encoding inflammatory cytokines and thereby facilitate the opening of chroma-tin and recruitment of p65 and/or the transcription factor AP-1. Such synergy might even be exacerbated by direct enhanced recruitment of p65 and/or AP-1 subsequent to their desumoylation14,16,26.
We identified Ifnb1 as a key target of sumoylation-mediated repres-sion of inflammation. Our findings demonstrated several salient features of the pattern of SUMO occupancy and function. First, SUMO-1 and SUMO-2 occupied three distal regulatory elements (S-IRE1, S-IRE2 and S-IRE3) upstream of the Ifnb1 promoter, and stimulation with LPS led to the release of SUMO-1 and, to a lesser extent, of SUMO-2 from these elements. Second, S-IRE1 had properties of a true enhancer in terms of its chromatin signature, transcription factor binding, LPS-stimulated transcription of eRNA and ability to induce Ifnb1. Third, lowering sumoylation increased LPS-induced expression of eRNA and enhancer activity of S-IRE1 and conferred increased and sustained enrichment for PolII, H3K4me3 and H3ac at the Ifnb1 promoter, together with massive and prolonged transcription of Ifnb1 following TLR activation. Collectively, these results suggested that sumoylation operated at a distance to both impart a repressive effect on the Ifnb1 promoter and facilitate transcriptional silencing. A human sequence that is an ortholog of S-IRE1 regulates IFN-β expression in a virus-inducible manner in fibroblasts41. In our setting, although S-IRE1 functioned as a potent enhancer in both normal conditions and after stimulation with LPS, we failed to detect an aug-mented contribution of this element in response to LPS. Whether this
c
0
20
40
60
0 1 4
**
S-I
RE
1 eR
NA
(re
lativ
e)
EVNR1
NR2NR3
S-IRE1
1ERI-S
S-IRE1-∆S
d
Luci
fera
se a
ctiv
ity (
rela
tive)
0
20
40
60
S-IRE1-D
S-IRE1-∆S-D
NR1-D
**
**
*
Luci
fera
se a
ctiv
ity (
rela
tive)
0
200
400
600
800
e
EVNR1
NR2NR3
S-IRE1
1ERI-S
S-IRE1-∆S
S-IRE1-D
S-IRE1-∆S-D
NR1-D
***
**
EV S-IRE1 NR1
Luci
fera
se a
ctiv
ity(r
elat
ive)
– + – + – + – + – + – +
– +– + – +– + – +– +–+ –+ –+ –+ –+ –+
LPSsiNC
siUbc9
NS
NS
f
0
4
8
12*
*
b
0 5 10 15 20 250
50
100
2 (h)
S-I
RE
1 eR
NA
(re
lativ
e) Ubc9–/– BMDMUbc9+/+ BMDM
0 5 10 15 20 250
50
100
2
S-I
RE
1 eR
NA
(re
lativ
e)
a
(h)
Ubc9–/– BMDCUbc9+/+ BMDC
siRNA NCsiRNA-1siRNA-2
0 1 40
100
200
300
400
500 **
Ifnb
1 m
RN
A (
rela
tive)
ND
npg
© 2
016
Nat
ure
Am
eric
a, In
c. A
ll rig
hts
rese
rved
.
nature immunology VOLUME 17 NUMBER 2 FEBRUARY 2016 149
A rt i c l e s
difference might be explained by a difference in the activating signal and/or cell type remains to be investigated. Future studies should also evaluate the contribution of the two other elements showing enrich-ment for SUMO (S-IRE2 and S-IRE3) to the massive effect of UBC9 loss on LPS-induced production of IFN-β.
In summary, we have demonstrated that sumoylation represented a ‘master repressor’ of gene expression during inflammatory responses. Whether total sumoylation can be modulated in physiology or pathol-ogy is a question for future studies. The increased sensitivity to septic shock and the enhanced protection against infection with chikun-gunya virus observed in mice depleted of UBC9 in the hematopoietic compartment suggested that UBC9 and, by extension, sumoylation might be relevant targets for pharmacological manipulation in various inflammatory and infectious diseases.
METhODSMethods and any associated references are available in the online version of the paper.
Accession codes. GEO: ChIPseq and Affymetrix data, GSE66339.
Note: Any Supplementary Information and Source Data files are available in the online version of the paper.
ACkNOwLEDGMENtSWe thank M. Dasso (US National Institutes of Health) for antibody to SUMO-2; A. Garcia-Sastre(Icahn School of Medicine at Mount Sinai) for antibody to HA; A. Andrieux and J.-M. Carpier for technical help; Philippe Sansonetti (Pasteur Institute, Paris) for S. flexneri; and M. Yaniv for critical reading of the manuscript. Sequencing was performed by the Institut Génétique Biologie Moléculaire Cellulaire Microarray and Sequencing platform, a member of the ‘France Génomique’ consortium (ANR-10-INBS-0009). Supported by Institut National du Cancer (PLBIO13-057 to S.A.), Agence Nationale de la Recherche (ANR- 14-CE16 to S.A.), Ligue Nationale Contre le Cancer (Equipes labellisées, A. Dejean and S.A.), Fondation pour la Recherche Médicale (FRM, AJE201212 to O.J.), Région-Midi-Pyrénées (NVEQ 2014 to O.J.), European Research Council (‘SUMOSTRESS’ to A. Dejean, ‘DC-BIOX340046’ to S.A., and ‘HIVINNATE’ (309848) to N.M.), Ecole Normale Supérieure (A. Decque) and Odyssey-RE (A. Decque).
AUtHOR CONtRIBUtIONSA. Decque, O.J., J.G.M. and J.-C.C. designed and performed all experiments, except those performed by R.B.-G., P.L., A.S., P.-E.J. and J.-S.S. (described below); R.B.-G. performed part of the ChIP-Seq experiments; P.L. performed infection with S. flexneri in vitro; A.S. performed viral infections in vitro, and N.M. assisted with experimental design; P.-E.J. performed infection with chikungunya virus in vivo; J.-S.S. generated the reporter-gene constructs; M.L.A. and I.A. assisted with experimental design and data analysis of ChIP-Seq and chikungunya virus infection and contributed to the writing of the manuscript; S.A. and A. Dejean conceived of and supervised the study; and A. Decque, O.J., J.G.M., J.-C.C., S.A. and A. Dejean wrote the manuscript.
COMPEtING FINANCIAL INtEREStSThe authors declare no competing financial interests.
reprints and permissions information is available online at http://www.nature.com/reprints/index.html.
1. Medzhitov, R. & Horng, T. Transcriptional control of the inflammatory response. Nat. Rev. Immunol. 9, 692–703 (2009).
2. Takeuchi, O. & Akira, S. Pattern recognition receptors and inflammation. Cell 140, 805–820 (2010).
3. Durbin, J.E. et al. Type I IFN modulates innate and specific antiviral immunity. J. Immunol. 164, 4220–4228 (2000).
4. Gough, D.J., Messina, N.L., Clarke, C.J., Johnstone, R.W. & Levy, D.E. Constitutive type I interferon modulates homeostatic balance through tonic signaling. Immunity 36, 166–174 (2012).
5. Crow, Y.J. Type I interferonopathies: Mendelian type I interferon up-regulation. Curr. Opin. Immunol. 32, 7–12 (2015).
6. Karaghiosoff, M. et al. Central role for type I interferons and Tyk2 in lipopolysaccharide-induced endotoxin shock. Nat. Immunol. 4, 471–477 (2003).
7. Thanos, D. & Maniatis, T. Virus induction of human IFN β gene expression requires the assembly of an enhanceosome. Cell 83, 1091–1100 (1995).
8. Hida, S. et al. CD8+ T cell-mediated skin disease in mice lacking IRF-2, the transcriptional attenuator of interferon-α/β signaling. Immunity 13, 643–655 (2000).
9. Geiss-Friedlander, R. & Melchior, F. Concepts in sumoylation: a decade on. Nat. Rev. Mol. Cell Biol. 8, 947–956 (2007).
10. Hay, R.T. SUMO: a history of modification. Mol. Cell 18, 1–12 (2005).11. Bawa-Khalfe, T. & Yeh, E.T. SUMO losing balance: SUMO proteases disrupt SUMO
homeostasis to facilitate cancer development and progression. Genes Cancer 1, 748–752 (2010).
12. Everett, R.D., Boutell, C. & Hale, B.G. Interplay between viruses and host sumoylation pathways. Nat. Rev. Microbiol. 11, 400–411 (2013).
13. Shuai, K. & Liu, B. Regulation of gene-activation pathways by PIAS proteins in the immune system. Nat. Rev. Immunol. 5, 593–605 (2005).
14. Tempé, D. et al. SUMOylation of the inducible (c-Fos:c-Jun)/AP-1 transcription complex occurs on target promoters to limit transcriptional activation. Oncogene 33, 921–927 (2014).
15. Liu, X., Chen, W., Wang, Q., Li, L. & Wang, C. Negative regulation of TLR inflammatory signaling by the SUMO-deconjugating enzyme SENP6. PLoS Pathog. 9, e1003480 (2013).
16. Liu, Y., Bridges, R., Wortham, A. & Kulesz-Martin, M. NF-kappaB repression by PIAS3 mediated RelA SUMOylation. PLoS ONE 7, e37636 (2012).
17. Ran, Y. et al. SENP2 negatively regulates cellular antiviral response by deSUMOylating IRF3 and conditioning it for ubiquitination and degradation. J. Mol. Cell Biol. 3, 283–292 (2011).
18. Liang, Q. et al. Tripartite motif-containing protein 28 is a small ubiquitin-related modifier E3 ligase and negative regulator of IFN regulatory factor 7. J. Immunol. 187, 4754–4763 (2011).
19. Fu, J., Xiong, Y., Xu, Y., Cheng, G. & Tang, H. MDA5 is SUMOylated by PIAS2β in the upregulation of type I interferon signaling. Mol. Immunol. 48, 415–422 (2011).
20. Begitt, A., Droescher, M., Knobeloch, K.P. & Vinkemeier, U. SUMO conjugation of STAT1 protects cells from hyperresponsiveness to IFNγ. Blood 118, 1002–1007 (2011).
21. Mi, Z., Fu, J., Xiong, Y. & Tang, H. SUMOylation of RIG-I positively regulates the type I interferon signaling. Protein Cell 1, 275–283 (2010).
22. Glass, C.K. & Saijo, K. Nuclear receptor transrepression pathways that regulate inflammation in macrophages and T cells. Nat. Rev. Immunol. 10, 365–376 (2010).
23. Lee, J.H. et al. Differential SUMOylation of LXRα and LXRβ mediates transrepression of STAT1 inflammatory signaling in IFN-gamma-stimulated brain astrocytes. Mol. Cell 35, 806–817 (2009).
24. Kubota, T. et al. Virus infection triggers SUMOylation of IRF3 and IRF7, leading to the negative regulation of type I interferon gene expression. J. Biol. Chem. 283, 25660–25670 (2008).
25. Ungureanu, D., Vanhatupa, S., Gronholm, J., Palvimo, J.J. & Silvennoinen, O. SUMO-1 conjugation selectively modulates STAT1-mediated gene responses. Blood 106, 224–226 (2005).
26. Liu, B. et al. Negative regulation of NF-κB signaling by PIAS1. Mol. Cell. Biol. 25, 1113–1123 (2005).
27. Liu, B. et al. PIAS1 selectively inhibits interferon-inducible genes and is important in innate immunity. Nat. Immunol. 5, 891–898 (2004).
28. Desterro, J.M., Rodriguez, M.S. & Hay, R.T. SUMO-1 modification of IκBα inhibits NF-κB activation. Mol. Cell 2, 233–239 (1998).
29. Demarque, M.D. et al. Sumoylation by Ubc9 regulates the stem cell compartment and structure and function of the intestinal epithelium in mice. Gastroenterology 140, 286–296 (2011).
30. Nacerddine, K. et al. The SUMO pathway is essential for nuclear integrity and chromosome segregation in mice. Dev. Cell 9, 769–779 (2005).
31. Blanc, M. et al. Host defense against viral infection involves interferon mediated down-regulation of sterol biosynthesis. PLoS Biol. 9, e1000598 (2011).
32. Clausen, B.E., Burkhardt, C., Reith, W., Renkawitz, R. & Forster, I. Conditional gene targeting in macrophages and granulocytes using LysMcre mice. Transgenic Res. 8, 265–277 (1999).
33. Couderc, T. et al. A mouse model for Chikungunya: young age and inefficient type-I interferon signaling are risk factors for severe disease. PLoS Pathog. 4, e29 (2008).
34. Qiao, Y. et al. Synergistic activation of inflammatory cytokine genes by interferon-γ-induced chromatin remodeling and toll-like receptor signaling. Immunity 39, 454–469 (2013).
35. Neyret-Kahn, H. et al. Sumoylation at chromatin governs coordinated repression of a transcriptional program essential for cell growth and proliferation. Genome Res. 23, 1563–1579 (2013).
36. Garber, M. et al. A high-throughput chromatin immunoprecipitation approach reveals principles of dynamic gene regulation in mammals. Mol. Cell 47, 810–822 (2012).
37. Heintzman, N.D. et al. Histone modifications at human enhancers reflect global cell-type-specific gene expression. Nature 459, 108–112 (2009).
38. Kaikkonen, M.U. et al. Remodeling of the enhancer landscape during macrophage activation is coupled to enhancer transcription. Mol. Cell 51, 310–325 (2013).
39. Lam, M.T., Li, W., Rosenfeld, M.G. & Glass, C.K. Enhancer RNAs and regulated transcriptional programs. Trends Biochem. Sci. 39, 170–182 (2014).
40. Chow, N.A., Jasenosky, L.D. & Goldfeld, A.E. A distal locus element mediates IFN-γ priming of lipopolysaccharide-stimulated TNF gene expression. Cell Rep. 9, 1718–1728 (2014).
41. Banerjee, A.R., Kim, Y.J. & Kim, T.H. A novel virus-inducible enhancer of the interferon-β gene with tightly linked promoter and enhancer activities. Nucleic Acids Res. 42, 12537–12554 (2014).
42. Racke, M.K. Experimental autoimmune encephalomyelitis (EAE). Curr. Protoc. Neurosci. Unit 9.7 Suppl. 14, 1–11 ( 2001).
npg
© 2
016
Nat
ure
Am
eric
a, In
c. A
ll rig
hts
rese
rved
.
nature immunology doi:10.1038/ni.3342
ONLINE METhODSMice. All animal studies were conducted under animal study protocols (2014-0022 and 02465.02) approved by the local ethics committee. Ubc9+/+ROSA26-CreERT2 (Ubc9+/+) and Ubc9fl/−ROSA26-CreERT2 (Ubc9fl/−) mice were generated as described29 by intercrossing of Ubc9fl/− and ROSA26-CreERT2 mice. Only sex-matched, 6- to 12-week-old littermates were used and com-pared in all experiments (except when 9-day-old neotatal mice were infected with chikungunya virus or when hematopoietic chimeras were used). Ifnar1−/− mice and Lyz2-Cre mice have been described32,43. All mice were bred at the Pasteur Institute animal facility (Paris, France) under specific pathogen–free conditions. CD45.1+ congenic C57BL/6 mice were bred and housed at the Curie Institute (Paris, France).
Antibodies and reagents. The following antibodies were used for immuno-blot analysis: antibody to (anti-)Sumo1 (Y299; ab32058) anti-Sumo2+3 (8A2; ab81371) and anti-Ubc9 (EP29389; ab75857) (all from Abcam); anti-SP1 PEP2 (sc-59), anti-Stat1 (E23; sc-346) and anti-tubulin (B-5-1-2; sc-23948) (all from Santa Cruz Biotechnology); antibody to Stat1 phosphorylated at Tyr701 (58D6; 9167), anti-IκBα (44D4; 4812), antibody to SAPK/JNK phosphorylated at Thr183 and Tyr185 (81E11; 4668), anti-SAPK/JNK (9552), antibody to 38 MAPK phosphorylated at Thr180 and Thr182 (D3F9; 4511), anti-p38 MAPK (9212), antibody to Erk1/2 phosphorylated at Thr202 and Tyr204 (D13.14.4E; 4370), anti-p44/42 MAPK (Erk1/2) (137F5; 4965), anti-NF-κB p65 D14E12 (8242) and antibody to IRF3 phosphorylated at Ser396 (4D4G; 4947) (all from Cell Signaling); anti-β-actin AC-15 (A5441; Sigma-Aldrich); and anti-IRF3 (07-2193; Millipore). The antibodies used for ChIP were provided by M. Dasso (anti-Sumo2+3), Abcam (antibody to Sumo1 Y299; ab32058), Covance (anti-polII; 8WG16; MMS-126R) or Millipore (anti-H3K4me3 (17-614) and anti-H3ac (06-599)). The following fluorochrome-conjugated antibodies were used for flow cytometry: anti-CD11c (HL3), anti-I-Ab (AF6-120.1), anti-CD40 (3/23), anti-CD11b (M1/70), anti-B220 (RA3-6B2) and anti-CD24 (M1/69) (all from BD); and anti-CD86 (GL1), anti-CD45.1 (A20), anti-CD45.2 (104), anti-Gr-1 (RB6-8C5) and anti-F4/80 (BM8) (all from eBioscience) and F4/80 (BM8). Zymosan, PAM3CSK4, LPS (ultrapure, from Escherichia coli strain 0111:B4) and CpG (oligodinucleotide 1668) were from Invivogen. Recombinant mouse TNF was from R&D Systems.
Cell culture. Bone marrow–derived dendritic cells (BMDCs) were dif-ferentiated from Ubc9+/+ROSA26-CreERT2 or Ubc9fl/−ROSA26-CreERT2 hematopoietic precursor cells. Total bone marrow cells were cultured for 10 d in complete culture medium (IMDM supplemented with 2 mM Glutamax, 1 mM sodium pyruvate, 1× non-essential amino acids, 10,000 units/ml peni-cillin, 10,000 µl/ml streptomycin, 50 mM 2-mercaptoethanol (all from Life Technologies) and 10% FCS (FCS; Eurobio)) and in the presence of recom-binant mouse cytokine GM-CSF (20 ng/ml; eBioscience) or Flt-3 ligand (50 ng/ml; R&D Systems). From day 6, the medium was supplemented with 100 nM 4-hydroxytamoxifen (Sigma). Bone marrow–derived macrophages (BMDM) were differentiated according to a similar protocol but with the cytokine M-CSF (20 ng/ml; R&D Systems). For analysis of the production of cytokines and chemokines, 1 × 10⁵ or 2 × 10⁵ cells per well were cultured for 24 h in 96-well flat-bottomed plates in 200 µl culture medium in the presence of the appropriate amount of LPS, CpG, Pam3CSK4, zymosan or TNF. For RNA isolation or biochemical assays, 5 × 10⁵ BMDCs per well were cultured for the appropriate time in 24-well plates in 0.5 ml culture medium containing 10 ng/ml LPS or not. In certain experiments, BMDCs were pre-treated for 3 h with recombinant mouse IFN-β (5 ng/ml) before stimulation with LPS. Mouse embryonic fibroblasts were generated from embryos at embryonic day 12.5 and were cultured in DMEM (Life Technologies) supplemented with penicillin, streptomycin and 10% heat-inactivated fetal calf serum (Eurobio). The human monocytic THP-1 cells and RAW264.7 mouse macrophage cells were cultured in RPMI-1640 medium supplemented with penicillin, streptomycin and 10% heat-inactivated fetal calf serum (Eurobio).
Flow cytometry. The phenotype and maturation status of BMDCs and BMDMs were analyzed by flow cytometry at the end of the culture. 1 × 10⁶ cells were first incubated on ice for 20 min in 50 µl of flow cytom-etry buffer (2 mM EDTA and 1% FCS in PBS) supplemented with Fc Block
(2.4G2; BD) and rat IgG. Cells were then labeled for 30 min on ice, while pro-tected from light, by the addition of 50 µl of flow cytometry buffer containing saturating amounts of the antibodies of interest. After being stained, cells were washed twice and homogenized in 200 µl of flow cytometry buffer. Data were acquired on a MACSquant Q10 cytometer (Miltenyi) and were analyzed with FlowJo software (TreeStar).
Measurements of cytokines and chemokines. The concentration of cytokines and chemokines (CCL2, CCL3, CCL4, IL-6, TNF, CXCL10 and IL-10) in serum and culture supernatants were measured by flow cytometry with a bead-based multiple-analytes detection system (Flow cytomix; eBioscience). Data were acquired on a MACSquant Q10 cytometer (Miltenyi) and were analyzed with Flow Cytomix Pro software (eBioscience). IFN-β concentrations were meas-ured with a VeriKine Mouse Interferon Beta ELISA Kit (PBL Assay Science) according to manufacturer’s instructions.
RNA isolation and quantitative RT-PCR. Total RNA was purified by TRIzol extraction, then cDNA was generated from 1 µg total RNA with a High-Capacity cDNA Reverse Transcription Kit (Applied Biosystems). mRNA was assessed by quantitative real-time PCR analysis with Power SYBR Green master mix (Applied Biosystems) and the primer sets in Supplementary Table 6. The change-in-cycling-threshold (∆Ct) values were calculated with Ct values from the amplification of endogenous mRNA encoding glyceraldehyde-3-phosphate dehydrogenase (Gapdh), hypoxanthine-guanine phosphoribosyltransferase (Hprt) or β-actin (Actb). Quantitative real-time PCR was performed on a CFX96 PCR system (Bio-Rad).
Microarray analysis. BMDCs were stimulated for 0 or 6 h with LPS (10 ng/ml), and total RNA was prepared by TRIzol extraction (Invitrogen). RNA integ-rity and its concentration were evaluated with a 2100 Bioanalyzer and RNA 6000 Nano kit (Agilent). The preparation of cDNA and its hybridization to an Affymetrix Mouse Gene 1.0 ST Array were performed at the Institut Pasteur facility. Statistical analysis for comparison of replicate arrays was done with the local poor-error test. P values were adjusted with the Bonferroni algo-rithm, and a threshold of P < 0.05 was used as the criterion for significance. Functional annotation was performed by DAVID software.
In vivo model of endotoxin-mediated septic shock. Bone marrow from femurs and tibias was collected from Ubc9+/+ROSA26-CreERT2 or Ubc9fl/− ROSA26-CreERT2 CD45.2+ mice in complete medium. Single-cell suspen-sions were washed three times in PBS and were filtered through a 70-µm cell strainer. 5 × 10⁶ cells were then injected intravenously into γ-irradiated CD45.1+ or Tlr4−/− C57BL/6 hosts (11 Gy; 137Cs source) that were provided acidified water for the complete duration of the experiment. At 6 to 10 weeks after grafting, hematopoietic reconstitution was assessed in blood samples by flow cytometry. More than 95% of the myeloid compartment was systemati-cally of donor (CD45.2+) origin. Mice were given intraperitoneal injection of 4-hydroxytamoxifen (100 µg per injection, three injections separated by 12 h) and were then challenged with LPS (25 mg per kg body weight) or with PBS. Mouse survival was monitored every 4–8 h. All mice that did not succumb to injection of endotoxin during the first 3 d quickly recovered afterward and survived for more than 4 weeks. In certain experiments, blood samples were obtained up 6 h after injection of LPS for quantification of pro- and anti-inflammatory mediators in the serum.
Chikungunya virus infection. 9-day-old Ubc9+/+LysM-Cre and Ubc9 fl/fl/ LysM-Cre mice were infected with 1 × 10⁶ plaque-forming units of chikun-gunya virus subcutaneously in the upper chest, and their survival was moni-tored for 20 d after infection as described33. At day 8 after infection, the clinical score of each mouse was determined according with published clinical scores for experimental autoimmune encephalomyelitis42 as follows: 0, no abnormal-ity; 1, limp tail; 2, mild limb weakness (mice grasp the cage with the ankle instead of with toes); 3, no righting reflex (unable to return and land on feet when flipped over); 4, complete hindlimb paralysis; 5, premoribund state.
Infection with S. flexneri. The invasive S. flexneri serotype 5a strain M90T44 was grown in Luria broth at 37 °C with aeration. The bacterial titer
npg
© 2
016
Nat
ure
Am
eric
a, In
c. A
ll rig
hts
rese
rved
.
nature immunologydoi:10.1038/ni.3342
was calculated as follow: an absorbance value of 1 at 600 nm corresponds to 5 × 10⁸ bacteria per ml. Mouse embryonic fibroblasts were infected for the appropriate time with S. flexneri strain M90T at a multiplicity of infection of 50 in DMEM.
Infection with influenza virus and MVA-B (HIV). BMDCs were harvested at day 10 and were homogenized at a density of 1 × 10⁶ per ml in complete culture medium containing 8 µg/ml protamine and 2% serum for infection with MVA-B (HIV) or 10% serum for infection with H1N1 influenza virus. 1 × 10⁵ cells were separated into aliquots of 100 µl in round-bottomed 96-well plates, and 100 µl of medium containing a dilution of virus or no virus was added. MVA-B was produced by Transgene and was provided by Agence nationale de recherche sur le sida et les hépatites virales and has been described45. Influenza virus H1N1 was strained A/PR/8/34 (10100374; Charles River). MVA-B-infected BMDCs were stained 6 h after infection with a Live/Dead violet marker (Life Technologies) and with fluorescence-labeled anti-CD11b (M1/70), anti-CD11c (HL3) and anti-I-Ab (AF-6-120.1) (all from BD Biosciences). Cells were fixed and permeabilized with BD Cytofix/Cytoperm buffer and were labeled with fluorescein isothiocyanate–coupled anti-Gag (KC57; Beckman Coulter) in BD Perm/Wash 1× buffer. H1N1 influenza virus–infected BMDCs were stained 24 h after infection with a Live/Dead violet marker and with ant-HA (KB2; a gift from A. Garcia-Sastre) and were fixed. Data were acquired on a FACSVerse flow cytometer (BD Biosciences).
ChIP. ChIP was performed as described46. Cells were fixed for 10 min at room temperature in culture medium with formaldehyde (1% final concentration). Formaldehyde was then quenched with glycine (125 mM final). Cells were washed in ice cold PBS and lysed in RIPA buffer. The extracted chromatin was sonicated with a Bioruptor Pico (Diagenode) until chromatin fragments reached a size of 200–500 base pairs (bp), as assayed by electrophoresis through agarose gels. Immunoprecipitation was performed overnight at 4 °C with anti-SUMO-2 (a gift from M. Dasso), anti-SUMO-1 (Y299; Abcam), anti-H3K4me3 (17-614; Millipore), anti-H3ac (06-599; Millipore) and anti-PolII (8WG16; Covance) in the presence of Protein G Dynabeads (Life Technologies). Beads were then extensively washed and the immunoprecipitated chromatin was eluted. The crosslinking was reversed by incubation of the chromatin for 4 h at 65 °C. RNA and protein were then digested by sequential treatment with RNaseA and proteinase K, respectively. DNA was purified with solid-phase reversible immobilization beads and ethanol wash, and were eventually eluted in Tris-EDTA buffer.
ChIP-seq analysis. ChIP libraries were indexed, pooled and sequenced on Illumina HiSeq-2000 sequencers at the Weizmann Institute (Rehovot, Israel). Reads were aligned onto the mm9 assembly of the mouse genome with Bowtie2.0 software47 as described36. Mapped reads were submitted to HOMER software (‘hypergeometric optimization of motif enrichment’) for the identification of SUMO-binding sites. HOMER was used with the default parameters after removing of the duplicated reads. The genome ontology and motif discovery analyses were performed with HOMER. Each peak identified was assigned to the closest gene(s) by calculation of the distance separating the center of the peak from the TSS. DeepTools software48 was used for nor-malization of ChIP-Seq data and for the generation of heat maps. Gene-body coordinates for mm9 were obtained from UCSC Table Browser.
Luciferase reporter assay. A luciferase reporter plasmid containing the mouse Ifnb1 promoter and proximal enhancer was cloned by insertion of 219 bp of the sequence preceding the Ifnb1 ATG into the promoter-less pGL3 Basic vector (Promega) flush with the luciferase ATG. To this were added S-IRE1 (2,433 bp) or negative control sequence NR1 (2,080 bp), NR2 (2049 bp) or NR3 (2,031 bp), amplified by PCR from mouse genomic DNA with primers in Supplementary Table 6 and inserted upstream of the Ifnb1 promoter and
proximal enhancer (position –219). A 488-bp deletion in the S-IRE1 sequence (S-IRE1-∆S) was made by removal of a StyI internal restriction fragment and religation. An inverted enhancer sequence (1ERI-S) was made by insertion in the antisense orientation. The enhancer (S-IRE1), the S-IRE1 sequence with the deletion noted above (S-IRE1-∆S) and one control sequence (NR1) were also inserted downstream (D) of the Ifnb1 enhancer-promoter (position –219) luciferase cassette (to generate S-IRE1-D, S-IRE1-∆S-D and NR1-D, respectively) by cloning of these into the BamHI and SalI sites 3′ of the SV-40 poly-adenylation signal following the luciferase sequence. The S-IRE1 and S-IRE1-∆S sequences lacked 45 bp of 5′ sequence that precedes an internal BamHI site used here for cloning. Complete sequences of all constructions are in Supplementary Table 7.
For reporter assays, 5 × 10⁵ RAW264.7 cells (ATCC) in 24-well format were transfected for 24 h with XtremeGENE HP reagent (Roche) containing 500 ng reporter plasmid and 100 ng TK-Renilla-luciferase control plasmid (Promega), followed by 6 h of treatment with 10 ng/ml LPS (or control) and assay with Dual-Glo Luciferase system reagent (Promega) according to the manufacturer’s protocol. Results of transfections were normalized to those of the renilla luciferase control values. siRNA for depletion of UBC9 was transfected into cells 24 h before transfection of luciferase reporter plasmids.
siRNA treatment and shRNA transduction. Shortly before transfection, RAW264.7 cells were seeded at a density of 2 × 10⁶ cells per well in six-well plates, in 0.8 ml of complete growth medium. Non-targeting control siRNA and siRNA directed against S-IRE1 eRNA (Ambion, Life Technologies) were transfected into cells via Hiperfect (Qiagen) according tothe manufacturer’s protocol. Transfection mixtures were prepared with 500 µl of RPMI-1640 medium without serum, 30 µl of HiPerFect and 1,900 ng of each individual siRNA. Cells were subsequently incubated for 16 h, then were diluted with 2 ml of complete growth medium and stimulated with LPS (10 ng/ml). RNA was harvested, followed by real-time PCR analysis. The same protocol was used for transfection of siRNA directed against Ubc9 mRNA. Two Ubc9-specific siRNAs (J-040661-17 and J-040661-20) and two non-targeting siRNAs (D-001810-01-05 and D-001810-02-05) were purchased from Dharmacon (sequences, Supplementary Table 6).
For stable knockdown of UBC9, THP-1 cells were seeded in 12-well plates and were incubated with lentivirus expressing a non-targeting control short hairpin RNA or UBC9-specific short hairpin RNA35, at a multiplicity of infec-tion of 1, for three consecutive cycles of 12 h, in the presence of polybrene (8 µg/ml). At 14 d after transduction, cells were treated with LPS or not.
Statistical analysis. A log-rank test was used for survival curves. For compari-son of cytokine production and mRNA, t-tests and Mann-Whitney tests were used. Correlation between SUMO-1 and SUMO-2 reads was assessed with the seqMINER data-interpretation platform49.
43. Schilte, C. et al. Type I IFN controls chikungunya virus via its action on nonhematopoietic cells. J. Exp. Med. 207, 429–442 (2010).
44. Sansonetti, P.J. & Mounier, J. Metabolic events mediating early killing of host cells infected by Shigella flexneri. Microb. Pathog. 3, 53–61 (1987).
45. Brandler, S. et al. Preclinical studies of a modified vaccinia virus Ankara-based HIV candidate vaccine: antigen presentation and antiviral effect. J. Virol. 84, 5314–5328 (2010).
46. Blecher-Gonen, R. et al. High-throughput chromatin immunoprecipitation for genome-wide mapping of in vivo protein-DNA interactions and epigenomic states. Nat. Protoc. 8, 539–554 (2013).
47. Langmead, B. & Salzberg, S.L. Fast gapped-read alignment with Bowtie 2. Nat. Methods 9, 357–359 (2012).
48. Ramírez, F., Dundar, F., Diehl, S., Gruning, B.A. & Manke, T. deepTools: a flexible platform for exploring deep-sequencing data. Nucleic Acids Res. 42, W187–191 (2014).
49. Ye, T. et al. seqMINER: an integrated ChIP-seq data interpretation platform. Nucleic Acids Res. 39, e35 (2011).
npg
© 2
016
Nat
ure
Am
eric
a, In
c. A
ll rig
hts
rese
rved
.
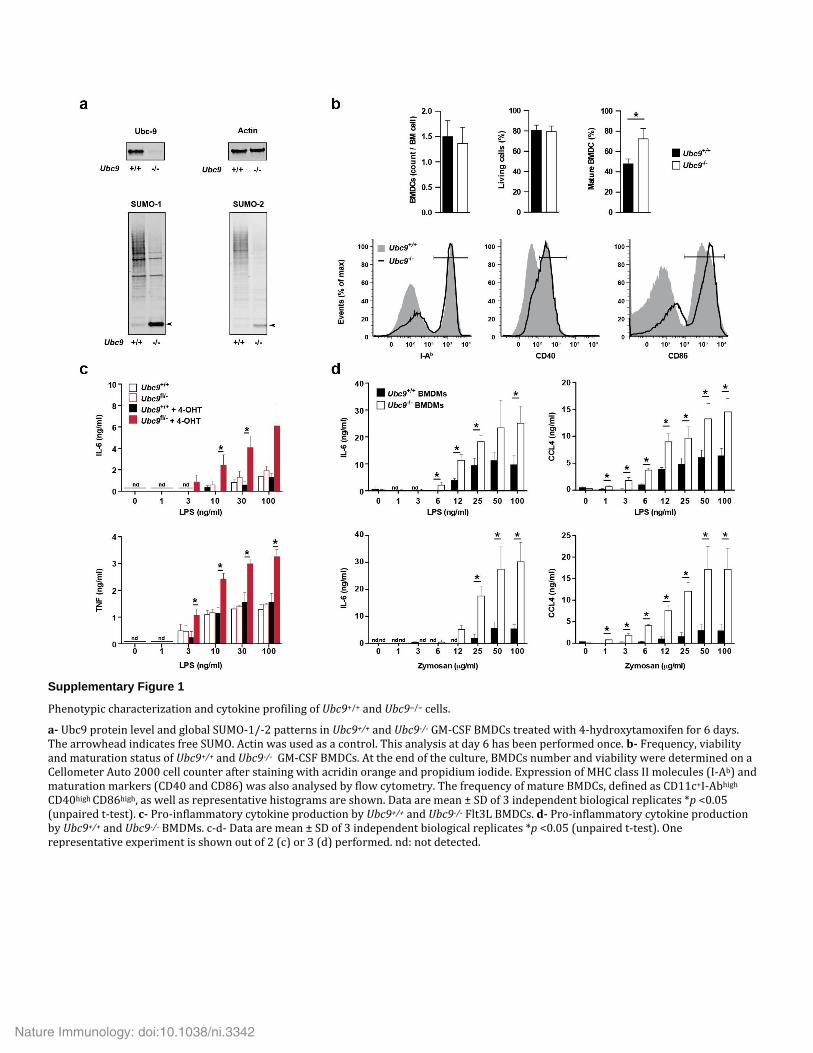
Supplementary Figure 1
Phenotypic characterization and cytokine profiling of Ubc9+/+ and Ubc9‒/‒ cells.
a- Ubc9 protein level and global SUMO-1/-2 patterns in Ubc9+/+ and Ubc9-/- GM-CSF BMDCs treated with 4-hydroxytamoxifen for 6 days. The arrowhead indicates free SUMO. Actin was used as a control. This analysis at day 6 has been performed once. b- Frequency, viability and maturation status of Ubc9+/+ and Ubc9-/- GM-CSF BMDCs. At the end of the culture, BMDCs number and viability were determined on a Cellometer Auto 2000 cell counter after staining with acridin orange and propidium iodide. Expression of MHC class II molecules (I-Ab) and maturation markers (CD40 and CD86) was also analysed by flow cytometry. The frequency of mature BMDCs, defined as CD11c+I-Abhigh
CD40high CD86high, as well as representative histograms are shown. Data are mean ± SD of 3 independent biological replicates *p <0.05 (unpaired t-test). c- Pro-inflammatory cytokine production by Ubc9+/+ and Ubc9-/- Flt3L BMDCs. d- Pro-inflammatory cytokine production by Ubc9+/+ and Ubc9-/- BMDMs. c-d- Data are mean ± SD of 3 independent biological replicates *p <0.05 (unpaired t-test). One representative experiment is shown out of 2 (c) or 3 (d) performed. nd: not detected.
Nature Immunology: doi:10.1038/ni.3342
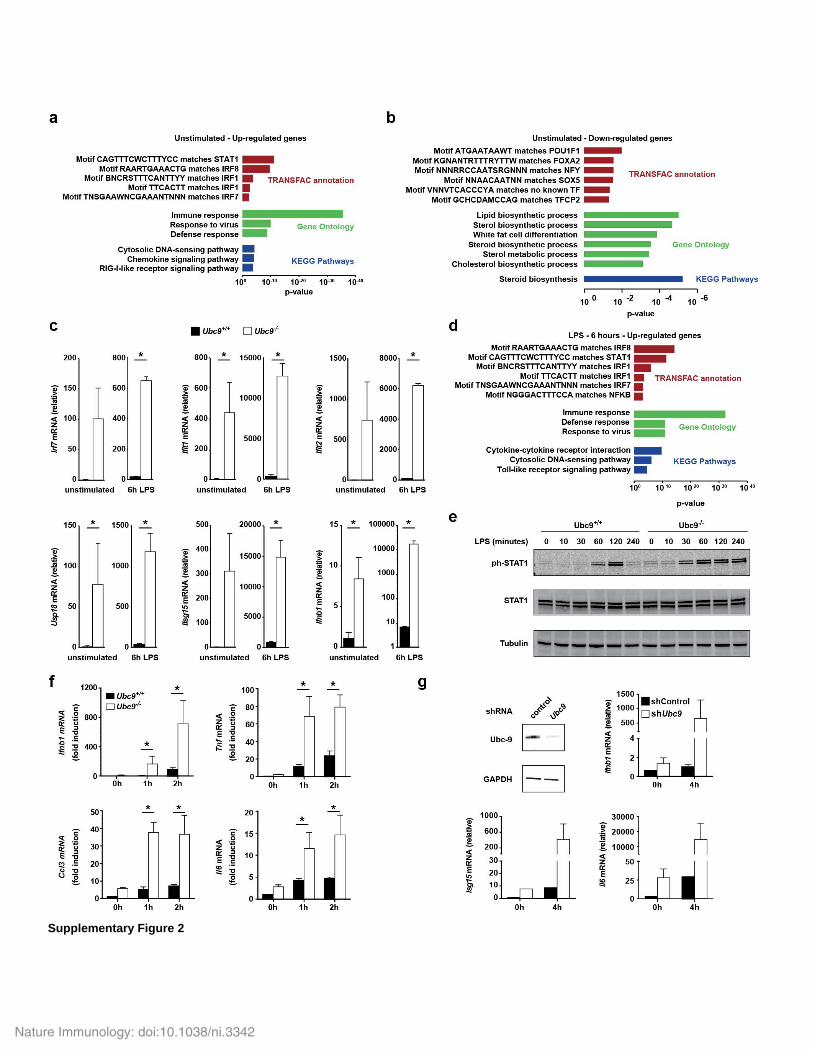
Supplementary Figure 2
Nature Immunology: doi:10.1038/ni.3342
Effect of Ubc9 loss on the pro-inflammatory and anti-viral transcriptional response in BMDCs, MEFs and THP-1 cells.
a-b- Functional annotation of up-regulated (a) or down-regulated (b) genes in unstimulated Ubc9+/+ vs Ubc9-/- BMDCs. The top over-
represented categories belonging to 3 different ontologies are shown. c- ISG and Ifnb1 mRNA levels in Ubc9+/+ and Ubc9-/- BMDCs
unstimulated or 6h post-stimulation with LPS as determined by RT-qPCR. Data are mean ± SD of 3 independent biological replicates
performed in triplicate. *p <0.05 (unpaired t-test, one tailed). d- Functional annotation of up-regulated genes in Ubc9+/+ vs Ubc9-/- stimulated
for 6h by LPS. The top over-represented categories belonging to 3 different ontologies are shown. e- Whole cell extracts from Ubc9+/+ and
Ubc9-/- BMDCs treated with LPS (10ng/ml) for the indicated times were analyzed by Western blotting with antibodies for STAT1 and
phospho-STAT1 (Tyr 701). Tubulin was used as a loading control. f- Ubc9+/+ and Ubc9-/- MEFs were infected for the indicated times by
Shigella flexneri and Ifnb1, Tnf, Ccl3 and Il6 transcripts were measured. Data are mean ±SD of 3 independent experiments; *p <0.05,
(Unpaired t-test). g- THP1 cells were infected with lentiviruses expressing a control shRNA or a shRNA targeting Ubc9 mRNA, and
knockdown efficiency was assessed by Western blotting (left panel, data are representative of 3 independent experiments). Ifnb1, Isg15 and
Il6 mRNA levels in Ubc9 knockdown or control THP1 cells treated for 0h and 4h with LPS as determined by RT-qPCR (right panel). Data are
mean +/- SD of 2 independent experiments.
Nature Immunology: doi:10.1038/ni.3342
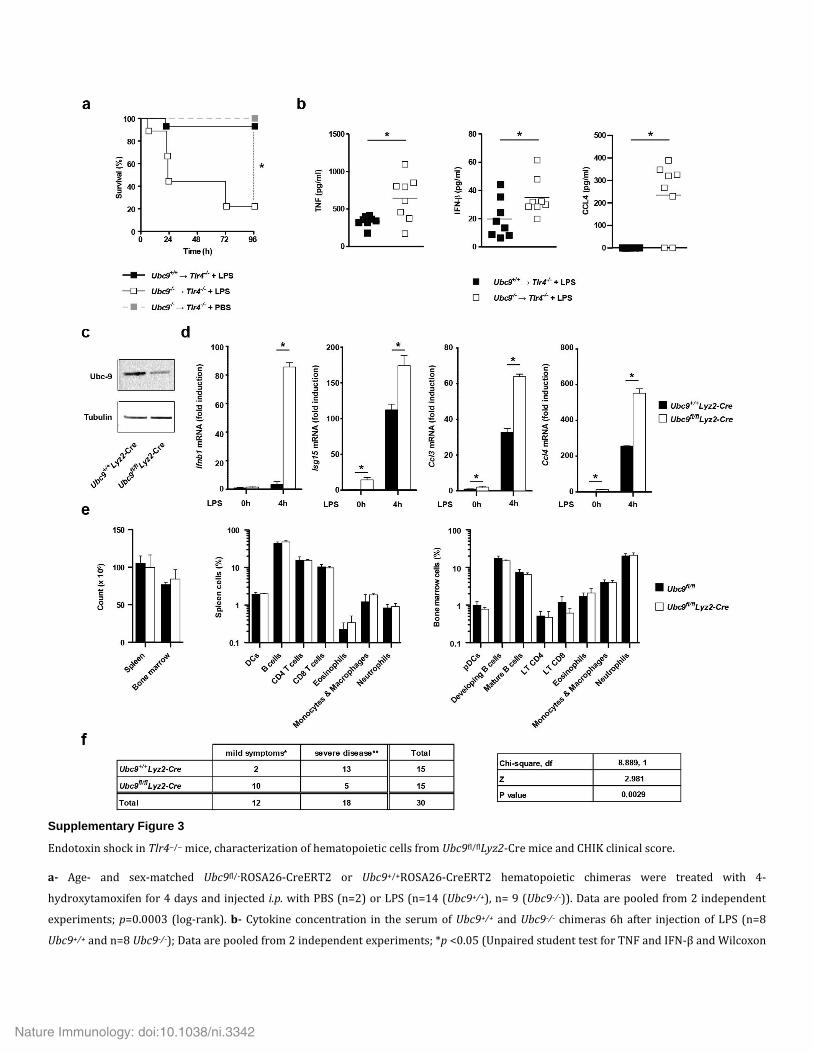
Supplementary Figure 3
Endotoxin shock in Tlr4‒/‒ mice, characterization of hematopoietic cells from Ubc9fl/flLyz2-Cre mice and CHIK clinical score.
a- Age- and sex-matched Ubc9fl/-ROSA26-CreERT2 or Ubc9+/+ROSA26-CreERT2 hematopoietic chimeras were treated with 4-
hydroxytamoxifen for 4 days and injected i.p. with PBS (n=2) or LPS (n=14 (Ubc9+/+), n= 9 (Ubc9-/-)). Data are pooled from 2 independent
experiments; p=0.0003 (log-rank). b- Cytokine concentration in the serum of Ubc9+/+ and Ubc9-/- chimeras 6h after injection of LPS (n=8
Ubc9+/+ and n=8 Ubc9-/-); Data are pooled from 2 independent experiments; *p <0.05 (Unpaired student test for TNF and IFN-β and Wilcoxon
Nature Immunology: doi:10.1038/ni.3342
t-test for CCL4 (the values of the Ubc9+/+ samples were all equal to 0, unpaired t-test not applicable). c- Western blot analysis of Ubc9
expression in GM-CSF-induced BMDCs from Ubc9+/+Lyz2-Cre and Ubc9fl/flLyz2-Cre mice. Data are representative of 3 independent
experiments. d- Cytokine mRNA levels in Ubc9+/+Lyz2-Cre and Ubc9fl/flLyz2-Cre BMDCs activated for 4h with LPS (10ng/ml). Data are mean ±
SD of 3 independent biological replicates performed in triplicate; *p <0.05, (unpaired t-test). e- Phenotypic characterization of bone marrow
and spleen cells derived from Ubc9fl/fl and Ubc9fl/flLyz2-Cre mice. Spleen dendritic cells (DC), B lymphocytes, CD4 or CD8 T cells, eosinophils,
monocytes/macrophages and neutrophils were defined as CD11c+I-Ab+, B220+CD19+, CD4+TCR+ or CD8+TCR+, lin-CD11b+Gr-1-/lowSSChigh,
lin-CD11b+Gr-1-/lowSSClow and lin-CD11b+Gr-1brightSSCint, respectively. Lineage-positive cells were gated out using a CD4, CD8, CD19, CD11c
and NK1.1 FITC dump channel. For the bone marrow, plasmacytoid dendritic cells (pDC), developing and mature B cells, CD4 or CD8 T cells,
eosinophils, monocytes/macrophages and neutrophils were defined as CD11c+PDCA-1+, IgD-B220+ or IgM+IgD+B220+, CD4+TCR+ or
CD8+TCR+, CD11c-F4/80highGr-1intSiglec-Fhigh, CD11c-F4/80highGr-1intSiglec-F- and CD11b+Ly6G+, respectively. Data are mean ± SD of 3
independent biological replicates. f- Statistical analysis of CHIKV clinical score (n=15, pool from 3 independent experiments). *mild
symptoms, mice with clinical score <2; ** severe symptoms, mice with clinical score >2; df, degrees of freedom; Z, standard normal
distribution score; p=0.0029 (Chi square test).
Nature Immunology: doi:10.1038/ni.3342
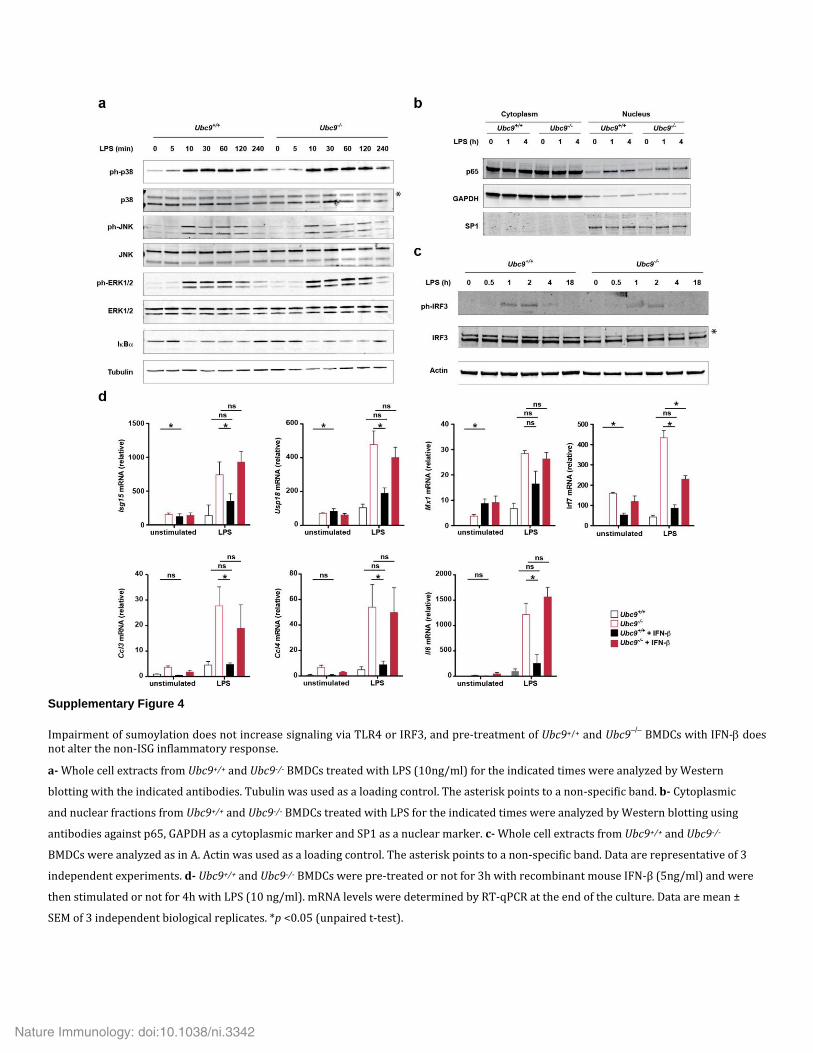
Supplementary Figure 4
Impairment of sumoylation does not increase signaling via TLR4 or IRF3, and pre-treatment of Ubc9+/+ and Ubc9‒/‒ BMDCs with IFN- does
not alter the non-ISG inflammatory response.
a- Whole cell extracts from Ubc9+/+ and Ubc9-/- BMDCs treated with LPS (10ng/ml) for the indicated times were analyzed by Western
blotting with the indicated antibodies. Tubulin was used as a loading control. The asterisk points to a non-specific band. b- Cytoplasmic
and nuclear fractions from Ubc9+/+ and Ubc9-/- BMDCs treated with LPS for the indicated times were analyzed by Western blotting using
antibodies against p65, GAPDH as a cytoplasmic marker and SP1 as a nuclear marker. c- Whole cell extracts from Ubc9+/+ and Ubc9-/-
BMDCs were analyzed as in A. Actin was used as a loading control. The asterisk points to a non-specific band. Data are representative of 3
independent experiments. d- Ubc9+/+ and Ubc9-/- BMDCs were pre-treated or not for 3h with recombinant mouse IFN-β (5ng/ml) and were
then stimulated or not for 4h with LPS (10 ng/ml). mRNA levels were determined by RT-qPCR at the end of the culture. Data are mean ±
SEM of 3 independent biological replicates. *p <0.05 (unpaired t-test).
Nature Immunology: doi:10.1038/ni.3342
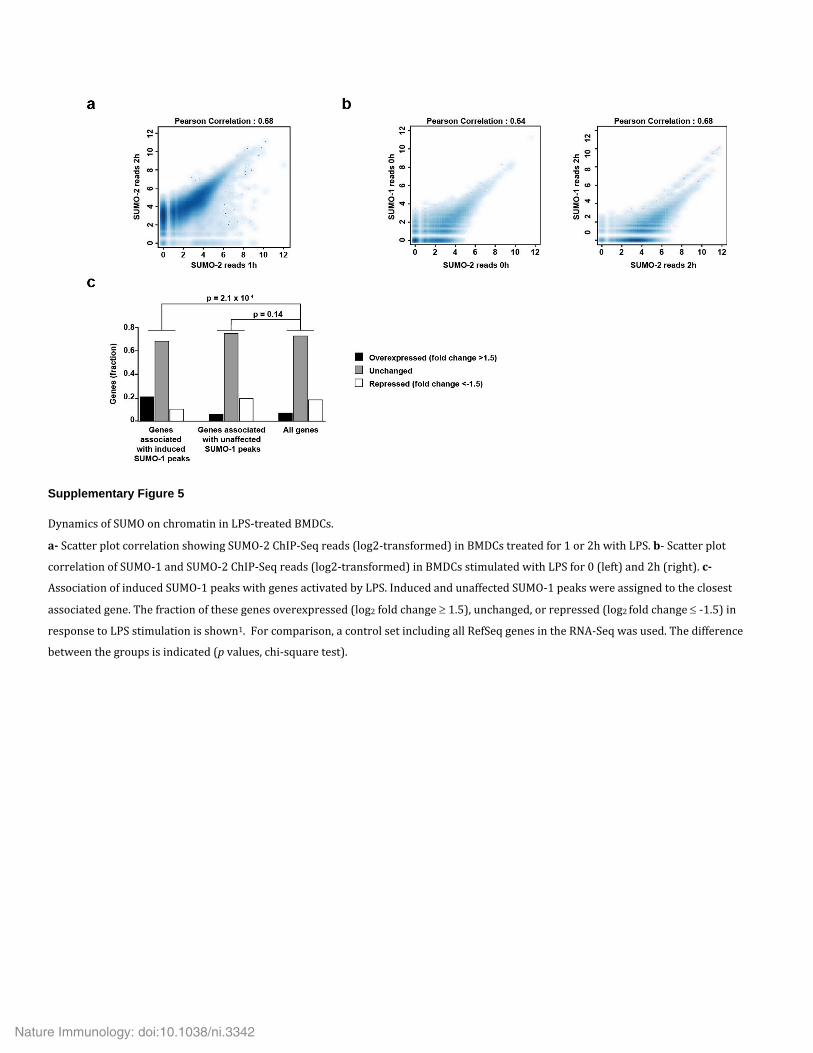
Supplementary Figure 5
Dynamics of SUMO on chromatin in LPS-treated BMDCs.
a- Scatter plot correlation showing SUMO-2 ChIP-Seq reads (log2-transformed) in BMDCs treated for 1 or 2h with LPS. b- Scatter plot
correlation of SUMO-1 and SUMO-2 ChIP-Seq reads (log2-transformed) in BMDCs stimulated with LPS for 0 (left) and 2h (right). c-
Association of induced SUMO-1 peaks with genes activated by LPS. Induced and unaffected SUMO-1 peaks were assigned to the closest
associated gene. The fraction of these genes overexpressed (log2 fold change 1.5), unchanged, or repressed (log2 fold change -1.5) in
response to LPS stimulation is shown1. For comparison, a control set including all RefSeq genes in the RNA-Seq was used. The difference
between the groups is indicated (p values, chi-square test).
Nature Immunology: doi:10.1038/ni.3342
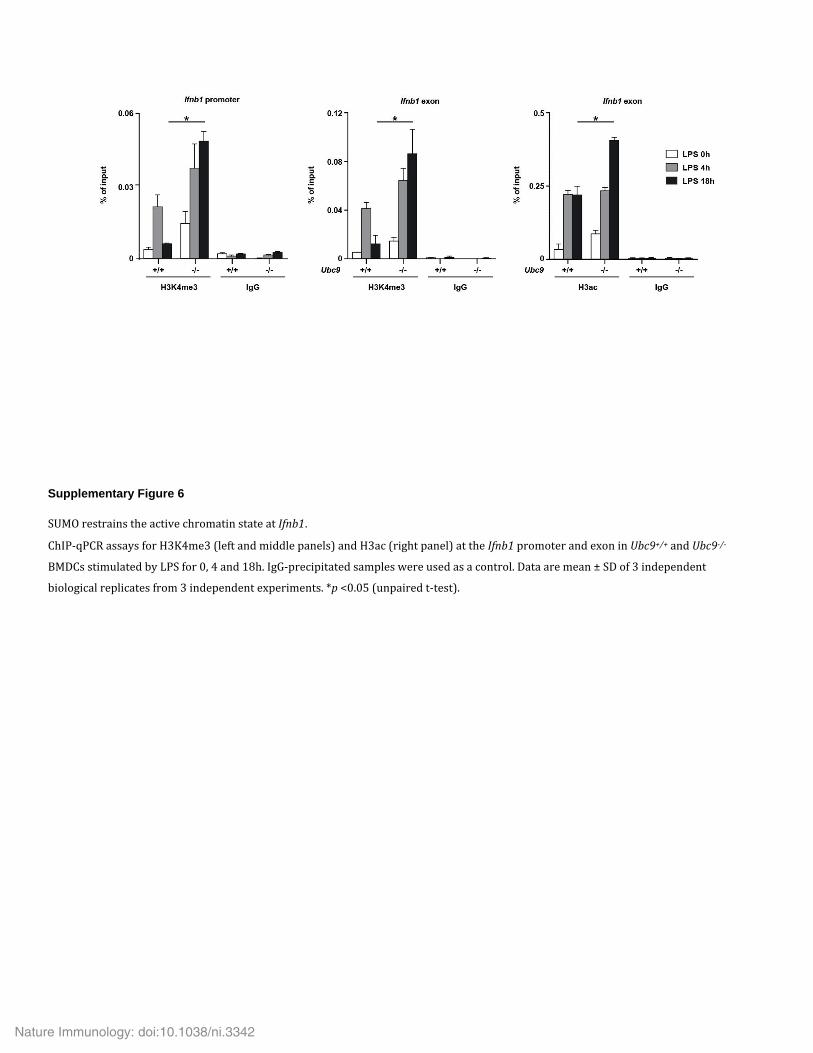
Supplementary Figure 6
SUMO restrains the active chromatin state at Ifnb1.
ChIP-qPCR assays for H3K4me3 (left and middle panels) and H3ac (right panel) at the Ifnb1 promoter and exon in Ubc9+/+ and Ubc9-/-
BMDCs stimulated by LPS for 0, 4 and 18h. IgG-precipitated samples were used as a control. Data are mean ± SD of 3 independent
biological replicates from 3 independent experiments. *p <0.05 (unpaired t-test).
Nature Immunology: doi:10.1038/ni.3342
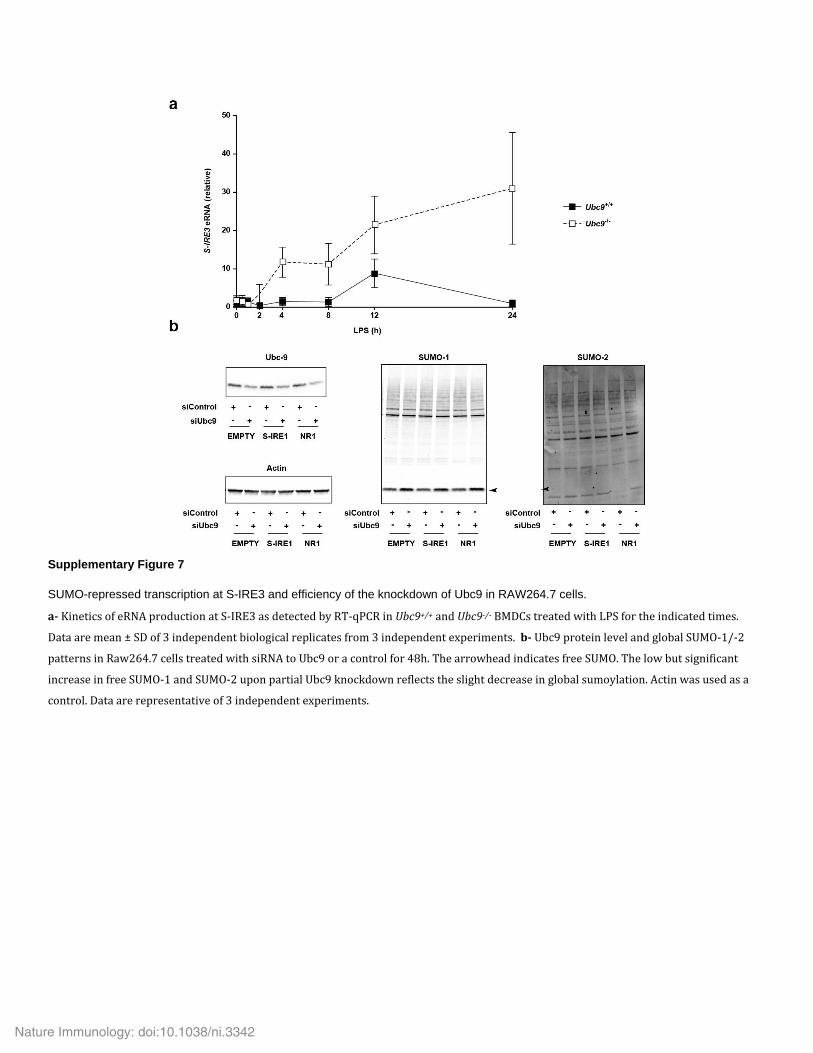
Supplementary Figure 7
SUMO-repressed transcription at S-IRE3 and efficiency of the knockdown of Ubc9 in RAW264.7 cells.
a- Kinetics of eRNA production at S-IRE3 as detected by RT-qPCR in Ubc9+/+ and Ubc9-/- BMDCs treated with LPS for the indicated times.
Data are mean ± SD of 3 independent biological replicates from 3 independent experiments. b- Ubc9 protein level and global SUMO-1/-2
patterns in Raw264.7 cells treated with siRNA to Ubc9 or a control for 48h. The arrowhead indicates free SUMO. The low but significant
increase in free SUMO-1 and SUMO-2 upon partial Ubc9 knockdown reflects the slight decrease in global sumoylation. Actin was used as a
control. Data are representative of 3 independent experiments.
Nature Immunology: doi:10.1038/ni.3342