Study of plasma carnitine ester profiles and genotype...
20
Study of plasma carnitine ester profiles and genotype analysis in carnitine deficiency syndromes PhD thesis Judit Bene Berenténé Department of Medical Genetics and Child Development Faculty of Medicine, University of Pécs Supervisor: Bela Melegh MD, PhD, DSc 2008 Pécs
Transcript of Study of plasma carnitine ester profiles and genotype...
Study of plasma carnitine ester profiles and genotype analysis in carnitine deficiency syndromes
PhD thesis
Judit Bene Berenténé
Department of Medical Genetics and Child Development Faculty of Medicine, University of Pécs
Supervisor: Bela Melegh MD, PhD, DSc
2008 Pécs
2
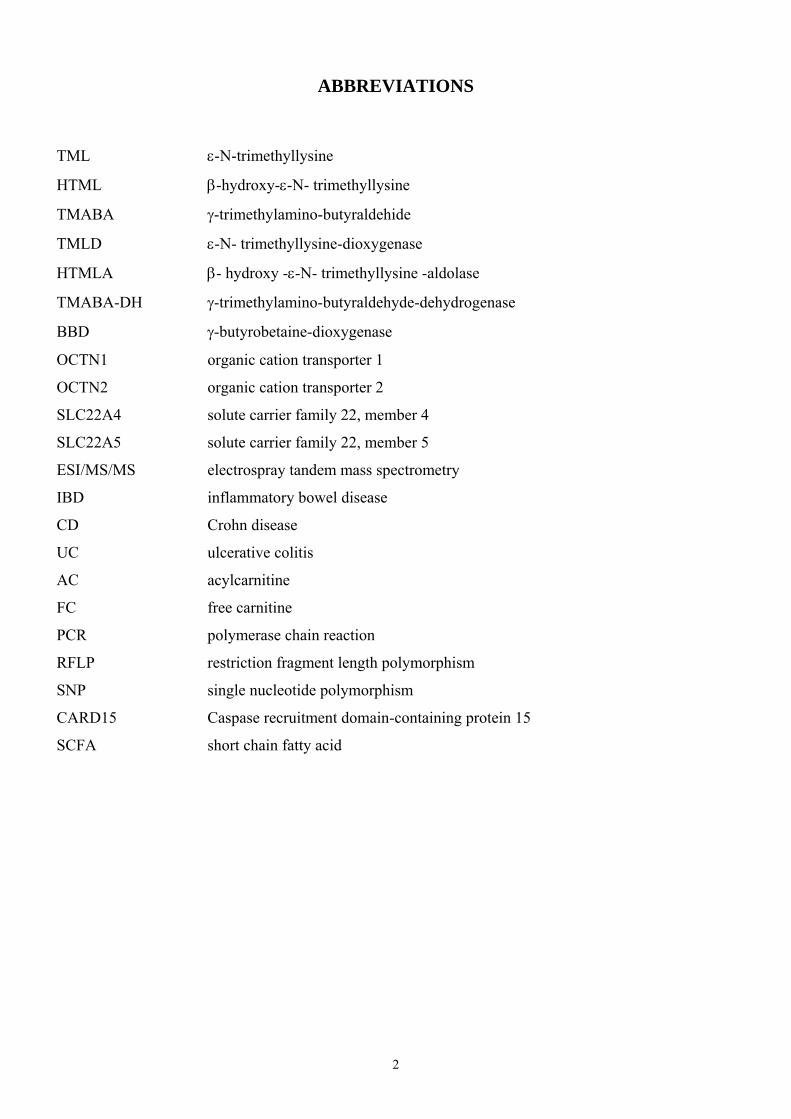
ABBREVIATIONS
TML ε-N-trimethyllysine
HTML β-hydroxy-ε-N- trimethyllysine
TMABA γ-trimethylamino-butyraldehide
TMLD ε-N- trimethyllysine-dioxygenase
HTMLA β- hydroxy -ε-N- trimethyllysine -aldolase
TMABA-DH γ-trimethylamino-butyraldehyde-dehydrogenase
BBD γ-butyrobetaine-dioxygenase
OCTN1 organic cation transporter 1
OCTN2 organic cation transporter 2
SLC22A4 solute carrier family 22, member 4
SLC22A5 solute carrier family 22, member 5
ESI/MS/MS electrospray tandem mass spectrometry
IBD inflammatory bowel disease
CD Crohn disease
UC ulcerative colitis
AC acylcarnitine
FC free carnitine
PCR polymerase chain reaction
RFLP restriction fragment length polymorphism
SNP single nucleotide polymorphism
CARD15 Caspase recruitment domain-containing protein 15
SCFA short chain fatty acid
3
1. INTRODUCTION
Carnitine (β-hydroxy-γ-N-trimethylaminobutyic acid) is a principal metabolite, it can be found in almost any animal, several microorganisms and plants.
1.1.1. The role of carnitine in metabolism
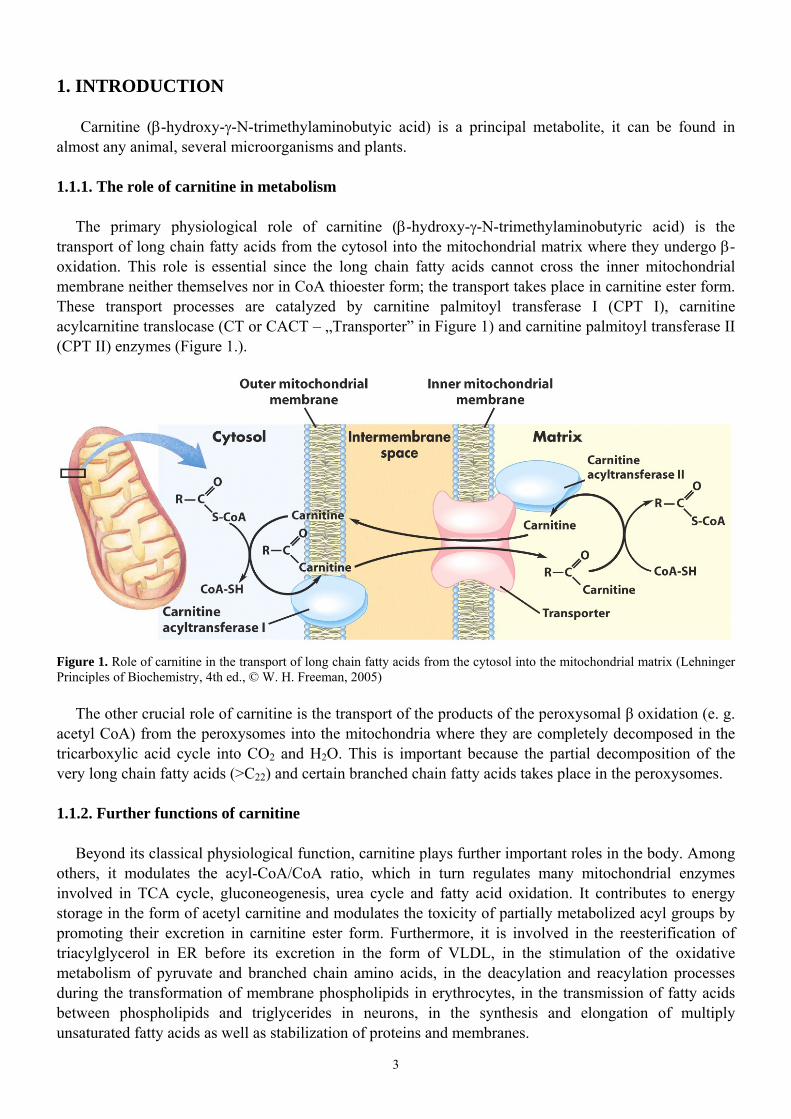
The primary physiological role of carnitine (β-hydroxy-γ-N-trimethylaminobutyric acid) is the transport of long chain fatty acids from the cytosol into the mitochondrial matrix where they undergo β-oxidation. This role is essential since the long chain fatty acids cannot cross the inner mitochondrial membrane neither themselves nor in CoA thioester form; the transport takes place in carnitine ester form. These transport processes are catalyzed by carnitine palmitoyl transferase I (CPT I), carnitine acylcarnitine translocase (CT or CACT – „Transporter” in Figure 1) and carnitine palmitoyl transferase II (CPT II) enzymes (Figure 1.).
Figure 1. Role of carnitine in the transport of long chain fatty acids from the cytosol into the mitochondrial matrix (Lehninger Principles of Biochemistry, 4th ed., © W. H. Freeman, 2005)
The other crucial role of carnitine is the transport of the products of the peroxysomal β oxidation (e. g. acetyl CoA) from the peroxysomes into the mitochondria where they are completely decomposed in the tricarboxylic acid cycle into CO2 and H2O. This is important because the partial decomposition of the very long chain fatty acids (>C22) and certain branched chain fatty acids takes place in the peroxysomes.
1.1.2. Further functions of carnitine
Beyond its classical physiological function, carnitine plays further important roles in the body. Among others, it modulates the acyl-CoA/CoA ratio, which in turn regulates many mitochondrial enzymes involved in TCA cycle, gluconeogenesis, urea cycle and fatty acid oxidation. It contributes to energy storage in the form of acetyl carnitine and modulates the toxicity of partially metabolized acyl groups by promoting their excretion in carnitine ester form. Furthermore, it is involved in the reesterification of triacylglycerol in ER before its excretion in the form of VLDL, in the stimulation of the oxidative metabolism of pyruvate and branched chain amino acids, in the deacylation and reacylation processes during the transformation of membrane phospholipids in erythrocytes, in the transmission of fatty acids between phospholipids and triglycerides in neurons, in the synthesis and elongation of multiply unsaturated fatty acids as well as stabilization of proteins and membranes.
4
1.1.3. Carnitine homeostasis in humans
Carnitine homeostasis is maintained by three main factors: endogenous synthesis, intake from nutrients and reabsorption in kidney tubules. Nutritional sources of carnitine are mainly of animal origin (meat, poultry, fish, dairy products), smaller amounts can be found in cereals, fruits and vegetables.
The total carnitine content of human body is in a fairly dynamic state. Carnitine and acyl carnitines flow from and to the gastrointestinal tract (after absorption), liver (after biosynthesis), kidney (for excretion) and carnitine dependent tissues (e. g. heart or skeletal muscle). Any metabolic change is followed by a redistribution between the carnitine and acyl carnitine pools of the tissues involved. Since carnitine and acyl carnitines cannot cross plasma membranes directly and carnitine is transported through the membranes by tissue specific transport systems (Kerner et al., 1998), total carnitine content and the kinetics of the carnitine homeostasis can vary significantly from tissue to tissue. Dramatic changes can take place in carnitine homeostasis of certain tissues simultaneously with no observable change in others.
Plasma is only a transporter of carnitine and acyl carnitines, so their concentrations are relatively low. In healthy adults free L-carnitine concentration of plasma is 40-50 µmol/l, that of acetyl carnitine (the most abundant ester) is typically 3-6 µmol/l. Total L-carnitine concentration is approx. 50-60 µmol/l (Evans et al., 2003). Since carnitine has no known metabolic function in plasma, changes in plasma carnitine concentrations can be understood only in relationships with other metabolic or tissue specific information. Kidney, liver and skeletal muscle contains carnitine in much higher concentrations than plasma. Due to the large mass of the skeletal muscle, the majority of the total carnitine content of the body is present in muscles and only very small amounts can be found in plasma or extracellular compartments.
Although 99% of the carnitine amount is intracellular, the relationship between serum acylcarnitine (AC) and free carnitine (FC) is highly sensitive to intramitochondrial alterations. Such alterations occur in different situations, both normal and abnormal. The normal situation is accompanied with changes in the relationship between AC and FC is fasting where increased ketogenesis leads to reduction in plasma free carnitine and the corresponding increase in AC. Other normal conditions include aging and pregnancy. Pathological situations with abnormal AC/FC ratio include several inborn errors of metabolism mainly organic acidurias, cirrhosis, chronic renal failure and iatrogenic situations such as treatment with valproate and zidovudine. Other situations with disturbed ratio AC/FC include all types of diabetes, heart failure and Alzheimer disease.
Under normal circumstances, about 80 % of serum carnitine is free carnitine and normal AC/FC ratio is 0.25; AC/FC > 0.4 are considered as abnormal (carnitine insufficiency). 1.2. Carnitine biosynthesis in humans
Carnitine is an essential compound thought to be synthesized in humans to some extent, however, humans do need (or under certain circumstances may need) external source of carnitine. Rat tissues were used as models of mammalian carnitine biosynthesis (Figure 2.).

5
Figure 2. L-Carnitine biosynthetic pathway with corresponding structural formulas (Vaz et al., 2002)
Carnitine is synthesized ultimately from the amino acids lysine and methionine. Lysine provides the carbon backbone of carnitine and the 4-N-methyl groups originate from methionine. In mammals certain proteins contain N6-trimethyllysine (TML) residues. N-methylation of these lysine residues occurs as a posttranslational event in proteins such as calmodulin, myosin, actin, cytochrome c and histones. Lysosomal hydrolysis results in the release of the TML, which is the first metabolite of carnitine biosynthesis. TML is first hydroxylated on the 3-position by TML dioxygenase to yield 3-hydroxy-TML (HTML). Aldolytic cleavage of HTML yields 4-trimethylaminobutyraldehyde (TMABA) and glycine, reaction catalyzed by HTML-aldolase. Dehydrogenation of TMABA by TMABA-dehydrogenase results in the formation of 4-N-trimethylaminobutyrate (butyrobetaine). In the last step, butyrobetaine is hydroxylated on the 3-position by γ-butyrobetaine dioxygenase. In humans the rate of carnitine biosynthesis is determined by the availability of trimethyllysine at the intramitochondrial site of trimethyllysine hydroxylase activity. The regulatory effect of trimethyllysine was demonstrated by Rebouche et al., when excess trimethyllysine was given to humans and an 8-fold increase in carnitine biosynthesis occurred. Humans synthesize approx. 1-2µmol of carnitine /kg/day.
1.3. Carnitine deficiency
Carnitine deficiency represents a heterogeneous group of diseases with widely varying clinical symptoms. Given that carnitine not only is required for fatty acid oxidation but also plays a crucial role in cellular homeostasis of free and acyl-CoA, the wide variety of clinical manifestation of carnitine deficiency is not unexpected. This is further complicated by the fact that the carnitine requirement depends on several other factors, such as age, diet, metabolic conditions (stress, fed versus fasting, and rest versus exercise) and tissue dependence on fatty acid oxidation. Carnitine deficiency is defined as decreased tissue carnitine concentration that is below the requirement for normal cellular metabolism. Clinical and biochemical data suggest that tissue carnitine levels may have to fall to less than 10% to 20% of normal before the biologic effects can be clinically significant. Carnitine deficiency can be primary and secondary. In primary systemic carnitine deficiency the cellular uptake of carnitine is mainly disturbed,
6
while in secondary carnitine deficiency the carnitine depletion is the secondary cause of other conditions or disease. 2. AIMS OF THE STUDY 1. In order to achieve a better understanding of carnitine biosynthesis in humans, appearance of supposed intermediates was studied in urine samples of healthy full-term newborns after administration of deuterium labeled TML. 2. Molecular genetic study of SLC22A5 gene in primary carnitine deficient patients, their family members and siblings died in SIDS. 3. Study of efficacy of carnitine therapy in Leigh syndrome patients. 4. Mass spectrometric study of plasma carnitine ester profiles influenced by malabsorption in celiac patients held on gluten free diet on. 5. Molecular genetic study of possible role of CARD15 gene variants and polymorphisms of carnitine transporter genes in the pathogenesis of Crohn’s disease in child and adult Crohn’s disease patients. 6. Study of the effect of SLC22A4 C1672T and SLC22A5 G-207C polymorphisms on carnitine ester profiles in adult Crohn’s patients. 7. Mass spectrometric study of carnitine metabolism in ulcerative colitis patients. 3. PATIENTS AND METHODS 3.1. Patients 3.1.1. Study of carnitine biosynthesis
Seven orally fed male infants were studied. The mean (SD) gestational age was 38.5 (0.87) weeks (range, 38-41 weeks). Postnatal age at the beginning of the study was 8 (range, 5-11) days, and body weight was 3360 (100) g (range, 3100-4300 g). The infants were fed 70 g of formula (Aptamil) seven times daily. The study period lasted 5 consecutive days, with 24-h urines collected on the day before administration of N6[Me-2H9]TML (day 0) and on the last day (day 5) of the study. After the preloading control day, the newborns received 0.5 mmol of N6[Me-2H9]TML daily in their formula during the 5-day study period.
The 24-h urines used for determination of the carnitine biosynthesis intermediates in controls were obtained from 40 healthy individuals (23 males and 17 females) with a mean age of 21 years (SD, 17; range, 2-66 years).
3.1.2. Patients with primary carnitine deficiency
During the study of primary systemic carnitine deficiency the members of two unrelated Hungarian Roma (Gypsy) families were investigated.
3.1.3. A patient with Leigh disease
In a patient with Leigh disease, presenting with severe cerebellar ataxia, mild mental retardation and muscular myopathy, molecular genetic studies revealed a maternally inherited heteroplasmic 8993 T>C mutation (95 % and 88 % mutant form in skeletal muscle and blood cells, respectively) of the mitochondrial DNA. In addition, a homoplasmic 8860 A>G transition (threonine → alanine change) was also detected in the sequence of the ATPase 6 gene of the patient and his mother.
7
3.1.4. Adult celiac disease We examined 33 patients with classic form of celiac disease and 35 carefully selected clinically
healthy control subjects. The diagnostic criteria of established celiac disease in our patients included: verification of the specific
histological features in small intestinal biopsy specimens, according to the modified Marsh classification, positive serological results (antiendomysial antibody and tissue transglutaminase), unequivocally favorable clinical response to the administration of gluten free diet. Patients with any of the rare manifestations of the disease were excluded. All of the celiac disease patients were at least 17 years old upon diagnosis, and adhered to gluten free diet for at least one year. All patients received long-term oral iron replacement therapy.
3.1.5. Crohn’s disease Pediatric patients with Crohn’s disease
We examined 19 pediatric and 55 adult patients with CD. This cohort was compared with 49 healthy controls. Both the pediatric and adult CD patients exhibited different clinical manifestations, therefore they represented mixed clinical CD populations. The diagnosis was confirmed by clinical, radiological, endoscopic and histological findings.
Adult patients with Crohn’s disease
For the genetic study we investigated the DNA of 100 patients with CD and 94 carefully selected healthy controls. The circulating plasma carnitine ester profile was determined in 85 patients and 48 healthy controls.
3.1.6. Patients with ulcerative colitis
We examined 44 patients with UC, and 44 carefully selected clinically healthy control subjects. The control subjects did not receive any drug medication, while the UC patients were treated with either sulfasalazine or 5-aminosalicylic acid. Diagnosis of the disease relied upon the history of the patients, clinical symptoms, negative stool examination for bacteria and parasites, and histologic results of rectal and/ or colonic biopsy.
Informed consent was obtained from each participant of the study and the study design was approved by the Departmental Ethics Committee. 3.2. Analytical methods 3.2.1. Analysis of carnitine biosynthesis metabolites in urine by HPLC-ESI tandem mass spectrometry
The analysis of carnitine biosynthesis metabolites in newborns and healthy controls were carried out from 24-h urine samples. After derivatization with methyl chloroformate the analytes were separated on Phenomenex Aqua analytical column using linear gradient elution techniques (mobile phase consist of: 11 m/l heptafluorobutyric acid and 900 ml/l methanol). A Quattro II tandem mass spectrometer (Micromass) was used in the positive electrospray ionization mode. Nitrogen was used as both the nebulizing ant the drying gas. The collision gas was argon , and the cell pressure was 0.25 Pa. The source temperature was set at 80 °C, and the capillary voltage was maintained at 3.5 kV. The detector was used in tandem MS mode with multiple-reaction monitoring to detect the transition of a specific precursor ion to a fragment for each analyte.
8
3.2.2. Determination of plasma and serum carnitine ester profile with ESI tandem mass spectrometry
Acylcarnitines were analyzed as butyl esters using a Micromass Quattro Ultima ESI triple-quadrupole mass spectrometer, combined with a Waters 2795 HPLC system for sample introduction. After derivatization with 3M butanolic HCl, samples were redissolved in the mobile phase (acetonitrile:water 80:20). With the help of the autosampler 10 µl of sample aliquots were injected into the mass spectrometer. During the ESI-MS/MS analysis the free carnitine and acylcarnitines were measured by positive precursor ion scan of m/z 85, with a scan range of m/z: 200-550. The applied capillary voltage, cone voltage and collision energy were 2.52kV, 55V and 26eV, respectively. The flow rate was 100 µl/min and the total analysis time was 4 minutes per sample. For each sample the measurements were performed in triplicates beginning with the injection step and the means of the three determinations were used for further calculations. 3.3. Molecular genetic methods Analysis of mitochondrial ATPase 6 gene mutations, SLC22A5, CARD15 gene mutations and SLC22A4 and SLC22A5 gene polymorphism with automated sequencer.
For the analysis of mitochondrial ATPase6 gene and detection of CARD 15 gene and SLC22A4 and SLC22A5 polymorphism, a gene specific primer pair were designed. For the amplification of the 10 exons of SLC22A5 genes a intron-based specific primer pairs were used. The PCR products were sequenced in both directions in an ABI Prism 3100 Genetic Analyzer with a dye termination method. We also developed a RFLP method for quick genotyping of the samples for the SLC22A5 mutation. After digestion of the PCR product with Bsl I enzyme the restriction fragments were separated in agarose gel.
3.4. Statistics
For statistics the Student’s t-test for unpaired samples was used. The values are expressed as means and their standard errors, in three decimals for the carnitine esters with respect to the low levels in the case of the long-chain carnitine esters. Chi-square test was applied for the determination of the distribution of different genotypes. 4. RESULTS 4.1. Study of carnitine biosynthesis intermediates
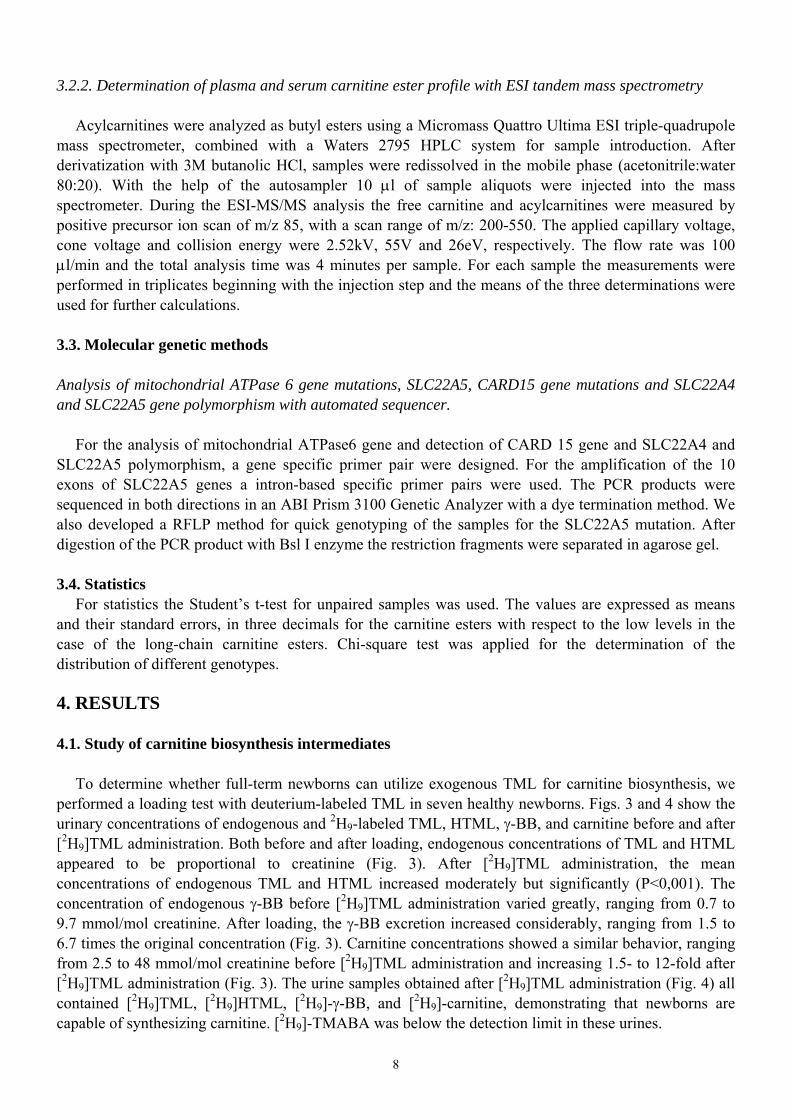
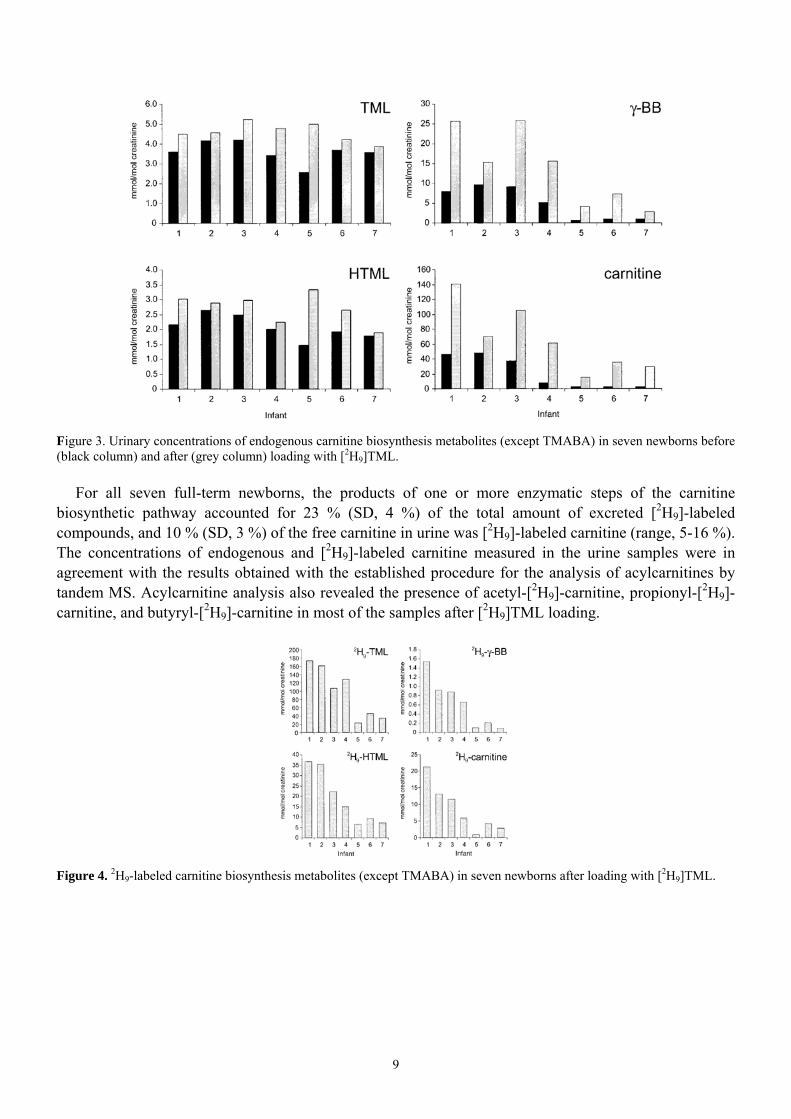
To determine whether full-term newborns can utilize exogenous TML for carnitine biosynthesis, we performed a loading test with deuterium-labeled TML in seven healthy newborns. Figs. 3 and 4 show the urinary concentrations of endogenous and 2H9-labeled TML, HTML, γ-BB, and carnitine before and after [2H9]TML administration. Both before and after loading, endogenous concentrations of TML and HTML appeared to be proportional to creatinine (Fig. 3). After [2H9]TML administration, the mean concentrations of endogenous TML and HTML increased moderately but significantly (P<0,001). The concentration of endogenous γ-BB before [2H9]TML administration varied greatly, ranging from 0.7 to 9.7 mmol/mol creatinine. After loading, the γ-BB excretion increased considerably, ranging from 1.5 to 6.7 times the original concentration (Fig. 3). Carnitine concentrations showed a similar behavior, ranging from 2.5 to 48 mmol/mol creatinine before [2H9]TML administration and increasing 1.5- to 12-fold after [2H9]TML administration (Fig. 3). The urine samples obtained after [2H9]TML administration (Fig. 4) all contained [2H9]TML, [2H9]HTML, [2H9]-γ-BB, and [2H9]-carnitine, demonstrating that newborns are capable of synthesizing carnitine. [2H9]-TMABA was below the detection limit in these urines.
9
Figure 3. Urinary concentrations of endogenous carnitine biosynthesis metabolites (except TMABA) in seven newborns before (black column) and after (grey column) loading with [2H9]TML.
For all seven full-term newborns, the products of one or more enzymatic steps of the carnitine biosynthetic pathway accounted for 23 % (SD, 4 %) of the total amount of excreted [2H9]-labeled compounds, and 10 % (SD, 3 %) of the free carnitine in urine was [2H9]-labeled carnitine (range, 5-16 %). The concentrations of endogenous and [2H9]-labeled carnitine measured in the urine samples were in agreement with the results obtained with the established procedure for the analysis of acylcarnitines by tandem MS. Acylcarnitine analysis also revealed the presence of acetyl-[2H9]-carnitine, propionyl-[2H9]-carnitine, and butyryl-[2H9]-carnitine in most of the samples after [2H9]TML loading.
Figure 4. 2H9-labeled carnitine biosynthesis metabolites (except TMABA) in seven newborns after loading with [2H9]TML.
10
4.2. Molecular genetic study of patients with primary carnitine deficiency
In two non-consanguineous Hungarian Roma (Gypsy) children who presented with cardiomyopathy and decreased plasma carnitine levels, we identified homozygous single base deletion (844delC in the cDNA and 17081delC in the genomic sequence) of the SLC22A5 gene that results in a frameshift at R282D and leads ultimately to a premature stop codon (V295X) in the OCTN2 carnitine transporter. No other sequence change in any exons could be observed as compared to AB016625 used as reference sequence.
Mutation analysis were carried out for DNA samples from 24 members of the first family and paraffin embedded blocks from two of the fatal cases. The two sudden death patients were also homozygous for the mutation, and a total of 12 carriers were verified.
The molecular genetic analysis of the second family revealed a homozygous single base deletion in the case of the index patient and the sudden death patient. Both parents carries the mutation in heterozygous form. 4.3. Molecular genetic study of the mitochondrial DNA and determination of plasma carnitine ester profile of a patient with Leigh disease
In a male child patient the molecular genetic studies revealed a maternally inherited heteroplasmic
8993 T>C mutation (95 % and 88 % mutant form in skeletal muscle and blood cells, respectively) of the mitochondrial DNA. In addition, a homoplasmic 8860 A>G transition (threonine → alanine change) was also detected in the sequence of the ATPase 6 gene of the patient and his mother.
In contrast to the normal pre-supplementation pattern, the plasma carnitine ester profile determined during carnitine treatment showed significantly elevated concentrations of free carnitine (117 µmol/l), butyrylcarnitine (5.29 vs 0.35 ± 0.20 µmol/l) and hexanoylcarnitine (1.68 vs 0.08 ± 0.04 µmol/l), with normal concentrations of all other acylcarnitines.
11
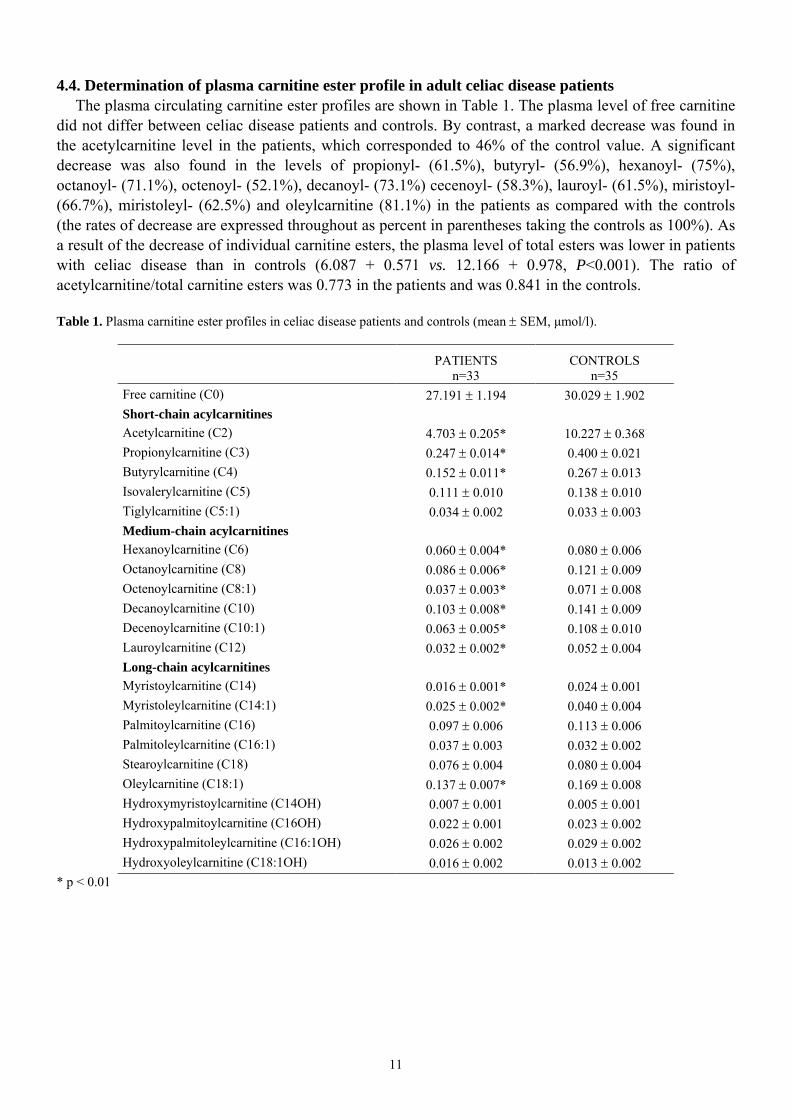
4.4. Determination of plasma carnitine ester profile in adult celiac disease patients The plasma circulating carnitine ester profiles are shown in Table 1. The plasma level of free carnitine
did not differ between celiac disease patients and controls. By contrast, a marked decrease was found in the acetylcarnitine level in the patients, which corresponded to 46% of the control value. A significant decrease was also found in the levels of propionyl- (61.5%), butyryl- (56.9%), hexanoyl- (75%), octanoyl- (71.1%), octenoyl- (52.1%), decanoyl- (73.1%) cecenoyl- (58.3%), lauroyl- (61.5%), miristoyl- (66.7%), miristoleyl- (62.5%) and oleylcarnitine (81.1%) in the patients as compared with the controls (the rates of decrease are expressed throughout as percent in parentheses taking the controls as 100%). As a result of the decrease of individual carnitine esters, the plasma level of total esters was lower in patients with celiac disease than in controls (6.087 + 0.571 vs. 12.166 + 0.978, P<0.001). The ratio of acetylcarnitine/total carnitine esters was 0.773 in the patients and was 0.841 in the controls. Table 1. Plasma carnitine ester profiles in celiac disease patients and controls (mean ± SEM, µmol/l).
PATIENTS n=33
CONTROLS n=35
Free carnitine (C0) 27.191 ± 1.194 30.029 ± 1.902 Short-chain acylcarnitines Acetylcarnitine (C2) 4.703 ± 0.205* 10.227 ± 0.368 Propionylcarnitine (C3) 0.247 ± 0.014* 0.400 ± 0.021 Butyrylcarnitine (C4) 0.152 ± 0.011* 0.267 ± 0.013 Isovalerylcarnitine (C5) 0.111 ± 0.010 0.138 ± 0.010 Tiglylcarnitine (C5:1) 0.034 ± 0.002 0.033 ± 0.003 Medium-chain acylcarnitines Hexanoylcarnitine (C6) 0.060 ± 0.004* 0.080 ± 0.006 Octanoylcarnitine (C8) 0.086 ± 0.006* 0.121 ± 0.009 Octenoylcarnitine (C8:1) 0.037 ± 0.003* 0.071 ± 0.008 Decanoylcarnitine (C10) 0.103 ± 0.008* 0.141 ± 0.009 Decenoylcarnitine (C10:1) 0.063 ± 0.005* 0.108 ± 0.010 Lauroylcarnitine (C12) 0.032 ± 0.002* 0.052 ± 0.004 Long-chain acylcarnitines Myristoylcarnitine (C14) 0.016 ± 0.001* 0.024 ± 0.001 Myristoleylcarnitine (C14:1) 0.025 ± 0.002* 0.040 ± 0.004 Palmitoylcarnitine (C16) 0.097 ± 0.006 0.113 ± 0.006 Palmitoleylcarnitine (C16:1) 0.037 ± 0.003 0.032 ± 0.002 Stearoylcarnitine (C18) 0.076 ± 0.004 0.080 ± 0.004 Oleylcarnitine (C18:1) 0.137 ± 0.007* 0.169 ± 0.008 Hydroxymyristoylcarnitine (C14OH) 0.007 ± 0.001 0.005 ± 0.001 Hydroxypalmitoylcarnitine (C16OH) 0.022 ± 0.001 0.023 ± 0.002 Hydroxypalmitoleylcarnitine (C16:1OH) 0.026 ± 0.002 0.029 ± 0.002 Hydroxyoleylcarnitine (C18:1OH) 0.016 ± 0.002 0.013 ± 0.002
* p < 0.01
12
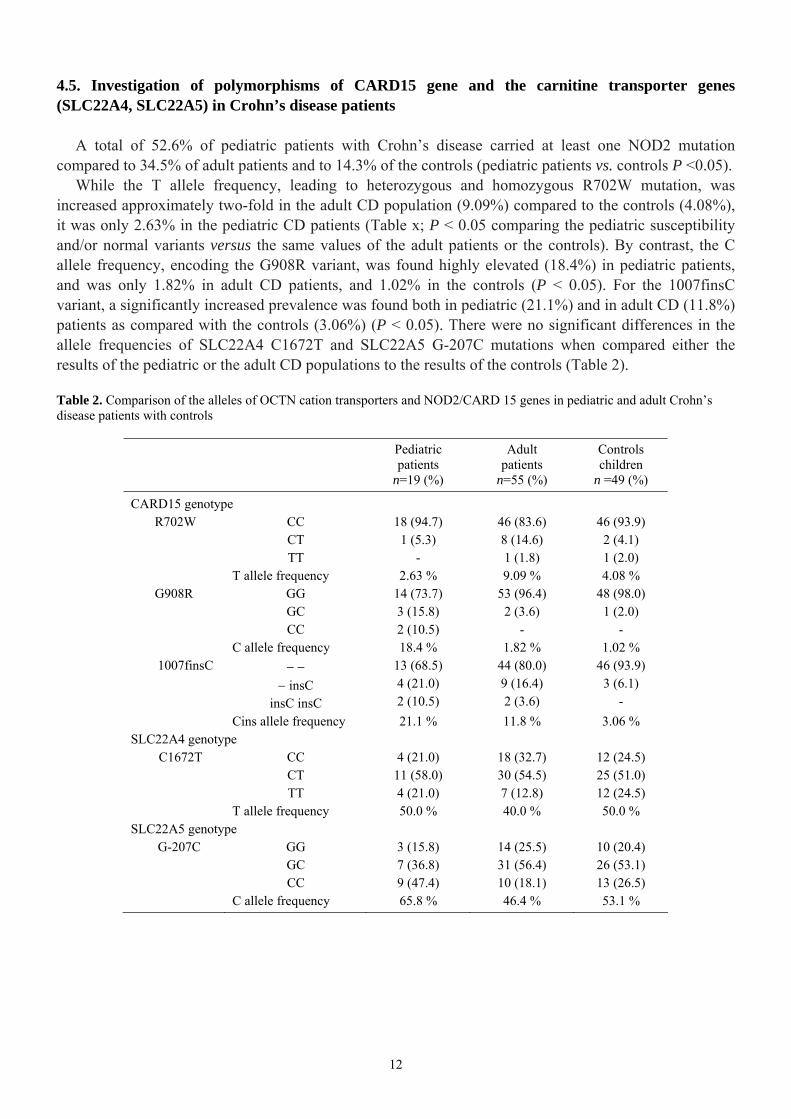
4.5. Investigation of polymorphisms of CARD15 gene and the carnitine transporter genes (SLC22A4, SLC22A5) in Crohn’s disease patients
A total of 52.6% of pediatric patients with Crohn’s disease carried at least one NOD2 mutation compared to 34.5% of adult patients and to 14.3% of the controls (pediatric patients vs. controls P <0.05).
While the T allele frequency, leading to heterozygous and homozygous R702W mutation, was increased approximately two-fold in the adult CD population (9.09%) compared to the controls (4.08%), it was only 2.63% in the pediatric CD patients (Table x; P < 0.05 comparing the pediatric susceptibility and/or normal variants versus the same values of the adult patients or the controls). By contrast, the C allele frequency, encoding the G908R variant, was found highly elevated (18.4%) in pediatric patients, and was only 1.82% in adult CD patients, and 1.02% in the controls (P < 0.05). For the 1007finsC variant, a significantly increased prevalence was found both in pediatric (21.1%) and in adult CD (11.8%) patients as compared with the controls (3.06%) (P < 0.05). There were no significant differences in the allele frequencies of SLC22A4 C1672T and SLC22A5 G-207C mutations when compared either the results of the pediatric or the adult CD populations to the results of the controls (Table 2).
Table 2. Comparison of the alleles of OCTN cation transporters and NOD2/CARD 15 genes in pediatric and adult Crohn’s disease patients with controls
Pediatric patients
n=19 (%)
Adult patients
n=55 (%)
Controls children
n =49 (%)
CARD15 genotype R702W CC
CT TT
18 (94.7) 1 (5.3)
-
46 (83.6) 8 (14.6) 1 (1.8)
46 (93.9) 2 (4.1) 1 (2.0)
T allele frequency 2.63 % 9.09 % 4.08 % G908R GG
GC CC
14 (73.7) 3 (15.8) 2 (10.5)
53 (96.4) 2 (3.6)
-
48 (98.0) 1 (2.0)
- C allele frequency 18.4 % 1.82 % 1.02 % 1007finsC − −
− insC insC insC
13 (68.5) 4 (21.0) 2 (10.5)
44 (80.0) 9 (16.4) 2 (3.6)
46 (93.9) 3 (6.1)
- Cins allele frequency 21.1 % 11.8 % 3.06 % SLC22A4 genotype C1672T CC
CT TT
4 (21.0) 11 (58.0) 4 (21.0)
18 (32.7) 30 (54.5) 7 (12.8)
12 (24.5) 25 (51.0) 12 (24.5)
T allele frequency 50.0 % 40.0 % 50.0 % SLC22A5 genotype G-207C GG
GC CC
3 (15.8) 7 (36.8) 9 (47.4)
14 (25.5) 31 (56.4) 10 (18.1)
10 (20.4) 26 (53.1) 13 (26.5)
C allele frequency 65.8 % 46.4 % 53.1 %
13
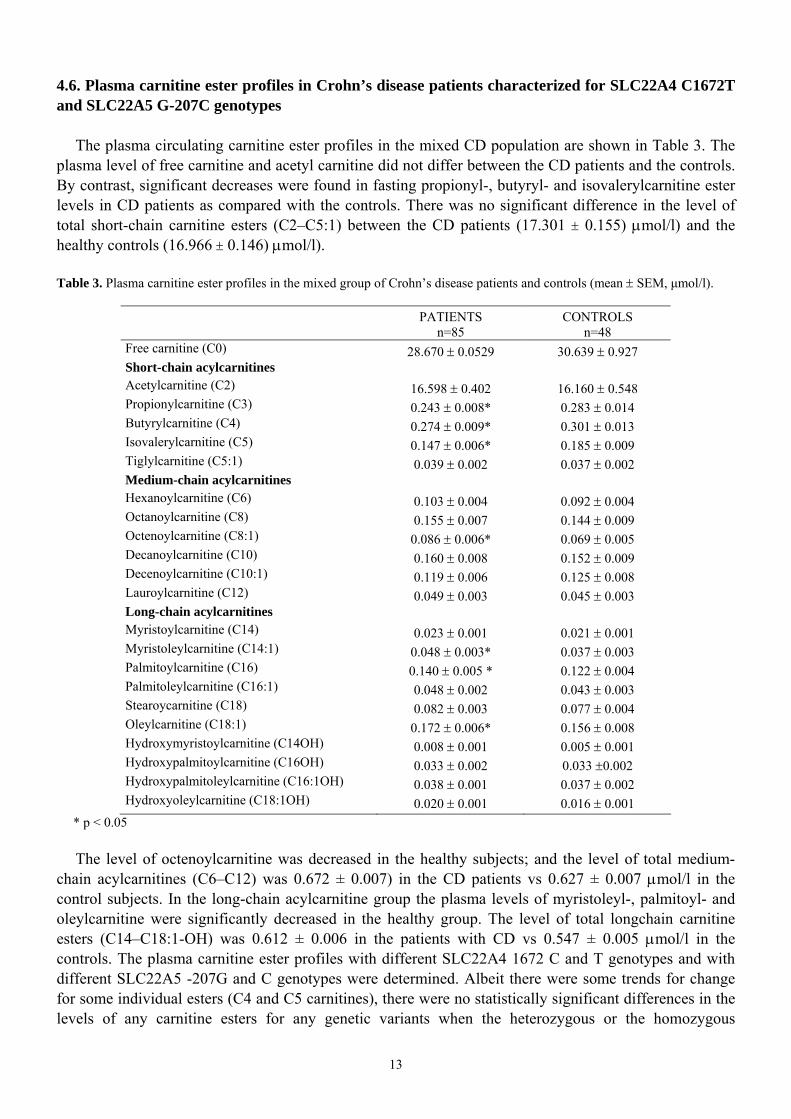
4.6. Plasma carnitine ester profiles in Crohn’s disease patients characterized for SLC22A4 C1672T and SLC22A5 G-207C genotypes
The plasma circulating carnitine ester profiles in the mixed CD population are shown in Table 3. The plasma level of free carnitine and acetyl carnitine did not differ between the CD patients and the controls. By contrast, significant decreases were found in fasting propionyl-, butyryl- and isovalerylcarnitine ester levels in CD patients as compared with the controls. There was no significant difference in the level of total short-chain carnitine esters (C2–C5:1) between the CD patients (17.301 ± 0.155) µmol/l) and the healthy controls (16.966 ± 0.146) µmol/l). Table 3. Plasma carnitine ester profiles in the mixed group of Crohn’s disease patients and controls (mean ± SEM, µmol/l).
PATIENTS n=85
CONTROLS n=48
Free carnitine (C0) 28.670 ± 0.0529 30.639 ± 0.927 Short-chain acylcarnitines Acetylcarnitine (C2) 16.598 ± 0.402 16.160 ± 0.548 Propionylcarnitine (C3) 0.243 ± 0.008* 0.283 ± 0.014 Butyrylcarnitine (C4) 0.274 ± 0.009* 0.301 ± 0.013 Isovalerylcarnitine (C5) 0.147 ± 0.006* 0.185 ± 0.009 Tiglylcarnitine (C5:1) 0.039 ± 0.002 0.037 ± 0.002 Medium-chain acylcarnitines Hexanoylcarnitine (C6) 0.103 ± 0.004 0.092 ± 0.004 Octanoylcarnitine (C8) 0.155 ± 0.007 0.144 ± 0.009 Octenoylcarnitine (C8:1) 0.086 ± 0.006* 0.069 ± 0.005 Decanoylcarnitine (C10) 0.160 ± 0.008 0.152 ± 0.009 Decenoylcarnitine (C10:1) 0.119 ± 0.006 0.125 ± 0.008 Lauroylcarnitine (C12) 0.049 ± 0.003 0.045 ± 0.003 Long-chain acylcarnitines Myristoylcarnitine (C14) 0.023 ± 0.001 0.021 ± 0.001 Myristoleylcarnitine (C14:1) 0.048 ± 0.003* 0.037 ± 0.003 Palmitoylcarnitine (C16) 0.140 ± 0.005 * 0.122 ± 0.004 Palmitoleylcarnitine (C16:1) 0.048 ± 0.002 0.043 ± 0.003 Stearoycarnitine (C18) 0.082 ± 0.003 0.077 ± 0.004 Oleylcarnitine (C18:1) 0.172 ± 0.006* 0.156 ± 0.008 Hydroxymyristoylcarnitine (C14OH) 0.008 ± 0.001 0.005 ± 0.001 Hydroxypalmitoylcarnitine (C16OH) 0.033 ± 0.002 0.033 ±0.002 Hydroxypalmitoleylcarnitine (C16:1OH) 0.038 ± 0.001 0.037 ± 0.002 Hydroxyoleylcarnitine (C18:1OH) 0.020 ± 0.001 0.016 ± 0.001
* p < 0.05
The level of octenoylcarnitine was decreased in the healthy subjects; and the level of total medium-chain acylcarnitines (C6–C12) was 0.672 ± 0.007) in the CD patients vs 0.627 ± 0.007 µmol/l in the control subjects. In the long-chain acylcarnitine group the plasma levels of myristoleyl-, palmitoyl- and oleylcarnitine were significantly decreased in the healthy group. The level of total longchain carnitine esters (C14–C18:1-OH) was 0.612 ± 0.006 in the patients with CD vs 0.547 ± 0.005 µmol/l in the controls. The plasma carnitine ester profiles with different SLC22A4 1672 C and T genotypes and with different SLC22A5 -207G and C genotypes were determined. Albeit there were some trends for change for some individual esters (C4 and C5 carnitines), there were no statistically significant differences in the levels of any carnitine esters for any genetic variants when the heterozygous or the homozygous
14
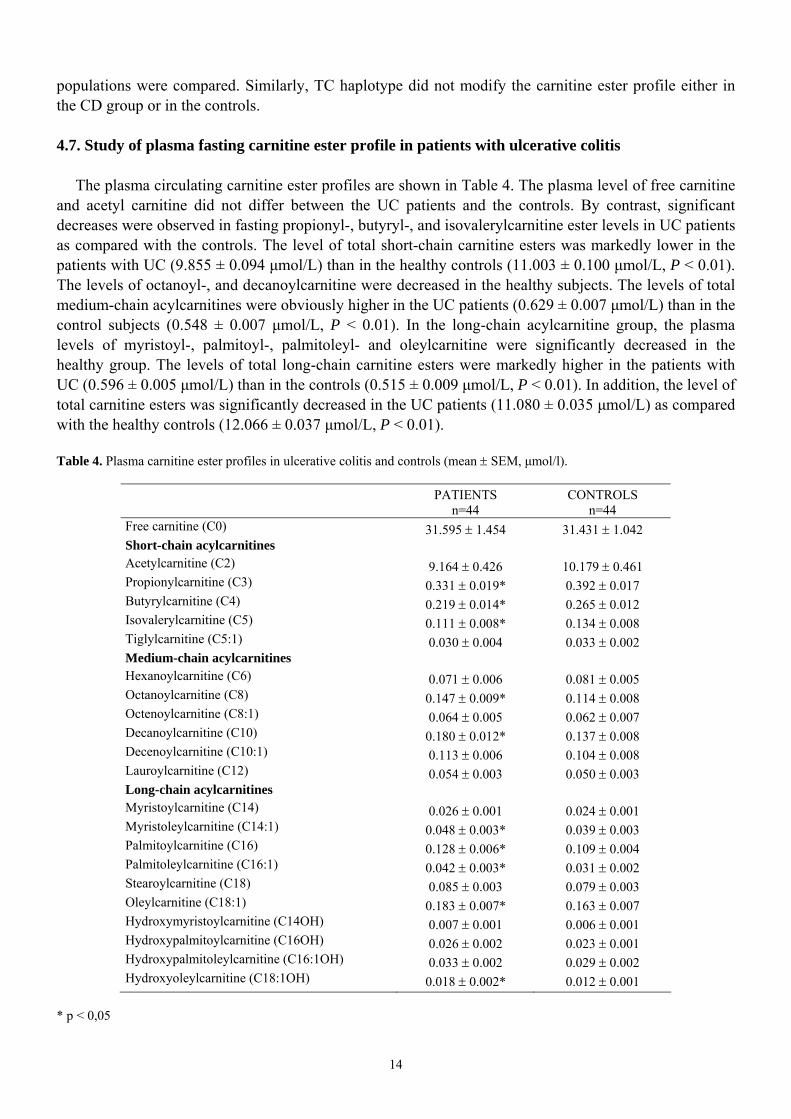
populations were compared. Similarly, TC haplotype did not modify the carnitine ester profile either in the CD group or in the controls. 4.7. Study of plasma fasting carnitine ester profile in patients with ulcerative colitis
The plasma circulating carnitine ester profiles are shown in Table 4. The plasma level of free carnitine
and acetyl carnitine did not differ between the UC patients and the controls. By contrast, significant decreases were observed in fasting propionyl-, butyryl-, and isovalerylcarnitine ester levels in UC patients as compared with the controls. The level of total short-chain carnitine esters was markedly lower in the patients with UC (9.855 ± 0.094 µmol/L) than in the healthy controls (11.003 ± 0.100 µmol/L, P < 0.01). The levels of octanoyl-, and decanoylcarnitine were decreased in the healthy subjects. The levels of total medium-chain acylcarnitines were obviously higher in the UC patients (0.629 ± 0.007 µmol/L) than in the control subjects (0.548 ± 0.007 µmol/L, P < 0.01). In the long-chain acylcarnitine group, the plasma levels of myristoyl-, palmitoyl-, palmitoleyl- and oleylcarnitine were significantly decreased in the healthy group. The levels of total long-chain carnitine esters were markedly higher in the patients with UC (0.596 ± 0.005 µmol/L) than in the controls (0.515 ± 0.009 µmol/L, P < 0.01). In addition, the level of total carnitine esters was significantly decreased in the UC patients (11.080 ± 0.035 µmol/L) as compared with the healthy controls (12.066 ± 0.037 µmol/L, P < 0.01). Table 4. Plasma carnitine ester profiles in ulcerative colitis and controls (mean ± SEM, µmol/l).
PATIENTS n=44
CONTROLS n=44
Free carnitine (C0) 31.595 ± 1.454 31.431 ± 1.042 Short-chain acylcarnitines Acetylcarnitine (C2) 9.164 ± 0.426 10.179 ± 0.461 Propionylcarnitine (C3) 0.331 ± 0.019* 0.392 ± 0.017 Butyrylcarnitine (C4) 0.219 ± 0.014* 0.265 ± 0.012 Isovalerylcarnitine (C5) 0.111 ± 0.008* 0.134 ± 0.008 Tiglylcarnitine (C5:1) 0.030 ± 0.004 0.033 ± 0.002 Medium-chain acylcarnitines Hexanoylcarnitine (C6) 0.071 ± 0.006 0.081 ± 0.005 Octanoylcarnitine (C8) 0.147 ± 0.009* 0.114 ± 0.008 Octenoylcarnitine (C8:1) 0.064 ± 0.005 0.062 ± 0.007 Decanoylcarnitine (C10) 0.180 ± 0.012* 0.137 ± 0.008 Decenoylcarnitine (C10:1) 0.113 ± 0.006 0.104 ± 0.008 Lauroylcarnitine (C12) 0.054 ± 0.003 0.050 ± 0.003 Long-chain acylcarnitines Myristoylcarnitine (C14) 0.026 ± 0.001 0.024 ± 0.001 Myristoleylcarnitine (C14:1) 0.048 ± 0.003* 0.039 ± 0.003 Palmitoylcarnitine (C16) 0.128 ± 0.006* 0.109 ± 0.004 Palmitoleylcarnitine (C16:1) 0.042 ± 0.003* 0.031 ± 0.002 Stearoylcarnitine (C18) 0.085 ± 0.003 0.079 ± 0.003 Oleylcarnitine (C18:1) 0.183 ± 0.007* 0.163 ± 0.007 Hydroxymyristoylcarnitine (C14OH) 0.007 ± 0.001 0.006 ± 0.001 Hydroxypalmitoylcarnitine (C16OH) 0.026 ± 0.002 0.023 ± 0.001 Hydroxypalmitoleylcarnitine (C16:1OH) 0.033 ± 0.002 0.029 ± 0.002 Hydroxyoleylcarnitine (C18:1OH) 0.018 ± 0.002* 0.012 ± 0.001
* p < 0,05
15
5. SUMMARY OF THE RESULTS AND CONCLUSIONS
1. After [2H9]-TML administration, all the metabolites of carnitine biosynthesis could be detected in the urine of full-term newborns in the [2H9]-labeled form, except for [2H9]TMABA. Most of the [2H9]-TML, however, was excreted unchanged in the urine. Our observations opposite to the results obtained from the animal model suggest that free TML yield carnitine in an extremely poor way. 2. In two patients with primary carnitine deficiency, we detected a homozygous single base deletion (844delC in the cDNA and 17081 delC in the genomic sequence) of the SLC22A5 gene that result a frameshift at R282D and leads ultimately to a premature stop codon in the OCTN2 carnitine transporter. We identified this mutation for the first time in the literature in sudden infant death cases. 3. In a patient with Leigh disease, molecular genetic studies revealed a maternally inherited heteroplasmic 8993 T>C mutation of the mitochondrial DNA. After introduction of carnitine therapy an impressive clinical response was observed. 4. Measuring the carnitine ester profile of celiac patients on long-term gluten free diet a significant decrease was observed in the level of the following esters: C2-, C3-, C4-, C6-, C8-, C8:1-, C10-, C10:1-, C12-, C14-, C14:1- és C18:1-carnitine ester. The changes observed could be the result of impaired carnitine homeostasis, consequence of influenced metabolism of the acyl groups derived mainly from the fatty acid metabolism, and combination of thereof. 5. The molecular genetic analysis of the CARD15, SLC22A4 and SLC22A5 gene polymorphisms showed the accumulation of the CARD15 variants in the Crohn’s disease patients. We could not detect the accumulation of either the SLC22A4, SLC22A5 susceptibility variants or the TC haplotype. Our results do not support the assumption that the carriage of the SLC and SLC TC haplotypes means significant susceptibility to Hungarian patients with CD. 6. Analyzing the effect of SLC22A4 C1672T and SLC22A5 G-207C SNPs for the carnitine status of patients with Crohn’s disease, no association was observed between the different genotype variations and the altered carnitine ester profile. 7. We investigated the carnitine status of patients with ulcerative colitis by tandem mass spectrometry first in the literature. Significant decreases were observed in fasting plasma levels of C3-, C4- and C5 carnitine esters, which refers to an altered fatty acid metabolism.
16
6. LIST OF PUBLICATIONS The thesis is based on the following publications 1. Toth G, Morava E, Bene J, Selhorst JJ, Overmars H, Vreken P, Molnar J, Farkas V, Melegh B.
Carnitine-responsive carnitine insufficiency in a case of mtDNA 8993T>C mutation associated Leigh syndrome. J Inherit Metab Dis 2001; 24:421-422. IF:1,790
2. Vaz FM, Melegh B, Bene J, Cuebas D, Gage DA, Bootsma A, Vreken P, van Gennip AH, Bieber LL,
Wanders RJ. Analysis of carnitine biosynthesis metabolites in urine by HPLC-electrospray tandem mass spectrometry. Clin Chem 2002a; 48:826-834. IF:4,788
3. Melegh B, Bene J, Mogyorosy G, Havasi V, Komlosi K, Pajor L, Olah E, Kispal G, Sumegi B, Mehes
K. Phenotypic manifestations of the OCTN2 V295X mutation: Sudden infant death and carnitine-responsive cardiomyopathy in Roma families. Am J Med Genet A 2004; 131:121-126. IF:3,659
4. Bene J, Komlosi K, Gasztonyi B, Juhasz M, Tulassay Z, Melegh B. Plasma carnitine ester profile in
adult celiac disease patients maintained on long-term gluten free diet. World J Gastroenterol 2005; 11:6671-6675.
5. Bene J, Komlosi K, Havasi V, Talian G, Gasztonyi B, Horvath K, Mozsik G, Hunyady B, Melegh B,
Figler M. Changes of plasma fasting carnitine ester profile in patients with ulcerative colitis. World J Gastroenterol 2006; 12:110-113.
6. Bene J, Magyari L, Talián G, Komlósi K, Gasztonyi B, Tari B, Várkonyi A, Mózsik G, Melegh B.
Prevalence of SLC22A4, SLC22A5 and CARD15 gene mutations in Hungarian pediatric patients with Crohn's disease. World J Gastroenterol 2006; 12:5550-5553.
7. Bene J, Komlosi K, Magyari L, Talian G, Horvath K, Gasztonyi B, Miheller P, Figler M, Mozsik G,
Tulassay Z, Melegh B. Plasma carnitine ester profiles in Crohn's disease patients characterized for SLC22A4 C1672T and SLC22A5 G-207C genotypes. Br J Nutr 2007; 98:345-350. IF: 2,708 (2006)
Other publications
1. Bene J, Nadasi E, Kosztolanyi G, Mehes K, Melegh B. Congenital cataract as the first symptom of a
neuromuscular disease caused by a novel single large-scale mitochondrial DNA deletion. Eur J Hum Genet 2003; 1:375-379. IF:3,669
2. Szolnoki Z, Somogyvari F, Kondacs A, Szabo M, Bene J, Havasi V, Komlosi K, Melegh B. Increased
prevalence of platelet glycoprotein IIb/IIIa PLA2 allele in ischaemic stroke associated with large vessel pathology. Thromb Res 2003; 109:265-269. IF:1,71
3. Szolnoki Z, Somogyvari F, Kondacs A, Szabo M, Fodor L, Bene J, Melegh B. Evaluation of the
modifying effects of unfavourable genotypes on classical clinical risk factors for ischaemic stroke. J Neurol Neurosurg Psychiatry 2003; 74:1615-1620. IF:3,035
4. Banyai K, Jakab F, Reuter G, Bene J, Uj M, Melegh B, Szucs G. Sequence heterogeneity among
human picobirnaviruses detected in a gastroenteritis outbreak. Arch Virol 2003; 148:2281-2291. IF:1,876
17
5. Komlosi K, Havasi V, Bene J, Ghosh M, Szolnoki Z, Melegh G, Nagy A, Stankovics J, Csaszar A, Papp E, Gasztonyi B, Toth K, Mozsik G, Romics L, ten Cate H, Smits P, Mehes K, Kosztolanyi G, Melegh B. Search for factor V Arg306 Cambridge and Hong Kong mutations in mixed Hungarian population samples. Acta Haematol 2003; 110:220-222. IF:1,874
6. Benedek O, Bene J, Melegh B, Emody L. Mapping of possible laminin binding sites of Y. pestis
plasminogen activator (Pla) via phage display. Adv Exp Med Biol 2003; 529:101-104. 7. Szolnoki Z, Somogyvari F, Kondacs A, Szabo M, Fodor L, Bene J, Melegh B. Specific APO E
genotypes in combination with the ACE D/D or MTHFR 677TT mutation yield an independent genetic risk of leukoaraiosis. Acta Neurol Scand 2004; 109:222-227. IF:1,712
8. Dr. Kárteszi Judit, Dr. Hollódy Katalin, Bene Judit, Dr. Morava Éva, Dr. Hadzsiev Kinga, Czakó
Márta, Dr. Melegh Béla, Dr. Kosztolányi György. Az MECP2 gén mutációinak analízise direkt szekvenálással magyarországi Rett-szindrómás betegekben. Orv Hetil 2004; 145:909-911.
9. Dr. Molnár Gergő Attila, Dr. Wagner Zoltán, Dr. Wagner László, Dr. Melegh Béla, Dr. Kőszegi
Tamás, Dr. Degrell Péter, Bene Judit, Dr. Tamaskó Mónika, Laczy Boglárka, Dr. Nagy Judit, Dr. Wittmann István. Az ACE gén polimorfizmusának befolyása a szénhidrát-anyagcserére, az oxidatív stresszre és a célszervkárosodásra 2-es típusú diabetesben. Orv Hetil 2004; 145:855-859.
10. Dr. Gombos Eszter, Dr. Rosdy Beáta, Dr. Scheuring Noémi, Dr. Lásztity Natália, Dr. Komlósi
Katalin, Bene Judit, Dr. Szabó Teréz, Pollreisz Ferenc, Dr. Vékey Károly, Dr. Melegh Béla, Dr. Czinner Antal. A metilmalonsav-acidaemiáról egy esetünk kapcsán. Gyermekgyógyászat 2004. 55. évf. 3. szám
11. Dr. Komlósi Katalin, Bene Judit, Dr. Havasi Viktória, Dr. Tihanyi Marianna, Dr. Herczegfalvi
Ágnes, Dr. Móser Judit, Dr. Melegh Béla. A mitokondriális DNS A3243G mutációja egy magyar családban. Orv Hetil 2004; 145:1805-1809.
12. Banyai K, Gentsch JR, Schipp R, Jakab F, Bene J, Melegh B, Glass RI, Szucs G. Molecular
epidemiology of human P[8],G9 rotaviruses in Hungary between 1998 and 2001. J Med Microbiol 2004; 53:791-801. IF:2,484
13. Karteszi J, Hollody K, Bene J, Morava E, Hadzsiev K, Czako M, Melegh B, Teszas A, Kosztolanyi
G. Mutation analysis of MECP2 and determination of the X-inactivation pattern in Hungarian Rett syndrome patients. Am J Med Genet A 2004; 131:106. IF:3,659
14. Komlosi K, Havasi V, Bene J, Storcz J, Stankovics J, Mohay G, Weisenbach J, Kosztolanyi G,
Melegh B. Increased Prevalence of Factor V Leiden Mutation in Premature but Not in Full-Term Infants with Grade I Intracranial Haemorrhage. Biol Neonate 2005; 87:56-59. IF:1,360
15. Szolnoki Z, Havasi V, Bene J, Komlosi K, Szoke D, Somogyvari F, Kondacs A, Szabo M, Fodor L,
Bodor A, Gati I, Wittman I, Melegh B. Endothelial nitric oxide synthase gene interactions and the risk of ischaemic stroke. Acta Neurol Scand 2005; 111:29-33. IF:1,982
16. Bellyei S, Szigeti A, Boronkai A, Szabo Z, Bene J, Janaky T, Barna L, Sipos K, Minik O, Kravjak A,
Ohmacht R, Melegh B, Zavodszky P, Than GN, Sumegi B, Bohn H, Than NG. Cloning, sequencing, structural and molecular biological characterization of placental protein 20 (PP20)/human thiamin pyrophosphokinase (hTPK). Placenta 2005; 26:34-46. IF:2,883
18
17. Papp E, Havasi V, Bene J, Komlosi K, Czopf L, Magyar E, Feher C, Feher G, Horvath B, Marton Z, Alexy T, Habon T, Szabo L, Toth K, Melegh B. Glycoprotein IIIA gene (PlA) polymorphism and aspirin resistance: is there any correlation? Ann Pharmacother 2005; 39:1013-1018. IF:1,837
18. Banyai K, Palya V, Benko M, Bene J, Havasi V, Melegh B, Szucs G. The Goose Reovirus Genome
Segment Encoding the Minor Outer Capsid Protein, sigma1/sigmaC, is Bicistronic and Shares Structural Similarities with its Counterpart in Muscovy Duck Reovirus. Virus Genes 2005; 31:285-291. IF:1,417
19. Papp E, Bene J, Havasi V, Komlosi K,Czopf L, Magyar É, Horváth B, Márton Zs, Alexy T, Fehér Cs,
Habon T, Szabó L, Tóth K, Melegh B. Van-e összefüggés a PlA polimorfizmus és acetilszalicilsav rezisztencia között? Card Hung 2005; 35:7-10
20. Nadasi E, Bene J, Havasi V, Komlosi K, Talian G, Melegh G, Papp E, Gasztonyi B, Szolnoki Z,
Sandor J, Mozsik G, Toth K, Melegh B, Wittmann I. Detection of the Leu40Arg variant of the platelet glycoprotein IIb/IIIa receptor in subjects with thrombotic diseases. Thromb Res 2005; 116:479-482. IF:2,012
21. Szolnoki Z, Havasi V, Talian G, Bene J, Komlosi K, Somogyvari F, Kondacs A, Szabo M, Fodor L,
Bodor A, Melegh B. Lymphotoxin-alpha gene 252G allelic variant is a risk factor for large-vessel-associated ischemic stroke. J Mol Neurosci 2005; 27:205-211. IF:2,555
22. Szolnoki Z, Havasi V, Talián G, Bene J, Komlósi K, Somogyvári F, Kondacs A, Szabó M, Fodor L,
Bodor A, Melegh B. Angiotensin II type-1 receptor A1166C polymorphism is associated with increased risk of ischemic stroke in hypertensive smokers. J Mol Neurosci 2006; 28:285-290. IF:2,965
23. Havasi V, Komlósi K, Bene J, Melegh B. Increased prevalence of glycoprotein IIb/IIIa Leu33Pro
polymorphism in term infants with grade I intracranial haemorrhage. Neuropediatrics 2006; 37:67-71. IF:1,366
24. Havasi V, Szolnoki Z, Talián G, Bene J, Komlósi K, Maász A, Somogyvári F, Kondacs A, Szabó M,
Fodor L, Bodor A, Melegh B. Apolipoprotein A5 gene promoter region T-1131C polymorphism associates with elevated circulating triglyceride levels and confers susceptibility for development of ischemic stroke. J Mol Neurosci 2006; 29:177-183. IF:2,965
25. Komlósi K, Havasi V, Bene J, Süle N, Pajor L, Nicolai R, Benatti P, Calvani M, Melegh B.
Histopathologic abnormalities of the lymphoreticular tissues in organic cation transporter 2 deficiency: evidence for impaired B cell maturation. J Pediatr 2007; 150:109-111. IF:3,991
26. Magyari L, Bene J, Komlósi K, Talián G, Faragó B, Csöngei V, Járomi L, Sáfrány E, Sipeky C,
Lakner L, Varga M, Gasztonyi B, Melegh B. Prevalence of SLC22A4 1672T and SLC22A5 -207C combination defined TC haplotype in Hungarian ulcerative colitis patients. Pathol Oncol Res 2007; 13:53-56. IF:1,241
27. Papp E, Havasi V, Bene J, Komlosi K, Talian G, Feher G, Horvath B, Szapary L, Toth K, Melegh B.
Does glycoprotein IIIa gene (Pl(A)) polymorphism influence clopidogrel resistance? : a study in older patients. Drugs Aging 2007; 24:345-350. IF:2,200
28. Magyari L, Faragó B, Bene J, Horvatovich K, Lakner L, Varga M, Figler M, Gasztonyi B, Mózsik G,
Melegh B. No association of the cytotoxic T-lymphocyte associated gene CTLA4 +49A/G polymorphisms with Crohn's disease and ulcerative colitis in Hungarian population samples. World J Gastroenterol 2007; 13:2205-2208.

19
29. Nadasi E, Gyurus P, Czakó M, Bene J, Kosztolányi S, Fazekas S, Dömösi P, Melegh B. Comparison
of mtDNA haplogroups in Hungarians with four other European populations: a small incidence of descents with Asian origin. Acta Biol Hung 2007; 58:245-256. IF:0,688
30. Komlósi K, Talián GC, Faragó B, Magyari L, Cserép V, Kovács B, Bene J, Havasi V, Kiss CG,
Czirják L, Melegh B. No influence of SLC22A4 C6607T and RUNX1 G24658C genotypic variants on the circulating carnitine ester profile in patients with rheumatoid arthritis. Clin Exp Rheumatol 2008; 26:61-66. IF:2,189
Cumulative impact factor (without citable abstracts): 64.615

20
7. ACKNOWLEDGEMENTS
Above all I would like to express my greatest thanks to my supervisor, Prof Dr Bela Melegh for the opportunity he offered and motivation he continuously endowed me with in order to be able to present this thesis. I feel especially fortunate for the working environment he created: full of inspiration and challenges in up to date topics. These circumstances made me immerse in molecular genetics and later in mass spectrometry.
I am indebted to Prof Dr Gyorgy Kosztolanyi, the former Head of Department of Medical Genetics and Child Development, for making it possible for me to work in this area and introduced me into the basics of genetics.
I am very grateful to each colleagues of mine in the Department of Medical Genetics and Child Development for their experienced support in the experimental part of my work. Special thanks to Ferencne Szanto and Marta Hartung for their invaluable contribution in mass spectrometric analyses and to Edit Papp and Judit Oksai for their help in genetic studies.
The friendly atmosphere created by the personality and expertise of my coworkers, Dr Katalin Komlosi, Dr Viktoria Havasi and Gabor Talian is very much appreciated.
A number of studies were conducted in cooperation with other institutions. Among these special thanks should go to Prof Dr Maria Figler and Dr Beata Gasztonyi for their cooperation in all areas from sample collection up to the tedious bits of the publication process.
Last but not least this work could not have been done without the secure and loving background, inspiration and support provided by my broader family. So I thank my husband Zoltan Berente and my children Tamas (3) Zsofi (3) and Pannika (1) their love and persistent patience, and I am grateful to my parents, my sister and the parents of my husband for their inestimable time and efforts in childcare and support in general.