Structural elucidation of menthol glycosides10.1186...Structural elucidation of menthol glycosides...
10
Structural elucidation of menthol glycosides The 1 H- and 13 C-NMR spectroscopic data for purified menthol glucoside together with two- dimensional (2D) NMR including 1 H- 1 H COSY, HMQC and HMBC were measured. The 1 H- NMR spectrum showed the presence of an anomeric proton at the chemical shift δ 4.35 (1H, d, J = 7.8 Hz, H-1’), indicating an anomeric proton with a configuration of the sugar moiety. The glucosylation position was determined by HMBC analysis (Fig. S6A). The anomeric proton at δ 4.35 was long-range coupled to the oxygenated methine carbon at δ 78.4 (C-1) of the aglycon. Thus, together with HR-ESIMS data, the product was determined as (-)-menthol D-glucoside. The chemical structure of the purified menthol galactoside was also determined in the same manner. The anomeric proton at the chemical shift δ 4.35 (1H, d, J = 7.6 Hz, H-1’), indicating an anomeric proton with a configuration of the sugar moiety, has HMBC correlation with the oxygenated methine carbon at δ 78.4 (C-1) of the aglycon in HMBC spectrum (Fig. S6B). The other portion was confirmed by the HMBC. Thus, together with HR-ESIMS data, menthol galactoside was determined as a new (-)-menthol D-galactoside. Because the yield of (-)-menthol N-acetylglucosamine was too low, the structure of (-)- menthol N-acetylglucosamine was determined using only MS/MS and HR-ESI data.
Transcript of Structural elucidation of menthol glycosides10.1186...Structural elucidation of menthol glycosides...
Structural elucidation of menthol glycosides
The 1H- and 13C-NMR spectroscopic data for purified menthol glucoside together with two-
dimensional (2D) NMR including 1H-1H COSY, HMQC and HMBC were measured. The 1H-
NMR spectrum showed the presence of an anomeric proton at the chemical shift δ 4.35 (1H, d,
J = 7.8 Hz, H-1’), indicating an anomeric proton with a configuration of the sugar moiety.
The glucosylation position was determined by HMBC analysis (Fig. S6A). The anomeric
proton at δ 4.35 was long-range coupled to the oxygenated methine carbon at δ 78.4 (C-1) of
the aglycon. Thus, together with HR-ESIMS data, the product was determined as (-)-menthol
D-glucoside.
The chemical structure of the purified menthol galactoside was also determined in the same
manner. The anomeric proton at the chemical shift δ 4.35 (1H, d, J = 7.6 Hz, H-1’), indicating
an anomeric proton with a configuration of the sugar moiety, has HMBC correlation with the
oxygenated methine carbon at δ 78.4 (C-1) of the aglycon in HMBC spectrum (Fig. S6B). The
other portion was confirmed by the HMBC. Thus, together with HR-ESIMS data, menthol
galactoside was determined as a new (-)-menthol D-galactoside.
Because the yield of (-)-menthol N-acetylglucosamine was too low, the structure of (-)-
menthol N-acetylglucosamine was determined using only MS/MS and HR-ESI data.
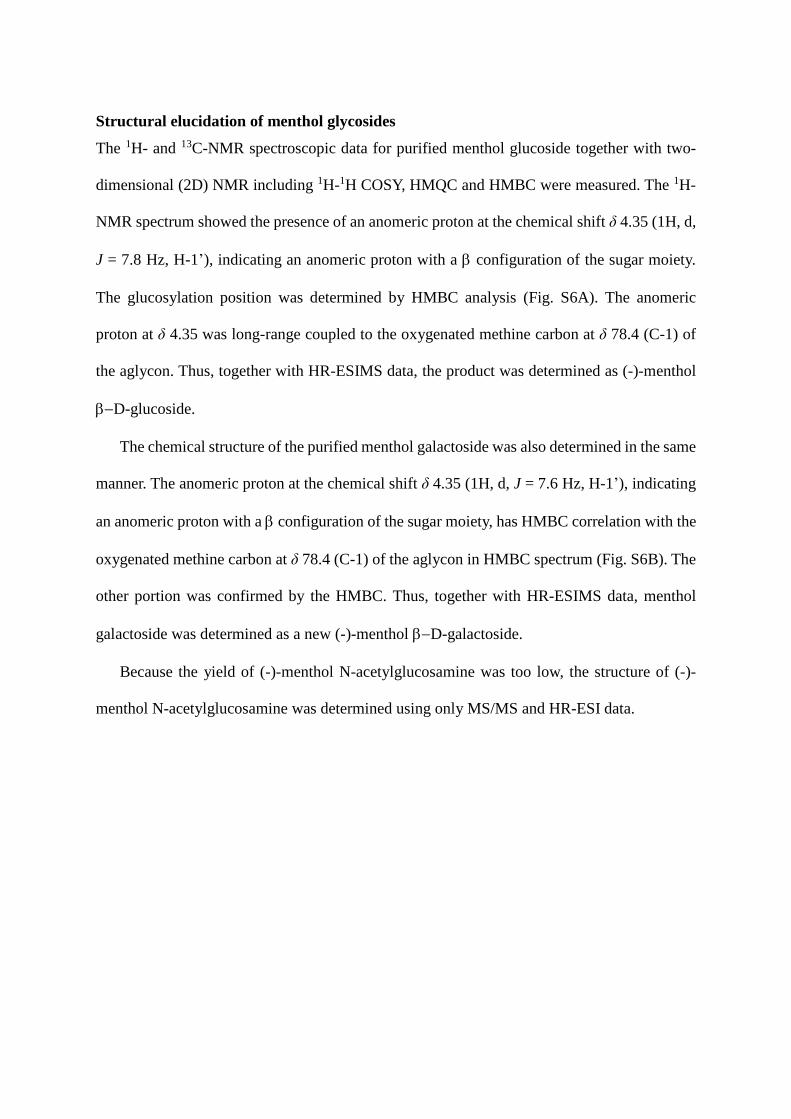
LR-ESIMS and HR-ESIMS data of menthol glycosides
Menthol D-glucoside. A white powder; ESI-MS : 341.2 [M+Na]+, 319.4 [M+H]+,
163.2 [glucose+H] +; HR-ESIMS: m/z 319.2117 (M+H)+, C16H31O6 requires
319.2115; m/z 341.1936 (M+Na)+, C16H30O6Na requires 341.1940.
Menthol D-galactoside. A white powder; ESI-MS : 341.3 [M+Na]+, 319.3
[M+H]+, 163.3 [glucose+H] +; HR-ESIMS: m/z 319.2117 (M+H)+, C16H31O6
requires 319.2115; m/z 341.1934 (M+Na)+, C16H30O6Na requires 341.1940.
Menthol D-N-acetylglucosamine. A white powder; ESI-MS : 382.3 [M+Na]+,
360.3 [M+H]+, 204.2 [N-acetylglucosamine+H] +; HR-ESIMS: m/z 360.2385
(M+H)+, C18H34O6N requires 360.2381; m/z 382.2201 (M+Na)+, C18H33O6NNa
requires 382.2205.
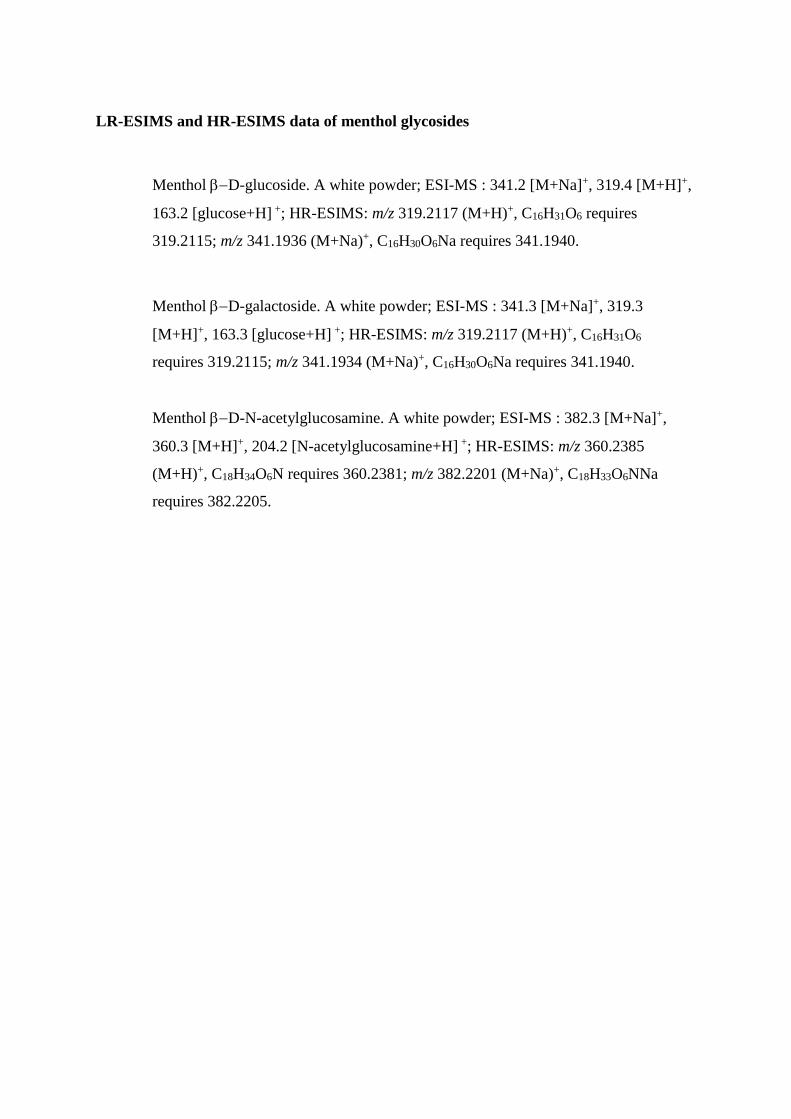
Fig S1. Lineweaver-Burk plot of (-)-menthol glucosylation by BLC respective to menthol.
-500
0
500
1000
1500
-2 -1 0 1 2 3 4 5
1/R
ate
of
form
ati
on
(m
in/m
M)
1/Menthol (mM-1)
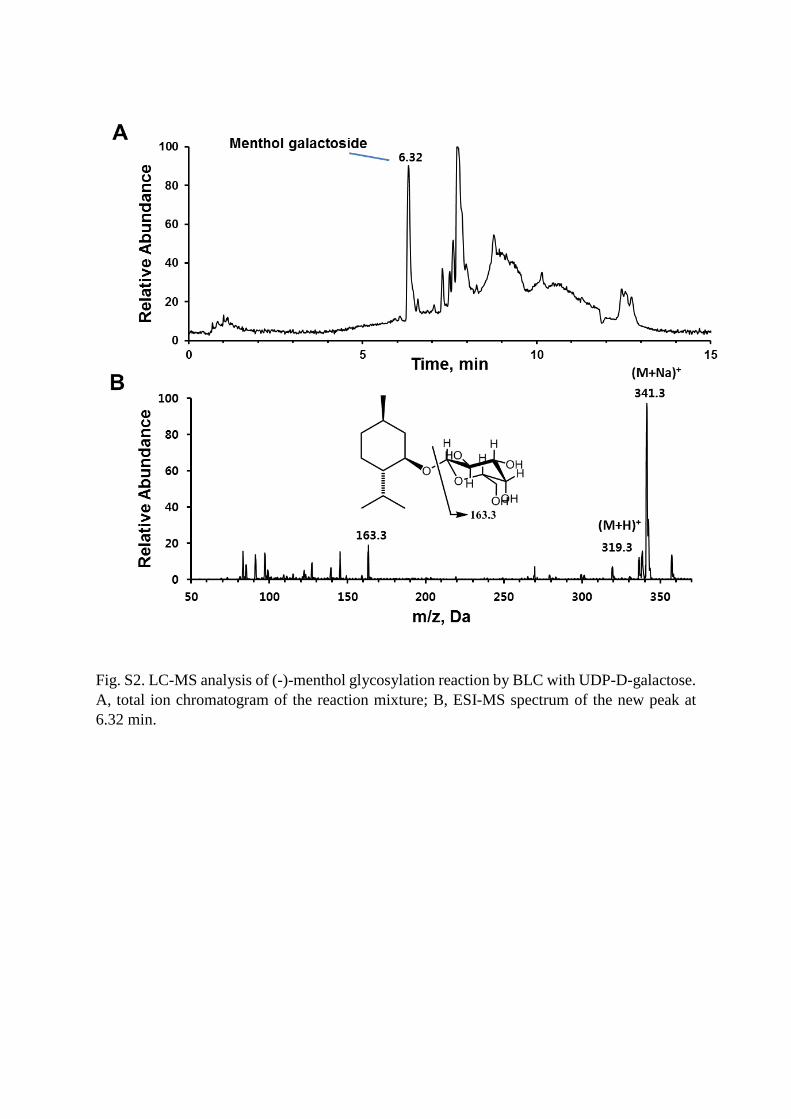
Fig. S2. LC-MS analysis of (-)-menthol glycosylation reaction by BLC with UDP-D-galactose.
A, total ion chromatogram of the reaction mixture; B, ESI-MS spectrum of the new peak at
6.32 min.
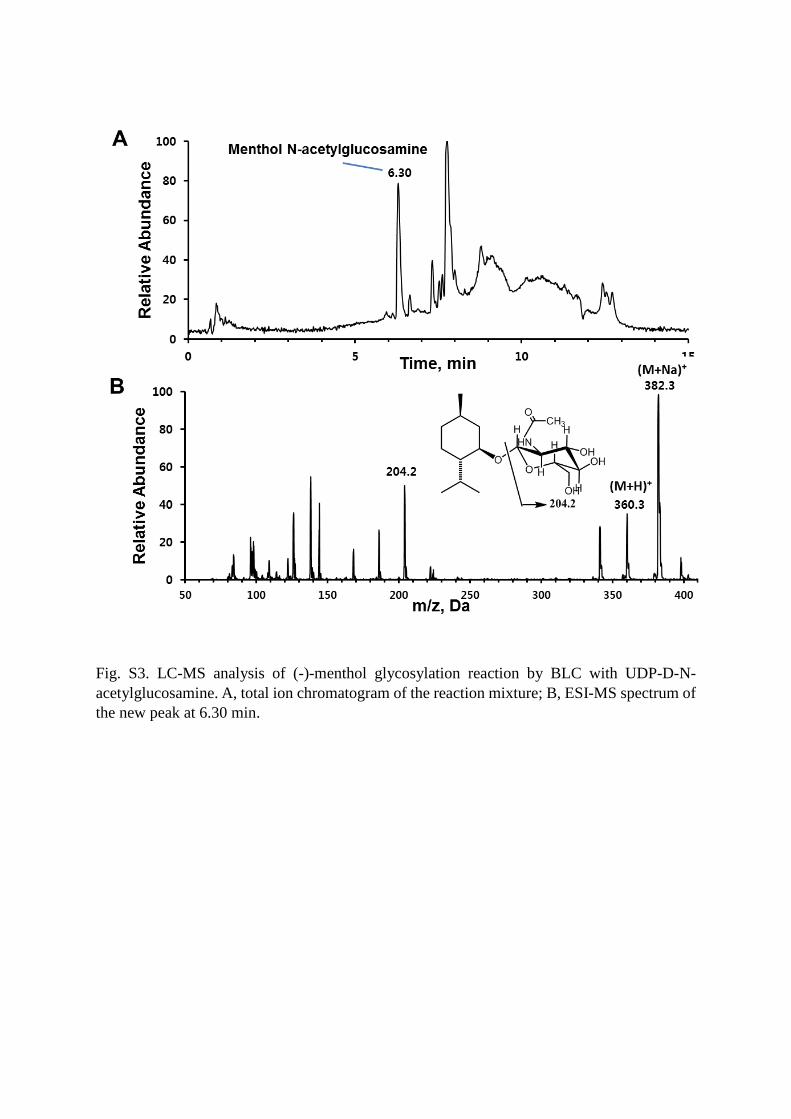
Fig. S3. LC-MS analysis of (-)-menthol glycosylation reaction by BLC with UDP-D-N-
acetylglucosamine. A, total ion chromatogram of the reaction mixture; B, ESI-MS spectrum of
the new peak at 6.30 min.
A
B
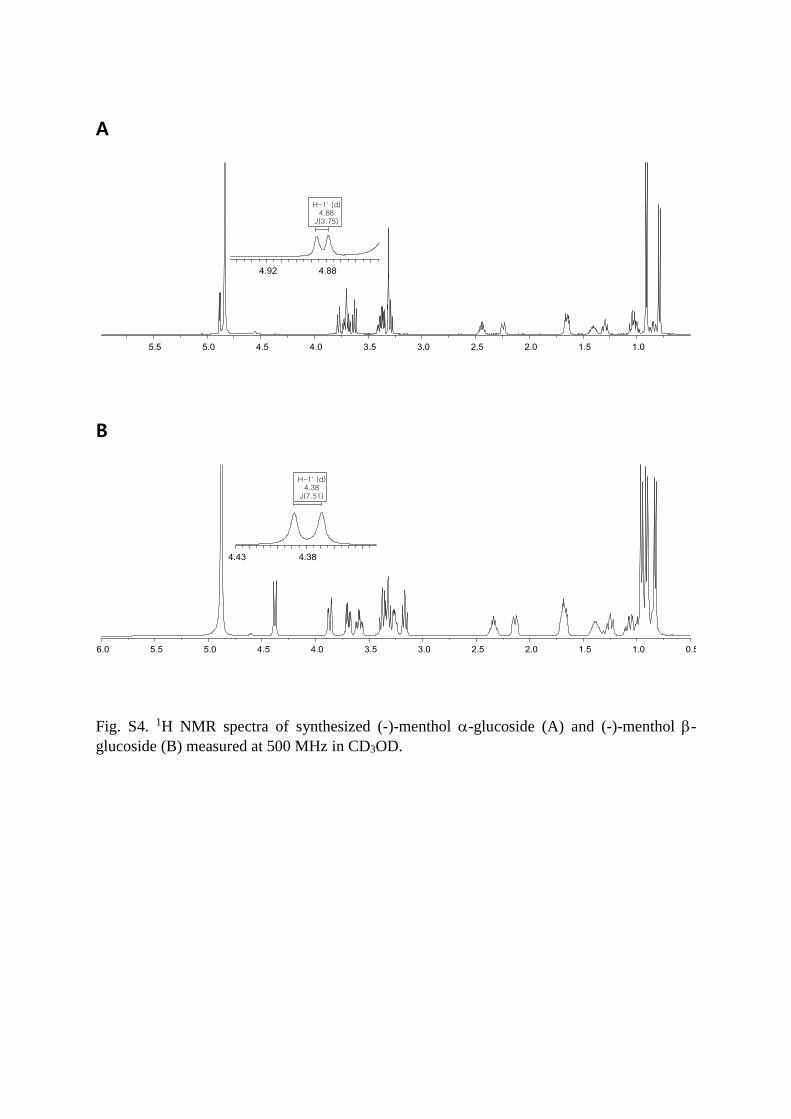
Fig. S4. 1H NMR spectra of synthesized (-)-menthol -glucoside (A) and (-)-menthol -
glucoside (B) measured at 500 MHz in CD3OD.
A
B
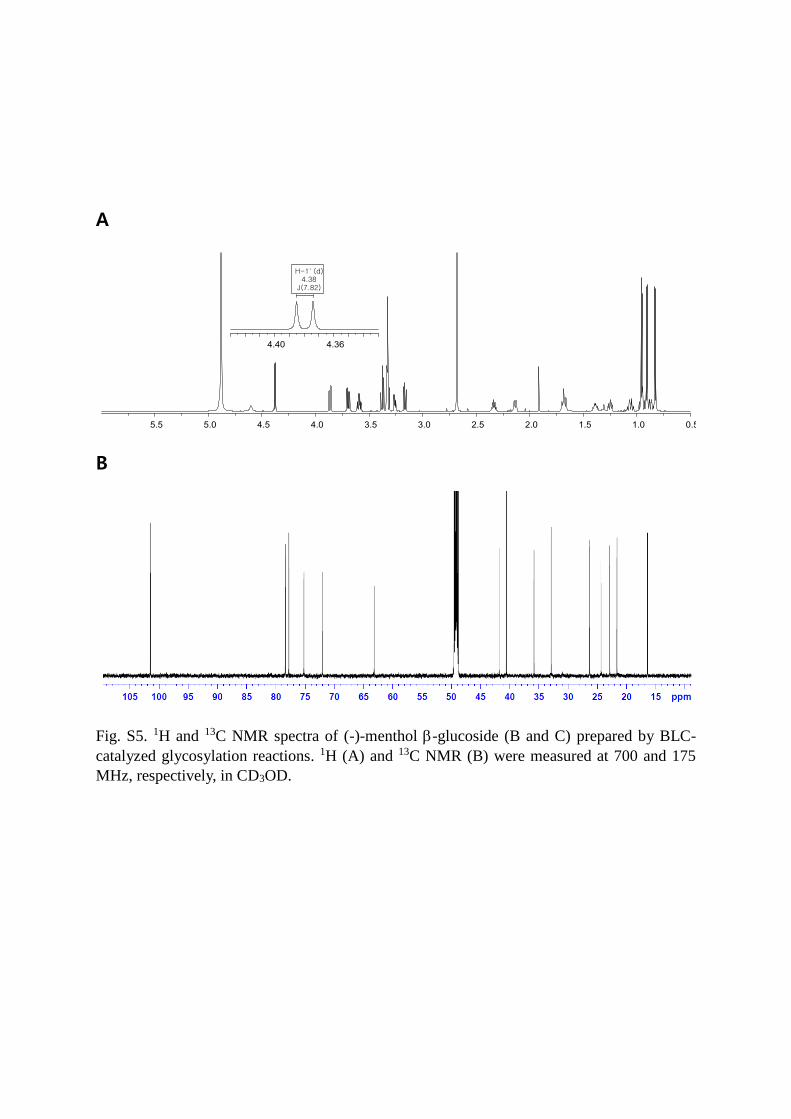
Fig. S5. 1H and 13C NMR spectra of (-)-menthol -glucoside (B and C) prepared by BLC-
catalyzed glycosylation reactions. 1H (A) and 13C NMR (B) were measured at 700 and 175
MHz, respectively, in CD3OD.
A
B
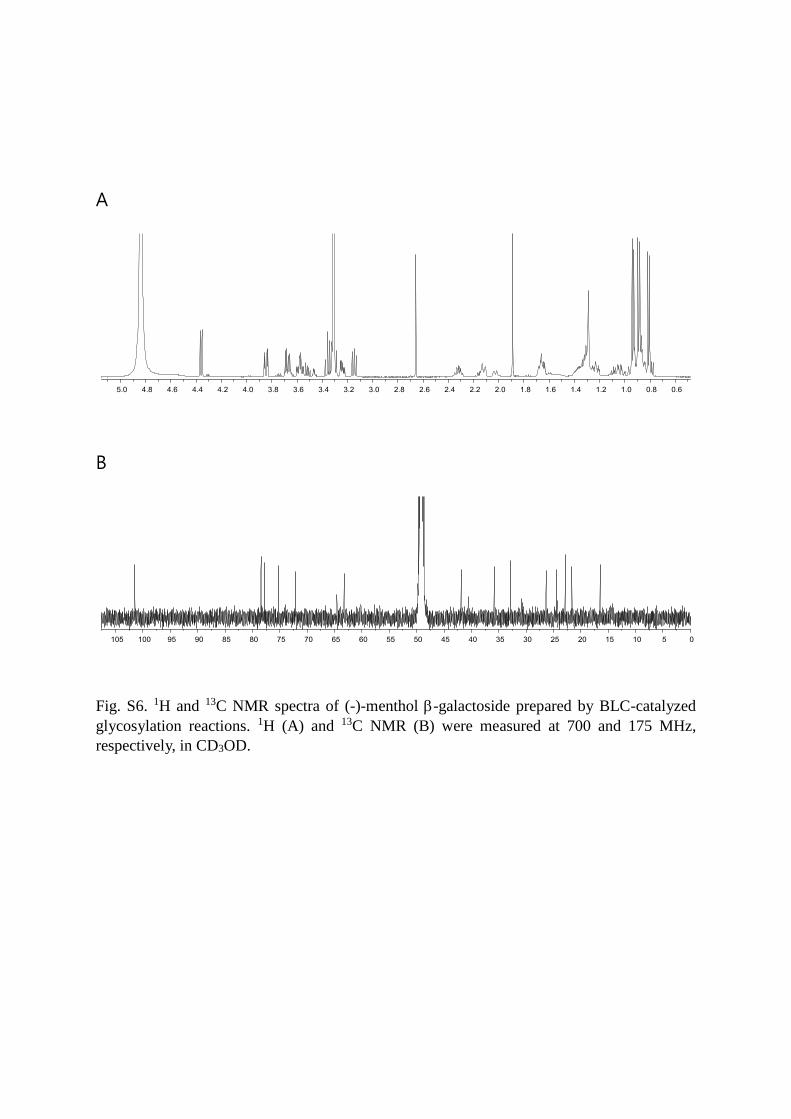
Fig. S6. 1H and 13C NMR spectra of (-)-menthol -galactoside prepared by BLC-catalyzed
glycosylation reactions. 1H (A) and 13C NMR (B) were measured at 700 and 175 MHz,
respectively, in CD3OD.
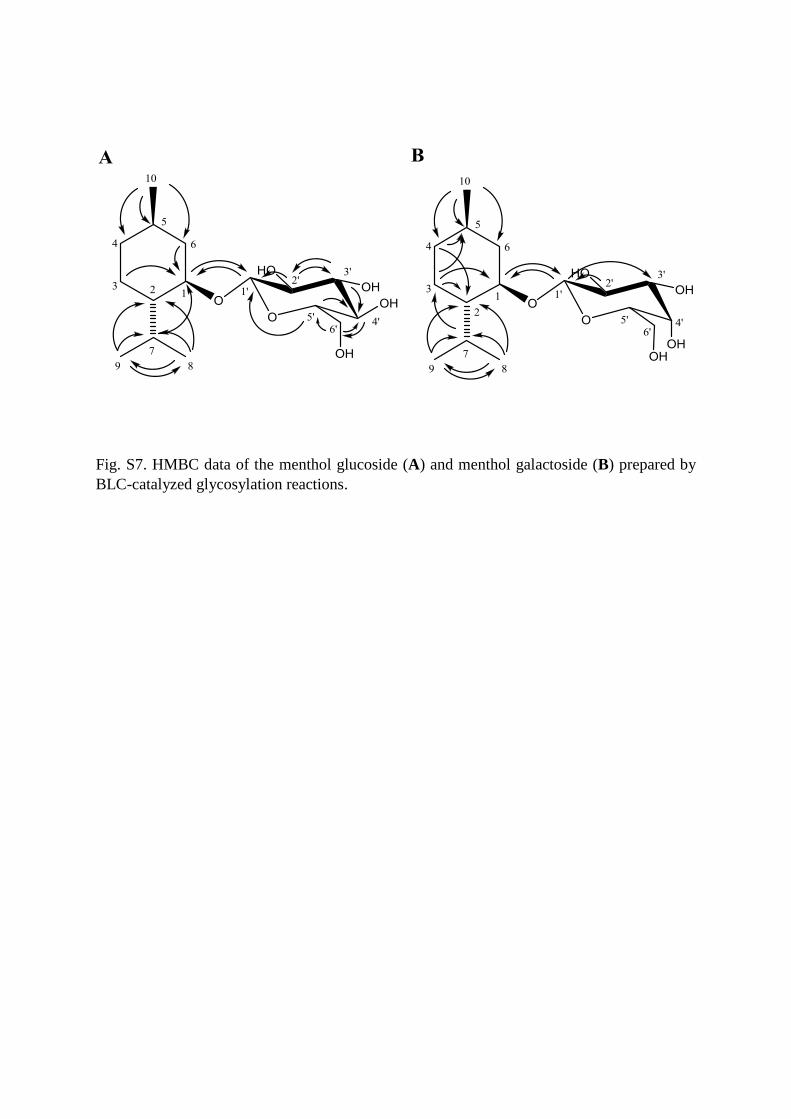
Fig. S7. HMBC data of the menthol glucoside (A) and menthol galactoside (B) prepared by
BLC-catalyzed glycosylation reactions.
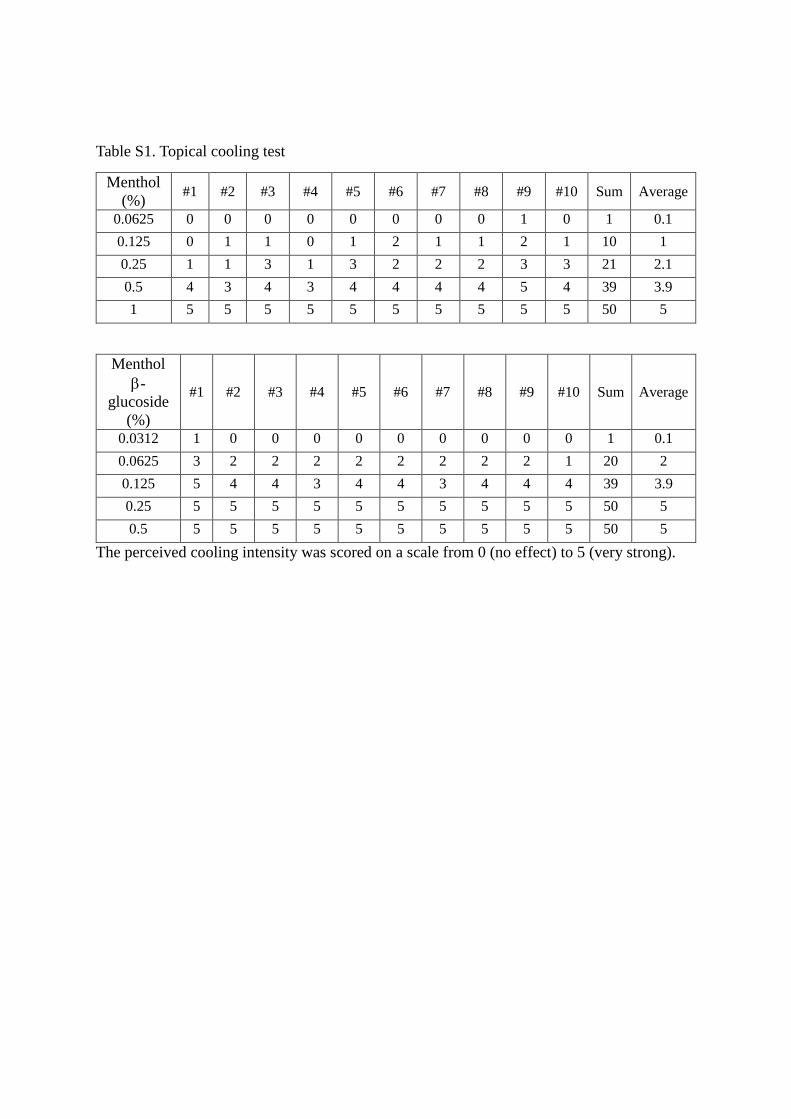
Table S1. Topical cooling test
Menthol
(%) #1 #2 #3 #4 #5 #6 #7 #8 #9 #10 Sum Average
0.0625 0 0 0 0 0 0 0 0 1 0 1 0.1
0.125 0 1 1 0 1 2 1 1 2 1 10 1
0.25 1 1 3 1 3 2 2 2 3 3 21 2.1
0.5 4 3 4 3 4 4 4 4 5 4 39 3.9
1 5 5 5 5 5 5 5 5 5 5 50 5
Menthol
-
glucoside
(%)
#1 #2 #3 #4 #5 #6 #7 #8 #9 #10 Sum Average
0.0312 1 0 0 0 0 0 0 0 0 0 1 0.1
0.0625 3 2 2 2 2 2 2 2 2 1 20 2
0.125 5 4 4 3 4 4 3 4 4 4 39 3.9
0.25 5 5 5 5 5 5 5 5 5 5 50 5
0.5 5 5 5 5 5 5 5 5 5 5 50 5
The perceived cooling intensity was scored on a scale from 0 (no effect) to 5 (very strong).


![High optical and structural quality of GaN epilayers grown ...projects.itn.pt/marco_fct/[4]High optical and structural quality of GaN... · High optical and structural quality of](https://static.fdocument.org/doc/165x107/5e880c2016bca472f2564feb/high-optical-and-structural-quality-of-gan-epilayers-grown-4high-optical-and.jpg)
![Structure Elucidation of Benzhexol-β-Cyclodextrin Complex ... · of inclusion complex, but also provides information useful for detailed structure elucidation of the complex [13].](https://static.fdocument.org/doc/165x107/5e7e1d38e07ed352d60daf63/structure-elucidation-of-benzhexol-cyclodextrin-complex-of-inclusion-complex.jpg)