Spectroscopy of Light Echoes from Carinae’s 19th-...
25
Spectroscopy of Light Echoes from η Carinae’s 19th- Century Great Eruption A. Rest 1 , J. L. Prieto 2,3 , N. R. Walborn 1 , N. Smith 4 , F. B. Bianco 5,6 , R. Chornock 7 , D. L. Welch 8 , D. A. Howell 5,6 , M. E. Huber 9 , R. J. Foley 7,10 , W. Fong 7 , B. Sinnott 8 , H. E. Bond 1 , R. C. Smith 11 , I. Toledo 12 , D. Minniti 13 , K. Mandel 7,14 1 Space Telescope Science Institute, 3700 San Martin Dr., Baltimore, MD 21218, USA 2 Carnegie Observatories, 813 Santa Barbara Street, Pasadena, CA 91101, USA 3 Hubble, Carnegie-Princeton Fellow 4 Steward Observatory, University of Arizona, 933 North Cherry Avenue, Tucson, AZ 85721, USA 5 Las Cumbres Observatory Global Telescope Network, Goleta, CA 93117, USA 6 Department of Physics, University of California, Santa Barbara, CA 93106, USA 7 Harvard-Smithsonian Center for Astrophysics, 60 Garden Street, Cambridge, MA 02138, USA 8 Department of Physics and Astronomy, McMaster University, Hamilton, Ontario, L8S 4M1, Canada 9 Department of Physics and Astronomy, Johns Hopkins University, Baltimore, 3400 North Charles Street, MD 21218, USA 10 Clay Fellow 11 Cerro Tololo Inter-American Observatory, National Optical Astronomy Observatory, Colina el Pino S/N, La Serena, Chile 12 ALMA, KM 121 CH 23, San Pedro de Atacama, II Region, Chile 13 Dept. of Astronomy and Astrophysics, Pontifica Universidad Catolica, Santiago 22, Chile 14 Imperial College London, Blackett Laboratory, Prince Consort Rd, London SW7 2AZ, UK η Carinae (η Car) is the most massive star known in the Milky Way 1 , and a prototype of the poorly understood Luminous Blue Variable stars. It is in a binary system with a period of 5.52 years 2 . Since it is one of the few systems close enough (2.3 kpc) to resolve circumstellar material and has evolved on a human timescale, much of our knowledge about the mass loss of massive stars is derived from this system 3 . It became the second-brightest star in the sky during its mid-19th century “Great Eruption,” but then faded from view; only visual estimates of its brightness were recorded and nothing is known about the eruption’s spectrum 4 . Here we report the discovery of light echoes of η Car which appear to be from the 1838-1858 eruption. While some of the light from the eruption traveled directly to Earth and was observed in the mid-19th century, light directed away from the Earth scattered off a dust sheet and has now been observed after a half-century delay. Spectra of these light echoes provide a direct estimate of the effective temperature and other physical properties of this eruption including the expansion speed, raising questions about traditional scenarios for the eruption that involve a minimum temperature for steady opaque winds. We also find important differences between the light-echo spectra of η Car and spectra of extragalactic transients previously presumed to be analogues. 1
Transcript of Spectroscopy of Light Echoes from Carinae’s 19th-...
Spectroscopy of Light Echoes from η Carinae’s 19th-Century Great EruptionA. Rest1, J. L. Prieto2,3, N. R. Walborn1, N. Smith4, F. B. Bianco5,6, R. Chornock7, D. L. Welch8,D. A. Howell5,6, M. E. Huber9, R. J. Foley7,10, W. Fong7, B. Sinnott8, H. E. Bond1, R. C. Smith11,I. Toledo12, D. Minniti13, K. Mandel7,14
1Space Telescope Science Institute, 3700 San Martin Dr., Baltimore, MD 21218, USA2Carnegie Observatories, 813 Santa Barbara Street, Pasadena, CA 91101, USA3Hubble, Carnegie-Princeton Fellow4Steward Observatory, University of Arizona, 933 North Cherry Avenue, Tucson, AZ 85721, USA5Las Cumbres Observatory Global Telescope Network, Goleta, CA 93117, USA6Department of Physics, University of California, Santa Barbara, CA 93106, USA7Harvard-Smithsonian Center for Astrophysics, 60 Garden Street, Cambridge, MA 02138, USA8Department of Physics and Astronomy, McMaster University, Hamilton, Ontario, L8S 4M1,Canada9Department of Physics and Astronomy, Johns Hopkins University, Baltimore, 3400 North CharlesStreet, MD 21218, USA10Clay Fellow11Cerro Tololo Inter-American Observatory, National Optical Astronomy Observatory, Colina elPino S/N, La Serena, Chile12ALMA, KM 121 CH 23, San Pedro de Atacama, II Region, Chile13Dept. of Astronomy and Astrophysics, Pontifica Universidad Catolica, Santiago 22, Chile14Imperial College London, Blackett Laboratory, Prince Consort Rd, London SW7 2AZ, UK
η Carinae (η Car) is the most massive star known in the Milky Way1, and a prototypeof the poorly understood Luminous Blue Variable stars. It is in a binary system with aperiod of 5.52 years2. Since it is one of the few systems close enough (2.3 kpc) to resolvecircumstellar material and has evolved on a human timescale, much of our knowledge aboutthe mass loss of massive stars is derived from this system3. It became the second-brighteststar in the sky during its mid-19th century “Great Eruption,” but then faded from view; onlyvisual estimates of its brightness were recorded and nothing is known about the eruption’sspectrum4. Here we report the discovery of light echoes of η Car which appear to be fromthe 1838-1858 eruption. While some of the light from the eruption traveled directly to Earthand was observed in the mid-19th century, light directed away from the Earth scattered offa dust sheet and has now been observed after a half-century delay. Spectra of these lightechoes provide a direct estimate of the effective temperature and other physical propertiesof this eruption including the expansion speed, raising questions about traditional scenariosfor the eruption that involve a minimum temperature for steady opaque winds. We also findimportant differences between the light-echo spectra of η Car and spectra of extragalactictransients previously presumed to be analogues.
1
Because of its proximity, η Car is probably the most intensely scrutinized massive star sys-tem. It lies at the heart of the Carina star-forming region, is surrounded by an intricate circumstellarnebula ejected during the Great Eruption, has spectacular variability at all wavelengths1, and is ina binary system with a period of 5.52 years 2. The Great Eruption is thought to have ejected morethan 10 M⊙ from the star, and to have released about 10% of the energy of a core-collapse super-nova (SN)5, 6, even though the star survived the event. The underlying physical mechanism of theoutburst remains unexplained.
Some extragalactic non-SN transients have been interpreted as analogues of the Great Erup-tion of η Car 7–12. However, their widening diversity calls into question their association or suggeststhat massive eruptions like η Car are only a subset of non-terminal eruptions13. An important gapin our understanding is that until now we have had only visual brightness estimates for the GreatEruption of η Car4, whereas we have modern spectra and precise photometry for the extragalactictransients.
1 Light Echoes of η Carinae’s Great Outburst
In 2003, 2010, and 2011, we obtained images with the CTIO 4-m Blanco telescope of a region∼0.5 degrees to the south of η Car (Figure 1) that, when differenced, show a rich set of lightechoes. We have also found similar echo candidates at other positions, which we are currentlymonitoring. Applying the vector method that previously allowed us to identify the source of thelight echoes from the SNe that produced the SNRs 0509−67.5, Cas A, and Tycho14, 15, we findthat a dramatic brightening of η Car must be the origin. In these echoes, unlike those of GalacticSNe16, there is still significant spatial overlap even at separations of one light-year, suggesting thatthe duration of the event causing them must be significantly longer than one year. We also seebrightening of 2 magnitudes or more within 8 years. Thus, the Lesser Eruption from 1887 to 1896,which brightened by only a magnitude, is excluded as the source. The large brightening and longduration point to the Great Eruption as the source of the light echoes.
We have also obtained a composite light curve in the SDSS i filter of the light echoes fromother telescopes (see Fig. 2), showing a slow decline of several tenths of a magnitude over half ayear. Within the Great Eruption there are three known peaks4 at 1838, 1843, and 1845. The echolight curve is most consistent with the historical observations of the 1843 event, although furtherobservations are necessary to be certain (see the Supplementary Information, SI).
2 Spectroscopy
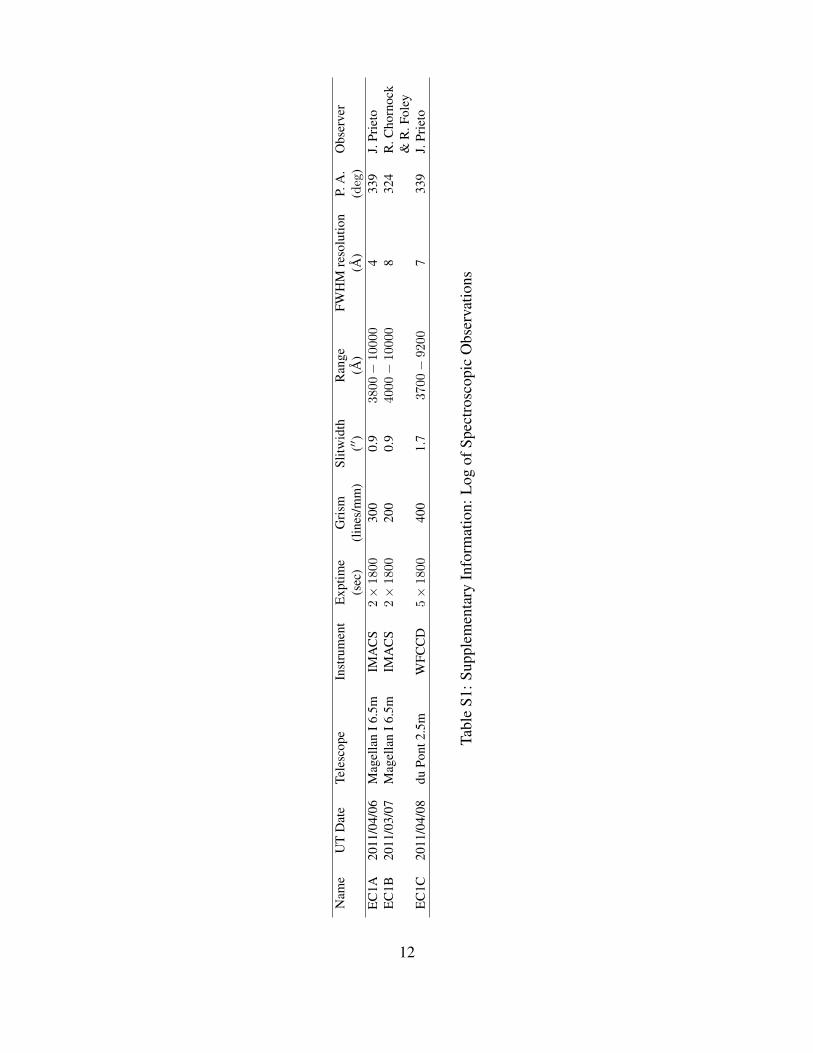
Three spectra of the light echo are shown in Figure 3 — the positions differ only slightly in slitangle (see Table S1). The light-echo spectra do not show emission lines, only absorption linescharacteristic of cool stellar photospheres. In particular, the Ca II infrared (IR) triplet is in absorp-
2
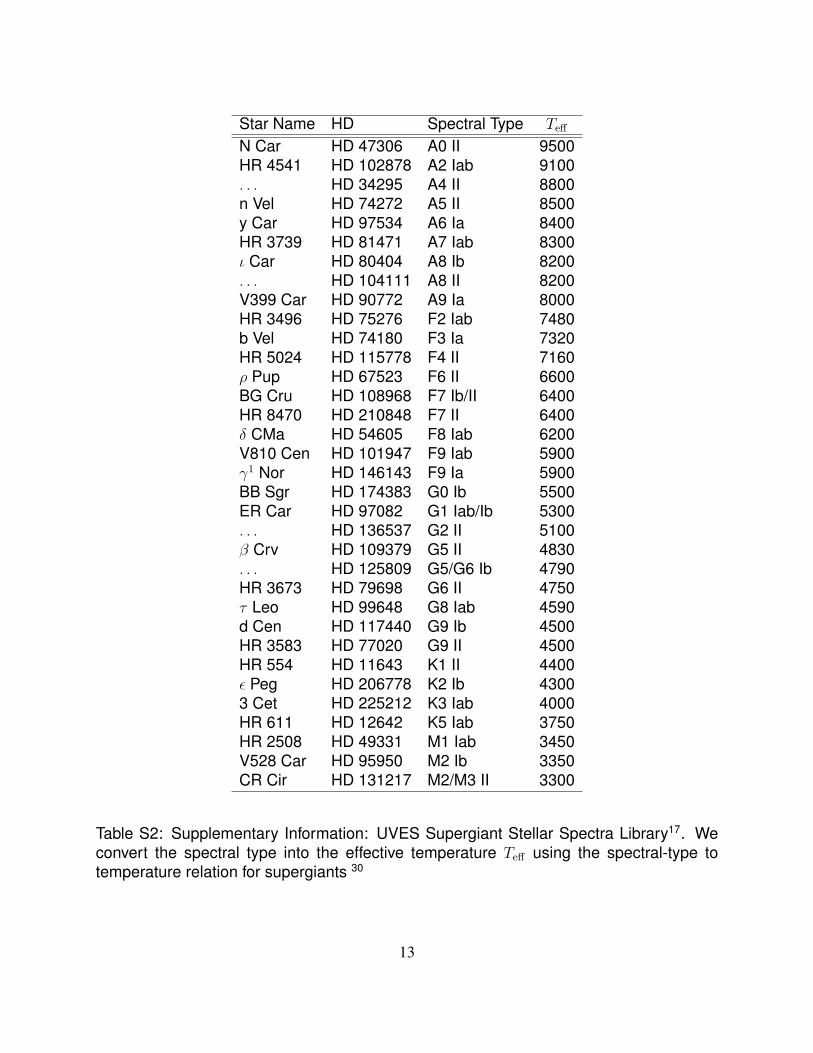
tion and not in emission. The right panel of Figure 3 shows the region of Hα and [N II]. Becauseof bright ambient nebular emission, it is difficult to determine if there is any emission from η Caritself, but in any case it must be weak if present. By cross-correlating each of our η Car echo spec-tra with the UVES spectral library17 (see Figure S6 and S7) we find best agreement with supergiantspectral types in the range of G2-G5, with an effective temperature of ∼5000 K. Spectral types ofF7 or earlier are ruled out by our analysis (see SI for more details).
The Ca II IR triplet absorption features in the spectrum are noticeably blueshifted (see Fig-ure S6). By cross-correlation with G-type18 templates, we determine velocities of −202 ± 9,−210 ± 14, and −237 ± 17 km s−1 for our three spectra. Averaging these, and adding an un-certainty for the the motion of the scattering dust sheet, we estimate the average velocity to be−210± 30 km s−1.
The bipolar nature of Homunculus Nebula shows that the η Car Great Eruption was stronglyaspherical. It was previously predicted that the outflow speeds one would derive from spectra ofη Car in outburst, looking at the poles and equator of the double lobes, would be ∼ −650 km s−1
and −40-100 km s−1, respectively3 (outflow speeds near the equator have a steep latitude depen-dence). The light echo we investigate in this paper arises from latitudes near the equator of η Car(see Figure S5), and the measured blue-shifted velocity of−210±30 km s−1 is in good agreementwith expansion speeds within±20◦ of the equatorial plane. We also find a strong asymmetry in theCa II IR triplet, extending to a velocity of−850 km s−1. This is well below the speeds of the fastestpolar ejecta found previously6, but is in good agreement with speeds observed in the blast waveat lower latitudes6. Future observations of light echoes viewing the η Car eruption from differentdirections, in particular from the poles, may have the potential to observe these very high-velocityejecta and other asymmetries.
3 Comparison to LBVs and SN impostors
Luminous Blue Variable (LBV) outbursts are divided into two classes8, 11, 19: “S Doradus (S Dor)-like” excursions in the HR diagram from OB to AF spectral types, with changes in the visual bright-ness of 1-3 magnitudes but nearly constant bolometric luminosity, and η Car-like giant eruptionswith the brightness increasing visually by more than 3 magnitudes, an increase in the bolometricluminosity, and an increase in the mass-loss rate8, 9. A characteristic of both types of LBV outburstsis their transition from a hot quiescent state to a cooler outburst state, although this feature is lesswell observed for the giant eruptions (see Figure 4).
While neither type of LBV outburst is well understood, the traditional mechanism for η Car-like giant eruptions is an unexplained increase in luminosity that drives a denser wind, so that anoptically thick pseudo-photosphere forms at a layer much larger and cooler than the hydrostaticstellar surface. As the mass-loss rate increases, the effective temperature decreases and the effec-tive photosphere of the star moves outward into the wind20. This scenario predicts a minimum
3
effective temperature of ∼7000 K (an F-type spectrum) due to the temperature dependence of thewind opacity. In contrast, S Dor-type outbursts are suggested to involve an actual expansion ofthe stellar photospheric radius; these events also have minimum temperatures in the 7000-9000 Krange and exhibit spectra at maximum resembling A or F-type supergiants8, 19. These events evi-dently occur as a massive star attempts to evolve redward and encounters the Humphreys-DavidsonLimit, beyond which no stable stars are observed.
Surprisingly, our G-type light-echo spectrum of the η Car Great Eruption is inconsistentwith expectations of an opaque-wind model20 (see Figure 4). This model also fails to explain thehigh 1050 erg kinetic energy5 and the presence of a fast blast wave at large radii6. Instead, theseobservations point toward a hydrodynamic explosion mechanism2, 5, 6. Other alternative modelsinvolving accretion in a binary system have also been proposed12.
The first visual spectroscopic observations of η Car around 1870 showed emission lines 21, 22.A photographic spectrogram obtained during its Lesser Eruption circa 189023, 24 resembles an F-type supergiant blueshifted by−200 km s−1, with moderate hydrogen P Cygni profiles, which is asexpected in the opaque-wind model20. The difference between the 1890 and our light-echo spectraof the Great Eruption is therefore quite striking, indicating that two distinct physical processes mayhave been involved. However, the 1890 event also produced a mass ejection, the Little Homuncu-lus, with the same axial symmetry as the Great Eruption25, albeit of a much smaller amount.
Although η Car’s Great Eruption has been considered the prototype of the so-called SNimpostors or η Car analogues, it is actually an extreme case in terms of radiated energy (1049.3 erg),kinetic energy (>1050 erg), and its decade-long duration13. Typically, the hotter SN impostors havesteep blue continua, stronger and broader Balmer lines, and relatively weak absorption, whereasthe cooler ones tend to have redder continua, weaker and narrower Balmer lines, strong [Ca II]and Ca II emission, deeper P Cygni absorption features, and in some cases stronger absorptionspectra similar to F-type supergiants13. However, the η Car Great-Eruption light-echo spectrumis quite different. Its spectral type is G2-G5, significantly later than all other SN impostors atpeak. Furthermore, the Ca II IR triplet lines are only in absorption. It is difficult to see howstrong emission lines could be avoided in an opaque wind where the continuum photosphere isdetermined by a change in opacity, so this is another argument against that model. For the extrememass-loss rates required in η Car’s Great Eruption, another process must give rise to the apparenttemperature.
The Great Eruption of η Car is one of the most spectacular known astronomical events, pro-viding valuable clues for understanding massive stars, stellar mass loss, LBVs, and SN impostors.Yet for a century and a half we were missing critical spectral information about the eruption it-self, due to the technological limitations of the past. The discovery of its light echoes gives us asecond chance to relive this important event. The early data presented here have already revealedsurprises. Many more will come as we continue to watch echoes from the Great Eruption in real
4
time, as we follow new echoes from different time periods, and as we add spatial information tobuild a four-dimensional picture of the death throes of one of the most interesting objects in theMilky Way.26, 27
Acknowledgements We thank R. Humphreys, K. Davidson, and J. Vink for comments and discussions.We thank S. Blondin for help with the continuum subtraction. The Blanco 4m telescope is a facility ofthe Cerro Tololo Inter-American Observatory, National Optical Astronomy Observatory, which are operatedby the Association of Universities for Research in Astronomy, under contract with the National ScienceFoundation. We use data from the UVES Paranal Observatory Project. The computations in this paper wererun on the Odyssey cluster supported by the FAS Science Division Research Computing Group at HarvardUniversity. Observations were obtained at LCOGT, and FBB and DAH acknowledge support from LCOGT.
Author Contributions All authors contributed to the drafting of the paper. A.R., N.S and R.C.S. imagedthe area around η Car. A.R. and M.H. reduced the imaging data. H.E.B. provided images of the echoes thatguided our spectroscopic pointings. J.L.P., R.C., R.J.F., and W.F. obtained the spectra and reduced them.A.R. and J.P.L. performed spectral analysis and interpretation. A.R., N.R.W., and F.B.B performed spectralclassification. F.B.B. and K.M. correlated the spectra. A.R., D.L.W. and B.S. modelled the light echo. I.T.and D.M. provided imaging of η Car. F.B.B and D.A.H provided the FTS images, F.B.B and A.R. reducedthem.
Author Information The authors declare that they have no competing financial interests. Correspondenceand requests for materials should be addressed to A.R. ([email protected]).
5
S4 Supplemental Information
Three dimensional orientation The scattered-light path is shown in Figure S5. The 3D-plotshows that with this light echo we see the eruption of η Car from a viewing angle perpendicular tothe principal axis of the Homunculus Nebula. It will be very interesting to compare spectra seenfrom this viewing angle with spectra from light echoes that view the eruption from the poles of thebipolar outflow.
Evidence that these are light echoes of the mid-19th century Great Eruption of η Car Theangular separation between the center of our light-echo images and η Car is∼0.5 degrees, as shownin the left panel of Figure 1, in which our pointing is indicated with a white box. In the middlepanel of this figure, our three epochs of SDSS i-band imaging obtained with the 8k × 8k Mosaicimager on the CTIO 4-m Blanco telescope are displayed. The images, each with an exposureof 160 s, were obtained on 2003 Mar 10 (A), 2010 May 10 (B), and 2011 Feb 6 (C). Differenceimages, C −A and C −B, are also shown (upper and middle right panels, respectively). In them,we notice excess flux from the first (black) and second epochs (white), which we interpret as lightechoes from η Car. Sample light-echo positions are indicated with blue (epoch A) and red (epochB and C) arrows.
Comparing the first- and second-epoch images, we can determine the direction of the appar-ent motion of the light echo and infer the direction to the illuminating source. Most of the excessflux in the first-epoch image is toward the northern part of the image (blue arrows in Figure 1,whereas most of the excess flux in the second-epoch image is in the southern portion (red arrowsin Figure 1. If the light echoes arise from η Car, this is exactly the directional sense expected. Wehave also found similar regions of excess flux at other positions in proximity to η Car, with ap-parent motions consistent with η Car being the source of the outburst light, which we will discussin a follow-up paper. The vector method we have used previously to determine the origin of thelight echoes for SNR 0509−67.5, Cas A, and Tycho14, 15 was applied here and, not surprisingly,we conclude that these excess fluxes are most likely light echoes from a dramatic brightening ofη Car.
The flux profile of a light echo, which is the cut through the light echo along the axis pointingtoward the source event, is the projected light curve, stretched or compressed depending on theinclination of the scattering dust filament, and convolved with the effects of the dust width andthe seeing16. In pathological cases where the inclination of the dust filament is very unfavorableor where the dust filament is significantly thicker than any yet observed, a useful correspondencemay be lost16. For light echoes from sources in our Galaxy scattered by dust with typical widthsand inclinations, we expect that the apparent motion of the light echo will move at a rate of oneprojected echo width between two epochs separated by twice the outburst event duration. Forknown galactic SNe light echoes the timescale of the brightest phase is of the order of a fewmonths, so that an imaging separation time of 1 year is sufficient for there to be no overlap (on
6
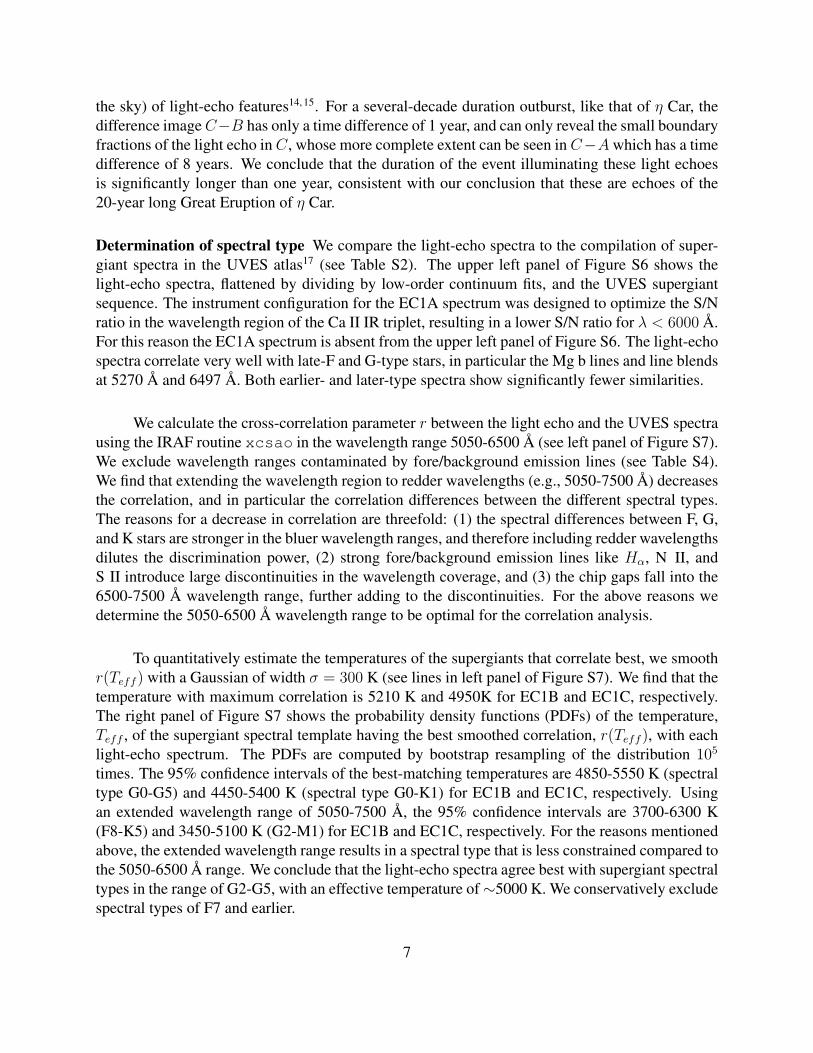
the sky) of light-echo features14, 15. For a several-decade duration outburst, like that of η Car, thedifference image C−B has only a time difference of 1 year, and can only reveal the small boundaryfractions of the light echo in C, whose more complete extent can be seen in C−A which has a timedifference of 8 years. We conclude that the duration of the event illuminating these light echoesis significantly longer than one year, consistent with our conclusion that these are echoes of the20-year long Great Eruption of η Car.
Determination of spectral type We compare the light-echo spectra to the compilation of super-giant spectra in the UVES atlas17 (see Table S2). The upper left panel of Figure S6 shows thelight-echo spectra, flattened by dividing by low-order continuum fits, and the UVES supergiantsequence. The instrument configuration for the EC1A spectrum was designed to optimize the S/Nratio in the wavelength region of the Ca II IR triplet, resulting in a lower S/N ratio for λ < 6000 A.For this reason the EC1A spectrum is absent from the upper left panel of Figure S6. The light-echospectra correlate very well with late-F and G-type stars, in particular the Mg b lines and line blendsat 5270 A and 6497 A. Both earlier- and later-type spectra show significantly fewer similarities.
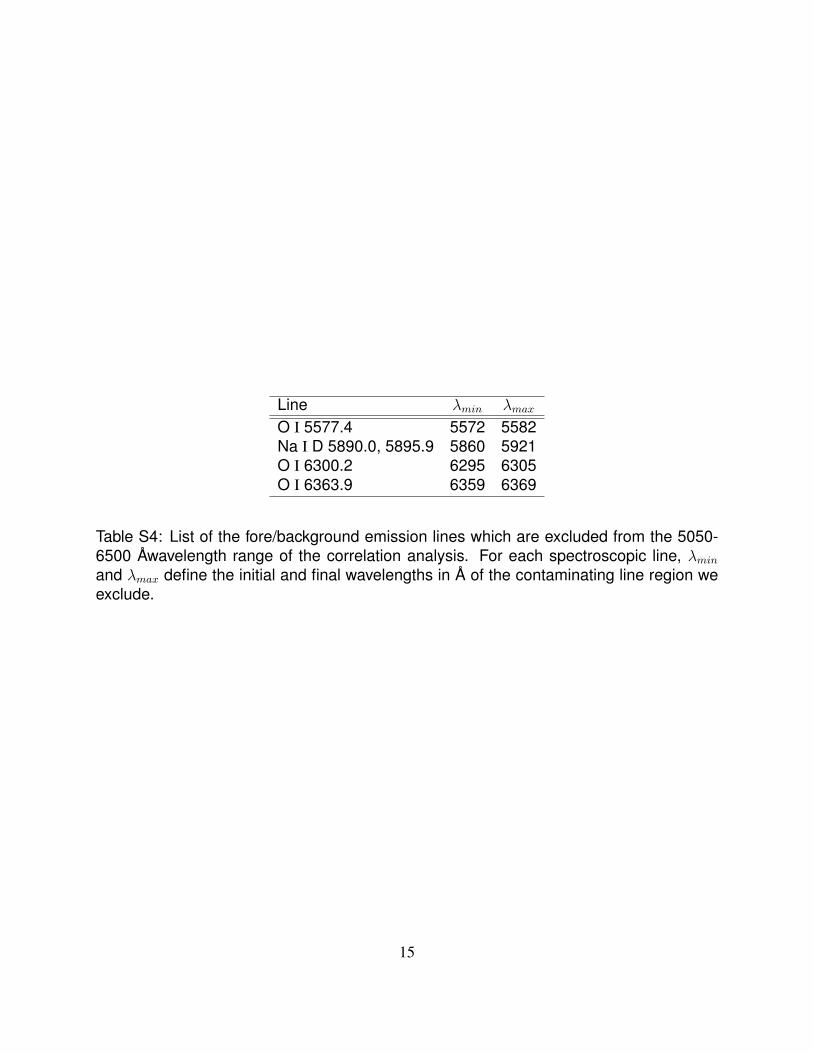
We calculate the cross-correlation parameter r between the light echo and the UVES spectrausing the IRAF routine xcsao in the wavelength range 5050-6500 A (see left panel of Figure S7).We exclude wavelength ranges contaminated by fore/background emission lines (see Table S4).We find that extending the wavelength region to redder wavelengths (e.g., 5050-7500 A) decreasesthe correlation, and in particular the correlation differences between the different spectral types.The reasons for a decrease in correlation are threefold: (1) the spectral differences between F, G,and K stars are stronger in the bluer wavelength ranges, and therefore including redder wavelengthsdilutes the discrimination power, (2) strong fore/background emission lines like Hα, N II, andS II introduce large discontinuities in the wavelength coverage, and (3) the chip gaps fall into the6500-7500 A wavelength range, further adding to the discontinuities. For the above reasons wedetermine the 5050-6500 A wavelength range to be optimal for the correlation analysis.
To quantitatively estimate the temperatures of the supergiants that correlate best, we smoothr(Teff ) with a Gaussian of width σ = 300 K (see lines in left panel of Figure S7). We find that thetemperature with maximum correlation is 5210 K and 4950K for EC1B and EC1C, respectively.The right panel of Figure S7 shows the probability density functions (PDFs) of the temperature,Teff , of the supergiant spectral template having the best smoothed correlation, r(Teff ), with eachlight-echo spectrum. The PDFs are computed by bootstrap resampling of the distribution 105
times. The 95% confidence intervals of the best-matching temperatures are 4850-5550 K (spectraltype G0-G5) and 4450-5400 K (spectral type G0-K1) for EC1B and EC1C, respectively. Usingan extended wavelength range of 5050-7500 A, the 95% confidence intervals are 3700-6300 K(F8-K5) and 3450-5100 K (G2-M1) for EC1B and EC1C, respectively. For the reasons mentionedabove, the extended wavelength range results in a spectral type that is less constrained compared tothe 5050-6500 A range. We conclude that the light-echo spectra agree best with supergiant spectraltypes in the range of G2-G5, with an effective temperature of∼5000 K. We conservatively excludespectral types of F7 and earlier.
7
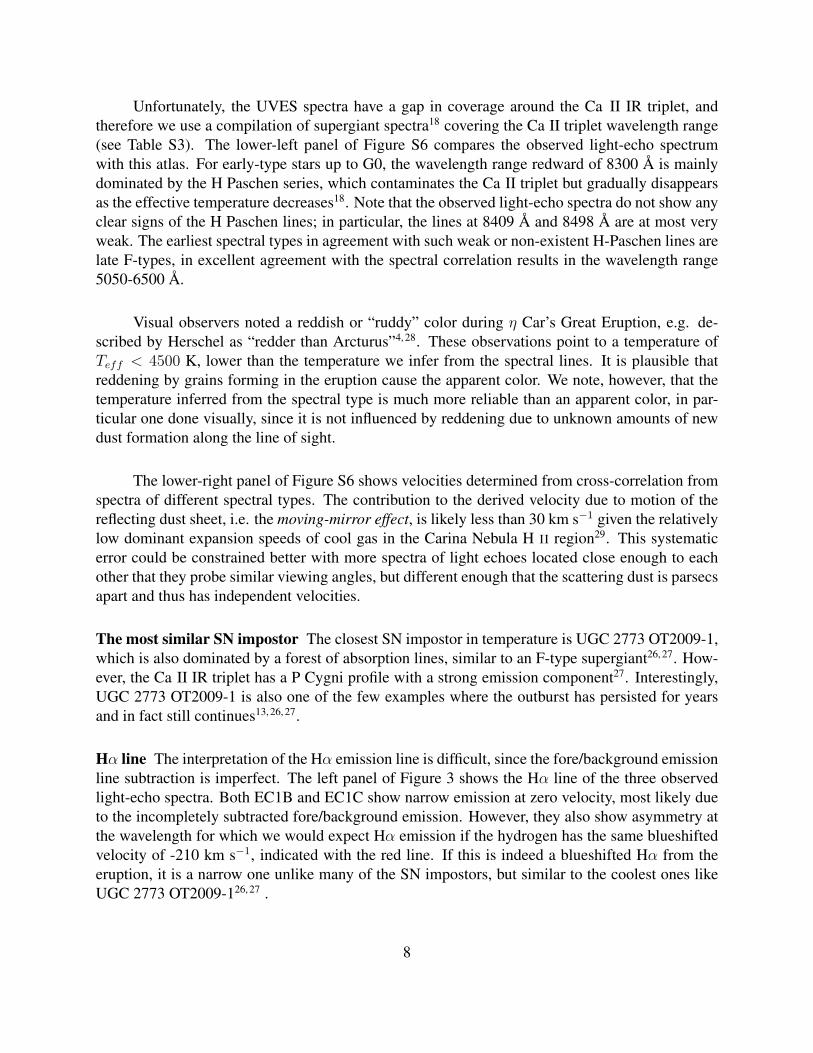
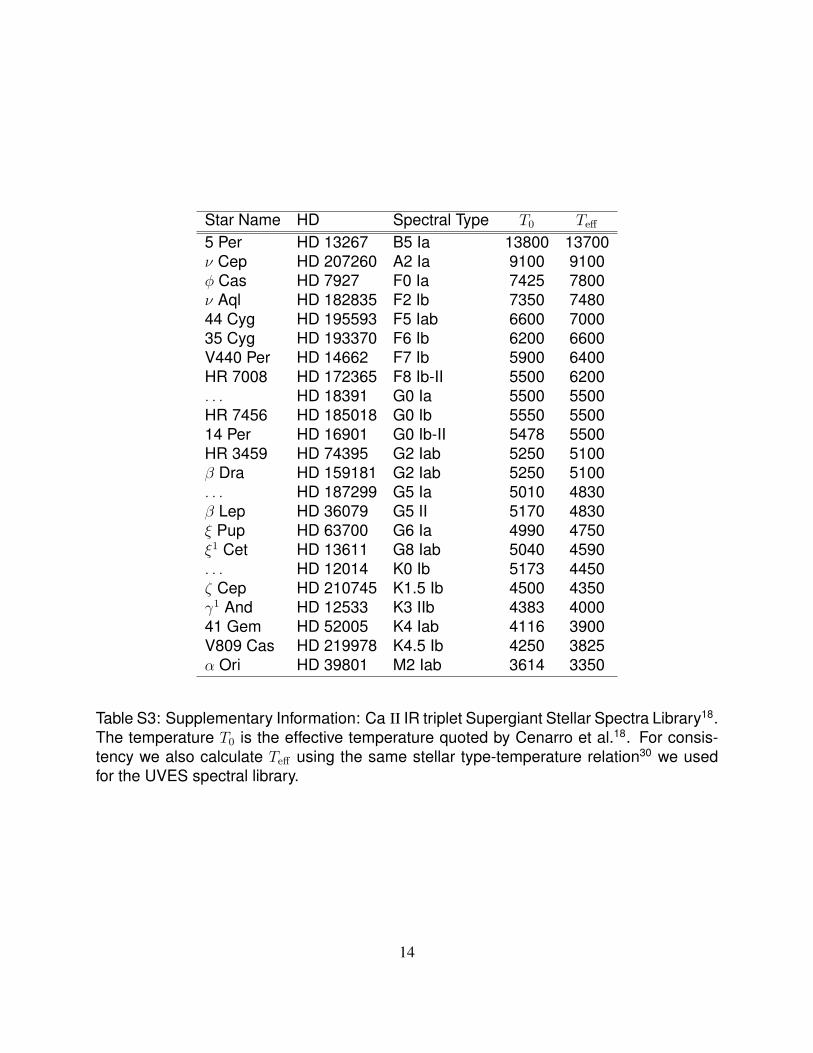
Unfortunately, the UVES spectra have a gap in coverage around the Ca II IR triplet, andtherefore we use a compilation of supergiant spectra18 covering the Ca II triplet wavelength range(see Table S3). The lower-left panel of Figure S6 compares the observed light-echo spectrumwith this atlas. For early-type stars up to G0, the wavelength range redward of 8300 A is mainlydominated by the H Paschen series, which contaminates the Ca II triplet but gradually disappearsas the effective temperature decreases18. Note that the observed light-echo spectra do not show anyclear signs of the H Paschen lines; in particular, the lines at 8409 A and 8498 A are at most veryweak. The earliest spectral types in agreement with such weak or non-existent H-Paschen lines arelate F-types, in excellent agreement with the spectral correlation results in the wavelength range5050-6500 A.
Visual observers noted a reddish or “ruddy” color during η Car’s Great Eruption, e.g. de-scribed by Herschel as “redder than Arcturus”4, 28. These observations point to a temperature ofTeff < 4500 K, lower than the temperature we infer from the spectral lines. It is plausible thatreddening by grains forming in the eruption cause the apparent color. We note, however, that thetemperature inferred from the spectral type is much more reliable than an apparent color, in par-ticular one done visually, since it is not influenced by reddening due to unknown amounts of newdust formation along the line of sight.
The lower-right panel of Figure S6 shows velocities determined from cross-correlation fromspectra of different spectral types. The contribution to the derived velocity due to motion of thereflecting dust sheet, i.e. the moving-mirror effect, is likely less than 30 km s−1 given the relativelylow dominant expansion speeds of cool gas in the Carina Nebula H II region29. This systematicerror could be constrained better with more spectra of light echoes located close enough to eachother that they probe similar viewing angles, but different enough that the scattering dust is parsecsapart and thus has independent velocities.
The most similar SN impostor The closest SN impostor in temperature is UGC 2773 OT2009-1,which is also dominated by a forest of absorption lines, similar to an F-type supergiant26, 27. How-ever, the Ca II IR triplet has a P Cygni profile with a strong emission component27. Interestingly,UGC 2773 OT2009-1 is also one of the few examples where the outburst has persisted for yearsand in fact still continues13, 26, 27.
Hα line The interpretation of the Hα emission line is difficult, since the fore/background emissionline subtraction is imperfect. The left panel of Figure 3 shows the Hα line of the three observedlight-echo spectra. Both EC1B and EC1C show narrow emission at zero velocity, most likely dueto the incompletely subtracted fore/background emission. However, they also show asymmetry atthe wavelength for which we would expect Hα emission if the hydrogen has the same blueshiftedvelocity of -210 km s−1, indicated with the red line. If this is indeed a blueshifted Hα from theeruption, it is a narrow one unlike many of the SN impostors, but similar to the coolest ones likeUGC 2773 OT2009-126, 27 .
8
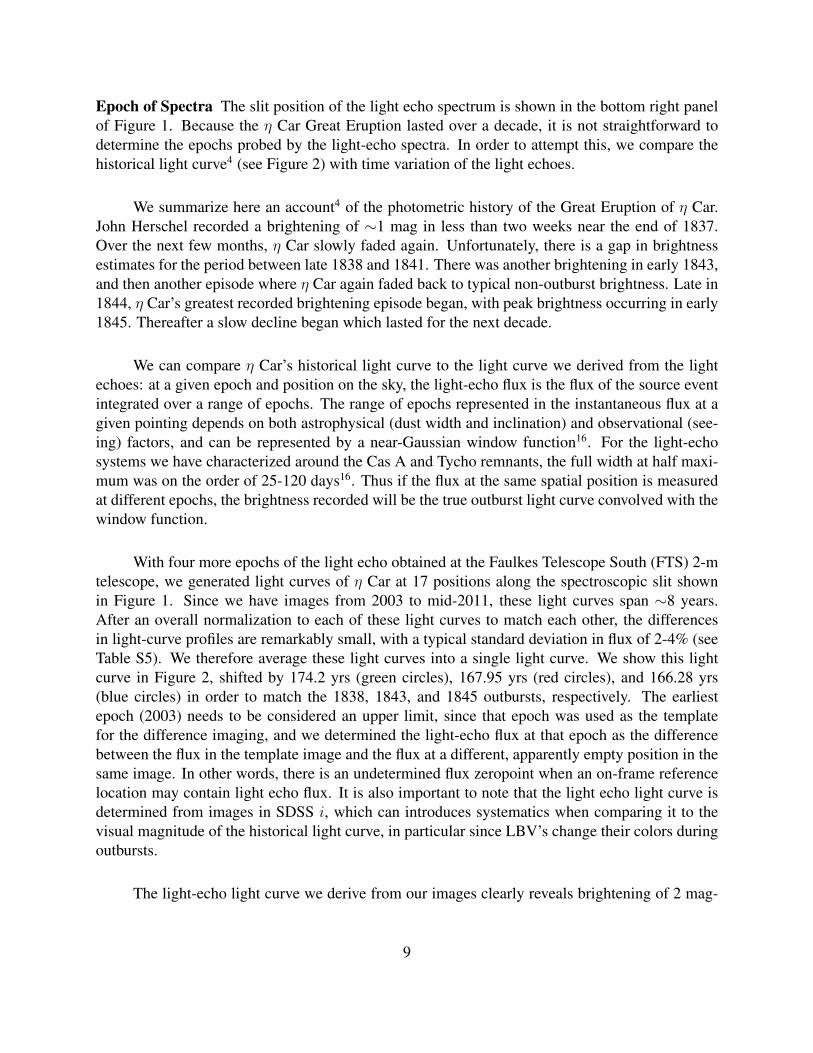
Epoch of Spectra The slit position of the light echo spectrum is shown in the bottom right panelof Figure 1. Because the η Car Great Eruption lasted over a decade, it is not straightforward todetermine the epochs probed by the light-echo spectra. In order to attempt this, we compare thehistorical light curve4 (see Figure 2) with time variation of the light echoes.
We summarize here an account4 of the photometric history of the Great Eruption of η Car.John Herschel recorded a brightening of ∼1 mag in less than two weeks near the end of 1837.Over the next few months, η Car slowly faded again. Unfortunately, there is a gap in brightnessestimates for the period between late 1838 and 1841. There was another brightening in early 1843,and then another episode where η Car again faded back to typical non-outburst brightness. Late in1844, η Car’s greatest recorded brightening episode began, with peak brightness occurring in early1845. Thereafter a slow decline began which lasted for the next decade.
We can compare η Car’s historical light curve to the light curve we derived from the lightechoes: at a given epoch and position on the sky, the light-echo flux is the flux of the source eventintegrated over a range of epochs. The range of epochs represented in the instantaneous flux at agiven pointing depends on both astrophysical (dust width and inclination) and observational (see-ing) factors, and can be represented by a near-Gaussian window function16. For the light-echosystems we have characterized around the Cas A and Tycho remnants, the full width at half maxi-mum was on the order of 25-120 days16. Thus if the flux at the same spatial position is measuredat different epochs, the brightness recorded will be the true outburst light curve convolved with thewindow function.
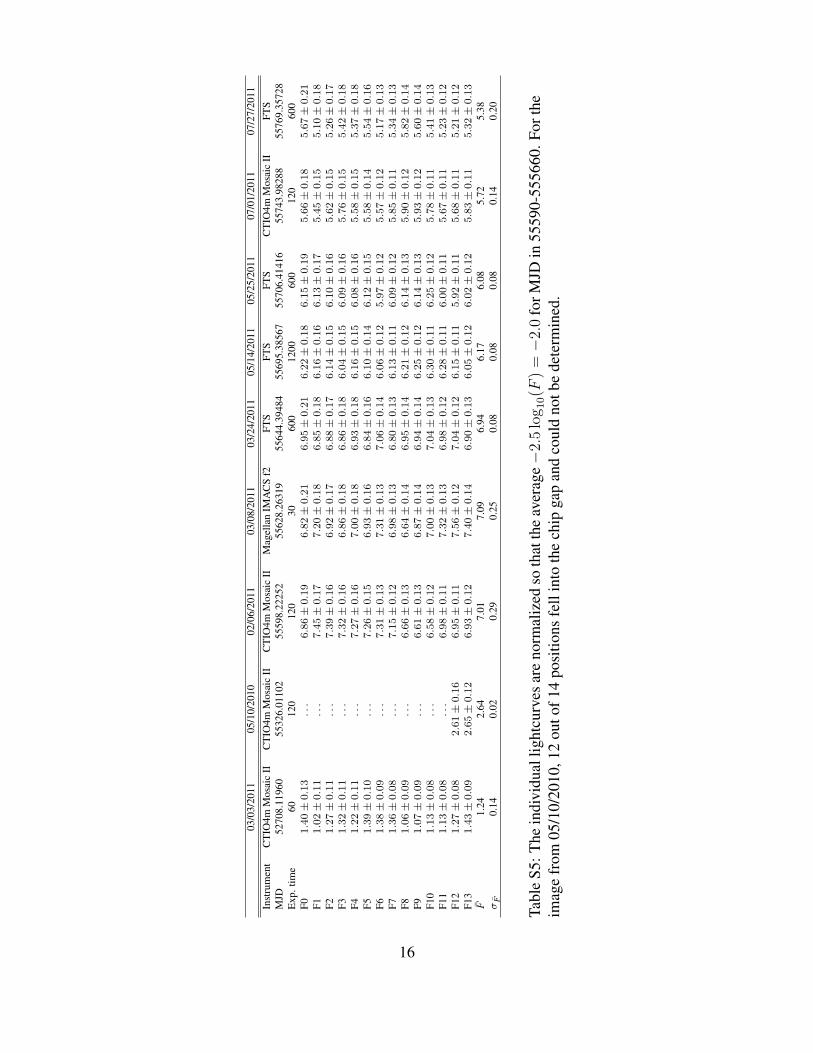
With four more epochs of the light echo obtained at the Faulkes Telescope South (FTS) 2-mtelescope, we generated light curves of η Car at 17 positions along the spectroscopic slit shownin Figure 1. Since we have images from 2003 to mid-2011, these light curves span ∼8 years.After an overall normalization to each of these light curves to match each other, the differencesin light-curve profiles are remarkably small, with a typical standard deviation in flux of 2-4% (seeTable S5). We therefore average these light curves into a single light curve. We show this lightcurve in Figure 2, shifted by 174.2 yrs (green circles), 167.95 yrs (red circles), and 166.28 yrs(blue circles) in order to match the 1838, 1843, and 1845 outbursts, respectively. The earliestepoch (2003) needs to be considered an upper limit, since that epoch was used as the templatefor the difference imaging, and we determined the light-echo flux at that epoch as the differencebetween the flux in the template image and the flux at a different, apparently empty position in thesame image. In other words, there is an undetermined flux zeropoint when an on-frame referencelocation may contain light echo flux. It is also important to note that the light echo light curve isdetermined from images in SDSS i, which can introduces systematics when comparing it to thevisual magnitude of the historical light curve, in particular since LBV’s change their colors duringoutbursts.
The light-echo light curve we derive from our images clearly reveals brightening of 2 mag-
9
nitudes or more within an interval of 8 years. The Lesser Eruption of η Car from 1887 to 1896caused η Car to brighten by roughly 1 magnitude only. Unless the Lesser Eruption was extremelyasymmetric such that it increased by an additional 1 magnitude or more in the direction of the lightecho, the Lesser Eruption is excluded as the source of the light echoes. We also note that most ofthe brightening occurs between the second and third epochs in a 9 month time-span, indicating thatthe peak was at some time between these epochs.
We conclude that there are three remaining eruption scenarios to which our observed lightcurve could be assigned: 1) the 1838 peak, 2) the 1843 peak, and 3) the 1845 peak. A fourth possi-bility is an even earlier, unrecorded brightening. Our ability to decide among the different scenariosrelies on the time differences between our images and spectra. The second- and third-epoch pairhave only 9 months between them and therefore provide strong discrimination for brightenings.The spectroscopic observations were done shortly after the third-epoch images, corresponding to<9 months after a brightness maximum.
We now discuss the individual scenarios and the likelihood that they correspond to the bright-ening observed in our images:
• 1838 peak: The first two epochs agree very well with the historical light curve. The histori-cal light curve seems to decline faster after the peak at the beginning of 1838. Unfortunately,the historical data that constrain this decline are few and have large uncertainties. In addition,if the width of the scattering dust filament is very large, then the window function can spana wide range of epochs, which would cause the light-echo light curve to have a shallowerdecline then the event light curve.
• 1843 peak: The first two epochs again agree very well. The decline in brightness is in verygood agreement with what would be expected from the historical light curve.
• 1845 peak: The first two epochs also agree very well with the 1845 peak. However, the cur-rent decline in brightness (≈0.6 mag yr−1) is considerably faster than the typical decline of≈0.1mag yr−1 observed after 1845. The light-echo light curve can only be put in agreementwith the historical light curve if there was a fast, unobserved decline from the peak in 1845.
We conclude that the most likely source of the light echoes for which we have spectra isthe 1843 outburst, shortly after its peak. Assuming typical dust properties as observed for lightechoes of other Galactic sources 16, the spectra is the light-curve-weighted average over an epochrange of 1-4 months. In the future, we will be able to further constrain the epoch range withadditional imaging data. The two peaks in 1838 and 1845 cannot yet be excluded completely, butcontinued observations of the light echoes at monthly intervals should discriminate the possibilitieswithin a year. This work, combined with targeted new observations and other contemporary imageswhich may become known, will likely provide a detailed photometric time-series of the Great
10
Eruption with the probability of a useful companion spectral time-series. The recovery of valuableastrophysical observational data from the pre-imaging era is another powerful illustration of thepower of light-echo observations
11
Nam
eU
TD
ate
Tele
scop
eIn
stru
men
tEx
ptim
eG
rism
Slitw
idth
Ran
geFW
HM
reso
lutio
nP.
A.
Obs
erve
r(s
ec)
(line
s/m
m)
(��)
(A)
(A)
(deg
)EC
1A20
11/0
4/06
Mag
ella
nI6
.5m
IMA
CS
2×
1800
300
0.9
3800−
1000
04
339
J.Pr
ieto
EC1B
2011
/03/
07M
agel
lan
I6.5
mIM
AC
S2×
1800
200
0.9
4000−
1000
08
324
R.C
horn
ock
&R
.Fol
eyEC
1C20
11/0
4/08
duPo
nt2.
5mW
FCC
D5×
1800
400
1.7
3700−
9200
733
9J.
Prie
to
Tabl
eS1
:Sup
plem
enta
ryIn
form
atio
n:Lo
gof
Spec
trosc
opic
Obs
erva
tions
12
Star Name HD Spectral Type Teff
N Car HD 47306 A0 II 9500HR 4541 HD 102878 A2 Iab 9100. . . HD 34295 A4 II 8800n Vel HD 74272 A5 II 8500y Car HD 97534 A6 Ia 8400HR 3739 HD 81471 A7 Iab 8300ι Car HD 80404 A8 Ib 8200. . . HD 104111 A8 II 8200V399 Car HD 90772 A9 Ia 8000HR 3496 HD 75276 F2 Iab 7480b Vel HD 74180 F3 Ia 7320HR 5024 HD 115778 F4 II 7160ρ Pup HD 67523 F6 II 6600BG Cru HD 108968 F7 Ib/II 6400HR 8470 HD 210848 F7 II 6400δ CMa HD 54605 F8 Iab 6200V810 Cen HD 101947 F9 Iab 5900γ
1 Nor HD 146143 F9 Ia 5900BB Sgr HD 174383 G0 Ib 5500ER Car HD 97082 G1 Iab/Ib 5300. . . HD 136537 G2 II 5100β Crv HD 109379 G5 II 4830. . . HD 125809 G5/G6 Ib 4790HR 3673 HD 79698 G6 II 4750τ Leo HD 99648 G8 Iab 4590d Cen HD 117440 G9 Ib 4500HR 3583 HD 77020 G9 II 4500HR 554 HD 11643 K1 II 4400� Peg HD 206778 K2 Ib 43003 Cet HD 225212 K3 Iab 4000HR 611 HD 12642 K5 Iab 3750HR 2508 HD 49331 M1 Iab 3450V528 Car HD 95950 M2 Ib 3350CR Cir HD 131217 M2/M3 II 3300
Table S2: Supplementary Information: UVES Supergiant Stellar Spectra Library17. Weconvert the spectral type into the effective temperature Teff using the spectral-type totemperature relation for supergiants 30
13
Star Name HD Spectral Type T0 Teff
5 Per HD 13267 B5 Ia 13800 13700ν Cep HD 207260 A2 Ia 9100 9100φ Cas HD 7927 F0 Ia 7425 7800ν Aql HD 182835 F2 Ib 7350 748044 Cyg HD 195593 F5 Iab 6600 700035 Cyg HD 193370 F6 Ib 6200 6600V440 Per HD 14662 F7 Ib 5900 6400HR 7008 HD 172365 F8 Ib-II 5500 6200. . . HD 18391 G0 Ia 5500 5500HR 7456 HD 185018 G0 Ib 5550 550014 Per HD 16901 G0 Ib-II 5478 5500HR 3459 HD 74395 G2 Iab 5250 5100β Dra HD 159181 G2 Iab 5250 5100. . . HD 187299 G5 Ia 5010 4830β Lep HD 36079 G5 II 5170 4830ξ Pup HD 63700 G6 Ia 4990 4750ξ
1 Cet HD 13611 G8 Iab 5040 4590. . . HD 12014 K0 Ib 5173 4450ζ Cep HD 210745 K1.5 Ib 4500 4350γ
1 And HD 12533 K3 IIb 4383 400041 Gem HD 52005 K4 Iab 4116 3900V809 Cas HD 219978 K4.5 Ib 4250 3825α Ori HD 39801 M2 Iab 3614 3350
Table S3: Supplementary Information: Ca II IR triplet Supergiant Stellar Spectra Library18.The temperature T0 is the effective temperature quoted by Cenarro et al.18. For consis-tency we also calculate Teff using the same stellar type-temperature relation30 we usedfor the UVES spectral library.
14
Line λmin λmax
O I 5577.4 5572 5582Na I D 5890.0, 5895.9 5860 5921O I 6300.2 6295 6305O I 6363.9 6359 6369
Table S4: List of the fore/background emission lines which are excluded from the 5050-6500 Awavelength range of the correlation analysis. For each spectroscopic line, λmin
and λmax define the initial and final wavelengths in A of the contaminating line region weexclude.
15
03/0
3/20
1105
/10/
2010
02/0
6/20
1103
/08/
2011
03/2
4/20
1105
/14/
2011
05/2
5/20
1107
/01/
2011
07/2
7/20
11In
stru
men
tC
TIO
4mM
osai
cII
CTI
O4m
Mos
aic
IIC
TIO
4mM
osai
cII
Mag
ella
nIM
AC
Sf2
FTS
FTS
FTS
CTI
O4m
Mos
aic
IIFT
SM
JD52
708.
1196
055
326.
0110
255
598.
2225
255
628.
2631
955
644.
3948
455
695.
3856
755
706.
4141
655
743.
9828
855
769.
3572
8Ex
p.tim
e60
120
120
3060
012
0060
012
060
0F0
1.40±
0.13
...
6.86±
0.19
6.82±
0.21
6.95±
0.21
6.22±
0.18
6.15±
0.19
5.66±
0.18
5.67±
0.21
F11.
02±
0.11
...
7.45±
0.17
7.20±
0.18
6.85±
0.18
6.16±
0.16
6.13±
0.17
5.45±
0.15
5.10±
0.18
F21.
27±
0.11
...
7.39±
0.16
6.92±
0.17
6.88±
0.17
6.14±
0.15
6.10±
0.16
5.62±
0.15
5.26±
0.17
F31.
32±
0.11
...
7.32±
0.16
6.86±
0.18
6.86±
0.18
6.04±
0.15
6.09±
0.16
5.76±
0.15
5.42±
0.18
F41.
22±
0.11
...
7.27±
0.16
7.00±
0.18
6.93±
0.18
6.16±
0.15
6.08±
0.16
5.58±
0.15
5.37±
0.18
F51.
39±
0.10
...
7.26±
0.15
6.93±
0.16
6.84±
0.16
6.10±
0.14
6.12±
0.15
5.58±
0.14
5.54±
0.16
F61.
38±
0.09
...
7.31±
0.13
7.31±
0.13
7.06±
0.14
6.06±
0.12
5.97±
0.12
5.57±
0.12
5.17±
0.13
F71.
36±
0.08
...
7.15±
0.12
6.98±
0.13
6.80±
0.13
6.13±
0.11
6.09±
0.12
5.85±
0.11
5.34±
0.13
F81.
06±
0.09
...
6.66±
0.13
6.64±
0.14
6.95±
0.14
6.21±
0.12
6.14±
0.13
5.90±
0.12
5.82±
0.14
F91.
07±
0.09
...
6.61±
0.13
6.87±
0.14
6.94±
0.14
6.25±
0.12
6.14±
0.13
5.93±
0.12
5.60±
0.14
F10
1.13±
0.08
...
6.58±
0.12
7.00±
0.13
7.04±
0.13
6.30±
0.11
6.25±
0.12
5.78±
0.11
5.41±
0.13
F11
1.13±
0.08
...
6.98±
0.11
7.32±
0.13
6.98±
0.12
6.28±
0.11
6.00±
0.11
5.67±
0.11
5.23±
0.12
F12
1.27±
0.08
2.61±
0.16
6.95±
0.11
7.56±
0.12
7.04±
0.12
6.15±
0.11
5.92±
0.11
5.68±
0.11
5.21±
0.12
F13
1.43±
0.09
2.65±
0.12
6.93±
0.12
7.40±
0.14
6.90±
0.13
6.05±
0.12
6.02±
0.12
5.83±
0.11
5.32±
0.13
F1.
242.
647.
017.
096.
946.
176.
085.
725.
38σ
F0.
140.
020.
290.
250.
080.
080.
080.
140.
20
Tabl
eS5
:The
indi
vidu
allig
htcu
rves
are
norm
aliz
edso
that
the
aver
age−
2.5
log 1
0(F
)=−
2.0
forM
JDin
5559
0-55
5660
.For
the
imag
efr
om05
/10/
2010
,12
outo
f14
posi
tions
fell
into
the
chip
gap
and
coul
dno
tbe
dete
rmin
ed.
16
1. Davidson, K. & Humphreys, R. M. Eta Carinae and Its Environment. Annu. Rev. Astron. Astr.35, 1–32 (1997).
2. Damineli, A. The 5.52 Year Cycle of Eta Carinae. Astrophys. J. 460, L49+ (1996).
3. Smith, N. The Structure of the Homunculus. I. Shape and Latitude Dependence from H2 and[Fe II] Velocity Maps of η Carinae. Astrophys. J. 644, 1151–1163 (2006).
4. Smith, N. & Frew, D. J. A revised historical light curve of Eta Carinae and the timing of closeperiastron encounters. Mon. Not. R. Astron. Soc. 1097–+ (2011).
5. Smith, N. et al. Mass and Kinetic Energy of the Homunculus Nebula around η Carinae. Astron.J. 125, 1458–1466 (2003).
6. Smith, N. A blast wave from the 1843 eruption of � Carinae. Nature 455, 201–203 (2008).
7. Goodrich, R. W., Stringfellow, G. S., Penrod, G. D. & Filippenko, A. V. SN 1961V - anextragalactic ETA Carinae analog. Astrophys. J. 342, 908–916 (1989).
8. Humphreys, R. M. & Davidson, K. The luminous blue variables: Astrophysical geysers. Publ.Astron. Soc. Pac. 106, 1025–1051 (1994).
9. Humphreys, R. M., Davidson, K. & Smith, N. Eta Carinae’s Second Eruption and the LightCurves of the eta Carinae Variables. Publ. Astron. Soc. Pac. 111, 1124–1131 (1999).
10. Van Dyk, S. D. et al. SN 1997bs in M66: Another Extragalactic η Carinae Analog? Publ.Astron. Soc. Pac. 112, 1532–1541 (2000). arXiv:astro-ph/0009027.
11. Vink, J. S. Eta Carinae and the Luminous Blue Variables. ArXiv e-prints (2009). 0905.3338.
12. Kashi, A., Frankowski, A. & Soker, N. NGC 300 OT2008-1 as a Scaled-down Version of theEta Carinae Great Eruption. Astrophys. J. 709, L11–L15 (2010).
13. Smith, N., Li, W., Silverman, J. M., Ganeshalingam, M. & Filippenko, A. V. Luminous bluevariable eruptions and related transients: diversity of progenitors and outburst properties. Mon.Not. R. Astron. Soc. 415, 773–810 (2011).
14. Rest, A. et al. Light echoes from ancient supernovae in the Large Magellanic Cloud. Nature438, 1132–1134 (2005).
15. Rest, A. et al. Scattered-Light Echoes from the Historical Galactic Supernovae Cassiopeia Aand Tycho (SN 1572). Astrophys. J. 681, L81–L84 (2008).
16. Rest, A. et al. On the Interpretation of Supernova Light Echo Profiles and Spectra. Astrophys.J. 732, 2–+ (2011).
17. Bagnulo, S. et al. The UVES Paranal Observatory Project: A Library of High- ResolutionSpectra of Stars across the Hertzsprung-Russell Diagram. The Messenger 114, 10–14 (2003).
17
18. Cenarro, A. J. et al. Empirical calibration of the near-infrared Ca ii triplet - I. The stellarlibrary and index definition. Mon. Not. R. Astron. Soc. 326, 959–980 (2001).
19. Smith, N., Vink, J. S. & de Koter, A. The Missing Luminous Blue Variables and the BistabilityJump. Astrophys. J. 615, 475–484 (2004).
20. Davidson, K. The relation between apparent temperature and mass-loss rate in hypergianteruptions. Astrophys. J. 317, 760–764 (1987).
21. Le Sueur, A. On the Nebulae of Argo and Orion, and on the Spectrum of Jupiter. RoyalSociety of London Proceedings Series I 18, 245–250 (1869).
22. Le Sueur, A. Observations with the Great Melbourne Telescope, in a Letter to Prof. Stokes.Royal Society of London Proceedings Series I 19, 18–19 (1870).
23. Walborn, N. R. & Liller, M. H. The earliest spectroscopic observations of eta Carinae and itsinteraction with the Carina Nebula. Astrophys. J. 211, 181–183 (1977).
24. Humphreys, R. M., Davidson, K. & Koppelman, M. The Early Spectra of Eta Carinae 1892to 1941 and the Onset of its High Excitation Emission Spectrum. Astron. J. 135, 1249–1263(2008).
25. Smith, N. Doppler tomography of the Little Homunculus: high-resolution spectra of[FeII]λ16435 around Eta Carinae∗. Mon. Not. R. Astron. Soc. 357, 1330–1336 (2005).
26. Smith, N. et al. Discovery of Precursor Luminous Blue Variable Outbursts in Two Recent Op-tical Transients: The Fitfully Variable Missing Links UGC 2773-OT and SN 2009ip. Astron.J. 139, 1451–1467 (2010).
27. Foley, R. J. et al. The Diversity of Massive Star Outbursts. I. Observations of SN2009ip, UGC2773 OT2009-1, and Their Progenitors . Astrophys. J. 732, 32–+ (2011).
28. Frew, D. J. The Historical Record of η Carinae I. The Visual Light Curve, 1595-2000. Journalof Astronomical Data 10, 6–+ (2004).
29. Walborn, N. R., Danks, A. C., Vieira, G. & Landsman, W. B. Space Telescope Imaging Spec-trograph Observations of High-Velocity Interstellar Absorption-Line Profiles in the CarinaNebula. Astrophys. J. Sup. 140, 407–456 (2002).
30. Humphreys, R. M. & McElroy, D. B. The initial mass function for massive stars in the Galaxyand the Magellanic Clouds. Astrophys. J. 284, 565–577 (1984).
31. Couderc, P. Les aureoles lumineuses des Novae. Annales d’Astrophysique 2, 271 (1939).
18
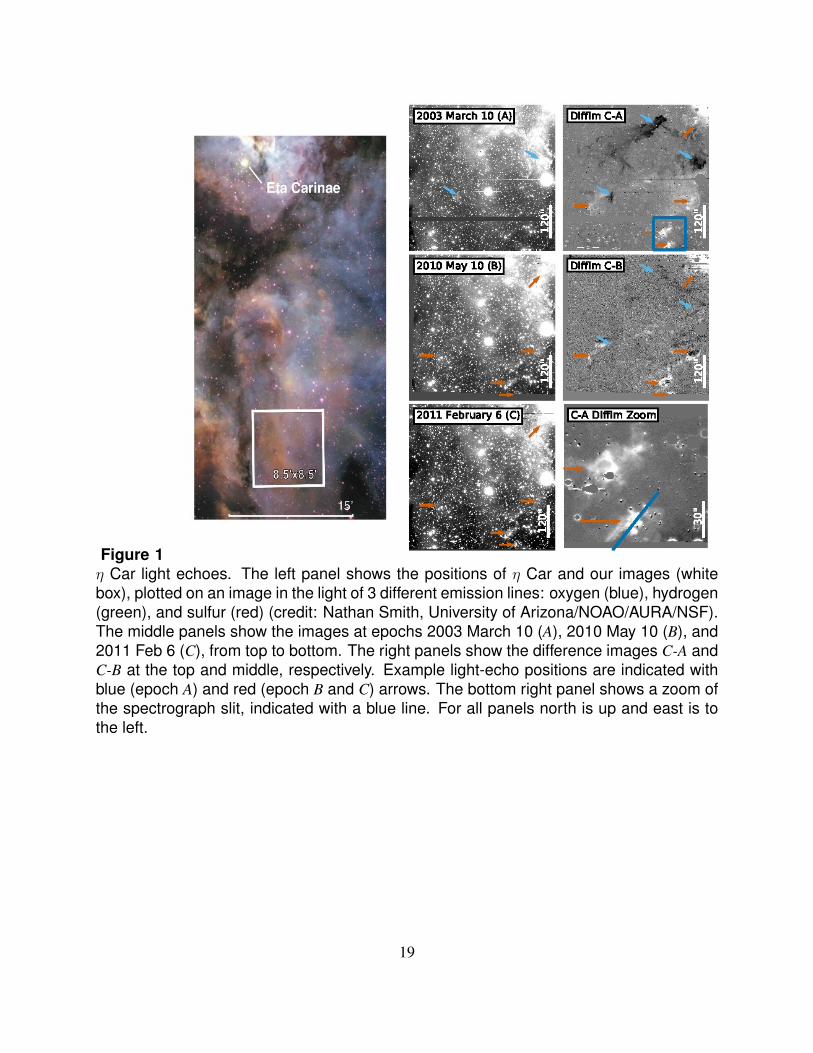
Figure 1η Car light echoes. The left panel shows the positions of η Car and our images (whitebox), plotted on an image in the light of 3 different emission lines: oxygen (blue), hydrogen(green), and sulfur (red) (credit: Nathan Smith, University of Arizona/NOAO/AURA/NSF).The middle panels show the images at epochs 2003 March 10 (A), 2010 May 10 (B), and2011 Feb 6 (C), from top to bottom. The right panels show the difference images C-A andC-B at the top and middle, respectively. Example light-echo positions are indicated withblue (epoch A) and red (epoch B and C) arrows. The bottom right panel shows a zoom ofthe spectrograph slit, indicated with a blue line. For all panels north is up and east is tothe left.
19
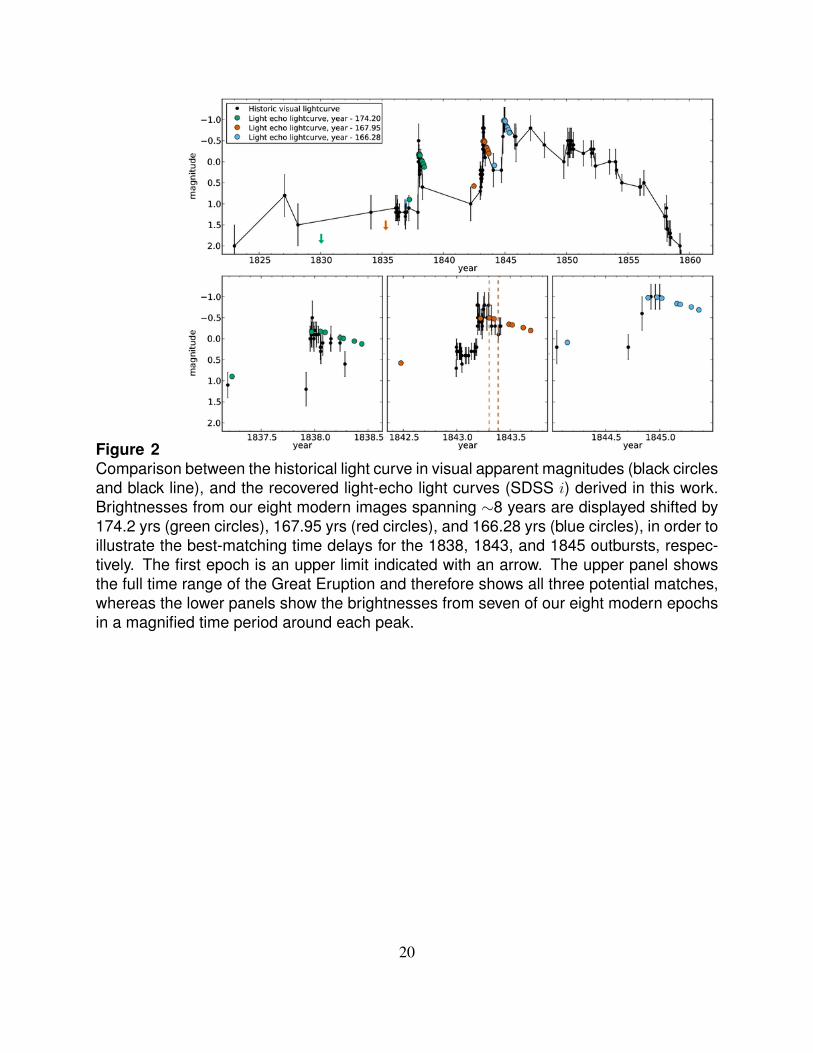
Figure 2Comparison between the historical light curve in visual apparent magnitudes (black circlesand black line), and the recovered light-echo light curves (SDSS i) derived in this work.Brightnesses from our eight modern images spanning ∼8 years are displayed shifted by174.2 yrs (green circles), 167.95 yrs (red circles), and 166.28 yrs (blue circles), in order toillustrate the best-matching time delays for the 1838, 1843, and 1845 outbursts, respec-tively. The first epoch is an upper limit indicated with an arrow. The upper panel showsthe full time range of the Great Eruption and therefore shows all three potential matches,whereas the lower panels show the brightnesses from seven of our eight modern epochsin a magnified time period around each peak.
20
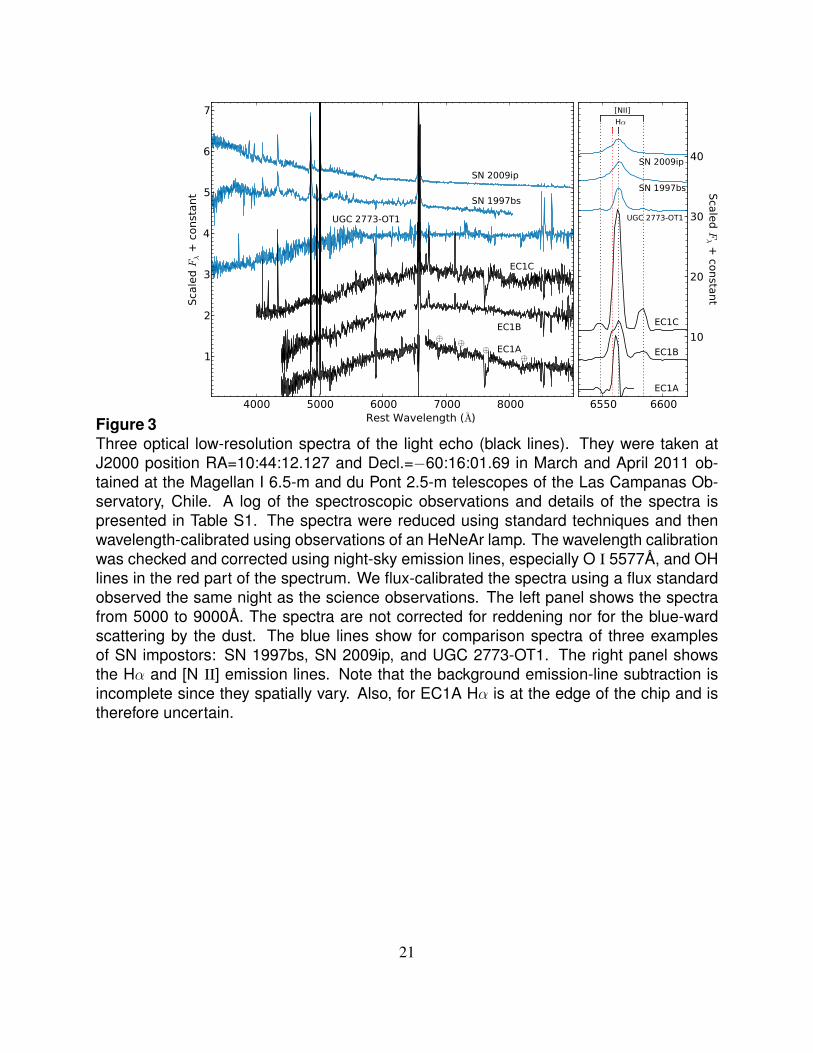
Figure 3Three optical low-resolution spectra of the light echo (black lines). They were taken atJ2000 position RA=10:44:12.127 and Decl.=−60:16:01.69 in March and April 2011 ob-tained at the Magellan I 6.5-m and du Pont 2.5-m telescopes of the Las Campanas Ob-servatory, Chile. A log of the spectroscopic observations and details of the spectra ispresented in Table S1. The spectra were reduced using standard techniques and thenwavelength-calibrated using observations of an HeNeAr lamp. The wavelength calibrationwas checked and corrected using night-sky emission lines, especially O I 5577A, and OHlines in the red part of the spectrum. We flux-calibrated the spectra using a flux standardobserved the same night as the science observations. The left panel shows the spectrafrom 5000 to 9000A. The spectra are not corrected for reddening nor for the blue-wardscattering by the dust. The blue lines show for comparison spectra of three examplesof SN impostors: SN 1997bs, SN 2009ip, and UGC 2773-OT1. The right panel showsthe Hα and [N II] emission lines. Note that the background emission-line subtraction isincomplete since they spatially vary. Also, for EC1A Hα is at the edge of the chip and istherefore uncertain.
21
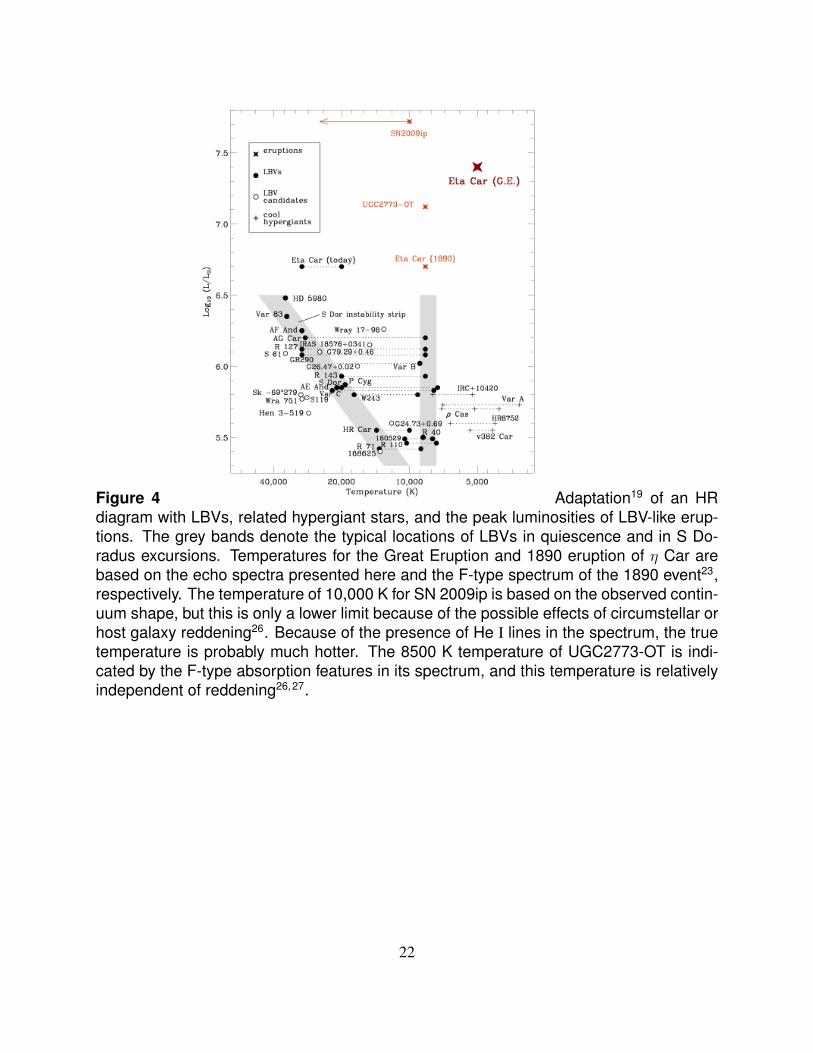
Figure 4 Adaptation19 of an HRdiagram with LBVs, related hypergiant stars, and the peak luminosities of LBV-like erup-tions. The grey bands denote the typical locations of LBVs in quiescence and in S Do-radus excursions. Temperatures for the Great Eruption and 1890 eruption of η Car arebased on the echo spectra presented here and the F-type spectrum of the 1890 event23,respectively. The temperature of 10,000 K for SN 2009ip is based on the observed contin-uum shape, but this is only a lower limit because of the possible effects of circumstellar orhost galaxy reddening26. Because of the presence of He I lines in the spectrum, the truetemperature is probably much hotter. The 8500 K temperature of UGC2773-OT is indi-cated by the F-type absorption features in its spectrum, and this temperature is relativelyindependent of reddening26,27.
22
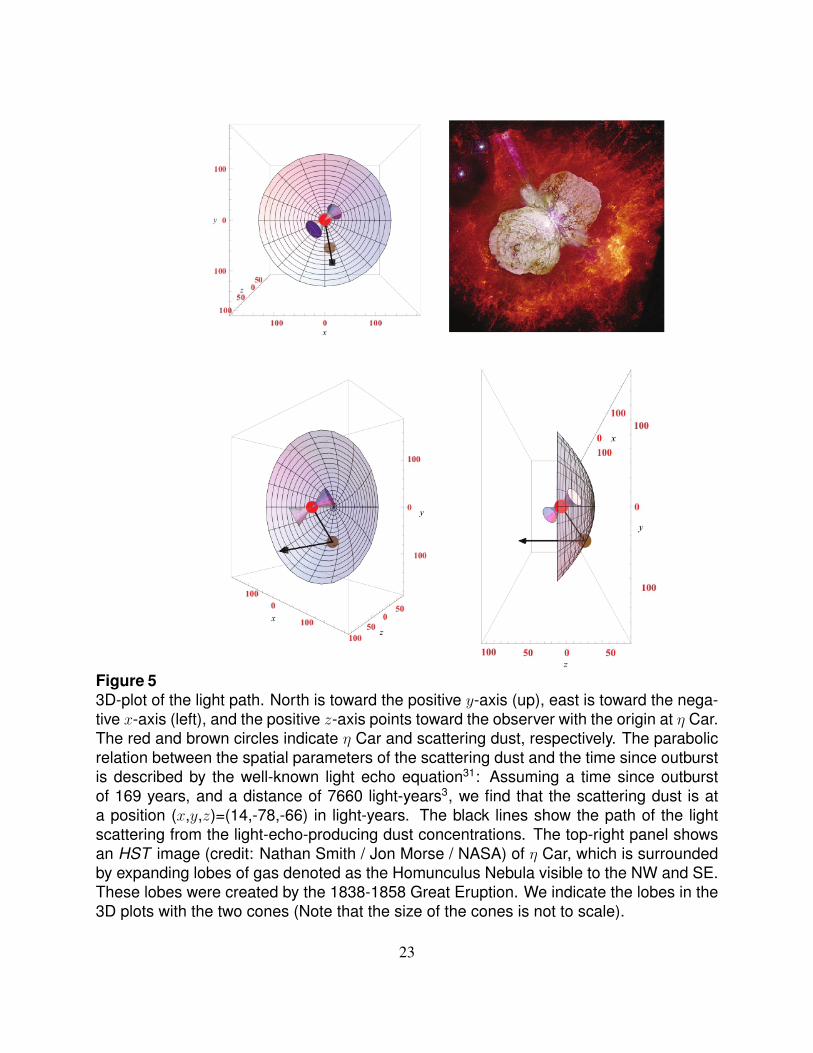
Figure 5 bla3D-plot of the light path. North is toward the positive y-axis (up), east is toward the nega-tive x-axis (left), and the positive z-axis points toward the observer with the origin at η Car.The red and brown circles indicate η Car and scattering dust, respectively. The parabolicrelation between the spatial parameters of the scattering dust and the time since outburstis described by the well-known light echo equation31: Assuming a time since outburstof 169 years, and a distance of 7660 light-years3, we find that the scattering dust is ata position (x,y,z)=(14,-78,-66) in light-years. The black lines show the path of the lightscattering from the light-echo-producing dust concentrations. The top-right panel showsan HST image (credit: Nathan Smith / Jon Morse / NASA) of η Car, which is surroundedby expanding lobes of gas denoted as the Homunculus Nebula visible to the NW and SE.These lobes were created by the 1838-1858 Great Eruption. We indicate the lobes in the3D plots with the two cones (Note that the size of the cones is not to scale).
23
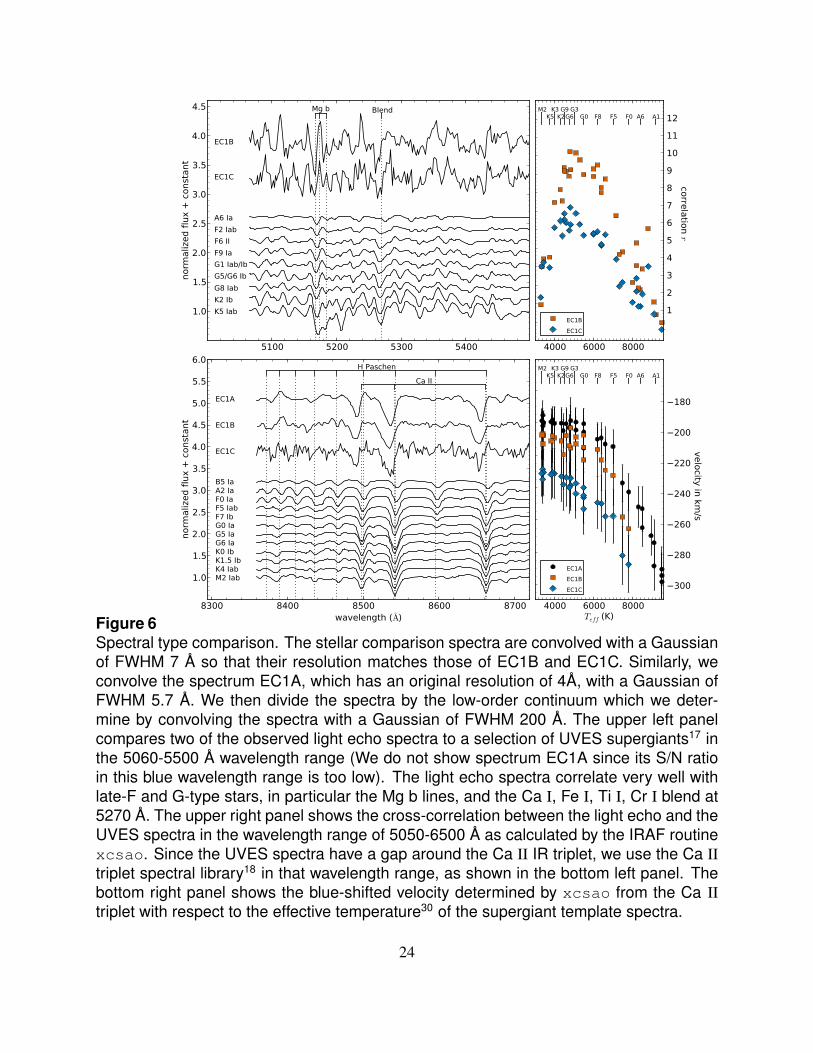
Figure 6 blaSpectral type comparison. The stellar comparison spectra are convolved with a Gaussianof FWHM 7 A so that their resolution matches those of EC1B and EC1C. Similarly, weconvolve the spectrum EC1A, which has an original resolution of 4A, with a Gaussian ofFWHM 5.7 A. We then divide the spectra by the low-order continuum which we deter-mine by convolving the spectra with a Gaussian of FWHM 200 A. The upper left panelcompares two of the observed light echo spectra to a selection of UVES supergiants17 inthe 5060-5500 A wavelength range (We do not show spectrum EC1A since its S/N ratioin this blue wavelength range is too low). The light echo spectra correlate very well withlate-F and G-type stars, in particular the Mg b lines, and the Ca I, Fe I, Ti I, Cr I blend at5270 A. The upper right panel shows the cross-correlation between the light echo and theUVES spectra in the wavelength range of 5050-6500 A as calculated by the IRAF routinexcsao. Since the UVES spectra have a gap around the Ca II IR triplet, we use the Ca IItriplet spectral library18 in that wavelength range, as shown in the bottom left panel. Thebottom right panel shows the blue-shifted velocity determined by xcsao from the Ca IItriplet with respect to the effective temperature30 of the supergiant template spectra.
24
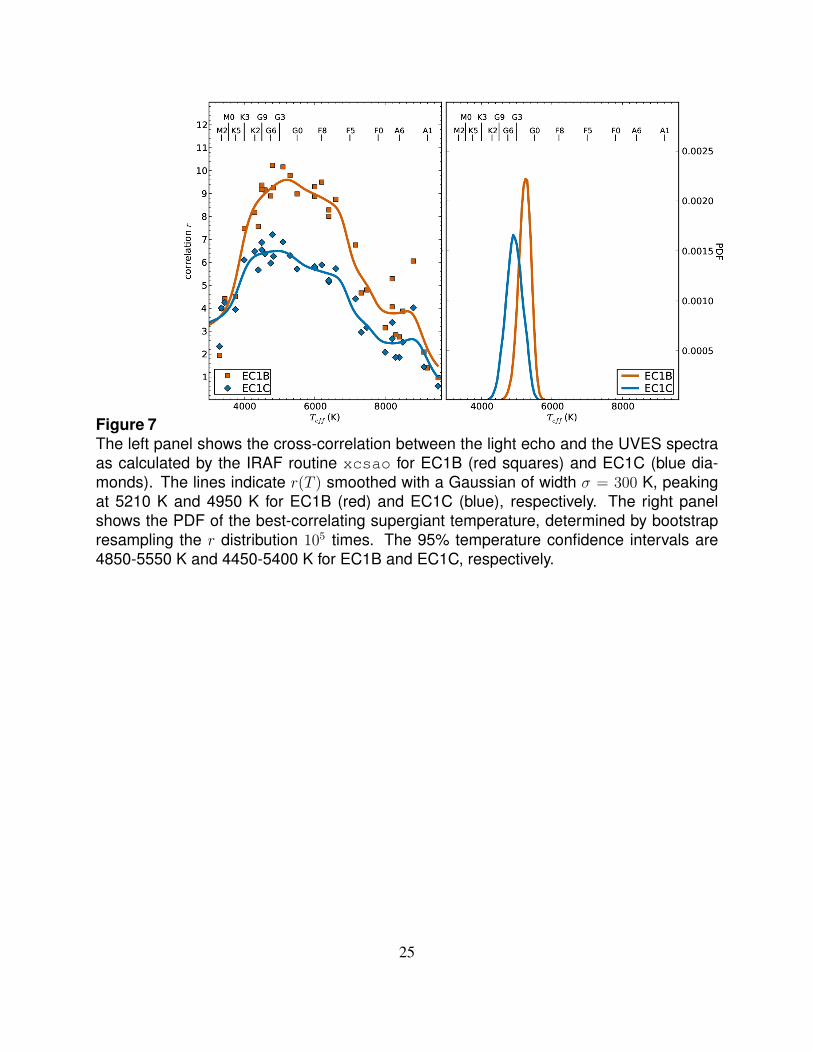
Figure 7The left panel shows the cross-correlation between the light echo and the UVES spectraas calculated by the IRAF routine xcsao for EC1B (red squares) and EC1C (blue dia-monds). The lines indicate r(T ) smoothed with a Gaussian of width σ = 300 K, peakingat 5210 K and 4950 K for EC1B (red) and EC1C (blue), respectively. The right panelshows the PDF of the best-correlating supergiant temperature, determined by bootstrapresampling the r distribution 105 times. The 95% temperature confidence intervals are4850-5550 K and 4450-5400 K for EC1B and EC1C, respectively.
25
![[Econ] PPT by Kittycolz -- Pure Competition McConnel 16th-19th Edition](https://static.fdocument.org/doc/165x107/58aafdc81a28abd35e8b5513/econ-ppt-by-kittycolz-pure-competition-mcconnel-16th-19th-edition.jpg)