SpectrophotometricEstimationofFlutamideinPureandin...
8
International Scholarly Research Network ISRN Spectroscopy Volume 2012, Article ID 728594, 7 pages doi:10.5402/2012/728594 Research Article Spectrophotometric Estimation of Flutamide in Pure and in Pharmaceutical Preparations Hemavathi Nagaraju Deepakumari and Hosakere Doddarevanna Revanasiddappa Department of Chemistry, University of Mysore, Manasagangotri, Mysore 570006, India Correspondence should be addressed to Hosakere Doddarevanna Revanasiddappa, [email protected] Received 9 October 2012; Accepted 27 October 2012 Academic Editors: T. Stafilov and Y. Ueno Copyright © 2012 H. N. Deepakumari and H. D. Revanasiddappa. This is an open access article distributed under the Creative Commons Attribution License, which permits unrestricted use, distribution, and reproduction in any medium, provided the original work is properly cited. Three simple, rapid, precise, sensitive, and accurate visible spectrophotometric methods (A, B, and C) are described for the estimation of flutamide in both pure and pharmaceutical preparations. They are based on the diazotization of reduced flutamide (FA) with nitrous acid followed by coupling with acetyl acetone (method A), citrazinic acid (method B), and 8-hydroxyquinoline (method C) to form colored azo dyes, exhibiting absorption maxima (λ max ) at 410, 440 and 500 nm, for methods A, B, and C, respectively. Linear concentration range was of 0.5–12, 0.5–10, and 0.3–10 μg/mL for methods A, B, and C, respectively, and the corresponding molar absorptivity values are 2.23 × 10 4 ,2.04 × 10 4 , and 1.35 × 10 4 L mol −1 cm −1 . The correlation coefficients for FA are 0.9988, 0.9976, and 0.9975 for methods A, B, and C, respectively. All variables were optimized, and the results were statistically compared with those of a literature method by employing Student’s t -test and F-test. No interference was observed from common adjuvants normally added to the tablets. The relative standard deviations (n = 5) for FA in all the three methods in the tablets are always less than 3%. 1. Introduction Flutamide (FA), chemically known as 2-methyl-N-[4-nitro- 3-(trifluoromethyl)phenyl]-propanamide (Figure 1), is a potent nonsteroidal antiandrogen drug primarily used to treat prostatic cancer [1–3]. FA competes with testosterone and its powerful metabolite, dihydrotestosterone (DHT) for binding to androgen receptors in the prostate gland thereby, and it inhibits the prostate cancer cells to grow. Flutamide has been largely replaced by a newer member of this class, bicalutamide, due to a better side-effect profile. Flutamide may also be used to treat excess androgen levels in women— especially those with polycystic ovarian syndrome (PCOS) [4]. This drug and its primary hydroxy metabolite decrease metabolism of C-19 steroids by the cytochrome P-450 system at the target cells in the secondary sex organ [5]. The official method for its determination is liquid chromatography reported in European Pharmacopoeia [6]. Different analytical methods for the quantitative deter- mination of FA in pure form, in pharmaceutical preparations and in biological fluids, including HPLC [7–9], electrochem- ical reduction [10], stripping voltammetry [11], spectroflu- orometry [12], and spectrophotometry [13–15] have been reported. The reported chromatographic techniques [7–9] require expensive experimental setup and are not affordable in every laboratory for routine analysis. The stripping voltammetric technique [11] requires sophisticated instru- mentation, and involvement of scrupulous experimental conditions, whereas the reported spectrfluorimetric method [12] is less sensitive, and the cited spectrophotometric meth- ods have some disadvantages such as less sensitivity, poorer selectivity [13, 15], and requires extraction step [14] for FA determination. Thus, there is a need to develop sensitive, accurate, and cost-effective methods for its determination. The present paper proposes three simple, sensitive, and inexpensive methods which allow a quick determination of FA in pure form and in dosage forms. The developed three visible spectrophotometric methods are based on diazo- coupling reactions using acetyl acetone (AA), citrazinic acid (CZA), and 8-hydroxyquinoline (HQ) as the coupling agents.
-
Upload
truongdiep -
Category
Documents
-
view
214 -
download
0
Transcript of SpectrophotometricEstimationofFlutamideinPureandin...
International Scholarly Research NetworkISRN SpectroscopyVolume 2012, Article ID 728594, 7 pagesdoi:10.5402/2012/728594
Research Article
Spectrophotometric Estimation of Flutamide in Pure and inPharmaceutical Preparations
Hemavathi Nagaraju Deepakumari and Hosakere Doddarevanna Revanasiddappa
Department of Chemistry, University of Mysore, Manasagangotri, Mysore 570006, India
Correspondence should be addressed to Hosakere Doddarevanna Revanasiddappa, [email protected]
Received 9 October 2012; Accepted 27 October 2012
Academic Editors: T. Stafilov and Y. Ueno
Copyright © 2012 H. N. Deepakumari and H. D. Revanasiddappa. This is an open access article distributed under the CreativeCommons Attribution License, which permits unrestricted use, distribution, and reproduction in any medium, provided theoriginal work is properly cited.
Three simple, rapid, precise, sensitive, and accurate visible spectrophotometric methods (A, B, and C) are described for theestimation of flutamide in both pure and pharmaceutical preparations. They are based on the diazotization of reduced flutamide(FA) with nitrous acid followed by coupling with acetyl acetone (method A), citrazinic acid (method B), and 8-hydroxyquinoline(method C) to form colored azo dyes, exhibiting absorption maxima (λmax) at 410, 440 and 500 nm, for methods A, B, and C,respectively. Linear concentration range was of 0.5–12, 0.5–10, and 0.3–10 μg/mL for methods A, B, and C, respectively, and thecorresponding molar absorptivity values are 2.23×10⁴, 2.04×10⁴, and 1.35×10⁴ L mol−1 cm−1. The correlation coefficients for FAare 0.9988, 0.9976, and 0.9975 for methods A, B, and C, respectively. All variables were optimized, and the results were statisticallycompared with those of a literature method by employing Student’s t-test and F-test. No interference was observed from commonadjuvants normally added to the tablets. The relative standard deviations (n = 5) for FA in all the three methods in the tablets arealways less than 3%.
1. Introduction
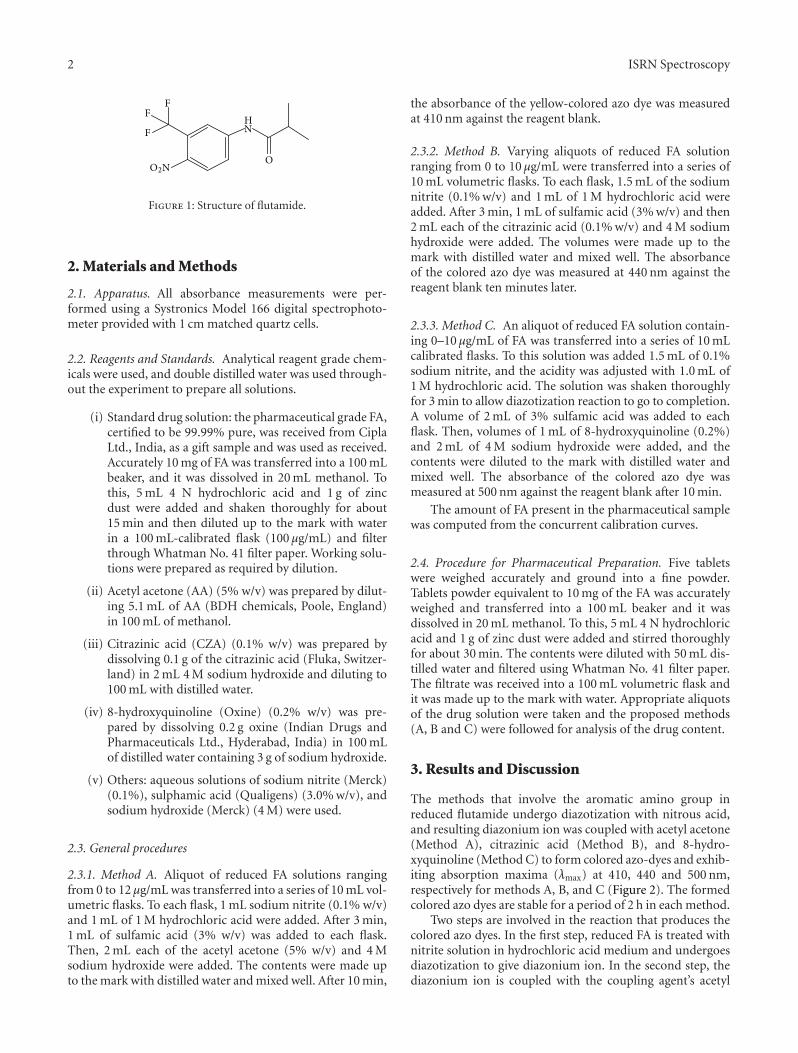
Flutamide (FA), chemically known as 2-methyl-N-[4-nitro-3-(trifluoromethyl)phenyl]-propanamide (Figure 1), is apotent nonsteroidal antiandrogen drug primarily used totreat prostatic cancer [1–3]. FA competes with testosteroneand its powerful metabolite, dihydrotestosterone (DHT) forbinding to androgen receptors in the prostate gland thereby,and it inhibits the prostate cancer cells to grow. Flutamidehas been largely replaced by a newer member of this class,bicalutamide, due to a better side-effect profile. Flutamidemay also be used to treat excess androgen levels in women—especially those with polycystic ovarian syndrome (PCOS)[4]. This drug and its primary hydroxy metabolite decreasemetabolism of C-19 steroids by the cytochrome P-450 systemat the target cells in the secondary sex organ [5]. The officialmethod for its determination is liquid chromatographyreported in European Pharmacopoeia [6].
Different analytical methods for the quantitative deter-mination of FA in pure form, in pharmaceutical preparations
and in biological fluids, including HPLC [7–9], electrochem-ical reduction [10], stripping voltammetry [11], spectroflu-orometry [12], and spectrophotometry [13–15] have beenreported. The reported chromatographic techniques [7–9]require expensive experimental setup and are not affordablein every laboratory for routine analysis. The strippingvoltammetric technique [11] requires sophisticated instru-mentation, and involvement of scrupulous experimentalconditions, whereas the reported spectrfluorimetric method[12] is less sensitive, and the cited spectrophotometric meth-ods have some disadvantages such as less sensitivity, poorerselectivity [13, 15], and requires extraction step [14] for FAdetermination. Thus, there is a need to develop sensitive,accurate, and cost-effective methods for its determination.
The present paper proposes three simple, sensitive, andinexpensive methods which allow a quick determination ofFA in pure form and in dosage forms. The developed threevisible spectrophotometric methods are based on diazo-coupling reactions using acetyl acetone (AA), citrazinic acid(CZA), and 8-hydroxyquinoline (HQ) as the coupling agents.
2 ISRN Spectroscopy
O2N
F
FF
NH
O
Figure 1: Structure of flutamide.
2. Materials and Methods
2.1. Apparatus. All absorbance measurements were per-formed using a Systronics Model 166 digital spectrophoto-meter provided with 1 cm matched quartz cells.
2.2. Reagents and Standards. Analytical reagent grade chem-icals were used, and double distilled water was used through-out the experiment to prepare all solutions.
(i) Standard drug solution: the pharmaceutical grade FA,certified to be 99.99% pure, was received from CiplaLtd., India, as a gift sample and was used as received.Accurately 10 mg of FA was transferred into a 100 mLbeaker, and it was dissolved in 20 mL methanol. Tothis, 5 mL 4 N hydrochloric acid and 1 g of zincdust were added and shaken thoroughly for about15 min and then diluted up to the mark with waterin a 100 mL-calibrated flask (100 μg/mL) and filterthrough Whatman No. 41 filter paper. Working solu-tions were prepared as required by dilution.
(ii) Acetyl acetone (AA) (5% w/v) was prepared by dilut-ing 5.1 mL of AA (BDH chemicals, Poole, England)in 100 mL of methanol.
(iii) Citrazinic acid (CZA) (0.1% w/v) was prepared bydissolving 0.1 g of the citrazinic acid (Fluka, Switzer-land) in 2 mL 4 M sodium hydroxide and diluting to100 mL with distilled water.
(iv) 8-hydroxyquinoline (Oxine) (0.2% w/v) was pre-pared by dissolving 0.2 g oxine (Indian Drugs andPharmaceuticals Ltd., Hyderabad, India) in 100 mLof distilled water containing 3 g of sodium hydroxide.
(v) Others: aqueous solutions of sodium nitrite (Merck)(0.1%), sulphamic acid (Qualigens) (3.0% w/v), andsodium hydroxide (Merck) (4 M) were used.
2.3. General procedures
2.3.1. Method A. Aliquot of reduced FA solutions rangingfrom 0 to 12 μg/mL was transferred into a series of 10 mL vol-umetric flasks. To each flask, 1 mL sodium nitrite (0.1% w/v)and 1 mL of 1 M hydrochloric acid were added. After 3 min,1 mL of sulfamic acid (3% w/v) was added to each flask.Then, 2 mL each of the acetyl acetone (5% w/v) and 4 Msodium hydroxide were added. The contents were made upto the mark with distilled water and mixed well. After 10 min,
the absorbance of the yellow-colored azo dye was measuredat 410 nm against the reagent blank.
2.3.2. Method B. Varying aliquots of reduced FA solutionranging from 0 to 10 μg/mL were transferred into a series of10 mL volumetric flasks. To each flask, 1.5 mL of the sodiumnitrite (0.1% w/v) and 1 mL of 1 M hydrochloric acid wereadded. After 3 min, 1 mL of sulfamic acid (3% w/v) and then2 mL each of the citrazinic acid (0.1% w/v) and 4 M sodiumhydroxide were added. The volumes were made up to themark with distilled water and mixed well. The absorbanceof the colored azo dye was measured at 440 nm against thereagent blank ten minutes later.
2.3.3. Method C. An aliquot of reduced FA solution contain-ing 0–10 μg/mL of FA was transferred into a series of 10 mLcalibrated flasks. To this solution was added 1.5 mL of 0.1%sodium nitrite, and the acidity was adjusted with 1.0 mL of1 M hydrochloric acid. The solution was shaken thoroughlyfor 3 min to allow diazotization reaction to go to completion.A volume of 2 mL of 3% sulfamic acid was added to eachflask. Then, volumes of 1 mL of 8-hydroxyquinoline (0.2%)and 2 mL of 4 M sodium hydroxide were added, and thecontents were diluted to the mark with distilled water andmixed well. The absorbance of the colored azo dye wasmeasured at 500 nm against the reagent blank after 10 min.
The amount of FA present in the pharmaceutical samplewas computed from the concurrent calibration curves.
2.4. Procedure for Pharmaceutical Preparation. Five tabletswere weighed accurately and ground into a fine powder.Tablets powder equivalent to 10 mg of the FA was accuratelyweighed and transferred into a 100 mL beaker and it wasdissolved in 20 mL methanol. To this, 5 mL 4 N hydrochloricacid and 1 g of zinc dust were added and stirred thoroughlyfor about 30 min. The contents were diluted with 50 mL dis-tilled water and filtered using Whatman No. 41 filter paper.The filtrate was received into a 100 mL volumetric flask andit was made up to the mark with water. Appropriate aliquotsof the drug solution were taken and the proposed methods(A, B and C) were followed for analysis of the drug content.
3. Results and Discussion
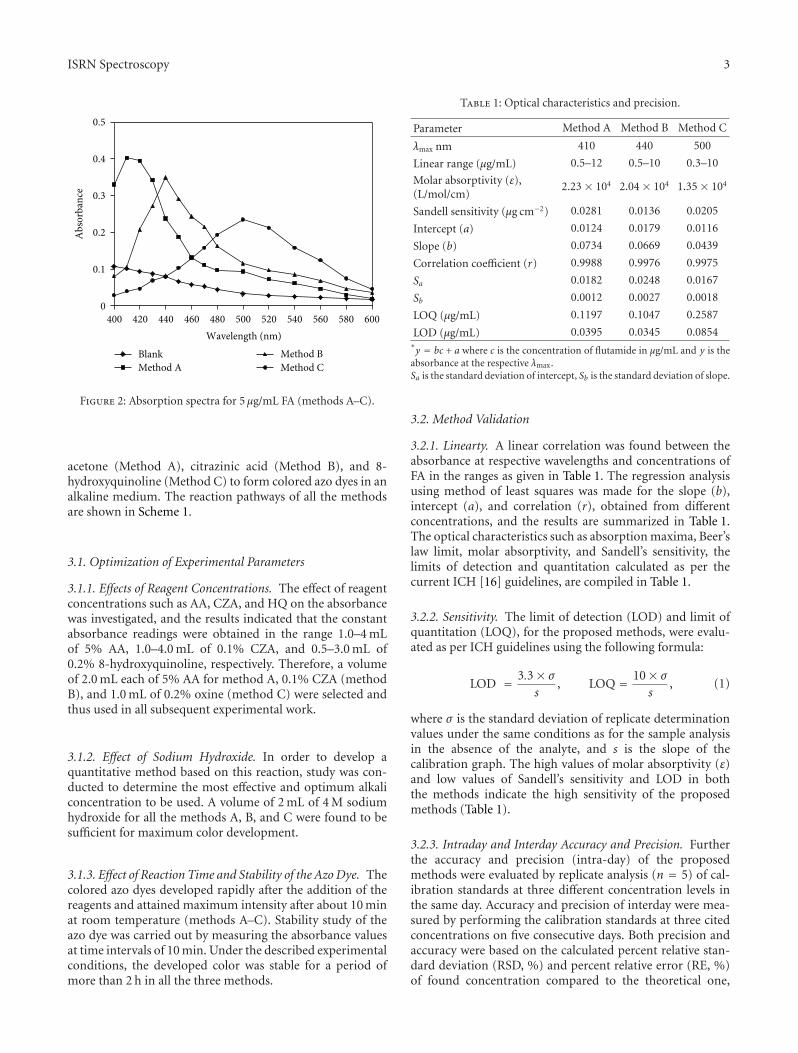
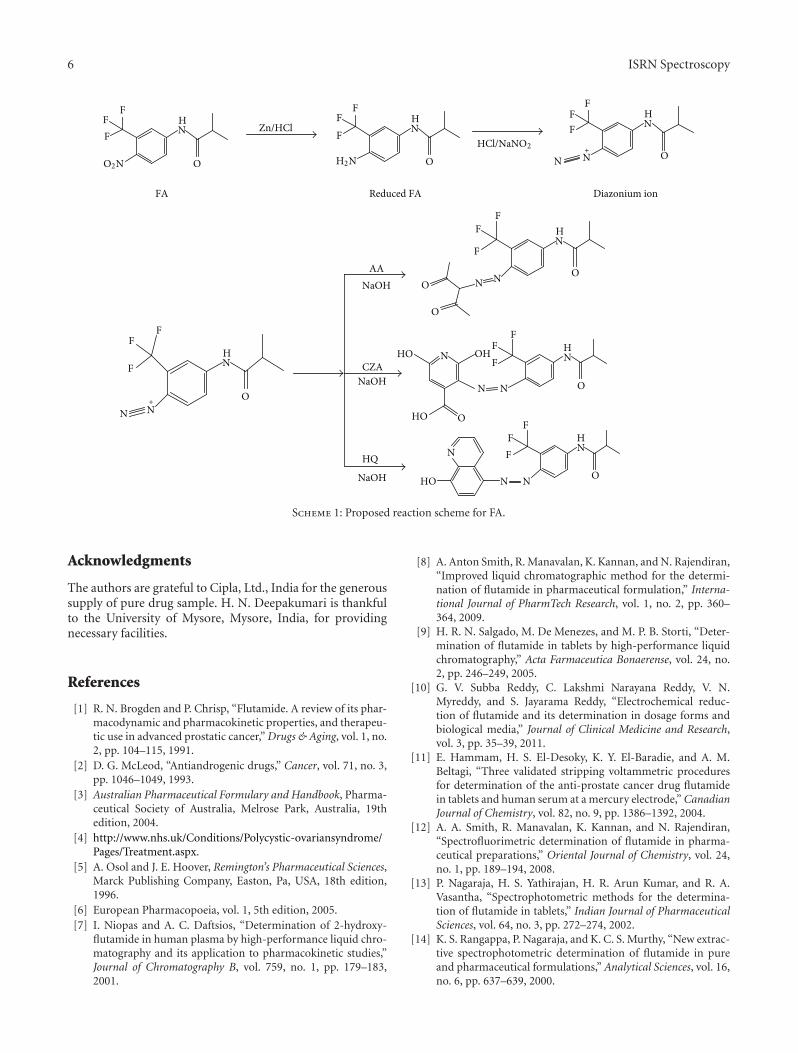
The methods that involve the aromatic amino group inreduced flutamide undergo diazotization with nitrous acid,and resulting diazonium ion was coupled with acetyl acetone(Method A), citrazinic acid (Method B), and 8-hydro-xyquinoline (Method C) to form colored azo-dyes and exhib-iting absorption maxima (λmax) at 410, 440 and 500 nm,respectively for methods A, B, and C (Figure 2). The formedcolored azo dyes are stable for a period of 2 h in each method.
Two steps are involved in the reaction that produces thecolored azo dyes. In the first step, reduced FA is treated withnitrite solution in hydrochloric acid medium and undergoesdiazotization to give diazonium ion. In the second step, thediazonium ion is coupled with the coupling agent’s acetyl
ISRN Spectroscopy 3
0
0.1
0.2
0.3
0.4
0.5
400 420 440 460 480 500 520 540 560 580 600
Abs
orba
nce
BlankMethod A
Method BMethod C
Wavelength (nm)
Figure 2: Absorption spectra for 5 μg/mL FA (methods A–C).
acetone (Method A), citrazinic acid (Method B), and 8-hydroxyquinoline (Method C) to form colored azo dyes in analkaline medium. The reaction pathways of all the methodsare shown in Scheme 1.
3.1. Optimization of Experimental Parameters
3.1.1. Effects of Reagent Concentrations. The effect of reagentconcentrations such as AA, CZA, and HQ on the absorbancewas investigated, and the results indicated that the constantabsorbance readings were obtained in the range 1.0–4 mLof 5% AA, 1.0–4.0 mL of 0.1% CZA, and 0.5–3.0 mL of0.2% 8-hydroxyquinoline, respectively. Therefore, a volumeof 2.0 mL each of 5% AA for method A, 0.1% CZA (methodB), and 1.0 mL of 0.2% oxine (method C) were selected andthus used in all subsequent experimental work.
3.1.2. Effect of Sodium Hydroxide. In order to develop aquantitative method based on this reaction, study was con-ducted to determine the most effective and optimum alkaliconcentration to be used. A volume of 2 mL of 4 M sodiumhydroxide for all the methods A, B, and C were found to besufficient for maximum color development.
3.1.3. Effect of Reaction Time and Stability of the Azo Dye. Thecolored azo dyes developed rapidly after the addition of thereagents and attained maximum intensity after about 10 minat room temperature (methods A–C). Stability study of theazo dye was carried out by measuring the absorbance valuesat time intervals of 10 min. Under the described experimentalconditions, the developed color was stable for a period ofmore than 2 h in all the three methods.
Table 1: Optical characteristics and precision.
Parameter Method A Method B Method C
λmax nm 410 440 500
Linear range (μg/mL) 0.5–12 0.5–10 0.3–10
Molar absorptivity (ε),(L/mol/cm)
2.23 × 10⁴ 2.04 × 10⁴ 1.35 × 10⁴
Sandell sensitivity (μg cm−2) 0.0281 0.0136 0.0205
Intercept (a) 0.0124 0.0179 0.0116
Slope (b) 0.0734 0.0669 0.0439
Correlation coefficient (r) 0.9988 0.9976 0.9975
Sa 0.0182 0.0248 0.0167
Sb 0.0012 0.0027 0.0018
LOQ (μg/mL) 0.1197 0.1047 0.2587
LOD (μg/mL) 0.0395 0.0345 0.0854∗y = bc + a where c is the concentration of flutamide in μg/mL and y is the
absorbance at the respective λmax.Sa is the standard deviation of intercept, Sb is the standard deviation of slope.
3.2. Method Validation
3.2.1. Linearty. A linear correlation was found between theabsorbance at respective wavelengths and concentrations ofFA in the ranges as given in Table 1. The regression analysisusing method of least squares was made for the slope (b),intercept (a), and correlation (r), obtained from differentconcentrations, and the results are summarized in Table 1.The optical characteristics such as absorption maxima, Beer’slaw limit, molar absorptivity, and Sandell’s sensitivity, thelimits of detection and quantitation calculated as per thecurrent ICH [16] guidelines, are compiled in Table 1.
3.2.2. Sensitivity. The limit of detection (LOD) and limit ofquantitation (LOQ), for the proposed methods, were evalu-ated as per ICH guidelines using the following formula:
LOD = 3.3× σ
s, LOQ = 10× σ
s, (1)
where σ is the standard deviation of replicate determinationvalues under the same conditions as for the sample analysisin the absence of the analyte, and s is the slope of thecalibration graph. The high values of molar absorptivity (ε)and low values of Sandell’s sensitivity and LOD in boththe methods indicate the high sensitivity of the proposedmethods (Table 1).
3.2.3. Intraday and Interday Accuracy and Precision. Furtherthe accuracy and precision (intra-day) of the proposedmethods were evaluated by replicate analysis (n = 5) of cal-ibration standards at three different concentration levels inthe same day. Accuracy and precision of interday were mea-sured by performing the calibration standards at three citedconcentrations on five consecutive days. Both precision andaccuracy were based on the calculated percent relative stan-dard deviation (RSD, %) and percent relative error (RE, %)of found concentration compared to the theoretical one,
4 ISRN Spectroscopy
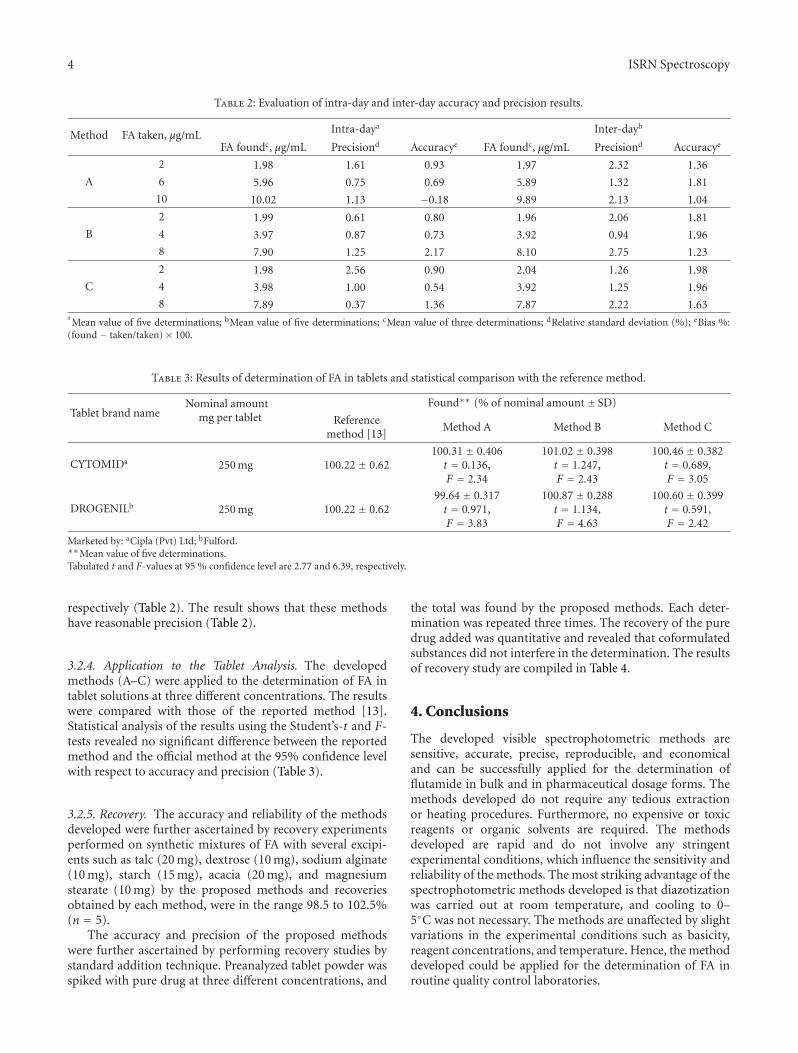
Table 2: Evaluation of intra-day and inter-day accuracy and precision results.
Method FA taken, μg/mL Intra-daya Inter-dayb
FA foundc, μg/mL Precisiond Accuracye FA foundc, μg/mL Precisiond Accuracye
2 1.98 1.61 0.93 1.97 2.32 1.36
A 6 5.96 0.75 0.69 5.89 1.32 1.81
10 10.02 1.13 −0.18 9.89 2.13 1.04
2 1.99 0.61 0.80 1.96 2.06 1.81
B 4 3.97 0.87 0.73 3.92 0.94 1.96
8 7.90 1.25 2.17 8.10 2.75 1.23
2 1.98 2.56 0.90 2.04 1.26 1.98
C 4 3.98 1.00 0.54 3.92 1.25 1.96
8 7.89 0.37 1.36 7.87 2.22 1.63aMean value of five determinations; bMean value of five determinations; cMean value of three determinations; dRelative standard deviation (%); eBias %:
(found − taken/taken)× 100.
Table 3: Results of determination of FA in tablets and statistical comparison with the reference method.
Tablet brand nameNominal amount
mg per tabletFound∗∗ (% of nominal amount ± SD)
Referencemethod [13]
Method A Method B Method C
CYTOMIDa 250 mg 100.22 ± 0.62100.31 ± 0.406
t = 0.136,F = 2.34
101.02 ± 0.398t = 1.247,F = 2.43
100.46 ± 0.382t = 0.689,F = 3.05
DROGENILb 250 mg 100.22 ± 0.6299.64 ± 0.317t = 0.971,F = 3.83
100.87 ± 0.288t = 1.134,F = 4.63
100.60 ± 0.399t = 0.591,F = 2.42
Marketed by: aCipla (Pvt) Ltd; bFulford.∗∗Mean value of five determinations.Tabulated t and F-values at 95 % confidence level are 2.77 and 6.39, respectively.
respectively (Table 2). The result shows that these methodshave reasonable precision (Table 2).
3.2.4. Application to the Tablet Analysis. The developedmethods (A–C) were applied to the determination of FA intablet solutions at three different concentrations. The resultswere compared with those of the reported method [13].Statistical analysis of the results using the Student’s-t and F-tests revealed no significant difference between the reportedmethod and the official method at the 95% confidence levelwith respect to accuracy and precision (Table 3).
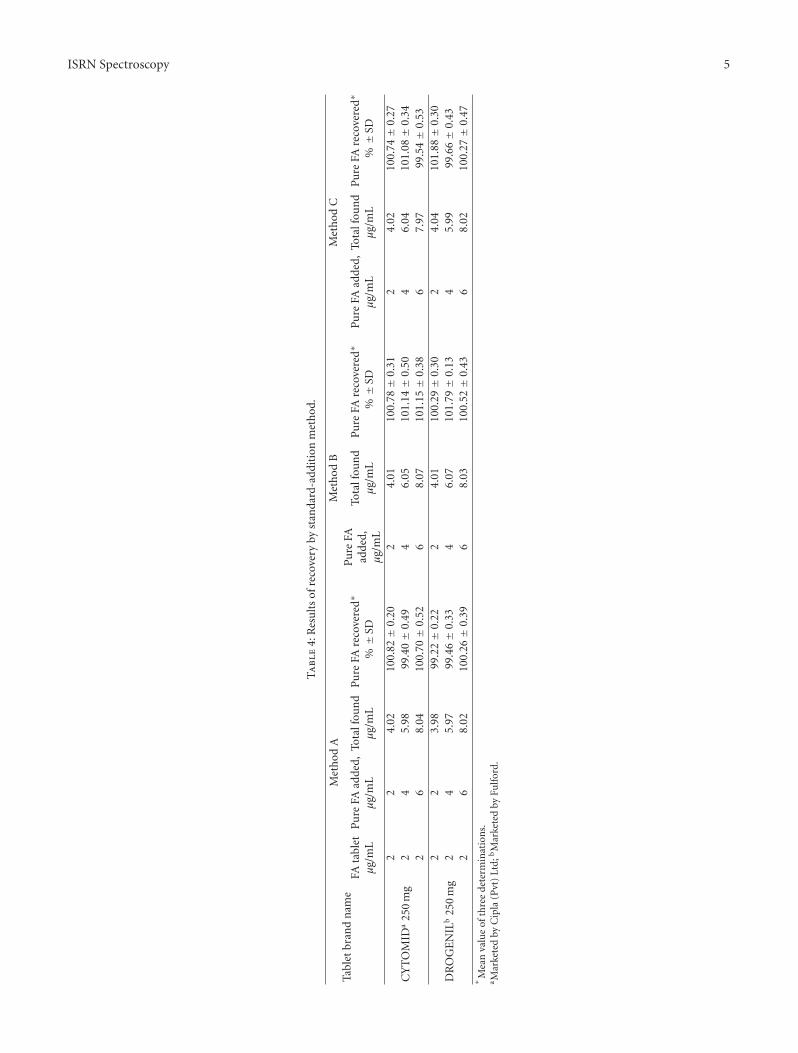
3.2.5. Recovery. The accuracy and reliability of the methodsdeveloped were further ascertained by recovery experimentsperformed on synthetic mixtures of FA with several excipi-ents such as talc (20 mg), dextrose (10 mg), sodium alginate(10 mg), starch (15 mg), acacia (20 mg), and magnesiumstearate (10 mg) by the proposed methods and recoveriesobtained by each method, were in the range 98.5 to 102.5%(n = 5).
The accuracy and precision of the proposed methodswere further ascertained by performing recovery studies bystandard addition technique. Preanalyzed tablet powder wasspiked with pure drug at three different concentrations, and
the total was found by the proposed methods. Each deter-mination was repeated three times. The recovery of the puredrug added was quantitative and revealed that coformulatedsubstances did not interfere in the determination. The resultsof recovery study are compiled in Table 4.
4. Conclusions
The developed visible spectrophotometric methods aresensitive, accurate, precise, reproducible, and economicaland can be successfully applied for the determination offlutamide in bulk and in pharmaceutical dosage forms. Themethods developed do not require any tedious extractionor heating procedures. Furthermore, no expensive or toxicreagents or organic solvents are required. The methodsdeveloped are rapid and do not involve any stringentexperimental conditions, which influence the sensitivity andreliability of the methods. The most striking advantage of thespectrophotometric methods developed is that diazotizationwas carried out at room temperature, and cooling to 0–5◦C was not necessary. The methods are unaffected by slightvariations in the experimental conditions such as basicity,reagent concentrations, and temperature. Hence, the methoddeveloped could be applied for the determination of FA inroutine quality control laboratories.
ISRN Spectroscopy 5
Ta
ble
4:R
esu
lts
ofre
cove
ryby
stan
dard
-add
itio
nm
eth
od.
Tabl
etbr
and
nam
eM
eth
odA
Met
hod
BM
eth
odC
FAta
blet
μg/
mL
Pu
reFA
adde
d,μ
g/m
LTo
talf
oun
dμ
g/m
LP
ure
FAre
cove
red∗
%±
SD
Pu
reFA
adde
d,μ
g/m
L
Tota
lfou
nd
μg/
mL
Pu
reFA
reco
vere
d∗
%±
SDP
ure
FAad
ded,
μg/
mL
Tota
lfou
nd
μg/
mL
Pu
reFA
reco
vere
d∗
%±
SD
22
4.02
100.
82±
0.20
24.
0110
0.78±
0.31
24.
0210
0.74±
0.27
CY
TO
MID
a25
0m
g2
45.
9899
.40±
0.49
46.
0510
1.14±
0.50
46.
0410
1.08±
0.34
26
8.04
100.
70±
0.52
68.
0710
1.15±
0.38
67.
9799
.54±
0.53
22
3.98
99.2
2±
0.22
24.
0110
0.29±
0.30
24.
0410
1.88±
0.30
DR
OG
EN
ILb
250
mg
24
5.97
99.4
6±
0.33
46.
0710
1.79±
0.13
45.
9999
.66±
0.43
26
8.02
100.
26±
0.39
68.
0310
0.52±
0.43
68.
0210
0.27±
0.47
∗M
ean
valu
eof
thre
ede
term
inat
ion
s.a M
arke
ted
byC
ipla
(Pvt
)L
td;b
Mar
kete
dby
Fulf
ord.
6 ISRN Spectroscopy
F
F
FFF F
FF F
FF
FFF
FF
F
F
F
F
F
NH
NNH
NH
NH
NH
NH N
NN
H
O
O O O
O
O
O
O
OHHO
HO
HO
O
O
NN
NN
NN
N
N N
+
AANaOH
CZANaOH
NaOH
HQ
O2N
Zn/HCl
H2N
FA Reduced FA Diazonium ion
+HCl/NaNO2
Scheme 1: Proposed reaction scheme for FA.
Acknowledgments
The authors are grateful to Cipla, Ltd., India for the generoussupply of pure drug sample. H. N. Deepakumari is thankfulto the University of Mysore, Mysore, India, for providingnecessary facilities.
References
[1] R. N. Brogden and P. Chrisp, “Flutamide. A review of its phar-macodynamic and pharmacokinetic properties, and therapeu-tic use in advanced prostatic cancer,” Drugs & Aging, vol. 1, no.2, pp. 104–115, 1991.
[2] D. G. McLeod, “Antiandrogenic drugs,” Cancer, vol. 71, no. 3,pp. 1046–1049, 1993.
[3] Australian Pharmaceutical Formulary and Handbook, Pharma-ceutical Society of Australia, Melrose Park, Australia, 19thedition, 2004.
[4] http://www.nhs.uk/Conditions/Polycystic-ovariansyndrome/Pages/Treatment.aspx.
[5] A. Osol and J. E. Hoover, Remington’s Pharmaceutical Sciences,Marck Publishing Company, Easton, Pa, USA, 18th edition,1996.
[6] European Pharmacopoeia, vol. 1, 5th edition, 2005.[7] I. Niopas and A. C. Daftsios, “Determination of 2-hydroxy-
flutamide in human plasma by high-performance liquid chro-matography and its application to pharmacokinetic studies,”Journal of Chromatography B, vol. 759, no. 1, pp. 179–183,2001.
[8] A. Anton Smith, R. Manavalan, K. Kannan, and N. Rajendiran,“Improved liquid chromatographic method for the determi-nation of flutamide in pharmaceutical formulation,” Interna-tional Journal of PharmTech Research, vol. 1, no. 2, pp. 360–364, 2009.
[9] H. R. N. Salgado, M. De Menezes, and M. P. B. Storti, “Deter-mination of flutamide in tablets by high-performance liquidchromatography,” Acta Farmaceutica Bonaerense, vol. 24, no.2, pp. 246–249, 2005.
[10] G. V. Subba Reddy, C. Lakshmi Narayana Reddy, V. N.Myreddy, and S. Jayarama Reddy, “Electrochemical reduc-tion of flutamide and its determination in dosage forms andbiological media,” Journal of Clinical Medicine and Research,vol. 3, pp. 35–39, 2011.
[11] E. Hammam, H. S. El-Desoky, K. Y. El-Baradie, and A. M.Beltagi, “Three validated stripping voltammetric proceduresfor determination of the anti-prostate cancer drug flutamidein tablets and human serum at a mercury electrode,” CanadianJournal of Chemistry, vol. 82, no. 9, pp. 1386–1392, 2004.
[12] A. A. Smith, R. Manavalan, K. Kannan, and N. Rajendiran,“Spectrofluorimetric determination of flutamide in pharma-ceutical preparations,” Oriental Journal of Chemistry, vol. 24,no. 1, pp. 189–194, 2008.
[13] P. Nagaraja, H. S. Yathirajan, H. R. Arun Kumar, and R. A.Vasantha, “Spectrophotometric methods for the determina-tion of flutamide in tablets,” Indian Journal of PharmaceuticalSciences, vol. 64, no. 3, pp. 272–274, 2002.
[14] K. S. Rangappa, P. Nagaraja, and K. C. S. Murthy, “New extrac-tive spectrophotometric determination of flutamide in pureand pharmaceutical formulations,” Analytical Sciences, vol. 16,no. 6, pp. 637–639, 2000.

ISRN Spectroscopy 7
[15] K. M. Reddy, K. Suvardhan, K. Suresh, S. Prabhakar, and P.Chiranjeevi, “New spectrophotometric method for the deter-mination of flutamide in pharmaceutical preparation usingchromotropic acid as a coupling agent,” in Proceedings of the3rd International Conference on Environment and Health, pp.410–416, Chennai, India, December 2003.
[16] “Validation of analytical procedures: text and methodologyQ2(R 1),” in Proceedings of the International Conference onHarmonization of Technical Requirements for Registration ofPharmaceuticals for Human Use, ICH Harmonised TripartiteGuideline, London, UK, November 1996.

Submit your manuscripts athttp://www.hindawi.com
Hindawi Publishing Corporationhttp://www.hindawi.com Volume 2014
Inorganic ChemistryInternational Journal of
Hindawi Publishing Corporation http://www.hindawi.com Volume 2014
International Journal ofPhotoenergy
Hindawi Publishing Corporationhttp://www.hindawi.com Volume 2014
Carbohydrate Chemistry
International Journal of
Hindawi Publishing Corporationhttp://www.hindawi.com Volume 2014
Journal of
Chemistry
Hindawi Publishing Corporationhttp://www.hindawi.com Volume 2014
Advances in
Physical Chemistry
Hindawi Publishing Corporationhttp://www.hindawi.com
Analytical Methods in Chemistry
Journal of
Volume 2014
Bioinorganic Chemistry and ApplicationsHindawi Publishing Corporationhttp://www.hindawi.com Volume 2014
SpectroscopyInternational Journal of
Hindawi Publishing Corporationhttp://www.hindawi.com Volume 2014
The Scientific World JournalHindawi Publishing Corporation http://www.hindawi.com Volume 2014
Medicinal ChemistryInternational Journal of
Hindawi Publishing Corporationhttp://www.hindawi.com Volume 2014
Chromatography Research International
Hindawi Publishing Corporationhttp://www.hindawi.com Volume 2014
Applied ChemistryJournal of
Hindawi Publishing Corporationhttp://www.hindawi.com Volume 2014
Hindawi Publishing Corporationhttp://www.hindawi.com Volume 2014
Theoretical ChemistryJournal of
Hindawi Publishing Corporationhttp://www.hindawi.com Volume 2014
Journal of
Spectroscopy
Analytical ChemistryInternational Journal of
Hindawi Publishing Corporationhttp://www.hindawi.com Volume 2014
Journal of
Hindawi Publishing Corporationhttp://www.hindawi.com Volume 2014
Quantum Chemistry
Hindawi Publishing Corporationhttp://www.hindawi.com Volume 2014
Organic Chemistry International
ElectrochemistryInternational Journal of
Hindawi Publishing Corporation http://www.hindawi.com Volume 2014
Hindawi Publishing Corporationhttp://www.hindawi.com Volume 2014
CatalystsJournal of