South African Journal of Botany of proline and total soluble sugar concentrations Proline contents...
8
Foliar-applied α-tocopherol enhances salt-tolerance in Vicia faba L. plants grown under saline conditions W.M. Semida a , R.S. Taha b , M.T. Abdelhamid c , M.M. Rady b, ⁎ a Horticulture Department, Faculty of Agriculture, Fayoum University, 63514 Fayoum, Egypt b Botany Department, Faculty of Agriculture, Fayoum University, 63514 Fayoum, Egypt c Botany Department, National Research Center, Cairo, Egypt abstract article info Article history: Received 27 May 2014 Received in revised form 19 August 2014 Accepted 21 August 2014 Available online 7 September 2014 Edited by Andrea Andreucci Keywords: Vicia faba L Antioxidants Growth Physiological attributes Anatomy Salinity The effect of foliar-applied α-tocopherol (αTOC) on salt tolerance in two varieties of faba beans (i.e., Giza 40 and Giza 429) grown under saline soil conditions was investigated. Salinity stress caused a significant reduction in growth traits, physiological attributes, yields and anatomy of the two faba bean varieties. αTOC-treated plants, grown under the abovementioned adverse conditions, had enhanced all growth parameters (i.e., shoot length, numbers of leaves and branches, leaf area, and shoot fresh and dry weights) and yield and its components (i.e., number of dry pod per plant, average 100-seed weight, and dry seed yield per plant and per hectare) of both varieties compared to control plants. In addition, performance index, relative water content, membrane stability index, nutrients and their relations, and anatomy of stem and leaf were significantly improved in αTOC-treated plants compared to control plants. Giza 429 was generated better growth and yield reflecting more salt-tolerance than Giza 40. Results of this study suggested that αTOC as antioxidant could activate the antioxidants in plants to enable them to alleviate the oxidative damage leading to improvements in physiological attributes in plants grown under the adverse conditions of newly-reclaimed saline soils. © 2014 SAAB. Published by Elsevier B.V. All rights reserved. 1. Introduction Faba beans (Vicia faba L.) are popular legume foods and consumed worldwide as an important protein source for human and animal nutri- tion (Cazzato et al., 2012). Faba bean seeds are rich in carbohydrates (51–68% of dry matter; Nachi and Guen, 1996) and proteins (28–30% of dry matter; Burbano et al., 1995), which are considerable among vegetables. Legumes are considered either sensitive or only moderately tolerant to salinity (Subbarao and Johansen, 1993). However, Saxena et al. (1993) reported that there is a considerable variability in salinity tolerance among legumes. The V. faba plants are proved to be moderate- ly sensitive to salinity (Delgado et al., 1994), showing 50% reduction in plant growth under 6.7 dS m −1 salinity (Mass and Hoffman, 1977). In Egypt, breeding faba beans for salt tolerance has usually been limited by the lack of reliable traits for selection. Therefore, it is necessary to de- termine the differences in resistance mechanisms between genotypes and to incorporate characteristics, which improve genotype tolerance into reasonably high yielding backgrounds (Noble and Rogers, 1992). The differences in salt tolerance of faba bean genotypes were observed by Gaballah and Gomaa (2005) based on their growth and enzymatic activity. In addition, Abdelhamid et al. (2010) found that the broomrape-tolerant faba bean cultivars are more salinity-tolerant than broomrape-susceptible cultivars. In the near future, there is a tendency for the agricultural expansion of many crops, including faba beans in newly-reclaimed soils in Egypt. However, most of these soils are affected by salinity. Salinity stress is one of the abiotic stresses, which negatively affect crop production in different regions, particularly in arid and semi-arid regions. There are over 800 million hectares of land worldwide are affected by salinity (Munns, 2005). High salinity causes ion toxicity and osmotic stress, leading to the excessive production of reactive oxygen species (ROS) in plant cells, including superoxide radicals, hydrogen peroxide, hy- droxyl anions, and singlet oxygen. These ROS cause damage to lipids, proteins and DNA (Yasar et al., 2006). Salinity stress causes osmotic stress, ion imbalance and direct toxic effects of ions on the metabolic processes, which are the most important and widely studied physiolog- ical deterioration (Munns et al., 2006). These effects under salinity stress are usually created by the increased Na + and Cl − levels in soils. Salinity stress adversely affects the morphological, physiological and biochemical responses of plants (Nazar et al., 2011). It reduces photo- synthetic attributes (Khan et al., 2009; Saha et al., 2010) and disturbs plant growth and development (Sairam and Tyagi, 2004). Several mech- anisms are being developed by plants to induce tolerance to overcome the adverse effects of salinity, including antioxidants. Efforts have been made to control salinity by various means, includ- ing foliar application of plants with some antioxidants, for developing South African Journal of Botany 95 (2014) 24–31 ⁎ Tel.: +20 1092392038, +20 1007302668; fax: +20 846343970, +20 846334964. E-mail addresses: [email protected], [email protected] (M.M. Rady). http://dx.doi.org/10.1016/j.sajb.2014.08.005 0254-6299/© 2014 SAAB. Published by Elsevier B.V. All rights reserved. Contents lists available at ScienceDirect South African Journal of Botany journal homepage: www.elsevier.com/locate/sajb
Transcript of South African Journal of Botany of proline and total soluble sugar concentrations Proline contents...
South African Journal of Botany 95 (2014) 24–31
Contents lists available at ScienceDirect
South African Journal of Botany
j ourna l homepage: www.e lsev ie r .com/ locate /sa jb
Foliar-applied α-tocopherol enhances salt-tolerance in Vicia faba L.plants grown under saline conditions
W.M. Semida a, R.S. Taha b, M.T. Abdelhamid c, M.M. Rady b,⁎a Horticulture Department, Faculty of Agriculture, Fayoum University, 63514 Fayoum, Egyptb Botany Department, Faculty of Agriculture, Fayoum University, 63514 Fayoum, Egyptc Botany Department, National Research Center, Cairo, Egypt
⁎ Tel.: +20 1092392038, +20 1007302668; fax: +20E-mail addresses: [email protected], mrady2050
http://dx.doi.org/10.1016/j.sajb.2014.08.0050254-6299/© 2014 SAAB. Published by Elsevier B.V. All ri
a b s t r a c t
a r t i c l e i n f oArticle history:Received 27 May 2014Received in revised form 19 August 2014Accepted 21 August 2014Available online 7 September 2014
Edited by Andrea Andreucci
Keywords:Vicia faba LAntioxidantsGrowthPhysiological attributesAnatomySalinity
The effect of foliar-appliedα-tocopherol (αTOC) on salt tolerance in two varieties of faba beans (i.e., Giza 40 andGiza 429) grown under saline soil conditions was investigated. Salinity stress caused a significant reduction ingrowth traits, physiological attributes, yields and anatomy of the two faba bean varieties. αTOC-treated plants,grown under the abovementioned adverse conditions, had enhanced all growth parameters (i.e., shoot length,numbers of leaves and branches, leaf area, and shoot fresh and dry weights) and yield and its components(i.e., number of dry pod per plant, average 100-seed weight, and dry seed yield per plant and per hectare) ofboth varieties compared to control plants. In addition, performance index, relative water content, membranestability index, nutrients and their relations, and anatomy of stem and leaf were significantly improved inαTOC-treated plants compared to control plants. Giza 429 was generated better growth and yield reflectingmore salt-tolerance than Giza 40. Results of this study suggested that αTOC as antioxidant could activate theantioxidants in plants to enable them to alleviate the oxidative damage leading to improvements in physiologicalattributes in plants grown under the adverse conditions of newly-reclaimed saline soils.
© 2014 SAAB. Published by Elsevier B.V. All rights reserved.
1. Introduction
Faba beans (Vicia faba L.) are popular legume foods and consumedworldwide as an important protein source for human and animal nutri-tion (Cazzato et al., 2012). Faba bean seeds are rich in carbohydrates(51–68% of dry matter; Nachi and Guen, 1996) and proteins (28–30%of dry matter; Burbano et al., 1995), which are considerable amongvegetables. Legumes are considered either sensitive or only moderatelytolerant to salinity (Subbarao and Johansen, 1993). However, Saxenaet al. (1993) reported that there is a considerable variability in salinitytolerance among legumes. TheV. fabaplants are proved to bemoderate-ly sensitive to salinity (Delgado et al., 1994), showing 50% reduction inplant growth under 6.7 dS m−1 salinity (Mass and Hoffman, 1977). InEgypt, breeding faba beans for salt tolerance has usually been limitedby the lack of reliable traits for selection. Therefore, it is necessary to de-termine the differences in resistance mechanisms between genotypesand to incorporate characteristics, which improve genotype toleranceinto reasonably high yielding backgrounds (Noble and Rogers, 1992).The differences in salt tolerance of faba bean genotypes were observedby Gaballah and Gomaa (2005) based on their growth and enzymaticactivity. In addition, Abdelhamid et al. (2010) found that the
846343970, +20 [email protected] (M.M. Rady).
ghts reserved.
broomrape-tolerant faba bean cultivars are more salinity-tolerant thanbroomrape-susceptible cultivars.
In the near future, there is a tendency for the agricultural expansionof many crops, including faba beans in newly-reclaimed soils in Egypt.However, most of these soils are affected by salinity. Salinity stress isone of the abiotic stresses, which negatively affect crop production indifferent regions, particularly in arid and semi-arid regions. There areover 800 million hectares of land worldwide are affected by salinity(Munns, 2005). High salinity causes ion toxicity and osmotic stress,leading to the excessive production of reactive oxygen species (ROS)in plant cells, including superoxide radicals, hydrogen peroxide, hy-droxyl anions, and singlet oxygen. These ROS cause damage to lipids,proteins and DNA (Yasar et al., 2006). Salinity stress causes osmoticstress, ion imbalance and direct toxic effects of ions on the metabolicprocesses, which are themost important andwidely studied physiolog-ical deterioration (Munns et al., 2006). These effects under salinitystress are usually created by the increased Na+ and Cl− levels in soils.Salinity stress adversely affects the morphological, physiological andbiochemical responses of plants (Nazar et al., 2011). It reduces photo-synthetic attributes (Khan et al., 2009; Saha et al., 2010) and disturbsplant growth anddevelopment (Sairamand Tyagi, 2004). Severalmech-anisms are being developed by plants to induce tolerance to overcomethe adverse effects of salinity, including antioxidants.
Efforts have beenmade to control salinity by various means, includ-ing foliar application of plants with some antioxidants, for developing
25W.M. Semida et al. / South African Journal of Botany 95 (2014) 24–31
the sustainable agriculture. α-Tocopherol (αTOC) is a low molecularweight lipophilic membrane-located antioxidant. It protects cell mem-branes from oxidative damage (Asada, 1999) and polyunsaturatedfatty acids from lipid peroxidation (Krieger-Liszkay and Trebst, 2006),and improvesmembrane stability and permeability. It helps also to pro-vide an optimal environment for the photosynthetic machinery (Wiseand Naylor, 1987). There was a positive correlation between αTOCand shoot/root growth in two grass species; tall fescue and creepingbentgrass (Zhang and Schmidt, 2000).
Up till now, there are no Egyptian cultivars of faba bean produced assalinity tolerant that could be recommended for cultivation in thenewly-reclaimed and salt-affected soils. Therefore, the aim of thisstudy is to evaluate the salt tolerance of two Egyptian faba bean culti-vars and their different responses to different levels of αTOC underthe adverse conditions of a reclaimed saline soil with regard to growthcharacteristics, physiological attributes, accumulation of ions and theirrelations and the obtained yield.
2. Materials and methods
2.1. Plant material, experimental design and treatments
Two field experiments were conducted in two successive seasons(2011/2012 and 2012/2013) at the Experimental Farm of the Facultyof Agriculture, Fayoum University, Southeast Fayoum (29° 17′N; 30°53′E), Egypt. In the 2011/2012 season, the daily temperatures averaged21.2° ± 2.6 °C, and the daily relative humidity averaged 58.4± 5.1%. Inthe 2012/2013 season, the daily temperatures averaged 22.1° ± 2.8 °C,and the daily relative humidity averaged 60 ± 4.9%.
Healthy seeds of two varieties (i.e., Giza 40 and Giza 429) of fababean (V. faba L.) were sown on 22 October 2011, and on 25 October2012. Seeds were obtained from Horticulture Research Institute, Agri-cultural Research Centre, Giza, Egypt, and were sown at the equivalentof 120 kg ha−1 to achieve the recommended planting density. Fababean seeds were selected for uniformity by choosing those of equalsize and of the same color. The selected seeds were washed with dis-tilled water, sterilized in 1% (v/v) sodium hypochlorite for approx.2 min, washed thoroughly again with distilled water, and left to dry atroom temperature overnight. Uniform, air-dried faba bean seeds weresown in hills spaced 20–25 cm apart, in rows spaced 70 cm apart in3.0m× 3.5mplots. Thinningwas done before the first irrigation to pro-duce two plants per hill. During soil preparation and plant growth, thesoil was supplemented with the full dose of NPK fertilizer according tothe recommendations of theMinistry of Agriculture and Land Reclama-tion. These recommendations were for 450 kg ha−1 calcium super-phosphate (15.5% P2O5), 250 kg ha−1 ammonium sulfate (20.5% N),and 120 kg ha−1 potassium sulfate (48% K2O) during seed-bed prepara-tion. Irrigation water was added to 100% of the reference crop evapo-transpiration (ETo), values from the Fayoum Meteo Station. Sevenirrigations were applied in each season, with total water rates of about2800m3 ha−1 in each growing season. All other recommended agricul-tural practices were followed as recommended by the Ministry of Agri-culture and Land Reclamation.
One experimental site was chosen for each season in the same loca-tion. Soil analyses were carried out according to Black et al. (1965) andJackson (1973). The soil texture was sandy clay loam [sand (%, w/v),49.8 and 50.0; silt (%, w/v), 19.7 and 19.9; clay (% w/v), 30.5 and 30.1in the 2011/2012 and 2012/2013, respectively]. The other maincharacteristics of the soil in the two growing seasons were: pH [at asoil:water (w/v) ratio of 1:2.5], 7.74 and 7.80; EC (dS m−1; soil–pasteextract), 8.88 and 8.95; organic matter [% (w/v)], 1.04 and 1.02; CaCO3
[% (w/v)], 6.96 and 6.89; total N [% (w/v)], 0.072 and 0.068; availableP (mg kg−1 soil), 8.67 and 8.49; available K (mg kg−1 soil), 192 and187; available Fe (mg kg−1 soil), 6.32 and 5.98; available Mn (mg kg−1
soil), 2.32 and 2.27; available Zn (mg kg−1 soil), 0.98 and 0.95; andavailable Cu (mg kg−1 soil), 0.48 and 0.52, respectively. Based on the
above EC values classed the soil as being strongly saline according toDahnke and Whitney (1988). The experiments were arranged in a ran-domized complete block design, with four levels of αTOC (0, 0.25, 0.50and 1.0 mM), with three replicate plots.
Twenty days after sowing (DAS), faba bean seedlings in each plotwere sprayed to run-off with 0 (tap water as a control), 0.25, 0.50 and1.0 mM αTOC, and then the sprays were repeated at 30 and 40 DAS.The concentration of Vit-E (Yongyi Chemicals Group Co., Ltd., China),and the number and timing of sprays were based on results from a pre-liminary pot trial (data not shown). To ensure optimal penetration intoleaf tissues, 0.1% (v/v) Tween-20 was added to the foliar sprays as asurfactant.
2.2. Plant growth and yield analyses
Fifty-day-old faba bean plants (n= 9)were carefully removed fromeach experimental plot and dipped in a bucket of water. Plants wereshaken gently to remove all adhering soil particles and the lengths oftheir shoots were measured using a meter scale. Numbers of leavesand branch plants−1 were counted. The shoots of plants were weighedto record their fresh weights, and then placed in an oven at 80 °C for24 h. The dried shoots were weighed to record their dry weights. Leafareas were measured manually using a graph sheet, where the squarescovered by the leafwere counted to note the leaf area. At the end of eachexperiment (2 April 2012 and 3 April 2013), all the dry pods on eachplant in each experimental plot were collected and counted. The dryseeds of faba bean were then extracted from the pods and weighed tocalculate the average 100-seed weight, and seed yield per plant andper hectare.
2.3. Measurement of proline and total soluble sugar concentrations
Proline contents (in mg 100 g−1 DW of leaf) were measured usingthe rapid colorimetric method outlined by Bates et al. (1973). Prolinewas extracted from 0.5 g DW of leaf tissue by grinding in 10 ml of 3%(v/v) sulfosalicylic acid. The mixture was then centrifuged at 10,000 ×gfor 10 min. In a test tube, 2 ml of the supernatant followed by 2 ml offreshly prepared acid–ninhydrin solutionwas placed. The tubeswere in-cubated in a water bath at 90 °C for 30 min and the reaction was termi-nated in an ice-bath. Each reactionmixturewas then extractedwith 5mlof toluene and vortex-mixed for 15 s. The tubes were allowed to standfor at least 20 min in the dark at room temperature to separate the tolu-ene and aqueous phases. The toluene phase was then collected carefullyinto a test tube and its absorbance was read at 520 nm. Proline concen-trations were determined from a standard curve prepared using analyt-ical grade proline.
Total soluble sugars (TSS) were extracted and determined as sug-gested by Irigoyen et al. (1992). A sample of 0.2 g dried leaves was ho-mogenized in 5ml of 96% (v/v) ethanol andwashedwith 5ml 70% (v/v)ethanol. The extract was centrifuged at 3500 ×g for 10 min and the su-pernatant was stored at 4 °C prior to measurement. TSS concentrationswere determined by reacting 0.1ml of the ethanolic extract with 3ml offreshly-prepared anthrone reagent [150 mg anthrone plus 100 ml of72% (v/v) sulphuric acid] by placing it in a boiling water bath for10 min. After cooling, the absorbance of the mixtures was recorded at625 nm using a Bauschand Lomb-2000 Spectronic Spectrophotometer.
2.4. Measurement of chlorophyll fluorescence
Chlorophyll fluorescencewasmeasured on two different sunny daysusing a portable fluorometer (Handy PEA, Hansatech Instruments Ltd,Kings Lynn, UK). One leaf (the same age) was chosen per plant fromthree plants in each experimental plot of each treatment (n = 9).Fluorescence measurements included: Maximum quantum yield of PSII Fv/Fm was calculated as; Fv/Fm = (Fm − Fo)/Fm (Maxwell andJohnson, 2000). Performance index of photosynthesis based on the
Table 1Effect of exogenously applied α-tocopherol (αTOC; mM) on growth characteristics of two varieties of Vicia faba L. grown in reclaimed-saline calcareous soil.
Treatment Shoot length (cm) Leaves no. Leaves area (dm2) Branches no. Shoot FW (g) Shoot DW (g)
Var. αTOC
G 40 0 30.7 ± 0.6c 12.3 ± 0.3c 5.8 ± 0.3c 1.0 ± 0.1d 28.4 ± 3.1d 4.4 ± 0.2d0.25 49.0 ± 1.0b 16.0 ± 0.5b 10.0 ± 0.4b 2.0 ± 0.2c 63.0 ± 6.2c 9.0 ± 0.6c0.50 56.0 ± 2.5a 18.7 ± 0.8a 15.7 ± 0.6a 3.3 ± 0.2a 103.4 ± 8.1a 14.5 ± 0.9a1 55.0 ± 1.7a 16.0 ± 0.5b 10.9 ± 0.5b 2.7 ± 0.1b 91.8 ± 7.5b 11.2 ± 0.8bMeans 47.7B 15.8B 10.6B 2.3B 71.7B 9.8B
G 429 0 36.7 ± 0.8c 14.7 ± 0.4d 6.2 ± 0.1d 2.0 ± 0.1c 57.1 ± 3.3d 7.6 ± 0.3b0.25 51.7 ± 1.4b 17.7 ± 0.6b 13.1 ± 0.7b 3.0 ± 0.2b 89.3 ± 6.8b 11.3 ± 0.6a0.50 59.3 ± 2.8a 19.0 ± 0.8a 16.1 ± 1.0a 4.3 ± 0.2a 113.3 ± 8.4a 13.4 ± 0.7a1 57.0 ± 1.9a 16.0 ± 0.5c 11.6 ± 0.4c 3.3 ± 0.1b 80.9 ± 6.1b 11.1 ± 0.6aMeans 51.2A 16.9A 11.8A 3.2A 85.2A 10.9A
Mean values (n = 9) in the same column for each trait with the same lower small or upper bold-case letters are not significantly different by Duncan's multiple range test at P ≤ 0.05.mM = millimole; cm = centimeter; dm = decimeter; FW = fresh weight; DW = dry weight; Var. = variety; G 40 = Giza 40; G 429 = Giza 429.Measurements were made in 50-day-old plants.
26 W.M. Semida et al. / South African Journal of Botany 95 (2014) 24–31
equal absorption (PIABS) was calculated as reported by Clark et al.(2000).
2.5. Determination of membrane stability index and relative water content
Membrane stability indices (MSI) were estimated, in 9 samples foreach treatment, using duplicate 0.2 g samples of fully-expanded leaf tis-sue (Rady, 2011). One sample of each duplicate was placed in a test-tube containing 10 ml of double-distilled water and heated at 40 °C ina water bath for 30 min. The electrical conductivity (C1) of the solutionwas recorded using a conductivity bridge. The second sample wasboiled at 100 °C for 10 min, and the conductivity was also measured(C2). The formula:MSI (%)= [1− (C1 ÷ C2)] × 100was applied for cal-culating the MSI.
Excluding themidrib, fresh 2 cm-diameter fully-expanded leaf discs(n=9)were used to determine the relativewater contents (RWC). Thediscs were weighed (fresh mass; FM) and immediately floated ondouble-distilled water in Petri dishes for 24 h, in the dark, to saturatethem with water. Any adhering water was blotted dry and the turgidmass (TM) was measured. The dry mass (DM) was recorded afterdehydrating the discs at 70 °C for 48 h. The RWC was then calculatedusing the formula of Hayat et al. (2007) as follows: RWC (%) =[(FM − DM) ÷ (TM − DM)] × 100.
2.6. Determination of leaf nitrogen (N), phosphorus (P), potassium (K),calcium (Ca) and sodium (Na) concentrations
Leaf N contents (in mg g−1 DW) were determined (Hafez andMikkelsen, 1981) using the Orange-G dye method. The dye solution
Table 2Effect of exogenously applied α-tocopherol (αTOC; mM) on physiological attributes of two va
Treatment Free proline (mg g−1 DW) Total soluble sugars(mg g−1 DW)
Var. αTOC
G 40 0 0.61 ± 0.02a 6.7 ± 0.3a0.25 0.38 ± 0.01b 4.4 ± 0.2b0.50 0.30 ± 0.01c 3.5 ± 0.2c1 0.38 ± 0.01b 5.7 ± 0.2bMeans 0.42A 5.1A
G 429 0 0.76 ± 0.02a 6.1 ± 0.3a0.25 0.33 ± 0.01b 5.3 ± 0.2b0.50 0.27 ± 0.01c 4.5 ± 0.1c1 0.34 ± 0.01b 5.2 ± 0.2bMeans 0.43A 5.3A
Mean values (n = 9) in the same column for each trait with the same lower small or upper bomM = millimole; mg = milligram; DW = dry weight; Var. = variety; G 40 = Giza 40; G 4adapted measurements; PI = photosynthetic performance index; MSI = membrane stabilityMeasurements were made in 50-day-old plants.
was prepared by dissolving 1.0 g of 96% (w/w) assay-dye in 1 L of dis-tilled water, with 21.0 g citric acid which acted as a buffer to maintainthe correct pH, and 2.5 ml 10% (v/v) thymol in 10% (v/v) ethanol as aninhibitor of microbial growth. Ground plant material (0.2 g leaf tissue)was placed in a centrifuge tube and 20 ml of the dye reagent solutionwas added. The contents of each tube were shaken for 15 min, then fil-tered using Whatman No. 1 filter paper. The solution was diluted 100-fold with distilled water and its absorbance was measured at 482 nm.N contents were calculated using the formulae:
N %ð Þ ¼ 0:39 þ 0: 954 � Dye absorbed g =100 gð Þ andDye absorbed g =100 gð Þ ¼ a–b=að Þ cfv=wð Þ � 100
where, a was the absorbance of the dye reagent solution at 482 nmwithout plant material (the blank), bwas the absorbance of the dye re-agent solution at 482 nmwith plantmaterial, cwas the concentration ofthe dye reagent (1.0 g l−1 distilled water), fwas the purity factor of thedye reagent (96%), v was the volume of the dye reagent solution usedper sample (20 ml), and w was the weight of ground dry material(0.2 g).
The molybdenum-reduced molybdophosphoric blue color method(Jackson, 1967), in sulphuric acid (with reduction to exclude arsenate),was used to determine P contents (in mg g−1 DW). Sulphomolybdicacid (molybdenum blue), diluted sulphomolybdic acid, and 8% (w/v)sodium bisulphite-H2SO4 solution were used as reagents. Leaf K+ andNa+ ion contents (in mg g−1 DW) were assessed using a Perkin-Elmer Model 52-A Flame Photometer (Glenbrook, Stamford, CT, USA;Page et al., 1982). Leaf Ca2+ was determined using a Perkin-ElmerModel 3300 Atomic Absorption Spectrophotometer (Chapman andPratt, 1961).
rieties of Vicia faba L. grown in reclaimed-saline calcareous soil.
Fv/Fm PI MSI(%)
RWC(%)
0.81 ± 0.03 3.3 ± 0.2c 48.8 ± 3.2c 42.7 ± 1.5c0.82 ± 0.03 3.7 ± 0.3b 55.8 ± 3.5b 48.3 ± 1.9b0.84 ± 0.06 5.1 ± 0.4a 61.0 ± 4.2a 53.7 ± 2.3a0.82 ± 0.04 3.8 ± 0.3b 54.9 ± 3.2b 48.0 ± 1.7b0.82A 4.1B 55.1B 46.2B0.81 ± 0.02 3.4 ± 0.2c 51.7 ± 3.1c 47.0 ± 1.8c0.82 ± 0.03 4.7 ± 0.2b 61.1 ± 3.8b 55.0 ± 2.3b0.83 ± 0.05 7.6 ± 0.4a 65.7 ± 4.0a 60.7 ± 2.4a0.81 ± 0.02 5.1 ± 0.3b 59.0 ± 3.4b 54.7 ± 2.1b0.82A 5.2A 59.4A 52.9A
ld-case letters are not significantly different by Duncan's multiple range test at P ≤ 0.05.29 = Giza 429; Fv/Fm = uses to estimate the potential efficiency of PSII by taking dark-index; RWC = relative water content.
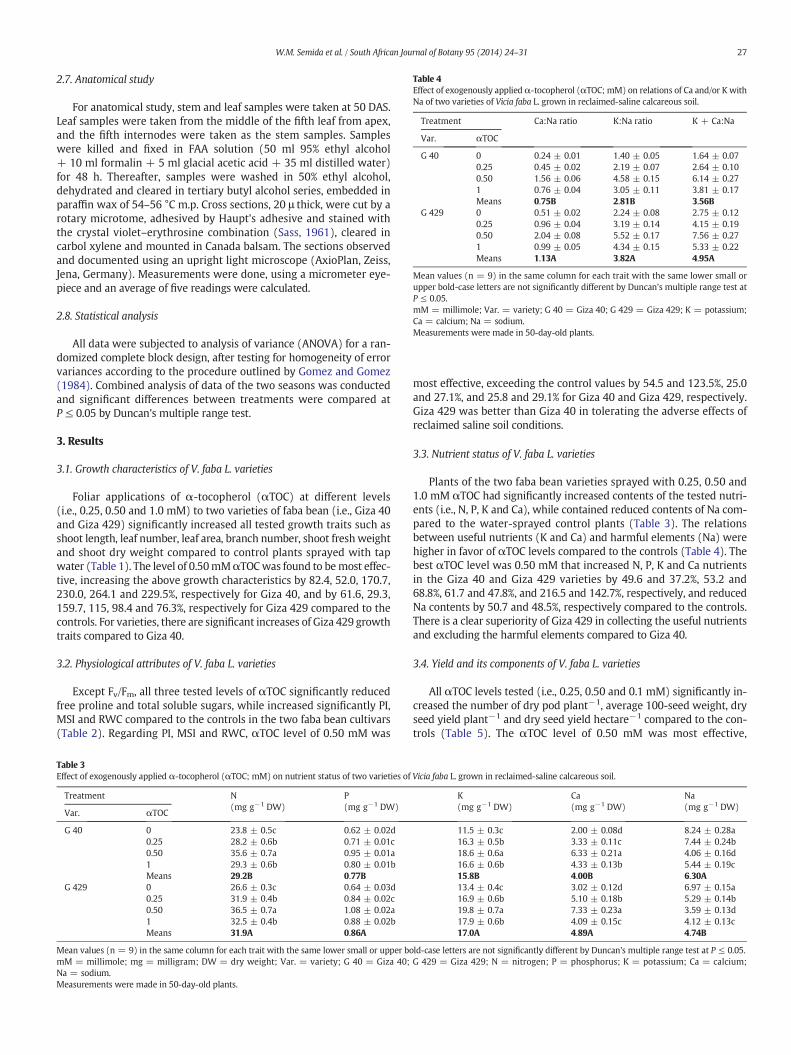
Table 4Effect of exogenously appliedα-tocopherol (αTOC; mM) on relations of Ca and/or K withNa of two varieties of Vicia faba L. grown in reclaimed-saline calcareous soil.
Treatment Ca:Na ratio K:Na ratio K + Ca:Na
Var. αTOC
G 40 0 0.24 ± 0.01 1.40 ± 0.05 1.64 ± 0.070.25 0.45 ± 0.02 2.19 ± 0.07 2.64 ± 0.100.50 1.56 ± 0.06 4.58 ± 0.15 6.14 ± 0.271 0.76 ± 0.04 3.05 ± 0.11 3.81 ± 0.17Means 0.75B 2.81B 3.56B
G 429 0 0.51 ± 0.02 2.24 ± 0.08 2.75 ± 0.120.25 0.96 ± 0.04 3.19 ± 0.14 4.15 ± 0.190.50 2.04 ± 0.08 5.52 ± 0.17 7.56 ± 0.271 0.99 ± 0.05 4.34 ± 0.15 5.33 ± 0.22Means 1.13A 3.82A 4.95A
Mean values (n = 9) in the same column for each trait with the same lower small orupper bold-case letters are not significantly different by Duncan's multiple range test atP ≤ 0.05.mM = millimole; Var. = variety; G 40 = Giza 40; G 429 = Giza 429; K = potassium;Ca = calcium; Na = sodium.Measurements were made in 50-day-old plants.
27W.M. Semida et al. / South African Journal of Botany 95 (2014) 24–31
2.7. Anatomical study
For anatomical study, stem and leaf samples were taken at 50 DAS.Leaf samples were taken from the middle of the fifth leaf from apex,and the fifth internodes were taken as the stem samples. Sampleswere killed and fixed in FAA solution (50 ml 95% ethyl alcohol+ 10 ml formalin + 5 ml glacial acetic acid + 35 ml distilled water)for 48 h. Thereafter, samples were washed in 50% ethyl alcohol,dehydrated and cleared in tertiary butyl alcohol series, embedded inparaffin wax of 54–56 °C m.p. Cross sections, 20 μ thick, were cut by arotary microtome, adhesived by Haupt's adhesive and stained withthe crystal violet–erythrosine combination (Sass, 1961), cleared incarbol xylene and mounted in Canada balsam. The sections observedand documented using an upright light microscope (AxioPlan, Zeiss,Jena, Germany). Measurements were done, using a micrometer eye-piece and an average of five readings were calculated.
2.8. Statistical analysis
All data were subjected to analysis of variance (ANOVA) for a ran-domized complete block design, after testing for homogeneity of errorvariances according to the procedure outlined by Gomez and Gomez(1984). Combined analysis of data of the two seasons was conductedand significant differences between treatments were compared atP ≤ 0.05 by Duncan's multiple range test.
3. Results
3.1. Growth characteristics of V. faba L. varieties
Foliar applications of α-tocopherol (αTOC) at different levels(i.e., 0.25, 0.50 and 1.0 mM) to two varieties of faba bean (i.e., Giza 40and Giza 429) significantly increased all tested growth traits such asshoot length, leaf number, leaf area, branch number, shoot fresh weightand shoot dry weight compared to control plants sprayed with tapwater (Table 1). The level of 0.50mMαTOCwas found to bemost effec-tive, increasing the above growth characteristics by 82.4, 52.0, 170.7,230.0, 264.1 and 229.5%, respectively for Giza 40, and by 61.6, 29.3,159.7, 115, 98.4 and 76.3%, respectively for Giza 429 compared to thecontrols. For varieties, there are significant increases of Giza 429 growthtraits compared to Giza 40.
3.2. Physiological attributes of V. faba L. varieties
Except Fv/Fm, all three tested levels of αTOC significantly reducedfree proline and total soluble sugars, while increased significantly PI,MSI and RWC compared to the controls in the two faba bean cultivars(Table 2). Regarding PI, MSI and RWC, αTOC level of 0.50 mM was
Table 3Effect of exogenously applied α-tocopherol (αTOC; mM) on nutrient status of two varieties of
Treatment N(mg g−1 DW)
P(mg g−1 DW)
Var. αTOC
G 40 0 23.8 ± 0.5c 0.62 ± 0.02d0.25 28.2 ± 0.6b 0.71 ± 0.01c0.50 35.6 ± 0.7a 0.95 ± 0.01a1 29.3 ± 0.6b 0.80 ± 0.01bMeans 29.2B 0.77B
G 429 0 26.6 ± 0.3c 0.64 ± 0.03d0.25 31.9 ± 0.4b 0.84 ± 0.02c0.50 36.5 ± 0.7a 1.08 ± 0.02a1 32.5 ± 0.4b 0.88 ± 0.02bMeans 31.9A 0.86A
Mean values (n = 9) in the same column for each trait with the same lower small or upper bomM = millimole; mg = milligram; DW = dry weight; Var. = variety; G 40 = Giza 40;Na = sodium.Measurements were made in 50-day-old plants.
most effective, exceeding the control values by 54.5 and 123.5%, 25.0and 27.1%, and 25.8 and 29.1% for Giza 40 and Giza 429, respectively.Giza 429 was better than Giza 40 in tolerating the adverse effects ofreclaimed saline soil conditions.
3.3. Nutrient status of V. faba L. varieties
Plants of the two faba bean varieties sprayed with 0.25, 0.50 and1.0 mM αTOC had significantly increased contents of the tested nutri-ents (i.e., N, P, K and Ca), while contained reduced contents of Na com-pared to the water-sprayed control plants (Table 3). The relationsbetween useful nutrients (K and Ca) and harmful elements (Na) werehigher in favor of αTOC levels compared to the controls (Table 4). Thebest αTOC level was 0.50 mM that increased N, P, K and Ca nutrientsin the Giza 40 and Giza 429 varieties by 49.6 and 37.2%, 53.2 and68.8%, 61.7 and 47.8%, and 216.5 and 142.7%, respectively, and reducedNa contents by 50.7 and 48.5%, respectively compared to the controls.There is a clear superiority of Giza 429 in collecting the useful nutrientsand excluding the harmful elements compared to Giza 40.
3.4. Yield and its components of V. faba L. varieties
All αTOC levels tested (i.e., 0.25, 0.50 and 0.1 mM) significantly in-creased the number of dry pod plant−1, average 100-seed weight, dryseed yield plant−1 and dry seed yield hectare−1 compared to the con-trols (Table 5). The αTOC level of 0.50 mM was most effective,
Vicia faba L. grown in reclaimed-saline calcareous soil.
K(mg g−1 DW)
Ca(mg g−1 DW)
Na(mg g−1 DW)
11.5 ± 0.3c 2.00 ± 0.08d 8.24 ± 0.28a16.3 ± 0.5b 3.33 ± 0.11c 7.44 ± 0.24b18.6 ± 0.6a 6.33 ± 0.21a 4.06 ± 0.16d16.6 ± 0.6b 4.33 ± 0.13b 5.44 ± 0.19c15.8B 4.00B 6.30A13.4 ± 0.4c 3.02 ± 0.12d 6.97 ± 0.15a16.9 ± 0.6b 5.10 ± 0.18b 5.29 ± 0.14b19.8 ± 0.7a 7.33 ± 0.23a 3.59 ± 0.13d17.9 ± 0.6b 4.09 ± 0.15c 4.12 ± 0.13c17.0A 4.89A 4.74B
ld-case letters are not significantly different by Duncan's multiple range test at P ≤ 0.05.G 429 = Giza 429; N = nitrogen; P = phosphorus; K = potassium; Ca = calcium;
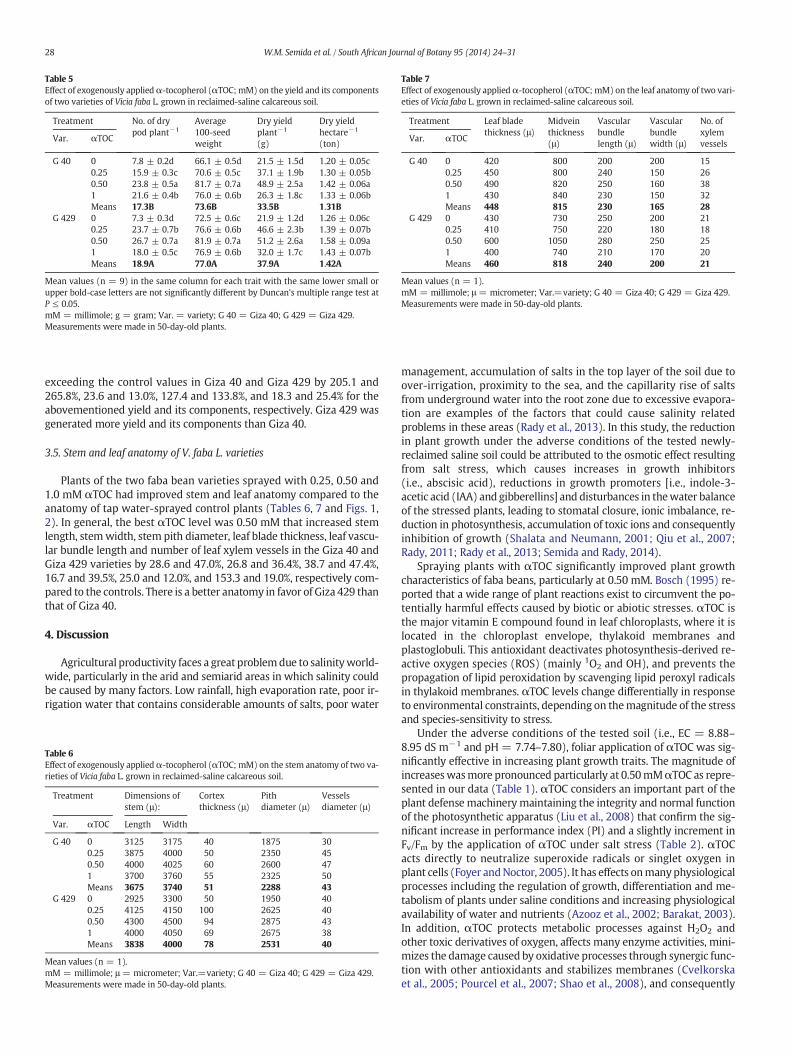
Table 5Effect of exogenously appliedα-tocopherol (αTOC;mM) on the yield and its componentsof two varieties of Vicia faba L. grown in reclaimed-saline calcareous soil.
Treatment No. of drypod plant−1
Average100-seedweight
Dry yieldplant−1
(g)
Dry yieldhectare−1
(ton)Var. αTOC
G 40 0 7.8 ± 0.2d 66.1 ± 0.5d 21.5 ± 1.5d 1.20 ± 0.05c0.25 15.9 ± 0.3c 70.6 ± 0.5c 37.1 ± 1.9b 1.30 ± 0.05b0.50 23.8 ± 0.5a 81.7 ± 0.7a 48.9 ± 2.5a 1.42 ± 0.06a1 21.6 ± 0.4b 76.0 ± 0.6b 26.3 ± 1.8c 1.33 ± 0.06bMeans 17.3B 73.6B 33.5B 1.31B
G 429 0 7.3 ± 0.3d 72.5 ± 0.6c 21.9 ± 1.2d 1.26 ± 0.06c0.25 23.7 ± 0.7b 76.6 ± 0.6b 46.6 ± 2.3b 1.39 ± 0.07b0.50 26.7 ± 0.7a 81.9 ± 0.7a 51.2 ± 2.6a 1.58 ± 0.09a1 18.0 ± 0.5c 76.9 ± 0.6b 32.0 ± 1.7c 1.43 ± 0.07bMeans 18.9A 77.0A 37.9A 1.42A
Mean values (n = 9) in the same column for each trait with the same lower small orupper bold-case letters are not significantly different by Duncan's multiple range test atP ≤ 0.05.mM = millimole; g = gram; Var. = variety; G 40 = Giza 40; G 429 = Giza 429.Measurements were made in 50-day-old plants.
Table 7Effect of exogenously appliedα-tocopherol (αTOC; mM) on the leaf anatomy of two vari-eties of Vicia faba L. grown in reclaimed-saline calcareous soil.
Treatment Leaf bladethickness (μ)
Midveinthickness(μ)
Vascularbundlelength (μ)
Vascularbundlewidth (μ)
No. ofxylemvessels
Var. αTOC
G 40 0 420 800 200 200 150.25 450 800 240 150 260.50 490 820 250 160 381 430 840 230 150 32Means 448 815 230 165 28
G 429 0 430 730 250 200 210.25 410 750 220 180 180.50 600 1050 280 250 251 400 740 210 170 20Means 460 818 240 200 21
Mean values (n = 1).mM = millimole; μ = micrometer; Var.=variety; G 40 = Giza 40; G 429 = Giza 429.Measurements were made in 50-day-old plants.
28 W.M. Semida et al. / South African Journal of Botany 95 (2014) 24–31
exceeding the control values in Giza 40 and Giza 429 by 205.1 and265.8%, 23.6 and 13.0%, 127.4 and 133.8%, and 18.3 and 25.4% for theabovementioned yield and its components, respectively. Giza 429 wasgenerated more yield and its components than Giza 40.
3.5. Stem and leaf anatomy of V. faba L. varieties
Plants of the two faba bean varieties sprayed with 0.25, 0.50 and1.0 mM αTOC had improved stem and leaf anatomy compared to theanatomy of tap water-sprayed control plants (Tables 6, 7 and Figs. 1,2). In general, the best αTOC level was 0.50 mM that increased stemlength, stemwidth, stem pith diameter, leaf blade thickness, leaf vascu-lar bundle length and number of leaf xylem vessels in the Giza 40 andGiza 429 varieties by 28.6 and 47.0%, 26.8 and 36.4%, 38.7 and 47.4%,16.7 and 39.5%, 25.0 and 12.0%, and 153.3 and 19.0%, respectively com-pared to the controls. There is a better anatomy in favor of Giza 429 thanthat of Giza 40.
4. Discussion
Agricultural productivity faces a great problemdue to salinityworld-wide, particularly in the arid and semiarid areas in which salinity couldbe caused by many factors. Low rainfall, high evaporation rate, poor ir-rigation water that contains considerable amounts of salts, poor water
Table 6Effect of exogenously appliedα-tocopherol (αTOC; mM) on the stem anatomy of two va-rieties of Vicia faba L. grown in reclaimed-saline calcareous soil.
Treatment Dimensions ofstem (μ):
Cortexthickness (μ)
Pithdiameter (μ)
Vesselsdiameter (μ)
Var. αTOC Length Width
G 40 0 3125 3175 40 1875 300.25 3875 4000 50 2350 450.50 4000 4025 60 2600 471 3700 3760 55 2325 50Means 3675 3740 51 2288 43
G 429 0 2925 3300 50 1950 400.25 4125 4150 100 2625 400.50 4300 4500 94 2875 431 4000 4050 69 2675 38Means 3838 4000 78 2531 40
Mean values (n = 1).mM = millimole; μ = micrometer; Var.=variety; G 40 = Giza 40; G 429 = Giza 429.Measurements were made in 50-day-old plants.
management, accumulation of salts in the top layer of the soil due toover-irrigation, proximity to the sea, and the capillarity rise of saltsfrom underground water into the root zone due to excessive evapora-tion are examples of the factors that could cause salinity relatedproblems in these areas (Rady et al., 2013). In this study, the reductionin plant growth under the adverse conditions of the tested newly-reclaimed saline soil could be attributed to the osmotic effect resultingfrom salt stress, which causes increases in growth inhibitors(i.e., abscisic acid), reductions in growth promoters [i.e., indole-3-acetic acid (IAA) and gibberellins] and disturbances in thewater balanceof the stressed plants, leading to stomatal closure, ionic imbalance, re-duction in photosynthesis, accumulation of toxic ions and consequentlyinhibition of growth (Shalata and Neumann, 2001; Qiu et al., 2007;Rady, 2011; Rady et al., 2013; Semida and Rady, 2014).
Spraying plants with αTOC significantly improved plant growthcharacteristics of faba beans, particularly at 0.50 mM. Bosch (1995) re-ported that a wide range of plant reactions exist to circumvent the po-tentially harmful effects caused by biotic or abiotic stresses. αTOC isthe major vitamin E compound found in leaf chloroplasts, where it islocated in the chloroplast envelope, thylakoid membranes andplastoglobuli. This antioxidant deactivates photosynthesis-derived re-active oxygen species (ROS) (mainly 1O2 and OH), and prevents thepropagation of lipid peroxidation by scavenging lipid peroxyl radicalsin thylakoid membranes. αTOC levels change differentially in responseto environmental constraints, depending on themagnitude of the stressand species-sensitivity to stress.
Under the adverse conditions of the tested soil (i.e., EC = 8.88–8.95 dS m−1 and pH = 7.74–7.80), foliar application of αTOC was sig-nificantly effective in increasing plant growth traits. The magnitude ofincreaseswasmore pronounced particularly at 0.50mMαTOC as repre-sented in our data (Table 1). αTOC considers an important part of theplant defensemachinery maintaining the integrity and normal functionof the photosynthetic apparatus (Liu et al., 2008) that confirm the sig-nificant increase in performance index (PI) and a slightly increment inFv/Fm by the application of αTOC under salt stress (Table 2). αTOCacts directly to neutralize superoxide radicals or singlet oxygen inplant cells (Foyer andNoctor, 2005). It has effects onmanyphysiologicalprocesses including the regulation of growth, differentiation and me-tabolism of plants under saline conditions and increasing physiologicalavailability of water and nutrients (Azooz et al., 2002; Barakat, 2003).In addition, αTOC protects metabolic processes against H2O2 andother toxic derivatives of oxygen, affects many enzyme activities, mini-mizes the damage caused by oxidative processes through synergic func-tion with other antioxidants and stabilizes membranes (Cvelkorskaet al., 2005; Pourcel et al., 2007; Shao et al., 2008), and consequently
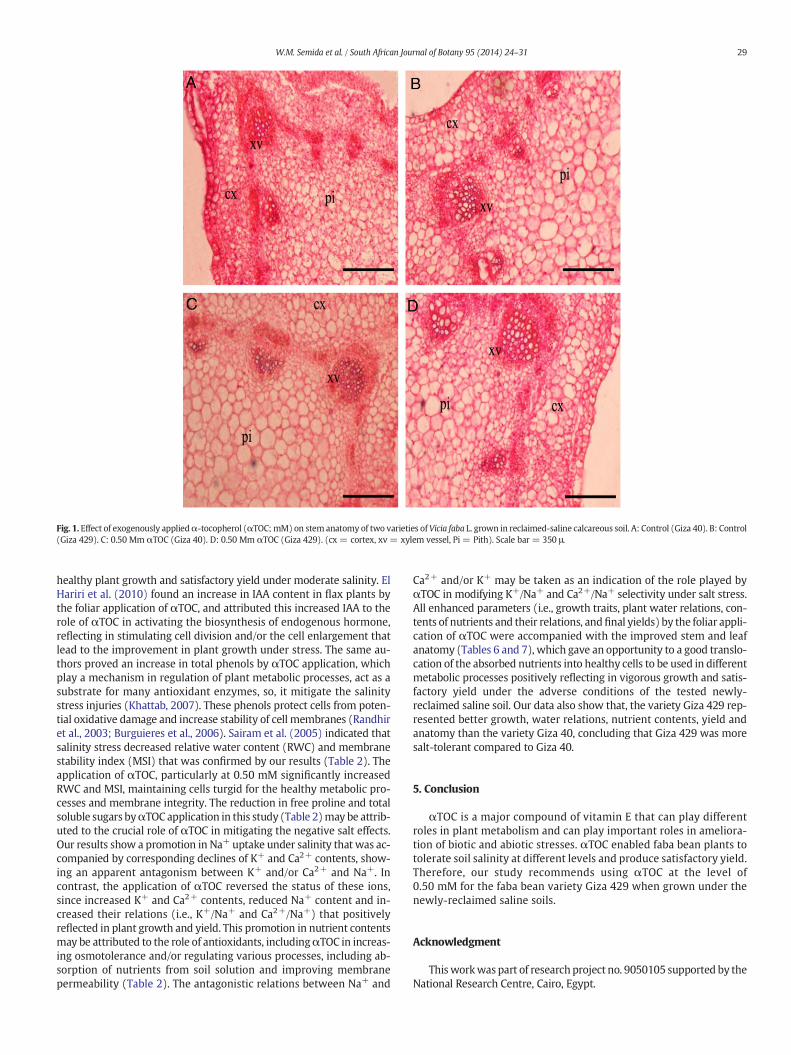
Fig. 1. Effect of exogenously appliedα-tocopherol (αTOC;mM) on stem anatomy of two varieties of Vicia faba L. grown in reclaimed-saline calcareous soil. A: Control (Giza 40). B: Control(Giza 429). C: 0.50 Mm αTOC (Giza 40). D: 0.50 Mm αTOC (Giza 429). (cx = cortex, xv = xylem vessel, Pi = Pith). Scale bar = 350 μ.
29W.M. Semida et al. / South African Journal of Botany 95 (2014) 24–31
healthy plant growth and satisfactory yield under moderate salinity. ElHariri et al. (2010) found an increase in IAA content in flax plants bythe foliar application of αTOC, and attributed this increased IAA to therole of αTOC in activating the biosynthesis of endogenous hormone,reflecting in stimulating cell division and/or the cell enlargement thatlead to the improvement in plant growth under stress. The same au-thors proved an increase in total phenols by αTOC application, whichplay a mechanism in regulation of plant metabolic processes, act as asubstrate for many antioxidant enzymes, so, it mitigate the salinitystress injuries (Khattab, 2007). These phenols protect cells from poten-tial oxidative damage and increase stability of cell membranes (Randhiret al., 2003; Burguieres et al., 2006). Sairam et al. (2005) indicated thatsalinity stress decreased relative water content (RWC) and membranestability index (MSI) that was confirmed by our results (Table 2). Theapplication of αTOC, particularly at 0.50 mM significantly increasedRWC and MSI, maintaining cells turgid for the healthy metabolic pro-cesses and membrane integrity. The reduction in free proline and totalsoluble sugars byαTOC application in this study (Table 2)may be attrib-uted to the crucial role of αTOC in mitigating the negative salt effects.Our results show a promotion in Na+ uptake under salinity that was ac-companied by corresponding declines of K+ and Ca2+ contents, show-ing an apparent antagonism between K+ and/or Ca2+ and Na+. Incontrast, the application of αTOC reversed the status of these ions,since increased K+ and Ca2+ contents, reduced Na+ content and in-creased their relations (i.e., K+/Na+ and Ca2+/Na+) that positivelyreflected in plant growth and yield. This promotion in nutrient contentsmay be attributed to the role of antioxidants, includingαTOC in increas-ing osmotolerance and/or regulating various processes, including ab-sorption of nutrients from soil solution and improving membranepermeability (Table 2). The antagonistic relations between Na+ and
Ca2+ and/or K+ may be taken as an indication of the role played byαTOC in modifying K+/Na+ and Ca2+/Na+ selectivity under salt stress.All enhanced parameters (i.e., growth traits, plant water relations, con-tents of nutrients and their relations, andfinal yields) by the foliar appli-cation of αTOC were accompanied with the improved stem and leafanatomy (Tables 6 and 7), which gave an opportunity to a good translo-cation of the absorbed nutrients into healthy cells to be used in differentmetabolic processes positively reflecting in vigorous growth and satis-factory yield under the adverse conditions of the tested newly-reclaimed saline soil. Our data also show that, the variety Giza 429 rep-resented better growth, water relations, nutrient contents, yield andanatomy than the variety Giza 40, concluding that Giza 429 was moresalt-tolerant compared to Giza 40.
5. Conclusion
αTOC is a major compound of vitamin E that can play differentroles in plant metabolism and can play important roles in ameliora-tion of biotic and abiotic stresses. αTOC enabled faba bean plants totolerate soil salinity at different levels and produce satisfactory yield.Therefore, our study recommends using αTOC at the level of0.50 mM for the faba bean variety Giza 429 when grown under thenewly-reclaimed saline soils.
Acknowledgment
Thisworkwas part of research project no. 9050105 supported by theNational Research Centre, Cairo, Egypt.
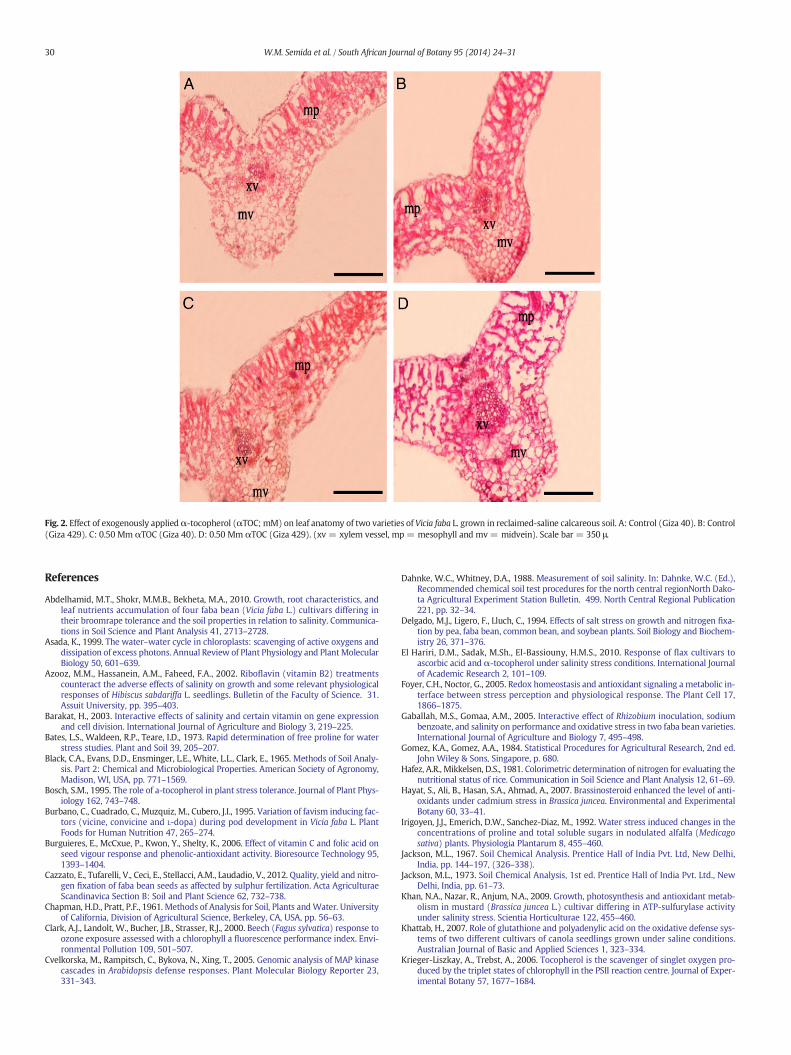
Fig. 2. Effect of exogenously appliedα-tocopherol (αTOC; mM) on leaf anatomy of two varieties of Vicia faba L. grown in reclaimed-saline calcareous soil. A: Control (Giza 40). B: Control(Giza 429). C: 0.50 Mm αTOC (Giza 40). D: 0.50 Mm αTOC (Giza 429). (xv = xylem vessel, mp = mesophyll and mv= midvein). Scale bar = 350 μ.
30 W.M. Semida et al. / South African Journal of Botany 95 (2014) 24–31
References
Abdelhamid, M.T., Shokr, M.M.B., Bekheta, M.A., 2010. Growth, root characteristics, andleaf nutrients accumulation of four faba bean (Vicia faba L.) cultivars differing intheir broomrape tolerance and the soil properties in relation to salinity. Communica-tions in Soil Science and Plant Analysis 41, 2713–2728.
Asada, K., 1999. The water–water cycle in chloroplasts: scavenging of active oxygens anddissipation of excess photons. Annual Review of Plant Physiology and PlantMolecularBiology 50, 601–639.
Azooz, M.M., Hassanein, A.M., Faheed, F.A., 2002. Riboflavin (vitamin B2) treatmentscounteract the adverse effects of salinity on growth and some relevant physiologicalresponses of Hibiscus sabdariffa L. seedlings. Bulletin of the Faculty of Science. 31.Assuit University, pp. 395–403.
Barakat, H., 2003. Interactive effects of salinity and certain vitamin on gene expressionand cell division. International Journal of Agriculture and Biology 3, 219–225.
Bates, L.S., Waldeen, R.P., Teare, I.D., 1973. Rapid determination of free proline for waterstress studies. Plant and Soil 39, 205–207.
Black, C.A., Evans, D.D., Ensminger, L.E., White, L.L., Clark, E., 1965. Methods of Soil Analy-sis. Part 2: Chemical and Microbiological Properties. American Society of Agronomy,Madison, WI, USA, pp. 771–1569.
Bosch, S.M., 1995. The role of a-tocopherol in plant stress tolerance. Journal of Plant Phys-iology 162, 743–748.
Burbano, C., Cuadrado, C., Muzquiz, M., Cubero, J.I., 1995. Variation of favism inducing fac-tors (vicine, convicine and L-dopa) during pod development in Vicia faba L. PlantFoods for Human Nutrition 47, 265–274.
Burguieres, E., McCxue, P., Kwon, Y., Shelty, K., 2006. Effect of vitamin C and folic acid onseed vigour response and phenolic-antioxidant activity. Bioresource Technology 95,1393–1404.
Cazzato, E., Tufarelli, V., Ceci, E., Stellacci, A.M., Laudadio, V., 2012. Quality, yield and nitro-gen fixation of faba bean seeds as affected by sulphur fertilization. Acta AgriculturaeScandinavica Section B: Soil and Plant Science 62, 732–738.
Chapman, H.D., Pratt, P.F., 1961. Methods of Analysis for Soil, Plants andWater. Universityof California, Division of Agricultural Science, Berkeley, CA, USA, pp. 56–63.
Clark, A.J., Landolt, W., Bucher, J.B., Strasser, R.J., 2000. Beech (Fagus sylvatica) response toozone exposure assessed with a chlorophyll a fluorescence performance index. Envi-ronmental Pollution 109, 501–507.
Cvelkorska, M., Rampitsch, C., Bykova, N., Xing, T., 2005. Genomic analysis of MAP kinasecascades in Arabidopsis defense responses. Plant Molecular Biology Reporter 23,331–343.
Dahnke, W.C., Whitney, D.A., 1988. Measurement of soil salinity. In: Dahnke, W.C. (Ed.),Recommended chemical soil test procedures for the north central regionNorth Dako-ta Agricultural Experiment Station Bulletin. 499. North Central Regional Publication221, pp. 32–34.
Delgado, M.J., Ligero, F., Lluch, C., 1994. Effects of salt stress on growth and nitrogen fixa-tion by pea, faba bean, common bean, and soybean plants. Soil Biology and Biochem-istry 26, 371–376.
El Hariri, D.M., Sadak, M.Sh., El-Bassiouny, H.M.S., 2010. Response of flax cultivars toascorbic acid and α-tocopherol under salinity stress conditions. International Journalof Academic Research 2, 101–109.
Foyer, C.H., Noctor, G., 2005. Redox homeostasis and antioxidant signaling a metabolic in-terface between stress perception and physiological response. The Plant Cell 17,1866–1875.
Gaballah, M.S., Gomaa, A.M., 2005. Interactive effect of Rhizobium inoculation, sodiumbenzoate, and salinity on performance and oxidative stress in two faba bean varieties.International Journal of Agriculture and Biology 7, 495–498.
Gomez, K.A., Gomez, A.A., 1984. Statistical Procedures for Agricultural Research, 2nd ed.John Wiley & Sons, Singapore, p. 680.
Hafez, A.R., Mikkelsen, D.S., 1981. Colorimetric determination of nitrogen for evaluating thenutritional status of rice. Communication in Soil Science and Plant Analysis 12, 61–69.
Hayat, S., Ali, B., Hasan, S.A., Ahmad, A., 2007. Brassinosteroid enhanced the level of anti-oxidants under cadmium stress in Brassica juncea. Environmental and ExperimentalBotany 60, 33–41.
Irigoyen, J.J., Emerich, D.W., Sanchez-Diaz, M., 1992. Water stress induced changes in theconcentrations of proline and total soluble sugars in nodulated alfalfa (Medicagosativa) plants. Physiologia Plantarum 8, 455–460.
Jackson, M.L., 1967. Soil Chemical Analysis. Prentice Hall of India Pvt. Ltd, New Delhi,India, pp. 144–197, (326–338).
Jackson, M.L., 1973. Soil Chemical Analysis, 1st ed. Prentice Hall of India Pvt. Ltd., NewDelhi, India, pp. 61–73.
Khan, N.A., Nazar, R., Anjum, N.A., 2009. Growth, photosynthesis and antioxidant metab-olism in mustard (Brassica juncea L.) cultivar differing in ATP-sulfurylase activityunder salinity stress. Scientia Horticulturae 122, 455–460.
Khattab, H., 2007. Role of glutathione and polyadenylic acid on the oxidative defense sys-tems of two different cultivars of canola seedlings grown under saline conditions.Australian Journal of Basic and Applied Sciences 1, 323–334.
Krieger-Liszkay, A., Trebst, A., 2006. Tocopherol is the scavenger of singlet oxygen pro-duced by the triplet states of chlorophyll in the PSII reaction centre. Journal of Exper-imental Botany 57, 1677–1684.
31W.M. Semida et al. / South African Journal of Botany 95 (2014) 24–31
Liu, X., Hua, X., Guo, J., Qi, D., Wang, L., Liu, Z., Jin, S., Chen, S., Liu, G., 2008. Enhanced tol-erance to drought stress in transgenic tobacco plants overexpressing VTE1 for in-creased tocopherol production from Arabidopsis thaliana. Biotechnology Letters 30,1275–1280.
Mass, E.V., Hoffman, G.J., 1977. Crop salt tolerance: current assessment. American Societyof Civil Engineers 103, 115–134.
Maxwell, K., Johnson, G.N., 2000. Chlorophyll fluorescence — a practical guide. Journal ofExperimental Botany 51, 659–668.
Munns, R., 2005. Genes and salt tolerance: bringing them together. The New Phytologist167, 645–663.
Munns, R., James, R., Läuchli, A., 2006. Approaches to increasing the salt tolerance ofwheat and other cereals. Journal of Experimental Botany 53, 39–47.
Nachi, N., Guen, J.L., 1996. Dry matter accumulation and seed yield in faba bean (Vicia fabaL.) genotypes. Agronomie 16, 47–59.
Nazar, R., Iqbal, N., Masood, A., Syeed, S., Khan, N.A., 2011. Understanding the significanceof sulphur in improving salinity tolerance plants. Environmental and ExperimentalBotany 70, 80–87.
Noble, C.L., Rogers, M.E., 1992. Arguments for the use of physiological criteria for improv-ing the salt tolerance in crops. Plant and Soil 146, 99–107.
Page, A.I., Miller, R.H., Keeny, D.R., 1982. Methods of soil analysis. Part II, Chemical andMi-crobiological Methods2nd ed. American Society of Agronomy, Madison, WI, USA, pp.225–246.
Pourcel, L., Routaboul, J.M., Cheynier, V., 2007. Flavonoid oxidation in plants: from bio-chemical properties to physiological functions. Trends in Plant Science 12, 29–36.
Qiu, D.-L., Lin, P., Guo, S.Z., 2007. Effects of salinity on leaf characteristics and CO2/H2O ex-change of Kandelia candel (L.) druce seedlings. Journal of Forest Science 53, 13–19.
Rady, M.M., 2011. Effect of 24-epibrassinolide on growth, yield, antioxidant system andcadmium content of bean (Phaseolus vulgaris L.) plants under salinity and cadmiumstress. Scientia Horticulturae 129, 232–237.
Rady, M.M., Bhavya Varma, C., Howladar, S.M., 2013. Common bean (Phaseolus vulgaris L.)seedlings overcome NaCl stress as a result of presoaking in Moringa oleifera leaf ex-tract. Scientia Horticulturae 162, 63–70.
Randhir, R., Sehtty, P., Shetty, K., 2003. L-DOPA and total phenolic stimulation in dark ger-minated faba bean in response to peptide and phytochemical eliciters. Process Bio-chemistry 37, 1247–1256.
Saha, P., Chatterjee, P., Biswas, A.K., 2010. NaCl pre-treatment alleviates salt stress by en-hancement of antioxidant defense system and osmolyte accumulation in mungbean(Vigna radiata L. Wilczek). Indian Journal of Experimental Biology 48, 593–600.
Sairam, R.K., Snvastava, G.C., Aganwal, S., Meena, R.C., 2005. Differences in antioxidant ac-tivity in response to salinity stress in tolerant and susceptible wheat genotypes.Biologia Plantarum 49, 85–91.
Sairam, R.K., Tyagi, A., 2004. Physiology and molecular biology of salinity stress tolerancein plants. Current Science 86, 407–421.
Sass, J.A., 1961. Botanical Microtechnique, 3rd ed. The Iowa State Univ. Press, Ames. Iowa,USA.
Saxena, N.P., Johansen, C., Saxena, M.C., Silim, S.N., 1993. Selection for drought and salinitytolerance in cool-season food legumes. In: Singh, K.B., Saxena, M.C. (Eds.), Breedingfor Stress Tolerance in Cool-Season Food Legumes. John Wiley & Sons, New York,pp. 245–270.
Semida, W.M., Rady, M.M., 2014. Presoaking application of propolis and maize grain ex-tracts alleviates salinity stress in common bean (Phaseolus vulgaris L.). ScientiaHorticulturae 168, 210–217.
Shalata, A., Neumann, P., 2001. Exogenous ascorbic acid (vitamin C) increases resistanceto salt stress and reduces lipid peroxidation. Journal of Experimental Botany 52,2207–2211.
Shao, H.B., Chu, L.Y., Zhao, H.L., Kang, C., 2008. Primary antioxidant free radical scavengingand redox signaling pathways in higher plant cells. International Journal of BiologicalSciences 4, 8–14.
Subbarao, G.V., Johansen, C.J., 1993. Potential for genetic improvement in salinity toler-ance in legumes. In: Pessarakli, M. (Ed.), Handbook of Plant and Crop Stress. MarcelDekker, New York, pp. 581–591.
Wise, R.R., Naylor, A.W., 1987. Chilling enhanced photo-oxidation. Plant Physiology 83,278–282.
Yasar, F., Kusvuran, S., Elialtio lu, S., 2006. Determination of antioxidant activities in somemelon (Cucumis melo L.) varieties and cultivars under salt stress. Journal of Horticul-tural Sciences and Biotechnology 81, 627–630.
Zhang, X., Schmidt, R.E., 2000. Hormone-containing products' impact on antioxidant sta-tus of tall fescue and creeping bent grass subjected to drought. Crop Science 40,1344–1349.


![A colorimetric method for α-glucosidase activity assay … · reversibly bind diols with high affinity to form cyclic esters [23]. Herein, based on these findings, a ...](https://static.fdocument.org/doc/165x107/5b696db67f8b9a24488e21b4/a-colorimetric-method-for-glucosidase-activity-assay-reversibly-bind-diols.jpg)