Section 6.6 - Phase Shift; Sinusoidal Curve Fitting Section 6.6 - Phase Shift; Sinusoidal Curve...
10
53 Section 6.6 - Phase Shift; Sinusoidal Curve Fitting Objective 1 Graph Trigonometric Functions with a Phase Shift. We have graphed trigonometric functions in the form of y = A•f(ωx) + B where |A| was the amplitude, and B was the vertical shift. The period for the sine, cosine, secant, and cosecant was T = 2π ω while the tangent and cotangent had a period of π ω . Now, we want to discuss trigonometric functions with a horizontal shift or what we call a phase shift. We will use a Greek letter φ (phi) to help us do this. Consider the function y = Asin(ωx – φ). To trace out one period of this function, the angle will range from 0 to 2π. Thus, 0 ≤ ωx – φ ≤ 2π (solve for x) φ ≤ ωx ≤ 2π + φ φ ω ≤ x ≤ 2π ω + φ ω = T + φ ω Thus, the graph will be shifted by φ ω horizontally. So, the phase shift is φ ω . The graph of y = A•trig(ωx – φ) + B has the following properties: Amplitude = |A| Phase shift = φ ω Vertical Shift = B Period = 2π ω for sine, cosine, secant, and cosecant Period = π ω for tangent and cotangent. An easy way to find the period and phase shift is set the angle in between the angle the parent trigonometric function starts and ends for one cycle and solve for x. The difference in the lower value endpoint and where the parent function starts is the phase shift and the difference between the two endpoints is the period. To graph the function, we will use the endpoints, the midpoint between the endpoints and the midpoints between the midpoint and the endpoint. Graph the following: Ex. 1a y = 3sin(2x + π) – 2 Ex. 1b y = tan(3x – π 2 ) Solution: a) For one cycle of sin(x), the angle ranges between 0 and 2π. Set 2x + π between 0 and 2π and solve:
Transcript of Section 6.6 - Phase Shift; Sinusoidal Curve Fitting Section 6.6 - Phase Shift; Sinusoidal Curve...

53
Section 6.6 - Phase Shift; Sinusoidal Curve Fitting Objective 1 Graph Trigonometric Functions with a Phase Shift.
We have graphed trigonometric functions in the form of y = A•f(ωx) + B where |A| was the amplitude, and B was the vertical shift. The period for the
sine, cosine, secant, and cosecant was T = 2π
ω while the tangent and
cotangent had a period of π
ω. Now, we want to discuss trigonometric
functions with a horizontal shift or what we call a phase shift. We will use a
Greek letter φ (phi) to help us do this. Consider the function
y = Asin(ωx – φ). To trace out one period of this function, the angle will range from 0 to 2π. Thus,
0 ≤ ωx – φ ≤ 2π (solve for x)
φ ≤ ωx ≤ 2π + φ
φ
ω ≤ x ≤
2π
ω +
φ
ω = T +
φ
ω
Thus, the graph will be shifted by φ
ω horizontally. So, the phase shift is
φ
ω.
The graph of y = A•trig(ωx – φ) + B has the following properties:
Amplitude = |A| Phase shift = φ
ω Vertical Shift = B
Period = 2π
ω for sine, cosine, secant, and cosecant
Period = π
ω for tangent and cotangent.
An easy way to find the period and phase shift is set the angle in between the angle the parent trigonometric function starts and ends for one cycle and solve for x. The difference in the lower value endpoint and where the parent function starts is the phase shift and the difference between the two endpoints is the period. To graph the function, we will use the endpoints, the midpoint between the endpoints and the midpoints between the midpoint and the endpoint. Graph the following:
Ex. 1a y = 3sin(2x + π) – 2 Ex. 1b y = tan(3x – π
2)
Solution: a) For one cycle of sin(x), the angle ranges between 0 and 2π. Set 2x + π between 0 and 2π and solve:
54
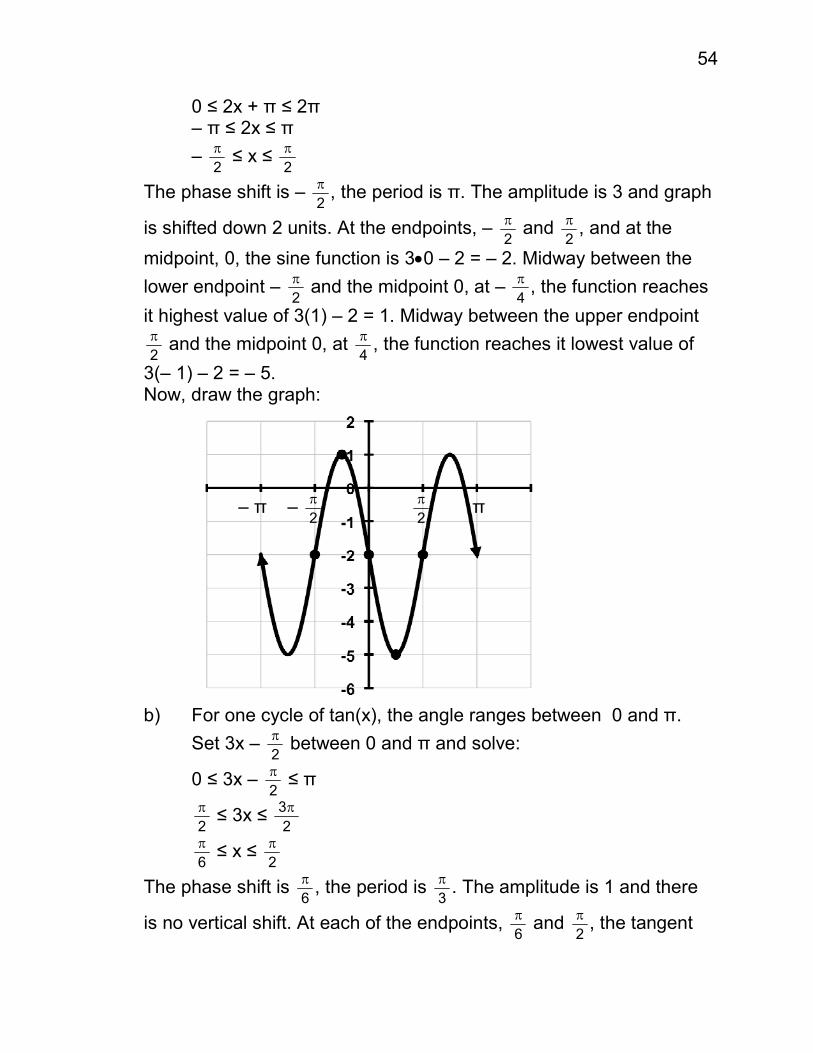
0 ≤ 2x + π ≤ 2π – π ≤ 2x ≤ π
– π
2 ≤ x ≤
π
2
The phase shift is – π
2, the period is π. The amplitude is 3 and graph
is shifted down 2 units. At the endpoints, – π
2 and
π
2, and at the
midpoint, 0, the sine function is 3•0 – 2 = – 2. Midway between the
lower endpoint – π
2 and the midpoint 0, at –
π
4, the function reaches
it highest value of 3(1) – 2 = 1. Midway between the upper endpoint
π
2 and the midpoint 0, at
π
4, the function reaches it lowest value of
3(– 1) – 2 = – 5. Now, draw the graph:
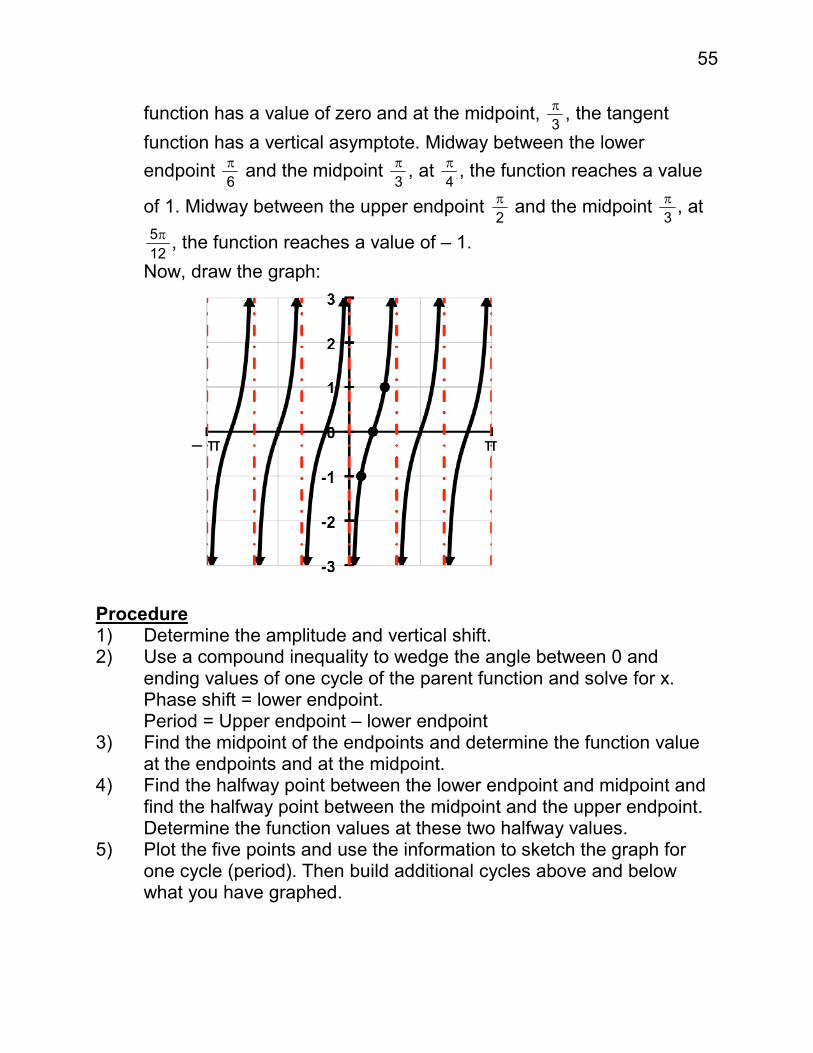
b) For one cycle of tan(x), the angle ranges between 0 and π.
Set 3x – π
2 between 0 and π and solve:
0 ≤ 3x – π
2 ≤ π
π
2 ≤ 3x ≤
3π
2
π
6 ≤ x ≤
π
2
The phase shift is π
6, the period is
π
3. The amplitude is 1 and there
is no vertical shift. At each of the endpoints, π
6 and
π
2, the tangent
– π – π
2
π
2 π
55
function has a value of zero and at the midpoint, π
3, the tangent
function has a vertical asymptote. Midway between the lower
endpoint π
6 and the midpoint
π
3, at
π
4, the function reaches a value
of 1. Midway between the upper endpoint π
2 and the midpoint
π
3, at
5π
12, the function reaches a value of – 1.
Now, draw the graph:
Procedure 1) Determine the amplitude and vertical shift. 2) Use a compound inequality to wedge the angle between 0 and ending values of one cycle of the parent function and solve for x. Phase shift = lower endpoint. Period = Upper endpoint – lower endpoint 3) Find the midpoint of the endpoints and determine the function value at the endpoints and at the midpoint. 4) Find the halfway point between the lower endpoint and midpoint and find the halfway point between the midpoint and the upper endpoint. Determine the function values at these two halfway values. 5) Plot the five points and use the information to sketch the graph for one cycle (period). Then build additional cycles above and below what you have graphed.
– π π
56
Sketch the graph of the following:
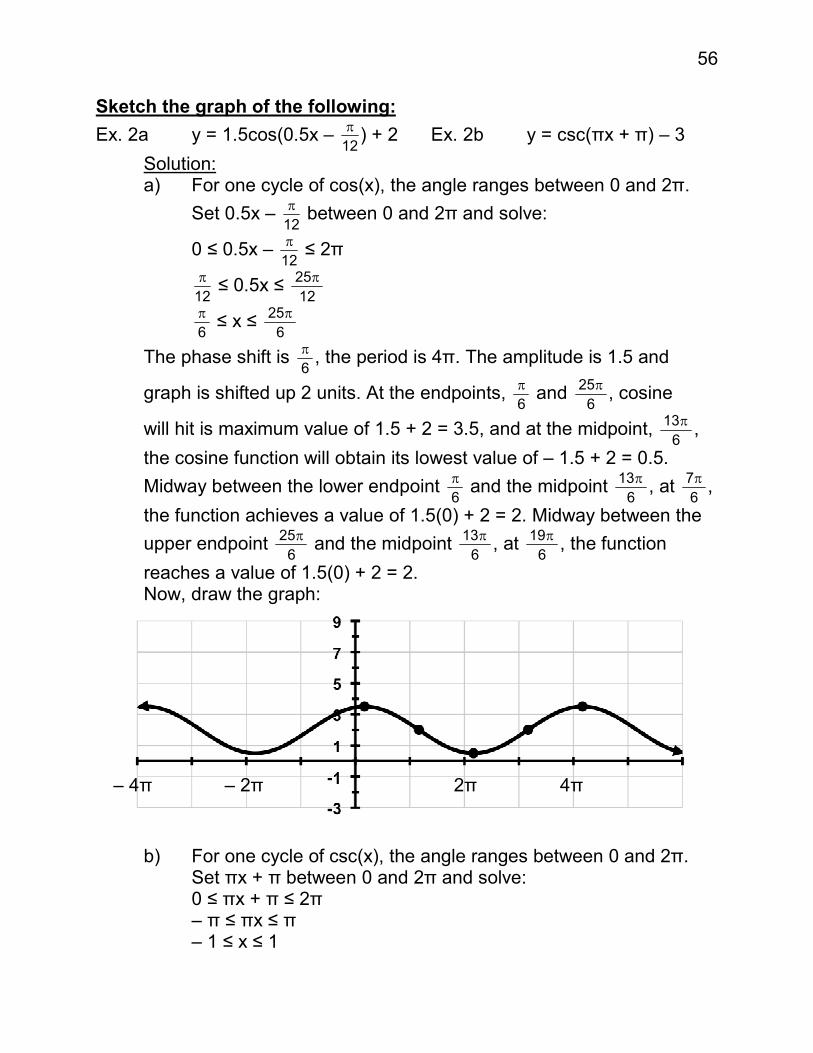
Ex. 2a y = 1.5cos(0.5x – π
12) + 2 Ex. 2b y = csc(πx + π) – 3
Solution: a) For one cycle of cos(x), the angle ranges between 0 and 2π.
Set 0.5x – π
12 between 0 and 2π and solve:
0 ≤ 0.5x – π
12 ≤ 2π
π
12 ≤ 0.5x ≤
25π
12
π
6 ≤ x ≤
25π
6
The phase shift is π
6, the period is 4π. The amplitude is 1.5 and
graph is shifted up 2 units. At the endpoints, π
6 and
25π
6, cosine
will hit is maximum value of 1.5 + 2 = 3.5, and at the midpoint, 13π
6,
the cosine function will obtain its lowest value of – 1.5 + 2 = 0.5.
Midway between the lower endpoint π
6 and the midpoint
13π
6, at
7π
6,
the function achieves a value of 1.5(0) + 2 = 2. Midway between the
upper endpoint 25π
6 and the midpoint
13π
6, at
19π
6, the function
reaches a value of 1.5(0) + 2 = 2. Now, draw the graph:
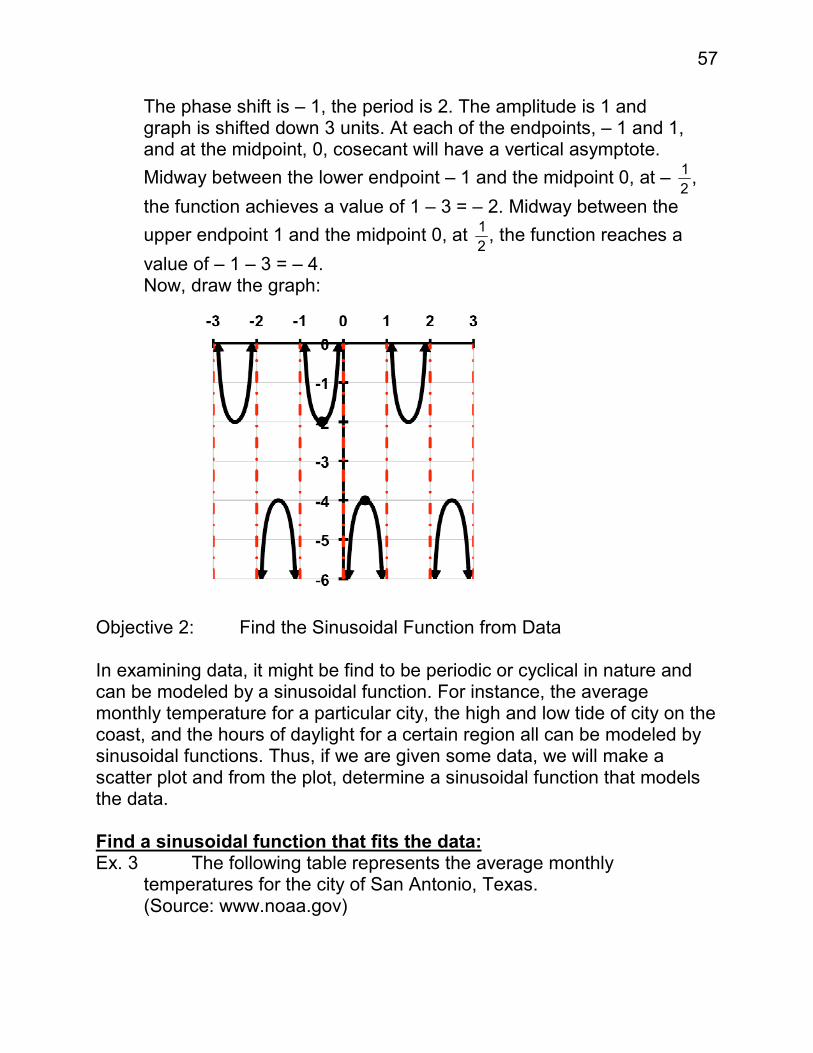
b) For one cycle of csc(x), the angle ranges between 0 and 2π. Set πx + π between 0 and 2π and solve: 0 ≤ πx + π ≤ 2π – π ≤ πx ≤ π – 1 ≤ x ≤ 1
– 4π – 2π 2π 4π
57
The phase shift is – 1, the period is 2. The amplitude is 1 and graph is shifted down 3 units. At each of the endpoints, – 1 and 1, and at the midpoint, 0, cosecant will have a vertical asymptote.
Midway between the lower endpoint – 1 and the midpoint 0, at – 1
2,
the function achieves a value of 1 – 3 = – 2. Midway between the
upper endpoint 1 and the midpoint 0, at 1
2, the function reaches a
value of – 1 – 3 = – 4. Now, draw the graph:
Objective 2: Find the Sinusoidal Function from Data In examining data, it might be find to be periodic or cyclical in nature and can be modeled by a sinusoidal function. For instance, the average monthly temperature for a particular city, the high and low tide of city on the coast, and the hours of daylight for a certain region all can be modeled by sinusoidal functions. Thus, if we are given some data, we will make a scatter plot and from the plot, determine a sinusoidal function that models the data. Find a sinusoidal function that fits the data: Ex. 3 The following table represents the average monthly temperatures for the city of San Antonio, Texas. (Source: www.noaa.gov)
58
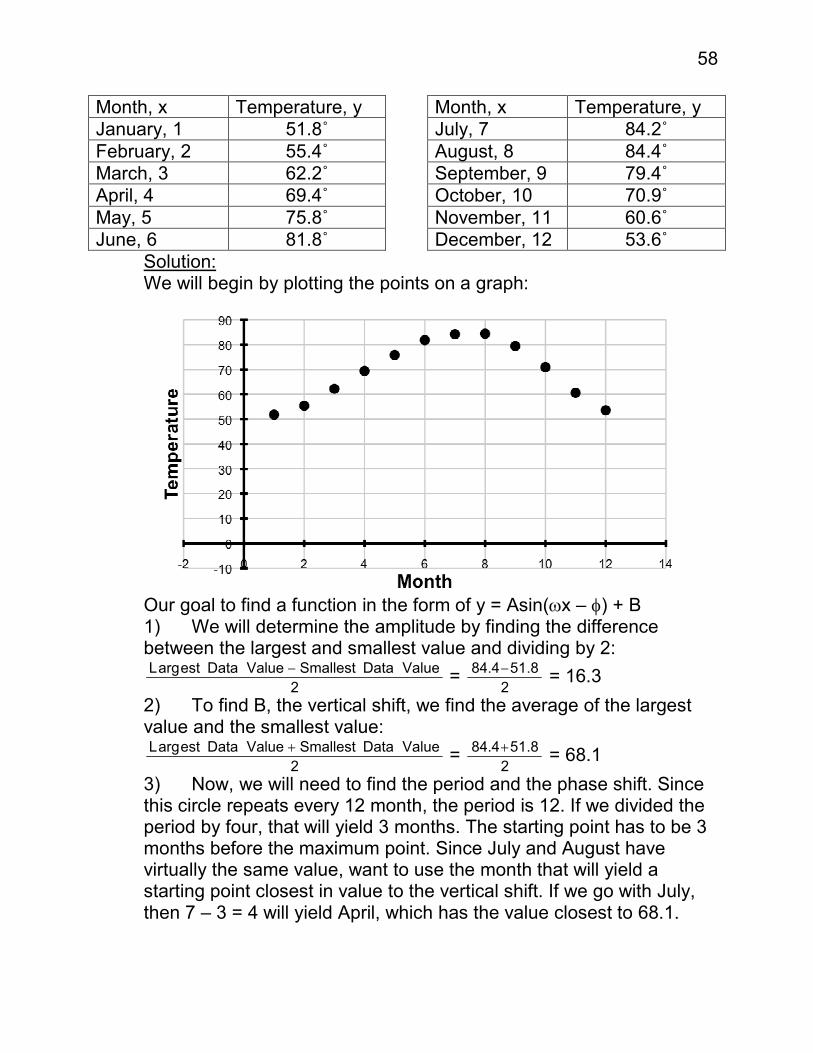
Month, x Temperature, y Month, x Temperature, y January, 1 51.8˚ July, 7 84.2˚
February, 2 55.4˚ August, 8 84.4˚ March, 3 62.2˚ September, 9 79.4˚ April, 4 69.4˚ October, 10 70.9˚
May, 5 75.8˚ November, 11 60.6˚ June, 6 81.8˚ December, 12 53.6˚ Solution: We will begin by plotting the points on a graph:
Our goal to find a function in the form of y = Asin(ωx – φ) + B 1) We will determine the amplitude by finding the difference between the largest and smallest value and dividing by 2:
Largest Data Value − Smallest Data Value
2 =
84.4−51.8
2 = 16.3
2) To find B, the vertical shift, we find the average of the largest value and the smallest value:
Largest Data Value + Smallest Data Value
2 =
84.4+51.8
2 = 68.1
3) Now, we will need to find the period and the phase shift. Since this circle repeats every 12 month, the period is 12. If we divided the period by four, that will yield 3 months. The starting point has to be 3 months before the maximum point. Since July and August have virtually the same value, want to use the month that will yield a starting point closest in value to the vertical shift. If we go with July, then 7 – 3 = 4 will yield April, which has the value closest to 68.1.
59
Thus, the value of x has to range from 4 to 4 + 12 = 16, meaning that the phase shift is 4. We will wedge x between 4 and 16 and manipulate the inequality until the angle is between 0 and 2π.
4 ≤ x ≤ 16 (subtract 4) 0 ≤ x – 4 ≤ 12 (divide by 6)
0 ≤ 1
6x –
2
3 ≤ 2 (multiply by π)
0 ≤ π
6x –
2π
3 ≤ 2π Thus, our angle is
π
6x –
2π
3 =
π
6 (x – 4).
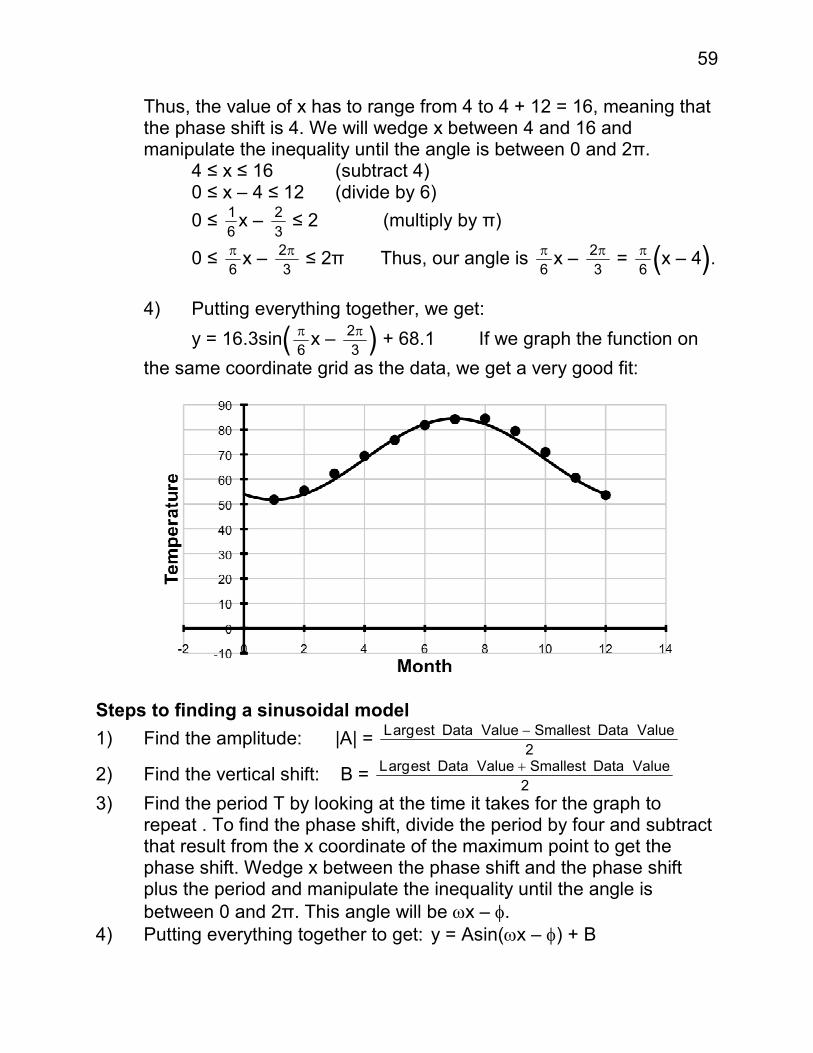
4) Putting everything together, we get:
y = 16.3sin( π
6x –
2π
3 ) + 68.1 If we graph the function on
the same coordinate grid as the data, we get a very good fit:
Steps to finding a sinusoidal model
1) Find the amplitude: |A| = Largest Data Value − Smallest Data Value
2
2) Find the vertical shift: B = Largest Data Value + Smallest Data Value
2
3) Find the period T by looking at the time it takes for the graph to repeat . To find the phase shift, divide the period by four and subtract that result from the x coordinate of the maximum point to get the phase shift. Wedge x between the phase shift and the phase shift plus the period and manipulate the inequality until the angle is
between 0 and 2π. This angle will be ωx – φ.
4) Putting everything together to get: y = Asin(ωx – φ) + B
60
Find a following Ex. 4 For the city of San Antonio, Texas in 2009, the Old Farmer's Almanac stated that the number of sunlight during the summer solstice was 14.03 hours, while the number was 10.27 hours during the winter solstice. a) Find a sinusoidal function that fits the data and sketch its graph. b) Predict the number of hours of sunlight on May 1. Solution:
a) 1) |A| = Largest Data Value − Smallest Data Value
2 =
14.03−10.27
2 = 1.88
2) B = Largest Data Value + Smallest Data Value
2 =
14.03+10.27
2 = 12.15
3) The period is 365 days. Since we do not have any additional points to examine, divide the period by 4 and subtract it from the x- coordinate of the maximum point: 365/4 = 91.25 To find what day June 21 is, add the numbers days in January though May and then add 21: 31+ 28 + 31 + 30 + 31 + 21 = 172 Thus, the phase shift is 172 – 91.25 = 80.75. Now, wedge x between 80.75 and 445.75 and manipulate it to get an angle between 0 and
2π: 80.75 ≤ x ≤ 445.75 (subtract 80.75 = 323
4)
0 ≤ x – 323
4 ≤ 365 (multiply by
2
365)
0 ≤
2
365x –
323
730 ≤ 2 (multiply by π)
0 ≤ 2π
365x –
323π
730 ≤ 2π So, (ωx – φ) = (
2π
365x –
323π
730 )
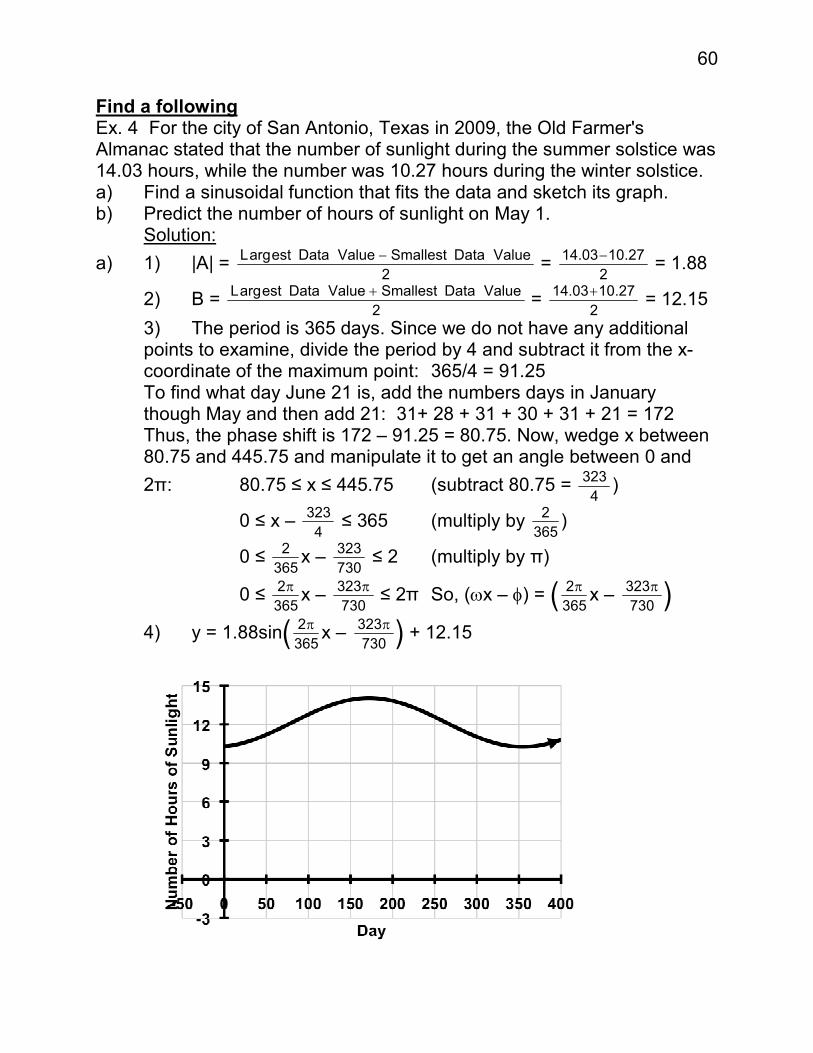
4) y = 1.88sin( 2π
365x –
323π
730 ) + 12.15

61
b) To find what day May 1 is, add the numbers days in January though April and then add 1: 31 + 28 + 31 + 30 + 1 = 121 Now, evaluate the function from part a at x = 121:
y = 1.88sin( 2π
365(121) –
323π
730 ) + 12.15
= 1.88sin(0.6928718…) + 12.15 = 1.88(0.6387494…) + 12.15 = 1.2008489… + 12.15 =13.3508489… ≈ 13.35 hours or 13 hours and 21 minutes. Ex. 5 On Tuesday, March 2, 2010, the length between two consecutive high tides in Galveston was about 11.8 hours. High tide occurred at 5:24 am (5.4 hours) and was measured to be 1.2 feet. Low tide occurred at 11:36 am (11.6 hours) and was measure to be – 0.1 feet. a) Approximately when did the next high tide occur? b) Find a sinusoidal function that fits the data. c) Draw a graph of the function. d) Use the function to predict the height of the next high tide. Solution: a) We add 11.8 hours to 5.4 hours to get 17.2 hours or at 17:12 which corresponds to 5:12 pm in the afternoon.
b) 1) |A| = Largest Data Value − Smallest Data Value
2 =
1.2−(−0.1)
2 = 0.65
2) B = Largest Data Value + Smallest Data Value
2 =
1.2+(−0.1)
2 = 0.55
3) The period is 11.8 hours. Since we do not have any additional points to examine, divide the period by 4 and subtract it from the x- coordinate of the maximum point: 11.8/4 = 2.95 Thus, the phase shift is 5.4 – 2.95 = 2.45. Now, wedge x between 2.45 and 14.25 and manipulate it to get an angle between 0 and
2π: 2.45 ≤ x ≤ 14.25 (subtract 2.45 = 49
20)
0 ≤ x – 49
20 ≤ 11.8 (multiply by
2
11.8 =
10
59)
0 ≤ 10
59x –
49
118 ≤ 2 (multiply by π)
0 ≤ 10π
59x –
49π
118 ≤ 2π So, (ωx – φ) = (
10π
59x –
49π
118 )
4) y = 0.65sin( 10π
59x –
49π
118 ) + 0.55
62
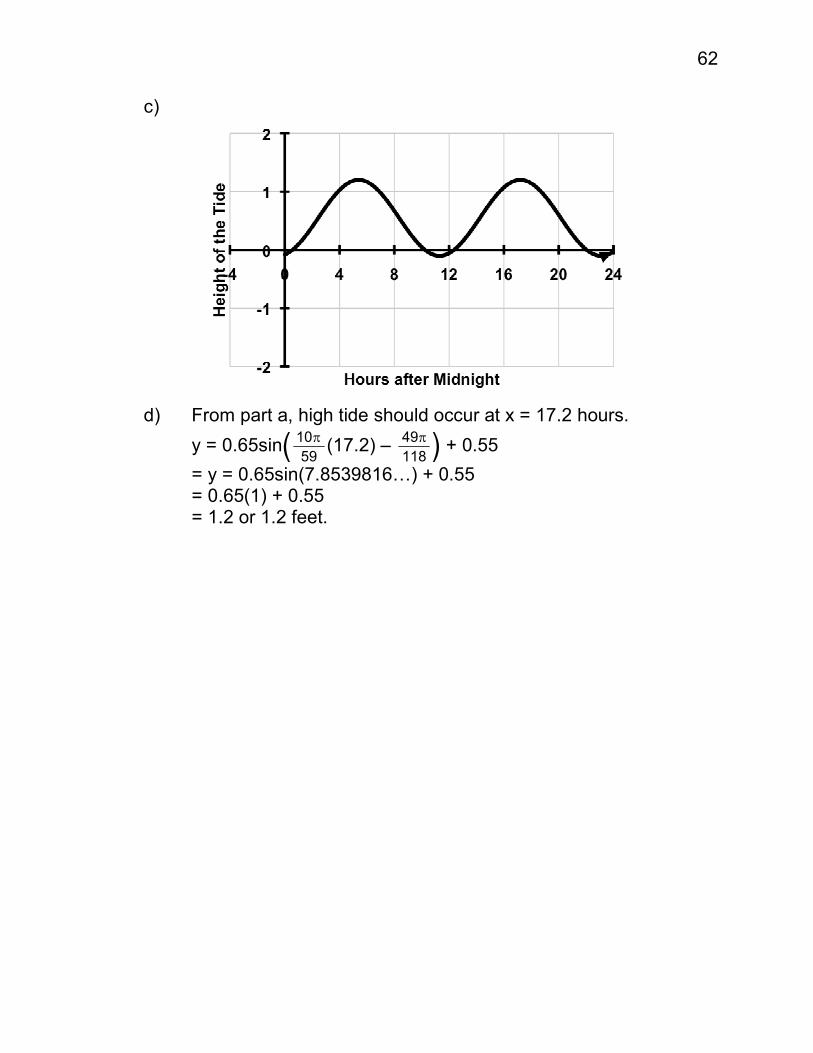
c)
d) From part a, high tide should occur at x = 17.2 hours.
y = 0.65sin( 10π
59(17.2) –
49π
118 ) + 0.55
= y = 0.65sin(7.8539816…) + 0.55 = 0.65(1) + 0.55 = 1.2 or 1.2 feet.