Sartorius Group First-Half Financial Report from January ... · The world's largest economy, ......
27
Sartorius Group First-Half Financial Report from January to June 2017
Transcript of Sartorius Group First-Half Financial Report from January ... · The world's largest economy, ......

Sartorius GroupFirst-Half Financial Report from January to June 2017
2
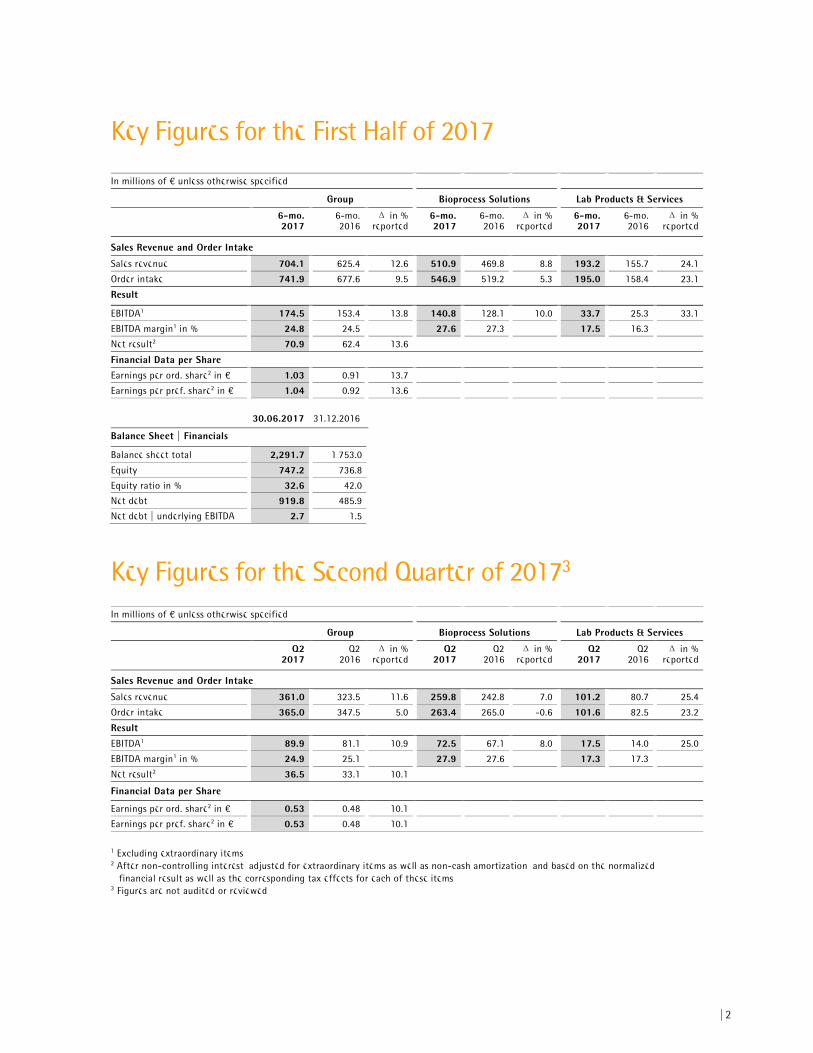
In millions of € unless otherwise specified
Group Bioprocess Solutions Lab Products & Services
6-mo. 2017
6-mo. 2016
Δ in % reported
6-mo. 2017
6-mo. 2016
Δ in % reported
6-mo. 2017
6-mo. 2016
Δ in % reported
Sales Revenue and Order Intake
Sales revenue 704.1 625.4 12.6 510.9 469.8 8.8 193.2 155.7 24.1
Order intake 741.9 677.6 9.5 546.9 519.2 5.3 195.0 158.4 23.1
Result
EBITDA1 174.5 153.4 13.8 140.8 128.1 10.0 33.7 25.3 33.1
EBITDA margin1 in % 24.8 24.5 27.6 27.3 17.5 16.3
Net result2 70.9 62.4 13.6
Financial Data per Share
Earnings per ord. share2 in € 1.03 0.91 13.7
Earnings per pref. share2 in € 1.04 0.92 13.6
30.06.2017 31.12.2016
Balance Sheet | Financials
Balance sheet total 2,291.7 1,753.0
Equity 747.2 736.8
Equity ratio in % 32.6 42.0
Net debt 919.8 485.9
Net debt | underlying EBITDA 2.7 1.5
Key Figures for the Second Quarter of 20173
In millions of € unless otherwise specified
Group Bioprocess Solutions Lab Products & Services
Q2 2017
Q2 2016
Δ in % reported
Q2 2017
Q2 2016
Δ in % reported
Q2 2017
Q2 2016
Δ in % reported
Sales Revenue and Order Intake
Sales revenue 361.0 323.5 11.6 259.8 242.8 7.0 101.2 80.7 25.4
Order intake 365.0 347.5 5.0 263.4 265.0 -0.6 101.6 82.5 23.2
Result
EBITDA1 89.9 81.1 10.9 72.5 67.1 8.0 17.5 14.0 25.0
EBITDA margin1 in % 24.9 25.1 27.9 27.6 17.3 17.3
Net result2 36.5 33.1 10.1
Financial Data per Share
Earnings per ord. share2 in € 0.53 0.48 10.1
Earnings per pref. share2 in € 0.53 0.48 10.1
1 Excluding extraordinary items 2 After non-controlling interest, adjusted for extraordinary items as well as non-cash amortization, and based on the normalized
financial result as well as the corresponding tax effects for each of these items 3 Figures are not audited or reviewed
Key Figures for the First Half of 2017

3
Macroeconomic Environment and Sector Conditions
The sectors in which the Sartorius Group is active differ in their dependence on the economy. The Bioprocess Solutions Division, for instance, operates in an environment that is largely independent of economic fluctuations. The Lab Products & Services Division, in contrast, conducts its business activities also in sectors that are more strongly affected by economic factors.
Global Economy Recorded Slight Growth Acceleration
According to the most recent data, first-quarter economic growth in the OECD countries in 2017 was up 2.0%, slightly above the level of the prior-year quarter of 1.7%.
The world's largest economy, the USA, grew at a somewhat lower rate than expected at the beginning of the year, 1.9% (previous year +1.6%), amid moderate consumer spending. During the further course of the year, stronger growth dynamics are anticipated in view of the robust U.S. labor market, among other factors.
Despite the uncertainties surrounding the planned exit of the U.K. from the European Union, the euro zone reported overall robust development, gaining 1.7% (previous year +1.7%), which was especially driven by strong demand of private households as well as by exports.
Asia proved to be a key growth driver yet again. China's gross domestic product thus rose by 6.9% (previous year +6.7%) due to higher government-led investments, among other reasons. Growth of the economy in India slowed as a result of the country's currency exchange initiative, from 8.7% in the year-earlier quarter to 6.2%. However, it continued to remain at a high level on an international comparison.
Sources: OECD: Quarterly National Accounts, May 2017; Reuters,
April 2017.
Continued Positive Sector Development
Sartorius generates the majority of its business with customers from the biopharmaceutical and pharmaceutical industries. In addition, Sartorius serves customers from public research institutes, the chemical industry and the food sector. Accordingly, the trends in these specific sectors considerably influence the business development of Sartorius.
The international market research institute IMS Health estimates that the global pharmaceutical market has grown annually by around 6% on average over the past five years. The main growth drivers were the availability of innovative new medications, improved access to healthcare – in part through the expansion of state healthcare systems – besides the continuously growing and aging world population.
The market for medications manufactured using biotech methods has been expanding overproportionately for many years within the global pharmaceutical market. This is primarily attributable to a high number of new drug approvals and additional market penetration by existing biologics. Overall, the share of sales revenue generated by medications manufactured using biotech methods relative to the total pharmaceuticals market rose from around 20% in 2012 to approximately 25% in 2016.
Biosimilars, or biological medications nearly identical to original products, have played only a minor role to date in the growth of the biotechnology market. However, the industry has recently made significant progress in the important U.S. market, which develops in a somewhat delayed manner compared to the biosimilars markets in Europe and Asia. So far, five biosimilars have been approved by the FDA, the U.S. health authority, following the first market authorization of a biosimilar in 2015 based on an abbreviated approval procedure.
Demand for laboratory instruments and consumables is primarily generated by the biopharmaceutical and pharmaceutical industries, public research institutes and the chemical and food sectors.
According to data provided by Frost & Sullivan, the global laboratory market grew by about 2.4% in 2016. In the face of moderate economic growth and uncertainty surrounding the British referendum against EU membership, Europe recorded growth of merely 1.5%. The largest market for laboratory products, the USA,

4
expanded at a rate of 2.5%. Significant growth was once again reported in Asian countries, such as China and India, in which the laboratory market enjoyed above-average expansion of 7.8% (China) and 8.4% (India).
Sources: IMS Health: Outlook for Global Medicines through 2021,
December 2016; EvaluatePharma: World Preview 2017, Outlook to
2022, June 2017; www.biologicsblog.com, May 19, 2017; Frost &
Sullivan: 2017 Spring Mid-year Report; May 2017.
5
Group Business Development
– Double-digit growth in sales and profit
– Lab Products & Services develops highly dynamically through organic growth and expansion of its portfolio
– Robust development of Bioprocess Solutions in light of normalized market growth
– Forecast for the full year of 2017 confirmed
Product Portfolio Expanded Through Acquisitions
In the first half of 2017, Sartorius added further innovative and complementary technologies to its product array through two acquisitions. The Lab Products & Services Division significantly expanded its portfolio in bioanalytics through the acquisition of Essen BioScience and thus has further strengthened its position with biopharmaceutical customers and in public research. Moreover, the Bioprocess Solutions Division expanded its comprehensive offering of single-use solutions and equipment through the acquisition of the data analytics specialist Umetrics.
For further information about these acquisitions, please see pp. 8 and 9.
Sartorius Achieves Double-Digit Sales Growth in the First Half
In the first half of 2017, the Sartorius Group continued to grow dynamically at double-digit rates. In light of the strong organic growth of both of its divisions and the acquisitions of Essen BioScience and Umetrics, the company’s sales revenue rose 11.5% in constant currencies from €625.4 million to €704.1 million; the reported increase was 12.6%.
Sales revenue and order intake
in millions of € 6-mo. 2017
6-mo. 2016
Δ in % reported
Δ in % cc1
Sales revenue 704.1 625.4 12.6 11.5
Order intake 741.9 677.6 9.5 8.4
1 In constant currencies
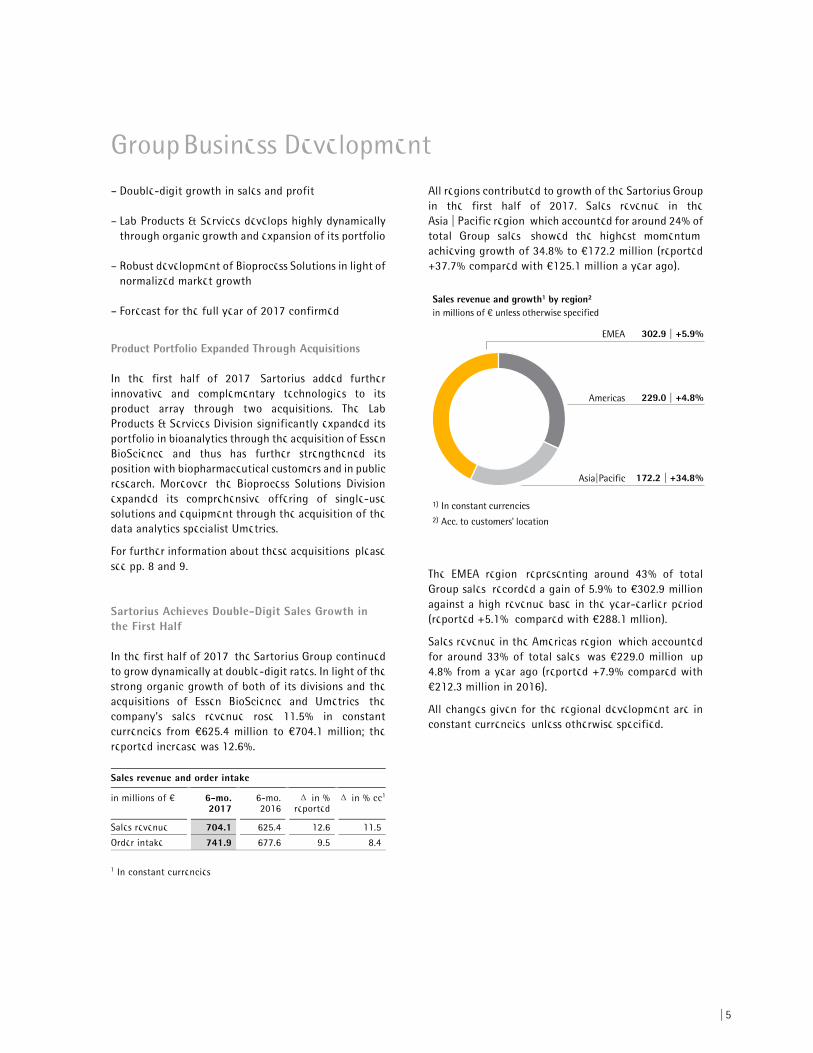
All regions contributed to growth of the Sartorius Group in the first half of 2017. Sales revenue in the Asia | Pacific region, which accounted for around 24% of total Group sales, showed the highest momentum, achieving growth of 34.8% to €172.2 million (reported +37.7% compared with €125.1 million a year ago).
The EMEA region, representing around 43% of total Group sales, recorded a gain of 5.9% to €302.9 million against a high revenue base in the year-earlier period (reported +5.1%, compared with €288.1 mllion).
Sales revenue in the Americas region, which accounted for around 33% of total sales, was €229.0 million, up 4.8% from a year ago (reported +7.9% compared with €212.3 million in 2016).
All changes given for the regional development are in constant currencies, unless otherwise specified.
6
Underlying EBITDA Increases Overproportionately
The Sartorius Group uses underlying EBITDA (earnings before interest, taxes, depreciation and amortization and adjusted for extraordinary items) as the key profitability indicator.
The Sartorius Group increased its earnings overproportionately yet again in the first half of 2017 relative to sales. Driven by economies of scale, underlying EBITDA rose 13.8% from €153.4 million to €174.5 million. The respective EBITDA margin climbed from 24.5% in the year-earlier period to 24.8%.
Underlying EBITDA and EBITDA margin Group
in millions of € 6-mo. 2017
6-mo. 2016
Δ in %
Underlying EBITDA 174.5 153.4 13.8
Underlying EBITDA margin 24.8 24.5
Consolidated EBIT, including extraordinary items of -€12.7 million (H1 2016: -€9.9 million), depreciation and amortization, amounted to €113.9 million compared with €109.9 million in the previous year. Extraordinary items were primarily related to various cross-divisional projects and expenses in connection with the Group's most recent acquisitions. Due to an acquisition-driven increase of amortization, the consolidated EBIT margin was 16.2%, up from 17.6% a year ago.
The financial result was -€9.0 million in the first half of 2017, relative to -€3.9 million for the prior-year period. This change is essentially attributable to valuation effects related to foreign currency liabilities and hedging instruments and to a smaller extent to higher interest expenses due to acquisitions.
Net profit for the first six months of 2017 totaled €74.5 million relative to €74.2 million in the comparable period. Net profit after non-controlling interest stood at €51.8 million relative to €53.4 million in the first half of 2016, with non-controlling interest accounting for €22.7 million (H1 2016: €20.8 million).
Relevant Net Profit Rises Significantly
The relevant net profit attributable to the shareholders of Sartorius AG rose by 13.6% from €62.4 million to €70.9 million. This profit figure is calculated by adjusting for extraordinary items and eliminating non-cash amortization, and is based on the normalized financial result as well as the corresponding tax effects for each of these items. Underlying earnings per ordinary share totaled €1.03 (H1 2016: €0.91) and €1.04 per preference share (H1 2016: €0.92).
in millions of € 6-mo. 2017 6-mo. 2016
EBIT 113.9 109.9
Extraordinary effects 12.7 9.9
Amortization 17.0 8.5
Normalized financial result1 -8.3 -6.8
Normalized income tax (2017: 29% | 2016: 30%)2 -39.2 -36.4
Underlying net result after tax 96.1 85.0Non-controlling interest -25.1 -22.6
Underlying earnings after taxes and non-controlling interest 70.9 62.4Underlying earnings per share
per ordinary share in € 1.03 0.91
per preference share in € 1.04 0.92
1 Financial result excluding fair value adjustments of hedging instruments and currency effects relating to financing activities
2 Underlying income tax, based on the underlying profit before tax and non-cash amortization
Operating Cash Flow Increases
In the first six months of the current fiscal year, the Sartorius Group reported a net cash flow from operating activities of €54.3 million relative to €43.1 million a year ago. Besides reflecting an increase in earnings, this development was influenced by lower tax payments than in the previous year and by a predominantly growth-related increase in funds allocated to working capital.
Net cash flow from investing activities was -€79.5 million, above the year-earlier figure of -€69.0 million, as planned. Capital expenditures in the reporting period were related to, inter alia, the expansion of production capacity at our site in Yauco, Puerto Rico, and the consolidation and expansion of Group headquarters in Goettingen, Germany. The ratio of capital expenditures relative to sales in the first half of 2017 was 12.9% (previous year: 11.5%)
Cash outflows associated with acquisitions of €362.6 million in the first half of 2017 were related to the purchase of Essen BioScience and Umetrics. The cash outflow of €79.1 million in the year-earlier period reflects the acquisition of IntelliCyt. On the whole, net cash flow from investing activities and acquisitions was -€442.1 million relative to the prior-year figure of -€148.1 million.

7
Key Balance Sheet and Financial Indicators Remain at Good Levels
The balance sheet total for the Sartorius Group stood at €2,291.7 million in the period ended June 30, 2017, compared to €1,753.0 million as of December 31, 2016. This increase is mainly due to the acquisitions of Essen BioScience and Umetrics.
The Group's equity rose slightly from €736.8 million to €747.2 million between December 31, 2016, and the reporting date. The equity ratio continued to remain at a comfortable level at 32.6% (December 31, 2016: 42.0%).
Gross debt increased from €547.9 million as of December 31, 2016, to €992.3 million as of June 30, 2017, primarily due to the acquisitions mentioned above. Net debt was €919.8 million relative to €485.9 million as of December 31, 2016.
In this context, the ratio of net debt to underlying EBITDA based on the past 12 months rose from 1.5 at year-end 2016, to 2.7 as of June 20, 2017.
Number of Employees Increases
As of June 30, 2017, the Sartorius Group employed a total of 7,364 people worldwide. Compared with December 31, 2016, head count thus rose by 453 or around 7%. This figure includes 208 staff from the acquisitions of Essen BioScience and Umetrics. From a geographical perspective, personnel increased predominantly in the Americas region, by 19%. The number of employees in the EMEA region rose in the reporting period by around 5% to 5,082. In Asia | Pacific, Sartorius employed 1,106 people as of the end of the reporting period (December 31, 2016: 1,069 staff).

8
Business Development of the Divisions
Bioprocess Solutions: Portfolio Expanded by the Acquisition of Data Analytics Specialist Umetrics
In April 2017, Sartorius expanded the portfolio of its Bioprocess Solutions Division through the acquisition of the Swedish company Umetrics. This company is a leading specialist in data analytics software for modeling and optimizing biopharmaceutical development and manufacturing processes, and has already been cooperating with Sartorius for around five years. For the full year of 2017, Umetrics plans to generate sales revenue of around U.S. $15 million, approximately three-fourths of which will be consolidated by the Bioprocess Solutions Division this year.
Robust Performance Given Normalized Market Growth
In the period under review, the dynamics of the bioprocess market returned to normal rates, as expected, after two years of extraordinarily strong growth. The Bioprocess Solutions Division thus recorded an increase in first-half sales revenue of 8.0% in constant currencies to €510.9 million (reported +8.8%). In particular, development of sales in the Americas region was influenced by relatively soft customer demand and limited delivery capacity for cell culture media. Consolidation of kSep acquired in July 2016 and of Umetrics contributed nearly 1 percentage point of non-organic growth.
The division's business development in the first half was quite different in the regions. The Asia|Pacific region achieved the highest gains, with sales revenue up 44.4% due to the delivery of some large equipment orders, among other reasons. By contrast, first-half business in the Americas was slightly below the strong previous year's level (-2.6%) due to the factors mentioned above. In the EMEA region, sales increased by 2.2% against a very high revenue base in the first half of 2016.
Bioprocess Solutions
in millions of € 6-mo. 2017
6-mo. 2016
Δ in % reported
Δ in %const. fx
Sales revenue 510.9 469.8 8.8 8.0
- EMEA1 209.4 207.2 1.0 2.2
- Americas1 181.3 181.1 0.1 –2.6
- Asia | Pacific1 120.3 81.5 47.6 44.4
Order intake 546.9 519.2 5.3 4.4
1 Acc. to customers' location
The division's first-half order intake rose by 4.4% compared with a very strong prior-year base, which was influenced by some larger equipment orders.
Underlying EBITDA of the Bioprocess Solutions Division increased by 10.0% from €128.1 million to €140.8 million. Its respective margin rose from 27.3% to 27.6%, especially due to economies of scale.
Underlying EBITDA and EBITDA margin Bioprocess Solutions
in millions of € 6-mo. 2017
6-mo. 2016
Δ in %
Underlying EBITDA 140.8 128.1 10.0
Underlying EBITDA margin in % 27.6 27.3

9
Lab Products & Services: Bioanalytics Portfolio Considerably Expanded
The Lab Products & Services Division significantly expanded its offering of innovative technologies for drug research in the area of bioanalytics with the purchase of U.S.-based Essen BioScience Inc. in March 2017 after acquiring IntelliCyt and ViroCyt in the summer of 2016. Essen's real-time live-cell imaging and analysis systems are an excellent complementary fit with IntelliCyt's products, offering additional growth potential for Lab Products & Services. Essen BioScience is expected to generate sales revenue of around U.S. $60 million for the full year of 2017, about three-fourths of which will be consolidated by the Bioprocess Solutions Division this year.
Continued Positive Business Development
In the first half of 2017, the Lab Products & Services Division increased its sales revenue significantly by 22.1% in constant currencies to €193.2 million (reported +24.1%). The division reported organic growth of around 7% due to strong demand in all regions and all product areas. The portfolio expansion in the area of bioanalytics contributed around 15 percentage points to growth.
Lab Products & Services
in millions of € 6-mo. 2017
6-mo. 2016
Δ in % reported
Δ in %const. fx
Sales revenue 193.2 155.7 24.1 22.1
- EMEA1 93.5 80.8 15.7 15.1
- Americas1 47.7 31.2 53.0 47.5
- Asia | Pacific1 52.0 43.6 19.2 17.2
Order intake 195.0 158.4 23.1 21.1
1 Acc. to customers' location
Underlying EBITDA of the Lab Products & Services Division rose sharply in the first half of 2017 by 33.1% from €25.3 million to €33.7 million. This increase was driven by economies of scale related to strong organic growth and acquisitions. The division's underlying EBITDA earnings margin improved from 16.3% a year ago to 17.5%.
Underlying EBITDA and EBITDA margin Lab Products & Services
in millions of € 6-mo. 2017
6-mo. 2016
Δ in %
Underlying EBITDA 33.7 25.3 33.1
Underlying EBITDA margin in % 17.5 16.3
10
Opportunity and Risk ReportThe opportunities and risk situation of the Sartorius Group has not materially changed since the publication of its 2016 Annual Report. For this reason, please refer to the detailed description of the opportunities and risks on pp. 52 et seq., as well as the risk management system on pp. 65 et seq., for the Sartorius Group in the 2016 Annual Report.
Forecast Report Macroeconomic Outlook Slightly Improved
According to the most recent forecast issued by the International Monetary Fund, IMF, expansion of the global economy in 2017 is expected to progress slightly better at a rate of 3.5% compared with 3.4% projected at the beginning of the year.
For the U.S. market, the IMF continues to predict that economic activity will gain momentum at a rate of 2.3% compared with 1.6% a year ago. Key growth drivers are an end to inventory reductions and a rebound in investment activity.
The IMF also slightly raised its growth expectations for the euro zone since the beginning of the year from 1.5% to 1.7% due to continuing expansive fiscal policy and the positive effects of the pickup in the U.S. economy. In the U.K., the effects of its planned withdrawal from the European Union are likely to be lower than expected over the short term. For this reason, the IMF estimates that the U.K. economy will grow by 2.0%.
Experts project that the Asian economic area will expand by 6.4%, unchanged from the prior year. Supported by government investments, China's economy is likewise expected to grow by 6.6%. The IMF estimates that the development of India's economy in the current year will be impacted by its currency exchange initiative. Accordingly, the IMF revised its most recent forecast to +7.2% for 2017.
Sources: International Monetary Fund, World Economic Outlook,
April 2017.
Continued Positive Sector Environment
The trends described on pages 61-63 of our 2016 Annual Report have remained unchanged with respect to their impacts on the development of the Sartorius Group.
Most recent estimates project that the global pharmaceutical market will grow at a compound annual growth rate of 4% to 7% during the period of 2016 to 2021. For the biopharma subsegment, market observers continue to expect overproportionate annual growth of around 9% on average. This growth will be driven largely by the increasing penetration of biopharmaceuticals already approved and an expansion of their indications, as well as by strong research and development pipelines.
Based on Frost & Sullivan estimates, global demand for laboratory products is forecasted to remain stable. Therefore, growth of around 2.8% is projected for 2017. While the markets in the USA and Europe are likely to expand moderately at rates of 3.2% and 1.9%, respectively, market observers expect the highest growth rates in Asian countries, for instance, 7.6% for China and 8.6% for India.
Sources: IMS Health: Outlook for Global Medicines through 2021,
December 2016; Frost & Sullivan; Frost & Sullivan: 2017 Mid-year
Report; May 2017; EvaluatePharma: World Preview 2017, Outlook
to 2022, June 2017.
Guidance for Fiscal 2017 Confirmed
Management confirms its forecast for the full year of 2017.
Group
Based on constant currencies, management maintains its projection that Group sales revenue will grow by about 12% to 16%. The Group's underlying EBITDA margin is expected to increase by slightly more than half a percentage point over the prior-year figure of 25.0%.
For 2017, Sartorius continues to plan on investing about 12% to 15% of sales revenue. Its investing activities remain focused on the expansion of its site in Yauco, Puerto Rico, for the manufacture of single-use bags and filters, as well as on consolidation and extension of Group headquarters in Goettingen, Germany.
Regarding its financial position, Sartorius expects that in light of its most recent acquisitions, its ratio of net debt to underlying EBITDA by the end of the current fiscal year will be around 2.4. Any further potential acquisitions are not reflected in this guidance.

11
Divisions
For the Bioprocess Solutions Division, management continues to anticipate that sales will grow by about 9% to 13%, which includes a good one percentage point of non-organic growth to be contributed by the acquired companies, kSep and Umetrics. With regard to delivery capacities for cell culture media, management assumes that the situation will normalize in the third quarter of 2017. The division's underlying EBITDA margin remains projected to rise by about half a percentage point over the prior-year figure of 28.0%.
For the Lab Products & Services Division, management continues to project that, assuming an overall stable economic environment, sales will increase by about 20% to 24%. This includes non-organic growth of around 17 percentage points to be contributed by the companies acquired, IntelliCyt, ViroCyt and Essen BioScience. The division's underlying EBITDA margin is expected rise by nearly two percentage points compared with the prior-year figure of 16.0%.
All forecasts are based on constant currencies.
Report on Material Events No material events occurred after June 30, 2017.
12
2nd quarter1)
2017¤ in mn
2nd quarter1)
2016€ in mn
6-month 2017
¤ in mn
6-month 2016
€ in mn
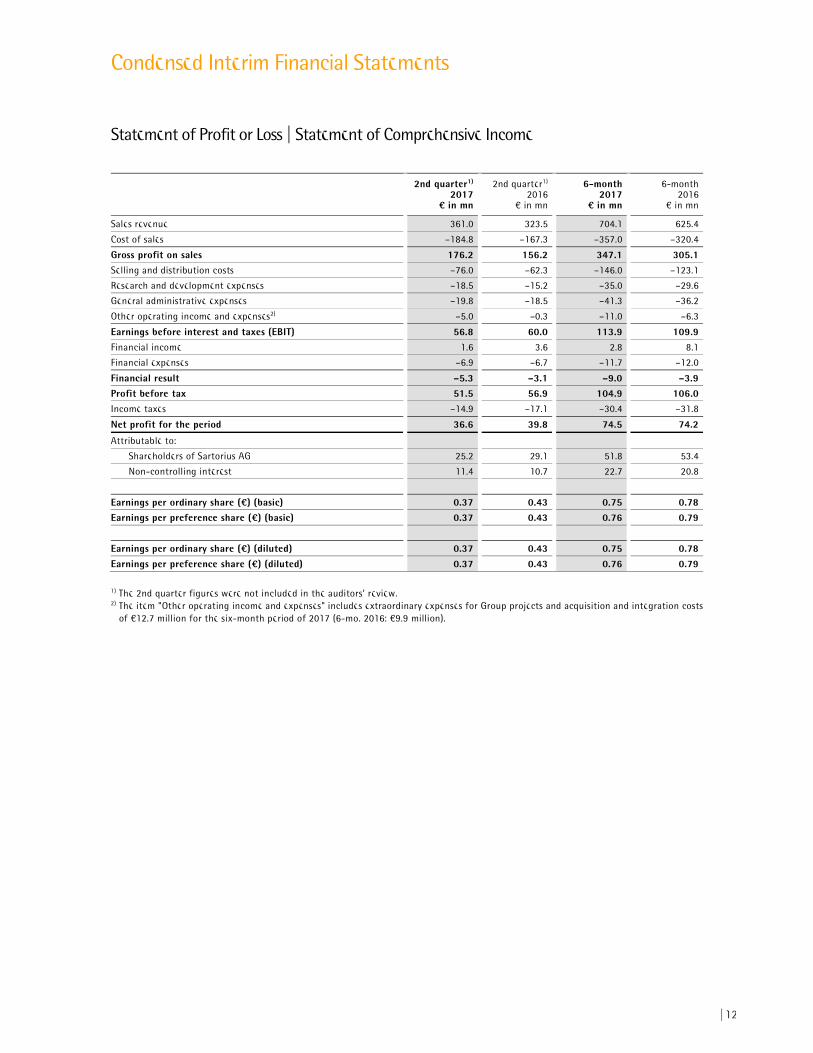
Sales revenue 361.0 323.5 704.1 625.4
Cost of sales –184.8 –167.3 –357.0 –320.4
Gross profit on sales 176.2 156.2 347.1 305.1Selling and distribution costs –76.0 –62.3 –146.0 –123.1
Research and development expenses –18.5 –15.2 –35.0 –29.6
General administrative expenses –19.8 –18.5 –41.3 –36.2
Other operating income and expenses2) –5.0 –0.3 –11.0 –6.3
Earnings before interest and taxes (EBIT) 56.8 60.0 113.9 109.9Financial income 1.6 3.6 2.8 8.1
Financial expenses –6.9 –6.7 –11.7 –12.0
Financial result –5.3 –3.1 –9.0 –3.9Profit before tax 51.5 56.9 104.9 106.0Income taxes –14.9 –17.1 –30.4 –31.8
Net profit for the period 36.6 39.8 74.5 74.2
Attributable to:
Shareholders of Sartorius AG 25.2 29.1 51.8 53.4
Non-controlling interest 11.4 10.7 22.7 20.8
Earnings per ordinary share (¤) (basic) 0.37 0.43 0.75 0.78Earnings per preference share (¤) (basic) 0.37 0.43 0.76 0.79
Earnings per ordinary share (¤) (diluted) 0.37 0.43 0.75 0.78
Earnings per preference share (¤) (diluted) 0.37 0.43 0.76 0.79
1) The 2nd quarter figures were not included in the auditors’ review. 2) The item "Other operating income and expenses" includes extraordinary expenses for Group projects and acquisition and integration costs
of €12.7 million for the six-month period of 2017 (6-mo. 2016: €9.9 million).
Condensed Interim Financial Statements
Statement of Profit or Loss | Statement of Comprehensive Income
13
2nd quarter1)
2017¤ in mn
2nd quarter1)
2016€ in mn
6-month 2017
¤ in mn
6-month 2016
€ in mn
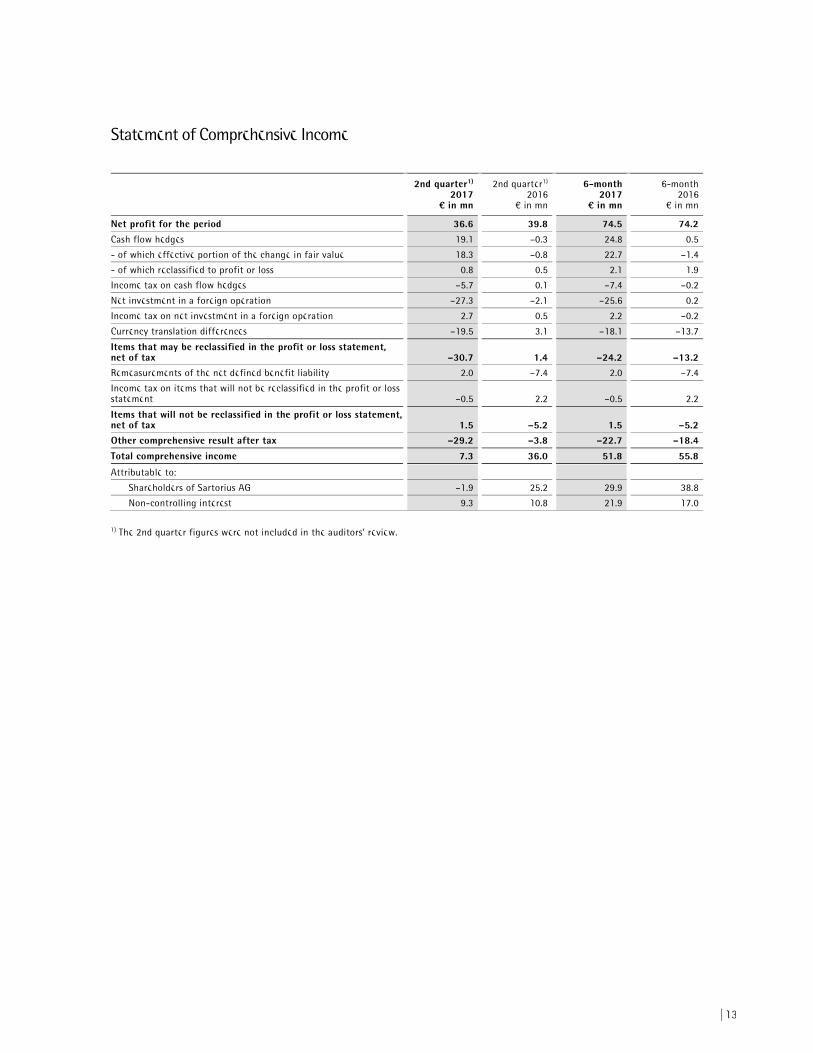
Net profit for the period 36.6 39.8 74.5 74.2
Cash flow hedges 19.1 –0.3 24.8 0.5
- of which effective portion of the change in fair value 18.3 –0.8 22.7 –1.4
- of which reclassified to profit or loss 0.8 0.5 2.1 1.9
Income tax on cash flow hedges –5.7 0.1 –7.4 –0.2
Net investment in a foreign operation –27.3 –2.1 –25.6 0.2
Income tax on net investment in a foreign operation 2.7 0.5 2.2 –0.2
Currency translation differences –19.5 3.1 –18.1 –13.7
Items that may be reclassified in the profit or loss statement, net of tax –30.7 1.4 –24.2 –13.2Remeasurements of the net defined benefit liability 2.0 –7.4 2.0 –7.4
Income tax on items that will not be reclassified in the profit or loss statement –0.5 2.2 –0.5 2.2
Items that will not be reclassified in the profit or loss statement, net of tax 1.5 –5.2 1.5 –5.2Other comprehensive result after tax –29.2 –3.8 –22.7 –18.4
Total comprehensive income 7.3 36.0 51.8 55.8
Attributable to:
Shareholders of Sartorius AG –1.9 25.2 29.9 38.8
Non-controlling interest 9.3 10.8 21.9 17.0
1) The 2nd quarter figures were not included in the auditors’ review.
Statement of Comprehensive Income

14
June 30, 2017 December 31, 2016
Assets ¤ in mn € in mn
Non-current assets
Goodwill 667.6 467.8
Other intangible assets 467.6 267.4
Property, plant and equipment 443.8 394.0
Financial assets 17.7 7.5
Other assets 0.8 0.9
Deferred tax assets 26.8 27.7
1,624.4 1,165.4
Current assets Inventories 241.9 222.2
Trade receivables 271.6 241.2
Other financial assets 27.4 15.0
Current tax assets 16.4 21.6
Other assets 33.0 22.0
Cash and cash equivalents 72.4 62.0
Assets held for sale 4.6 3.6
667.3 587.6
Total assets 2,291.7 1,753.0
June 30, 2017 December 31, 2016
Equity and liabilities ¤ in mn € in mn
Equity Equity attributable to Sartorius AG shareholders 578.8 579.7
Issued capital 68.4 68.4
Capital reserves 39.1 38.4
Other reserves and retained earnings 471.3 472.9
Non-controlling interest 168.4 157.1
747.2 736.8
Non-current liabilities Pension provisions 62.4 64.1
Other provisions 7.8 7.8
Loans and borrowings 906.3 433.0
Finance lease liabilities 18.2 18.9
Other financial liabilities 67.9 73.7
Deferred tax liabilities 130.7 54.3
1,193.4 651.8
Current liabilities Provisions 17.2 18.1
Trade payables 127.4 120.4
Loans and borrowings 64.9 93.0
Finance lease liabilities 2.8 3.0
Employee benefits 52.3 49.0
Other financial liabilities 22.9 32.3
Current tax liabilities 23.7 23.6
Other liabilities 39.9 25.0
351.2 364.4
Total equity and liabilities 2,291.7 1,753.0
Statement of Financial Position

15
6-month 2017
¤ in mn
6-month 2016
€ in mn
Profit before tax 104.9 106.0
Financial result 9.0 3.9
Earnings before interest and taxes (EBIT) 113.9 109.9Depreciation | amortization of intangible and tangible assets 48.0 33.6
Increase | decrease in provisions –0.9 1.1
Income taxes paid –28.7 –32.0
Other non-cash items 1.0 0.7
Gross cash flows from operating activities 133.2 113.3
Increase | decrease in receivables and other assets –35.6 –51.8
Increase | decrease in inventories –16.7 –29.8
Increase | decrease in liabilities (without loans and borrowings) –26.6 11.5
Net cash flow from operating activities 54.3 43.1
Capital expenditures –79.5 –69.4
Proceeds from the disposal of fixed assets 0.0 0.4
Net cash flow from investing activities –79.5 –69.0
Payments for acquisitions of consolidated subsidiaries and other business operations, net of cash acquired –362.6 –79.1
Net cash flow from investing activities, acquisitions and disposals –442.1 –148.1
Interest received 0.2 2.1
Interest paid and other financial charges –4.3 –3.6
Dividends paid to:
- Shareholders of Sartorius AG –31.1 –25.8
- Non-controlling interest –10.7 –8.7
Gross cash flows from financing activities –45.9 –36.0
Loans repaid –70.8 –2.3
Loans raised 515.0 164.5
Net cash flow from financing activities 398.3 126.3
Net increase | decrease in cash and cash equivalents 10.6 21.3
Cash and cash equivalents at the beginning of the period 62.0 52.8
Net effect of currency translation on cash and cash equivalents –0.2 2.0
Cash and cash equivalents at the end of the period 72.4 76.0
Statement of Cash Flows

16
€ in millions Issued
capitalCapital
reservesHedgingreserves
Pensionreserves
Earningsreserves
and retained
profits
Difference resulting
from currency
translation
Equity attri-butable to
Sartorius AG shareholders
Non-control-
ling interest
Total equity
Balance at January 1, 2016 17.1 88.4 –3.1 –15.1 406.5 24.0 517.7 127.0 644.8Net profit for the period 0.0 0.0 0.0 0.0 53.4 0.0 53.4 20.8 74.2
Cash flow hedges 0.0 0.0 0.3 0.0 0.0 0.0 0.3 0.3 0.5
Actuarial gains | losses from pension provisions 0.0 0.0 0.0 –6.4 0.0 0.0 –6.4 –1.0 –7.4
Currency translation differences 0.0 0.0 0.0 0.0 0.0 –10.2 –10.2 –3.5 –13.7
Net investment in a foreign operation 0.0 0.0 0.0 0.0 –0.1 0.0 –0.1 0.3 0.2
Income tax on items that are recognized in other comprehensive income 0.0 0.0 –0.1 1.9 0.0 0.0 1.8 0.1 1.9
Other comprehensive result after tax 0.0 0.0 0.2 –4.6 –0.1 –10.2 –14.6 –3.8 –18.4
Total comprehensive income 0.0 0.0 0.2 –4.6 53.3 –10.2 38.8 17.0 55.8Share-based payment 0.0 0.7 0.0 0.0 0.0 0.0 0.7 0.0 0.7
Dividends 0.0 0.0 0.0 0.0 –25.8 0.0 –25.8 –8.7 –34.5
Capital increase1) 51.3 –51.3 0.0 0.0 0.0 0.0 0.0 0.0 0.0
Purchase price liability Israel 0.0 0.0 0.0 0.0 –13.4 0.0 –13.4 0.0 –13.4
Other changes in equity 0.0 0.0 0.0 0.5 0.4 0.0 1.0 –0.2 0.8
Balance at June 30, 2016 68.4 37.7 –2.9 –19.2 421.1 13.9 519.0 135.1 654.2
€ in millions Issued
capitalCapital
reservesHedgingreserves
Pensionreserves
Earningsreserves
and retained
profits
Difference resulting
from currency
translation
Equity attri-butable to
Sartorius AG shareholders
Non-control-
ling interest
Total equity
Balance at January 1, 2017 68.4 38.4 –7.3 –17.7 473.6 24.3 579.7 157.1 736.8Net profit for the period 0.0 0.0 0.0 0.0 51.8 0.0 51.8 22.7 74.5
Cash flow hedges 0.0 0.0 19.8 0.0 0.0 0.0 19.8 5.0 24.8
Actuarial gains | losses from pension provisions 0.0 0.0 0.0 1.7 0.0 0.0 1.7 0.3 2.0
Currency translation differences 0.0 0.0 0.0 0.0 0.0 –13.6 –13.6 –4.4 –18.1
Net investment in a foreign operation 0.0 0.0 0.0 0.0 –25.6 0.0 –25.6 0.0 –25.6
Income tax on items that are recognized in other comprehensive income 0.0 0.0 –5.9 –0.4 2.2 0.0 –4.2 –1.6 –5.7
Other comprehensive result after tax 0.0 0.0 13.9 1.3 –23.4 –13.6 –21.9 –0.8 –22.7
Total comprehensive income 0.0 0.0 13.9 1.3 28.4 –13.6 29.9 21.9 51.8Share-based payment 0.0 0.7 0.0 0.0 0.0 0.0 0.7 0.0 0.7
Dividends 0.0 0.0 0.0 0.0 –31.1 0.0 –31.1 –10.7 –41.8
Other changes in equity 0.0 0.0 0.0 0.0 –0.4 0.0 –0.4 0.1 –0.3
Balance at June 30, 2017 68.4 39.1 6.6 –16.4 470.4 10.7 578.8 168.4 747.2
1) In fiscal 2016, capital was increased by the use of retained earnings to perform a stock split.
Statement of Changes in Equity

17
According to IFRS 8, Operating Segments, the identifi-cation of reportable operating segments is based on the "management approach"; i.e., the segments are defined analogously to the internal control and re-porting structure of an entity. Accordingly, the divi-sions called Bioprocess Solutions and Lab Products & Services are to be considered operating segments.
“Underlying EBITDA" is the key performance indicator of the operating segments of the Sartorius Group. EBITDA corresponds to earnings before interest (finan-cial result), taxes, depreciation and amortization. “Un-
derlying EBITDA” means EBITDA adjusted for extraor-dinary items. In this connection, extraordinary items are expenses and income that are of an exceptional or a one-time nature and accordingly distort the sustain-able profitability of a segment and, from the Group’s perspective, have a material impact on the net worth, financial position and earnings of the Group.
Apart from that, the recognition and measurement methods for the reportable segments conform to the general Group accounting principles.
Sales revenue Underlying EBITDA
€ in millions 6-mo. 2017 6-mo. 2016 6-mo. 2017 6-mo. 2016
Bioprocess Solutions 510.9 469.8 140.8 128.1
Lab Products & Services 193.2 155.7 33.7 25.3
Total continuing operations 704.1 625.4 174.5 153.4Reconciliation to the profit before tax Depreciation and amortization –48.0 –33.6
Extraordinary items –12.7 –9.9
Earnings before interest and taxes (EBIT) 113.9 109.9Financial result –9.0 –3.9
Profit before tax from continuing operations 104.9 106.0
Geographical Information
Sales revenue
€ in millions 6-mo. 2017 6-mo. 2016
EMEA 302.9 288.1Americas 229.0 212.3Asia | Pacific 172.2 125.1
Group 704.1 625.4
Segment Reports
18
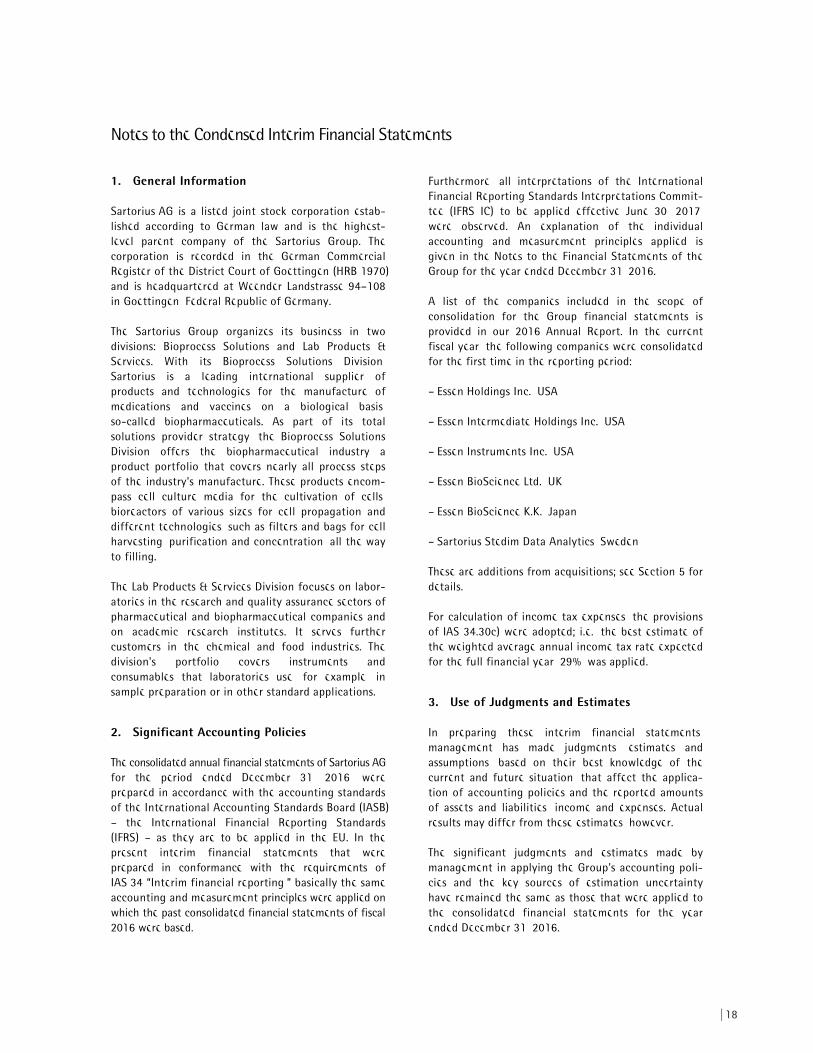
1. General Information
Sartorius AG is a listed joint stock corporation estab-lished according to German law and is the highest-level parent company of the Sartorius Group. The corporation is recorded in the German Commercial Register of the District Court of Goettingen (HRB 1970) and is headquartered at Weender Landstrasse 94–108 in Goettingen, Federal Republic of Germany.
The Sartorius Group organizes its business in two divisions: Bioprocess Solutions and Lab Products & Services. With its Bioprocess Solutions Division, Sartorius is a leading international supplier of products and technologies for the manufacture of medications and vaccines on a biological basis, so-called biopharmaceuticals. As part of its total solutions provider strategy, the Bioprocess Solutions Division offers the biopharmaceutical industry a product portfolio that covers nearly all process steps of the industry's manufacture. These products encom-pass cell culture media for the cultivation of cells, bioreactors of various sizes for cell propagation and different technologies, such as filters and bags for cell harvesting, purification and concentration, all the way to filling.
The Lab Products & Services Division focuses on labor-atories in the research and quality assurance sectors of pharmaceutical and biopharmaceutical companies and on academic research institutes. It serves further customers in the chemical and food industries. The division's portfolio covers instruments and consumables that laboratories use, for example, in sample preparation or in other standard applications.
2. Significant Accounting Policies
The consolidated annual financial statements of Sartorius AG for the period ended December 31, 2016, were prepared in accordance with the accounting standards of the International Accounting Standards Board (IASB) – the International Financial Reporting Standards (IFRS) – as they are to be applied in the EU. In the present interim financial statements that were prepared in conformance with the requirements of IAS 34 “Interim financial reporting,” basically the same accounting and measurement principles were applied on which the past consolidated financial statements of fiscal 2016 were based.
Furthermore, all interpretations of the International Financial Reporting Standards Interpretations Commit-tee (IFRS IC) to be applied effective June 30, 2017, were observed. An explanation of the individual accounting and measurement principles applied is given in the Notes to the Financial Statements of the Group for the year ended December 31, 2016.
A list of the companies included in the scope of consolidation for the Group financial statements is provided in our 2016 Annual Report. In the current fiscal year, the following companies were consolidated for the first time in the reporting period:
– Essen Holdings Inc., USA
– Essen Intermediate Holdings Inc., USA
– Essen Instruments Inc., USA
– Essen BioScience Ltd., UK
– Essen BioScience K.K., Japan
– Sartorius Stedim Data Analytics, Sweden
These are additions from acquisitions; see Section 5 for details.
For calculation of income tax expenses, the provisions of IAS 34.30c) were adopted; i.e., the best estimate of the weighted average annual income tax rate expected for the full financial year, 29%, was applied.
3. Use of Judgments and Estimates
In preparing these interim financial statements, management has made judgments, estimates and assumptions, based on their best knowledge of the current and future situation, that affect the applica-tion of accounting policies and the reported amounts of assets and liabilities, income and expenses. Actual results may differ from these estimates, however.
The significant judgments and estimates made by management in applying the Group's accounting poli-cies and the key sources of estimation uncertainty have remained the same as those that were applied to the consolidated financial statements for the year ended December 31, 2016.
Notes to the Condensed Interim Financial Statements

19
4. Accounting Rules Applied for the First Time in the Current Fiscal Year
The Group did not yet apply the following new ac-counting rules as their application was not yet manda-tory for the reporting period:
– Annual Improvements to IRFSs – Cycle 2014-2016 (issued in Dec. 2016), Amendments to IFRS 12
– Amendments to IAS 12, Recognition of Deferred Tax Assets for Unrealised Losses
– Amendments to IAS 7, Disclosure Initiative
First-time application of these standards is not ex-pected to have an impact on the presentation of the Group's financial statements. The following amend-ments are to be applied as of 2018 (IFRS 15, IFRS 9) and 2019 (IFRS 16):
IFRS 15, Revenue from Contracts with Customers, defines a comprehensive framework for determining whether, in which amount and at which point in time revenue is to be recognized. This standard replaces the existing guidance for revenue recognition, including IAS 18, Revenue; IAS 11, Construction contracts; and IFRIC 13, Customer Loyalty Programmes.
The Group is currently conducting a project to analyze the effects of the application of the new standards in the future. At this time, the Group does not expect any material changes regarding the amount and tim-ing of revenue for the major part of the Group's busi-ness. However, especially in the case of construction contracts that are currently accounted for under IAS 11, the timing of revenue recognition may change as a result of the new criteria of IFRS 15 for revenue recognition over time.
At the current state of analysis, the Group does not expect full retrospective application of this new standard. Instead, the Group plans to recognize the cumulative effect of applying IFRS 15 at the date of initial application as an adjustment to the opening balance of equity. Furthermore, at initial application, the Group expects to apply IFRS 15 only to contracts that are not considered completed contracts at the date of initial application.
IFRS 9, Financial Instruments, replaces the existing guidelines in IAS 39, Financial instruments: recognition and measurement. IFRS 9 includes revised guidelines for classification and measurement of financial in-struments, including a new model of expected credit
losses for the calcuation of impairments of financial assets, as well as the new general guidelines for hedge accounting. This standard also adopts the guidance of IAS 39 for recognition and derecognition of financial instruments. The Group is currently conducting a pro-ject to analyze the effects of the application of this new standard in the future. At the current state of analysis, there is no information contrary to the dis-closures in the Group's consolidated financial state-ments. Please refer to the disclosures made in Group financial statements for the full year of 2016.
The application of IFRS 16, Leases, is mandatory for periods from 2019 onwards. IFRS 16 introduces a standardized accounting model according to which leases are generally to be recognized on the lessee's balance sheet. A lessee recognizes a right-of-use asset representing its right to use a lease asset, as well as a liability resulting from the lease, which represents its obligation to make lease payments. There are exemp-tions for short-term leases and leases of low-value assets. Accounting for the lessor is comparable to that of the current standard; i.e., lessors continue to classi-fy leases as financial or operating leases.
The Group has started to analyze the effects of this new standard and does not plan to apply the standard earlier than 2019. At the current stage of analysis, the Group plans to use the exemptions for short-term leases and leases of low-value assets and to recognize the corresponding lease payments as an expense gen-erally on a straigt-line basis over the particular lease term.
Application of IFRS 16 will likely lead to an increase in fixed assets and financial liabilities. Based on its pre-sent level of knowledge, the Group does not expect any significant impact overall on its key performance indicators, such as equity ratio or underlying EBITDA, however. For example, on the basis of the Group's future financial obligations in relation to operating leases as reported on December 31, 2016, the equity ratio would be reduced by about 1%.
With regard to all new changes described above, anal-ysis of their impact has not yet been completed. The information provided above can be regarded as an update of the information provided in the last annual consolidated financial statements for the year ended December 31, 2016. Therefore, the information provid-ed should be read in conjunction with the information disclosed in the Notes to those annual consolidated financial statements.

20
5. Business Acquisitions and Divestitures
Acquisition of Essen BioScience
On March 24, 2017, the Group acquired the U.S. com-pany Essen BioScience Inc. headquartered in Ann Arbor, Michigan, purchasing 100% of the voting rights in this company. The acquisition has been expanding the bioanalytics portfolio of the Lab Products & Services Division.
Essen BioScience develops and markets novel cell im-aging and analysis systems for medical drug research, which are increasingly becoming standard equipment in pharmaceutical laboratories. These systems repre-sent a platform of instrumentation, software and reagents for real-time live-cell imaging and fully au-tomated data analysis. The information delivered by these systems provides new insight and understanding into the mechanisms of healthy and diseased cells, which helps significantly accelerate often time-consuming discovery and development of new drugs.
Founded in 1996, the company currently employs approximately 150 people and is expected to generate sales revenue of around U.S. $60 million. Besides its headquarters in the USA, Essen BioScience has sales companies in the U.K. and in Japan.
Determination of the acquisition-date fair values of the assets acquired and liabilities assumed has not yet been completed. Therefore, the purchase price alloca-tion is preliminary based on the current knowledge of management:
Preliminary purchase price
allocation¤ in mn
Other intangible assets 229.3
Property, plant and equipment 1.3
Inventories 9.1
Trade receivables 9.9
Other assets 0.7
Cash and cash equivalents 14.9
Deferred taxes - net –73.3
Other liabilities –22.1
Net assets acquired 169.8
Purchase price 309.4
Goodwill 139.6
The converted purchase price of €309.4 million was paid in cash. The expenses of €0.3 million directly attributable to the acquisition were recognized as other operating expenses. Goodwill is not expected to be tax-deductible. According to its present level of knowledge, the Group expects that the intangible assets to be recognized will be primarily technology-based, customer-related and brand-based.
Besides being attributable to the synergies that are to be realized by the acquiree's use of the Group's sales and distribution network, the resulting goodwill of the Umetrics acquisition is attributed to extension of the product portfolio of the Lab Products & Services Divi-sion and expansion of this division's position with respect to biopharmaceutical customers.
Acquisition of Umetrics
On April 3, 2017, the Group acquired 100% of the voting rights in the Swedish company MKS Instru-ments AB (Umetrics) based in Umeå, Sweden. In the meantime, the company has been renamed "Sartorius Stedim Data Analytics AB." In addition to these shares, the Group acquired further related intangible assets through asset deals as part of the business combina-tion. The acquisition adds complementary products to the portfolio of the Bioprocess Solutions Division.
Umetrics is a globally leading provider of data analyt-ics software for modeling and optimizing biopharma-ceutical development and manufacturing processes. The company currently employs approximately 50 people and is expected to generate sales revenue of about $15 million in 2017.
The determination of the acquisition-date fair values of the assets acquired and liabilities assumed has not yet been completed. Therefore, the purchase price allocation is preliminary based on the current knowledge of management:

21
Preliminary purchase price
allocation¤ in mn
Other intangible assets 30.3
Property, plant and equipment 0.1
Inventories 0.0
Trade receivables 1.2
Other assets 0.3
Cash and cash equivalents 6.9
Deferred taxes - net –6.3
Other liabilities –4.6
Net assets acquired 28.0
Purchase price 75.0
Goodwill 47.0
The purchase price of approximately €75.0 million was paid in cash. The expenses €0.2 million directly at-tributable to the acquisition were recognized as other expenses in profit or loss. It is expected that the goodwill of this company will not be deductible for tax purposes. According to its present level of knowledge, the Group expects that the intangible assets recognized are primarily technology-based and customer-related intangible assets.
Since their initial consolidation, the entities acquired in the first half of 2017 have contributed sales reve-nue of around €16 million (Essen BioSicence) and €2 million (Umetrics) to consolidated earnings. On the whole, these figures did not have a material impact on Group earning.s
If the acquisitions had taken place as of January 1, 2017, sales revenue for the Group in the first half of 2017 would have been approximately €713.5 million. Without the impacts on the purchase price allocation, the effects on net profit would be immaterial.

22
6. Financial Instruments
Carrying Amounts and Fair Values
€ in millions Categories
June 30, 2017Carrying amount
June 30, 2017Fair value
Dec. 31, 2016Carrying amount
Dec. 31, 2016Fair value
Financial assets Available for sale 5.7 5.7 3.8 3.8
Financial assets Loans and
receivables 3.3 3.3 3.2 3.2
Derivative financial instruments Held for trading 0.0 0.0 0.3 0.3
Derivative financial instruments designated as hedging instruments n/a 8.7 8.7 0.2 0.2
Financial assets (non-current) 17.7 17.7 7.5 7.5
Trade receivables Loans and
receivables 271.6 271.6 241.2 241.2
Receivables and other assets Loans and
receivables 23.5 23.5 14.7 14.7
Derivative financial instruments Held for trading 0.1 0.1 0.0 0.0
Derivative financial instruments designated as hedging instruments n/a 3.9 3.9 0.3 0.3
Other financial assets (current) 27.4 27.4 15.0 15.0
Cash and cash equivalents Loans and
receivables 72.4 72.4 62.0 62.0
Loans and borrowings Financial
liabilities at cost 971.2 977.4 526.0 536.2Finance lease liabilities IAS 17 21.1 32.2 21.9 33.5
Trade payables Financial
liabilities at cost 86.9 86.9 76.4 76.4
Trade payables | payments received for orders n/a 40.6 40.6 44.0 44.0
Trade payables 127.4 127.4 120.4 120.4Derivative financial instruments Held for trading 6.2 6.2 5.6 5.6
Derivative financial instruments designated as hedging instruments n/a 1.1 1.1 13.8 13.8
Other financial liabilities Financial
liabilities at cost 63.8 69.2 66.9 73.7
Other financial liabilities Fair value through
OCI 14.2 14.2 13.8 14.7
Other financial liabilities Fair value through
profit or loss 5.5 5.5 5.8 5.8
Other financial liabilities 90.8 96.1 105.9 113.6
For the equity investments measured at acquisition cost (financial assets), it is not possible to determine fair values reliably due to the absence of active mar-kets. This applies mainly to shares in non-consolidated subsidiaries. These are essentially sales companies of the Group; the calculation of fair values for their ac-tivities would therefore not be relevant for the eco-nomic decisions of the users. There is currently no intention to sell the assets of Sartorius Group affiliates.
The fair values of the financial instruments were de-termined on the basis of the market information avail-able on the reporting date and are to be allocated to one of the three levels of the fair value hierarchy in accordance with IFRS 13.
Level 1 financial instruments are calculated on the basis of prices quoted on active markets for identical assets and liabilities. In Level 2, financial instruments are calcu-lated on the basis of input factors, which are derivable from observable market data or on the basis of market

23
prices for similar instruments. Level 3 financial instru-ments are calculated on the basis of input factors that cannot be derived from observable market data.
The financial instruments to be recognized at fair value on the reporting date are exclusively derivatives in the form of forward contracts, interest rate swaps and structured forward contracts. They were measured on the basis of their quoted exchange rates and mar-ket yield curves (Level 2).
The fair values to be disclosed for financial liabilities recognized at amortized cost, especially liabilities to banks and those related to note loans ("Schuldschein-darlehen"), as well as finance lease liabilities, were measured on the basis of the market interest rate curve, taking the current indicative credit spreads into account (Level 2).
The purchase price liability for the non-controlling interest in Sartorius Israel Ltd. and for the liability resulting from the AllPure phantom stock units are required to be disclosed in the amount of the present value of the expected purchase price payments. Their present value is to be derived in both cases from the expected revenues as of the exercise date and from the risk-adjusted discount rate (Level 3).
The fair values of the remaining financial assets and liabilities to be disclosed approximate the carrying amounts on account of their predominantly short-term maturity.
The maximum credit loss risk is reflected by the carry-ing amounts of the financial assets recognized in the Statement of Profit or Loss.
Measurement of Fair Value
The Group recognizes transfers between the levels of the fair value hierarchies at the end of the reporting period during which the change has occurred. In the current reporting period, there were no transfers between the levels.
The valuation of the level 3 liability is based on a dis-counted cash flow technique in which the expected future payments that are discounted using a risk-adjusted discount rate are taken into account. The expected payments are determined by considering possible developments of future revenue and the amounts to be paid under each scenario. The signifi-cant unobservable input in this calculation is the future sales revenue which was considered at a com-
pound annual growth rate of 15-20% for the AllPure liability.
The carrying amount of this liability developed as follows:
2017¤ in mn
2016€ in mn
Balance at January 1 5.8 5.4
Financial expenses 0.1 0.0
Translation effects –0.4 –0.1
Balance at June 30 5.5 5.4
An increase (a decrease) of the sales revenue by 10% in each of the following years would lead to an in-crease (a decrease) of the liability by €0.5 million (€0.5 million).
Concerning the liability for the purchase of the non-controlling interest in Sartorius Israel Ltd., the input factor that cannot be derived from observable market data is also sales growth for which a compound annual growth rate of approx. 15% was assumed.
The carrying amount of this liability developed as follows:
2017¤ in mn
2016€ in mn
Balance at January 1 13.8 0.0
Initial measurement 0.0 13.4
Financial expenses 0.2 0.2
Translation effects 0.2 –0.1
Balance at June 30 14.2 13.5
An increase (a decrease) in expected sales revenue by 10% in each of the following years would lead to an increase (a decrease) of the liability by €1.4 million (€1.4 million).
7. Related Companies and Persons
The Group companies included in the consolidated financial statements carry out business activities and transactions in related party relationships as defined by IAS 24. In particular, this concerns transactions with non-consolidated subsidiaries and are generally concluded according to the customary market terms.
In the reporting period, sales revenue of €4.6 million (H1 2016: €4.2 million) was generated by these com-panies; there were liabilities from loans and borrow-
24
ings as well as trade payables, both totaling €11.9 million (H1 2016: €10.8 million). A long-term service contract exists with an affiliate for which expenses of €3.5 million (H1 2016: €3.1 million) were incurred in the reporting period.
For further details, also on related companies and persons, see page 159 in our 2016 Annual Report.
8. Other Disclosures
In the interim reporting period, no asset impairments were identified. Generally, asset impairment tests need to be performed for goodwill and other assets with indefinite useful lives.
Regarding its acquisition activities, Sartorius placed a €350 million note loan in the first half of 2017 to further strengthen its financing structure.
The note loan consists of three tranches with maturity terms of 5, 7 and 10 years. These tranches completely bear fixed interest rates. In total, note loan tranches of €595 million are therefore outstanding as of June 30.
Exchange differences arising from net investments in foreign operations are recognized in other comprehen-sive income. In connection with the acquisitions in 2016 and 2017, these net investments increased sig-nificantly, which led to a respective impact on the Group's other comprehensive income.
In the reporting period, Sartorius AG paid dividends totaling €31.1 million, of which €15.4 million were for ordinary shares and €15.7 million for preference shares.
Independent, certified auditors performed an audit review of this consolidated six-month report. The figures of the individual second quarter in the state-ment of profit or loss, as well as the statement of comprehensive income, were not part of this review.
9. Material Events After the Reporting Date
No material events occurred up to completion of the preparation of these interim financial statements.
25
To Sartorius Aktiengesellschaft, Goettingen
We have reviewed the condensed interim consolidated financial statements of the Sartorius Aktiengesell-schaft, Goettingen – comprising the condensed state-ment of profit or loss, statement of comprehensive income, statement of financial position, statement of cash flows, statement of the changes in equity and selected explanatory notes – together with the interim Group management report of the Sartorius Aktien-gesellschaft, Goettingen, Germany, for the period from January 1 to June 30, 2017 that are part of the semi-annual financial report according to § 37 w WpHG ("Wertpapierhandelsgesetz": German Securities Trading Act). The preparation of the condensed interim consol-idated financial statements in accordance with those IFRSs applicable to interim financial reporting as adopted by the EU, and of the interim Group manage-ment report in accordance with the requirements of WpHG applicable to interim Group management re-ports, is the responsibility of the company’s manage-ment. Our responsibility is to issue a report on the condensed interim consolidated financial statements and on the interim Group management report based on our review.
We performed our review of the condensed interim consolidated financial statements and the interim Group management report in accordance with the German generally accepted standards for the review of financial statements established by the German Insti-tute of Independent Auditors, "Institut der Wirtschaftsprüfer" (IDW). These standards require that we plan and perform the review to obtain reasonable assurance that the condensed interim consolidated financial statements have been prepared, in all materi-al respects, in accordance with the IFRSs applicable to interim financial reporting, as adopted by the EU, and that the interim Group management report has been prepared, in all material respects, in accordance with WpHG requirements applicable to interim Group man-agement reports. A review is limited primarily to com-pany employees' responses to our inquiries and to analytical assessments and, therefore, does not provide the assurance attainable in a financial statement audit. Since, in accordance with our audit review assignment, we have not performed a full audit of the financial statements, we cannot issue an audit report.
Based on our review, no matters have come to our attention that cause us to presume that the condensed interim consolidated financial statements have not been prepared, in material respects, in accordance with the IFRSs applicable to interim financial reporting as adopted by the EU or that the interim Group man-agement report has not been prepared, in material respects, in accordance with the requirements of WpHG applicable to interim Group management re-ports.
Hanover, Germany, July 20, 2017
KPMG AG Wirtschaftsprüfungsgesellschaft
Sven-Olaf Leitz Frank Thiele Auditor Auditor
(German Public Auditor) (German Public Auditor)
Independent Auditors' Review Report

26
Declaration of the Executive Board
We declare to the best of our knowledge that the condensed interim consolidated financial statements for the first half ended June 30, 2017, present a true and fair view of the actual net worth, financial situa-tion and profitability of the Group in accordance with the accounting standards to be applied in preparing these statements. We also certify that the progress of the Group’s business, including its business perfor-mance and its situation, are represented accurately in the Group interim report in all material respects and describe the most important opportunities and risks of the Group’s projected development for the remaining six months of the financial year.
Goettingen, July 20, 2017
Sartorius AG
The Executive Board
Responsibility Statement of the Legal Representatives
27
Sartorius AG Weender Landstrasse 94–108 37075 Goettingen, Germany
Phone +49.551.308.0 Fax +49.551.308.3289 www.sartorius.com
Group Corporate Communications
Petra Kirchhoff Vice President Phone +49.551.308.1686 [email protected]
Investor Relations
Andreas Theisen Director Phone +49.551.308.1668 [email protected]
August 29, 2017
Commerzbank Sector Conference Week | Frankfurt am Main, Germany
September 6, 2017
Goldman Sachs European Medtech Conference | London, U.K.
September 12, 2017
Morgan Stanley Global Healthcare Conference | New York, USA
September 18-19, 2017
Berenberg German Corporate Conference | Munich, Germany
October 24, 2017
Publication of nine-month figures for 2017
November 28, 2017
German Equity Forum | Frankfurt am Main, Germany
December 5, 2017
Berenberg European Conference | London, U.K.
January 2018
Publication of preliminary results for fiscal 2017
April 5, 2018
Annual General Shareholders' Meeting | Goettingen, Germany
April 2018
Publication of first-quarter figures for 2018
This is a translation of the original German-language first-half Group interim financial report (January to June 2017) entitled "Sartorius
Konzern Halbjahresbericht – Januar bis Juni 2017." Sartorius AG shall not assume any liability for the correctness of this translation. The
original German interim report is the legally binding version. Furthermore, Sartorius AG reserves the right not to be responsible for the
topicality, correctness, completeness or quality of the information provided. Liability claims regarding damage caused by the use of any
information provided, including any kind of information which is incomplete or incorrect, will therefore be rejected.
Forward-looking Statements Contain Risks
This Sartorius Group Interim Report for the period from the beginning of January 2017 to the end of June 2017 contains various state-
ments concerning the Sartorius Group’s future performance. These statements are based on assumptions and estimates. Although we are
convinced that these forward-looking statements are realistic, we cannot guarantee that they will actually apply. This is because our as-
sumptions harbor risks and uncertainties that could lead to actual results diverging substantially from the expected ones. It is not planned
to update our forward-looking statements.
Throughout the entire report, differences may be apparent as a result of rounding during addition.
Contacts Financial Schedule