S-Nitrosylation of Platelet α IIb β 3 As...
8
S-Nitrosylation of Platelet R IIb 3 As Revealed by Raman Spectroscopy ² Geraldine M. Walsh, ‡ Deirdre Leane, § Niamh Moran, ‡ Tia E. Keyes, § Robert J. Forster, § Dermot Kenny, ‡,§ and Sarah O’Neill* ,‡,§ Molecular and Cellular Therapeutics, Royal College of Surgeons in Ireland, Dublin 2, Ireland, and Biomedical Diagnostics Institute, Dublin City UniVersity, Dublin 9, Ireland ReceiVed October 5, 2006; ReVised Manuscript ReceiVed March 15, 2007 ABSTRACT: The exact mechanisms regulating conformational changes in the platelet-specific integrin R IIb 3 are not fully understood. However, a role exists for thiol/disulfide exchange in integrin conformational changes leading to altered disulfide bonding patterns, via its endogenous thiol isomerase activity. Nitric oxide (NO) accelerates this intrinsic enzymatic activity and, in doing so, reverses the activational state of the integrin on the platelet surface toward a more unactivated one. We propose that it is an S-nitrosylation- induced “shuffling” of thiol/disulfide exchange that regulates this reversal of the activated state of the integrin. In this study, we use Raman spectroscopy to explore S-nitrosylation of purified R IIb 3 . Using S-nitrosoglutathione (GSNO) as a model system, we identify Raman markers which show a direct interaction between NO and the thiol groups of the integrin and reveal many of the structural changes that occur in R IIb 3 in the course of not only its activation but also its deactivation. Key conformational changes are detected within the integrin when treated with manganese (Mn 2+ ), occurring mainly in the cysteine and disulfide regions of the protein, confirming the importance of thiol/disulfide exchange in integrin activation. These changes are subsequently shown to be reversed in the presence of NO. Aggregation of platelets is a crucial process in the hemostatic and thrombotic systems. A critical step in platelet aggregation is the activation of the platelet-specific integrin R IIb 3 (1). In its native, resting state, R IIb 3 has a low affinity for its primary ligand fibrinogen. Upon platelet activation, it undergoes dramatic conformational changes, which in- creases its affinity for its primary ligand fibrinogen. Fibrino- gen binding facilitates cross-linking of adjacent platelets to form a thrombus. Despite the pivotal role of R IIb 3 in thrombotic disorders, the exact molecular mechanisms of this conformational switch are not yet fully elucidated. R IIb 3 has an endogenous enzymatic thiol isomerase activity (2), which catalyzes thiol/disulfide bond exchange within the molecule and is hypothesized to be involved in conformational changes. Recent evidence suggests that R IIb 3 and its thiol isomerase activity are targets for redox regulation (3-5). Divalent Mn 2+ cations induce an active-like confor- mation in R IIb 3 , which increase ligand binding (6-8). Nitric oxide (NO), 1 alone or in combination with glutathione (GSH), reversed this activation state by directly targeting R IIb 3 in platelets. NO also accelerated the thiol isomerase activity of purified R IIb 3 in an allosteric manner (4). We therefore hypothesized that the effect of NO on R IIb 3 may occur as a direct interaction between it and the integrin. It is increasingly emerging that modification of proteins by NO, a process known as S-nitrosylation, is a functionally relevant posttranslational modification that plays a key role in a wide variety of cellular functions. Techniques such as protein crystallography have greatly enhanced the understanding of integrin structure (9-11). However, this technique is constrained by its static nature and the uncertain relevance of the crystallized structure to the form the protein takes in fluid media. For that reason, we sought an alternative approach to explore the structural changes accompanying the activation of R IIb 3 in a biologi- cally relevant setting. We used Raman spectroscopy, a noninvasive tool, which has proven useful in determining the conformation and molecular structure of proteins in aqueous media. There are a limited number of descriptions of Raman spectroscopy as applied to glycoproteins and integrins (12-16). Furthermore, resonance Raman has been widely used to explore ligand binding and heme distortion in heme proteins, including myoglobin, nitric oxide synthase, and soluble guanylate cyclase (17-20). Raman spectroscopy is one of the few techniques that can unambiguously detect the presence of disulfide bonds in proteins (21). Indeed, this technique is remarkably sensitive to the geometry about disulfide bonds in proteins and peptides. Since disulfide rearrangement is of significant importance in the regulation of R IIb 3 activation states (22), we considered Raman spectroscopy an ideal tool to explore changes in the thiols and disulfides in the integrin. In this study we show that Mn 2+ dramatically alters specific areas of the secondary structure of purified R IIb 3 . We describe how NO converts Mn 2+ -activated R IIb 3 to a conformation ² This work was supported by the Science Foundation Ireland, Grants 04/BR/B0666 and 05/INI/B30, the Health Research Board Ireland, and the Higher Education Authority. * Corresponding author. Telephone: +353-1-402 2349. Fax: +353- 1-402 2453. E-mail: [email protected]. ‡ Royal College of Surgeons in Ireland. § Dublin City University. 1 Abbreviations: EDTA, ethylenediaminetetraacetic acid; GSH, glu- tathione; GSNO, S-nitrosoglutathione; Mn 2+ , manganese; NO, nitric oxide; PVDF, polyvinyl difluoride; SDS-PAGE, sodium dodecyl sulfate-polyacrylamide gel electrophoresis; SNOAC, S-nitroso-N- acetylcysteine. 6429 Biochemistry 2007, 46, 6429-6436 10.1021/bi0620712 CCC: $37.00 © 2007 American Chemical Society Published on Web 05/03/2007
Transcript of S-Nitrosylation of Platelet α IIb β 3 As...
S-Nitrosylation of PlateletRIIbâ3 As Revealed by Raman Spectroscopy†
Geraldine M. Walsh,‡ Deirdre Leane,§ Niamh Moran,‡ Tia E. Keyes,§ Robert J. Forster,§ Dermot Kenny,‡,§ andSarah O’Neill*,‡,§
Molecular and Cellular Therapeutics, Royal College of Surgeons in Ireland, Dublin 2, Ireland, andBiomedical Diagnostics Institute, Dublin City UniVersity, Dublin 9, Ireland
ReceiVed October 5, 2006; ReVised Manuscript ReceiVed March 15, 2007
ABSTRACT: The exact mechanisms regulating conformational changes in the platelet-specific integrinRIIbâ3
are not fully understood. However, a role exists for thiol/disulfide exchange in integrin conformationalchanges leading to altered disulfide bonding patterns, via its endogenous thiol isomerase activity. Nitricoxide (NO) accelerates this intrinsic enzymatic activity and, in doing so, reverses the activational state ofthe integrin on the platelet surface toward a more unactivated one. We propose that it is an S-nitrosylation-induced “shuffling” of thiol/disulfide exchange that regulates this reversal of the activated state of theintegrin. In this study, we use Raman spectroscopy to explore S-nitrosylation of purifiedRIIbâ3. UsingS-nitrosoglutathione (GSNO) as a model system, we identify Raman markers which show a direct interactionbetween NO and the thiol groups of the integrin and reveal many of the structural changes that occur inRIIbâ3 in the course of not only its activation but also its deactivation. Key conformational changes aredetected within the integrin when treated with manganese (Mn2+), occurring mainly in the cysteine anddisulfide regions of the protein, confirming the importance of thiol/disulfide exchange in integrin activation.These changes are subsequently shown to be reversed in the presence of NO.
Aggregation of platelets is a crucial process in thehemostatic and thrombotic systems. A critical step in plateletaggregation is the activation of the platelet-specific integrinRIIbâ3 (1). In its native, resting state,RIIbâ3 has a low affinityfor its primary ligand fibrinogen. Upon platelet activation,it undergoes dramatic conformational changes, which in-creases its affinity for its primary ligand fibrinogen. Fibrino-gen binding facilitates cross-linking of adjacent platelets toform a thrombus. Despite the pivotal role ofRIIbâ3 inthrombotic disorders, the exact molecular mechanisms of thisconformational switch are not yet fully elucidated.
RIIbâ3 has an endogenous enzymatic thiol isomeraseactivity (2), which catalyzes thiol/disulfide bond exchangewithin the molecule and is hypothesized to be involved inconformational changes. Recent evidence suggests thatRIIbâ3
and its thiol isomerase activity are targets for redox regulation(3-5). Divalent Mn2+ cations induce an active-like confor-mation inRIIbâ3, which increase ligand binding (6-8). Nitricoxide (NO),1 alone or in combination with glutathione(GSH), reversed this activation state by directly targetingRIIbâ3 in platelets. NO also accelerated the thiol isomeraseactivity of purified RIIbâ3 in an allosteric manner (4). We
therefore hypothesized that the effect of NO onRIIbâ3 mayoccur as a direct interaction between it and the integrin. It isincreasingly emerging that modification of proteins by NO,a process known as S-nitrosylation, is a functionally relevantposttranslational modification that plays a key role in a widevariety of cellular functions.
Techniques such as protein crystallography have greatlyenhanced the understanding of integrin structure (9-11).However, this technique is constrained by its static natureand the uncertain relevance of the crystallized structure tothe form the protein takes in fluid media. For that reason,we sought an alternative approach to explore the structuralchanges accompanying the activation ofRIIbâ3 in a biologi-cally relevant setting. We used Raman spectroscopy, anoninvasive tool, which has proven useful in determiningthe conformation and molecular structure of proteins inaqueous media. There are a limited number of descriptionsof Raman spectroscopy as applied to glycoproteins andintegrins (12-16). Furthermore, resonance Raman has beenwidely used to explore ligand binding and heme distortionin heme proteins, including myoglobin, nitric oxide synthase,and soluble guanylate cyclase (17-20).
Raman spectroscopy is one of the few techniques that canunambiguously detect the presence of disulfide bonds inproteins (21). Indeed, this technique is remarkably sensitiveto the geometry about disulfide bonds in proteins andpeptides. Since disulfide rearrangement is of significantimportance in the regulation ofRIIbâ3 activation states (22),we considered Raman spectroscopy an ideal tool to explorechanges in the thiols and disulfides in the integrin. In thisstudy we show that Mn2+ dramatically alters specific areasof the secondary structure of purifiedRIIbâ3. We describehow NO converts Mn2+-activatedRIIbâ3 to a conformation
† This work was supported by the Science Foundation Ireland, Grants04/BR/B0666 and 05/INI/B30, the Health Research Board Ireland, andthe Higher Education Authority.
* Corresponding author. Telephone:+353-1-402 2349. Fax:+353-1-402 2453. E-mail: [email protected].
‡ Royal College of Surgeons in Ireland.§ Dublin City University.1 Abbreviations: EDTA, ethylenediaminetetraacetic acid; GSH, glu-
tathione; GSNO,S-nitrosoglutathione; Mn2+, manganese; NO, nitricoxide; PVDF, polyvinyl difluoride; SDS-PAGE, sodium dodecylsulfate-polyacrylamide gel electrophoresis; SNOAC,S-nitroso-N-acetylcysteine.
6429Biochemistry2007,46, 6429-6436
10.1021/bi0620712 CCC: $37.00 © 2007 American Chemical SocietyPublished on Web 05/03/2007
similar to a resting conformation of the integrin. The Ramanstudies further indicate that NO directly modifiesRIIbâ3 atits thiol groups, a finding consistent with our hypothesis thatRIIbâ3 can be directly S-nitrosylated. Direct S-nitrosylationof RIIbâ3 has not previously been demonstrated, and thisfinding provides a mechanism for the previously observedeffects of NO on integrin activation. The result of this Ramanstudy was confirmed using the biotin-switch assay (23) toverify in vitro nitrosylation of integrin cysteines and wasfurther supported by the presence of known nitrosylationmotifs in the primary amino acid sequence ofRIIbâ3.
EXPERIMENTAL PROCEDURES
Materials.Monoclonal antibodies, fluorescein isothiocy-anate- (FITC-) conjugated monoclonal antibody PAC-1, andphycoerythrin- (PE-) conjugated monoclonal antibody CD62Pwere obtained from Becton Dickinson, Oxford, England.Glutathione reduced (GSH),S-nitrosoglutathione (GSNO),and Ultrafree-MC microcentrifuge filters (10000 NMWL)were purchased from Sigma Aldrich Ltd., Tallaght, Ireland.RIIbâ3 was obtained from Enzyme Research Laboratories,Swansea, U.K. The Bradford DC assay and micro-Bio-SpinP6 columns were obtained from Bio-Rad Laboratories Ltd.,Hertfordshire, U.K. The CM5 dextran-gold (Au) sensor chipwas from Biacore, Uppsala, Sweden. The SuperSignal WestPico Chemiluminescent kit was from Pierce, Rockford, IL.
FACS Analysis of PAC-1 and P-Selectin Expression.Gel-filtered platelets, prepared as described previously (4), wereadjusted to 3× 10⁸ platelets/mL and diluted 1:1 in buffer.Platelets were activated with 1 unit/mL thrombin for 3 minat 37°C. The activated platelets were immediately incubatedwith GSH (3 mM)( S-nitroso-N-acetylcysteine (SNOAC,10 µM) for 3 min at room temperature. The platelets wereincubated with both fluorescein isothiocyanate- (FITC-)conjugated monoclonal antibody, PAC-1, which is directedagainst an active conformation ofRIIbâ3, and phycoerythrin-(PE-) conjugated monoclonal antibody, CD62P, directedagainst P-selectin, which is only expressed on the plateletsurface upon activation and secretion. Samples were fixedwith 1% formaldehyde and read at room temperature on aBecton-Dickinson FACScan flow cytometer at 488/510 nm.Platelet populations were gated, and mean fluorescenthistograms were generated for each sample.
Flow Cytometry Data Analysis.Unactivated platelets weremarked at a value of 5% positive for both PAC-1 and CD62Pexpression. All subsequent samples were measured relativeto the 5% gate in the resting samples, giving a percentagepositive score for each antibody and for each treatment. Log-transformation was used to resolve nonnormality of the data(Shapiro-WilksP-value) 0.1794 and 0.3271 for PAC-1 andCD629P, respectively), andp-values were adjusted using theBonferroni correction.
Preparation ofRIIbâ3 for Raman Spectroscopy.RIIbâ3 wasconcentrated by centrifugation at 4000g for 30 min at 4°Cthrough Ultrafree-MC microcentrifuge filters (10000 NMWL)prewashed with buffer. The protein was exchanged into aPBS buffer (40 mM Na2HPO4, 10 mM NaH2PO4‚H2O, 100mM NaCl, pH 7.4) containing 0.1% Triton X-100 (PBSTX),which gives a minimal level of background signal in Ramanspectroscopy. The protein solution was carefully washed offthe filter membrane, and protein concentration was deter-
mined using the Bradford DC assay. Concentrations ofgreater than 10 mg/mL were found to be suitable for Ramanspectroscopy.
Analysis of PurifiedRIIbâ3 by Raman Spectroscopy.A 1µL drop of concentratedRIIbâ3 was placed on a CM5 dextran-gold (Au) chip; surface roughness was estimated to beapproximately 2. The Raman spectra were recorded on aHORIBA Jobin Yvon LabRAM HR 2000 spectrometer,equipped with an integral confocal microscope. A 632.8 nmexcitation line was employed from an air-cooled HeNe laser.The scattered radiation was observed with 180° geometrywith a cooled (-75 °C) charged-coupled device (CCD)detector. The laser beam was focused through a 300µmconfocal hole onto a spot of 1µm in diameter with a longfocal length objective of the order of 10×. Data acquisitiontimes were every 6 s with 20 accumulations. The holographicgrating (1800 grooves/nm) allowed resolution of 0.1 cm-1.The instrument was calibrated using silicon wafer (520 cm-1)and acetonitrile standards. Accuracy was estimated to be lessthan 0.5 cm-1. Laser power was limited, using optical densityto 23 mW to minimize the possibility of damage to theprotein. Spectra of blank PBS buffer with 0.1% TritonX-100 were collected and used for background subtraction.Solid GSH and GSNO were analyzed in their solid state ona low-fluorescence glass slide for acquisition of Ramanspectra. Spectra were analyzed using Peak Fit or Labspecsoftware.
Treatment ofRIIbâ3 with Conformation Modifying Re-agents.Purified, concentrated (>10 mg/mL) RIIbâ3 wastreated with 10 mM NO donor,S-nitrosoglutathione (GSNO),in the dark at room temperature for 15 min. The sampleswere centrifuged through micro-Bio-Spin P6 columns equili-brated with PBSTX buffer to remove any excess GSNO fromthe sample. A 1µL drop of the modified protein was placedon the dextran-modified Au chip, and Raman spectra wereacquired as described above. Similarly, purified and con-centratedRIIbâ3 in PBSTX buffer was treated with 1 mMMnCl2 for 10 min at room temperature. One microliter ofthis modified protein was placed on the Biacore dextran-Auchip and analyzed as described. The remainder of the samplewas treated with 10 mM GSNO for 15 min at roomtemperature in the dark. The sample was spun through micro-Bio-Spin P6 columns equilibrated with PBSTX buffer toremove any excess GSNO. A 1µL drop of this Mn2+-activated, GSNO-treatedRIIbâ3 was placed on the Biacoredextran-Au chip for Raman spectra acquisition. All measure-ments were carried out a minimum ofn ) 3 and showedexcellent reproducibility.
Biotin-Switch Assay of PurifiedRIIbâ3. Purified RIIbâ3 (3mg/mL), in a final volume of 50µL, was incubated withdeionized H2O or the NO donor SNOAC (1 mM) for20 min at room temperature. Nitrosylation was then detectedusing a modified version of the biotin-switch assay (23, 24).Briefly, samples were incubated with 150µL of blockingsolution [9 volumes of HEN buffer (25 mM HEPES, pH7.4, 0.1 mM EDTA, 10µM neocuprione), 1 volume of 25%SDS/20 mM MMTS (added from a 2 M stock prepared inDMF)] at 50°C for 1 h. Four hundred microliters of cooled(-20 °C) acetone was added to the samples, and they wereprecipitated twice. After the final precipitation, the pelletswere carefully resuspended in 30µL of HENS solubilizationbuffer (25 mM HEPES, pH 7.4, 0.1 mM EDTA, 10µM
6430 Biochemistry, Vol. 46, No. 21, 2007 Walsh et al.
neocuproine, 1% SDS), and 2.4µM ascorbate and 1 mMbiotin-HPDP were added to each sample, and they werevortexed vigorously. Samples were incubated at roomtemperature in the dark for 1 h. To detect biotinylatedproteins by western blot, an equal volume of 2× nonreducingsample buffer was added to each sample; they were notboiled and were run on 7.5% SDS-PAGE. Proteins weretransferred to PVDF membrane, stained with the reversibleprotein stain Ponceau-S, and imaged. The membrane wasthen blocked for 1.5 h in 1% casein in 0.05% PBS Tween-20 (PBST) and probed with 1:4000 anti-biotin antibody and1:20000 dilutions of goat anti-mouse HRP. Membranes weredeveloped using the SuperSignal West Pico Chemilumines-cent kit and exposed to Kodak Biomax ML film.
RESULTS
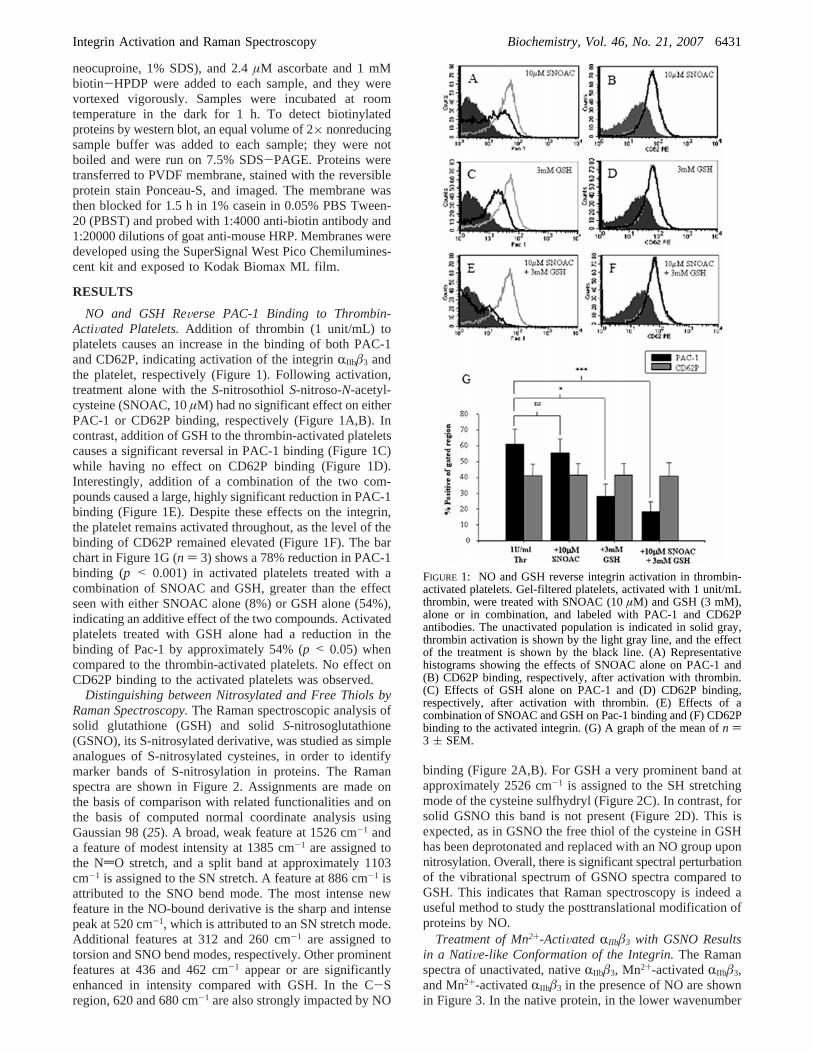
NO and GSH ReVerse PAC-1 Binding to Thrombin-ActiVated Platelets.Addition of thrombin (1 unit/mL) toplatelets causes an increase in the binding of both PAC-1and CD62P, indicating activation of the integrinRIIbâ3 andthe platelet, respectively (Figure 1). Following activation,treatment alone with theS-nitrosothiol S-nitroso-N-acetyl-cysteine (SNOAC, 10µM) had no significant effect on eitherPAC-1 or CD62P binding, respectively (Figure 1A,B). Incontrast, addition of GSH to the thrombin-activated plateletscauses a significant reversal in PAC-1 binding (Figure 1C)while having no effect on CD62P binding (Figure 1D).Interestingly, addition of a combination of the two com-pounds caused a large, highly significant reduction in PAC-1binding (Figure 1E). Despite these effects on the integrin,the platelet remains activated throughout, as the level of thebinding of CD62P remained elevated (Figure 1F). The barchart in Figure 1G (n ) 3) shows a 78% reduction in PAC-1binding (p < 0.001) in activated platelets treated with acombination of SNOAC and GSH, greater than the effectseen with either SNOAC alone (8%) or GSH alone (54%),indicating an additive effect of the two compounds. Activatedplatelets treated with GSH alone had a reduction in thebinding of Pac-1 by approximately 54% (p < 0.05) whencompared to the thrombin-activated platelets. No effect onCD62P binding to the activated platelets was observed.
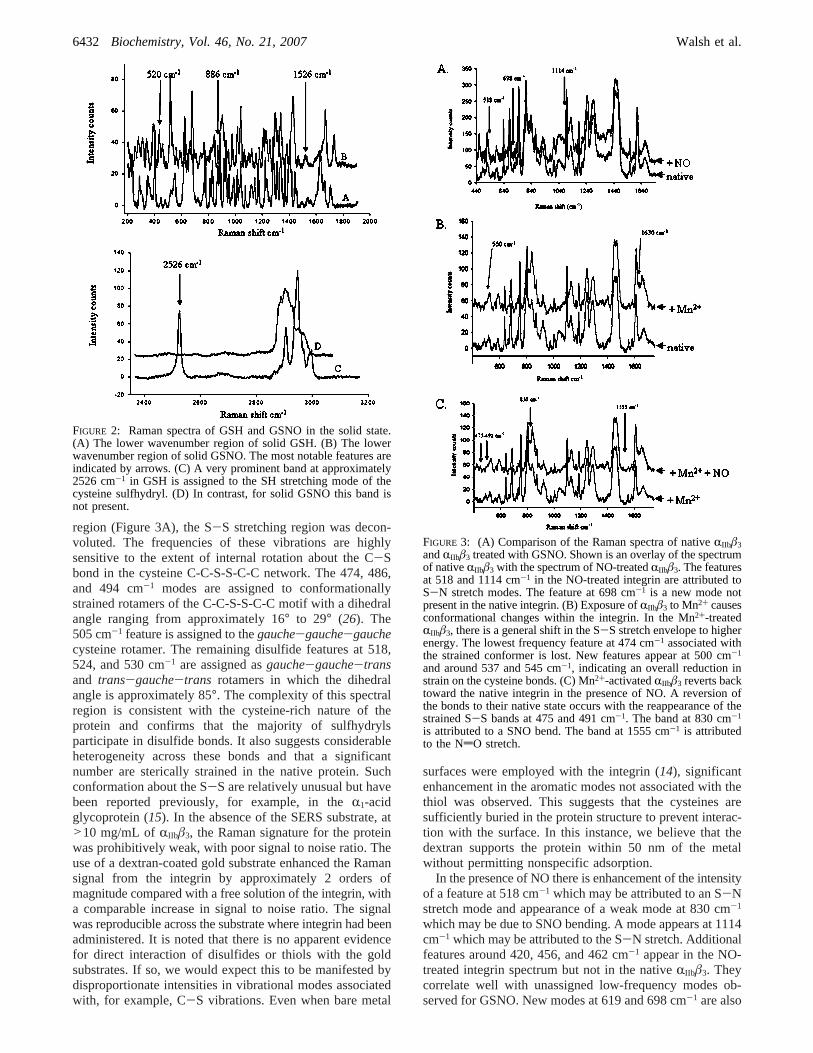
Distinguishing between Nitrosylated and Free Thiols byRaman Spectroscopy.The Raman spectroscopic analysis ofsolid glutathione (GSH) and solidS-nitrosoglutathione(GSNO), its S-nitrosylated derivative, was studied as simpleanalogues of S-nitrosylated cysteines, in order to identifymarker bands of S-nitrosylation in proteins. The Ramanspectra are shown in Figure 2. Assignments are made onthe basis of comparison with related functionalities and onthe basis of computed normal coordinate analysis usingGaussian 98 (25). A broad, weak feature at 1526 cm-1 anda feature of modest intensity at 1385 cm-1 are assigned tothe NdO stretch, and a split band at approximately 1103cm-1 is assigned to the SN stretch. A feature at 886 cm-1 isattributed to the SNO bend mode. The most intense newfeature in the NO-bound derivative is the sharp and intensepeak at 520 cm-1, which is attributed to an SN stretch mode.Additional features at 312 and 260 cm-1 are assigned totorsion and SNO bend modes, respectively. Other prominentfeatures at 436 and 462 cm-1 appear or are significantlyenhanced in intensity compared with GSH. In the C-Sregion, 620 and 680 cm-1 are also strongly impacted by NO
binding (Figure 2A,B). For GSH a very prominent band atapproximately 2526 cm-1 is assigned to the SH stretchingmode of the cysteine sulfhydryl (Figure 2C). In contrast, forsolid GSNO this band is not present (Figure 2D). This isexpected, as in GSNO the free thiol of the cysteine in GSHhas been deprotonated and replaced with an NO group uponnitrosylation. Overall, there is significant spectral perturbationof the vibrational spectrum of GSNO spectra compared toGSH. This indicates that Raman spectroscopy is indeed auseful method to study the posttranslational modification ofproteins by NO.
Treatment of Mn2+-ActiVated RIIbâ3 with GSNO Resultsin a NatiVe-like Conformation of the Integrin.The Ramanspectra of unactivated, nativeRIIbâ3, Mn2+-activatedRIIbâ3,and Mn2+-activatedRIIbâ3 in the presence of NO are shownin Figure 3. In the native protein, in the lower wavenumber
FIGURE 1: NO and GSH reverse integrin activation in thrombin-activated platelets. Gel-filtered platelets, activated with 1 unit/mLthrombin, were treated with SNOAC (10µM) and GSH (3 mM),alone or in combination, and labeled with PAC-1 and CD62Pantibodies. The unactivated population is indicated in solid gray,thrombin activation is shown by the light gray line, and the effectof the treatment is shown by the black line. (A) Representativehistograms showing the effects of SNOAC alone on PAC-1 and(B) CD62P binding, respectively, after activation with thrombin.(C) Effects of GSH alone on PAC-1 and (D) CD62P binding,respectively, after activation with thrombin. (E) Effects of acombination of SNOAC and GSH on Pac-1 binding and (F) CD62Pbinding to the activated integrin. (G) A graph of the mean ofn )3 ( SEM.
Integrin Activation and Raman Spectroscopy Biochemistry, Vol. 46, No. 21, 20076431
region (Figure 3A), the S-S stretching region was decon-voluted. The frequencies of these vibrations are highlysensitive to the extent of internal rotation about the C-Sbond in the cysteine C-C-S-S-C-C network. The 474, 486,and 494 cm-1 modes are assigned to conformationallystrained rotamers of the C-C-S-S-C-C motif with a dihedralangle ranging from approximately 16° to 29° (26). The505 cm-1 feature is assigned to thegauche-gauche-gauchecysteine rotamer. The remaining disulfide features at 518,524, and 530 cm-1 are assigned asgauche-gauche-transand trans-gauche-trans rotamers in which the dihedralangle is approximately 85°. The complexity of this spectralregion is consistent with the cysteine-rich nature of theprotein and confirms that the majority of sulfhydrylsparticipate in disulfide bonds. It also suggests considerableheterogeneity across these bonds and that a significantnumber are sterically strained in the native protein. Suchconformation about the S-S are relatively unusual but havebeen reported previously, for example, in theR1-acidglycoprotein (15). In the absence of the SERS substrate, at>10 mg/mL ofRIIbâ3, the Raman signature for the proteinwas prohibitively weak, with poor signal to noise ratio. Theuse of a dextran-coated gold substrate enhanced the Ramansignal from the integrin by approximately 2 orders ofmagnitude compared with a free solution of the integrin, witha comparable increase in signal to noise ratio. The signalwas reproducible across the substrate where integrin had beenadministered. It is noted that there is no apparent evidencefor direct interaction of disulfides or thiols with the goldsubstrates. If so, we would expect this to be manifested bydisproportionate intensities in vibrational modes associatedwith, for example, C-S vibrations. Even when bare metal
surfaces were employed with the integrin (14), significantenhancement in the aromatic modes not associated with thethiol was observed. This suggests that the cysteines aresufficiently buried in the protein structure to prevent interac-tion with the surface. In this instance, we believe that thedextran supports the protein within 50 nm of the metalwithout permitting nonspecific adsorption.
In the presence of NO there is enhancement of the intensityof a feature at 518 cm-1 which may be attributed to an S-Nstretch mode and appearance of a weak mode at 830 cm-1
which may be due to SNO bending. A mode appears at 1114cm-1 which may be attributed to the S-N stretch. Additionalfeatures around 420, 456, and 462 cm-1 appear in the NO-treated integrin spectrum but not in the nativeRIIbâ3. Theycorrelate well with unassigned low-frequency modes ob-served for GSNO. New modes at 619 and 698 cm-1 are also
FIGURE 2: Raman spectra of GSH and GSNO in the solid state.(A) The lower wavenumber region of solid GSH. (B) The lowerwavenumber region of solid GSNO. The most notable features areindicated by arrows. (C) A very prominent band at approximately2526 cm-1 in GSH is assigned to the SH stretching mode of thecysteine sulfhydryl. (D) In contrast, for solid GSNO this band isnot present.
FIGURE 3: (A) Comparison of the Raman spectra of nativeRIIbâ3andRIIbâ3 treated with GSNO. Shown is an overlay of the spectrumof nativeRIIbâ3 with the spectrum of NO-treatedRIIbâ3. The featuresat 518 and 1114 cm-1 in the NO-treated integrin are attributed toS-N stretch modes. The feature at 698 cm-1 is a new mode notpresent in the native integrin. (B) Exposure ofRIIbâ3 to Mn2+ causesconformational changes within the integrin. In the Mn2+-treatedRIIbâ3, there is a general shift in the S-S stretch envelope to higherenergy. The lowest frequency feature at 474 cm-1 associated withthe strained conformer is lost. New features appear at 500 cm-1
and around 537 and 545 cm-1, indicating an overall reduction instrain on the cysteine bonds. (C) Mn2+-activatedRIIbâ3 reverts backtoward the native integrin in the presence of NO. A reversion ofthe bonds to their native state occurs with the reappearance of thestrained S-S bands at 475 and 491 cm-1. The band at 830 cm-1
is attributed to a SNO bend. The band at 1555 cm-1 is attributedto the NdO stretch.
6432 Biochemistry, Vol. 46, No. 21, 2007 Walsh et al.
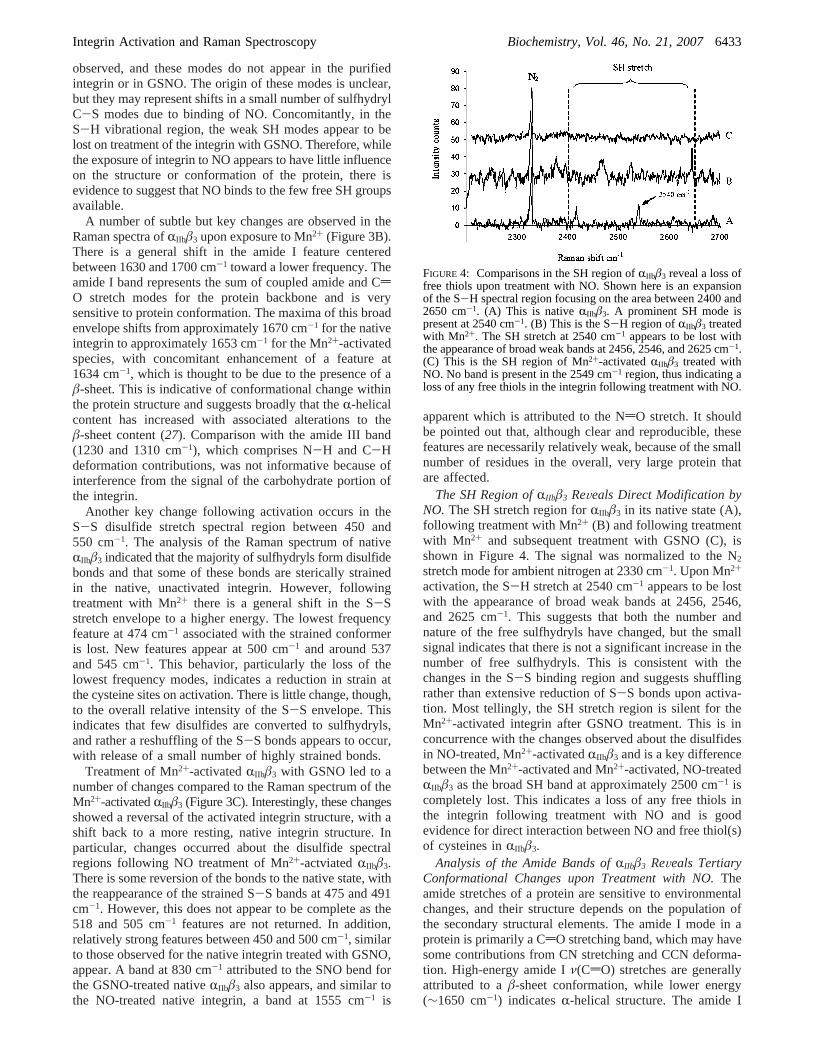
observed, and these modes do not appear in the purifiedintegrin or in GSNO. The origin of these modes is unclear,but they may represent shifts in a small number of sulfhydrylC-S modes due to binding of NO. Concomitantly, in theS-H vibrational region, the weak SH modes appear to belost on treatment of the integrin with GSNO. Therefore, whilethe exposure of integrin to NO appears to have little influenceon the structure or conformation of the protein, there isevidence to suggest that NO binds to the few free SH groupsavailable.
A number of subtle but key changes are observed in theRaman spectra ofRIIbâ3 upon exposure to Mn2+ (Figure 3B).There is a general shift in the amide I feature centeredbetween 1630 and 1700 cm-1 toward a lower frequency. Theamide I band represents the sum of coupled amide and CdO stretch modes for the protein backbone and is verysensitive to protein conformation. The maxima of this broadenvelope shifts from approximately 1670 cm-1 for the nativeintegrin to approximately 1653 cm-1 for the Mn2+-activatedspecies, with concomitant enhancement of a feature at1634 cm-1, which is thought to be due to the presence of aâ-sheet. This is indicative of conformational change withinthe protein structure and suggests broadly that theR-helicalcontent has increased with associated alterations to theâ-sheet content (27). Comparison with the amide III band(1230 and 1310 cm-1), which comprises N-H and C-Hdeformation contributions, was not informative because ofinterference from the signal of the carbohydrate portion ofthe integrin.
Another key change following activation occurs in theS-S disulfide stretch spectral region between 450 and550 cm-1. The analysis of the Raman spectrum of nativeRIIbâ3 indicated that the majority of sulfhydryls form disulfidebonds and that some of these bonds are sterically strainedin the native, unactivated integrin. However, followingtreatment with Mn2+ there is a general shift in the S-Sstretch envelope to a higher energy. The lowest frequencyfeature at 474 cm-1 associated with the strained conformeris lost. New features appear at 500 cm-1 and around 537and 545 cm-1. This behavior, particularly the loss of thelowest frequency modes, indicates a reduction in strain atthe cysteine sites on activation. There is little change, though,to the overall relative intensity of the S-S envelope. Thisindicates that few disulfides are converted to sulfhydryls,and rather a reshuffling of the S-S bonds appears to occur,with release of a small number of highly strained bonds.
Treatment of Mn2+-activatedRIIbâ3 with GSNO led to anumber of changes compared to the Raman spectrum of theMn2+-activatedRIIbâ3 (Figure 3C). Interestingly, these changesshowed a reversal of the activated integrin structure, with ashift back to a more resting, native integrin structure. Inparticular, changes occurred about the disulfide spectralregions following NO treatment of Mn2+-actviatedRIIbâ3.There is some reversion of the bonds to the native state, withthe reappearance of the strained S-S bands at 475 and 491cm-1. However, this does not appear to be complete as the518 and 505 cm-1 features are not returned. In addition,relatively strong features between 450 and 500 cm-1, similarto those observed for the native integrin treated with GSNO,appear. A band at 830 cm-1 attributed to the SNO bend forthe GSNO-treated nativeRIIbâ3 also appears, and similar tothe NO-treated native integrin, a band at 1555 cm-1 is
apparent which is attributed to the NdO stretch. It shouldbe pointed out that, although clear and reproducible, thesefeatures are necessarily relatively weak, because of the smallnumber of residues in the overall, very large protein thatare affected.
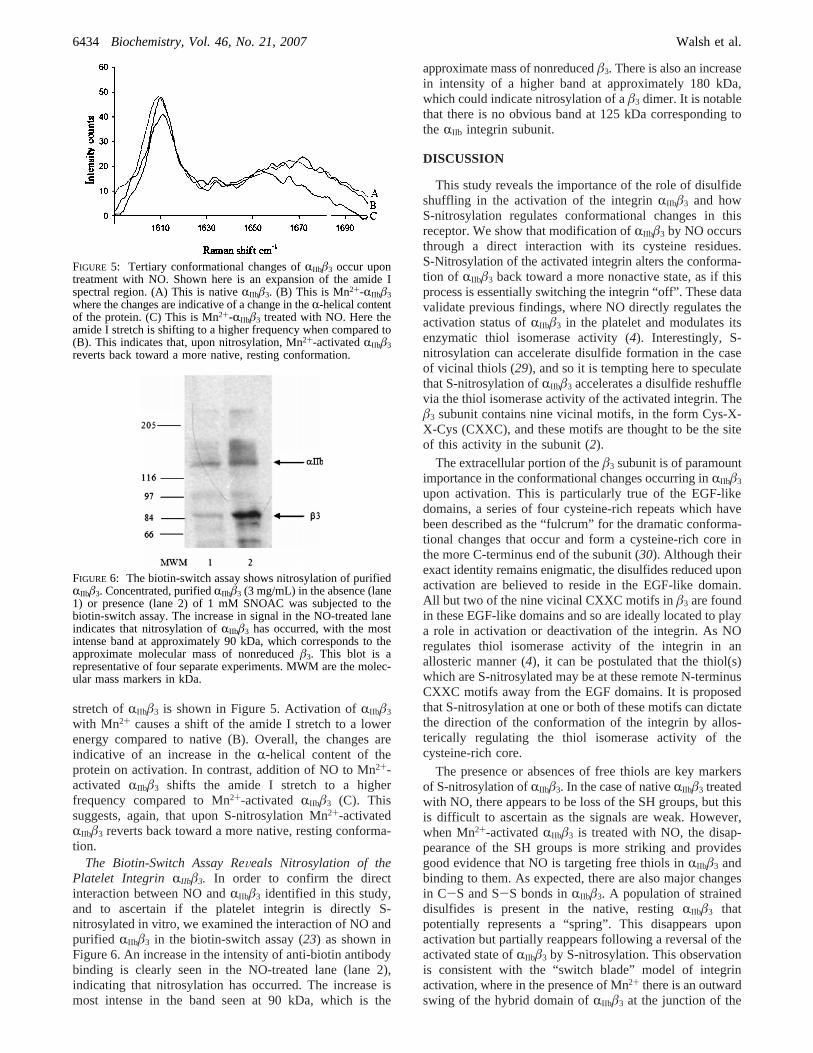
The SH Region ofRIIbâ3 ReVeals Direct Modification byNO. The SH stretch region forRIIbâ3 in its native state (A),following treatment with Mn2+ (B) and following treatmentwith Mn2+ and subsequent treatment with GSNO (C), isshown in Figure 4. The signal was normalized to the N2
stretch mode for ambient nitrogen at 2330 cm-1. Upon Mn2+
activation, the S-H stretch at 2540 cm-1 appears to be lostwith the appearance of broad weak bands at 2456, 2546,and 2625 cm-1. This suggests that both the number andnature of the free sulfhydryls have changed, but the smallsignal indicates that there is not a significant increase in thenumber of free sulfhydryls. This is consistent with thechanges in the S-S binding region and suggests shufflingrather than extensive reduction of S-S bonds upon activa-tion. Most tellingly, the SH stretch region is silent for theMn2+-activated integrin after GSNO treatment. This is inconcurrence with the changes observed about the disulfidesin NO-treated, Mn2+-activatedRIIbâ3 and is a key differencebetween the Mn2+-activated and Mn2+-activated, NO-treatedRIIbâ3 as the broad SH band at approximately 2500 cm-1 iscompletely lost. This indicates a loss of any free thiols inthe integrin following treatment with NO and is goodevidence for direct interaction between NO and free thiol(s)of cysteines inRIIbâ3.
Analysis of the Amide Bands ofRIIbâ3 ReVeals TertiaryConformational Changes upon Treatment with NO.Theamide stretches of a protein are sensitive to environmentalchanges, and their structure depends on the population ofthe secondary structural elements. The amide I mode in aprotein is primarily a CdO stretching band, which may havesome contributions from CN stretching and CCN deforma-tion. High-energy amide Iν(CdO) stretches are generallyattributed to aâ-sheet conformation, while lower energy(∼1650 cm-1) indicatesR-helical structure. The amide I
FIGURE 4: Comparisons in the SH region ofRIIbâ3 reveal a loss offree thiols upon treatment with NO. Shown here is an expansionof the S-H spectral region focusing on the area between 2400 and2650 cm-1. (A) This is nativeRIIbâ3. A prominent SH mode ispresent at 2540 cm-1. (B) This is the S-H region ofRIIbâ3 treatedwith Mn2+. The SH stretch at 2540 cm-1 appears to be lost withthe appearance of broad weak bands at 2456, 2546, and 2625 cm-1.(C) This is the SH region of Mn2+-activatedRIIbâ3 treated withNO. No band is present in the 2549 cm-1 region, thus indicating aloss of any free thiols in the integrin following treatment with NO.
Integrin Activation and Raman Spectroscopy Biochemistry, Vol. 46, No. 21, 20076433
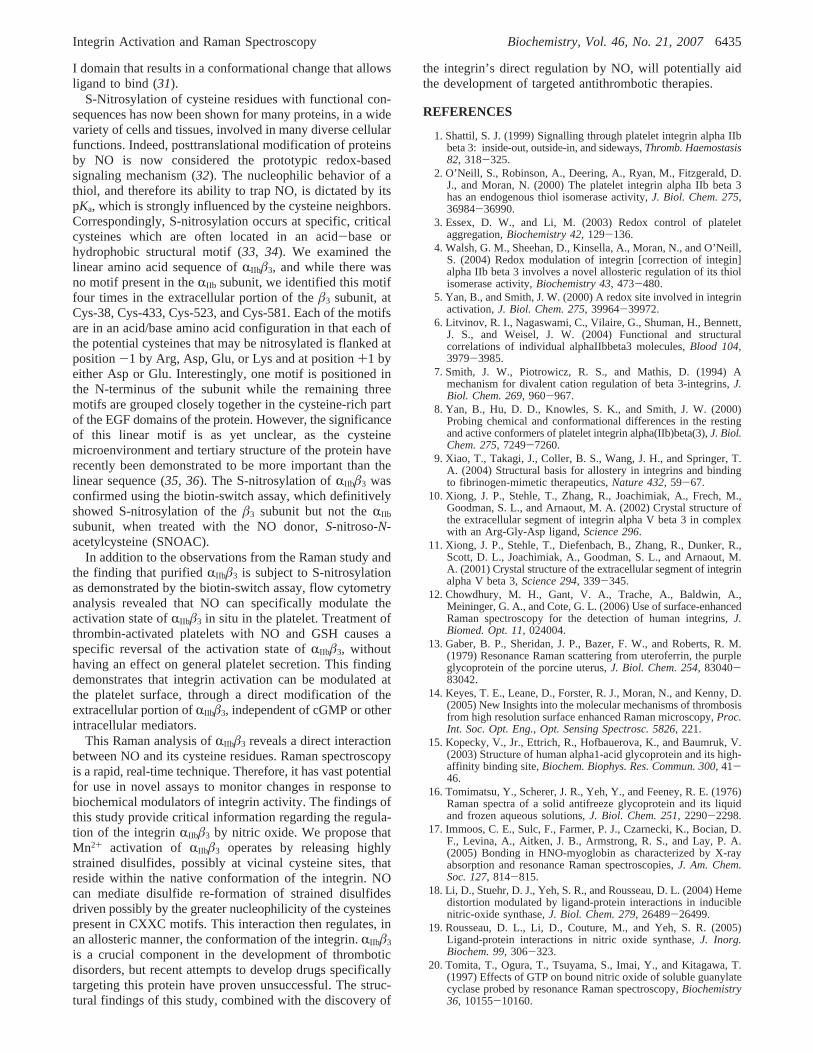
stretch ofRIIbâ3 is shown in Figure 5. Activation ofRIIbâ3
with Mn2+ causes a shift of the amide I stretch to a lowerenergy compared to native (B). Overall, the changes areindicative of an increase in theR-helical content of theprotein on activation. In contrast, addition of NO to Mn2+-activated RIIbâ3 shifts the amide I stretch to a higherfrequency compared to Mn2+-activated RIIbâ3 (C). Thissuggests, again, that upon S-nitrosylation Mn2+-activatedRIIbâ3 reverts back toward a more native, resting conforma-tion.
The Biotin-Switch Assay ReVeals Nitrosylation of thePlatelet Integrin RIIbâ3. In order to confirm the directinteraction between NO andRIIbâ3 identified in this study,and to ascertain if the platelet integrin is directly S-nitrosylated in vitro, we examined the interaction of NO andpurified RIIbâ3 in the biotin-switch assay (23) as shown inFigure 6. An increase in the intensity of anti-biotin antibodybinding is clearly seen in the NO-treated lane (lane 2),indicating that nitrosylation has occurred. The increase ismost intense in the band seen at 90 kDa, which is the
approximate mass of nonreducedâ3. There is also an increasein intensity of a higher band at approximately 180 kDa,which could indicate nitrosylation of aâ3 dimer. It is notablethat there is no obvious band at 125 kDa corresponding tothe RIIb integrin subunit.
DISCUSSION
This study reveals the importance of the role of disulfideshuffling in the activation of the integrinRIIbâ3 and howS-nitrosylation regulates conformational changes in thisreceptor. We show that modification ofRIIbâ3 by NO occursthrough a direct interaction with its cysteine residues.S-Nitrosylation of the activated integrin alters the conforma-tion of RIIbâ3 back toward a more nonactive state, as if thisprocess is essentially switching the integrin “off”. These datavalidate previous findings, where NO directly regulates theactivation status ofRIIbâ3 in the platelet and modulates itsenzymatic thiol isomerase activity (4). Interestingly, S-nitrosylation can accelerate disulfide formation in the caseof vicinal thiols (29), and so it is tempting here to speculatethat S-nitrosylation ofRIIbâ3 accelerates a disulfide reshufflevia the thiol isomerase activity of the activated integrin. Theâ3 subunit contains nine vicinal motifs, in the form Cys-X-X-Cys (CXXC), and these motifs are thought to be the siteof this activity in the subunit (2).
The extracellular portion of theâ3 subunit is of paramountimportance in the conformational changes occurring inRIIbâ3
upon activation. This is particularly true of the EGF-likedomains, a series of four cysteine-rich repeats which havebeen described as the “fulcrum” for the dramatic conforma-tional changes that occur and form a cysteine-rich core inthe more C-terminus end of the subunit (30). Although theirexact identity remains enigmatic, the disulfides reduced uponactivation are believed to reside in the EGF-like domain.All but two of the nine vicinal CXXC motifs inâ3 are foundin these EGF-like domains and so are ideally located to playa role in activation or deactivation of the integrin. As NOregulates thiol isomerase activity of the integrin in anallosteric manner (4), it can be postulated that the thiol(s)which are S-nitrosylated may be at these remote N-terminusCXXC motifs away from the EGF domains. It is proposedthat S-nitrosylation at one or both of these motifs can dictatethe direction of the conformation of the integrin by allos-terically regulating the thiol isomerase activity of thecysteine-rich core.
The presence or absences of free thiols are key markersof S-nitrosylation ofRIIbâ3. In the case of nativeRIIbâ3 treatedwith NO, there appears to be loss of the SH groups, but thisis difficult to ascertain as the signals are weak. However,when Mn2+-activatedRIIbâ3 is treated with NO, the disap-pearance of the SH groups is more striking and providesgood evidence that NO is targeting free thiols inRIIbâ3 andbinding to them. As expected, there are also major changesin C-S and S-S bonds inRIIbâ3. A population of straineddisulfides is present in the native, restingRIIbâ3 thatpotentially represents a “spring”. This disappears uponactivation but partially reappears following a reversal of theactivated state ofRIIbâ3 by S-nitrosylation. This observationis consistent with the “switch blade” model of integrinactivation, where in the presence of Mn2+ there is an outwardswing of the hybrid domain ofRIIbâ3 at the junction of the
FIGURE 5: Tertiary conformational changes ofRIIbâ3 occur upontreatment with NO. Shown here is an expansion of the amide Ispectral region. (A) This is nativeRIIbâ3. (B) This is Mn2+-RIIbâ3where the changes are indicative of a change in theR-helical contentof the protein. (C) This is Mn2+-RIIbâ3 treated with NO. Here theamide I stretch is shifting to a higher frequency when compared to(B). This indicates that, upon nitrosylation, Mn2+-activatedRIIbâ3reverts back toward a more native, resting conformation.
FIGURE 6: The biotin-switch assay shows nitrosylation of purifiedRIIbâ3. Concentrated, purifiedRIIbâ3 (3 mg/mL) in the absence (lane1) or presence (lane 2) of 1 mM SNOAC was subjected to thebiotin-switch assay. The increase in signal in the NO-treated laneindicates that nitrosylation ofRIIbâ3 has occurred, with the mostintense band at approximately 90 kDa, which corresponds to theapproximate molecular mass of nonreducedâ3. This blot is arepresentative of four separate experiments. MWM are the molec-ular mass markers in kDa.
6434 Biochemistry, Vol. 46, No. 21, 2007 Walsh et al.
I domain that results in a conformational change that allowsligand to bind (31).
S-Nitrosylation of cysteine residues with functional con-sequences has now been shown for many proteins, in a widevariety of cells and tissues, involved in many diverse cellularfunctions. Indeed, posttranslational modification of proteinsby NO is now considered the prototypic redox-basedsignaling mechanism (32). The nucleophilic behavior of athiol, and therefore its ability to trap NO, is dictated by itspKa, which is strongly influenced by the cysteine neighbors.Correspondingly, S-nitrosylation occurs at specific, criticalcysteines which are often located in an acid-base orhydrophobic structural motif (33, 34). We examined thelinear amino acid sequence ofRIIbâ3, and while there wasno motif present in theRIIb subunit, we identified this motiffour times in the extracellular portion of theâ3 subunit, atCys-38, Cys-433, Cys-523, and Cys-581. Each of the motifsare in an acid/base amino acid configuration in that each ofthe potential cysteines that may be nitrosylated is flanked atposition-1 by Arg, Asp, Glu, or Lys and at position+1 byeither Asp or Glu. Interestingly, one motif is positioned inthe N-terminus of the subunit while the remaining threemotifs are grouped closely together in the cysteine-rich partof the EGF domains of the protein. However, the significanceof this linear motif is as yet unclear, as the cysteinemicroenvironment and tertiary structure of the protein haverecently been demonstrated to be more important than thelinear sequence (35, 36). The S-nitrosylation ofRIIbâ3 wasconfirmed using the biotin-switch assay, which definitivelyshowed S-nitrosylation of theâ3 subunit but not theRIIb
subunit, when treated with the NO donor,S-nitroso-N-acetylcysteine (SNOAC).
In addition to the observations from the Raman study andthe finding that purifiedRIIbâ3 is subject to S-nitrosylationas demonstrated by the biotin-switch assay, flow cytometryanalysis revealed that NO can specifically modulate theactivation state ofRIIbâ3 in situ in the platelet. Treatment ofthrombin-activated platelets with NO and GSH causes aspecific reversal of the activation state ofRIIbâ3, withouthaving an effect on general platelet secretion. This findingdemonstrates that integrin activation can be modulated atthe platelet surface, through a direct modification of theextracellular portion ofRIIbâ3, independent of cGMP or otherintracellular mediators.
This Raman analysis ofRIIbâ3 reveals a direct interactionbetween NO and its cysteine residues. Raman spectroscopyis a rapid, real-time technique. Therefore, it has vast potentialfor use in novel assays to monitor changes in response tobiochemical modulators of integrin activity. The findings ofthis study provide critical information regarding the regula-tion of the integrinRIIbâ3 by nitric oxide. We propose thatMn2+ activation of RIIbâ3 operates by releasing highlystrained disulfides, possibly at vicinal cysteine sites, thatreside within the native conformation of the integrin. NOcan mediate disulfide re-formation of strained disulfidesdriven possibly by the greater nucleophilicity of the cysteinespresent in CXXC motifs. This interaction then regulates, inan allosteric manner, the conformation of the integrin.RIIbâ3
is a crucial component in the development of thromboticdisorders, but recent attempts to develop drugs specificallytargeting this protein have proven unsuccessful. The struc-tural findings of this study, combined with the discovery of
the integrin’s direct regulation by NO, will potentially aidthe development of targeted antithrombotic therapies.
REFERENCES
1. Shattil, S. J. (1999) Signalling through platelet integrin alpha IIbbeta 3: inside-out, outside-in, and sideways,Thromb. Haemostasis82, 318-325.
2. O’Neill, S., Robinson, A., Deering, A., Ryan, M., Fitzgerald, D.J., and Moran, N. (2000) The platelet integrin alpha IIb beta 3has an endogenous thiol isomerase activity,J. Biol. Chem. 275,36984-36990.
3. Essex, D. W., and Li, M. (2003) Redox control of plateletaggregation,Biochemistry 42, 129-136.
4. Walsh, G. M., Sheehan, D., Kinsella, A., Moran, N., and O’Neill,S. (2004) Redox modulation of integrin [correction of integin]alpha IIb beta 3 involves a novel allosteric regulation of its thiolisomerase activity,Biochemistry 43, 473-480.
5. Yan, B., and Smith, J. W. (2000) A redox site involved in integrinactivation,J. Biol. Chem. 275, 39964-39972.
6. Litvinov, R. I., Nagaswami, C., Vilaire, G., Shuman, H., Bennett,J. S., and Weisel, J. W. (2004) Functional and structuralcorrelations of individual alphaIIbbeta3 molecules,Blood 104,3979-3985.
7. Smith, J. W., Piotrowicz, R. S., and Mathis, D. (1994) Amechanism for divalent cation regulation of beta 3-integrins,J.Biol. Chem. 269, 960-967.
8. Yan, B., Hu, D. D., Knowles, S. K., and Smith, J. W. (2000)Probing chemical and conformational differences in the restingand active conformers of platelet integrin alpha(IIb)beta(3),J. Biol.Chem. 275, 7249-7260.
9. Xiao, T., Takagi, J., Coller, B. S., Wang, J. H., and Springer, T.A. (2004) Structural basis for allostery in integrins and bindingto fibrinogen-mimetic therapeutics,Nature 432, 59-67.
10. Xiong, J. P., Stehle, T., Zhang, R., Joachimiak, A., Frech, M.,Goodman, S. L., and Arnaout, M. A. (2002) Crystal structure ofthe extracellular segment of integrin alpha V beta 3 in complexwith an Arg-Gly-Asp ligand,Science 296.
11. Xiong, J. P., Stehle, T., Diefenbach, B., Zhang, R., Dunker, R.,Scott, D. L., Joachimiak, A., Goodman, S. L., and Arnaout, M.A. (2001) Crystal structure of the extracellular segment of integrinalpha V beta 3,Science 294, 339-345.
12. Chowdhury, M. H., Gant, V. A., Trache, A., Baldwin, A.,Meininger, G. A., and Cote, G. L. (2006) Use of surface-enhancedRaman spectroscopy for the detection of human integrins,J.Biomed. Opt. 11, 024004.
13. Gaber, B. P., Sheridan, J. P., Bazer, F. W., and Roberts, R. M.(1979) Resonance Raman scattering from uteroferrin, the purpleglycoprotein of the porcine uterus,J. Biol. Chem. 254, 83040-83042.
14. Keyes, T. E., Leane, D., Forster, R. J., Moran, N., and Kenny, D.(2005) New Insights into the molecular mechanisms of thrombosisfrom high resolution surface enhanced Raman microscopy,Proc.Int. Soc. Opt. Eng., Opt. Sensing Spectrosc. 5826, 221.
15. Kopecky, V., Jr., Ettrich, R., Hofbauerova, K., and Baumruk, V.(2003) Structure of human alpha1-acid glycoprotein and its high-affinity binding site,Biochem. Biophys. Res. Commun. 300, 41-46.
16. Tomimatsu, Y., Scherer, J. R., Yeh, Y., and Feeney, R. E. (1976)Raman spectra of a solid antifreeze glycoprotein and its liquidand frozen aqueous solutions,J. Biol. Chem. 251, 2290-2298.
17. Immoos, C. E., Sulc, F., Farmer, P. J., Czarnecki, K., Bocian, D.F., Levina, A., Aitken, J. B., Armstrong, R. S., and Lay, P. A.(2005) Bonding in HNO-myoglobin as characterized by X-rayabsorption and resonance Raman spectroscopies,J. Am. Chem.Soc. 127, 814-815.
18. Li, D., Stuehr, D. J., Yeh, S. R., and Rousseau, D. L. (2004) Hemedistortion modulated by ligand-protein interactions in induciblenitric-oxide synthase,J. Biol. Chem. 279, 26489-26499.
19. Rousseau, D. L., Li, D., Couture, M., and Yeh, S. R. (2005)Ligand-protein interactions in nitric oxide synthase,J. Inorg.Biochem. 99, 306-323.
20. Tomita, T., Ogura, T., Tsuyama, S., Imai, Y., and Kitagawa, T.(1997) Effects of GTP on bound nitric oxide of soluble guanylatecyclase probed by resonance Raman spectroscopy,Biochemistry36, 10155-10160.
Integrin Activation and Raman Spectroscopy Biochemistry, Vol. 46, No. 21, 20076435
21. Pelton, J. T., and McLean, L. R. (2000) Spectroscopic methodsfor analysis of protein secondary structure,Anal. Biochem. 277,167-176.
22. Yan, B., and Smith, J. W. (2001) Mechanism of integrin activationby disulfide bond reduction,Biochemistry 40, 8861-8867.
23. Jaffrey, S. R., and Synder, S. H. (2001) The biotin switch methodfor the detection of S-nitrosylated proteins,Sci. STKE PL1.
24. Jaffrey, S. R., Erdjument-Bromage, H., Ferris, C. D., Tempst, P.,and Snyder, S. H. (2001) Protein S-nitrosylation: a physiologicalsignal for neuronal nitric oxide,Nat. Cell Biol. 3, 193-197.
25. Jia, L., Young, X., and Guo, W. (1999) Physicochemistry,pharmacokinetics, and pharmacodynamics of S-nitrosocaptoprilcrystals, a new nitric oxide donor,J. Pharm. Sci. 88, 981-986.
26. Van Wart, H. E., Lewis, A., Scheraga, H. A., and Saeva, F. D.(1973) Disulfide bond dihedral angles from Raman spectroscopy,Proc. Natl. Acad. Sci. U.S.A. 70, 2619-2623.
27. Torreggiani, A., and Fini, G. (1998) The binding of biotinanalogues by streptavidin: A Raman spectroscopic study,Bio-spectroscopy 4, 197-208.
28. Fleury, F., Ianoul, A., Kryukov, E., Sukhanova, A., Kudelina, I.,Wynne-Jones, A., Bronstein, I. B., Maizieres, M., Berjot, M.,Dodson, G. G., Wilkinson, A. J., Holden, J. A., Feofanov, A. V.,Alix, A. J., Jardillier, J. C., and Nabiev, I. (1998) Raman and CDspectroscopy of recombinant 68-kDa DNA human topoisomeraseI and its complex with suicide DNA-substrate,Biochemistry 37,14630-14642.
29. Arnelle, D. R., and Stamler, J. S. (1995) NO+, NO, and NO-
donation by S-nitrosothiols: implications for regulation of physi-ological functions by S-nitrosylation and acceleration of disulfideformation,Arch. Biochem. Biophys. 318, 279-285.
30. Beglova, N., Blacklow, S. C., Takagi, J., and Springer, T. A. (2002)Cysteine-rich module structure reveals a fulcrum for integrinrearrangement upon activation,Nat. Struct. Biol. 9, 282-287.
31. Takagi, J., Petre, B. M., Walz, T., and Springer, T. A. (2002)Global conformational rearrangements in integrin extracellulardomains in outside-in and inside-out signaling,Cell 110, 599-611.
32. Stamler, J. S., Lamas, S., and Fang, F. C. (2001) Nitrosylation:the prototypic redox-based signaling mechanism,Cell 106, 675-683.
33. Gow, A. J., and Stamler, J. S. (1998) Reactions between nitricoxide and haemoglobin under physiological conditions,Nature391, 169-173.
34. Stamler, J. S., Toone, E. J., Lipton, S. A., and Sucher, N. J. (1997)(S)NO signals: translocation, regulation, and a consensus motif,Neuron 18, 691-696.
35. Ascenzi, P., Colasanti, M., Persichini, T., Muolo, M., Polticelli,F., Venturini, G., Bordo, D., and Bolognesi, M. (2000) Re-evaluation of amino acid sequence and structural consensus rulesfor cysteine-nitric oxide reactivity,J. Biol. Chem. 381, 623-627.
36. Hao, G., Derakhshan, B., Shi, L., Campagne, F., and Gross, S. S.(2006) SNOSID, a proteomic method for identification of cysteineS-nitrosylation sites in complex protein mixtures,Proc. Natl. Acad.Sci. U.S.A. 103, 1012-1017.
BI0620712
6436 Biochemistry, Vol. 46, No. 21, 2007 Walsh et al.


![OPEN ACCESS International Journal of Molecular Sciences...hair growth [2].Platelet-derived growth factor (PDGF) isoforms reportedlyinduce and maintain theanagen phase of the murine](https://static.fdocument.org/doc/165x107/60f85444d7faee31306fdb0e/open-access-international-journal-of-molecular-sciences-hair-growth-2platelet-derived.jpg)