
Rechargeable Zinc Batteries Supporting Information for … · - 1 - Supporting Information for...
9
- 1 - Supporting Information for Elucidating the Intercalation Mechanism of Zinc Ions into α-MnO 2 for Rechargeable Zinc Batteries Boeun Lee, Hae Ri Lee, Haesik Kim, Kyung Yoon Chung, Byung Won Cho, Si Hyoung Oh * Center for Energy Convergence Research, Korea Institute of Science and Technology, Hwarang-ro 14-gil 5, Seongbuk-gu, Seoul, 136-791, Korea This PDF file includes: Methods, Figures S1-S4 and References * to whom correspondence should be addressed: [email protected] Electronic Supplementary Material (ESI) for ChemComm. This journal is © The Royal Society of Chemistry 2015
Transcript of Rechargeable Zinc Batteries Supporting Information for … · - 1 - Supporting Information for...
- 1 -
Supporting Information forElucidating the Intercalation Mechanism of Zinc Ions into α-MnO2 for
Rechargeable Zinc Batteries
Boeun Lee, Hae Ri Lee, Haesik Kim, Kyung Yoon Chung, Byung Won Cho, Si Hyoung Oh*
Center for Energy Convergence Research, Korea Institute of Science and Technology, Hwarang-ro 14-gil 5, Seongbuk-gu, Seoul, 136-791, Korea
This PDF file includes:
Methods, Figures S1-S4 and References
* to whom correspondence should be addressed: [email protected]
Electronic Supplementary Material (ESI) for ChemComm.This journal is © The Royal Society of Chemistry 2015
- 2 -
Methods
Synthesis of α-MnO2 nano-rod. The α-MnO2 nano-rod was synthesized by a known literature
method1. Briefly, KMnO4 (0.1264 g) and NH4Cl (0.0428 g) were homogeneously mixed with
distilled water (40 mL) until they are completely dissolved. The solution was then poured into a
Teflon-lined reactor and was subjected to hydrothermal condition at 140 °C for 24 h. Then, the
resulting powder was filtered and washed with plenty of distilled water. Finally, the filtered
powder was dried in a vacuum oven at 80 °C overnight.
Rechargeable Zn battery test. The cathode was prepared by uniformly mixing synthetic α-MnO2
powder (70 mg) and carbon black (10 mg) with a spatula, where polyvinylidene fluoride (PVdF)
binder (20 mg) was then added to make homogeneous mixture. Then, the whole mixture was ball-
milled in N-methyl-2-pyrrolidone (NMP). The α-MnO2 slurry was cast onto stainless steel foil (25
μm thickness) at a loading of approximately 5.0 mg cm-2. The electrochemical performance was
evaluated using type-2032 coin cells composed of the as-prepared cathode, a zinc foil anode (10
μm thickness), a glass wool separator, and a 1.0 M aqueous zinc sulfate (ZnSO4) electrolyte. The
cells were tested with a MACCOR cycler between 0.7 – 2.0 V at a C/20 rate for the initial 2 cycles,
then at a C/5 rate for the remaining cycles (1 C = 210 mA g-1 of α-MnO2).
GITT measurements and the calculation of the diffusion coefficients. For GITT measurement,
rectangular current pulses were applied to the cell containing α-MnO2 cathode repeatedly until it
completes the first discharge-charge process. The current pulse lasted for 40 min at a rate of 0.1 C
and then the cell was subject to relaxation for 1 h to allow the voltage profile to reach the
equilibrium. The chemical diffusion coefficient of Zn2+ ions passing through the α-MnO2 electrode
can be calculated based on the equation (1) from the literatures.2,3
- 3 -
(1)𝐷𝑍𝑛2 +
=4𝜋(𝑚𝑉𝑀𝑀𝑆 )2( 𝑑𝐸𝑠 𝑑𝛿𝑑𝐸𝜏 𝑑 𝜏)2 ≈ 4
𝜋𝜏(𝑚𝑉𝑀𝑀𝑆 )2(∆𝐸𝑠∆𝐸𝜏)2
,where m and M are the mass (g) and the molecular weight (g/mol) of the active material,
respectively. VM is the molar volume (cm3/mol) of α-MnO2, obtainable from the crystallographic
information. S is the effective surface area (cm2) between the active material and the electrolyte
and can be considered to be Brunauer-Emmett-Teller surface area (SBET). SBET for α-MnO2 nano-
rod is 22 m2/g. dEs/dδ is the slope of the coulometric titration curve which can be obtained by
plotting the equilibrium electrode voltage measured after each titration step δ. dEτ/d denotes the 𝜏
slope of the linearized region of the potential Eτ during the current pulse of duration time τ (sec).
This equation is valid when τ≪L2/ , where L (cm) is the thickness of the electrode and can 𝐷𝑍𝑛2 +
be simplified as the right hand of the equation if dEτ/d shows a linear behavior. 𝜏
Characterization. The crystallographic structures were measured by powder X-ray diffraction
(XRD) using Cu-Kα radiation (λ=1.5405 Å, Rigaku D/MAX-2500/PC). The morphology of the α-
MnO2 electrodes was observed by high resolution transmission electron microscopy (HR-TEM,
FEI Tecnai G2 operating at 200 KeV) and field-emission scanning electron microscopy (FE-SEM,
Hitachi S-4000).
In-situ XRD measurements. The in-situ XRD patterns were collected using an X-ray diffracto
metry system (Rigaku MicroMAX 007HF with R-AXIS IV++ image plate) with using Mo-Kα radi
- 4 -
ation (λ=0.7107 Å). The electrochemical cell specially designed for in-situ XRD analysis was insta
lled on the diffractometer and was connected to the potentiostat (WBCS3000, WonA tech). The c
ell was galvanostatically cycled at a scan rate of C/20 while XRD patterns were measured successi
vely every eight minute. To compare the results with those reported in the literature, the 2θ value
s were converted to the ones that correspond to Cu-Kα radiation (λ=1.5405 Å).
- 5 -
(001
)
(002
)
(003
)
20 402 / degree
Inte
nsity
/ a.
u.
Time
361
141
21
281
II
III
IV
I
a b
0.8 1 1.2 1.4 1.6 1.8
Potential / V
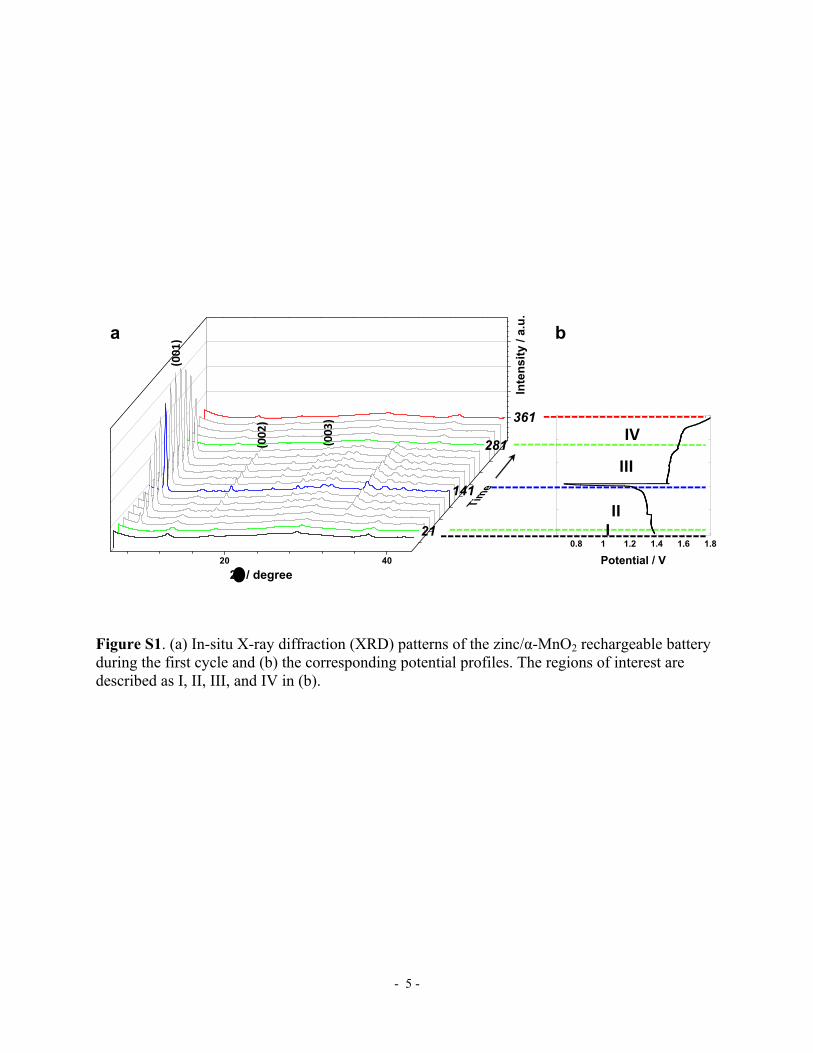
Figure S1. (a) In-situ X-ray diffraction (XRD) patterns of the zinc/α-MnO2 rechargeable battery during the first cycle and (b) the corresponding potential profiles. The regions of interest are described as I, II, III, and IV in (b).
- 6 -
cryptomelane7 Å
7 Å10 Å
discharge charge
drying
buserite
birnessite
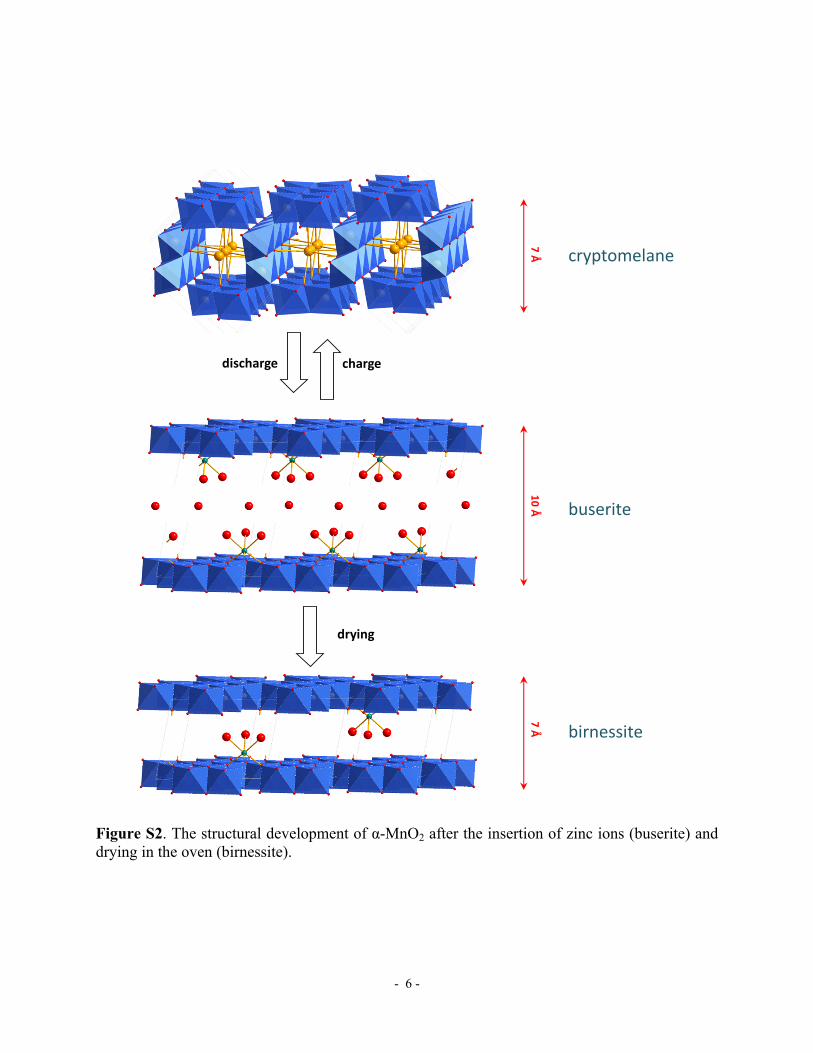
Figure S2. The structural development of α-MnO2 after the insertion of zinc ions (buserite) and drying in the oven (birnessite).
- 7 -
a b
c d
e f
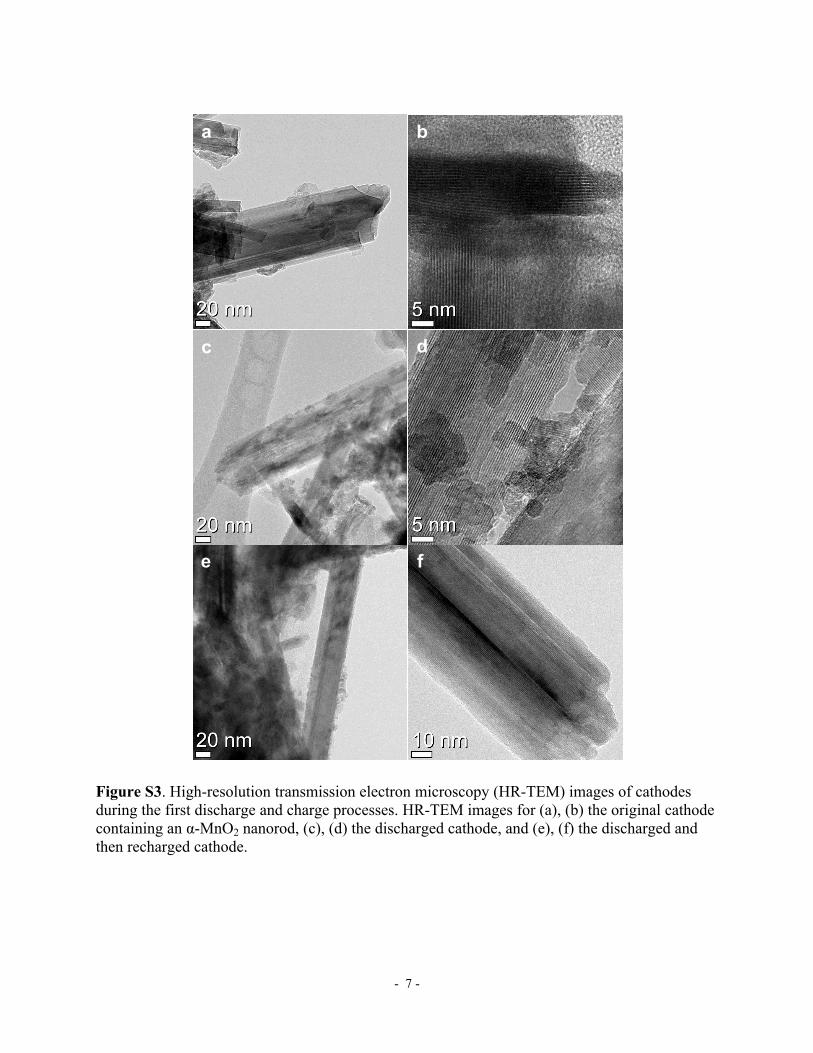
Figure S3. High-resolution transmission electron microscopy (HR-TEM) images of cathodes during the first discharge and charge processes. HR-TEM images for (a), (b) the original cathode containing an α-MnO2 nanorod, (c), (d) the discharged cathode, and (e), (f) the discharged and then recharged cathode.
- 8 -
Element Atomic %
O 68.043
Mn 27.579
Zn 0.934
K 3.442
Element Atomic %
O 65.455
Mn 23.083
Zn 8.920
K 2.540
Element Atomic %
O 70.615
Mn 6.048
Zn 23.336
K 0.000
c
a
d
b
BC
D
B
C
D
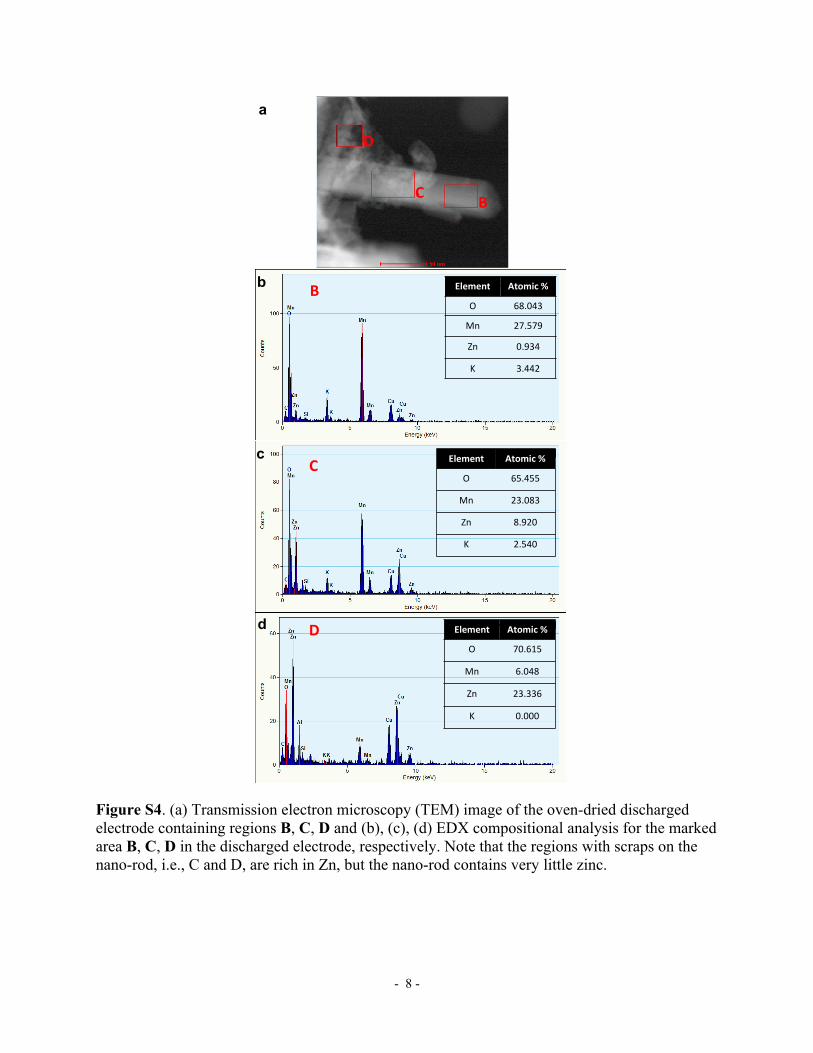
Figure S4. (a) Transmission electron microscopy (TEM) image of the oven-dried discharged electrode containing regions B, C, D and (b), (c), (d) EDX compositional analysis for the marked area B, C, D in the discharged electrode, respectively. Note that the regions with scraps on the nano-rod, i.e., C and D, are rich in Zn, but the nano-rod contains very little zinc.
- 9 -
Reference
1. Gao, Y.; Wang, Z.; Wan, J., Zou, G.; Qian, Y. J. Cryst. Growth 2005, 279, 415.
2. Li, Z.; Du, F.; Bie, X.; Zhang, D.; Cai, Y.; Cui, X.; Wang, C.; Chen, G.; Wei, Y. J. Phys. Chem.
C. 2010, 114, 22751.
3. Zhu, Y.; Wang, C. J. Phys. Chem. C. 2010, 114, 2830.