Raman Spectroscopy Study of α-, β-, γ-Na CoO2 and γ … 1. Introduction Layered NaxCoO2...
23
1 Raman Spectroscopy Study of α-, β-, γ-Na x CoO 2 and γ-(Ca,Sr) x CoO 2 H.X. Yang, Y. Xia, Y.G. Shi, H.F. Tian, R.J. Xiao, X. Liu, Y.L. Liu and J.Q. Li* Beijing National Laboratory for Condensed Matter Physics, Institute of Physics, Chinese Academy of Sciences, Beijing 100080, China Raman spectroscopy measurements have been performed on α-, β-, and γ-Na x CoO 2 phases differing in their stacking of CoO 6 octahedra along the c-axis direction. The results demonstrate that, in general, there are five Raman active phonons for γ-Na 0.75 CoO 2 , two Raman active phonons for α-NaCoO 2, and three Raman peaks for β-Na 0.6 CoO 2 . We have also performed Raman scattering measurements on several γ-(Ca,Sr) x CoO 2 (0.15 ≤ x ≤ 0.40) samples which show well-defined intercalated Ca/Sr-ordering. The experimental data show that the intercalated cation ordering could result in visible alterations on Raman spectral structures. The observations of the spectral changes along with the variation of the CoO 6 stacking, as well as the intercalated Sr/Ca ordering suggest that the interlayer interaction plays an important role for understanding the phonon properties in this layered system. PACS numbers: 61.66. Fn, 78.30.–j, 68.65.Cd Keywords: Na x CoO 2 ; Cobalt oxides; Raman spectroscopy; Cation ordering Author to whom correspondence should be addressed: [email protected]
Transcript of Raman Spectroscopy Study of α-, β-, γ-Na CoO2 and γ … 1. Introduction Layered NaxCoO2...

1
Raman Spectroscopy Study of α-, β-, γ-NaxCoO2 and γ-(Ca,Sr)xCoO2
H.X. Yang, Y. Xia, Y.G. Shi, H.F. Tian, R.J. Xiao, X. Liu, Y.L. Liu and J.Q. Li*
Beijing National Laboratory for Condensed Matter Physics, Institute of Physics, Chinese
Academy of Sciences, Beijing 100080, China
Raman spectroscopy measurements have been performed on α-, β-, and γ-NaxCoO2
phases differing in their stacking of CoO6 octahedra along the c-axis direction. The results
demonstrate that, in general, there are five Raman active phonons for γ-Na0.75CoO2, two
Raman active phonons for α-NaCoO2, and three Raman peaks for β-Na0.6CoO2. We have
also performed Raman scattering measurements on several γ-(Ca,Sr)xCoO2 (0.15 ≤ x ≤ 0.40)
samples which show well-defined intercalated Ca/Sr-ordering. The experimental data show
that the intercalated cation ordering could result in visible alterations on Raman spectral
structures. The observations of the spectral changes along with the variation of the CoO6
stacking, as well as the intercalated Sr/Ca ordering suggest that the interlayer interaction
plays an important role for understanding the phonon properties in this layered system.
PACS numbers: 61.66. Fn, 78.30.–j, 68.65.Cd
Keywords: NaxCoO2; Cobalt oxides; Raman spectroscopy; Cation ordering
Author to whom correspondence should be addressed: [email protected]

2
1. Introduction
Layered NaxCoO2 materials have been extensively investigated in recent years due to a
notably large thermoelectric power coexisting with superconductivity and complex
charge-ordering (CO) transitions [1-3]. In order to understand the lattice dynamics in this
layered system, Raman scattering [4-9], infrared absorption [10], and neutron scattering
experiments [11] have been carried out in numerous laboratories and under different
experimental conditions. Theoretical analysis based on lattice shell model and first
principle calculations have also been performed for typical NaxCoO2 materials with x = 1.0,
0.74, 0.5 and 0.3 [5, 12], however, much controversy still remains in related published
results [4-13]. J.F. Qu et al. observed three phonon modes in the experimental spectrum of
Na0.7CoO2 [13], in sharp contrast with our previous reported data which clearly
demonstrated five Raman-activated modes for γ- Na0.75CoO2 [4]. Moreover, remarkable
spectral differences also exist in the charge ordered Na0.5CoO2 material as reported in refs.
5, 6, 9 and 13. In our recent study, it is noted that the layered NaxCoO2 materials actually
have a rich variety of structural features that could have visible effects on physical
properties, such as, structural modulation from Na-ordering, and sample (surface)
instability in the air or water [4, 6, 14]. There are three distinctive structural series of
NaxCoO2 materials that differ in their stacking of CoO6 octahedra along the c-axis direction,
the so called α-, β-, and γ- phases respectively. The distance between two CoO2 layers are
almost the same for all three phases, each phase having its specific structural properties
depend on Na concentration [15-21]. It is also noted that structural alternations in NaxCoO2

3
can also be caused by the post-chemical treatments as commonly adopted for preparing the
NaxCoO2 sample with lower Na concentrations. For instance, our recent experimental
results revealed that α-NaxCoO2 materials undergo a clear phase transition from the
hexagonal to the β-phase-like monoclinic structure along with the Na deintercalation [14].
Actually, the structural stability along with the decrease of Na concentration has not been
very well understood for this layered system, especially, for α- and β- NaxCoO2. Therefore,
special precautions have to be taken for the samples used in experimental measurements.
Cation ordering, commonly existing in layered NaxCoO2 materials, is another notable issue
concerned in structural measurements and analysis of physical properties. For instance,
certain experimental and theoretical investigations have paid special attention to
intercalated Na ordering among CoO2 sheets [6, 22], where the 31/2×31/2 superstructure was
expected to have marked effects on the magnetic ordering in the layered system [23].
Recently, we have synthesized a series of γ-CaxCoO2 (0.15 ≤ x ≤ 0.4) and γ-SrxCoO2 (0.15
≤ x ≤ 0.4) by means of an ion exchange reaction. Structural analysis indicates that the
average structures of these materials are isomorphic with the γ-NaxCoO2 phase. The
well-defined cation ordering has been characterized by TEM observations [24, 25].
Moreover, MxCoO2 (M = Sr, Ca) compounds are found to be much more stable in the air
than their analogous NaxCoO2 materials, thus (Sr,Ca)xCoO2 are more suitable for Raman
observations [24, 25]. In the present paper, we will report on the Raman scattering
measurements on the parent phases of α-, β-, γ-NaxCoO2 and on typical samples of
γ-(Sr,Ca)xCoO2 (0.15 ≤ x ≤ 0.40). Certain spectral features have been also discussed in
comparison with the theoretical analysis based on the group factor theory [26].

4
2. Experimental
Polycrystalline samples of α-NaCoO2, β-Na0.6CoO2, γ-Na0.75CoO2 and (Sr,Ca)xCoO2
(0.15 ≤ x ≤ 0.40) materials were used in our Raman scattering study. The γ-Na0.75CoO2
phase was synthesized following the procedure as described in Ref [17], while α-NaCoO2
and β-Na0.6CoO2 were prepared by conventional solid-state reactions at relatively lower
temperatures of 500oC to 550oC [14]. In the synthesis of α-NaCoO2 materials, powdered
cobalt (Co) metal (99.5%) and 10% excess anhydrous NaOH pellets (Aldrich) (Na:Co =
1.1:1) were ground together under inert atmosphere and placed in an alumina boat under
flowing O2 for approximately 6 days at 500°C with one intermediate grinding. For the
synthesis of β-Na0.6CoO2 material, the Co powder and NaOH pellets were mixed in a molar
ratio of Na:Co = 0.7:1, ground together under flowing N2, and then reacted under flowing
O2 at 550°C for approximately 5 days with one intermediate grinding. Polycrystalline
materials with nominal compositions of SrxCoO2 and CaxCoO2 (0.15 ≤ x ≤ 0.40) were
prepared by a low-temperature ion exchange reaction using a γ-NaxCoO2 (0.33 ≤ x ≤ 0.8)
precursor prepared by conventional solid-state reaction or by sodium deintercalation of
Na0.75CoO2 [27]. The ion exchange process was carried out using the modified
Cushing-Wiley method [28]. X-ray diffraction (XRD) measurements were carried out with
a diffractometer in the Bragg-Brentano geometry using Cu K-α radiation. The
compositions of all materials have been measured by an inductively coupled plasma (ICP)
analysis technique. XRD results show that Sr/Ca intercalated samples made by
Cushing-Wiley method have very similar structure with their γ-NaxCoO2 precursors, in

5
good agreement with previous publications [24, 25, 28].
Specimens for transmission-electron microscopy (TEM) observations were polished
mechanically with a Gatan polisher to a thickness of around 50µm and then ion-milled by a
Gatan-691 PIPS ion miller. The TEM measurements were performed on the Tecnai F20
(200 kV). Raman spectra were collected using a back-scattering geometry at room
temperature with a Jobin-Yvon T64000 triple spectrometer equipped with a cooled
charge-couple device. In the spectrometer, an objective of 100X-magnification was used to
focus the laser beam on the sample surface and collect the scattered light. The excitation
wavelength of 514.5 nm of an Ar+ ion laser was used in our experiments. The laser power
at the focus spot of 2-3 µm in diameter was kept below 1 mW to prevent laser-induced
damage to the samples. For storage, the samples were rapidly put in a vacuum to avoid
surface contamination and water adsorption. For facilitating the comparison, The Raman
spectra presented in figure 2 and 4 have been stacked by some arb. units with respect to
each other without being multiplied by any scale factor.
3. Results and discussion
Figure 1(a) shows the XRD patterns for the α-NaCoO2, β-Na0.6CoO2 and
γ-Na0.75CoO2 phases. These phases differ crystallographically in the stacking patterns of
CoO6 octahedra along the c-axis direction [15-21]. In the α-NaxCoO2 system, the parent
phase with a nominal composition of α-NaCoO2 has a hexagonal cell with lattice
parameters of a = 2.89 Å, c = 15.59 Å (R3_
m space group) [20]; the parent sample
β-Na0.6CoO2 has a monoclinic structure with a C2/m space group and lattice parameters a =

6
4.90 Å, b =2.83 Å, c = 5.71 Å, β = 106.180° [21]; The parent material of γ-Na0.75CoO2 has
a hexagonal cell with lattice parameters a = 2.84 Å and c = 10.80Å (P63/mmc space group)
[11]. In recent studies, the γ-NaxCoO2 (0.15 < x < 0.75) materials were found to show a rich
variety of significant physical properties [1-3], such as, a notably large thermoelectric
power, superconductivity under water intercalation, and CO transitions for x~0.5.
Figure 1(b) shows the layered structural features of α-NaCoO2, β-Na0.6CoO2 and
γ-NaxCoO2. The α-NaCoO2 contains three CoO2 layers in one unit cell in which Na
occupies the unique 3a (0,0,0) site, Co occupies the 3b (0,0,1/2) site, and O occupies the 6c
(0,0,z) site [20]. The β-NaxCoO2 has a C2/m symmetry, its unit cell contains only one CoO2
layer, Na occupies the 2a (0,0,0) site, Co occupies the 4i (x,0,z ) site, and O occupies the 8j
(x,y,z) site [21]. The γ-Na0.75CoO2 material contains two CoO2 layers in one unit cell in
which Co occupies the 2a (0,0,0) and O occupies the 4f (1/3,2/3,z) site, while the Na atoms
in this structure could occupy two distinct sites within a given plane denoted with Wyckoff
indices of 2b(Na1) and 2d(Na2) [11]. The occupation ratio on either Na1 or Na2 site depends
on the Na content.
Based on this structural information, we have made a brief theoretical factor-group
analysis for the Raman active modes in the α-, β- and γ-NaxCoO2 phases, based on the
method as reported in Ref [26]. It is demonstrated that there are two Raman active phonon
modes A1g+Eg for the α-NaCoO2 phase, both connected with O motions; there are nine
Raman active phonon modes: 5Ag+4Bg for β-Na0.6CoO2, Ag and Bg modes may connect
with both Na and O motions. The γ-NaxCoO2 phase has five Raman active phonon modes:
A1g + E1g + 3E2g, the A1g and E1g modes involve motions of the oxygen atoms only, E2g

7
modes may connect with both Na and O motions while Co motions are not Raman active as
discussed previously [4].
Fig. 2 shows the experimental Raman spectra for three typical phases. According to the
conductivity measurements for these phases, the α-NaCoO2 phase is a semiconductor at
room temperature while β-Na0.6CoO2 and γ-NaxCoO2 phases are metallic [29]. An increase
in conductivity reduces the optical skin depth of the incident laser beam, and results in a
decrease of the signal/noise ratio. Hence, under the same experimental conditions the
α-NaCoO2 has a relatively higher signal/noise ratio. The experimental spectrum of
α-NaCoO2 contains two clear peaks found at 486.5 and 586.4cm−1, respectively. We
interpret theses peaks as the Eg (486.5cm−1) and A1g (586.4cm−1) active modes in
accordance with theoretical analysis. The A1g and Eg modes involve atomic motions from
oxygen atoms only: the Eg represents the in-plane vibration, and the A1g represents the
out-of-plane movement. The energy of the A1g mode strongly depends on the occupancy of
the Na layer which divides the CoO6 octahedral in the c-axis direction. It is worth
mentioning that our experimental spectra for the α-NaxCoO2 phase shows noticeable
similarities with results reported in Ref [5] and [9] obtained from NaxCoO2 single crystals.
Hence, it is possible that the above referenced crystals (or crystal surfaces) crystallize in an
α-phase structure rather than a γ-phase structure. Experimental spectra of β-Na0.6CoO2 in
general contain three strong peaks at around 461, 577, and 691 cm-1 respectively (see Fig.
2). On the other hand, our theoretical factor-group analysis suggests that nine active modes
(5Ag+4Bg) are possibly visible; this discrepancy could be caused by the overlap of Raman
peaks. There are five Raman active modes that can be identified: A1g at 673.3cm-1, E1g at

8
188.5cm-1, and E2g at 470.4cm-1, 510.7cm-1, 605.8 cm-1 and 673.3 cm-1 for γ-Na0.75CoO2,
which agree well with our former detailed analysis on single crystals [4].
It is noted that the intercalations of Na, Sr, and Ca atoms or H2O molecules could make
the local structure of this layered system much more complex. The intercalated atoms can
be random with high mobility or crystallized in a variety of ordered states [6, 22]. Certain
ordered states were demonstrated to have notable effects on physical properties. For
instance, Na atoms in Na0.5CoO2 crystallize in an orderly, well-defined zigzag pattern
yielding an orthorhombic structure in which low temperature charge ordering is observed
[6]. The Raman spectroscopy is sensitive to the ordered structures, and can be used
effectively to characterize the degree and type of cation order in perovskite oxides [29].
Recently, experimental and theoretical investigations have paid special attention to
intercalated cation/vacancy ordering in the layered cobalt oxides [6, 22]. First principle
calculations demonstrated that a variety of possible ordered states can be stable at different
levels of intercalated cation content, such as 31/2a×31/2a superstructure at x = 1/3 (or 2/3)
and other ordered states at x = 1/2, 1/4, 1/5, etc. [22]. Previously, several superstructures in
LixCoO2 and NaxCoO2 materials have been demonstrated to have cation ordering [6, 30].
However, it is also noted that the electron beam radiation during TEM observation could
severely alter the cation arrangements among the CO2 sheets due to the high mobility of
either Na or Li ions in this layered structure [6, 30].
Figs. 3(a) and (b) show respectively the electron-diffraction patterns and
high-resolution TEM images for the Sr0.35CoO2. The most notable structural phenomenon
revealed in the electron diffraction pattern of Fig. 3(a) is the appearance of systematic weak

9
reflection spots in addition to the main diffraction spots indexed perfectly on the known
hexagonal structure. The superstructure spots in the present case can be well characterized
by an in-plane wave vector q = (1/3, 1/3, 0) which yields a 31/2a×31/2a super-cell within the
basic a-b plane. The superlattice spots on the a*-b* plane in general are very sharp,
indicating a relatively long coherent length (>30nm) of the ordered state. Fig. 3(b) shows a
[001] zone-axis HRTEM image for Sr0.35CoO2, illustrating the atomic structure for this
superstructure. The image was obtained from a thin region of the crystal near the Scherzer
defocus value (≈-60nm). The metal atom (Co) positions are therefore recognizable as dark
dots. In this image, the hexagonal superstructure is clearly seen in the relative thick area as
illustrated by a hexagonal supercell.
Raman scattering measurements on γ-SrxCoO2 (0.15 ≤ x ≤ 0.40) materials have revealed
notable changes of the Raman spectrum along with the appearance of cation ordered states.
Fig. 4(a) shows a series of Raman spectra taken from the γ-SrxCoO2 materials with x = 0.15,
0.25, 0.35 and 0.40. These spectra have markedly different signal/noise ratio caused by the
variation of the conductivity that depend directly on the Sr concentration. Measurements of
resistivity showed that SrxCoO2 in general are insulators for samples with low strontium
content (x < 0.2) and transforms to metals for x > 0.35 [31]. It is noted that the Raman
active modes for x = 0.15 and 0.25 show five clear active modes (with limited shifts)
notably similar with the data from γ-Na0.75CoO2 as shown in Fig.2. Actually, the
intercalated Sr atoms in γ-SrxCoO2 samples with x < 0.25 are rather random as observed for
Na atoms in γ-Na0.75CoO2. Certain notable spectral features were observed in the data
obtained from Sr0.35CoO2 which contains a well defined 31/2a×31/2a superstructure, in

10
addition to the remarkable shifts of the five typical peaks for the γ-Sr0.15CoO2 phase. For
instance, the notable new mode at ~148 cm-1 are possibly in correlation with Brillouine
zone folding in superstructure phase. On the other hand, it is noted that the alterations of
phonon width and lineshape are also visible for certain Raman active modes, these changes
could be partially caused by the modifications of electronic structure; the defects and
locally distortion could also result in the broadening of the Raman modes in this system.
In order to further understand the effects of intercalated cation ordering in the Raman
spectra of this layered system, we have also performed measurements on the γ-CaxCoO2
materials. This system, being similar to SrxCoO2 and NaxCoO2, contains a rich variety of
structural phenomena, such as Ca ordering and phase separation [25]. Fig. 4(b) displays the
Raman spectra from the γ-CaxCoO2 (0.15 ≤ x ≤ 0.40) materials, illustrating clear
alternations of the relative intensities and frequencies of the Raman peaks with the increase
of Ca content. These facts, in combination with results from SrxCoO2 and NaxCoO2,
suggest that the lattice dynamics are somewhat sensitive to the variation of the cation
ordering in the present system. The γ-Ca0.15CoO2 material has five active modes identified
respectively as A1g at 691.1cm-1, E1g at 196.6cm-1, and E2g at 483.3cm-1, 525.1cm-1, and
621.8 cm-1 that are comparable with the active modes of γ-Sr0.15CoO2 as discussed above.
Moreover, it is remarkable that all the Raman active modes show significant shifts towards
higher frequencies in comparison with those in the γ-Na0.75CoO2 sample, especially A1g and
E1g peaks which are essentially connected with the O vibrations. This could be due to the
larger electrostatic interaction between divalent ions and the negative CoO2 layer in
γ-(Ca,Sr)xCoO2 compounds.

11
Systematic structural analysis on γ-CaxCoO2 suggests that there are two well-defined
cation ordered states corresponding respectively to the orthorhombic superstructure at
around x = 1/2 and the 31/2a×31/2a superstructure at around x = 1/3 in this kind of system.
Multiple ordered states, phase separation, and incommensurate structural modulations
commonly appear in materials with 0.3 < x < 0.5 [24]. Although γ-Ca0.3CoO2 in general
contains clear 31/2×31/2 superstructure as revealed in our TEM observations [24], its Raman
spectrum, in contrast to Sr0.35CoO2, does not shows the additional new mood at around
148-1. This difference maybe caused by coexistence of complex multiple superstructures in
γ-Ca0.3CoO2. Actually, the 31/2×31/2 superstructure in γ-Ca0.3CoO2 is less well-defined in
comparison with Sr0.35CoO2; our high resolution TEM observations demonstrated that
incommensurate modulations and phase separation often appears in the γ-Ca0.3CoO2
samples [24]. Hence, the low frequency mode proposed in connection with Brillouine
zone folding is more difficult to be detected in Raman scattering. On the other hand, some
alternations that might relate to the 31/2×31/2 superstructure still can be recognized in the
Raman spectrum of γ-Ca0.3CoO2 (as shown in Fig.4b). Further analysis of the γ-Ca0.3CoO2
spectrum shows that the A1g mode at 691cm-1 shifts slightly to a higher frequency and the
E2g mode at 483 cm-1 shifts to a lower frequency in comparison with those for the x = 0.15
sample. Moreover, the two modes that appear at 560 and 595 cm-1 are possibly the
remaining E2g modes under significant shift, or new modes arising from local structural
ordered states in the superstructure phase. The spectra of Ca0.35CoO2 and Ca0.4CoO2 shows
certain combined features of Ca0.15CoO2 and Ca0.30CoO2, indicating the presence of local
structural inhomogeneities in the samples studied, which agrees well with the structural

12
analysis [24].
As mentioned in the introduction part, that the Raman scattering measurements on
NaxCoO2 materials (polycrystalline samples or single crystals) performed in several
laboratories show apparently different spectral features [4 - 9]. Here we make a brief
discussion on the samples used for experimental investigations. In our previous publication,
we identified that five active phonons generally appear in the Raman spectra of γ-NaxCoO2
by using γ-Na0.7CoO2 single crystals grown by the flux method [4]. On the other hand, in
the paper of P. Lemmens et al, Raman spectroscopy has been measured on NaxCoO2 single
crystals, with x = 0.5, 0.83, and 1.0 [9]; all spectra show two strong phonon modes at
around 580 cm−1 and 480 cm−1. The NaCoO2 (x = 1.0, 0.83) samples used by P. Lemmens
are made via floating zone method, and other samples were made by Na-deintercalation
using post-chemical treatments. The spectra of x = 1.0 sample is very similar with our data
obtained from the α-NaCoO2 phase in this paper. It is well known [17] that NaxCoO2
samples with x > 0.80 generally dominate by the α-phase rather than γ-phase.
Na-deintercalation can also result in certain phase transitions that are still not well
understood [14]. These facts suggest that the notable differences among the spectra from
different groups possibly caused by the structural discrepancy of the samples made by
different methods.
The structural transitions appear during post-chemical treatments of NaxCoO2 samples
are another kind of significant issues for understanding their physical properties, e.g.
Na-deintercalation and H2O intercalation could result in clear lattice instability and
complex defects, especially in single crystals. We have carefully checked the
13
microstructure of the single crystalline samples of Na0.5CoO2 and Na0.3CoO2 prepared by
Na-deintercalation and it was observed that stacking faults and intergrowth (coexistence) of
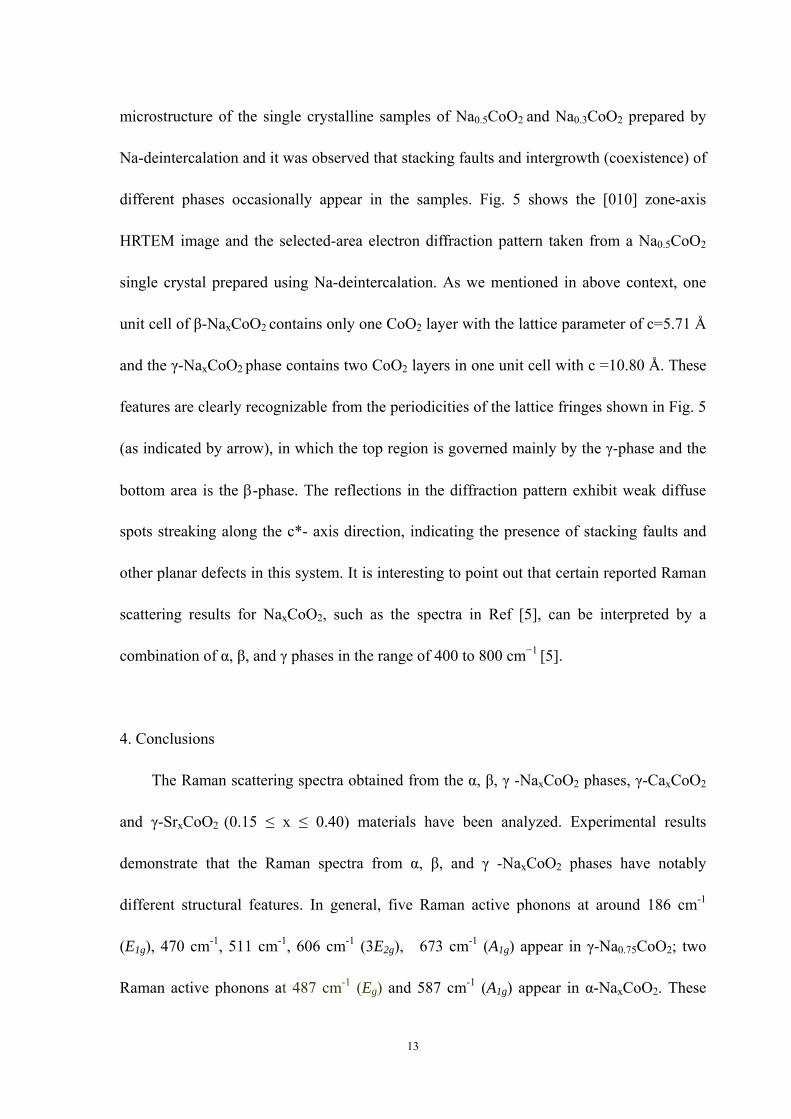
different phases occasionally appear in the samples. Fig. 5 shows the [010] zone-axis
HRTEM image and the selected-area electron diffraction pattern taken from a Na0.5CoO2
single crystal prepared using Na-deintercalation. As we mentioned in above context, one
unit cell of β-NaxCoO2 contains only one CoO2 layer with the lattice parameter of c=5.71 Å
and the γ-NaxCoO2 phase contains two CoO2 layers in one unit cell with c =10.80 Å. These
features are clearly recognizable from the periodicities of the lattice fringes shown in Fig. 5
(as indicated by arrow), in which the top region is governed mainly by the γ-phase and the
bottom area is the β-phase. The reflections in the diffraction pattern exhibit weak diffuse
spots streaking along the c*- axis direction, indicating the presence of stacking faults and
other planar defects in this system. It is interesting to point out that certain reported Raman
scattering results for NaxCoO2, such as the spectra in Ref [5], can be interpreted by a
combination of α, β, and γ phases in the range of 400 to 800 cm−1 [5].
4. Conclusions
The Raman scattering spectra obtained from the α, β, γ -NaxCoO2 phases, γ-CaxCoO2
and γ-SrxCoO2 (0.15 ≤ x ≤ 0.40) materials have been analyzed. Experimental results
demonstrate that the Raman spectra from α, β, and γ -NaxCoO2 phases have notably
different structural features. In general, five Raman active phonons at around 186 cm-1
(E1g), 470 cm-1, 511 cm-1, 606 cm-1 (3E2g), 673 cm-1 (A1g) appear in γ-Na0.75CoO2; two
Raman active phonons at 487 cm-1 (Eg) and 587 cm-1 (A1g) appear in α-NaxCoO2. These

14
results are fundamentally in agreement with the theoretical analysis based on the group
factor theory. The Raman spectra of γ-(Sr,Ca)xCoO2 with x = 0.15 and 0.25 show five clear
active modes similar with the data from γ-Na0.75CoO2, and visible shifts towards higher
frequencies appear at A1g and E1g peaks which are essentially connected with the O
vibrations. Moreover, the Raman active phonons in γ-(Sr,Ca)xCoO2 materials are found to
change apparently with the intercalated cation ordering. These observations suggest that
local structural transition in connection with the CoO6 stacking, as well as Sr/Ca
intercalation, can result in significant changes in certain phonon modes. Hence, we
conclude that the interlayer interaction and local structural features play important roles for
understanding the lattice dynamics and physical properties in this layered system. TEM
study on samples made by post-chemical treatments, such as Na0.5CoO2, could contain
different structural phases and complex defects. Therefore, it is worthy to point out that due
to the complex structures and various kinds of cation orders in these kinds of materials,
special precautions have to be taken for processing and interpreting the experimental data.
Acknowledgments
We would like to thank Professor N.L. Wang for providing single crystals of NaxCoO2
and Miss G. Zhu for assistance in preparing samples and measuring Raman spectra. We are
grateful to Q.M. Zhang and N. Pemberton-Pigott for fruitful discussions and help during
manuscript preparation. The work reported here is supported by the ‘Outstanding Youth
Fund’ supported by the National Natural Foundation of China and by the Ministry of
Science and Technology of China (973 project No: 2006CB601001).

15
References:
1. I. Terasaki, Y. Sasago, K. Uchinokura, Phys. Rev. B, 56, R12685 (1997).
2. K. Takada, H. Sakurai, E. Takayama-Muromachi, F. Izumi, R.A. Dilanian and T.
Sasaki, Nature, 422, 53 (2003).
3. M.L. Foo, Y.Y. Wang, S. Watauchi, H.W. Zandbergen, T. He, R.J. Cava, and N.P. Ong,
Phys. Rev. Lett. 92, 247001 (2004).
4. Y.G. Shi, Y.L. Liu, H.X. Yang, C.J. Nie, R. Jin, J.Q. Li, Phys. Rev. B, 70, 052502
(2004).
5. P. Lemmens, V. Gnezdilov, N.N. Kovaleva, et al., J. Phy. : -Cond. Matt., 16,
S857-S865 (2004).
6. H.X. Yang, C.J. Nie, Y.G. Shi, H.C. Yu, S. Ding, Y.L. Liu, D. Wu, N.L. Wang, J.Q. Li,
Solid State Commun.134, 403 (2005).
7. X.N. Zhang, P. Lemmens, , V. Gnezdilov, K.Y. Choi, B. Keimer, D.P. Chen, C.T. Lin,
F.C. Chou, Physica B 359-361, 424 (2005).
8. M.N. Iliev, A.P. Litvinchuk, R.L. Meng, Y.Y. Sun, J. Cmaidalka, C.W. Chu. Physica
C, 402, 239 (2004).
9. P. Lemmens, K.Y. Choi, V. Gnezdilov, E.Ya.Sherman, D.P. Chen, C.T. Lin, F.C.
Chou, B. Keimer, Phys. Rev. Lett., 96, 167204 (2006).
10. N.L. Wang, D. Wu, G. Li, X.H. Chen, C.H. Wang, X.G. Lou, Phys. Rev. Lett. 93,
147403 (2004)
11. J.W. Lynn, Q. Huang, C.M. Brown, V.L. Miller, M.L. Foo, R.E. Schaak, C. Y. Jones,
E.A. Mackey, and R.J. Cava, Phys. Rev. B 68, 214516 (2003).

16
12. Z.Y. Li, J.L. Yang, J.G. Hou and Q.S. Zhu, Phys. Rev. B 70, 144518 (2004)
13. J.F. Qu, W. Wang, Y. Chen, G. Li, X.G. Li, Phys. Rev. B, 73, 092518 (2006)
14. Y.G. Shi, H.X. Yang, H. Huang, X. Liu, and J.Q. Li*, Phys. Rev. B, 73, 094505 (2006).
15. K. Takada, H. Sakurai, E. Takayama-Muromachi, F. Izumi, R.A. Dilanian, and T.
Sasaki, Adv. Mater. 16, 1901 (2004).
16. S. Mistry, D.C. Arnold, C. J. Nuttall, A. Lappas and M. A. Green, Chem. Commun.,
2440 (2004).
17. C. Fouassier, Gn. Matejka, J.-M. Reau, and P.J. Hagenmuller, J. Solid State Chem. 6,
532 (1973).
18. T. Motohashi, R. Ueda, E. Naujalis, T. Tojo, I. Terasaki, T. Atake, M. Karppinen, H.
Yamauchi, Physical Review B 67,064406(2003).
19. M.L. Foo, T. Klimczuk, L Li, N.P. Ong, R.J. Cava. Solid State Commun. 133, 407
(2005).
20. Y. Takahash, Y. Gotoh, J. Akimoto, J. Solid State Chem. 172, 22 (2003).
21. Y. Ono, R. Ishikawa, Y. Miyazaki, Y. Ishii, Y. Morii, and T. Kajitani, J. Solid State
Chem., 166, 177 (2002).
22. P.H. Zhang, R.B. Capaz, M.L. Cohen, S.G. Louie, Phys. Rev. B, 71, 153102 (2005).
23. A. Van der Ven, M. K. Aydinol, G. Ceder, G. Kresse and J. Hafner, Phys. Rev. B 58,
2975 (2004)
24. H.X. Yang, Y.G. Shi, X. Liu, R.J. Xiao, H.F. Tian and J.Q. Li, , Phys. Rev. B 73, 014109
(2006).
25. H.X. Yang, Y.G. Shi, Y.Q. Guo, X. Liu, R.J. Xiao, J.L. Luo, J.Q. Li,

17
cond-mat/0503136.
26. E. Kroumova, M.I. Aroyo, J.M. Perez-Mato, A. Kirov, C. Capillas, S. Ivantchev, H.
Wondratschek, Phase Transitions 76, 155 (2003).
27. M.L. Foo, Y. Wang, S.Watauchi, H.W. Zandbergen, T. He, R.J. Cava, and N.P. Ong,
Phys. Rev. Lett. 92, 247001 (2004).
28. B.L. Cushing, J.B. Wiley, J. Solid. State. Chem. 141, 385 (1998).
29. I. Levin, S.A. Prosandeev, and J.E. Maslar, Applied Physics Letters 86, 011919 (2005).
30. H.W. Zandbergen, M. Foo, Q. Xu, V. Kumar, R.J. Cava, Phys. Rev. B, 70, 024101
(2004).
31. Y.Q. Guo, J.L. Luo, G.T. Liu, H.X. Yang, J.Q. Li, N.L. Wang, D. Jin, unpublished.

18
Figure Captions
Fig. 1: (a) XRD patterns for parent phases of α-NaCoO2, β-Na0.6CoO2 and γ-Na0.75CoO2.
The lattice parameters for all phases are shown for comparison.
(b) Structural models of α-NaCoO2, β-Na0.6CoO2 and γ-Na0.75CoO2 phases.
Fig. 2: Raman spectra of the α-NaCoO2, β-Na0.6CoO2 and γ-Na0.75CoO2 phases,
demonstrating different spectral structures for these specific phases.
Fig. 3: (a) Electron diffraction patterns and (b) HRTEM image taken along the [001] zone
axis direction of Sr0.35CoO2, showing the 31/2a×31/2a superstructure from Sr ordering.
Fig. 4: (a) Raman spectra taken from γ-SrxCoO2 materials with x = 0.15, 0.25, 0.35 and
0.40, showing the evident change of the spectral structures due to the 31/2×31/2
superstructure.
(b) Raman spectra taken from γ- CaxCoO2 materials with x = 0.15, 0.3, 0.35 and 0.40,
showing the spectral features arising from cation ordering.
Fig. 5: HRTEM and corresponding electron diffraction pattern taken alone [010] zone-axis,
indicating the coexistence of different phases observed in the Na0.5CoO2 single crystals.
The top region is governed mainly by the γ-phase and the bottom area is almost entirely
β-phase. C1 is c parameter for γ-phase of about 10.8 Å, C2 is c parameter for β-phase of
about 5.7 Å.

19
Figure 1

20
Figure 2
200 400 600 800
In
tens
ity (a
rb. u
nits
)
Raman shift (cm-1)
γ-Na0.75CoO2
β-Na0.6CoO2
α-NaCoO2
188.5 470.4 510.7
605.8
673.3
460.8576.7 691.1
486.5586.4

21
Figure 3

22
Figure 4
..
200 400 600 800
Ca0.40CoO2
Inte
nsity
(arb
. uni
ts)
Raman shift (cm-1)
Ca0.35CoO2
Ca0.3CoO2
Ca0.15CoO2196.6 483.3 525.1 621.8691.1
477.1560.4
594.8694.8
(b)
200 400 600 800
Sr0.40CoO2
Sr0.15CoO2
Sr0.25CoO2
Inte
nsity
(arb
. uni
ts)
Raman shift (cm-1)
193.4 480.1 521.9618.5 687.9
148.2180.5 462.3
536.4 592.8
694.9Sr0.35CoO2
(a)
23
Figure 5


![arXiv:math/0110288v1 [math.NT] 26 Oct 2001 · The calculation of the singular Fourier coefficients uses extensively ideas from [10], where the case of n= pwas considered. However,](https://static.fdocument.org/doc/165x107/5fc3b3f1199f32581a09655e/arxivmath0110288v1-mathnt-26-oct-2001-the-calculation-of-the-singular-fourier.jpg)


![Jacobs Journal of Inorganic Chemistry · been extensively studied in cyclic polyenes, such as cyclopen-tadienyl, indenyl, and anthracenyl ligands [20]. A reversible haptotropic shift](https://static.fdocument.org/doc/165x107/607e117ab1b6794ce90bc6c9/jacobs-journal-of-inorganic-chemistry-been-extensively-studied-in-cyclic-polyenes.jpg)