Rachelle Allen-McFarlane , Adrian Douglas Allen , Garima ......century, and that the scarcity of new...
13
1041 ISOLATION AND CHARACTERIZATION OF L. parafarraginis (KU495926) INHIBITING MULTIDRUG-RESISTANT AND EXTENDED SPECTRUM ΒETA-LACTAMASE GRAM-NEGATIVE BACTERIA Rachelle Allen-McFarlane 1 , Adrian Douglas Allen 1 , Garima Bansal 1 , Broderick Eribo* 1 Address(es): Ph.D. Broderick Eribo, 1 Howard University, Department of Biology, 415 College St. NW., 20059, Washington D.C., 202-806-693. *Corresponding author: [email protected] ABSTRACT Keywords: Lactobacillus parafarraginis, lactic acid bacteria (LAB), multi-drug resistant (MDR), extended spectrum beta-lactamase (ESBL), bacteriocin INTRODUCTION The genus Lactobacillus, first proposed by Beijerinick (1901) (Lin et al., 2013), consists of phylogenetically diverse (224 species and 29 subspecies) organisms known as lactic acid bacteria (LAB) (http://www.bacterio.net/lactobacillus.html). The commonality among these organisms is the fermentation of carbohydrates to produce lactic acid as the sole or main end product (Tannock, 2004). Having been used by humans since time immemorial for fermented food production and preservation, LAB are generally recognized as safe (GRAS)(Ongol, 2012). Lactobacilli, although widely distributed in the environment (Holt et al., 1994; Jay et al., 2008),are fastidious, having complex nutritional requirements of amino acids, peptides, vitamins, peptides, vitamins, salts, fatty acids, fatty acid esters and nucleic acid derivatives (Moretro et al., 1998; Salvetti et al., 2012; Tannock, 2004). Their complex nutritional requirements are often reflective of their habitat where carbohydrate containing substrates are available (Salvetti et al., 2012). They may be homofermenters—fermenting hexoses almost exclusively ( >85%) to lactic acid with pentoses and gluconates are not fermented; facultative heterofermenters—fermenting hexoses to lactic acid and degrade pentoses and gluconates to acetic acid, ethanol and formic acid under conditions of limited glucose or obligate heterofermenters—metabolize pentoses and hexoses to produce lactic acid, ethanol (or acetic acid) and carbon dioxide (Salvetti et al., 2012). Additionally, some lactobacilli are known to produce exopolysaccharides which contribute to the texture of foods and in their survival as probiotics in the gastrointestinal tract (Badel et al., 2011; Sun et al., 2015). The first species of L. parafarraginis, reported by Endo and Okada in 2007, was isolated from a compost of distilled shochu (a traditional Japanese distilled spirit made from rice, sweet potato, barley or other starchy nutrients) residue (Endo and Okada, 2007). Increasing research on L. parafarraginis has identified strains capable of improving aerobic stability of silage (Liu et al., 2014); deodorization and purification of water in eel farming (H. H. Lee et al., 2013); and metabolizing lactic acid anaerobically (Johanningsmeier, 2011). The efficacy of LAB, as a bio-control may lie in its gene products such as bacteriocins. Bacteriocins, discovered by the Belgian scientist Andrѐ Gratia in 1925 (Daw and Falkiner, 1996), are among the most important antimicrobial agents produced by LAB. They are diverse and naturally abundant ribosomally synthesized antimicrobial peptides, polypeptide, proteins or protein complexes which have been found in all major lineage of Bacteria and Archaea (Klaenhammer, 1988; Parada et al., 2007; M. Riley and Gillor, 2007; Zacharof and Lovitt, 2012). They are usually produced during stressful conditions, released extracellularly, utilized during competition for space and nutrients by rapid eliminating neighboring cells that are not immune to their effect (Heng et al., 2007; Pingitore et al., 2007; M. A. Riley and Gordon, 1999). Over the years, interest in bacteriocins from LAB has been largely driven by commercial imperatives (Heng et al., 2007) in the food industry, where bacteriocin producing LAB and bacteriocins such as nisin and pediocin have limited application as additives to prevent the growth of food-poisoning and food-spoilage bacteria (Zacharof and Lovitt, 2012). This narrow spectrum of application is based on the general knowledge that bacteriocins are short-chain peptides with antimicrobial activity against closely related bacteria. More recently, however, several bacteriocins have been shown to exhibit broad spectrum activity against a wide range of bacteria (Kwon et al., 2002; Mlalazi et al., 2011; Muller et al., 2009; Todorov and Dicks, 2005). Given this potential, this study’s primary objective was to characterize bacteriocins from LAB capable of inhibiting multidrug-resistant, extended spectrum beta-lactamase Gram- negative bacteria. The prevalence of multidrug-resistance cannot be over emphasized. In 2014, the World Health Organization (WHO) noted that a post- antibiotic era in which common infections and minor injuries can kill is a real possibility for the 21st century, and that the scarcity of new classes of antimicrobial drugs for Gram-negative bacteria adds additional urgency. To the best of our knowledge, the current study is the first to show a Lactobacillus parafarraginis species inhibiting the growth of multidrug-resistant and extended spectrum β-lactamase Gram-negative bacteria from clinical specimens, and the first reported finding of this isolate in yogurt. A new strain of Lactobacillus parafarraginis was isolated from a sample of commercial yogurt and identified by phenotypic and molecular methods. Phenotypic characterization showed bacilli sizes ~ 0.75-2.75 μm × 0.25-0.75 μm, a generation time of ~3.04 h under anaerobic conditions, halotolerance, lactose fermentation, production of hydrogen sulfide gas from Kliger iron agar, and the presence of an unusual fatty-acid methyl ester, cis- 10-nonadecenoic acid. Based on 16S rRNA gene sequencing, the isolate was identified as Lactobacillus parafarraginis and given the GenBank accession number (KU495926). L. parafarraginis ((KU495926)) inhibited 14 multidrug-resistant (MDR) and extended spectrum β-lactamase (ESBL) Gram-negative clinical isolates, as well as 11 other pathogens by spot-test and well-diffusion assays. The MDR/ESBL clinical isolates and other pathogens included Escherichia coli, Pseudomonas aeruginosa, Acinetobacter baumannii/haemolyticus, Enterobacter aerogenes, Proteus mirabilis and Klebsiella pneumonia, Staphylococcus aureus, Listeria monocytogenes, Escherichia coli (O157:H7), Bacillus cereus, Yersinia enterocolitica, Pseudomonas aeruginosa, Shigella sonnei, Streptococcus pyogenes and Enterococcus faecalis. Analyses of the semi-purified inhibitory fraction by SDS-PAGE, fast perfusion liquid chromatography (FPLC) inferred antimicrobial properties, characteristic of bacteriocins, with a protein band of ~75 kDa. Four bacteriocin structural genes which include sakT-β for sakacinT-β chain, sakT-α (sakacinT-α chain), acd T (acidocin), and plnc8A (plantaricin-α chain) were detected by PCR. The data suggest that L. parafarraginis (KU495926) may be a novel strain with potential therapeutic application. To our knowledge, this is the first report of the isolation of this strain from yogurt. ARTICLE INFO Received 11. 8. 2018 Revised 5. 11. 2018 Accepted 12. 11. 2018 Published 1. 2. 2019 Regular article doi: 10.15414/jmbfs.2019.8.4.1041-1053
Transcript of Rachelle Allen-McFarlane , Adrian Douglas Allen , Garima ......century, and that the scarcity of new...
1041
ISOLATION AND CHARACTERIZATION OF L. parafarraginis (KU495926) INHIBITING MULTIDRUG-RESISTANT
AND EXTENDED SPECTRUM ΒETA-LACTAMASE GRAM-NEGATIVE BACTERIA
Rachelle Allen-McFarlane1, Adrian Douglas Allen1, Garima Bansal1, Broderick Eribo*1
Address(es): Ph.D. Broderick Eribo, 1Howard University, Department of Biology, 415 College St. NW., 20059, Washington D.C., 202-806-693.
*Corresponding author: [email protected] ABSTRACT
Keywords: Lactobacillus parafarraginis, lactic acid bacteria (LAB), multi-drug resistant (MDR), extended spectrum beta-lactamase
(ESBL), bacteriocin
INTRODUCTION
The genus Lactobacillus, first proposed by Beijerinick (1901) (Lin et al., 2013),
consists of phylogenetically diverse (224 species and 29 subspecies) organisms
known as lactic acid bacteria (LAB) (http://www.bacterio.net/lactobacillus.html). The commonality among these organisms is the fermentation of carbohydrates to
produce lactic acid as the sole or main end product (Tannock, 2004). Having
been used by humans since time immemorial for fermented food production and preservation, LAB are generally recognized as safe (GRAS)(Ongol, 2012).
Lactobacilli, although widely distributed in the environment (Holt et al., 1994;
Jay et al., 2008),are fastidious, having complex nutritional requirements of amino acids, peptides, vitamins, peptides, vitamins, salts, fatty acids, fatty acid
esters and nucleic acid derivatives (Moretro et al., 1998; Salvetti et al., 2012;
Tannock, 2004). Their complex nutritional requirements are often reflective of their habitat where carbohydrate containing substrates are available (Salvetti et
al., 2012). They may be homofermenters—fermenting hexoses almost
exclusively ( >85%) to lactic acid with pentoses and gluconates are not fermented; facultative heterofermenters—fermenting hexoses to lactic acid and
degrade pentoses and gluconates to acetic acid, ethanol and formic acid under conditions of limited glucose or obligate heterofermenters—metabolize pentoses
and hexoses to produce lactic acid, ethanol (or acetic acid) and carbon dioxide
(Salvetti et al., 2012). Additionally, some lactobacilli are known to produce exopolysaccharides which contribute to the texture of foods and in their survival
as probiotics in the gastrointestinal tract (Badel et al., 2011; Sun et al., 2015).
The first species of L. parafarraginis, reported by Endo and Okada in 2007, was isolated from a compost of distilled shochu (a traditional Japanese distilled spirit
made from rice, sweet potato, barley or other starchy nutrients) residue (Endo
and Okada, 2007). Increasing research on L. parafarraginis has identified
strains capable of improving aerobic stability of silage (Liu et al., 2014);
deodorization and purification of water in eel farming (H. H. Lee et al., 2013);
and metabolizing lactic acid anaerobically (Johanningsmeier, 2011). The efficacy of LAB, as a bio-control may lie in its gene products such as
bacteriocins. Bacteriocins, discovered by the Belgian scientist Andrѐ Gratia in
1925 (Daw and Falkiner, 1996), are among the most important antimicrobial agents produced by LAB. They are diverse and naturally abundant ribosomally
synthesized antimicrobial peptides, polypeptide, proteins or protein complexes
which have been found in all major lineage of Bacteria and Archaea (Klaenhammer, 1988; Parada et al., 2007; M. Riley and Gillor, 2007;
Zacharof and Lovitt, 2012). They are usually produced during stressful
conditions, released extracellularly, utilized during competition for space and nutrients by rapid eliminating neighboring cells that are not immune to their
effect (Heng et al., 2007; Pingitore et al., 2007; M. A. Riley and Gordon,
1999). Over the years, interest in bacteriocins from LAB has been largely driven by
commercial imperatives (Heng et al., 2007) in the food industry, where
bacteriocin producing LAB and bacteriocins such as nisin and pediocin have limited application as additives to prevent the growth of food-poisoning and
food-spoilage bacteria (Zacharof and Lovitt, 2012). This narrow spectrum of
application is based on the general knowledge that bacteriocins are short-chain peptides with antimicrobial activity against closely related bacteria. More
recently, however, several bacteriocins have been shown to exhibit broad
spectrum activity against a wide range of bacteria (Kwon et al., 2002; Mlalazi et
al., 2011; Muller et al., 2009; Todorov and Dicks, 2005). Given this potential,
this study’s primary objective was to characterize bacteriocins from LAB capable of inhibiting multidrug-resistant, extended spectrum beta-lactamase Gram-
negative bacteria. The prevalence of multidrug-resistance cannot be over
emphasized. In 2014, the World Health Organization (WHO) noted that a post-antibiotic era in which common infections and minor injuries can kill is a real
possibility for the 21st
century, and that the scarcity of new classes of
antimicrobial drugs for Gram-negative bacteria adds additional urgency. To the best of our knowledge, the current study is the first to show a
Lactobacillus parafarraginis species inhibiting the growth of multidrug-resistant
and extended spectrum β-lactamase Gram-negative bacteria from clinical
specimens, and the first reported finding of this isolate in yogurt.
A new strain of Lactobacillus parafarraginis was isolated from a sample of commercial yogurt and identified by phenotypic and molecular methods. Phenotypic characterization showed bacilli sizes ~ 0.75-2.75 μm × 0.25-0.75 μm, a generation time of ~3.04 h under
anaerobic conditions, halotolerance, lactose fermentation, production of hydrogen sulfide gas from Kliger iron agar, and the presence of
an unusual fatty-acid methyl ester, cis- 10-nonadecenoic acid. Based on 16S rRNA gene sequencing, the isolate was identified as Lactobacillus parafarraginis and given the GenBank accession number (KU495926). L. parafarraginis ((KU495926)) inhibited 14
multidrug-resistant (MDR) and extended spectrum β-lactamase (ESBL) Gram-negative clinical isolates, as well as 11 other pathogens
by spot-test and well-diffusion assays. The MDR/ESBL clinical isolates and other pathogens included Escherichia coli, Pseudomonas aeruginosa, Acinetobacter baumannii/haemolyticus, Enterobacter aerogenes, Proteus mirabilis and Klebsiella pneumonia,
Staphylococcus aureus, Listeria monocytogenes, Escherichia coli (O157:H7), Bacillus cereus, Yersinia enterocolitica, Pseudomonas
aeruginosa, Shigella sonnei, Streptococcus pyogenes and Enterococcus faecalis. Analyses of the semi-purified inhibitory fraction by SDS-PAGE, fast perfusion liquid chromatography (FPLC) inferred antimicrobial properties, characteristic of bacteriocins, with a protein
band of ~75 kDa. Four bacteriocin structural genes which include sakT-β for sakacinT-β chain, sakT-α (sakacinT-α chain), acd T
(acidocin), and plnc8A (plantaricin-α chain) were detected by PCR. The data suggest that L. parafarraginis (KU495926) may be a novel strain with potential therapeutic application. To our knowledge, this is the first report of the isolation of this strain from yogurt.
ARTICLE INFO
Received 11. 8. 2018
Revised 5. 11. 2018
Accepted 12. 11. 2018
Published 1. 2. 2019
Regular article
doi: 10.15414/jmbfs.2019.8.4.1041-1053
J Microbiol Biotech Food Sci / Allen-McFarlane et al. 2019 : 8 (4) 1041-1053
1042
MATERIAL AND METHODS
Isolation of LAB from yogurt
LAB were isolated from 15 randomly selected commercial yogurts. Eleven (11)
grams of each yogurt were aseptically transferred into a stomacher bag and
combined with 99 mL of 0.01% of proteose peptone (DB Difco). Each combination was homogenized in a stomacher laboratory blender (80, Seward,
UK) for 60 sec. Volumes of 0.1 mL from 10 fold serial dilutions, of the
homogenized specimen, were plated on de Man Rogosa Sharpe (MRS) agar (DB Difco) and incubated anaerobically at 370C for 72 h (Mlalazi et al., 2011).
Countable plates were enumerated and colonies randomly selected, propagated, and used for antimicrobial screening using spot-test assay. Type cultures
(indicators organisms) used for spot testing included Staphylococcus aureus
(ATCC 6538), Listeria monocytogenes (ATCC 7644) and Escherichia coli O157:H7 (ATCC 35150). One isolate, A1 (KU495926), exhibiting broad
spectrum antimicrobial activity against these cultures, was selected for further
studies.
Detection of inhibitory activity of strain A1 (KU495926)
The antimicrobial activity of strain A1 (KU495926) was assessed by utilizing
spot tests, well-diffusion assays, live dead assays (flow cytometry and
fluorescence microscopy) in parallel with aerobic plate count. The spot testing method (Mohankumar et al. 2011) was modified and utilized in preliminary
screening against the indicators organisms Staphylococcus aureus (ATCC 6538),
Listeria monocytogenes (ATCC 7644) and Escherichia coli O157:H7 (ATCC 35150) and subsequent testing with fourteen (14) multidrug resistant and
extended spectrum β-lactamase Gram-negative organisms from six genera,
Escherichia coli (5), Pseudomonas aeruginosa (2), Acinetobacter baumannii/haemolyticus (3), Enterobacter aerogenes (1), Proteus mirabilis (2)
and Klebsiella pneumoniae (1), isolated from clinical specimens at a local
Washington D.C hospital (USA) (Table 1). Other indicator organisms tested include Pseudomonas aeruginosa (culture collection), Serratia marcescens
(culture collection), Shigella sonnei ATCC 11060, Yersinia enterocolitica
(ATCC 23715), Streptococcus pyogenes (ATCC 19615), Bacillus cereus (culture collection), Enterococcus faecalis (ATCC 29212) and Staphylococcus aureus
(culture collection). Pure colonies of strain A1 ((KU495926)) were inoculated in
MRS broth and incubated anaerobically at 370C for 72 h. The broth was then
vortexed and 1.5 mL pipetted into a sterile microfuge tube. The sample was then
centrifuged at room temperature for 10 min at 14,000 rpm (Eppendorf centrifuge
5415 C). The supernatant was decanted in another tube and 20 μL aliquoted and used to re-suspend the bacterial residue. A sterile Pasteur pipette was used to
make approximated 1 mm wells on the surface of MRS agar plates. A volume of
1 µL of the re-suspended residue was pipetted in each indentation created. The plates were then incubated at 370C anaerobically for approximately 24h.
Samples of exponential growth phase cultures (grown overnight on TSA, BHI or
Heart Infusion agar) of the indicator organisms were prepared to concentrations equivalent to that of a 0.5 McFarland by inoculating isolated colonies in sterile
saline. McFarland standard was prepared based on protocol found elsewhere
(McFarland, 1907) . The optical density was evaluated at OD625 nm (Bausch & Lomb Spectronic 601) with a reading of 0.100 ± 0.001. A 1 mL sample of
(McFarland equivalent) indicator organism was mixed with 8 mL of liquefied 1%
TSA, BHI agar or Heart infusion agar. The individual preparations were then poured over the colonies of strain A1 ((KU495926)) organism grown on the MRS
agar plates. The TSA agar/BHI/ Heart infusion agar was then allowed to solidify
on top of the MRS agar and the plates incubated aerobically at 370C for 24-48h.
Following the incubation period, the zones of inhibition observed were measured
(mm). The experiment was repeated a minimum of four times for each indicator
organism. A modified version of the well diffusion assay used by Kazemipoor et al 2012
(Kazemipoor et al., 2012) was utilized. Briefly, the indicator organisms were
grown on tryptic soy agar plates at 370C for 18- 24 h (instead of growing in BHI) then suspended in sterile saline to make 0.5 McFarland standard equivalents. A
lawn of the indicator organism was prepared by applying the McFarland standard equivalent to the surface of TSA plates by means of a sterile cotton swab
(Puritan®). A sterile well borer of diameter 5 mm was then used to cut uniform wells in the inoculated TSA plates. Each well was then filled with 80 μL of the
cell free supernatant (CFS) obtained from the LAB isolate. The CFS was
prepared by filtering ~72 h old MRS broth cultures of A1 ((KU495926)) with 0.22 μm filters. The CSF was concentrated by utilizing a speed vacuum
centrifuge (Integrated Speed Vac® System ISS110- Savant) (Mlalazi et al.,
2011) to reduce samples to at least a third of their original volume (3× concentrated). The prepared plates were then incubated at 370C for 16-24 h and
the diameter of the zone of inhibition ascertained with a millimeter rule. At least
four readings were derived for each indicator organism.
Time Lapse Studies of the Effect of A1 (KU495926) CFS/Bacteriocin on the
Growth of MDR/ ESBL Gram-negative Bacteria using Fluorescence
Microscopy and Aerobic Plate Count.
Pseudomonas aeruginosa (HUH06), a multidrug-resistant indicator organism,
was utilized in time lapse studies to verify the effect of the CFS of the
Lactobacillus isolate. Briefly, 500 µL of 0.5 McFarland standard equivalent of exponential growth phase P. aeruginosa (HUH06), O.D 625nm= 0.087 were
combined with 500 µL of 0.2 g/mL distilled H2O-lyophilized CFS. A volume of
3 µL of live-dead stain (Invitrogen L7012 Live-Dead Backlight™ Bacterial
Viability Kit- (SYTO 9 and propidium iodide combined 1:1)) was then added to
the 1000 µL preparation. The preparation was briefly vortexed and incubated at
370C. Samplings were done at intervals of 0.5, 2, 4, 6, 8, 24,48,72,96,120 and 144h. A total of five experiments were done. Lyophilized MRS sample of the
same volume and concentration (0.2 g/mL) as the CFS was utilized in control
experiments. At each sampling point, the tubes were briefly vortexed and 5 µL placed on a sterile microscope slide and photographed under the EVOS Digital
Inverted Microscope (Advance Microscopy Group). Additionally, the microbial
population in each microfuge tube was monitored in parallel with EVOS viewing by using micro-samplings to do standard plate counts. One (1) µL of sample was
removed from the microfuge tube and placed in 9 mL of sterile saline. After
vortexing the tube, subsequent 1:10 dilutions were done and 0.1 mL plated on trypticase soy agar plates. Plates were incubated aerobically at 370C overnight
and cfu/mL enumerated. Similar experiments were done with A. baumannii
(HUH11).
Time Lapse and Flow Cytometry Assessment of A1 ((KU495926))
CFS/Bacteriocin efficacy on Growth of MDR/ ESBL Gram-negative
Bacteria
Flow cytometric analyses (BD Accuri™ C6 Plus Flow Cytometer) were done to further verify the inhibitory action of strain A1 ((KU495926)) CFS against
Escherichia coli (HUH12), A. baumannii (HUH08) and P. aeruginosa (HUH06).
A uniform suspension of exponential growth phase culture of each bacterium was prepared by inoculating pure colonies in sterile saline solution each with OD625nm
= ~0.3. A volume of 500 μL of each bacterial suspension was combined with 500
μL of the Lactobacillus CFS (3× speed vacuum concentrated) in triplicates. Control experiments were set up for each organism with 500 μL MRS broth (3×
speed vacuum concentrated) instead of strain A1 ((KU495926)) CFS. Three
microliters of L7012 Live-Dead Backlight™ fluorescence dyes (SYTO 9 and propidium iodide combined 1:1) were also added to all microfuge tubes. The
tubes were then incubated at 370C and analyzed using BD Accuri™ C6 Plus flow
cytometer at times 5 and 96 h. The green fluorescence of SYTO 9 (indicated live bacteria) and red fluorescence of propidium iodide (indicated dead/damaged
bacteria) were evaluated by the standard optical filters 533/30 nm (FL1) and 670
LP nm FL3 respectively (Berney et al., 2007; Elshikh et al., 2016; Joshi et al.,
2006). The equipment was set at a flow rate of 10,000 events per second. The
live-dead data captured by the optical filters were analyzed both graphically and
by doing Repeated Measures ANOVA (RMA) using SPSS statistical software, version 23 (Singh et al., 2013) to determine any significant difference between
mean number of organisms alive in strain A1 ((KU495926)) CFS compared to
the MRS broth.
J Microbiol Biotech Food Sci / Allen-McFarlane et al. 2019 : 8 (4) 1041-1053
1043
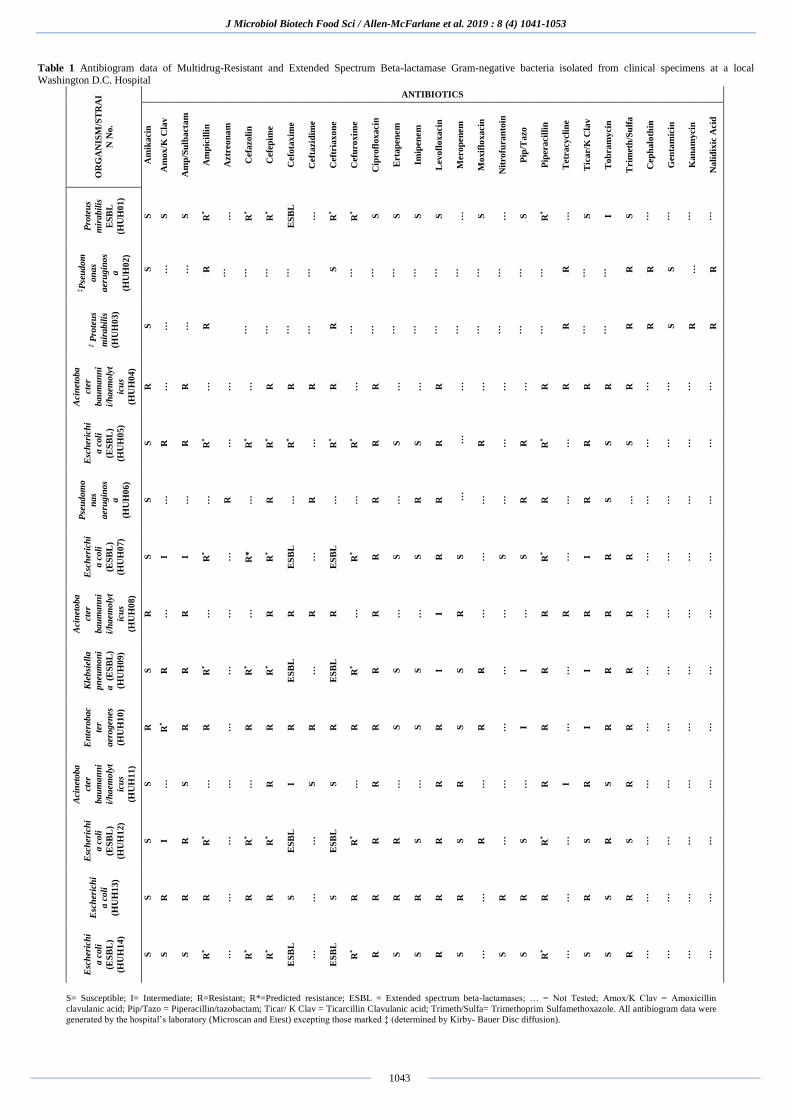
Table 1 Antibiogram data of Multidrug-Resistant and Extended Spectrum Beta-lactamase Gram-negative bacteria isolated from clinical specimens at a local Washington D.C. Hospital
OR
GA
NIS
M/S
TR
AI
N N
o.
ANTIBIOTICS
Am
ikacin
Am
ox/K
Cla
v
Am
p/S
ulb
acta
m
Am
pic
illi
n
Aztr
eon
am
Cefa
zoli
n
Cefe
pim
e
Cefo
tax
ime
Ceft
azid
ime
Ceft
ria
xo
ne
Cefu
roxim
e
Cip
rofl
oxacin
Erta
pen
em
Imip
en
em
Levofl
oxaci
n
Merop
en
em
Moxif
loxacin
Nit
rofu
ran
toin
Pip
/Tazo
Pip
eracil
lin
Tetr
acycli
ne
Tic
ar/K
Cla
v
Tob
ram
ycin
Trim
eth
/Su
lfa
Cep
halo
thin
Gen
tam
icin
Kan
am
ycin
Nali
dix
ic A
cid
Pro
teu
s
mir
abil
is
ES
BL
(HU
H0
1)
S
S
S
R*
…
R*
R*
ES
BL
…
R*
R*
S
S
S
S
…
S
…
S
R*
…
S
I S …
…
…
…
‡P
seu
dom
on
as
aeru
gin
os
a
(HU
H0
2)
S
…
…
R …
…
…
…
…
S …
…
…
…
…
…
…
…
…
…
R …
…
R
R
S
…
R
‡ P
rote
us
mir
abil
is
(HU
H0
3)
S
…
…
R
…
…
…
…
R …
…
…
…
…
…
…
…
…
…
R …
…
R
R
S
R
R
Acin
eto
ba
cte
r
bau
ma
nn
i
i/h
aem
oly
t
icu
s
(HU
H0
4)
R
…
R
…
…
…
R
R
R
R
…
R
…
…
R
…
…
…
…
R
R
R
R
R …
…
…
…
Esc
heri
chi
a c
oli
(ES
BL
)
(HU
H0
5)
S
R
R
R*
…
R*
R*
R*
…
R*
R*
R
S
S
R
…
R
…
R
R*
…
R
S
S …
…
…
…
Pse
ud
om
o
na
s
aeru
gin
os
a
(HU
H0
6)
S
…
…
…
R
…
R
…
R
…
…
R
…
R
R
…
…
…
R
R
…
R
S
… …
…
…
…
Esc
heri
chi
a c
oli
(ES
BL
)
(HU
H0
7)
S
I I R*
…
R*
R*
ES
BL
…
ES
BL
R*
R
S
S
R
S
…
S
S
R*
…
I R
R …
…
…
…
Acin
eto
ba
cte
r
ba
um
an
ni
i/h
aem
oly
t
icu
s
(HU
H0
8)
R
…
R
…
…
…
R
R
R
R
…
R
…
…
I R
…
…
…
R
R
R
R
R …
…
…
…
Kle
bsi
ella
pn
eu
mo
ni
a
(ES
BL
)
(HU
H0
9)
S
R
R
R*
…
R*
R*
ES
BL
…
ES
BL
R*
R
S
S
I S
R
…
I R
…
I R
R …
…
…
…
En
tero
ba
c
ter
aero
gen
es
(HU
H1
0)
R
R*
R
R
…
R
R
R
R
R
R
R
S
S
R
S
R
…
I R
…
I R
R …
…
…
…
Acin
eto
ba
cte
r
bau
ma
nn
i
i/h
aem
oly
t
icu
s
(HU
H1
1)
S
…
S
…
…
…
R
I S
S
…
R
…
…
R
R
…
…
…
R
I R
S
R …
…
…
…
Esc
heri
chi
a c
oli
(ES
BL
)
(HU
H1
2)
S
I R
R*
…
R*
R*
ES
BL
…
ES
BL
R*
R
R
S
R
S
R
…
S
R*
…
S
R
S …
…
…
…
Esc
heri
chi
a c
oli
(HU
H1
3)
S
R
R
R
…
R
R
S
…
S
R
R
R
R
R
R
…
R
R
R
…
R
S
R …
…
…
…
Esc
heri
chi
a c
oli
(ES
BL
)
(HU
H1
4)
S
S
S
R*
…
R*
R*
ES
BL
…
ES
BL
R*
R
S
S
R
S
…
S
S
R*
…
S
S
R …
…
…
…
S= Susceptible; I= Intermediate; R=Resistant; R*=Predicted resistance; ESBL = Extended spectrum beta-lactamases; … = Not Tested; Amox/K Clav = Amoxicillin
clavulanic acid; Pip/Tazo = Piperacillin/tazobactam; Ticar/ K Clav = Ticarcillin Clavulanic acid; Trimeth/Sulfa= Trimethoprim Sulfamethoxazole. All antibiogram data were
generated by the hospital’s laboratory (Microscan and Etest) excepting those marked ‡ (determined by Kirby- Bauer Disc diffusion).
J Microbiol Biotech Food Sci / Allen-McFarlane et al. 2019 : 8 (4) 1041-1053
1044
Determining minimum inhibitory concentration (MIC) and minimum
bactericidal concentration (MBC) of CFS
A 0.5 McFarland standard equivalent was prepared in sterile saline for each of the 14 isolated clinical pathogens using exponential growth phase cultures
(grown overnight on TSA; ~ 16-18h old). One hundred and sixty (160) µL of a
20 mg/mL distilled H2O-lyophilized sample of strain A1 (KU495926) CFS was added to each of the first test wells on 96 well plates (Corning Incorporated;
USA). Eighty (80) µL of heart infusion broth (Difco; USA) was then added to all
other wells. Serial dilution of the A1 CFS was done by transferring 80 µL of solution from the first well to subsequent wells in each vertical row, ensuring
proper mixing of the contents in each well before transfer. The final 80 µL were discarded. Ten (10) µL of the 0.5 McFarland standard equivalent prepared for
each pathogen was added to each well in the appropriately labeled vertical row.
Ten (10) µL of 6.75 mg/mL resazurin (Sigma company; USA) solution were added to all wells. The 96 well plates were incubated overnight and then
evaluated macroscopically to determine the MIC (Allen et al., 2012). To
determine MBC an inoculum from each well was applied to the surface of TSA, incubated overnight then observed for growth. Similar experiments using
lyophilized MRS broth were set up as control.
Effect of temperature on the activity of CFS
Aliquots of 0.2 g/mL lyophilized cell free supernatant dissolved in sterile distilled water were subjected to heat treatments of 40, 80 and 1000C for 30 min and
autoclaved at 1210C for 20 min. The samples were cooled and tested for
antimicrobial activity via well- diffusion assay (van Reenen et al., 1998).
Effect of pH on the activity of CFS
The initial pH (4.46 ) of 3x speed vacuum concentrated CFS of strain A1
(KU495926) was determined by using a pH meter (Thermo-electron co-
operation) and aliquots used for controlled experiments. Additional aliquots were adjusted to pH 2, 3, 4, 5, 6, 7, 8, 9 and 10 by using 1M sodium hydroxide and
hydrochloric acid (Joshi et al., 2006). The prepared samples were allowed to
stand at room temperature for 1h and then assayed for activity against four indicator organisms (E. coli (HUH12), A. baumannii (HUH04), E. faecalis
(ATCC 29212) and B. cereus) via well-diffusion as described earlier. The
diameters of the zones of inhibition (mm) were measured following overnight
incubation at 370C. An average of three measurements were taken for each pH.
Tricine SDS-PAGE to detect bacteriocin released by L. parafarraginis
KU494926
Cell free supernatant was prepared as previously mentioned from various aged culture of the Lactobacillus spp. (5 months, 3 months, 13 days, 5 days and ~72
h). These CFS samples were 3× speed vacuum concentrated (Integrated Speed
Vac® System ISS110- Savant) and used for SDS-PAGE. Both precast gels (Biorad® Mini-Prortean™ TGX 4-20% gel) and self-made gels (Schagger,
2006) were utilized in this study. Molecular weight marker with range 3.5-245
kDa (Flash Protein Ladder, Gel-Company- San Francisco, U.S.A) and 10-250 kDa (BioRad unstained Precision Plus protein ladder) were utilized. Gels were
stained by using Coomassie Blue R250 and/or Imidazole-SDS-Zinc (Gillespie
and Elliott, 2005). SDS-PAGE was also used to detect bacteriocin production along the growth
curve of L. parafarraginis (KU495926). Colonies L. parafarraginis grown under
anaerobic conditions at 370C for ~72 h were inoculated in 10mL of MRS broth.
The broth was incubated at 370C for 16 h under the previously mentioned
conditions, vortexed and 1 mL added to each of three Erlenmeyer flasks
containing 200 mL of MRS broth. The flasks were incubated at 370C under anaerobic conditions with constant agitation. Samples of CFS supernatant were
prepared from the flasks at times :0, 3, 6, 12, 15, 18, 21, 24, 36, 48, 60,72 and 96
h by filter sterilizing aliquots of 5mL using 0.22 µm syringe filters. Samples were stored at -200C until further use. The optical densities of the cultures were also
assessed at each time by aspirating 1 mL samples (OD625nm against MRS blank) and the average density at each time used to generate a growth curve. A volume
0.5 mL of CFS collected for each time was centrifuged (Integrated Speed Vac®
System ISS110- Savant) and pellet reconstituted with 50 µL of sterile deionized water. The reconstituted samples were utilized for SDS-PAGE. A volume of 0.5
mL MRS broth was treated in the same manner as the CFS and electrophoresed
as a negative control. Activity unit with time was also assessed by utilizing the indicator organism E. coli (HUH14). A volume of 1.5 mL of CFS collected at
each time was concentrated thrice by centrifuging and 80 µL utilized per well
(created with a 5 mm well borer). The assays were done in triplicate and the zones of inhibition measured (mm). The average zones of inhibition were used to
determine activity unit per/mL (AU/mL) using the formula (Iyapparaj et al.,
2013): AU/mL=(Diameter of the zone of clearance (mm) × 1000) ÷Volume placed in the well (µL). A graph of AU/mL of CFS and growth of L. parafarraginis (KU495926) was generated (Goh and Philip, 2015). An average
of four pH readings was also taken for CFS collected at each time (Thermo
electron co-operation Orion2 Star pH Benchtop pH meter). Average aerobic plate count of E. coli (HUH14) was also assessed with CFS collected for each time
along the growth curve. For the aerobic plate count a volume of 500 µL of each
timed CFS was combined with 500 µL of E. coli (HUH14) OD625nm= 0.313 (Ultrospec 2100 pro UV/visible spectrophotometer) in sterile microfuge tubes
and incubated with constant agitation at 370C overnight (~16 h). The content of
each microfuge tube was then added to 10 mL of sterile saline solution vortexed and serially diluted up to a dilution factor of 10-5. Triplicate plating was done on
Brain Heart Infusion agar plates for each dilution.
Partial purification of bacteriocin
Seventy-two hours CFS of L. parafarraginis KU494926 was prepared as
previously mentioned. The samples were 6× speed concentrated (Integrated
Speed Vac® System ISS110- Savant) and loaded in a sterile tube onto the BioCAD 700E perfusion liquid chromatography workstation. The mobile phase
and eluent used were 0.45 µm filter sterilized; 10 mM sodium phosphate buffer
(pH 4.99) and 10 mM sodium phosphate containing 1 M NaCl pH 4.58 respectively (Håvarstein, Holo, & Nes, 1994). A HiTrap™ SP Sepharose FF, 1
mL cationic exchange column was used at a flow rate of 1 mL/min. A dual UV
detector set at 254 and 280 nm was used for protein detection. Fractions were
collected by peak cutting into sterile 15 mL tubes using Avantec SF-2120 Super
Fraction Collector. Fractions unique to particular peaks were pooled and
concentrated by speed vacuum and antimicrobial activity evaluated via well-diffusion assay. The combined fraction showing activity was further evaluated.
Following fractionation and combination, desalting and concentrating of 500 µL
combined fractions was done with Microcon® centrifugal filtering device 3 kDa cut-off-point, and further concentration was done for 1 h by speed vacuuming. A
volume of 5 μL, 0.2µm filter sterilized pH 4.43 deionized water was added to the
tube to enhance optimal pH for activity. MRS broth (control) was treated in a similar manner as the strain A1 ((KU495926)) CFS. Eighty microliters of the
prepared desalted fractions, as well as the sterilized deionized water (pH 4.43)
were assayed for activity via well-diffusion assay. SDS-PAGE was also done on individual fractions as well as the combined fractions.
The effect of proteolytic enzymes on partially purified bacteriocin
The effect of proteolytic enzymes on partially purified bacteriocin was
determined as mentioned elsewhere (Sharma and Neha., 2008). Active FPLC
fractions containing bacteriocin was combined in a 1:1 ratio with individual
enzymatic solution, incubated at 370C for 1 h, then heated for 3 min at 1000C for
enzyme inactivation prior to diffusion assay (van Reenen et al., 1998). The enzymes utilized included pepsin, papain, trypsin, α- chymotrypsin and
proteinase K (Fisher Science Education and Sigma; USA). The CFS was also
treated with previously mentioned enzymes (excepting papain) as well as α-amylase, peptidase, lipase A and catalase.
PCR Detection of Bacteriocin Structural Genes
Twenty sets of bacteriocin primers (Table 2) were used for the detection of
bacteriocin structural genes as mentioned elsewhere (Macwana and Muriana, 2012). The bacterial DNA was extracted from 1 mL of exponential growth phase
population in MRS broth. The sample was centrifuged at 12,000 rpm for 5 min,
the supernatant decanted, and the pellet resuspended in 750 μL of 50 mM EDTA (Fisher Scientific; USA), followed by the addition of 100 μL of a solution of 50
mg/mL lysozyme (Sigma; USA) (Abdulla, 2014). The protocol was then
observed as outlined by QIAamp (DNA mini kit). Post extraction, the purity and
concentration of the DNA was determined (Thermo-Scientific NanoDrop 2000c),
and PCR performed (Bio-Rad MJ Mini Personal Thermal Cycler). The annealing
temperatures for the various primers were determined in-silico (Themo Scientific calculator, https://www.thermofisher.com/us/en/home/brands/thermo-
scientific/molecular-biology/molecular-biology-learning-center/molecular-
biology-resource-library/thermo-scientific-web-tools/tm-calculator.html). A PCR reaction volume of 25 μL consisted 1 μL of DNA template (22.3 ng/ μL),
0.5 μL of forward and reverse primers (25 picomol/μL), 12.5 μL of Lucigen® Econo Taq® Plus 2X Master Mix and 10.5 μL of water (molecular grade). The
thermal cycler was programmed with a pre-incubation period of 2 min at 940C
and for 35 cycles each consisting denaturation for 30s at 940C, the appropriate annealing temperature for 30s, elongation for 1 min at 720C. A final elongation of
10 min at 720C proceeded the 35 cycles. The amplicons were electrophoresed
using 0.8% agarose gel containing 5 μL of 10 mg/mL ethidium bromide per 100 mL of gel. The electrophoresed gels were viewed either with Kodak Gel Logic
100 Imaging System or Li-cor Odyssey Fc Imaging system.
Amplicons for sakT-β gene were cleaned-up using QIAquick PCR purification Kit, while those for sakT-α, acdT and plnc8A were extracted from the agarose gel
(Monarch DNA gel extraction kit) and the amplification repeated. Sanger
sequencing was performed by Genewiz® Inc. (South Plainfield, NJ), and sequences evaluated using Applied Biosystems (ABI) Sequence Scanner software
2, and the homologies evaluated using NCBI BLAST
(https://blast.ncbi.nlm.nih.gov/Blast.cgi). Pairwise comparisons were done with
J Microbiol Biotech Food Sci / Allen-McFarlane et al. 2019 : 8 (4) 1041-1053
1045
the sequences for sakT-β and sakT-α by with Lactobacillus sakei IP-TX (GenBank accession, AY206863.1). Similarly, comparisons were done between
the acdT gene sequence and acdT gene from Lactobacillus acidophilus (GenBank
accession, D43626.1), and between the plnc8A gene sequence and plnc8A gene of Lactobacillus plantarum (GenBank accession, AB552848.1). BLASTX was also
used to do conceptual translation of the sequences and queries against protein
databases. The bacteriocin genome mining tool BAGEL3
(http://bagel.molgenrug.nl/index.php/bacteriocin-database/) (van Heel et al., 2013; Walsh et al., 2015) was used to do comparative analyses with the
sequenced bacteriocin structural genes and those in : Lactobacillus buchneri
CD034, Lactobacillus acidophilus 30SC, Lactobacillus acidophilus La 14, Lactobacillus acidophilus NCFM and Lactobacillus plantarum subsp.
plantarum P8.
Table 2 Primers used in this study
Baccteriocin Gene Forward Primer Reverse Primer Name of Bacteriocin*
Primer Reference (5′–3′) (5′–3′)
papA ttacttgtggcaaacattcctg tgattaccttgatgtccaccag Pediocin (Macwana and Muriana, 2012)
breB atggagaaattcgcagtgttatc tgttatttaggcagctaattgca breB brevicin 925A (Macwana and Muriana, 2012)
breC atgtataaagaattaacagttgatgaatt gtgcatgccgtgtaagttgt breC brevicin 925A (Macwana and Muriana, 2012)
plnc8A ctagaaaagatctctggcggtg catatgggtgctttaaattcca Plantaricin.NC8 alpha
peptide (Macwana and Muriana, 2012)
plnc8B ggcaagagtagcttgtctcaaa caatcgttttgcgatgcttat Plantaricin NC8 beta
peptide (Macwana and Muriana, 2012)
Enterocin AS48 gaggagtatcatggttaa aga atattg ttaaattac caa Enterocin AS48 (Mirhosseini et al., 2008)
curvacin A atgaataatgtaaaagaattaagtatgaca tccagctaaaccactagccc Curvacin A (Macwana and Muriana, 2012)
mesB aaacaaatttcaaaatcctttcaga atttgtggttcttgatctttgc Mesentericin B105 (Macwana and Muriana, 2012)
acdT aaagaattagcattaatttctgggg cgtcagtataacgaaggctttccc Acidocin T8912 (Macwana and Muriana, 2012)
helveticin atgattggaaaagaaactcaaatac aataaaggcaatcaccagttactt Helveticin (Macwana and Muriana, 2012)
α-peptide aacaattggtggtggcatgt tatccaagacgtccctttttgt Lactocin-α (Macwana and Muriana, 2012)
β-peptide gaaaaatttgccaatatctcgaa accattaattggtgaatggtga Lactocin-β (Macwana and Muriana, 2012)
sakT- α tcggtggctatactgctaaaca tgtcctaaaaatccaccaatgc SakacinT-α (Macwana and Muriana, 2012)
sakT-β aagaaatgatagaaatttttggagg tgtgaaatccaatcttgtcctg SakacinT-β (Macwana and Muriana, 2012)
laf agtcgttgttggtggaagaaat tcttatcttgccaaaaccacct Lactacin F (Macwana and Muriana, 2012)
NisZ atgagtacaaaagattttaacttgg ttatttgcttacgtgaatactaca Nisin Z (Macwana and Muriana, 2012)
Bac147 accaatgtttggtttgaactgta aaaattacttgtttcaacacttatcct Nisin U (Macwana and Muriana, 2012)
gaa A cggacgtaatttaggtttgaaca aagcccatgcaggtaatgtc Gassericin A (Macwana and Muriana, 2012)
B-Talla gtaacggagttcattgcacaaa taccagaaaccatttccaccat Leucocin-B (Leucocin
B-Ta11a) (Macwana and Muriana, 2012)
lclA aaaccaagtctctcgtattggc ggcacgttgtgtatccttacct Lactococcin A (Macwana and Muriana, 2012)
*, Identified with the aid of literature and database searches (e.g. BACTIBASE).
Phenotypic characterization of strain A1 ((KU495926))
The colony morphology of isolate A1, propagated on MRS agar plates was
determined via stereoscopy (Fisher Stereomaster). The organism was further
characterized by doing various biochemical and physiological tests. These
included Gram-stain, endospore stain, catalase, oxidase, gelatin liquefaction and
motility tests (BD BBL™ Motility Test Medium). DNase (BD Difco), urea
hydrolysis, tryptophan hydrolysis, methyl red, Voges-Proskeur, nitrate, citrate, growth in Kliger iron agar (BBL), sulphur-indole-motility (SIM) agar (BBL),
lysine–iron–agar (LIA, (BBL)), nutrient broth (OXOID) and fermentation of
lactose, glucose, sucrose, bile esculin and mannitol were also evaluated under both aerobic and anaerobic conditions via conventional methods. Its ability to
ferment forty-nine (49) carbohydrates was also evaluated via API-50CH
(BioMѐrieux® SA, France), (Nigatu, 2000) and the data garnered fed into a database provided by the manufacturer (http://apiweb.biomerieux.com) to
ascertain the identity of the organism (Mlalazi et al., 2011). Carbon-dioxide
production from dextrose metabolism in MRS was verified by bubbling the gas released into filtered 0.1 M barium hydroxide solution (Fisher scientific; USA).
The effect of pH, temperature, sodium chloride (NaCl) concentration as well as
presence and absence of oxygen on growth of the organism were evaluated. Growth in nutrient broth at pH 3, 7 and 9 was monitored by measuring optical
density (OD625nm against nutrient broth blank) over a 75 h period. An overnight
MRS broth culture of A1 (OD625nm, 0.105, grown at 370C anaerobically) was
homogenized with a vortex and 1.5mL of the specimen dispensed in 13.5mL of
nutrient broth at the different pH. Samples were incubated at 370C anaerobically
and vortexing followed by 1 mL samplings done at times: 0, 5, 10, 15, 30, 40, 55, 60 and 75 h. The optical densities of the samples were monitored with,
Spectronic® Genesys™ spectrophotometer. The effect of NaCl concentration was
evaluated by using a 16 h MRS broth culture of A1 (OD625nm, 1.724); 5 mL of this broth culture were pipetted into 20 mL nutrient broth of each salt concentration
(0.5%, 6.5%, 10%, and 15%). The optical densities of the samples were
monitored with Spectronic® Genesys™ spectrophotometer similar to the experiment for effect of pH. At the end of the 75 h assessment period a 1 mL
sample form each salt concentration was pipetted in 4 mL of MRS broth,
incubated anaerobically at 370C for 48 h and then streaked on MRS agar to assess viability of the cultures. Growth on MRS agar slants at 0oC, 4oC, 25oC, 37oC and
45oC was assessed both aerobically and anaerobically. Samples were incubated at
each temperature for 3 days. The generation time of strain A1 in MRS broth was estimated both aerobically
and anaerobically. Results were derived from two experiments which were
conducted in duplicate under each condition. Each experiment was initiated by
pipetting 1 mL of a homogenized overnight anaerobic broth culture into two sets
of 20 mL MRS broth. All tubes were vortexed and one set of two was incubated
under aerobic conditions and the other under anaerobic conditions at 370C with constant agitation. The optical densities of 1 mL samplings (Spectronic®
Genesys™ spectrophotometer) were obtained over an 80 h period at times: 0, 20,
40, 60 and 80 h. The standard plate count of each sample was determined at each
time interval by pipetting 1 mL into 9 mL of saline, with subsequent serial 10 fold dilutions of up to 10-7 and 10-8, with duplicate plating of 0.1 mL on MRS
agar plates. These plates were incubated anaerobically for 72 h at 370C and then
enumerated. The bacterial load was reported as colony forming units per mL
(CFU/mL) (Awua et al., 2012).
Microbial fatty acid profile
The microbial fatty acid profile of the organism was determined by gas
chromatography/mass spectrometry (GC/MS) analysis (Agilent Technologies 6890N Network GC system). The samples for fatty acid methyl ester (FAME)
were prepared by harvesting colonies from pure culture of the organism grown on
MRS agar. Fifty (50) mg of bacteria were aseptically added to a glass tube. Fatty-acids were saponified by the addition of a solution containing 0.45g sodium
hydroxide, 1.5 mL methanol and 1.5 mL distilled water. This preparation was
vortexed briefly and heated for 5 min at 1000C in a water bath. Re-vortexing and re-heating at the same temperature then followed for 10s and 30 min respectively.
The tube was then allowed to cool to 250C and the saponified fatty acids
methylated by adding 2 mL of a reagent containing 3.25 of 6M hydrochloric acid and 2.75 mL methanol. The latter preparation was briefly vortex and reheated at
810C for 11 min. Extraction of the fatty-acid methyl ester (FAME) then followed
with the addition of 1.25 mL of a solution containing 1:1 hexane; methyl tert-
butyl ether (MTBE). Subsequent mixing of the tube for 10 minutes was then
ensued and the aqueous (lower) phase removed. The remaining organic phase
was then washed by the addition of a solution containing 0.11g of NaOH in 9 mL of distilled water. The organic phase was then removed to a new tube for analysis
by GC/MS (Allen et al., 2012; McNabb et al., 1997).
Positive staining for Transmission Electron Microscopy (TEM)
A 1 mL sample of 12 days old MRS broth culture of the organism was placed in a sterile Eppendorf tube and centrifuged at 14,000 rpm for 10 min followed by
removal of the supernatant. The bacterial residue was then washed six times with
phosphate buffered saline. Three (3) µL of the sample were then placed on the dull side of a copper grid and allowed to stand for 5 min. Five (5) µL uranyl
acetate were added to the shine side of the grid and allowed to stand for 1 min.
Excess uranyl acetate was removed by blotting the grid with a filter paper. The grid was then washed twice by dipping ten times into two separate containers of
Millipore water. The grid was then placed on a filter paper, allowed to dry and
then evaluated by TEM (Zeiss Libra 120) (Barreto-Vieira and Barth, 2015).
Genotypic characterization
Pure colonies were evaluated by 16S rRNA gene sequencing (Genewiz Inc.,
South Plainfield, NJ), and sequences obtained were analyzed using NCBI

J Microbiol Biotech Food Sci / Allen-McFarlane et al. 2019 : 8 (4) 1041-1053
1046
Nucleotide BLAST search (www.ncbi.nlm.nih.gov/blast/html/BLASThomehelp.html), and a phylogram
generated utilizing MEGA 6.06 (bootstrapping, 1000). The 16S rRNA gene
sequence was deposited in GenBank and assigned the accession number (KU495926).
The organism was also evaluated for the presence of plasmids by utilizing BIO
101 RapidPURE™ Plasmid Mini Kit with turbo cartridges (North America, Europe), as well as Quigen plasmid extraction kit. Extraction was done following
the manufacturer’s instructions and the processed samples were assessed for the
presence of plasmid DNA using 1% agarose gel electrophoresis (Bio-Rad apparatus). Positive controls included 1000 base pair pUC8 (VWR International,
Inc.), and Escherichia coli O157:H7 (ATCC 35150).
Statistical analysis Microsoft Excel®, 2016 was utilized to do Two-Factor ANOVA without
replication on the data collected for spot and well-diffusion assays. This was
utilized to access the significant difference between the zones of inhibition (obtained for both tests) for the organisms. Similarly, Pearson product correlation
analysis was done to determine the association between spot and well-diffusion
assay (α, 0.05). To evaluate flow cytometric data, two-way repeated measures
ANOVA (α, 0.05) was done using SPSS v.23 (Statistical Package for Social
Sciences) statistical software.
RESULTS
Isolation and screening of LAB
Antimicrobial activities against three indicator organisms Staphylococcus aureus
(ATCC 6538), Listeria monocytogenes (ATCC 7644) and Escherichia coli
O157:H7 (ATCC 35150), were observed in a preliminary screening of lactic acid bacterial isolates selected from 15 samples of retail yogurt. Based on broad
spectrum antimicrobial activity and predominance, only one of 59 isolates from
yogurt, designated strain A1((KU495926)), was selected as a prototype for further characterization .
Phenotypic characterization of strain A1 ((KU495926))
Cells were Gram-positive, catalase and oxidase negative, non-motile rods (singly
or grouped) with length (~0.75 to 2.75 μm) and width (~0.25 to 0.75 μm). Electron micrographs reveal the presence of exopolysaccharide and another
unidentified secreted particles (Figure 1). Isolated colonies on MRS agar plates were beige, umbonate, waxy, opaque and grew to approximately 2-4 mm
diameter over 4 days’ period. Colonies typically presented with irregular margins
but occasional presentation of smooth margins was observed. The organism is facultative and heterofermentative. Carbon-dioxide was produced when grown in
MRS broth, but no gas was detected in Durham tubes when grown in
conventional glucose or maltose broth. It did not reduce nitrate nor liquefy gelatin. Acid was produced from several carbohydrates including lactose and 5-
keto-gluconate. It generated hydrogen sulfide gas in Kligler iron agar under both
aerobic and anaerobic conditions, in Sulphur-Indole-Motility (SIM) under
anaerobic conditions, but not in Lysine-Iron-Agar (LIA). It gave weakly positive,
variable reaction in citrate under aerobic conditions in about 3 days, and cells
grew at temperatures 25, 37 and 45 0C. The phenotypic characteristics of strain A1 (KU495626) are presented in Table 3. The predominant fatty-acid methyl
esters identified were C16:0 (hexadecanoic acid, methyl ester), 38.3% and C19:
i10 (cis-10 nonadecenoic acid, methyl ester), 31.90% (Table 4).
Table 3 Phenotypic characteristics of L. parafarraginis KU495926 Characteristics Reaction Characteristics cont’d Reaction
Gram-stain Gram-positive rods (occurring singly or in
groups)
Carbohydrate
Fermentation cont’d:
Oxidase - D-Mannose +
Catalase - L-Sorbose -
Gelatinase - L-Rhamnose -
Urease - Dulcitol -
Motility - Inositol -
Endospore - D-Mannitol +
FTM; O/F glucose; O/F lactosea Facultative anaerobe D-Sorbitol -
Kliger iron agar Acid/Neutral with H2S at 24h; Acid/Acid with
H2S in 3-4 days
Methyl-α-D-
Mannosepyranoside -
Lysine Iron Agar (LIA) Lysine decarboxylase - H2S - Methyl-α-D-
Glucopyranoside -
Sulphur/indole /motility (SIM) H2S -/+ b, indole -, motility - N-Acetylglucosamine -
Growth in MRS broth + (with gas production) c; heterofermentative. Amygdalin -
Growth in Nutrient broth
Sediment formed at bottom of the tube; broth
becomes
cloudy when tube is shaken, no flocculation
observed
Arbutin -
Growth on Mannitol Salt Agar - Esculin +
Citrate +w/- d Salicin -
Nitrate - D-Cellobiose -
Methyl Red + D-Maltose +
Voges-Proskaur - D-Lactose +
Phenylalanine - D-Melibiose +
DNAse - Sucrose +
Growth at Different Temp:
D-Trehalose -
0 0C - Inulin -
4 0C - D-Melezitose +
25 0C + D-Raffinose +
37 0C + Amidon(Starch) -
45 0C + Glyocogen -
Carbohydrate Fermentation:
Xylitol -
Glycerol - Gentiobiose -
Erythritol - D-Turanose -
D-Arabinose - D-Lyxose -
L-Arabinose + D-Tagatose -
D-Ribose + D-Fucose -
D-Xylose + L-Fucose -
L-Xylose - D-Arabitol +
D-Adonitol - L-Arabitol -
Methyl-β-D-Xylopyranoside - Gluconate +
D-Galactose + 2-Ketogluconate -
D-Glucose + 5-Ketogluconate +
D-Fructose +
+, positive; +w, weakly positive; -, negative; H2S, Hydrogen Sulfide; +/-, variable; FTM, Fluid thioglycollate medium; a, Acid production in O/F lactose was faster than in
O/F glucose; b, H2S positive in SIM media under anaerobic but negative under aerobic conditions; c, white precipitate formed when gas was bubbles into barium hydroxide
solution (confirmed CO2 production and that the organism is heterofermentative); d , Weakly positive reaction in citrate observed at 3-4 days under aerobic conditions.
J Microbiol Biotech Food Sci / Allen-McFarlane et al. 2019 : 8 (4) 1041-1053
1047
Table 4 Major fatty acid methyl esters (FAME) derived from strain A1 ((KU495926)) and MRS agar (control) identified by Gas chromatography mass spectrometry (GC/MS)
Fatty Acid Methyl Ester (%)
C16: i9 C16:0 C18: i9 C18:0 C18:0 C14:0 C19: i10cis
A1 0.92 38.30 6.09 3.43 3.43 0.26 31.90
MRS Agar (control) 2.04 8.25 0.94
Key: (left to right across heading of the table) :>9- Hexadecenoic acid, methyl ester (C16:i9), (Z)- Hexadecanoic
acid, methyl ester(C16:0),9-Octadecenoic acid (Z)-,methyl ester (C18:i9), Octadecanoic acid, methyl ester
(C18:0)>Methyl stearate (C18), Methyl tetradecanoate (C14:0),> cis-10-Nonadecenoic acid, methyl ester (C19:i10
cis).
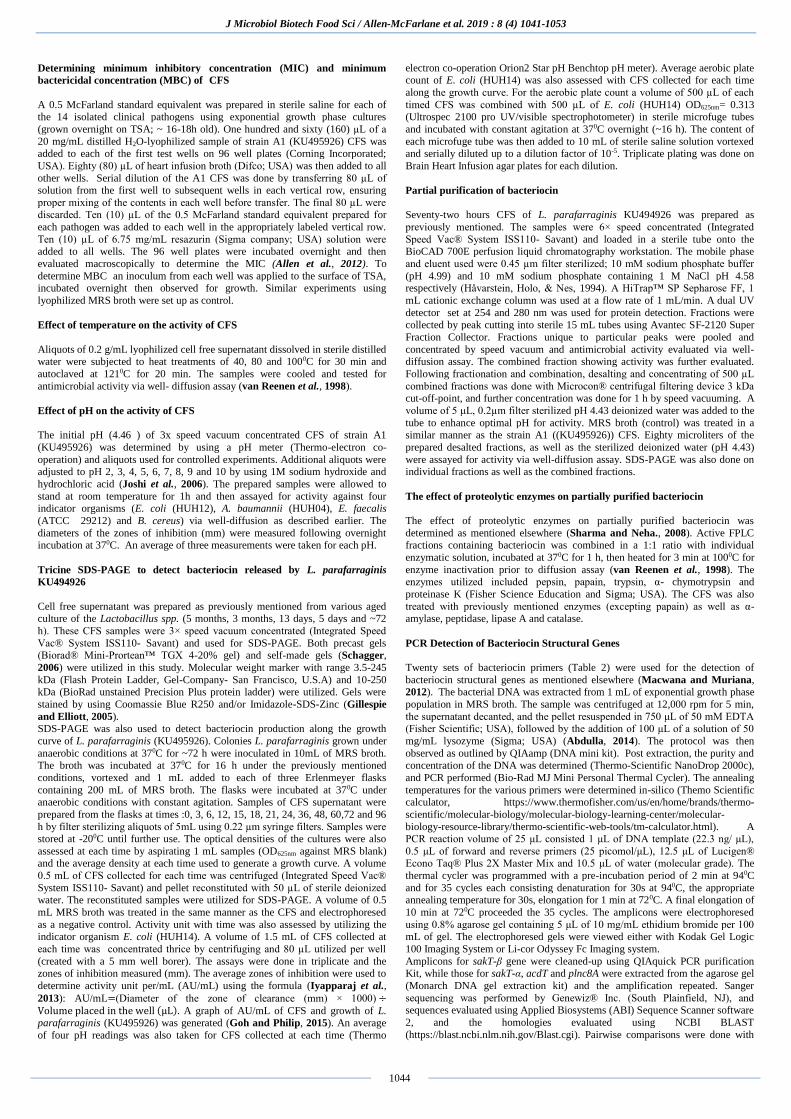
Figure 1 Shows three electron micrographs of Lactobacillus parafarraginis
(KU495926). A, the bacillary structure of this lactic acid bacteria along with numerous particles suspected to be secreted bacteriocins in the field (see arrows
in micrograph). B, increased magnification (50,000×) of potential secreted
bacteriocin. C, bacilli covered in mucoid material, suggesting exopolysaccharide production by the bacilli. The dimensions of the bacilli were estimated to be:
~0.75-2.75µm × ~0.25-0.75µm.
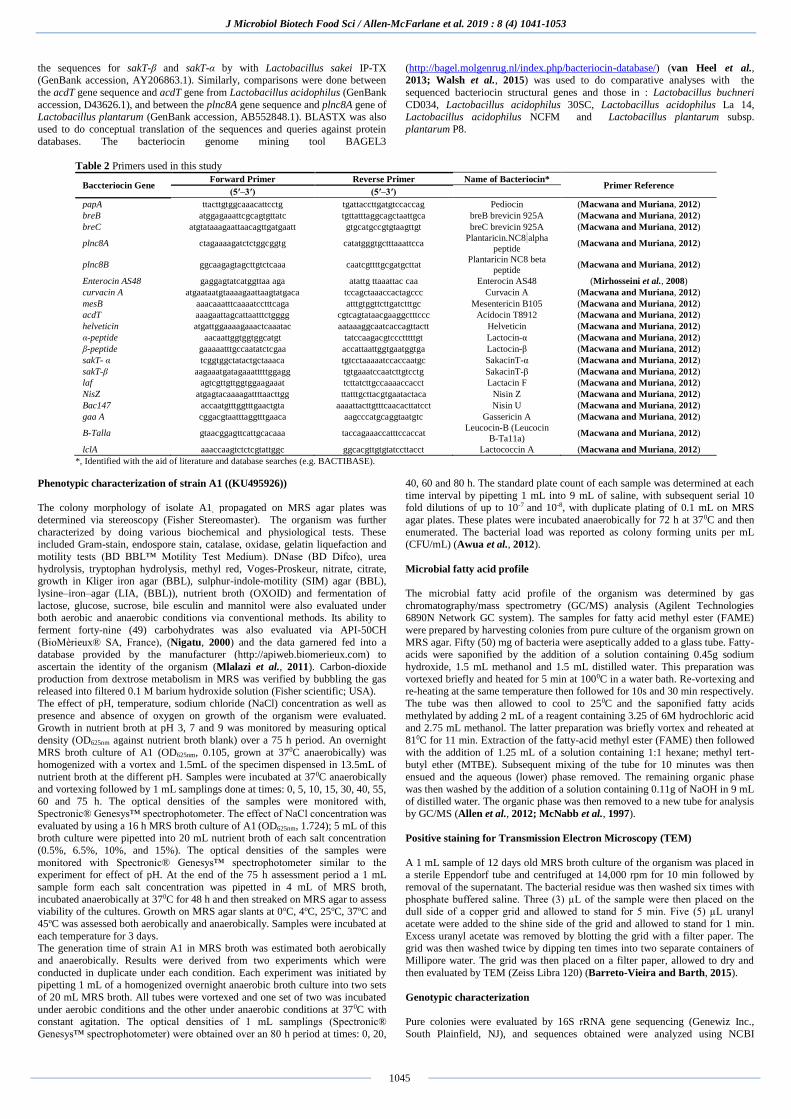
The bacilli have an estimated generation time of 5.4 h and 3.04 h respectively in
MRS broth under aerobic and anaerobic conditions (Figure 2. (a) and (b) and
Equation 1). Growth is best in 0.5% NaCl when compared to 6.5, 10 and 15 % (Figure 2. (c)). The bacilli were however halotolerant as they survived in 10%
NaCl for 75 h. When inocula from each NaCl concentration were incubated in
MRS broth and then plated on MRS agar plates growth was obtained on all plates excepting plates streaked with inocula related to 15% NaCl. Strain A1
(KU495926) was also found to grow best under acidic conditions (pH 3) when
compared to pH 7 and pH 9 (Figure 2. (d)).
Figure 2 Growth of L. parafarraginis ((KU495926)) under different physical
conditions; (a) and (b) show growth in MRS broth under aerobic and anaerobic
conditions respectively; (c) Optical density of growth in nutrient broth of different percent concentration of sodium chloride (0.5, 6.5, 10.0 and 15.0 %). (d)
Growth in nutrient broth of different pH (3, 7 and 9).
Equation 1 Calculations of Generation Time
Using the equation from (Madigan et al., 2012), Where: g = t/n; g = generation time of the exponential growing population; t =
time taken to give rise to n generations; n = number of generations during the
period of exponential growth. n=3.3 (log N - log N0) Where: N=final cell number, N0=initial cell number Where:
N = N02n
log N = log N0 + n log 2; log N - log N0 = n log 2;
n=log N- log N0 /log 2;
n=log N-log N0 / 0.301; n=3.3 (log N - log N0)
Generation time under aerobic conditions: g=t/n; g=20h/ 3.3 × log
(1010.419/109.290); g= 20h/ 3.3 × 1.129; g~ 5.4 h Generation time under anaerobic conditions: g=t/n; g=20h/ 3.3 × log
(1010.712/108.716); g= 20h/ 3.3 × 1.996; g~ 3.04 h
Genotypic characterization of strain A1 (KU495926)
Strain A1 (KU495926) was initially identified by API 50CH as 99.9% similar to Lactobacillus brevis; however, NCBI BLAST of 16S rRNA gene sequence
showed a 99% similarity to L. parafarraginis strain NRIC 0677. This was further
supported by MEGA6.06 (100% identity). As shown by the phylogenetic tree (Figure 3), there is no close alignment with Lactobacillus brevis.
Figure 3 Phylogenetic tree generated by utilizing the software MEGA 6.06
(bootstrapping, 1000×), shows that among several different species of
lactobacilli, strain A1 (KU495926) is more closely related to L. parafarraginis.
Inhibitory action of L. parafarraginis (KU495926)
Lactobacillus parafarraginis (KU495926) inhibited fourteen multidrug-resistant
and extended spectrum β-lactamase Gram-negative clinical isolates. These
include Escherichia coli (5), Pseudomonas aeruginosa (2), Acinetobacter baumannii (3), Enterobacter aerogenes (1), Proteus mirabilis (2) and Klebsiella
pneumoniae (1), as well as eleven other pathogens (Table 5, Figure 4). Two-
factor ANOVA without replication showed that there was no statistical significance among the average zones of inhibition for the indicator organisms (F
(24,24) =1.53; p = 0.15).There was however a significant difference between the
average zones of inhibition for spot and well-diffusion assay (F (1, 24) = 115.09; p < 0.05). Pearson correlation analysis however, showed a positive association
between spot and well-diffusion assay (r=0.3; r2= 9%), (Figure 5).
Figure 4 Photograph of three spot-tests illustrating the inhibitory action of L. parafarraginis (KU495926); (a) Inhibition of K. pneumoniae (HUH09), (b)
inhibition of S. pyogenes ATCC 12384, and (c) Inhibition of A.
baumannii/haemolyticus (HUH11).
J Microbiol Biotech Food Sci / Allen-McFarlane et al. 2019 : 8 (4) 1041-1053
1048
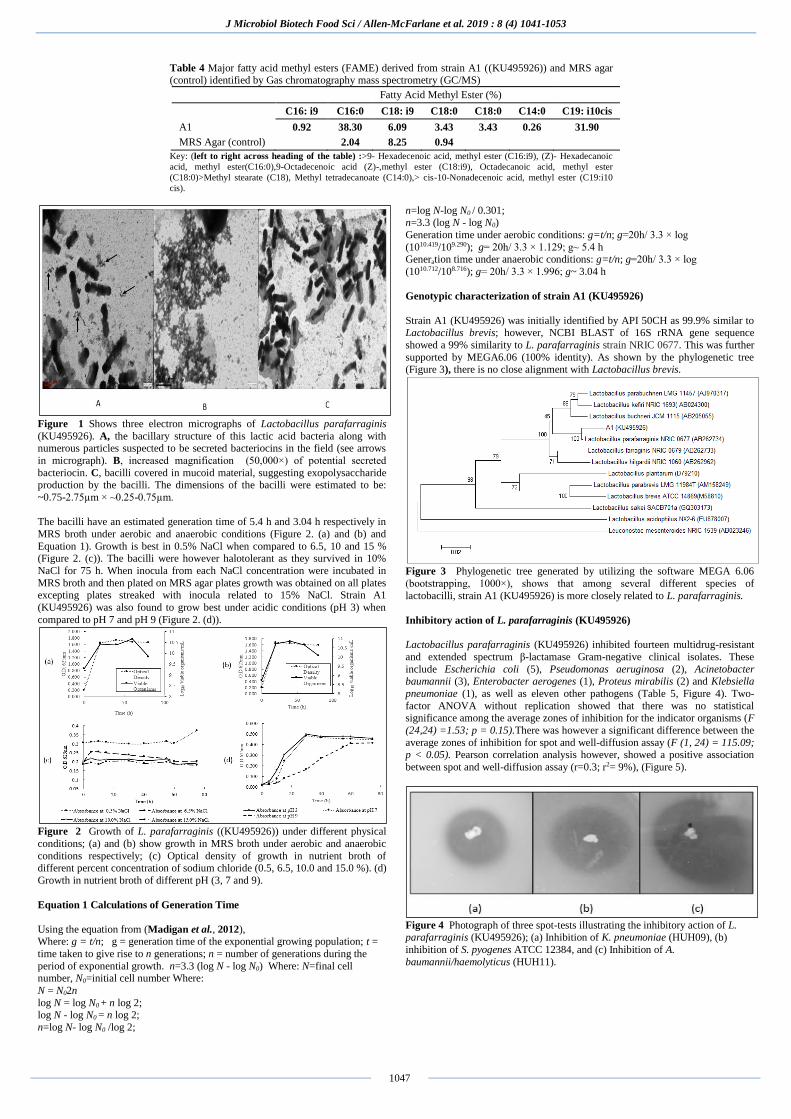
Table 5 Average zones of inhibition exhibited by L. parafarraginis KU495926 in spot-test and well-diffusion assays against twenty-five indicator organisms.
Indicator Organisms
Spot-Test Assay¥ Well-Diffusion Assay¥
Average Zones of
inhibition (mm)
Average Zones
of inhibition
(mm)
Pseudomonas aeruginosa (culture collection) ‡ 46.5 15.0
Serratia marcescens (culture collection) ‡ 34.5 12.3
Shigella sonnei ATCC 1060 31.3 12.3
Yersinia enterocolitica ATCC 23715 32.3 16.8
Streptococcus pyogenes ATCC 12384 30.3 11.8
Escherichia coli O157:H7 ATCC 35150 36.0 17.0
Bacillus cereus (culture collection) 28.3 10.0
Enterococcus faecalis ATCC 29212 19.0 11.0
Staphylococcus aureus ATCC 6538 19.5 16.8
Staphylococcus aureus (culture collection) ‡ 21.5 18.3
Listeria monocytogenes ATCC 7644 28.5 16.0
Proteus mirabilis (HUH01)b 23.3 15.8
Pseudomonas aeruginosa (HUH02)a 35.0 14.0
Proteus mirabilis (HUH03)a 28.3 11.5
Acinetobacter baumannii/haemolyticus (HUH04)a 23.8 11.8
Escherichia coli (HUH05)b 27.0 10.0
Pseudomonas aeruginosa (HUH06)a,c 27.3 17.0
Escherichia coli (HUH07)a,b 24.8 11.8
Acinetobacter baumannii/ haemolyticus (HUH08)a,c 39.0 20.0
Klebsiella pneumoniae (HUH09a,b) 14.8 10.8
Enterobacter aerogenes (HUH10a) 20.3 11.5
Acinetobacter baumannii/haemolyticus (HUH11)a,c 28.5 10.0
Escherichia coli (HUH12)a,b 28.5 13.5
Escherichia coli (HUH13)a,c 29.3 14.0
Escherichia coli (HUH14a,b) 23.3 14.0 a, MDR; b, ESBL; c, Carbapenem resistant (Carbapenem resistance is highlighted here in addition to MDR and ESBL as the carbapenems are usually the
antibiotic treatment of last resort for many infections caused by Gram-negative bacteria); ‡, Culture collection Dr. B.E. Eribo (Howard University, Biology
Department); † Isolated from clinical specimens at local Washington D.C. Hospital; ¥ An average of four (4) readings. Isolation sites: HUH01 = Incision;
HUH02, HUH03, HUH04, HUH07 & HUH13 = Urine; HUH14 = Urinary Bladder; HUH05 and HUH08 = Sacral decubitus; HUH06 = Right ankle;
HUH11 & HUH12 = Wound; HUH 09 = Peripheral blood.
Figure 5 Scatter diagram illustrating a low positive association between average
zones of inhibition of spot-test and well-diffusion assays for twenty-five indicator organisms.
Time lapse studies done with P. aeruginosa (HUH06) using fluorescence
microscopy and aerobic plate counts showed a sharp reduction in the number of
organisms alive in the presence of L. parafarraginis ((KU495926)) CFS by 24 h of exposure when compared to the control (MRS broth), (Figure 6). A similar
observation was made with Acinetobacter baumannii (HUH11). Flow cytometric
analyses with E. coli (HUH12), P. aeruginosa (HUH06) and Acinetobacter baumannii (HUH08), showed that the number of organisms alive at times 5 h
and 96 h in the presence of L. parafarraginis (KU495926) CFS decreased when
compared to the control (Figure 7). Further analysis using ANOVA indicated a significant difference between the overall average number of organisms alive in
L. parafarraginis (KU495926) CFS when compared to control, (F (1,2) =
77.067; p= 0.013; α = 0.05). The minimum inhibitory concentration (MIC) of L. parafarraginis (KU495926)
lyophilized CFS was ~20 mg/mL, and the minimum bactericidal concentration
(MBC) >20mg/mL.
Figure 6 EVOS fluorescence microscopy in parallel with standard plate count.
(A) Fluorescence microscopy (Magnification: 200X) and (B) aerobic plate count
showing decreased number of viable P. aeruginosa (HUH06) with time in L. parafarraginis KU495926 CSF when compared with the control experiment
(MRS broth). Similar results were obtained with Acinetobacter
baumannii/haemolyticus (HUH11).
0
5
10
15
20
25
0 10 20 30 40 50
Wel
l-d
iffu
sio
n A
ssay
(m
m)
Spot-Test Assay (mm)
r2=9%
J Microbiol Biotech Food Sci / Allen-McFarlane et al. 2019 : 8 (4) 1041-1053
1049
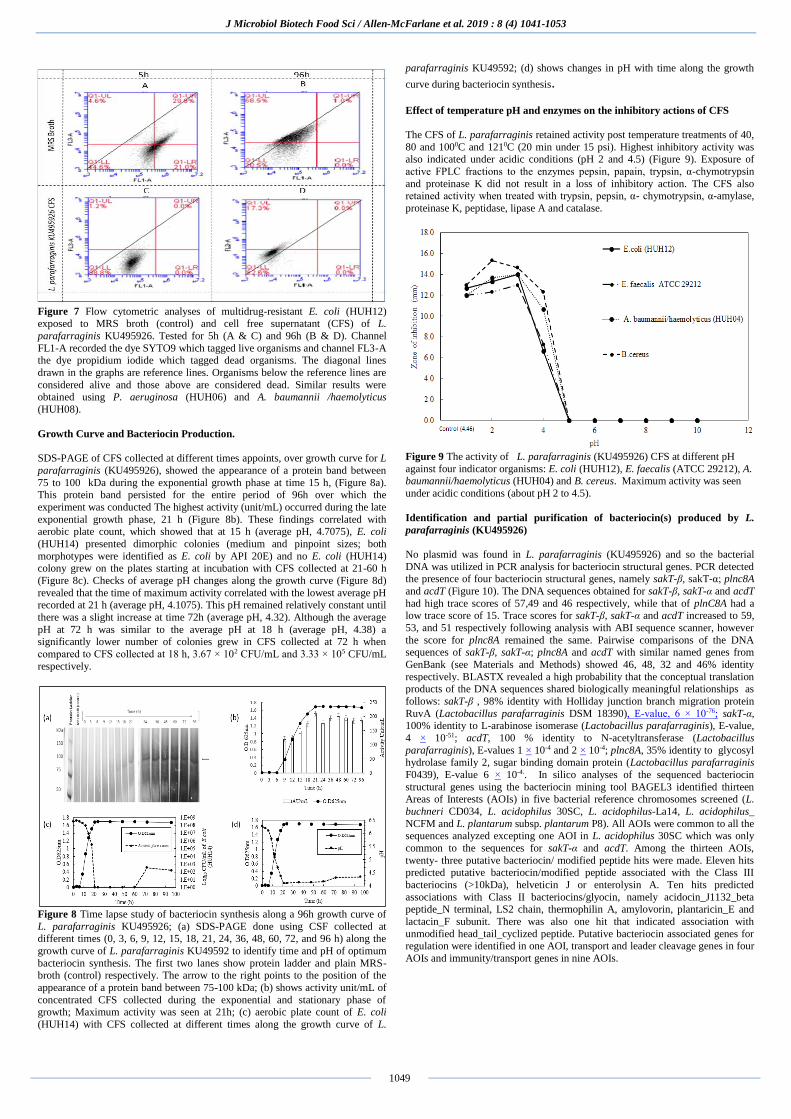
Figure 7 Flow cytometric analyses of multidrug-resistant E. coli (HUH12)
exposed to MRS broth (control) and cell free supernatant (CFS) of L.
parafarraginis KU495926. Tested for 5h (A & C) and 96h (B & D). Channel
FL1-A recorded the dye SYTO9 which tagged live organisms and channel FL3-A the dye propidium iodide which tagged dead organisms. The diagonal lines
drawn in the graphs are reference lines. Organisms below the reference lines are
considered alive and those above are considered dead. Similar results were obtained using P. aeruginosa (HUH06) and A. baumannii /haemolyticus
(HUH08).
Growth Curve and Bacteriocin Production.
SDS-PAGE of CFS collected at different times appoints, over growth curve for L
parafarraginis (KU495926), showed the appearance of a protein band between
75 to 100 kDa during the exponential growth phase at time 15 h, (Figure 8a). This protein band persisted for the entire period of 96h over which the
experiment was conducted The highest activity (unit/mL) occurred during the late
exponential growth phase, 21 h (Figure 8b). These findings correlated with aerobic plate count, which showed that at 15 h (average pH, 4.7075), E. coli
(HUH14) presented dimorphic colonies (medium and pinpoint sizes; both
morphotypes were identified as E. coli by API 20E) and no E. coli (HUH14) colony grew on the plates starting at incubation with CFS collected at 21-60 h
(Figure 8c). Checks of average pH changes along the growth curve (Figure 8d)
revealed that the time of maximum activity correlated with the lowest average pH recorded at 21 h (average pH, 4.1075). This pH remained relatively constant until
there was a slight increase at time 72h (average pH, 4.32). Although the average
pH at 72 h was similar to the average pH at 18 h (average pH, 4.38) a significantly lower number of colonies grew in CFS collected at 72 h when
compared to CFS collected at 18 h, 3.67 × 10² CFU/mL and 3.33 × 10⁵ CFU/mL
respectively.
Figure 8 Time lapse study of bacteriocin synthesis along a 96h growth curve of
L. parafarraginis KU495926; (a) SDS-PAGE done using CSF collected at different times (0, 3, 6, 9, 12, 15, 18, 21, 24, 36, 48, 60, 72, and 96 h) along the
growth curve of L. parafarraginis KU49592 to identify time and pH of optimum
bacteriocin synthesis. The first two lanes show protein ladder and plain MRS- broth (control) respectively. The arrow to the right points to the position of the
appearance of a protein band between 75-100 kDa; (b) shows activity unit/mL of
concentrated CFS collected during the exponential and stationary phase of growth; Maximum activity was seen at 21h; (c) aerobic plate count of E. coli
(HUH14) with CFS collected at different times along the growth curve of L.
parafarraginis KU49592; (d) shows changes in pH with time along the growth
curve during bacteriocin synthesis.
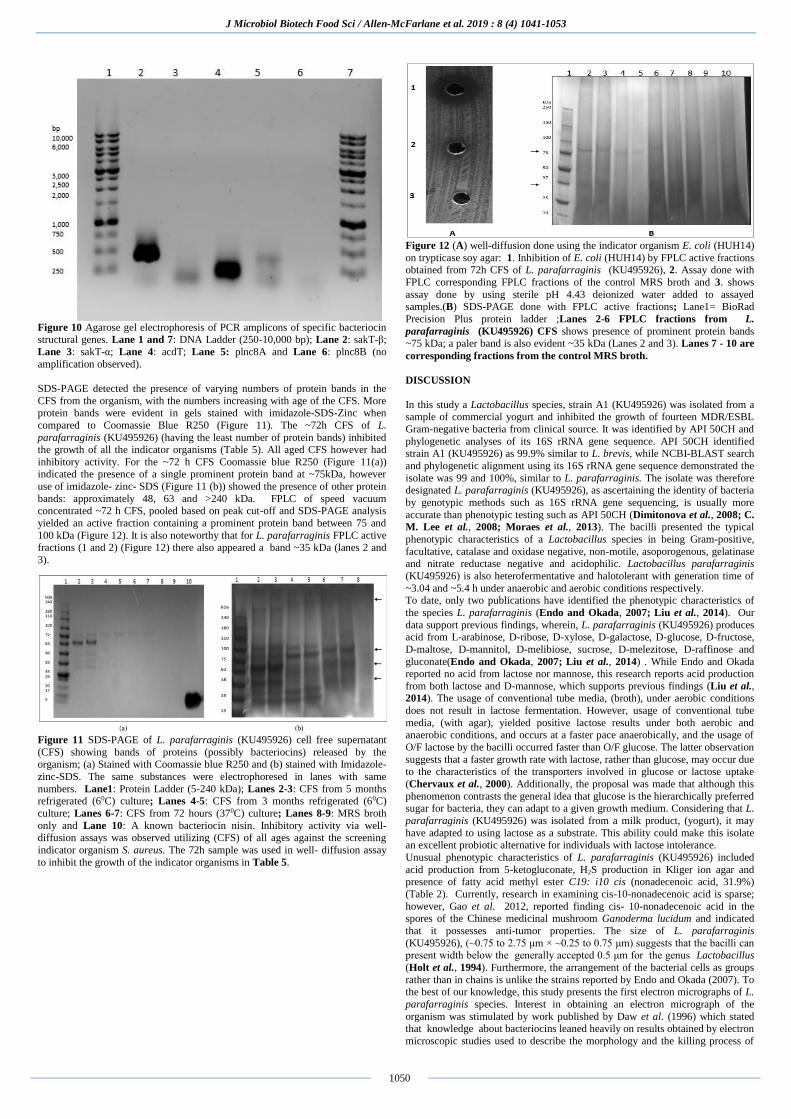
Effect of temperature pH and enzymes on the inhibitory actions of CFS
The CFS of L. parafarraginis retained activity post temperature treatments of 40,
80 and 1000C and 1210C (20 min under 15 psi). Highest inhibitory activity was also indicated under acidic conditions (pH 2 and 4.5) (Figure 9). Exposure of
active FPLC fractions to the enzymes pepsin, papain, trypsin, α-chymotrypsin
and proteinase K did not result in a loss of inhibitory action. The CFS also retained activity when treated with trypsin, pepsin, α- chymotrypsin, α-amylase,
proteinase K, peptidase, lipase A and catalase.
Figure 9 The activity of L. parafarraginis (KU495926) CFS at different pH
against four indicator organisms: E. coli (HUH12), E. faecalis (ATCC 29212), A. baumannii/haemolyticus (HUH04) and B. cereus. Maximum activity was seen
under acidic conditions (about pH 2 to 4.5).
Identification and partial purification of bacteriocin(s) produced by L.
parafarraginis (KU495926)
No plasmid was found in L. parafarraginis (KU495926) and so the bacterial
DNA was utilized in PCR analysis for bacteriocin structural genes. PCR detected the presence of four bacteriocin structural genes, namely sakT-β, sakT-α; plnc8A
and acdT (Figure 10). The DNA sequences obtained for sakT-β, sakT-α and acdT
had high trace scores of 57,49 and 46 respectively, while that of plnC8A had a low trace score of 15. Trace scores for sakT-β, sakT-α and acdT increased to 59,
53, and 51 respectively following analysis with ABI sequence scanner, however
the score for plnc8A remained the same. Pairwise comparisons of the DNA sequences of sakT-β, sakT-α; plnc8A and acdT with similar named genes from
GenBank (see Materials and Methods) showed 46, 48, 32 and 46% identity
respectively. BLASTX revealed a high probability that the conceptual translation products of the DNA sequences shared biologically meaningful relationships as
follows: sakT-β , 98% identity with Holliday junction branch migration protein
RuvA (Lactobacillus parafarraginis DSM 18390), E-value, 6 × 10-76; sakT-α, 100% identity to L-arabinose isomerase (Lactobacillus parafarraginis), E-value,
4 × 10-51; acdT, 100 % identity to N-acetyltransferase (Lactobacillus
parafarraginis), E-values 1 × 10⁻⁴ and 2 × 10⁻⁴; plnc8A, 35% identity to glycosyl
hydrolase family 2, sugar binding domain protein (Lactobacillus parafarraginis
F0439), E-value 6 × 10⁻⁴.. In silico analyses of the sequenced bacteriocin
structural genes using the bacteriocin mining tool BAGEL3 identified thirteen Areas of Interests (AOIs) in five bacterial reference chromosomes screened (L.
buchneri CD034, L. acidophilus 30SC, L. acidophilus-La14, L. acidophilus_
NCFM and L. plantarum subsp. plantarum P8). All AOIs were common to all the sequences analyzed excepting one AOI in L. acidophilus 30SC which was only
common to the sequences for sakT-α and acdT. Among the thirteen AOIs,
twenty- three putative bacteriocin/ modified peptide hits were made. Eleven hits predicted putative bacteriocin/modified peptide associated with the Class III
bacteriocins (>10kDa), helveticin J or enterolysin A. Ten hits predicted
associations with Class II bacteriocins/glyocin, namely acidocin_J1132_beta peptide_N terminal, LS2 chain, thermophilin A, amylovorin, plantaricin_E and
lactacin_F subunit. There was also one hit that indicated association with
unmodified head_tail_cyclized peptide. Putative bacteriocin associated genes for regulation were identified in one AOI, transport and leader cleavage genes in four
AOIs and immunity/transport genes in nine AOIs.
J Microbiol Biotech Food Sci / Allen-McFarlane et al. 2019 : 8 (4) 1041-1053
1050
Figure 10 Agarose gel electrophoresis of PCR amplicons of specific bacteriocin structural genes. Lane 1 and 7: DNA Ladder (250-10,000 bp); Lane 2: sakT-β;
Lane 3: sakT-α; Lane 4: acdT; Lane 5: plnc8A and Lane 6: plnc8B (no
amplification observed).
SDS-PAGE detected the presence of varying numbers of protein bands in the
CFS from the organism, with the numbers increasing with age of the CFS. More protein bands were evident in gels stained with imidazole-SDS-Zinc when
compared to Coomassie Blue R250 (Figure 11). The ~72h CFS of L.
parafarraginis (KU495926) (having the least number of protein bands) inhibited the growth of all the indicator organisms (Table 5). All aged CFS however had
inhibitory activity. For the ~72 h CFS Coomassie blue R250 (Figure 11(a)) indicated the presence of a single prominent protein band at ~75kDa, however
use of imidazole- zinc- SDS (Figure 11 (b)) showed the presence of other protein
bands: approximately 48, 63 and >240 kDa. FPLC of speed vacuum concentrated ~72 h CFS, pooled based on peak cut-off and SDS-PAGE analysis
yielded an active fraction containing a prominent protein band between 75 and
100 kDa (Figure 12). It is also noteworthy that for L. parafarraginis FPLC active
fractions (1 and 2) (Figure 12) there also appeared a band ~35 kDa (lanes 2 and
3).
Figure 11 SDS-PAGE of L. parafarraginis (KU495926) cell free supernatant
(CFS) showing bands of proteins (possibly bacteriocins) released by the
organism; (a) Stained with Coomassie blue R250 and (b) stained with Imidazole-
zinc-SDS. The same substances were electrophoresed in lanes with same
numbers. Lane1: Protein Ladder (5-240 kDa); Lanes 2-3: CFS from 5 months refrigerated (60C) culture; Lanes 4-5: CFS from 3 months refrigerated (60C)
culture; Lanes 6-7: CFS from 72 hours (370C) culture; Lanes 8-9: MRS broth
only and Lane 10: A known bacteriocin nisin. Inhibitory activity via well-diffusion assays was observed utilizing (CFS) of all ages against the screening
indicator organism S. aureus. The 72h sample was used in well- diffusion assay
to inhibit the growth of the indicator organisms in Table 5.
Figure 12 (A) well-diffusion done using the indicator organism E. coli (HUH14)
on trypticase soy agar: 1. Inhibition of E. coli (HUH14) by FPLC active fractions obtained from 72h CFS of L. parafarraginis (KU495926), 2. Assay done with
FPLC corresponding FPLC fractions of the control MRS broth and 3. shows
assay done by using sterile pH 4.43 deionized water added to assayed samples.(B) SDS-PAGE done with FPLC active fractions; Lane1= BioRad
Precision Plus protein ladder ;Lanes 2-6 FPLC fractions from L.
parafarraginis (KU495926) CFS shows presence of prominent protein bands ~75 kDa; a paler band is also evident ~35 kDa (Lanes 2 and 3). Lanes 7 - 10 are
corresponding fractions from the control MRS broth.
DISCUSSION
In this study a Lactobacillus species, strain A1 (KU495926) was isolated from a sample of commercial yogurt and inhibited the growth of fourteen MDR/ESBL
Gram-negative bacteria from clinical source. It was identified by API 50CH and
phylogenetic analyses of its 16S rRNA gene sequence. API 50CH identified strain A1 (KU495926) as 99.9% similar to L. brevis, while NCBI-BLAST search
and phylogenetic alignment using its 16S rRNA gene sequence demonstrated the
isolate was 99 and 100%, similar to L. parafarraginis. The isolate was therefore designated L. parafarraginis (KU495926), as ascertaining the identity of bacteria
by genotypic methods such as 16S rRNA gene sequencing, is usually more
accurate than phenotypic testing such as API 50CH (Dimitonova et al., 2008; C.
M. Lee et al., 2008; Moraes et al., 2013). The bacilli presented the typical
phenotypic characteristics of a Lactobacillus species in being Gram-positive,
facultative, catalase and oxidase negative, non-motile, asoporogenous, gelatinase and nitrate reductase negative and acidophilic. Lactobacillus parafarraginis
(KU495926) is also heterofermentative and halotolerant with generation time of
~3.04 and ~5.4 h under anaerobic and aerobic conditions respectively. To date, only two publications have identified the phenotypic characteristics of
the species L. parafarraginis (Endo and Okada, 2007; Liu et al., 2014). Our
data support previous findings, wherein, L. parafarraginis (KU495926) produces acid from L-arabinose, D-ribose, D-xylose, D-galactose, D-glucose, D-fructose,
D-maltose, D-mannitol, D-melibiose, sucrose, D-melezitose, D-raffinose and
gluconate(Endo and Okada, 2007; Liu et al., 2014) . While Endo and Okada reported no acid from lactose nor mannose, this research reports acid production
from both lactose and D-mannose, which supports previous findings (Liu et al., 2014). The usage of conventional tube media, (broth), under aerobic conditions
does not result in lactose fermentation. However, usage of conventional tube
media, (with agar), yielded positive lactose results under both aerobic and anaerobic conditions, and occurs at a faster pace anaerobically, and the usage of
O/F lactose by the bacilli occurred faster than O/F glucose. The latter observation
suggests that a faster growth rate with lactose, rather than glucose, may occur due
to the characteristics of the transporters involved in glucose or lactose uptake
(Chervaux et al., 2000). Additionally, the proposal was made that although this
phenomenon contrasts the general idea that glucose is the hierarchically preferred sugar for bacteria, they can adapt to a given growth medium. Considering that L.
parafarraginis (KU495926) was isolated from a milk product, (yogurt), it may
have adapted to using lactose as a substrate. This ability could make this isolate an excellent probiotic alternative for individuals with lactose intolerance.
Unusual phenotypic characteristics of L. parafarraginis (KU495926) included
acid production from 5-ketogluconate, H2S production in Kliger ion agar and presence of fatty acid methyl ester C19: i10 cis (nonadecenoic acid, 31.9%)
(Table 2). Currently, research in examining cis-10-nonadecenoic acid is sparse;
however, Gao et al. 2012, reported finding cis- 10-nonadecenoic acid in the spores of the Chinese medicinal mushroom Ganoderma lucidum and indicated
that it possesses anti-tumor properties. The size of L. parafarraginis
(KU495926), (~0.75 to 2.75 μm × ~0.25 to 0.75 μm) suggests that the bacilli can present width below the generally accepted 0.5 μm for the genus Lactobacillus
(Holt et al., 1994). Furthermore, the arrangement of the bacterial cells as groups
rather than in chains is unlike the strains reported by Endo and Okada (2007). To
the best of our knowledge, this study presents the first electron micrographs of L.
parafarraginis species. Interest in obtaining an electron micrograph of the
organism was stimulated by work published by Daw et al. (1996) which stated that knowledge about bacteriocins leaned heavily on results obtained by electron
microscopic studies used to describe the morphology and the killing process of
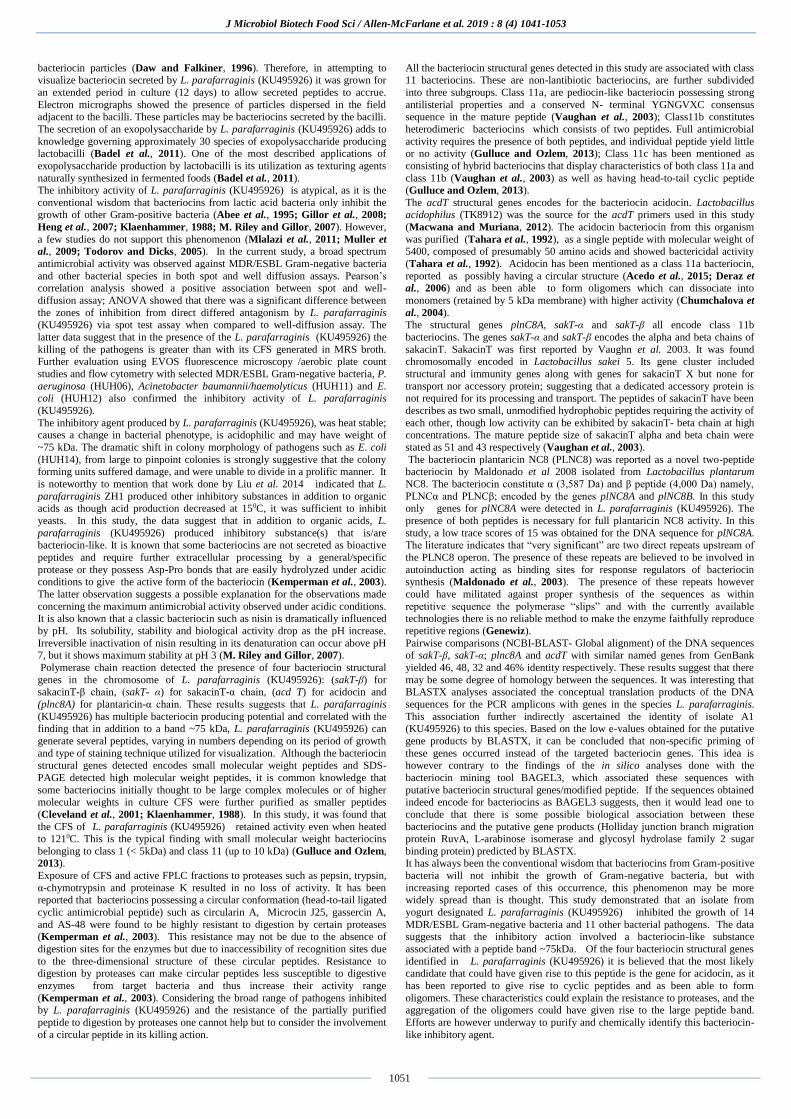
J Microbiol Biotech Food Sci / Allen-McFarlane et al. 2019 : 8 (4) 1041-1053
1051
bacteriocin particles (Daw and Falkiner, 1996). Therefore, in attempting to visualize bacteriocin secreted by L. parafarraginis (KU495926) it was grown for
an extended period in culture (12 days) to allow secreted peptides to accrue.
Electron micrographs showed the presence of particles dispersed in the field adjacent to the bacilli. These particles may be bacteriocins secreted by the bacilli.
The secretion of an exopolysaccharide by L. parafarraginis (KU495926) adds to
knowledge governing approximately 30 species of exopolysaccharide producing lactobacilli (Badel et al., 2011). One of the most described applications of
exopolysaccharide production by lactobacilli is its utilization as texturing agents
naturally synthesized in fermented foods (Badel et al., 2011). The inhibitory activity of L. parafarraginis (KU495926) is atypical, as it is the
conventional wisdom that bacteriocins from lactic acid bacteria only inhibit the growth of other Gram-positive bacteria (Abee et al., 1995; Gillor et al., 2008;
Heng et al., 2007; Klaenhammer, 1988; M. Riley and Gillor, 2007). However,
a few studies do not support this phenomenon (Mlalazi et al., 2011; Muller et
al., 2009; Todorov and Dicks, 2005). In the current study, a broad spectrum
antimicrobial activity was observed against MDR/ESBL Gram-negative bacteria
and other bacterial species in both spot and well diffusion assays. Pearson’s correlation analysis showed a positive association between spot and well-
diffusion assay; ANOVA showed that there was a significant difference between
the zones of inhibition from direct differed antagonism by L. parafarraginis
(KU495926) via spot test assay when compared to well-diffusion assay. The
latter data suggest that in the presence of the L. parafarraginis (KU495926) the
killing of the pathogens is greater than with its CFS generated in MRS broth. Further evaluation using EVOS fluorescence microscopy /aerobic plate count
studies and flow cytometry with selected MDR/ESBL Gram-negative bacteria, P.
aeruginosa (HUH06), Acinetobacter baumannii/haemolyticus (HUH11) and E. coli (HUH12) also confirmed the inhibitory activity of L. parafarraginis
(KU495926).
The inhibitory agent produced by L. parafarraginis (KU495926), was heat stable; causes a change in bacterial phenotype, is acidophilic and may have weight of
~75 kDa. The dramatic shift in colony morphology of pathogens such as E. coli
(HUH14), from large to pinpoint colonies is strongly suggestive that the colony forming units suffered damage, and were unable to divide in a prolific manner. It
is noteworthy to mention that work done by Liu et al. 2014 indicated that L.
parafarraginis ZH1 produced other inhibitory substances in addition to organic acids as though acid production decreased at 150C, it was sufficient to inhibit
yeasts. In this study, the data suggest that in addition to organic acids, L.
parafarraginis (KU495926) produced inhibitory substance(s) that is/are
bacteriocin-like. It is known that some bacteriocins are not secreted as bioactive
peptides and require further extracellular processing by a general/specific
protease or they possess Asp-Pro bonds that are easily hydrolyzed under acidic conditions to give the active form of the bacteriocin (Kemperman et al., 2003).
The latter observation suggests a possible explanation for the observations made
concerning the maximum antimicrobial activity observed under acidic conditions. It is also known that a classic bacteriocin such as nisin is dramatically influenced
by pH. Its solubility, stability and biological activity drop as the pH increase.
Irreversible inactivation of nisin resulting in its denaturation can occur above pH 7, but it shows maximum stability at pH 3 (M. Riley and Gillor, 2007).
Polymerase chain reaction detected the presence of four bacteriocin structural
genes in the chromosome of L. parafarraginis (KU495926): (sakT-β) for sakacinT-β chain, (sakT- α) for sakacinT-α chain, (acd T) for acidocin and
(plnc8A) for plantaricin-α chain. These results suggests that L. parafarraginis
(KU495926) has multiple bacteriocin producing potential and correlated with the finding that in addition to a band ~75 kDa, L. parafarraginis (KU495926) can
generate several peptides, varying in numbers depending on its period of growth
and type of staining technique utilized for visualization. Although the bacteriocin
structural genes detected encodes small molecular weight peptides and SDS-
PAGE detected high molecular weight peptides, it is common knowledge that
some bacteriocins initially thought to be large complex molecules or of higher molecular weights in culture CFS were further purified as smaller peptides
(Cleveland et al., 2001; Klaenhammer, 1988). In this study, it was found that
the CFS of L. parafarraginis (KU495926) retained activity even when heated to 1210C. This is the typical finding with small molecular weight bacteriocins
belonging to class 1 (< 5kDa) and class 11 (up to 10 kDa) (Gulluce and Ozlem, 2013).
Exposure of CFS and active FPLC fractions to proteases such as pepsin, trypsin,
α-chymotrypsin and proteinase K resulted in no loss of activity. It has been reported that bacteriocins possessing a circular conformation (head-to-tail ligated
cyclic antimicrobial peptide) such as circularin A, Microcin J25, gassercin A,
and AS-48 were found to be highly resistant to digestion by certain proteases (Kemperman et al., 2003). This resistance may not be due to the absence of
digestion sites for the enzymes but due to inaccessibility of recognition sites due
to the three-dimensional structure of these circular peptides. Resistance to digestion by proteases can make circular peptides less susceptible to digestive
enzymes from target bacteria and thus increase their activity range
(Kemperman et al., 2003). Considering the broad range of pathogens inhibited by L. parafarraginis (KU495926) and the resistance of the partially purified
peptide to digestion by proteases one cannot help but to consider the involvement
of a circular peptide in its killing action.
All the bacteriocin structural genes detected in this study are associated with class 11 bacteriocins. These are non-lantibiotic bacteriocins, are further subdivided
into three subgroups. Class 11a, are pediocin-like bacteriocin possessing strong
antilisterial properties and a conserved N- terminal YGNGVXC consensus sequence in the mature peptide (Vaughan et al., 2003); Class11b constitutes
heterodimeric bacteriocins which consists of two peptides. Full antimicrobial
activity requires the presence of both peptides, and individual peptide yield little or no activity (Gulluce and Ozlem, 2013); Class 11c has been mentioned as
consisting of hybrid bacteriocins that display characteristics of both class 11a and
class 11b (Vaughan et al., 2003) as well as having head-to-tail cyclic peptide (Gulluce and Ozlem, 2013).
The acdT structural genes encodes for the bacteriocin acidocin. Lactobacillus acidophilus (TK8912) was the source for the acdT primers used in this study
(Macwana and Muriana, 2012). The acidocin bacteriocin from this organism
was purified (Tahara et al., 1992), as a single peptide with molecular weight of 5400, composed of presumably 50 amino acids and showed bactericidal activity
(Tahara et al., 1992). Acidocin has been mentioned as a class 11a bacteriocin,
reported as possibly having a circular structure (Acedo et al., 2015; Deraz et
al., 2006) and as been able to form oligomers which can dissociate into
monomers (retained by 5 kDa membrane) with higher activity (Chumchalova et
al., 2004).
The structural genes plnC8A, sakT-α and sakT-β all encode class 11b
bacteriocins. The genes sakT-α and sakT-β encodes the alpha and beta chains of
sakacinT. SakacinT was first reported by Vaughn et al. 2003. It was found chromosomally encoded in Lactobacillus sakei 5. Its gene cluster included
structural and immunity genes along with genes for sakacinT X but none for
transport nor accessory protein; suggesting that a dedicated accessory protein is not required for its processing and transport. The peptides of sakacinT have been
describes as two small, unmodified hydrophobic peptides requiring the activity of
each other, though low activity can be exhibited by sakacinT- beta chain at high concentrations. The mature peptide size of sakacinT alpha and beta chain were
stated as 51 and 43 respectively (Vaughan et al., 2003).
The bacteriocin plantaricin NC8 (PLNC8) was reported as a novel two-peptide bacteriocin by Maldonado et al 2008 isolated from Lactobacillus plantarum
NC8. The bacteriocin constitute α (3,587 Da) and β peptide (4,000 Da) namely,
PLNCα and PLNCβ; encoded by the genes plNC8A and plNC8B. In this study only genes for plNC8A were detected in L. parafarraginis (KU495926). The
presence of both peptides is necessary for full plantaricin NC8 activity. In this
study, a low trace scores of 15 was obtained for the DNA sequence for plNC8A.
The literature indicates that “very significant” are two direct repeats upstream of
the PLNC8 operon. The presence of these repeats are believed to be involved in
autoinduction acting as binding sites for response regulators of bacteriocin synthesis (Maldonado et al., 2003). The presence of these repeats however
could have militated against proper synthesis of the sequences as within
repetitive sequence the polymerase “slips” and with the currently available technologies there is no reliable method to make the enzyme faithfully reproduce
repetitive regions (Genewiz).
Pairwise comparisons (NCBI-BLAST- Global alignment) of the DNA sequences of sakT-β, sakT-α; plnc8A and acdT with similar named genes from GenBank
yielded 46, 48, 32 and 46% identity respectively. These results suggest that there
may be some degree of homology between the sequences. It was interesting that BLASTX analyses associated the conceptual translation products of the DNA
sequences for the PCR amplicons with genes in the species L. parafarraginis.
This association further indirectly ascertained the identity of isolate A1 (KU495926) to this species. Based on the low e-values obtained for the putative
gene products by BLASTX, it can be concluded that non-specific priming of
these genes occurred instead of the targeted bacteriocin genes. This idea is
however contrary to the findings of the in silico analyses done with the
bacteriocin mining tool BAGEL3, which associated these sequences with
putative bacteriocin structural genes/modified peptide. If the sequences obtained indeed encode for bacteriocins as BAGEL3 suggests, then it would lead one to
conclude that there is some possible biological association between these
bacteriocins and the putative gene products (Holliday junction branch migration protein RuvA, L-arabinose isomerase and glycosyl hydrolase family 2 sugar
binding protein) predicted by BLASTX. It has always been the conventional wisdom that bacteriocins from Gram-positive
bacteria will not inhibit the growth of Gram-negative bacteria, but with
increasing reported cases of this occurrence, this phenomenon may be more widely spread than is thought. This study demonstrated that an isolate from
yogurt designated L. parafarraginis (KU495926) inhibited the growth of 14
MDR/ESBL Gram-negative bacteria and 11 other bacterial pathogens. The data suggests that the inhibitory action involved a bacteriocin-like substance
associated with a peptide band ~75kDa. Of the four bacteriocin structural genes
identified in L. parafarraginis (KU495926) it is believed that the most likely candidate that could have given rise to this peptide is the gene for acidocin, as it
has been reported to give rise to cyclic peptides and as been able to form
oligomers. These characteristics could explain the resistance to proteases, and the aggregation of the oligomers could have given rise to the large peptide band.
Efforts are however underway to purify and chemically identify this bacteriocin-
like inhibitory agent.
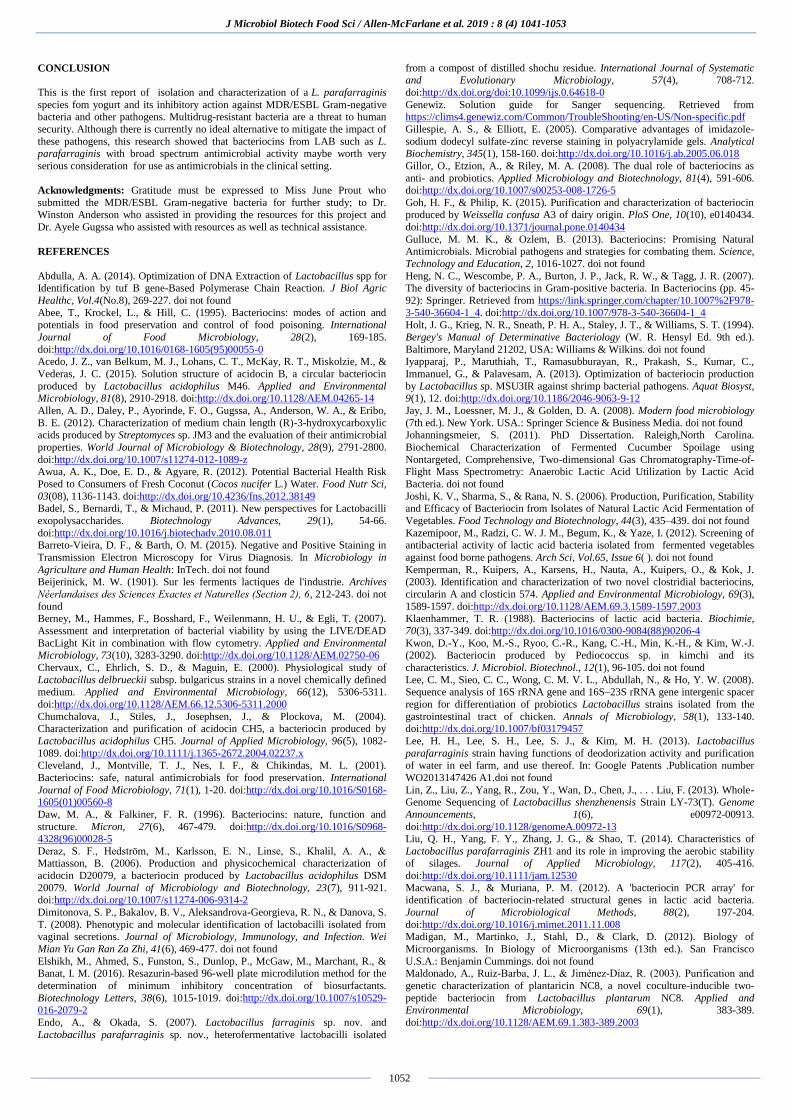
J Microbiol Biotech Food Sci / Allen-McFarlane et al. 2019 : 8 (4) 1041-1053
1052
CONCLUSION
This is the first report of isolation and characterization of a L. parafarraginis
species fom yogurt and its inhibitory action against MDR/ESBL Gram-negative bacteria and other pathogens. Multidrug-resistant bacteria are a threat to human
security. Although there is currently no ideal alternative to mitigate the impact of
these pathogens, this research showed that bacteriocins from LAB such as L. parafarraginis with broad spectrum antimicrobial activity maybe worth very
serious consideration for use as antimicrobials in the clinical setting.
Acknowledgments: Gratitude must be expressed to Miss June Prout who
submitted the MDR/ESBL Gram-negative bacteria for further study; to Dr. Winston Anderson who assisted in providing the resources for this project and
Dr. Ayele Gugssa who assisted with resources as well as technical assistance.
REFERENCES
Abdulla, A. A. (2014). Optimization of DNA Extraction of Lactobacillus spp for Identification by tuf B gene-Based Polymerase Chain Reaction. J Biol Agric
Healthc, Vol.4(No.8), 269-227. doi not found
Abee, T., Krockel, L., & Hill, C. (1995). Bacteriocins: modes of action and
potentials in food preservation and control of food poisoning. International
Journal of Food Microbiology, 28(2), 169-185.
doi:http://dx.doi.org/10.1016/0168-1605(95)00055-0 Acedo, J. Z., van Belkum, M. J., Lohans, C. T., McKay, R. T., Miskolzie, M., &
Vederas, J. C. (2015). Solution structure of acidocin B, a circular bacteriocin
produced by Lactobacillus acidophilus M46. Applied and Environmental Microbiology, 81(8), 2910-2918. doi:http://dx.doi.org/10.1128/AEM.04265-14
Allen, A. D., Daley, P., Ayorinde, F. O., Gugssa, A., Anderson, W. A., & Eribo,
B. E. (2012). Characterization of medium chain length (R)-3-hydroxycarboxylic acids produced by Streptomyces sp. JM3 and the evaluation of their antimicrobial
properties. World Journal of Microbiology & Biotechnology, 28(9), 2791-2800.
doi:http://dx.doi.org/10.1007/s11274-012-1089-z Awua, A. K., Doe, E. D., & Agyare, R. (2012). Potential Bacterial Health Risk
Posed to Consumers of Fresh Coconut (Cocos nucifer L.) Water. Food Nutr Sci,
03(08), 1136-1143. doi:http://dx.doi.org/10.4236/fns.2012.38149 Badel, S., Bernardi, T., & Michaud, P. (2011). New perspectives for Lactobacilli
exopolysaccharides. Biotechnology Advances, 29(1), 54-66.
doi:http://dx.doi.org/10.1016/j.biotechadv.2010.08.011
Barreto-Vieira, D. F., & Barth, O. M. (2015). Negative and Positive Staining in
Transmission Electron Microscopy for Virus Diagnosis. In Microbiology in
Agriculture and Human Health: InTech. doi not found Beijerinick, M. W. (1901). Sur les ferments lactiques de l'industrie. Archives
Néerlandaises des Sciences Exactes et Naturelles (Section 2), 6, 212-243. doi not
found Berney, M., Hammes, F., Bosshard, F., Weilenmann, H. U., & Egli, T. (2007).
Assessment and interpretation of bacterial viability by using the LIVE/DEAD
BacLight Kit in combination with flow cytometry. Applied and Environmental Microbiology, 73(10), 3283-3290. doi:http://dx.doi.org/10.1128/AEM.02750-06
Chervaux, C., Ehrlich, S. D., & Maguin, E. (2000). Physiological study of
Lactobacillus delbrueckii subsp. bulgaricus strains in a novel chemically defined medium. Applied and Environmental Microbiology, 66(12), 5306-5311.
doi:http://dx.doi.org/10.1128/AEM.66.12.5306-5311.2000
Chumchalova, J., Stiles, J., Josephsen, J., & Plockova, M. (2004). Characterization and purification of acidocin CH5, a bacteriocin produced by
Lactobacillus acidophilus CH5. Journal of Applied Microbiology, 96(5), 1082-
1089. doi:http://dx.doi.org/10.1111/j.1365-2672.2004.02237.x
Cleveland, J., Montville, T. J., Nes, I. F., & Chikindas, M. L. (2001).
Bacteriocins: safe, natural antimicrobials for food preservation. International
Journal of Food Microbiology, 71(1), 1-20. doi:http://dx.doi.org/10.1016/S0168-1605(01)00560-8
Daw, M. A., & Falkiner, F. R. (1996). Bacteriocins: nature, function and
structure. Micron, 27(6), 467-479. doi:http://dx.doi.org/10.1016/S0968-4328(96)00028-5
Deraz, S. F., Hedström, M., Karlsson, E. N., Linse, S., Khalil, A. A., & Mattiasson, B. (2006). Production and physicochemical characterization of
acidocin D20079, a bacteriocin produced by Lactobacillus acidophilus DSM
20079. World Journal of Microbiology and Biotechnology, 23(7), 911-921. doi:http://dx.doi.org/10.1007/s11274-006-9314-2
Dimitonova, S. P., Bakalov, B. V., Aleksandrova-Georgieva, R. N., & Danova, S.
T. (2008). Phenotypic and molecular identification of lactobacilli isolated from vaginal secretions. Journal of Microbiology, Immunology, and Infection. Wei
Mian Yu Gan Ran Za Zhi, 41(6), 469-477. doi not found
Elshikh, M., Ahmed, S., Funston, S., Dunlop, P., McGaw, M., Marchant, R., & Banat, I. M. (2016). Resazurin-based 96-well plate microdilution method for the
determination of minimum inhibitory concentration of biosurfactants.
Biotechnology Letters, 38(6), 1015-1019. doi:http://dx.doi.org/10.1007/s10529-016-2079-2
Endo, A., & Okada, S. (2007). Lactobacillus farraginis sp. nov. and
Lactobacillus parafarraginis sp. nov., heterofermentative lactobacilli isolated
from a compost of distilled shochu residue. International Journal of Systematic and Evolutionary Microbiology, 57(4), 708-712.
doi:http://dx.doi.org/doi:10.1099/ijs.0.64618-0
Genewiz. Solution guide for Sanger sequencing. Retrieved from https://clims4.genewiz.com/Common/TroubleShooting/en-US/Non-specific.pdf
Gillespie, A. S., & Elliott, E. (2005). Comparative advantages of imidazole-
sodium dodecyl sulfate-zinc reverse staining in polyacrylamide gels. Analytical Biochemistry, 345(1), 158-160. doi:http://dx.doi.org/10.1016/j.ab.2005.06.018
Gillor, O., Etzion, A., & Riley, M. A. (2008). The dual role of bacteriocins as
anti- and probiotics. Applied Microbiology and Biotechnology, 81(4), 591-606. doi:http://dx.doi.org/10.1007/s00253-008-1726-5
Goh, H. F., & Philip, K. (2015). Purification and characterization of bacteriocin produced by Weissella confusa A3 of dairy origin. PloS One, 10(10), e0140434.
doi:http://dx.doi.org/10.1371/journal.pone.0140434
Gulluce, M. M. K., & Ozlem, B. (2013). Bacteriocins: Promising Natural Antimicrobials. Microbial pathogens and strategies for combating them. Science,
Technology and Education, 2, 1016-1027. doi not found
Heng, N. C., Wescombe, P. A., Burton, J. P., Jack, R. W., & Tagg, J. R. (2007). The diversity of bacteriocins in Gram-positive bacteria. In Bacteriocins (pp. 45-
92): Springer. Retrieved from https://link.springer.com/chapter/10.1007%2F978-
3-540-36604-1_4. doi:http://dx.doi.org/10.1007/978-3-540-36604-1_4
Holt, J. G., Krieg, N. R., Sneath, P. H. A., Staley, J. T., & Williams, S. T. (1994).
Bergey's Manual of Determinative Bacteriology (W. R. Hensyl Ed. 9th ed.).
Baltimore, Maryland 21202, USA: Williams & Wilkins. doi not found Iyapparaj, P., Maruthiah, T., Ramasubburayan, R., Prakash, S., Kumar, C.,
Immanuel, G., & Palavesam, A. (2013). Optimization of bacteriocin production
by Lactobacillus sp. MSU3IR against shrimp bacterial pathogens. Aquat Biosyst, 9(1), 12. doi:http://dx.doi.org/10.1186/2046-9063-9-12
Jay, J. M., Loessner, M. J., & Golden, D. A. (2008). Modern food microbiology
(7th ed.). New York. USA.: Springer Science & Business Media. doi not found Johanningsmeier, S. (2011). PhD Dissertation. Raleigh,North Carolina.
Biochemical Characterization of Fermented Cucumber Spoilage using
Nontargeted, Comprehensive, Two-dimensional Gas Chromatography-Time-of-Flight Mass Spectrometry: Anaerobic Lactic Acid Utilization by Lactic Acid
Bacteria. doi not found
Joshi, K. V., Sharma, S., & Rana, N. S. (2006). Production, Purification, Stability and Efficacy of Bacteriocin from Isolates of Natural Lactic Acid Fermentation of
Vegetables. Food Technology and Biotechnology, 44(3), 435–439. doi not found
Kazemipoor, M., Radzi, C. W. J. M., Begum, K., & Yaze, I. (2012). Screening of
antibacterial activity of lactic acid bacteria isolated from fermented vegetables
against food borne pathogens. Arch Sci, Vol.65, Issue 6( ). doi not found
Kemperman, R., Kuipers, A., Karsens, H., Nauta, A., Kuipers, O., & Kok, J. (2003). Identification and characterization of two novel clostridial bacteriocins,
circularin A and closticin 574. Applied and Environmental Microbiology, 69(3),
1589-1597. doi:http://dx.doi.org/10.1128/AEM.69.3.1589-1597.2003 Klaenhammer, T. R. (1988). Bacteriocins of lactic acid bacteria. Biochimie,
70(3), 337-349. doi:http://dx.doi.org/10.1016/0300-9084(88)90206-4
Kwon, D.-Y., Koo, M.-S., Ryoo, C.-R., Kang, C.-H., Min, K.-H., & Kim, W.-J. (2002). Bacteriocin produced by Pediococcus sp. in kimchi and its
characteristics. J. Microbiol. Biotechnol., 12(1), 96-105. doi not found
Lee, C. M., Sieo, C. C., Wong, C. M. V. L., Abdullah, N., & Ho, Y. W. (2008). Sequence analysis of 16S rRNA gene and 16S–23S rRNA gene intergenic spacer
region for differentiation of probiotics Lactobacillus strains isolated from the
gastrointestinal tract of chicken. Annals of Microbiology, 58(1), 133-140. doi:http://dx.doi.org/10.1007/bf03179457
Lee, H. H., Lee, S. H., Lee, S. J., & Kim, M. H. (2013). Lactobacillus
parafarraginis strain having functions of deodorization activity and purification
of water in eel farm, and use thereof. In: Google Patents .Publication number
WO2013147426 A1.doi not found
Lin, Z., Liu, Z., Yang, R., Zou, Y., Wan, D., Chen, J., . . . Liu, F. (2013). Whole-Genome Sequencing of Lactobacillus shenzhenensis Strain LY-73(T). Genome
Announcements, 1(6), e00972-00913.
doi:http://dx.doi.org/10.1128/genomeA.00972-13 Liu, Q. H., Yang, F. Y., Zhang, J. G., & Shao, T. (2014). Characteristics of
Lactobacillus parafarraginis ZH1 and its role in improving the aerobic stability of silages. Journal of Applied Microbiology, 117(2), 405-416.
doi:http://dx.doi.org/10.1111/jam.12530
Macwana, S. J., & Muriana, P. M. (2012). A 'bacteriocin PCR array' for identification of bacteriocin-related structural genes in lactic acid bacteria.
Journal of Microbiological Methods, 88(2), 197-204.
doi:http://dx.doi.org/10.1016/j.mimet.2011.11.008 Madigan, M., Martinko, J., Stahl, D., & Clark, D. (2012). Biology of
Microorganisms. In Biology of Microorganisms (13th ed.). San Francisco
U.S.A.: Benjamin Cummings. doi not found Maldonado, A., Ruiz-Barba, J. L., & Jiménez-Díaz, R. (2003). Purification and
genetic characterization of plantaricin NC8, a novel coculture-inducible two-
peptide bacteriocin from Lactobacillus plantarum NC8. Applied and Environmental Microbiology, 69(1), 383-389.
doi:http://dx.doi.org/10.1128/AEM.69.1.383-389.2003
J Microbiol Biotech Food Sci / Allen-McFarlane et al. 2019 : 8 (4) 1041-1053
1053
McFarland, J. (1907). The nephelometer: an instrument for estimating the number of bacteria in suspensions used for calculating the opsonic index and for
vaccines. Journal of the American Medical Association, XLIX(14), 1176-1178.
doi:http://dx.doi.org/10.1001/jama.1907.25320140022001f McNabb, A., Shuttleworth, R., Behme, R., & Colby, W. D. (1997). Fatty acid
characterization of rapidly growing pathogenic aerobic actinomycetes as a means
of identification. Journal of Clinical Microbiology, 35(6), 1361-1368. doi not found
Mirhosseini, M., Iraj, N., Giti, E., & Manouchehr, T. (2008). Culture-Dependent
and Culture-Independent Qualitative Analysis of Dairy Products for Bacteriocin Production by Lactic Acid Bacteria. World Appl
Sci J, 5(1), 20-24. doi not found Mlalazi, M., Winslow, A. R., Beaubrun, J. J.-G., & Eribo, B. E. (2011).
Occurrence of Pediocin PA-1AcH-Like Bacteriocin in Native Non-starter
Lactobacillus casei, Lactobacillus paracasei and Lactobacillus rhamnosus from retail Ched.pdf. Internet Journal of Food Safety, 13, 325-331. doi not found
Moraes, P. M., Perin, L. M., Silva Júnior, A., & Nero, L. A. (2013). Comparison
of phenotypic and molecular tests to identify lactic acid bacteria. Brazilian Journal of Microbiology, 44(1), 109-112. doi not found
Moretro, T., Hagen, B. F., & Axelsson, L. (1998). A new, completely defined
medium for meat lactobacilli. Journal of Applied Microbiology, 85(4), 715-722.
doi:http://dx.doi.org/10.1111/j.1365-2672.1998.00583.x
Muller, D. M., Carrasco, M. S., Tonarelli, G. G., & Simonetta, A. C. (2009).
Characterization and purification of a new bacteriocin with a broad inhibitory spectrum produced by Lactobacillus plantarum lp 31 strain isolated from dry-
fermented sausage. Journal of Applied Microbiology, 106(6), 2031-2040.
doi:http://dx.doi.org/10.1111/j.1365-2672.2009.04173.x Nigatu, A. (2000). Evaluation of numerical analyses of RAPD and API 50 CH
patterns to differentiate Lactobacillus plantarum, Lact. fermentum, Lact.
rhamnosus, Lact. sake, Lact. parabuchneri, Lact. gallinarum, Lact. casei, Weissella minor and related taxa isolated from kocho and tef. Journal of Applied
Microbiology, 89(6), 969-978. doi:http://dx.doi.org/10.1046/j.1365-
2672.2000.01202.x Ongol, M. P. (2012). Lactic Acid Bacteria in Health and Disease. Rwanda
Journal of Health Sciences, 1(1).
Parada, J. L., Caron, C. R., Medeiros, A. B. P., & Soccol, C. R. (2007). Bacteriocins from lactic acid bacteria: purification, properties and use as
biopreservatives. Braz Arch Biol Technol, 50(3), 512-542.
doi:http://dx.doi.org/10.1590/S1516-89132007000300018
Pingitore, E. V., Salvucci, E., Sesma, F., & E., N.-M. M. (2007). Different
strategies for purification of antimicrobial peptides from Lactic Acid Bacteria
(LAB). Foramatex 2007. doi not found Riley, M., & Gillor, O. (2007). Research and Applications in Bacteriocins (G. O.
Riley A Magaret Ed.): Horizon Bioscience.
Riley, M. A., & Gordon, D. M. (1999). The ecological role of bacteriocins in bacterial competition. Trends in Microbiology, 7(3), 129-133.
Salvetti, E., Torriani, S., & Felis, G. E. (2012). The Genus Lactobacillus: A
Taxonomic Update. Probiotics Antimico., 4(4), 217-226. doi:http://dx.doi.org/10.1007/s12602-012-9117-8
Schagger, H. (2006). Tricine-SDS-PAGE. Nature Protocols, 1(1), 16-22.
doi:http://dx.doi.org/10.1038/nprot.2006.4 Sharma, N., & Neha., G. (2008). Antibacterial activity and characterization of
bacteriocin of Bacillus mycoides. Indian Journal of Microbiology, Vol. 7, 117-
121. doi not found Singh, V., Rana, R. K., & Singhal, R. (2013). Analysis of repeated measurement
data in the clinical trials. Journal of Ayurveda and Integrative Medicine, 4(2), 77-
81. doi:http://dx.doi.org/10.4103/0975-9476.113872
Sun, Z., Harris, H. M. B., McCann, A., Guo, C., Argimón, S., Zhang, W., . . .
O'Toole, P. W. (2015). Expanding the biotechnology potential of lactobacilli
through comparative genomics of 213 strains and associated genera. Nat Commun, 6, 8322. doi:http://dx.doi.org/10.1038/ncomms9322
Tahara, T., Kanatani, K., Yoshida, K., Miura, H., Sakamoto, M., & Oshimura, M.
(1992). Purification and Some Properties of Acidocin 8912, a Novel Bacteriocin Produced by Lactobacillus acidophilus TK8912. Bioscience, Biotechnology, and
Biochemistry, 56(8), 1212-1215. doi:http://dx.doi.org/10.1271/bbb.56.1212 Tannock, G. W. (2004). A special fondness for lactobacilli. J Appl Environ
Microbiol, 70(6), 3189-3194. doi:http://dx.doi.org/10.1128/AEM.70.6.3189-
3194.2004 Todorov, S. D., & Dicks, L. M. T. (2005). Lactobacillus plantarum isolated from
molasses produces bacteriocins active against Gram-negative bacteria. Enzyme
and Microbial Technology, 36(2-3), 318-326. doi:http://dx.doi.org/10.1016/j.enzmictec.2004.09.009
van Heel, A. J., de Jong, A., Montalban-Lopez, M., Kok, J., & Kuipers, O. P.
(2013). BAGEL3: Automated identification of genes encoding bacteriocins and (non-)bactericidal posttranslationally modified peptides. Nucleic Acids Research,
41(Web Server issue), W448-453. doi:http://dx.doi.org/10.1093/nar/gkt391
van Reenen, C. A., Dicks, L. M., & Chikindas, M. L. (1998). Isolation, purification and partial characterization of plantaricin 423, a bacteriocin produced
by Lactobacillus plantarum. Journal of Applied Microbiology, 84(6), 1131-1137.
doi:http://dx.doi.org/10.1046/j.1365-2672.1998.00451.x ·
Vaughan, A., Eijsink, V. G., & Van Sinderen, D. (2003). Functional characterization of a composite bacteriocin locus from malt isolate Lactobacillus
sakei 5. Applied and Environmental Microbiology, 69(12), 7194-7203.
doi:http://dx.doi.org/10.1128/AEM.69.12.7194-7203.2003 Walsh, C. J., Guinane, C. M., Hill, C., Ross, R. P., O’Toole, P. W., & Cotter, P.
D. (2015). In silico identification of bacteriocin gene clusters in the
gastrointestinal tract, based on the Human Microbiome Project’s reference genome database. BMC Microbiology, 15(1), 183.
doi:http://dx.doi.org/10.1186/s12866-015-0515-4
Zacharof, M. P., & Lovitt, R. W. (2012). Bacteriocins Produced by Lactic Acid Bacteria a Review Article. APCBEE Procedia, 2, 50-56.
doi:http://dx.doi.org/10.1016/j.apcbee.2012.06.010