![Index [assets.cambridge.org]assets.cambridge.org/.../index/9781107011687_index.pdf · Index Aβ see amyloid-β ABILHAND questionnaire 591 abundance, in motor system 602–5 acarbose](https://static.fdocument.org/doc/165x107/5f031f417e708231d407a572/index-index-a-see-amyloid-abilhand-questionnaire-591-abundance-in-motor.jpg)
Quantitative analysis of the time course of Aβ oligomerization and subsequent growth steps using...
8
Quantitative analysis of the time course of Aβ oligomerization and subsequent growth steps using tetramethylrhodamine-labeled Aβ Kanchan Garai and Carl Frieden 1 Department of Biochemistry and Molecular Biophysics, Washington University School of Medicine, St. Louis, MO 63110 Contributed by Carl Frieden, December 27, 2012 (sent for review November 13, 2012) Although amyloid β (Aβ) is a critical player in the pathology of Alzheimer’s disease, there is currently little Information on the rate and extent of formation of oligomers that lead to the pres- ence of Aβ fibrils observed in amyloid plaques. Here we describe a unique method to monitor the full time course of Aβ aggrega- tion. In this method, Aβ is labeled with tetramethylrhodamine at a lysine residue on the N-terminal end. During aggregation, the fluorescence is quenched in a time-dependent manner in three distinct phases: an early oligomerization phase, an intermediate phase, and a growth phase. The oligomerization phase can be characterized as a monomer-dimer-trimer process for which we have determined the rate and equilibrium constants. The rate con- stants differ markedly between Aβ 1–42 and Aβ 1–40 , with Aβ 1–42 showing a greater oligomerization propensity. The intermediate phase reflects slow clustering and reorganization of the oligomers, whereas the growth phase ultimately results in the formation of fibrillar material. The data are consistent with a conformational change being an important rate-limiting step in the overall aggre- gation process. The rates of all phases are highly sensitive to tem- perature and pH, with the pH-dependent data indicating important roles for lysine and histidine residues. From the temperature- dependent data, activation energies of oligomerization and fibril- lization are estimated to be 5.5 and 12.1 kCal/mol, respectively. The methodologies presented here are simple and can be applied to other amyloidogenic peptides or proteins. oligomer formation | fluorescence quenching | kinetics of aggregation | nucleation A lzheimer’s disease (AD), the most prevalent form of neu- rodegenerative diseases, is characterized by deposition of senile plaques in the brain. These plaques contain aggregates of the amyloid β (Aβ) peptides Aβ 1–42 and Aβ 1–40 . In vitro, both peptides self-assemble into soluble oligomers and insoluble fibrils in a time-dependent manner. There has been extensive structure–function characterization of the in vitro aggregation process using a large number of available methods (1). The most widely used method follows changes in the fluorescence of Thi- oflavin T (ThT). This dye is particularly useful because of the large fluorescence increase observed during the final phase of aggregation coincident with the formation of β-strand structure. This assay, however, does not report on intermediates in the aggregation process and therefore cannot detect soluble oligomers that lack well-defined β-strand structure. It is critical to understand the nature of these small oligomers, because re- cent experiments suggest that they may be the major cytotoxic species for AD (2–5). Data in the literature present a highly complex picture of the oligomer formation, starting from dimers to spherical oligomers and linear protofibrils comprised of a large number of monomers. Biophysical characterization of the low-molecular-weight oligom- ers, however, has been difficult because of their small size and metastable nature. Bitan et al. (3), for example, characterized the low-molecular-weight oligomers of Aβ 1–40 and Aβ 1–42 by stabilizing them using covalent cross-linking. More recently, mass spectrom- etry coupled with ion mobility spectrometry (IM-MS) experiments have provided information regarding the size and shape of the low- molecular-weight oligomeric forms of Aβ and other amyloidoic proteins (6, 7). A variety of biophysical methods have been used to study the oligomers extensively (2, 7–14). Despite such studies, the ability to measure the rates of for- mation of the oligomers remains difficult. Recently, Lee et al. (15) reported a method suitable for monitoring the full time course of aggregation showing distinct phases corresponding to oligomerization and fibrillization using Cys-Cys-Aβ and FlAsH dye binding to tetracysteine motifs arising from self-association of Aβ. A quantitative characterization of the monomer-oligomer process, however, is still lacking. Here we report a fluorescent method that allows characterization of the full time course of aggregation including the early events—specifically those in- volved in the formation of low-molecular-weight oligomers—as well as the fibrillization process. The method uses tetrame- thylrhodamine (TMR) covalently attached to an N-terminal ly- sine residue of Aβ. The basis for this assay is fluorescence self- quenching as discussed by Zhuang et al. (16) and used by Chattopadhyay et al. (17) to measure the kinetics of conforma- tional fluctuations in an unfolded protein. Our assay, applied to both Aβ 1–40 and Aβ 1–42 , allows us to determine rate constants of the early steps of the monomer-oligomer process. In this paper, we compare this assay with those using ThT or circular dichroism (CD) and discuss their similarities and differences. Finally, we use this assay to determine the time course of Aβ self-assembly as a function of temperature and pH. Results Time Course of Fluorescence and Circular Dichroism Changes Using TMR-Labeled Aβ. Fig. 1 compares the time course of the TMR fluorescence and the CD data measured at 216 nm of TMR-la- beled Aβ 1–42 . The experiments were performed at room tem- perature in 20 mM phosphate buffer, at pH 7.5, containing 15 mM NaCl with continuous stirring. The TMR fluorescence decreases in at least three distinct phases: a fast small decrease in fluorescence completed within 30–45 min, which, as described below, we term the oligomerization phase; followed by a longer phase of ∼500 min, termed the intermediate (or lag) phase, during which there is only a small change in fluorescence; and finally, a rapid and large decrease in fluorescence, which we call the growth phase. Conversely, the CD data show a long lag followed by a rapid increase in β-structure formation. In this experiment, the Aβ 1–42 concentration was 2 μM, and the data were normalized for comparison. From the raw TMR data, some fluorescence remains at long times. Assuming this represents monomer, the final Aβ 1–42 concentration can be calculated to be 0.35 μM, ∼15% of the starting material. Author contributions: K.G. and C.F. designed research; K.G. performed research; K.G. and C.F. analyzed data; and K.G. and C.F. wrote the paper. The authors declare no conflict of interest. 1 To whom correspondence should be addressed. E-mail: [email protected]. This article contains supporting information online at www.pnas.org/lookup/suppl/doi:10. 1073/pnas.1222478110/-/DCSupplemental. www.pnas.org/cgi/doi/10.1073/pnas.1222478110 PNAS | February 26, 2013 | vol. 110 | no. 9 | 3321–3326 BIOCHEMISTRY
Transcript of Quantitative analysis of the time course of Aβ oligomerization and subsequent growth steps using...

Quantitative analysis of the time course of Aβoligomerization and subsequent growth steps usingtetramethylrhodamine-labeled AβKanchan Garai and Carl Frieden1
Department of Biochemistry and Molecular Biophysics, Washington University School of Medicine, St. Louis, MO 63110
Contributed by Carl Frieden, December 27, 2012 (sent for review November 13, 2012)
Although amyloid β (Aβ) is a critical player in the pathology ofAlzheimer’s disease, there is currently little Information on therate and extent of formation of oligomers that lead to the pres-ence of Aβ fibrils observed in amyloid plaques. Here we describea unique method to monitor the full time course of Aβ aggrega-tion. In this method, Aβ is labeled with tetramethylrhodamine ata lysine residue on the N-terminal end. During aggregation, thefluorescence is quenched in a time-dependent manner in threedistinct phases: an early oligomerization phase, an intermediatephase, and a growth phase. The oligomerization phase can becharacterized as a monomer-dimer-trimer process for which wehave determined the rate and equilibrium constants. The rate con-stants differ markedly between Aβ1–42 and Aβ1–40, with Aβ1–42showing a greater oligomerization propensity. The intermediatephase reflects slow clustering and reorganization of the oligomers,whereas the growth phase ultimately results in the formation offibrillar material. The data are consistent with a conformationalchange being an important rate-limiting step in the overall aggre-gation process. The rates of all phases are highly sensitive to tem-perature and pH, with the pH-dependent data indicating importantroles for lysine and histidine residues. From the temperature-dependent data, activation energies of oligomerization and fibril-lization are estimated to be 5.5 and 12.1 kCal/mol, respectively.The methodologies presented here are simple and can be appliedto other amyloidogenic peptides or proteins.
oligomer formation | fluorescence quenching | kinetics of aggregation |nucleation
Alzheimer’s disease (AD), the most prevalent form of neu-rodegenerative diseases, is characterized by deposition of
senile plaques in the brain. These plaques contain aggregates ofthe amyloid β (Aβ) peptides Aβ1–42 and Aβ1–40. In vitro, bothpeptides self-assemble into soluble oligomers and insolublefibrils in a time-dependent manner. There has been extensivestructure–function characterization of the in vitro aggregationprocess using a large number of available methods (1). The mostwidely used method follows changes in the fluorescence of Thi-oflavin T (ThT). This dye is particularly useful because of thelarge fluorescence increase observed during the final phase ofaggregation coincident with the formation of β-strand structure.This assay, however, does not report on intermediates in theaggregation process and therefore cannot detect solubleoligomers that lack well-defined β-strand structure. It is criticalto understand the nature of these small oligomers, because re-cent experiments suggest that they may be the major cytotoxicspecies for AD (2–5).Data in the literature present a highly complex picture of the
oligomer formation, starting from dimers to spherical oligomersand linear protofibrils comprised of a large number of monomers.Biophysical characterization of the low-molecular-weight oligom-ers, however, has been difficult because of their small size andmetastable nature. Bitan et al. (3), for example, characterized thelow-molecular-weight oligomers of Aβ1–40 and Aβ1–42 by stabilizingthem using covalent cross-linking. More recently, mass spectrom-etry coupled with ion mobility spectrometry (IM-MS) experiments
have provided information regarding the size and shape of the low-molecular-weight oligomeric forms of Aβ and other amyloidoicproteins (6, 7). A variety of biophysical methods have been used tostudy the oligomers extensively (2, 7–14).Despite such studies, the ability to measure the rates of for-
mation of the oligomers remains difficult. Recently, Lee et al.(15) reported a method suitable for monitoring the full timecourse of aggregation showing distinct phases corresponding tooligomerization and fibrillization using Cys-Cys-Aβ and FlAsHdye binding to tetracysteine motifs arising from self-associationof Aβ. A quantitative characterization of the monomer-oligomerprocess, however, is still lacking. Here we report a fluorescentmethod that allows characterization of the full time course ofaggregation including the early events—specifically those in-volved in the formation of low-molecular-weight oligomers—aswell as the fibrillization process. The method uses tetrame-thylrhodamine (TMR) covalently attached to an N-terminal ly-sine residue of Aβ. The basis for this assay is fluorescence self-quenching as discussed by Zhuang et al. (16) and used byChattopadhyay et al. (17) to measure the kinetics of conforma-tional fluctuations in an unfolded protein. Our assay, applied toboth Aβ1–40 and Aβ1–42, allows us to determine rate constants ofthe early steps of the monomer-oligomer process. In this paper,we compare this assay with those using ThT or circular dichroism(CD) and discuss their similarities and differences. Finally, weuse this assay to determine the time course of Aβ self-assemblyas a function of temperature and pH.
ResultsTime Course of Fluorescence and Circular Dichroism Changes UsingTMR-Labeled Aβ. Fig. 1 compares the time course of the TMRfluorescence and the CD data measured at 216 nm of TMR-la-beled Aβ1–42. The experiments were performed at room tem-perature in 20 mM phosphate buffer, at pH 7.5, containing 15mM NaCl with continuous stirring. The TMR fluorescencedecreases in at least three distinct phases: a fast small decrease influorescence completed within 30–45 min, which, as describedbelow, we term the oligomerization phase; followed by a longerphase of ∼500 min, termed the intermediate (or lag) phase,during which there is only a small change in fluorescence; andfinally, a rapid and large decrease in fluorescence, which we callthe growth phase. Conversely, the CD data show a long lagfollowed by a rapid increase in β-structure formation. In thisexperiment, the Aβ1–42 concentration was 2 μM, and the datawere normalized for comparison. From the raw TMR data, somefluorescence remains at long times. Assuming this representsmonomer, the final Aβ1–42 concentration can be calculated to be0.35 μM, ∼15% of the starting material.
Author contributions: K.G. and C.F. designed research; K.G. performed research; K.G. andC.F. analyzed data; and K.G. and C.F. wrote the paper.
The authors declare no conflict of interest.1To whom correspondence should be addressed. E-mail: [email protected].
This article contains supporting information online at www.pnas.org/lookup/suppl/doi:10.1073/pnas.1222478110/-/DCSupplemental.
www.pnas.org/cgi/doi/10.1073/pnas.1222478110 PNAS | February 26, 2013 | vol. 110 | no. 9 | 3321–3326
BIOCH
EMISTR
Y

Although the CD data are consistent with a classical nucle-ation-elongation model, the TMR data refute this model, clearlyindicating substantial self-association before the growth phase.The growth phase of the TMR fluorescence data is similar to theCD change, although the half-time (t1/2) of the growth phaseobserved from TMR fluorescence (∼910 min) is somewhat lessthan that observed from the CD data (∼1,210 min).
Time Course of Aggregation Using Unlabeled and TMR-Labeled Aβ.We then compared the TMR-Aβ assay to the ThT assay of un-labeled Aβ under a variety of conditions. Fig. 2 A–C comparesthe time course of aggregation between TMR-labeled Aβ1–42 andunlabeled Aβ1–42 at two different temperatures (25 and 50 °C;Fig. 2 A and B) and two different pH values (pH 7.5 and 6.5; Fig.2 A and C). Under all conditions, the fluorescence of TMR-Aβ1–42(red curves) shows the same three distinct phases discussed inFig. 1, whereas those of the ThT assay (blue curves) show only
a lag and a growth phase. Again, the TMR assay shows that theclassical nucleation-elongation model is not an appropriate de-scription of the process. In all cases, the growth phase of theTMR-Aβ (red curves) assay is similar to that of unlabeled Aβmeasured by ThT fluorescence (blue curves), indicating minimalinterference of the attached TMR on aggregation of Aβ. How-ever, the half-time (t1/2) of the growth phase, as measured byTMR fluorescence, is shorter than that measured by ThT fluo-rescence, possibly indicating unstructured aggregation before ap-pearance of fibrils as will be discussed later. It is evident from Fig.2 that the time course of Aβ aggregation is highly sensitive tochanges in temperature and pH. We address this issue in moredetail in later sections.In the case of TMR-Aβ1–40, the loss of fluorescence in the first
phase was small (Fig. 2D, red curves) for reasons discussed later.It should be noted that the ThT fluorescence decreases at longtimes as a result of precipitation of large fibrils.
Effect of TMR Labeling on the Morphology of Aβ Fibrils. Fig. 3 showsnegative-stain EM images of samples prepared under identicalconditions. It may be seen that the EM images of the TMR-Aβ1–42and TMR-Aβ1–40 fibrils are similar to those of unlabeled Aβ1–42and Aβ1–40. All of the peptides formed amyloid fibrils that aresimilar in width (∼6 nm) and length (>100 nm). Overall, ourdata indicate that TMR labeling does not significantly affectAβ fibril morphology.
Oligomerization Phase. Figs. 1 and 2 show a rapid decrease inTMR fluorescence in the first 30–45 min, during which time theThT fluorescence did not change. To examine the meaning ofthis phase, we prepared a stock solution of monomeric TMR-labeled Aβ in 4 M GdnCl as described in Materials and Methods.Fig. 4 shows the time-dependent changes of TMR fluorescencefollowing dilution of this material into 20 mM phosphate bufferat pH 7.5 and 25 °C. The final GdnCl concentration in all sol-utions was 0.16 M. Fig. 4A shows that the change of TMRfluorescence is negligible at an Aβ1–42 concentration of 0.5 μM.At higher concentrations, the TMR fluorescence changes ina time-dependent manner over 30 min. We interpret thequenching of TMR fluorescence to be a result of self-association
Fig. 1. Normalized time course of changes in TMR fluorescence (□) and inCD (○). TMR-Aβ1–42 (2 μM) was prepared in 20 mM phosphate buffer at pH7.5 containing 15 mM NaCl, 0.1 mM EDTA, and 0.5 mM βMe. TMR fluores-cence was monitored at 600 nm with excitation at 520 nm. The CD signal wasmonitored at 216 nm. Both measurements were performed on the samesample. Solid lines are sigmoidal fits to the data. The data were normalizedby setting the fluorescence at zero time to 1 and that at long times to zero.
Fig. 2. Time courses using TMR (red) or ThT fluo-rescence (blue) under various conditions. A–C useunlabeled or TMR-labeled Aβ1–42 at (A) 25 °C, pH 7.5;(B) 50 °C, pH 7.5; and (C) 25 °C, pH 6.5. (D) Time courseof unlabeled and TMR-labeled Aβ1–40 at 25 °C, pH 7.5.All buffers contained 150 mM NaCl, 1 mM EDTA, and5 mM βMe. The unlabeled Aβ samples contained 2 μMThT and were monitored at an emission wavelength470 nm with excitation at 438 nm. The data werenormalized for comparative purposes.
3322 | www.pnas.org/cgi/doi/10.1073/pnas.1222478110 Garai and Frieden

to form low-molecular-weight oligomers. A two-exponentialequation is required to fit these data, indicating the formation ofmore than one species from the monomer. The kinetic data canbe globally fit (solid red lines) assuming a simple monomer-di-mer-trimer model as shown in Scheme 1. When similar experi-ments are performed with Aβ1–40 (Fig. 4B), the fluorescencechange is much smaller and the rates are slower. The individualrate constants obtained for the monomer-dimer-trimer schemefor both Aβ1–42 and Aβ1–40 are summarized in Table 1.
Intermediate (Lag) Phase. Figs. 1 and 2 show that, after the firstrapid phase reflecting oligomerization, there is a phase duringwhich there is only a slight decrease in fluorescence, suggestinglittle incorporation of monomer in this phase. The fluorescencechange in this phase is larger for Aβ1–42 than for Aβ1–40. In eithercase, this phase may reflect either the clustering of the oligo-meric species and/or the reorganization of the oligomeric speciesalready present. In any case, these clusters, containing disor-dered monomers of Aβ, are not recognized by ThT. The dataalso suggest that these clusters do not fluoresce as brightly asthe monomer.
Growth Phase. The final time-dependent fluorescence changeis large as measured by changes in both TMR-Aβ and ThTfluorescence (Fig. 2 A–D). This phase is also correlated withappearance of the β-structure as measured by CD (Fig. 1). Aswill be discussed below, the rate of this phase, as measured by theTMR assay, appears somewhat faster than that measured by theThT assay, although the length of time before this phase is almostthe same for these two assays. In this and all other experiments,the rate of this phase is possibly enhanced by fragmentation of thefibril caused by stirring the solution.
pH Dependence of the Phases. The data in Fig. 2 indicated a strongpH dependence of the three phases that describe the aggregationprocess. Fig. S1 A and B shows kinetic data for the oligomeriza-tion phase and the full time course of TMR-Aβ1–42 as a functionof pH. The data clearly show that the phases are highly sensitive topH. Fig. 5A shows the plot of extent of oligomerization (estimatedin the first 20 min) derived from the data presented in Fig. S1A.There are clear changes in oligomerization behavior around pH6.5 and pH 11.0. Fig. 5B shows the plot of 1/t1/2 of the growthphase as a function of pH derived from the data presented in Fig.S1B. Clearly, the overall rates are faster at low pH, with a mid-point between pH 6.5 and pH 7.0.
Temperature Dependence of the Phases. Fig. 2 A and B indicatesthat the rate of oligomerization, the extent of the intermediatephase, and the rate of the growth phase are all highly sensitive totemperature. We addressed this issue by performing experimentsover a range of solution temperatures (from ∼3 °C to ∼75 °C). Thetemperature-dependent kinetic data of TMR-Aβ1–42 are shown inFig. S2 A and B. Fig. 6 A and B shows Arrhenius plots (squares) ofthe temperature dependence data. The solid lines represent fits ofthe data to the Arrhenius equation as described by Eq. 1a(Materials and Methods). It is clear from the figures that the datado not conform to the Arrhenius equation over the full tempera-ture range but rather deviate at temperatures >50 °C. Fitting thedata below 50 °C yields the values of activation energies (Ea) of theoligomerization and growth phases to be 5.5 and 12 kCal/mol,respectively. Deviations from the Arrhenius equation at hightemperatures may arise as a consequence of reduced hydrophobicinteractions between the peptides under these conditions or froma change in the mechanism of oligomerization.
DiscussionWe developed a unique fluorescent assay to monitor the fulltime course of fibril formation using TMR covalently attachedto the Aβ peptide. The basis for this assay is fluorescence self-quenching (17). Although there are many assays that are usedto monitor different aspects of amyloid aggregation, the major
Fig. 3. Negative stain electron microscopy images of Aβ fibrils collectedfrom the endpoints of the experiments shown in Fig. 2 prepared in pH 7.5and incubated at 25 °C. (A) unlabeled Aβ1–42, (B) unlabeled Aβ1–40, (C) TMR-Aβ1–42, and (D) TMR-Aβ1–40.
Fig. 4. Oligomerization of TMR-labeled Aβ. Timecourse of fluorescence change following dilution ofa 100 μM stock solution containing monomeric (A)TMR-Aβ1–42 or (B) TMR-Aβ1–40, prepared in 4 MGdnCl, to final concentrations from 0.5 to 4.0 μM in20 mM phosphate buffer at pH 7.5 containing 1 mMEDTA and 5 mM βMe. The black dots representdata, and the red lines are global fit of the datausing a monomer-dimer-trimer model as describedin Scheme 1. The rate constants obtained are sum-marized in Table 1. In all of the samples, the finalconcentration of GdnCl is 0.16 M. All experimentswere performed at 25 °C without stirring.
Scheme 1. Monomer-dimer-trimer process of Aβ oligomerization.
Garai and Frieden PNAS | February 26, 2013 | vol. 110 | no. 9 | 3323
BIOCH
EMISTR
Y

advantage of the TMR assay is the ability to follow, by a con-venient fluorescent method, the early formation of oligomers.In this assay, the oligomerization phase is clearly separatedfrom the growth phase by an intermediate or lag phase, en-abling quantitative analysis of the data.
TMR Assay and the ThT Assay May Be Complementary. ThT fluo-rescence has been the most widely used method to detect ormonitor amyloid aggregation. ThT fluorescence, however, is notsuitable for mechanistic studies primarily because it does notreport on early steps in the aggregation process. The fact thatTMR fluorescence is sensitive to early oligomeric steps enablesus to monitor and quantitate the earliest phase of aggregation.Conversely, the ThT assay does report on the formation ofstructured fibrils, so it can be complementary to data obtainedwith the TMR assay. Careful examination of the data in Fig. 2,for example, shows that there are differences in the growth phase,suggesting that the TMR assay is measuring large oligomers thatdo not necessarily have the canonical β-strand structure typicalof fibrils.
Interpretation of the Oligomerization and Intermediate Phases. Datain the literature present a highly complex picture of Aβoligomers starting from dimers and proceeding to large-sizedspherical oligomers or the protofibrils with little quantitativecharacterization (2–6, 8–12, 14). Thus, it has been impossible toestablish a complete kinetic scheme of oligomerization.The TMR data presented in Figs. 1, 2, 4, 5, and 6 support the
concept of spontaneous oligomer formation during the earlyphase of aggregation. We show that this phase can be simplydescribed by a monomer-dimer-trimer process with different rateand equilibrium constants for dimer and trimer formation.Attempts to fit the data to an isodesmic model were not suc-cessful. Our data for both Aβ1–40 and Aβ1–42 collected overa range of concentrations are consistent with this model (Fig. 4).It is also well known that Aβ1–42 aggregates more readily thanAβ1–40, and the data of Table 1 show that Aβ1–42 monomers self-associate to dimers and trimers more readily than do monomersof Aβ1–40 (3). The rate constants for association to dimer ortrimer are, however, well below what would be expected fora diffusion controlled process. This suggests that the formationof oligomers may be a rare event, perhaps due to only rare formsforming stable dimers. This interpretation is consistent with theview that the monomers of Aβ exist in multiple conformations
and that the predominant or the lowest energy conformers arenot suitable for self-association (18).From the rate constants, we can calculate apparent equilib-
rium constants. For the monomer-dimer process, this value is12.8 μM for Aβ1–42 and 54 μM for Aβ1–40 (Table 1). Thus, it isnot surprising that oligomers of Aβ1–40 hardly form at concen-trations of 2–4 μM, as shown in Fig. 4. Using the rate constantsshown in Table 1, we can simulate the appearance of theoligomers. Fig. 7 shows these simulations for Aβ1–42 and Aβ1–40using a starting concentration of 2 μM. It is clear that bothdimers and trimers of Aβ1–42 form faster and to a greater extentthan do oligomers of Aβ1–40. It may be recalled here that theoligomers, especially the dimers of Aβ1–42, have been detected inthe cortices of AD patients’ brains, although the total Aβ1–42concentration in the brain is only a few nanomolar (19). How theoligomers of Aβ1–42 form at such low concentrations is not clear,but the presence of lipids, membranes, and macromolecularcrowding in vivo may catalyze such processes (20, 21). Addi-tionally, physiological temperature (37 °C) and low pH, espe-cially that found in the intracellular lysosomal compartments,can have catalytic effects on the oligomerization of Aβ1–42 (22).It is of interest that at 10- to 100-fold higher Aβ concentrations
and using chemical cross-linking or ion mobility MS (IM-MS),investigators have detected the presence of dimer, trimer, tet-ramer, and higher oligomers of both Aβ1–40 and Aβ1–42 (3, 6).As mentioned earlier, during the intermediate phase, there is
very little fluorescence change, yet the aggregation process stillcontinues and probably represents the formation of large clustersof the dimeric and trimeric or higher oligomers. There is verylittle fluorescence change during this time, because the concen-tration of highly fluorescent monomers is not being significantlydepleted.
Growth Phase. Our data show that the t1/2 of the growth phase ofAβ aggregation is highly dependent on temperature (Figs. 2 and6) but relatively independent of the initial Aβ concentration (Fig.S3). Such a result could arise from a concentration-independentstep, such as a conformational change, being rate limiting. Wesuggest that this step occurs within the phase we characterized asthe intermediate phase that follows the initial oligomerizationprocess. Our data, and that from numerous other groups, haveshown the presence of metastable oligomers of n ≥ 2 beforefibrillization of Aβ1–42 (3, 4, 10, 15), clearly refuting the homo-geneous nucleation model. Several authors have suggested thatconformational conversion of the monomers occurs within the
Table 1. Rate constants for the monomer-dimer-trimer process of Aβ oligomerization
Sample k+12 (M−1·s−1) × 102 k−12 (s−1) × 10−3 k+23 (M−1·s−1) k−23 (s−1) × 10−3 K12−1 (M) × 10−6 K23
−1 (M) × 10−6
TMR-Aβ1–42 9.9 ± 1.9 12.7 ± 3.0 38 ± 5 0.3 ± 0.1 12.8 7.9TMR-Aβ1–40 0.5 ± 0.05 2.7 ± 0.3 20 ± 10 0* 54.0 ND
ND, not determined.*Value of this parameter was too small; hence, it was set equal to 0.
Fig. 5. pH dependence of oligomerization andfibrillization. (A) Extent of loss of TMR fluorescencein 20 min following dilution of a 100 μM stock so-lution of monomeric TMR-Aβ1–42 to 2.0 μM and (B)the inverse of half-time (t1/2) of the growth phase ofTMR-labeled Aβ1–42 at different pH values. Emptysquares represent data, and the solid lines representsigmoidal fit of the data. The final buffer concen-tration was 20 mM phosphate at all pH values.
3324 | www.pnas.org/cgi/doi/10.1073/pnas.1222478110 Garai and Frieden

liquid-like oligomers (15, 23). Our data agree with this mecha-nism and show that this step is pH and temperature dependent.
Activation Barrier of Oligomerization and Fibrillization. The activa-tion barrier between the monomers and the oligomers is 5.5kCal/mol and that between the monomers and fibrils is 12.1kCal/mol. The high activation barrier separating the fibrils fromother species can explain the long intermediate phase observedbefore the growth phase. We note here that, using a similarapproach, the Ea of fibrillization for Aβ1–40 at pH 3.0 and pH 7.4was earlier reported to be 23 and 74 kCal/mol, respectively (24,25). However, to our knowledge, the Ea of oligomerization forany amyloidic protein has never been reported.
Importance of the Lysine and Histidine Residues in OligomerFormation. Fig. 5A shows the oligomerization process to behighly sensitive to pH, with little self-association above pH 11.0,almost pH-independent behavior between pH 7.5 and pH 10.2,and increasingly faster oligomerization below pH 7.5. Addi-tionally, the growth phase is also quite sensitive to pH, withsignificantly lower t1/2 values for the growth phase below pH 7.0(Fig. 5B). Because lysine and histidine side chains have pKa valuesof 10.5 and 6.5, respectively, it is likely that these residues playimportant roles in both the oligomerization and growth phases.The large changes below pH 7.5 suggest an important role forhistidine, even though the 3 histidine residues are clustered withinthe first 14 residues and are sequentially distant from residuesproposed to be involved in a turn motif (Asp23-Lys28) (26).
Overall Mechanism. Fig. 8 shows a schematic view of the aggre-gation process based on the data that are presented here. Thered circles are disordered monomers labeled with TMR, whereasthe black circles are those monomers in which the TMR fluo-rescence has been quenched. The step from position A to B
represents the formation of dimers and trimers observed in theoligomerization phase. The step from position B to C reflects theclustering of these oligomers to form larger, perhaps micelle-like, species composed of disordered monomers. At point C,a conformational change occurs, allowing the rapid formation offibrils with the canonical β-strand structure. Some monomersmay persist even after complete fibrillization.
ConclusionIn summary, we developed a unique method that allows in-vestigation of the early steps in the formation of Aβ fibrils. Usingthis assay, we determined the rate constants for the formation ofdimers and trimers that are the earliest events in the formation offibrillar structures. Our data are consistent with a conformationalchange of monomers within an intermediate oligomeric form beingthe rate-determining step of fibrillization of Aβ. We speculate thatour method would be applicable to study other amyloidic proteinssuch as α-synuclein and polyglutamine repeat proteins.
Materials and MethodsPreparation of TMR-Labeled Aβ.Unlabeled and TMR-labeled Aβ peptides werechemically synthesized and purchased from Keck Foundation (Yale Univer-sity). The peptides were purified by reverse-phase LC using a C18 columnin water/acetonitrile media. The purified peptides were lyophilized andresuspended in 6 M GdnCl. The Aβ peptides were further purified by sizeexclusion chromatography using a Superdex peptide column (GE Healthcare)in 4 M GdnCl and 20 mM phosphate, pH 7.5, or 3 mM NaOH. The pre-dominant fraction was selected for subsequent experiments.
Measurement of Aβ Oligomerization. Appropriate volumes of TMR-Aβ1–42 orTMR-Aβ1–40 prepared in 4 M GdnCl and 20 mM phosphate, pH 7.5, were di-luted from a 100-μM stock solution to final peptide concentrations ranging
Fig. 6. Temperature dependence of oligomeriza-tion and fibrillization. Arrhenius plots of (A) theextent of loss of TMR fluorescence in 20 min fol-lowing dilution of a 100 μM stock solution of mo-nomeric TMR-Aβ1–42 to 2.0 μM and (B) the half-timeof the growth phase of TMR-labeled Aβ1–42 into 20mM phosphate, pH 7.5 buffer at different temper-atures. Empty squares represent data, and the solidlines represent fit of the data to Arrhenius equationas described in Eq. 1a.
Fig. 7. Simulation of time course of oligomerization by Aβ1–40 and Aβ1–42.Time course of dimer and trimer formation for Aβ1–42 (solid lines) and Aβ1–40(dotted lines) starting from 2 μM monomer. The curves were simulated byKintek explorer (28) using the rate constants listed in Table 1.
Fig. 8. Schematic view of aggregation based on time course of TMR fluo-rescence. The red curve is a typical fluorescence time course of TMR-Aβ. (A)Monomeric ensemble at t = 0, (B) small oligomers predominantly dimers andtrimers formed during the oligomerization phase, (C) small oligomers clusterto larger oligomers during the intermediate or lag phase, and (D) β-struc-tured fibrillar aggregates are formed and the solution is monomer depleted.
Garai and Frieden PNAS | February 26, 2013 | vol. 110 | no. 9 | 3325
BIOCH
EMISTR
Y

from 0.5 to 4 μM into 20 mM phosphate buffer, pH 7.5, at 25 °C. The finalconcentration of GdnCl was adjusted to 160 mM in all samples. Thefluorescence of TMR was monitored as a function of time in an Alphascanfluorometer (PTI), with excitation and emission monochromators set to 520and 600 nm, respectively. The monochromator positions were chosenslightly away from the excitation and emission maxima of TMR (550 and575 nm, respectively) to avoid inner filter effect by the dye at micromolarconcentrations.
Fluorescence Time Course Measurements. A 20-μM stock solution of unlabeledAβ or TMR-labeled Aβ prepared in 3 mM NaOH was diluted to 4.0 μM finalconcentration in 20 mM phosphate buffer, pH 7.4, containing 150 mM NaCl,1 mM EDTA, and 5 mM β-mercaptoethanol (βME) and incubated in a cleanglass test tube with continuous stirring in a temperature-controlled cuvetteholder. The unlabeled Aβ samples contained 2.0 μM ThT. Aggregation ofunlabeled and TMR-labeled Aβ samples was monitored continuously usingThT (λex = 438 nm, λem = 480 nm) or TMR (λex = 520 nm, λem = 600 nm). Toincrease the rate of fibrillization, all samples were stirred using a stir bar.Because variations of stirring speed can alter the aggregation kinetics, thetemperature- and pH-dependent experiments reported here were per-formed at the same stirring speeds.
CD Measurements. The CD measurements were performed on 2.0 μM TMR-Aβ1–42 in 20 mM phosphate buffer containing 15 mM NaCl, 0.1 mM EDTA,and 0.5 mM βME in a Jasco 715 spectropolarimeter. The samples, prepared ina 1 × 1-cm quartz cuvette, were continuously stirred at room temperaturebetween measurements.
Electron Microscopy of Aβ Aggregates. Unlabeled Aβ1–42 and Aβ1–40 and TMR-labeled Aβ1–42 and Aβ1–40, prepared in 20 mM phosphate buffer at pH 7.5containing 150 mM NaCl, 1 mM EDTA, and 5 mM β ME, were stored at roomtemperature for 2 d in glass test tubes with continuous stirring. Theaggregates were then resuspended in the solution by a brief vortexing. Eachsample of 10 μL volume was incubated on a Formvar carbon-coated 200mesh copper grid (Electron Microscopy Sciences) for 1 min. The grid waswashed twice in buffer, followed by two washes in distilled water. Finally,the grid was negatively stained in 0.5% uranyl acetate for 1 min and thendried in a desicator overnight at room temperature. The images were col-lected in a JEOL 100CX transmission electron microscope equipped with anAMT digital camera.
Data Analysis. Fitting the Kinetic Data. The kinetic data of the oligomerizationof TMR-Aβ1–42 and TMR-Aβ1–40 were fit globally to the monomer-dimer-tri-mer model shown in Scheme 1 using a similar approach previously applied toa protein that was described by a monomer-dimer-tetramer process (27). Thetime-dependent TMR-Aβ fluorescence, F(t), is expressed as F(t) = c[m1(t) +e2m2(t) + e3m3(t)], where c is a normalization constant, m1, m2, and m3 areconcentrations of monomers, dimers and trimers respectively, and e2 and e3are the average relative (compared with the monomers) brightness values ofthe dimers and the trimers respectively. Experiments were simulated startingwith monomers of Aβ at multiple concentrations ranging from 0.5 to 4.0 μM.The kinetic data at all of the concentrations were fit globally by KintekExplorer (Kintek Corp.) (28) to obtain the four rate constants and twobrightness values. The values of e2 and e3 were allowed to float in the fittingprocess and then held constant for fitting the rate constants (Table 1).Estimation of Activation Energy from Temperature-Dependent Kinetic Data. Tem-perature dependence of the rate (r) of a chemical reaction is commonlydescribed by the following Arrhenius equation:
r =Aexp�−
EakBT
�; [1]
where A is the preexponential factor that takes into account a number offactors such as the frequency of collision between and the orientation of thereacting particles, Ea is the activation energy, kB is the Boltzmann constant,and T is the absolute temperature of the solution. Alternatively Eq. 1 can beexpressed as
log r = logA−EakB
�1T
�: [1a]
For a single rate-limited thermally activated process, the logr vs. 1/T plotgives a straight line. The activation energy, Ea can be determined from theslope of the straight line.
The rate of oligomerization is calculated as the extent of change of TMRfluorescence in the initial 20 min. The rate of fibrillization is assumed to beproportional to the inverse of the half-time (1/t1/2) of aggregation. t1/2 valueswere calculated from the quenching that occurs after the oligomerizationphase. The Ea of oligomerization or fibrillization is calculated from the slopeof the linear region of the logr vs. 1/T plot.
ACKNOWLEDGMENTS. We thank Dr. Rohit Pappu and Dr. Scott Crick fordiscussions and critical reading of the manuscript. This work was supportedin part by a grant from the American Health Assistance Foundation (to C.F.).
1. Morris AM, Watzky MA, Finke RG (2009) Protein aggregation kinetics, mechanism,and curve-fitting: A review of the literature. Biochim Biophys Acta 1794(3):375–397.
2. Lashuel HA, Hartley D, Petre BM, Walz T, Lansbury PT, Jr. (2002) Neurodegenerativedisease: Amyloid pores from pathogenic mutations. Nature 418(6895):291.
3. Bitan G, et al. (2003) Amyloid beta -protein (Abeta) assembly: Abeta 40 and Abeta 42oligomerize through distinct pathways. Proc Natl Acad Sci USA 100(1):330–335.
4. Klein WL, Stine WB, Jr., Teplow DB (2004) Small assemblies of unmodified amyloidbeta-protein are the proximate neurotoxin in Alzheimer’s disease. Neurobiol Aging25(5):569–580.
5. Jin M, et al. (2011) Soluble amyloid beta-protein dimers isolated from Alzheimercortex directly induce Tau hyperphosphorylation and neuritic degeneration. Proc NatlAcad Sci USA 108(14):5819–5824.
6. Bernstein SL, et al. (2009) Amyloid-β protein oligomerization and the importance oftetramers and dodecamers in the aetiology of Alzheimer’s disease. Nat Chem 1(4):326–331.
7. Smith DP, Radford SE, Ashcroft AE (2010) Elongated oligomers in beta2-microglobulinamyloid assembly revealed by ion mobility spectrometry-mass spectrometry. Proc NatlAcad Sci USA 107(15):6794–6798.
8. Lomakin A, Benedek GB, Teplow DB (1999) Monitoring protein assembly using qua-sielastic light scattering spectroscopy. Methods Enzymol 309:429–459.
9. Parbhu A, Lin H, Thimm J, Lal R (2002) Imaging real-time aggregation of amyloid betaprotein (1-42) by atomic force microscopy. Peptides 23(7):1265–1270.
10. Garai K, Sahoo B, Kaushalya SK, Desai R, Maiti S (2007) Zinc lowers amyloid-betatoxicity by selectively precipitating aggregation intermediates. Biochemistry 46(37):10655–10663.
11. Carulla N, et al. (2009) Experimental characterization of disordered and orderedaggregates populated during the process of amyloid fibril formation. Proc Natl AcadSci USA 106(19):7828–7833.
12. Hashimoto T, Adams KW, Fan Z, McLean PJ, Hyman BT (2011) Characterization ofoligomer formation of amyloid-beta peptide using a split-luciferase complementa-tion assay. J Biol Chem 286(31):27081–27091.
13. Krishnan R, et al. (2012) Conserved features of intermediates in amyloid assemblydetermine their benign or toxic states. Proc Natl Acad Sci USA 109(28):11172–11177.
14. Fawzi NL, Ying J, Torchia DA, Clore GM (2010) Kinetics of amyloid beta monomer-to-oligomer exchange by NMR relaxation. J Am Chem Soc 132(29):9948–9951.
15. Lee J, Culyba EK, Powers ET, Kelly JW (2011) Amyloid-β forms fibrils by nucleatedconformational conversion of oligomers. Nat Chem Biol 7(9):602–609.
16. Zhuang X, et al. (2000) Fluorescence quenching: A tool for single-molecule protein-folding study. Proc Natl Acad Sci USA 97(26):14241–14244.
17. Chattopadhyay K, Elson EL, Frieden C (2005) The kinetics of conformational fluctua-tions in an unfolded protein measured by fluorescence methods. Proc Natl Acad SciUSA 102(7):2385–2389.
18. Straub JE, Thirumalai D (2011) Toward a molecular theory of early and late events inmonomer to amyloid fibril formation. Annu Rev Phys Chem 62:437–463.
19. Shankar GM, et al. (2008) Amyloid-beta protein dimers isolated directly from Alz-heimer’s brains impair synaptic plasticity and memory. Nat Med 14(8):837–842.
20. Davis CH, Berkowitz ML (2009) Interaction between amyloid-beta (1-42) peptide andphospholipid bilayers: A molecular dynamics study. Biophys J 96(3):785–797.
21. Munishkina LA, Cooper EM, Uversky VN, Fink AL (2004) The effect of macromolecularcrowding on protein aggregation and amyloid fibril formation. J Mol Recognit 17(5):456–464.
22. Hu X, et al. (2009) Amyloid seeds formed by cellular uptake, concentration, and ag-gregation of the amyloid-beta peptide. Proc Natl Acad Sci USA 106(48):20324–20329.
23. Auer S, Ricchiuto P, Kashchiev D (2012) Two-step nucleation of amyloid fibrils: Om-nipresent or not? J Mol Biol 422(5):723–730.
24. Kusumoto Y, Lomakin A, Teplow DB, Benedek GB (1998) Temperature dependence ofamyloid beta-protein fibrillization. Proc Natl Acad Sci USA 95(21):12277–12282.
25. Sabaté R, Gallardo M, Estelrich J (2005) Temperature dependence of the nucleationconstant rate in beta amyloid fibrillogenesis. Int J Biol Macromol 35(1-2):9–13.
26. Sciarretta KL, Gordon DJ, Petkova AT, Tycko R, Meredith SC (2005) Abeta40-Lactam(D23/K28) models a conformation highly favorable for nucleation of amyloid. Bio-chemistry 44(16):6003–6014.
27. Garai K, Frieden C (2010) The association−dissociation behavior of the ApoE proteins:Kinetic and equilibrium studies. Biochemistry 49(44):9533–9541.
28. Johnson KA, Simpson ZB, Blom T (2009) Global kinetic explorer: A new computerprogram for dynamic simulation and fitting of kinetic data. Anal Biochem 387(1):20–29.
3326 | www.pnas.org/cgi/doi/10.1073/pnas.1222478110 Garai and Frieden

Supporting InformationGarai and Frieden 10.1073/pnas.1222478110
Fig. S1. pH dependence of oligomerization (A) and fibrillization (B) of tetramethylrhodamine (TMR)-amyloid β (Aβ)1–42. (A) Time course of fluorescencechange following dilution of a 100 μM stock solution containing monomeric TMR-Aβ1–42 prepared in 4 M GdnCl to final concentrations of 2.0 μM in 20 mMphosphate buffer at different pH values and 25 °C. The final GdnHCl concentration was 0.16 M. (B) Full time course of 2.0 μM TMR-Aβ1–42 fluorescence in 20 mMphosphate buffer at different pH values. All buffers contained 1 mM EDTA and 5 mM β-mercaptoethanol (βME). The experiments in B were performed withcontinuing stirring.
Fig. S2. Temperature dependence of oligomerization (A) and fibrillization (B) of TMR-Aβ1–42. (A) Time course of fluorescence change following dilution ofa 100 μM stock solution containing monomeric TMR-Aβ1–42 prepared in 4 M GdnCl to final concentrations of 2.0 μM in 20 mM phosphate buffer at pH 7.5 andvarious temperatures. The final GdnHCl concentration was 0.16 M. (B). Full time course of 2.0 μM TMR-Aβ1–42 fluorescence in 20 mM phosphate buffer, pH 7.5,containing 150 mM NaCl at various temperatures as shown. All buffers contained 1 mM EDTA and 5 mM βME. The experiments in B were performed withcontinuing stirring. The abscissa of B is logarithmic.
Garai and Frieden www.pnas.org/cgi/content/short/1222478110 1 of 2
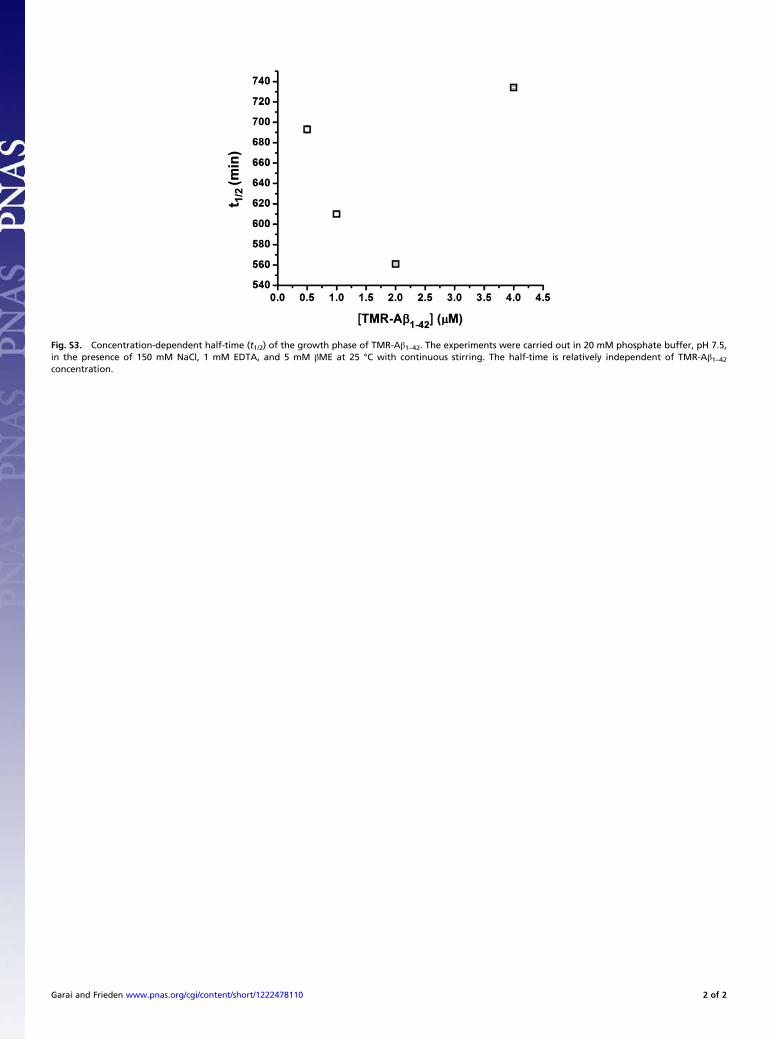
Fig. S3. Concentration-dependent half-time (t1/2) of the growth phase of TMR-Aβ1–42. The experiments were carried out in 20 mM phosphate buffer, pH 7.5,in the presence of 150 mM NaCl, 1 mM EDTA, and 5 mM βME at 25 °C with continuous stirring. The half-time is relatively independent of TMR-Aβ1–42concentration.
Garai and Frieden www.pnas.org/cgi/content/short/1222478110 2 of 2