QALYs as a Factor in Decision Making for Pharmaceuticals ... · QALYs as a Factor in Decision...
45
QALYs as a Factor in Decision Making for Pharmaceuticals in the U.S. Robert M. Kaplan Fred W. and Pamela K. Wasserman Professor Chair, Department of Health Services, UCLA School of Public Health Professor of Medicine UCLA David Geffen School of Medicine
-
Upload
truongkhanh -
Category
Documents
-
view
222 -
download
0
Transcript of QALYs as a Factor in Decision Making for Pharmaceuticals ... · QALYs as a Factor in Decision...
QALYs as a Factor in Decision Making for Pharmaceuticals in
the U.S.Robert M. Kaplan
Fred W. and Pamela K. Wasserman ProfessorChair, Department of Health Services, UCLA School of
Public HealthProfessor of Medicine
UCLA David Geffen School of Medicine

Question 1
How can we best use our resources to improve public
health?

Level of Economic Analysis
ν Macro level--informs policy
ν Micro level-informs clinical decisions
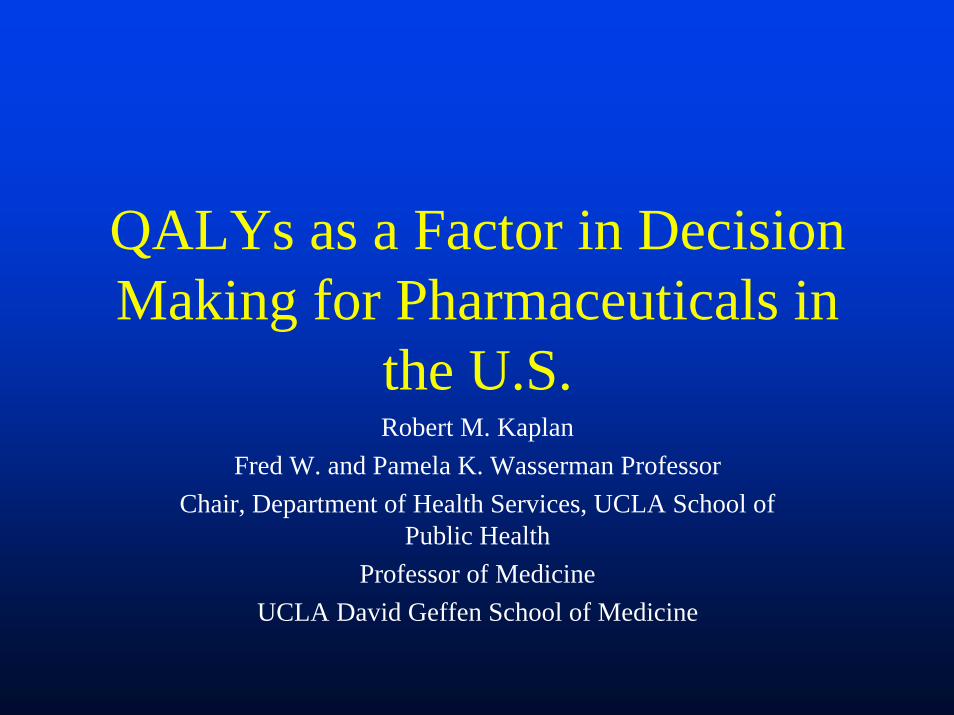
Example Macro Problem
ν Oregon - late 1980sν Medcaid costs were increasing 25% per yearν Medicaid coped with the problem by changing eligibility
thresholdν Number of people covered reduced to 200,000 among
600,000 eligibleν Proposed rationing services rather than peopleν Goal was to increase number covered

Macro Level Decision
ν Fixed level of resourcesν Potentially infinite demandν Need to make effective/efficient use
of resourcesν Set priorities-make choices
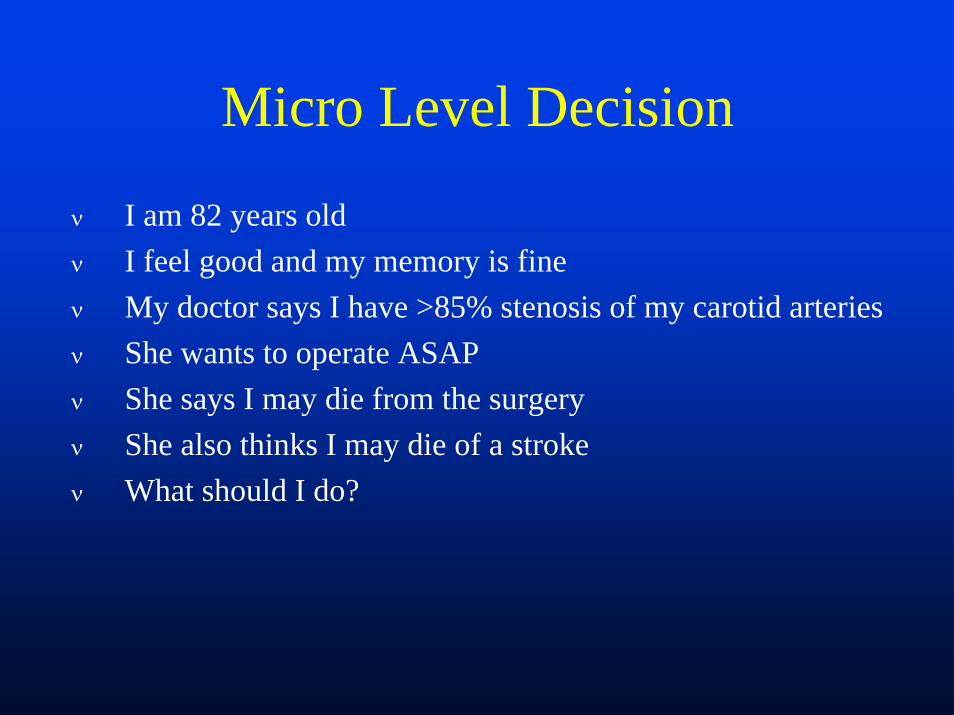
Micro Level Decision
ν I am 82 years oldν I feel good and my memory is fineν My doctor says I have >85% stenosis of my carotid arteriesν She wants to operate ASAPν She says I may die from the surgeryν She also thinks I may die of a strokeν What should I do?

If widely different interventions are to be compared…..
ν The measure of health must be able to encompass not only differences in length of life but differences in the quality of that life, in symptoms and ability to function.
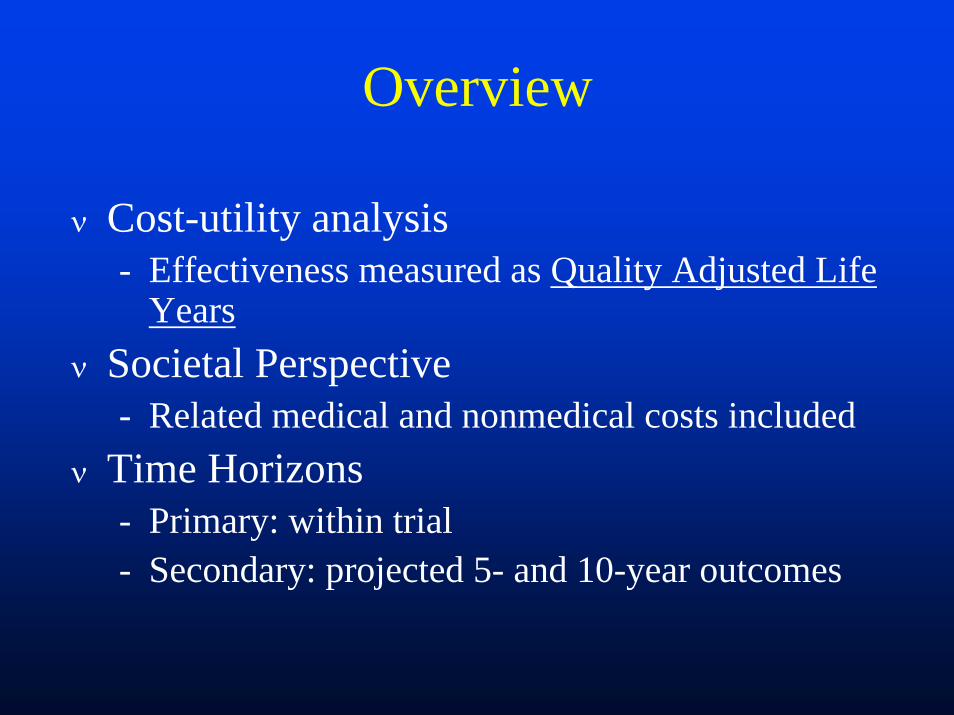
Overview
ν Cost-utility analysis- Effectiveness measured as Quality Adjusted Life
Yearsν Societal Perspective
- Related medical and nonmedical costs includedν Time Horizons
- Primary: within trial- Secondary: projected 5- and 10-year outcomes

Medicare Expense Variations

The Boston New Haven Difference Continues Through
2000
1.01.0
2.02.0
3.03.0
4.04.0
5.05.0
6.06.0
7.07.0
8.08.0
9.09.0
10.010.0
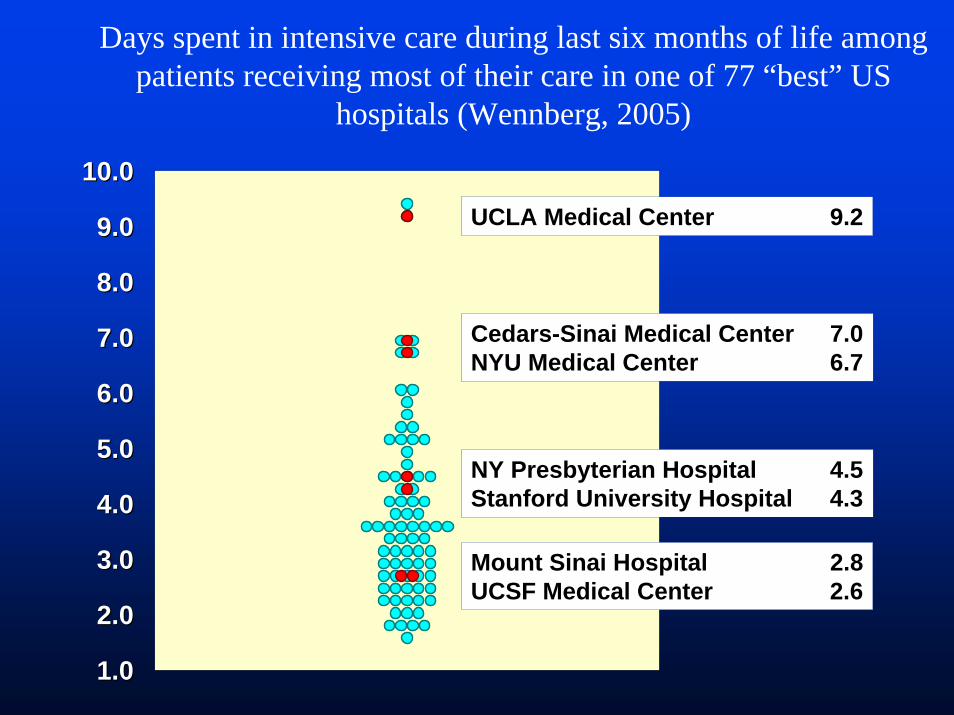
NY Presbyterian Hospital 4.5Stanford University Hospital 4.3
UCLA Medical Center 9.2
Cedars-Sinai Medical Center 7.0NYU Medical Center 6.7
Mount Sinai Hospital 2.8UCSF Medical Center 2.6
Days spent in intensive care during last six months of life among patients receiving most of their care in one of 77 “best” US
hospitals (Wennberg, 2005)
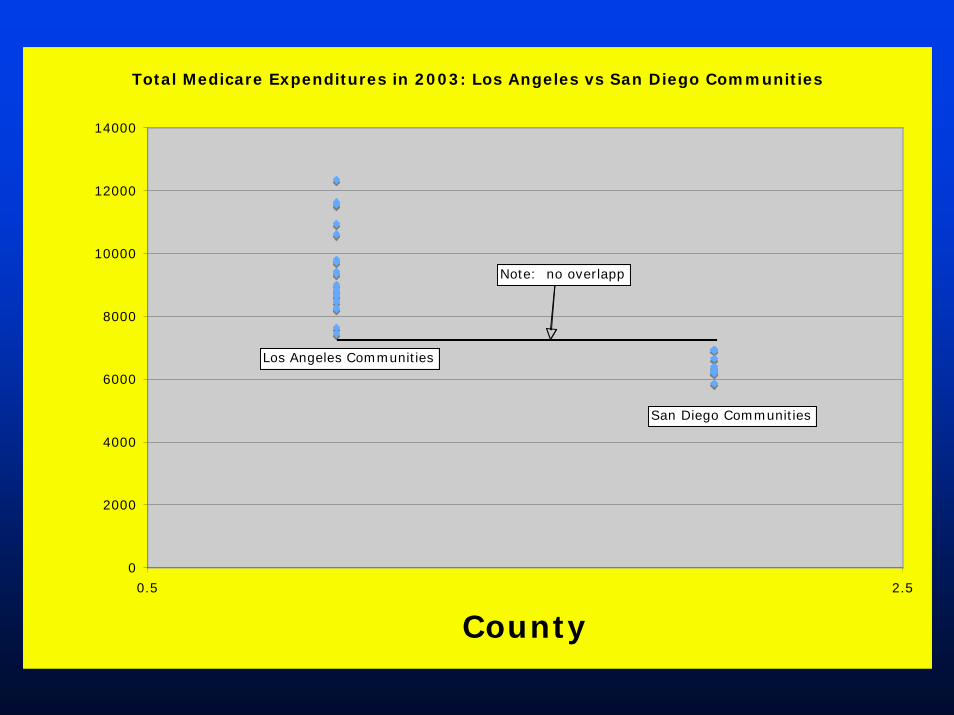
Total Medicare Expenditures in 2003: Los Angeles vs San Diego Communities
0
2000
4000
6000
8000
10000
12000
14000
0.5 2.5
County
Los Angeles Communities
San Diego Communities
Note: no overlapp
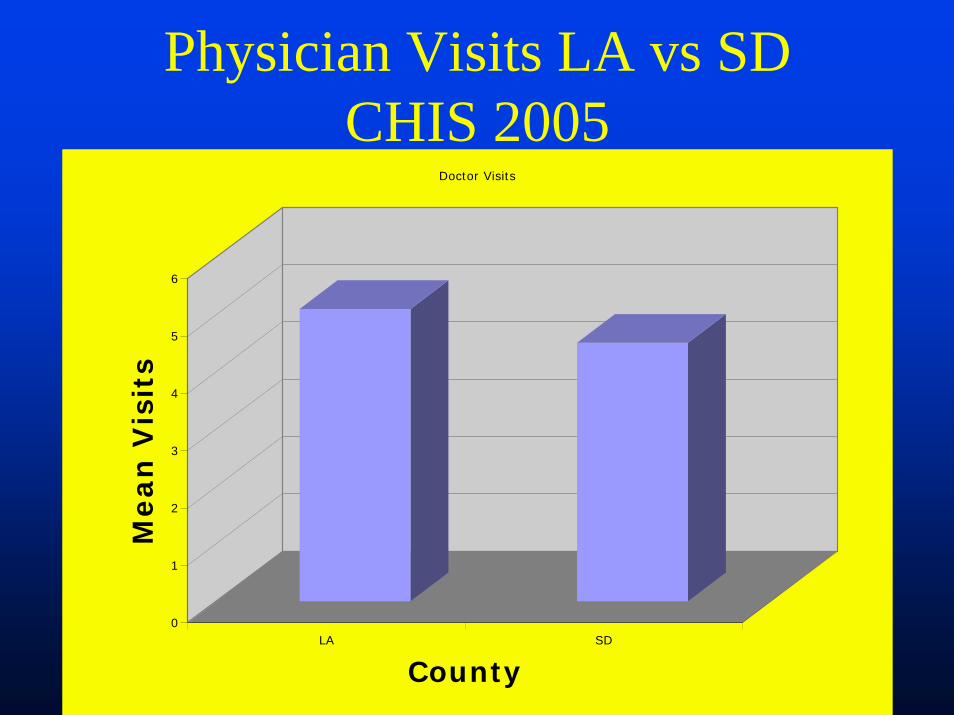
Physician Visits LA vs SDCHIS 2005
0
1
2
3
4
5
6
Mean
Vis
its
LA SD
County
Doctor Visits

Percent Medicare Recipients With No Physician Visits: CHIS 2005
0
1
2
3
4
5
6
7
8
9
10
Perc
en
t
LA SD
County
% Zero Visits
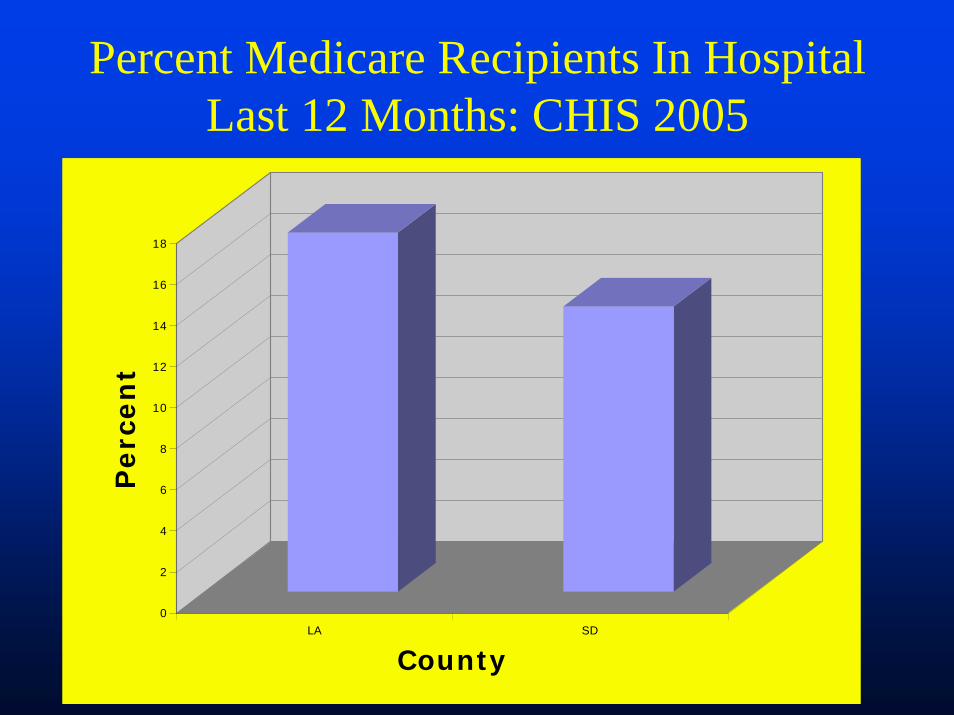
Percent Medicare Recipients In Hospital Last 12 Months: CHIS 2005
0
2
4
6
8
10
12
14
16
18
Perc
en
t
LA SD
County
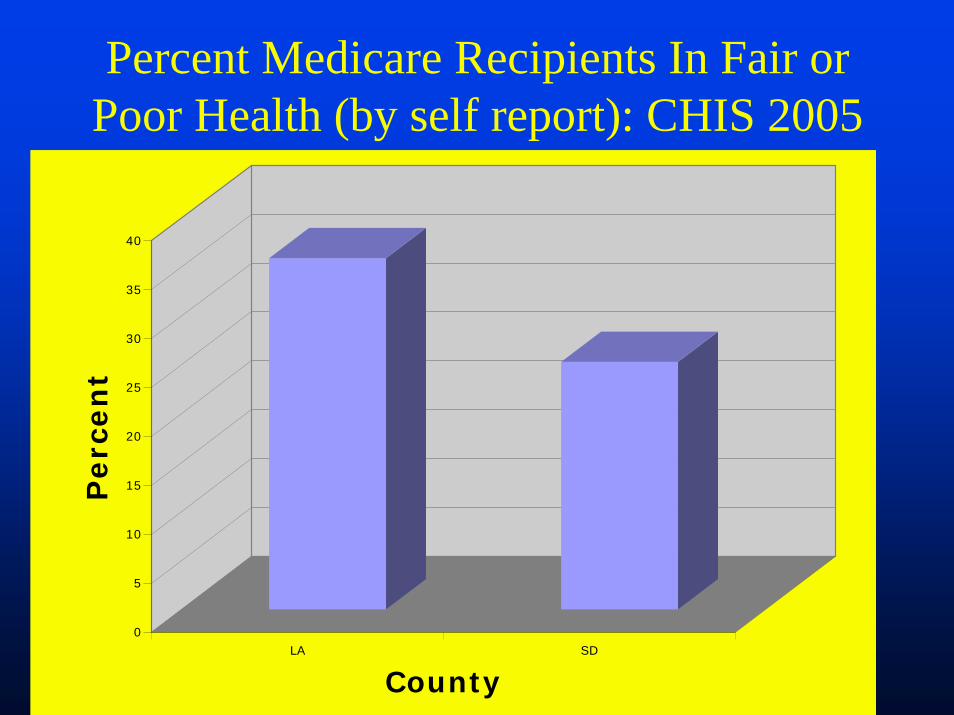
Percent Medicare Recipients In Fair or Poor Health (by self report): CHIS 2005
0
5
10
15
20
25
30
35
40
Perc
en
t
LA SD
County
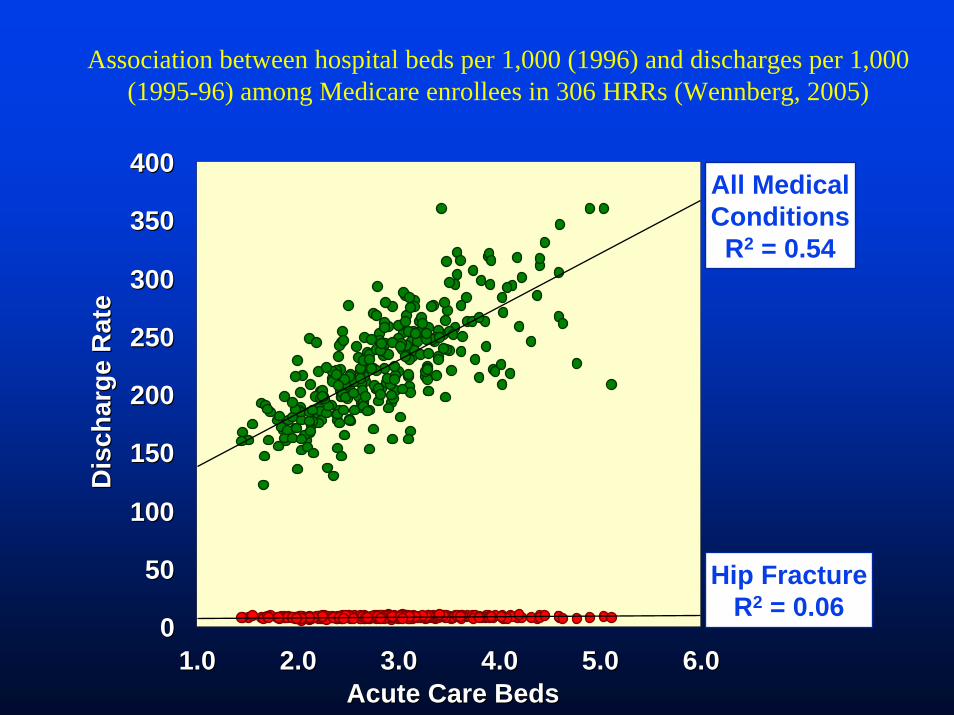
Hip FractureR2 = 0.06
All MedicalConditionsR2 = 0.54
00
5050
100100
150150
200200
250250
300300
350350
400400
1.01.0 2.02.0 3.03.0 4.04.0 5.05.0 6.06.0Acute Care BedsAcute Care Beds
Dis
char
ge R
ate
Dis
char
ge R
ate
Association between hospital beds per 1,000 (1996) and discharges per 1,000 (1995-96) among Medicare enrollees in 306 HRRs (Wennberg, 2005)
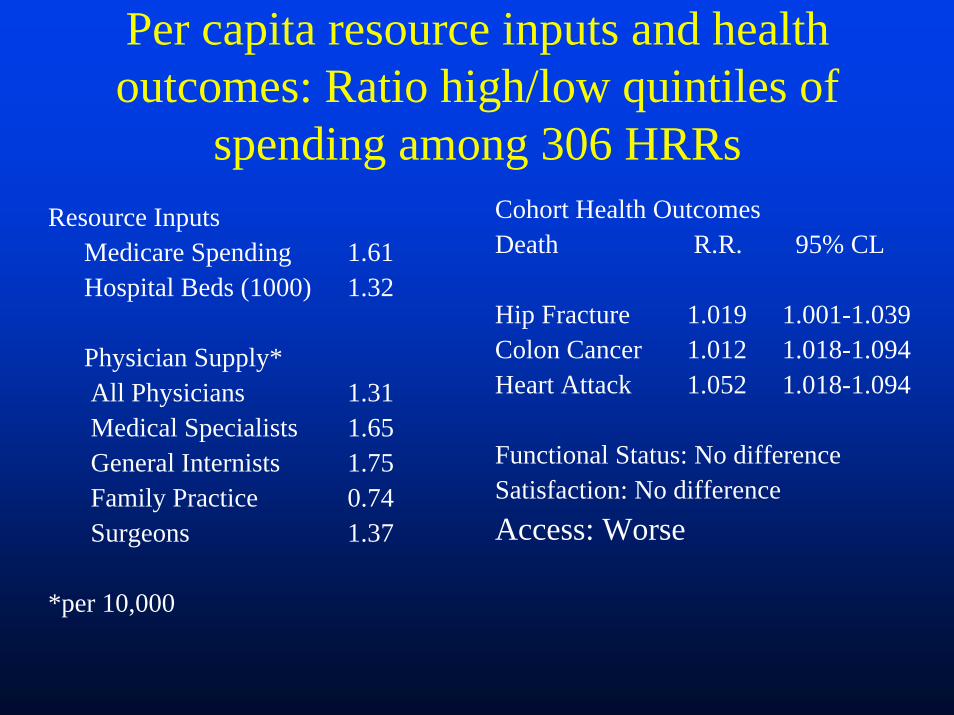
Per capita resource inputs and health outcomes: Ratio high/low quintiles of
spending among 306 HRRsResource Inputs
Medicare Spending 1.61Hospital Beds (1000) 1.32
Physician Supply* All Physicians 1.31Medical Specialists 1.65General Internists 1.75Family Practice 0.74Surgeons 1.37
*per 10,000
Cohort Health OutcomesDeath R.R. 95% CL
Hip Fracture 1.019 1.001-1.039Colon Cancer 1.012 1.018-1.094 Heart Attack 1.052 1.018-1.094
Functional Status: No differenceSatisfaction: No differenceAccess: Worse
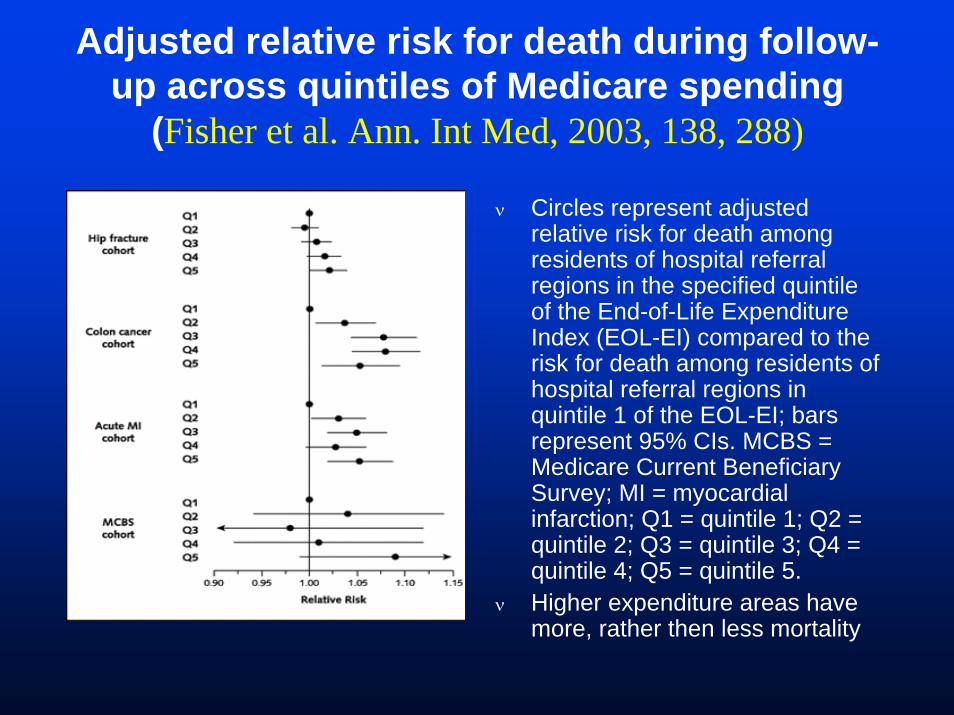
Adjusted relative risk for death during follow-up across quintiles of Medicare spending
(Fisher et al. Ann. Int Med, 2003, 138, 288)
ν Circles represent adjusted relative risk for death among residents of hospital referral regions in the specified quintile of the End-of-Life Expenditure Index (EOL-EI) compared to the risk for death among residents of hospital referral regions in quintile 1 of the EOL-EI; bars represent 95% CIs. MCBS = Medicare Current Beneficiary Survey; MI = myocardial infarction; Q1 = quintile 1; Q2 = quintile 2; Q3 = quintile 3; Q4 = quintile 4; Q5 = quintile 5.
ν Higher expenditure areas have more, rather then less mortality
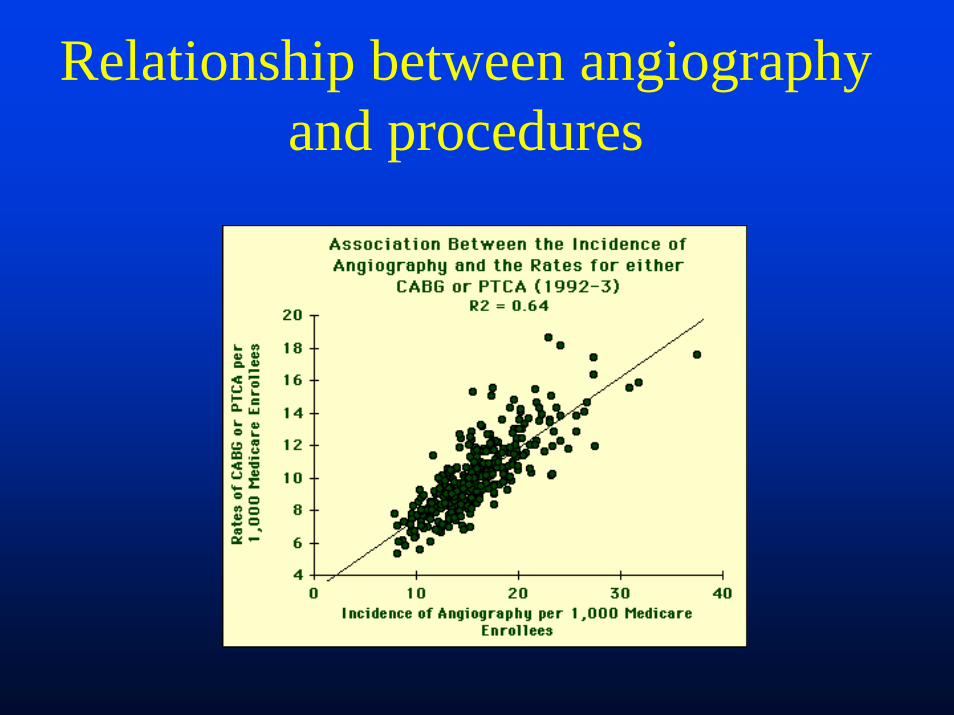
Relationship between angiography and procedures
Angiography US Vs. Canada
Where would you prefer to have your MI. USA or Canada?
QuickTime™ and aAnimation decompressor
are needed to see this picture.
QuickTime™ and aAnimation decompressor
are needed to see this picture.
Procedures US Vs Canada
Mortality US Vs Canada

Example Policy Problem
ν Oregon - late 1980sν Medcaid costs were increasing 25% per yearν Medicaid coped with the problem by changing eligibility
thresholdν Number of people covered reduced to 200,000 among
600,000 eligibleν Proposed rationing services rather than peopleν Goal was to increase number covered
Oregon Medicaid Experiment
Initial proposal included prioritization by cost/utility of as an alternative to a more subjective approach

Oregon Prioritized List, February 1995 (Top)
ν Medical or surgical treatment for moderate or severe head injury
ν Medical therapy, insulin dependent diabetes mellitus
ν Treatment of peritonitisν Therapy (including dialysis) for acute
glomerulonephritis

Oregon Prioritized List, February 1995 (Middle)
ν Medical therapy for rheumatoid arthritisν Medical/psychotherapy for anxiety disorderν Surgical repair for cleft palateν Medical therapy for rheumatic fever

Oregon Prioritized List, February 1995 (Bottom)
ν Evaluation of conditions of the eye for which there is no effective treatment
ν Evaluation of conditions of the heart for which there is no effective treatment
ν In-vitro fertilization for tubal dysfunctionν Radial keratotomy for disorders of refraction
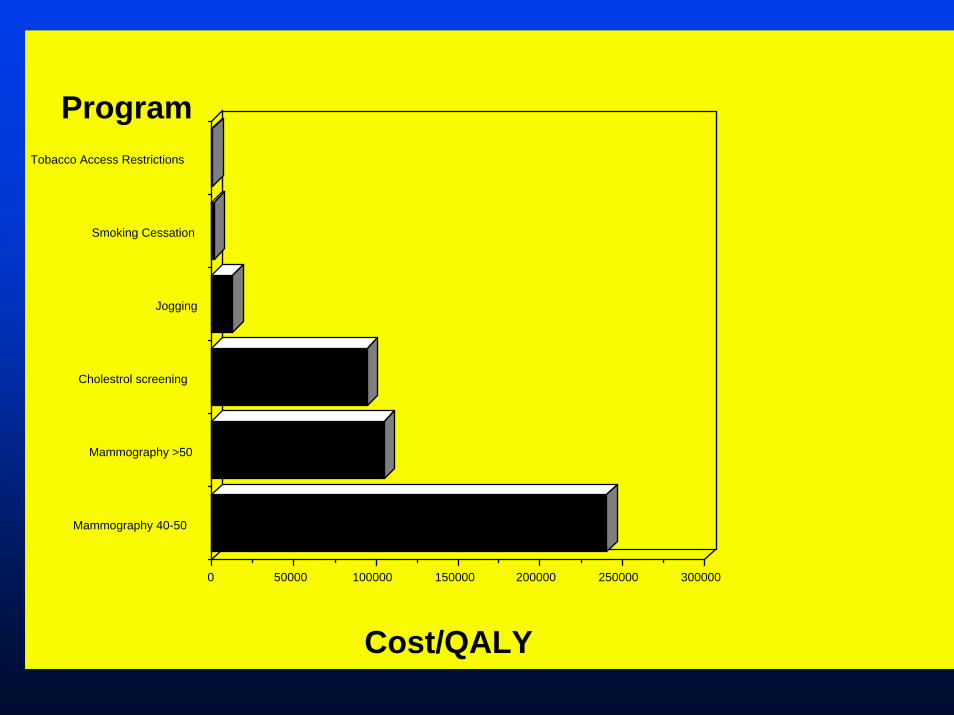
300000250000200000150000100000500000
Mammography 40-50
Mammography >50
Cholestrol screening
Jogging
Smoking Cessation
Tobacco Access Restrictions
Cost/QALY
Program
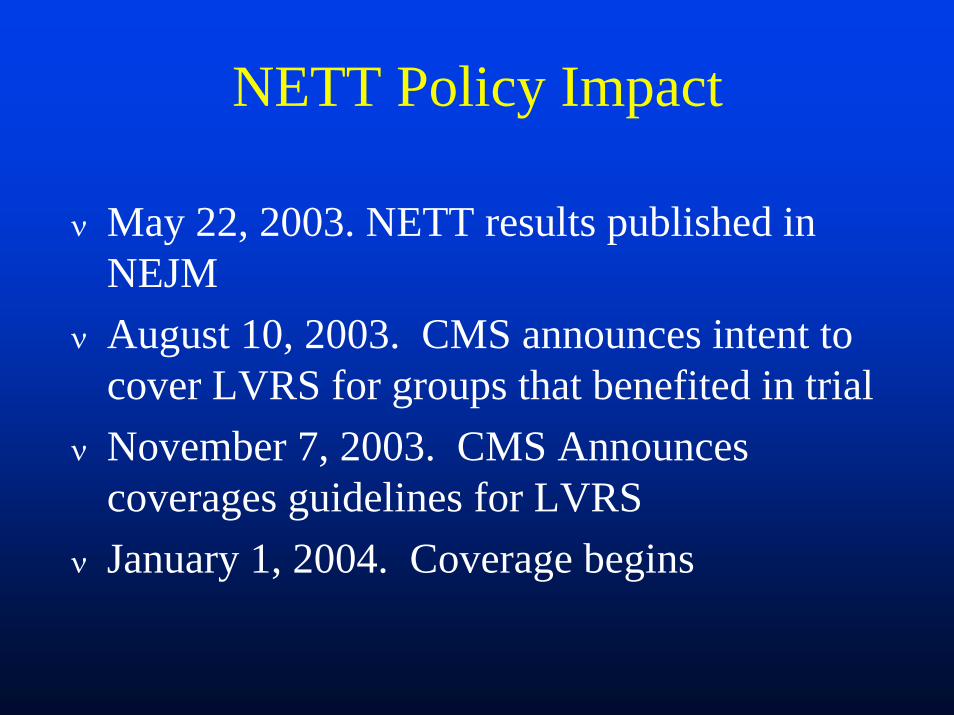
NETT Policy Impact
ν May 22, 2003. NETT results published in NEJM
ν August 10, 2003. CMS announces intent to cover LVRS for groups that benefited in trial
ν November 7, 2003. CMS Announces coverages guidelines for LVRS
ν January 1, 2004. Coverage begins
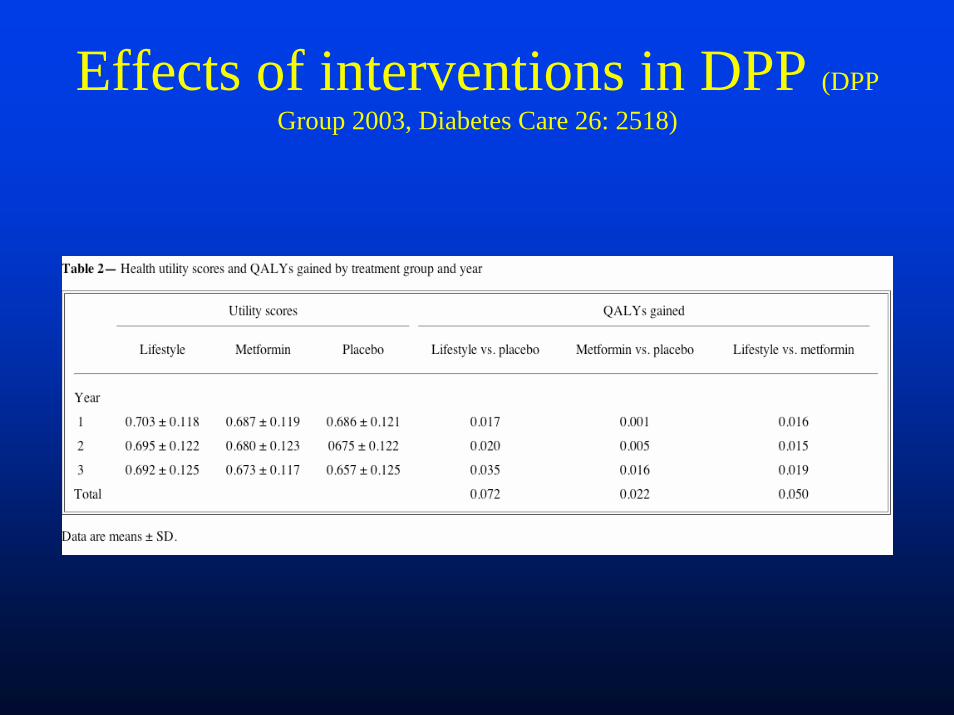
Effects of interventions in DPP (DPP Group 2003, Diabetes Care 26: 2518)
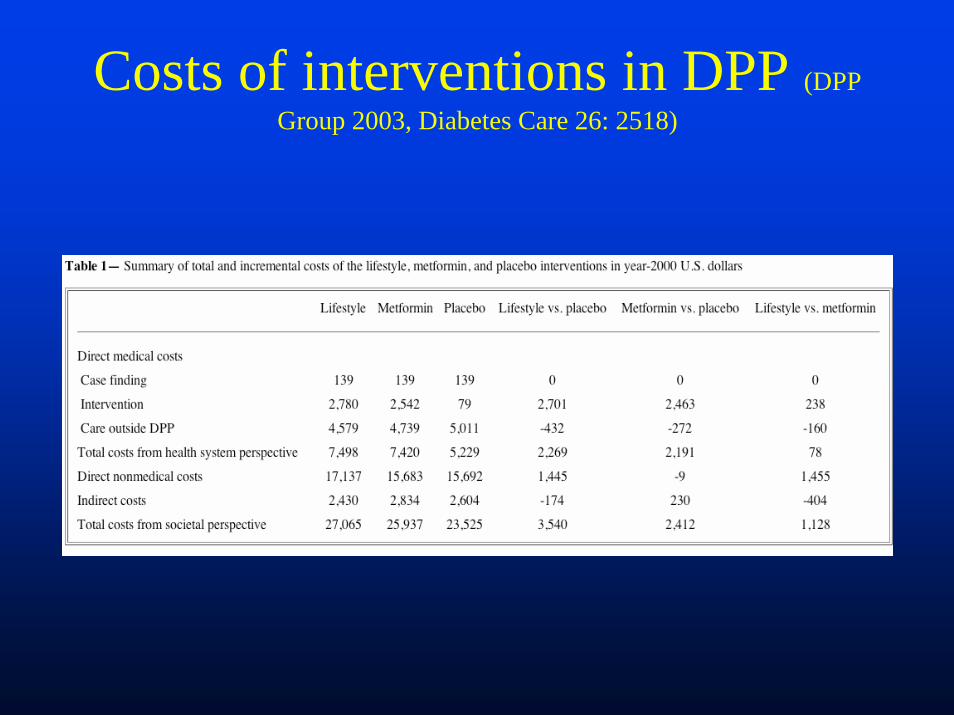
Costs of interventions in DPP (DPP Group 2003, Diabetes Care 26: 2518)

Cost/QALY in DPP (DPP Group 2003, Diabetes Care 26: 2518)
0
20000
40000
60000
80000
100000
120000
Co
st/
QA
LY
Livestyle Metformin
Intervention
Cost/QALY of Lifestyle and Metformin in DPP: Health System Perspective
PlaceboNothing

What has held us back?
ν Distractions- Disagreements on which measure is best- Disagreements on general philosophy of
outcome measurement» Generic vs disease specific» Psychometric vs. utility based» Disciplinary differences – statistics, economics,
medicine, psychology, anthropology….
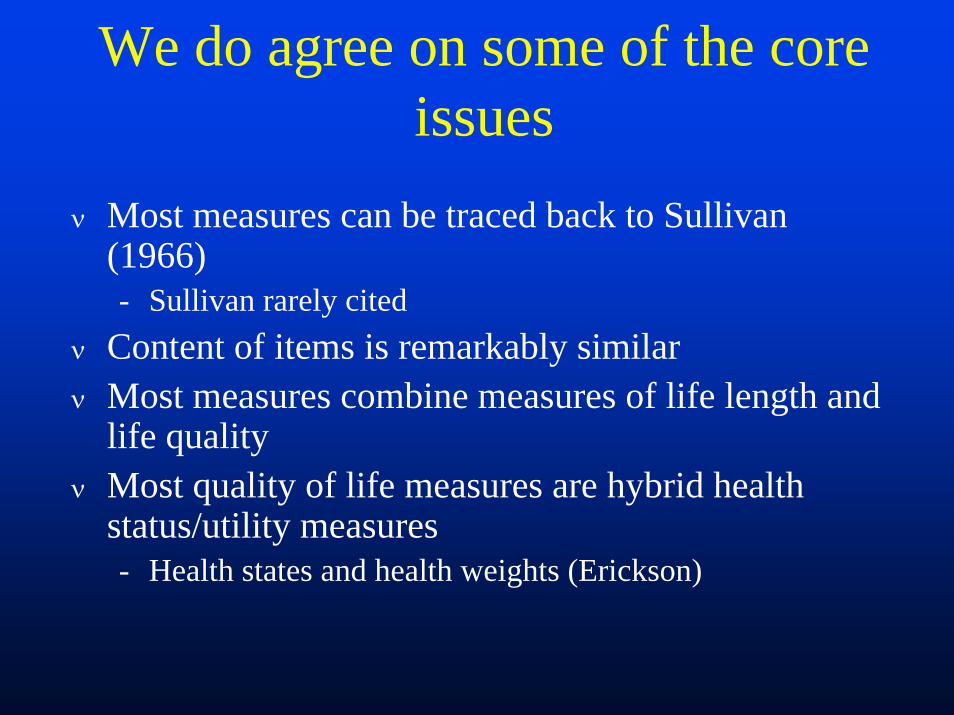
We do agree on some of the core issues
ν Most measures can be traced back to Sullivan (1966)- Sullivan rarely cited
ν Content of items is remarkably similarν Most measures combine measures of life length and
life qualityν Most quality of life measures are hybrid health
status/utility measures- Health states and health weights (Erickson)
John Ware
ν Think of different approaches as brand names of products designed to measure the same underlying construct… health
Response Shift
ν Preferences of patients and non-patients differ
ν As a result, preferences weights have no meaning
ν But, is this supported by evidence?
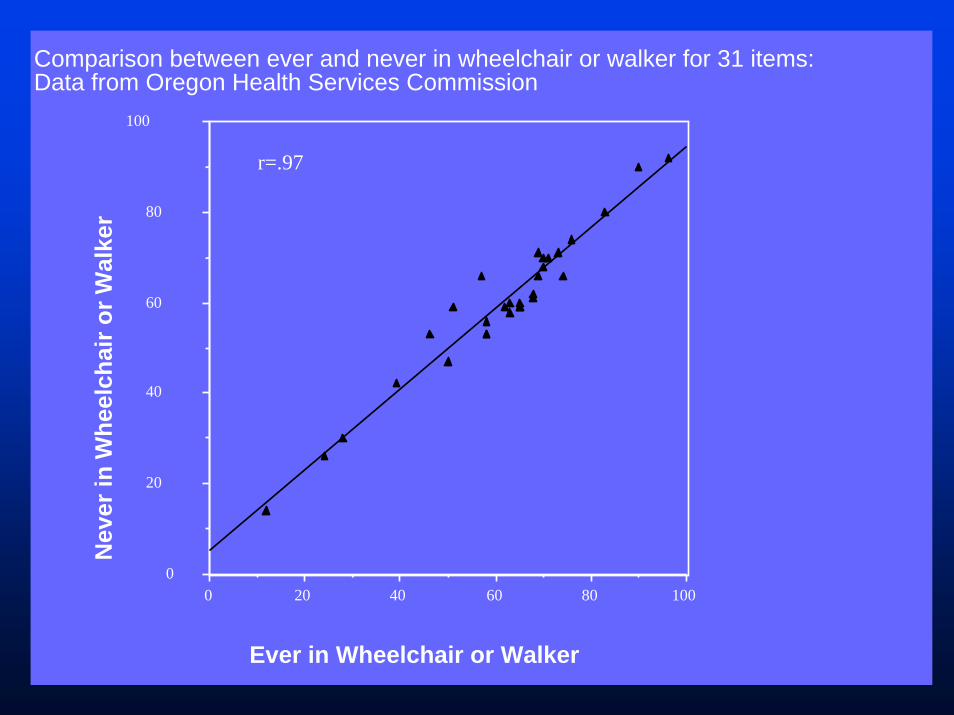
Wheelchair versus Not in Chair
1008060402000
20
40
60
80
100
Comparison between ever and never in wheelchair or walker for 31 items: Data from Oregon Health Services Commission
Ever in Wheelchair or Walker
Nev
er in
Whe
elch
air o
r Wal
ker
r=.97

QWB Weights US- 1975 vs Trinidad-Tobago 2000 (from Hector 2007)
Preference and Utility Assessment
νStandard GambleνTime Trade-offνRating ScalesνThink scoring systems
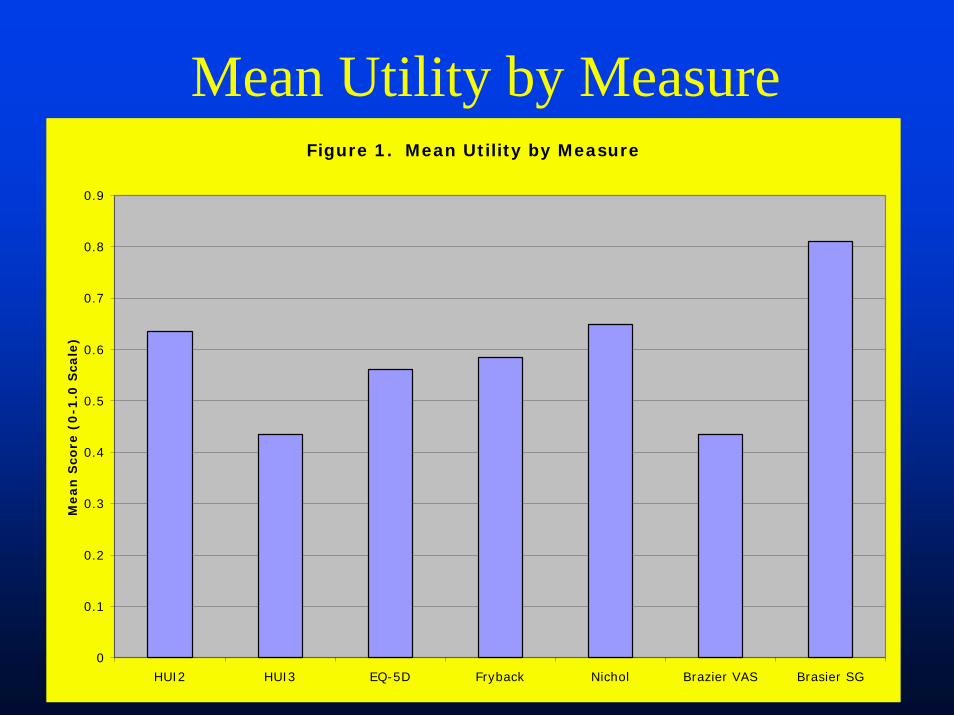
Mean Utility by MeasureFigure 1. Mean Utility by Measure
0
0.1
0.2
0.3
0.4
0.5
0.6
0.7
0.8
0.9
HUI2 HUI3 EQ-5D Fryback Nichol Brazier VAS Brasier SG
Mean
Sco
re (
0-1
.0 S
cale
)

All measures captured clinical change
0.00
0.05
0.10
0.15
0.20
0.25
0.30
0.35
Nichol Fryback Brazier VAS Brazier SG EQ 5-D HUI
Failed ACR20ACR 20ACR 50
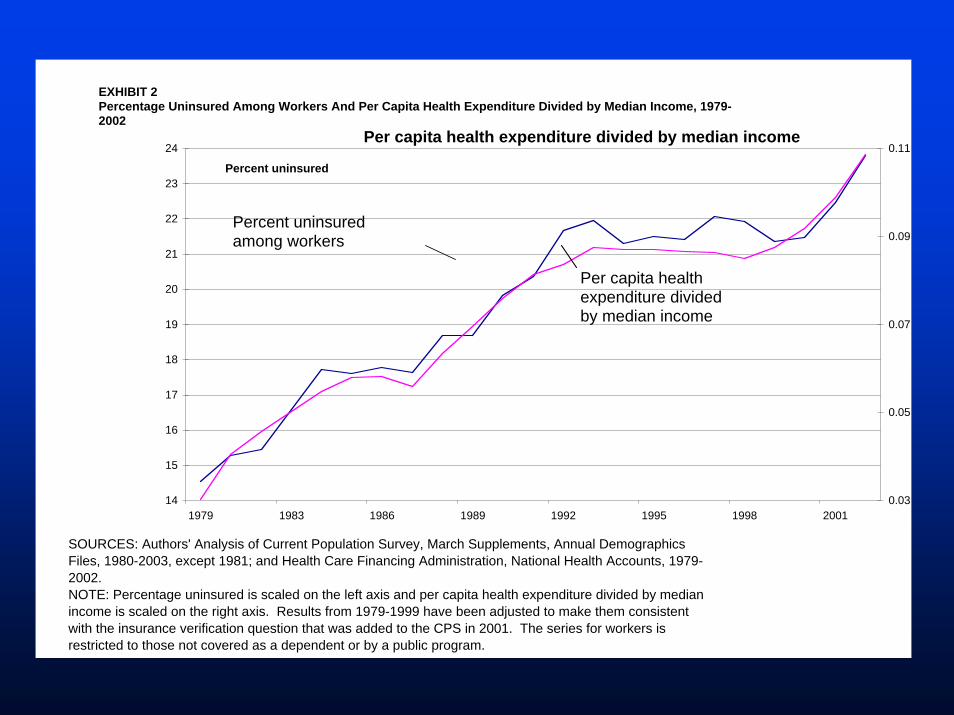
EXHIBIT 2Percentage Uninsured Among Workers And Per Capita Health Expenditure Divided by Median Income, 1979-2002
14
15
16
17
18
19
20
21
22
23
24
1979 1983 1986 1989 1992 1995 1998 2001
Percent uninsured
0.03
0.05
0.07
0.09
0.11
Percent uninsured among workers
Per capita health expenditure divided by median income
SOURCES: Authors' Analysis of Current Population Survey, March Supplements, Annual Demographics Files, 1980-2003, except 1981; and Health Care Financing Administration, National Health Accounts, 1979-2002.NOTE: Percentage uninsured is scaled on the left axis and per capita health expenditure divided by median income is scaled on the right axis. Results from 1979-1999 have been adjusted to make them consistent with the insurance verification question that was added to the CPS in 2001. The series for workers is restricted to those not covered as a dependent or by a public program.
Per capita health expenditure divided by median income
Summary
ν Utility-based measures are available to estimate the impact of pharmaceutical products
ν Generic methods allow the comparison of investments in drugs with investments in other aspects of health care
ν There are very few applications at presentν We look forward to the development of these
methods for studies on pharmaceutical regulation.


![Maroussi, 4-6-2013 Decision no. 693/9 DECISION Regulation ...Maroussi, 4-6-2013 Decision no. 693/9 DECISION «Regulation on Management and Assignment of [.gr] Domain Names» The Hellenic](https://static.fdocument.org/doc/165x107/5ff09edd49cda41bcc425ac3/maroussi-4-6-2013-decision-no-6939-decision-regulation-maroussi-4-6-2013.jpg)


![Decision making. Blaise Pascal 1623 - 1662 Probability in games of chance How much should I bet on ’20’? E[gain] = Σgain(x) Pr(x)](https://static.fdocument.org/doc/165x107/56649d565503460f94a34f31/decision-making-blaise-pascal-1623-1662-probability-in-games-of-chance.jpg)