PURIFICATION OF THE ALPHA SUBUNIT OF THE EPITHELIAL SODIUM …
86
PURIFICATION OF THE ALPHA SUBUNIT OF THE EPITHELIAL SODIUM CHANNEL (αENAC) FOR SURFACE PLASMON RESONANCE (SPR) STUDIES by Chance N. Berman, B.S A thesis submitted to the Graduate Council of Texas State University in partial fulfillment of the requirements for the degree of Master of Science with a Major in Biochemistry December 2016 Committee Members: Rachell Booth, Chair Wendi David Karen Lewis
Transcript of PURIFICATION OF THE ALPHA SUBUNIT OF THE EPITHELIAL SODIUM …
PURIFICATION OF THE ALPHA SUBUNIT OF THE EPITHELIAL SODIUM CHANNEL (αENAC)
FOR SURFACE PLASMON RESONANCE (SPR) STUDIES
by
Chance N. Berman, B.S
A thesis submitted to the Graduate Council of Texas State University in partial fulfillment
of the requirements for the degree of Master of Science
with a Major in Biochemistry December 2016
Committee Members:
Rachell Booth, Chair
Wendi David
Karen Lewis

COPYRIGHT
by
Chance Novelli Berman
2016
FAIR USE AND AUTHOR’S PERMISSION STATEMENT
Fair Use
This work is protected by the Copyright Laws of the United States (Public Law 94-553,
section 107). Consistent with fair use as defined in the Copyright Laws, brief quotations
from this material are allowed with proper acknowledgment. Use of this material for
financial gain without the author’s express written permission is not allowed.
Duplication Permission
As the copyright holder of this work I, Chance Novelli Berman, authorize duplication of this work, in whole or in part, for educational or scholarly purposes only with written permission.

iv
ACKNOWLEDGEMENTS
I would first like to thank Dr. Rachell Booth for all her guidance and support with
this project. I joined Dr. Booth’s lab during my undergraduate junior year with course
lab experience only. She welcomed me in the lab and gave me the opportunity to
conduct scientific research. Without her extreme patients and support throughout my
undergraduate career and graduate career, she allowed me to explore the world of
scientific research which in turn helped me flourish as a graduate student. In addition to
Dr. Booth, I would like to thank my committee members, Dr. Wendi David and Dr. Karen
Lewis, whose guidance and support for my research was paramount to my success in
graduate school.
Secondly, I would like to thank all the members of the Booth research lab, past
and present, who have aided me along the way especially Samantha Swann who
introduced me to Dr. Booth when I was an undergraduate teachers assistant. Without
out her I would never have indulged into scientific research and most likely would not
have pursued my graduate degree. Also, to all the other lab members I got the privilege
to work with over the last 3 years which added to my success and their assistance
should not go unnoticed.

v
Lastly I would like to thank my family. My parents, Jerry and Marina, who were
always guiding and supporting me to always strive to do better throughout my college
career. I would also like to thank my best friend, my wife, Skyler Berman. Her
unconditional love, patients, and support throughout this journey drove me to become
the man I am today.
vi
TABLE OF CONTENTS
Page
ACKNOWLEDGEMENTS ....................................................................................................... iv
LIST OF TABLES ................................................................................................................... vii
LIST OF FIGURES ................................................................................................................ viii
ABSTRACT ............................................................................................................................ xi
CHAPTER
I. INTRODUCTION AND LITERATURE REVIEW ............................................................ 1 II. MATERIALS AND METHODS .................................................................................. 13
III. RESULTS AND DISCUSSION ................................................................................... 27 IV. CONCLUSION ......................................................................................................... 70
LITERATURE CITED ............................................................................................................ 73
vii
LIST OF TABLES
Table Page
1. PCR primers used .................................................................................................. 14
2. Peptide sequences ................................................................................................ 21
3. Concentrations of peptide/protein injections and interactions with immobilized peptide ......................................................................... 26
4. ENaC peptides and their location ......................................................................... 43
5. Summary of ENaC peptide Fractions quantitated ................................................ 54
6. GST-E438 vs N285 kinetics .................................................................................... 58
7. GST-N285 vs E438 kinetics .................................................................................... 59
8. GST-E254 vs Q444 kinetics .................................................................................... 60
9. GST-Q444 vs E254 kinetics .................................................................................... 62
10. GST-E438 vs αENaC kinetics .................................................................................. 63
11. GST-N285 vs αENaC kinetics ................................................................................. 64
12. GST-E254 vs αENaC kinetics .................................................................................. 65
13. GST-E438 vs αHis2-αENaC kinetics ....................................................................... 67
14. GST-N285 vs αHis2-αENaC kinetics....................................................................... 68
15. GST-E254 vs αHis2-αENaC kinetics ....................................................................... 69
16. Summary of Kinetics ............................................................................................. 72
viii
LIST OF FIGURES
Figure Page
1. Cross-sectional area of the kidney with emphasis on the nephron ................................................................................................ 2
2. Depiction of epithelial cells which line the distal convoluted tubules, representing the movement of sodium and potassium ions through the cell ........................................................................................... 3
3. ENaC/DEG family conserved protein sequences .................................................... 4
4. Predicted heterotrimeric structure of ENaC ........................................................... 5
5. Predicted quaternary and secondary structure of ENaC ........................................ 6
6. Regulation of ENaC in an epithelial cell .................................................................. 9
7. Polymerase Chain Reaction (PCR) of αHis2-αENaC gene from pmαHis2-αENaC plasmid DNA ......................................................... 28
8. Gel extraction of digested αHis2-αENaC PCR product and digested pYES2/NTA plasmid DNA ..................................................... 29
9. pYES2/NTA/αHis2-αENaC plasmid isolation and digestion from Top 10™ E. coli cells to verify cloning .............................................. 32
10. Survival dilution growth “pronging” assay in BY4742 yeast cells ......................... 33
11. Survival dilution growth “pronging” assay in S1 yeast cells ................................. 34
12. Western blot analysis of αHis2-αENaC using different lysis conditions ............... 36
13. Western blot analysis of αHis2-αENaC time course in BY4742 yeast strain ........ 39
14. Western blot analysis of αHis2-αENaC time course in S1 yeast strain ................. 40
ix
15. IMAC purification of αHis2-αENaC analyzed by western blotting ........................ 42
16. Plasmid Isolation of ENaC ligand genes ................................................................ 43
17. Expressed GST-ENaC fusion proteins in total cell lysate ...................................... 46
18. ISAC purification of GST-N285 analyzed by SDS-PAGE ......................................... 50
19. ISAC purification of GST-E254 analyzed by SDS-PAGE .......................................... 51
20. ISAC purification of GST-E438 analyzed by SDS-PAGE .......................................... 52
21. ISAC purification of GST-Q444 analyzed by SDS-PAGE ......................................... 53
22. CM5 chip activation and immobilization of GST-E438 ......................................... 56
23. Kinetic evaluation of binding assay of N285 analyte to GST fusion peptide E438 .................................................................................. 57
24. Kinetic evaluation of binding assay of E438 analyte to GST fusion peptide N285 ................................................................................. 59
25. Kinetic evaluation of binding assay of Q444 analyte to GST fusion peptide E254 .................................................................................. 60
26. Kinetic evaluation of binding assay of E254 analyte to GST fusion peptide Q444 ................................................................................. 61
27. Kinetic evaluation of binding assay of αENaC analyte to GST fusion peptide E438 .................................................................................. 63
28. Kinetic evaluation of binding assay of αENaC analyte to GST fusion peptide N285 ................................................................................. 64
29. Kinetic evaluation of binding assay of αENaC analyte to GST fusion peptide E254 .................................................................................. 65
30. Kinetic evaluation of binding assay of αHis2-αENaC analyte to GST fusion peptide E438 .................................................................................. 66
x
31. Kinetic evaluation of binding assay of αHis2-αENaC analyte to GST fusion peptide N285 ................................................................................. 68
32. Kinetic evaluation of binding assay of αHis2-αENaC analyte to GST fusion peptide E254 .................................................................................. 69
xi
ABSTRACT
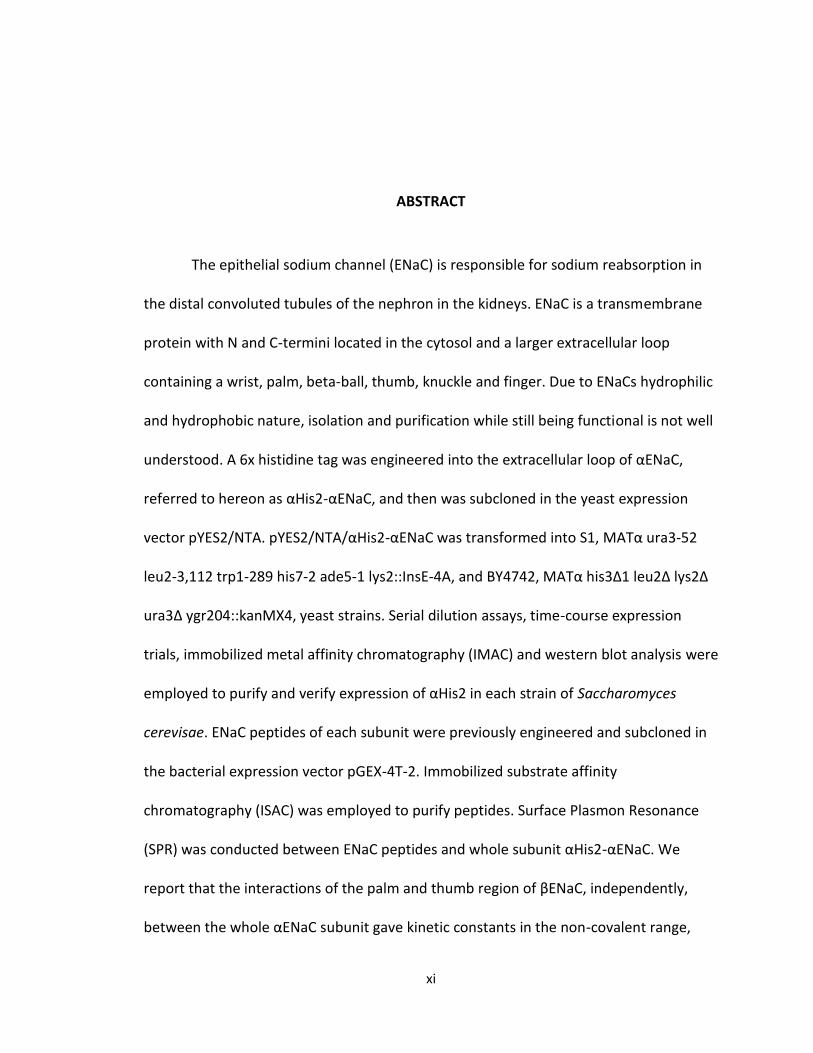
The epithelial sodium channel (ENaC) is responsible for sodium reabsorption in
the distal convoluted tubules of the nephron in the kidneys. ENaC is a transmembrane
protein with N and C-termini located in the cytosol and a larger extracellular loop
containing a wrist, palm, beta-ball, thumb, knuckle and finger. Due to ENaCs hydrophilic
and hydrophobic nature, isolation and purification while still being functional is not well
understood. A 6x histidine tag was engineered into the extracellular loop of αENaC,
referred to hereon as αHis2-αENaC, and then was subcloned in the yeast expression
vector pYES2/NTA. pYES2/NTA/αHis2-αENaC was transformed into S1, MATα ura3-52
leu2-3,112 trp1-289 his7-2 ade5-1 lys2::InsE-4A, and BY4742, MATα his3∆1 leu2∆ lys2∆
ura3∆ ygr204::kanMX4, yeast strains. Serial dilution assays, time-course expression
trials, immobilized metal affinity chromatography (IMAC) and western blot analysis were
employed to purify and verify expression of αHis2 in each strain of Saccharomyces
cerevisae. ENaC peptides of each subunit were previously engineered and subcloned in
the bacterial expression vector pGEX-4T-2. Immobilized substrate affinity
chromatography (ISAC) was employed to purify peptides. Surface Plasmon Resonance
(SPR) was conducted between ENaC peptides and whole subunit αHis2-αENaC. We
report that the interactions of the palm and thumb region of βENaC, independently,
between the whole αENaC subunit gave kinetic constants in the non-covalent range,

xii
potentially being an inter-subunit binding domain. Additional studies would use longer
peptides, thought to be portions/ whole binding domains, to further elucidate inter-
subunit binding regions.
1
I. INTRODUCTION AND LITERATURE REVIEW
The ability of the human body to osmotically regulate sodium is critical for the
circulatory system to maintain a physiological blood pressure. Deviations from
homeostasis cause diseases such as heart, renal, hypertension, and hypotension (1).
Regulation of sodium occurs in epithelial cells in the pulmonary system, colorectal
system, and distal tubules of the kidney. Fine-tuning of sodium reabsorption is, in part,
accomplished in these organs by the up or down regulation of the epithelial sodium
channel, ENaC (2).
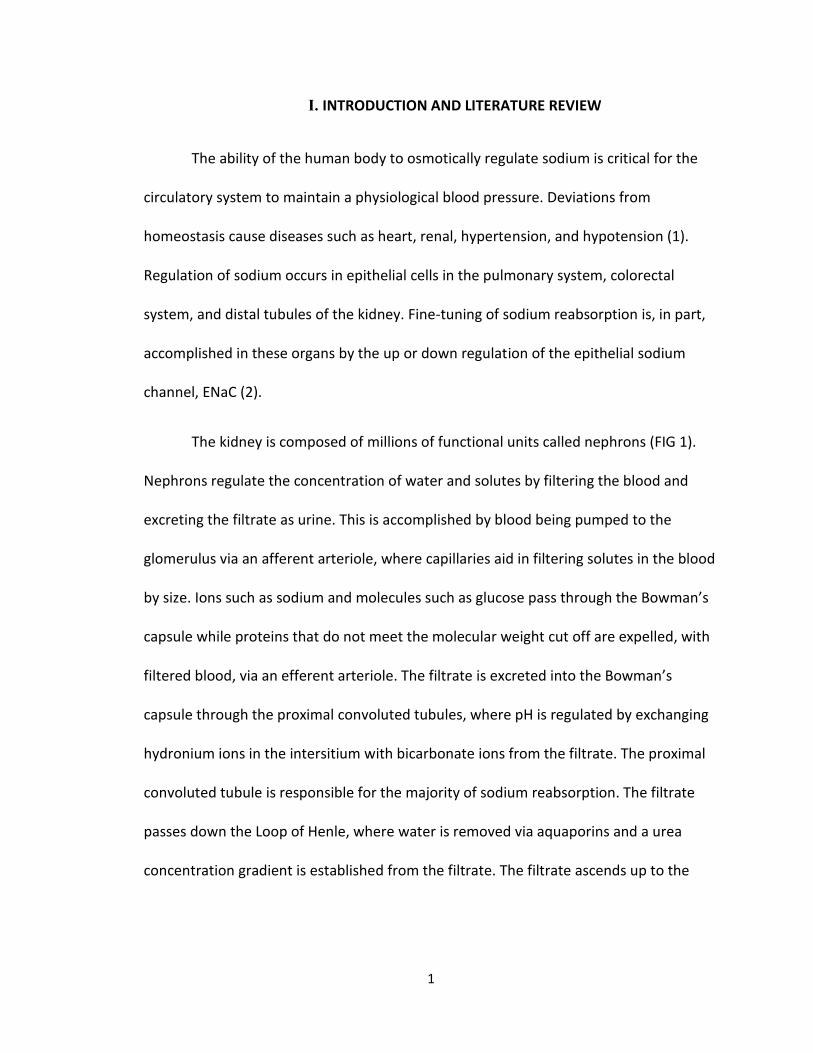
The kidney is composed of millions of functional units called nephrons (FIG 1).
Nephrons regulate the concentration of water and solutes by filtering the blood and
excreting the filtrate as urine. This is accomplished by blood being pumped to the
glomerulus via an afferent arteriole, where capillaries aid in filtering solutes in the blood
by size. Ions such as sodium and molecules such as glucose pass through the Bowman’s
capsule while proteins that do not meet the molecular weight cut off are expelled, with
filtered blood, via an efferent arteriole. The filtrate is excreted into the Bowman’s
capsule through the proximal convoluted tubules, where pH is regulated by exchanging
hydronium ions in the intersitium with bicarbonate ions from the filtrate. The proximal
convoluted tubule is responsible for the majority of sodium reabsorption. The filtrate
passes down the Loop of Henle, where water is removed via aquaporins and a urea
concentration gradient is established from the filtrate. The filtrate ascends up to the
2
distal convoluted tubule where is ENaC is located, and then moves to the collecting
ducts where it is expelled as urine.
FIG 1. Cross-sectional area of the kidney with emphasis on the nephron. Filtration of our blood occurs in
the kidneys where sodium ion reabsorption by ENaC transpires in the distal convoluted tubule of the
nephron. Figure adapted from (3).
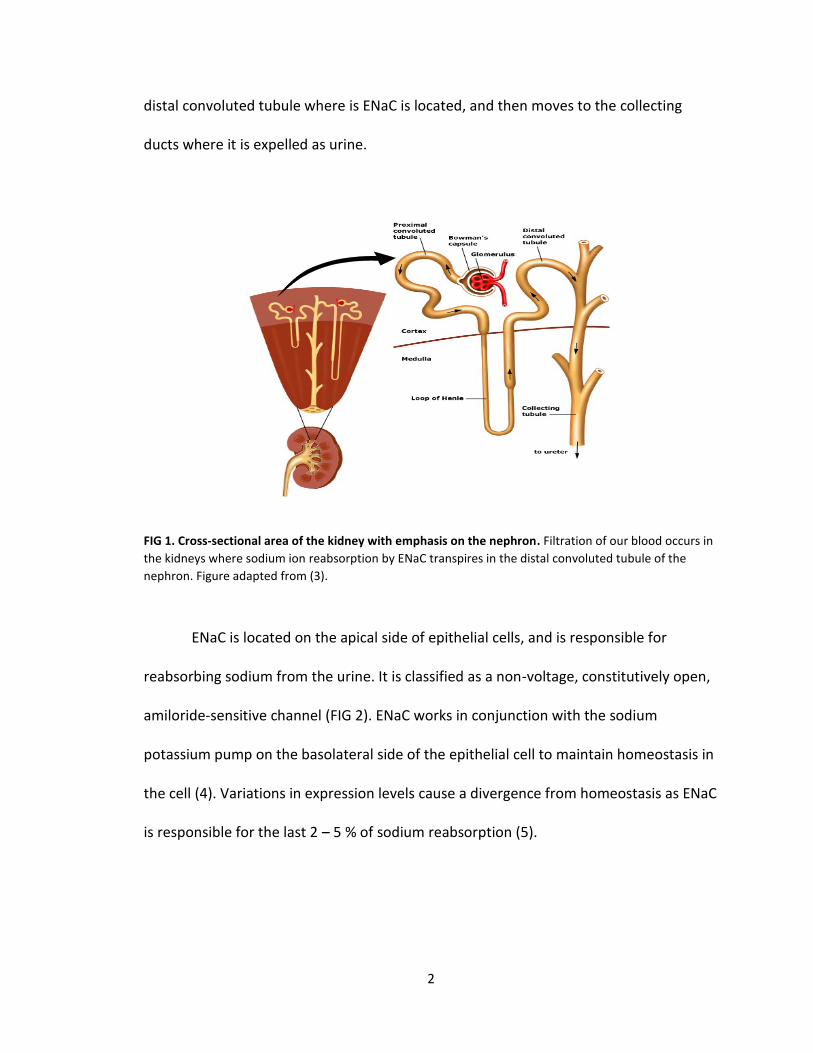
ENaC is located on the apical side of epithelial cells, and is responsible for
reabsorbing sodium from the urine. It is classified as a non-voltage, constitutively open,
amiloride-sensitive channel (FIG 2). ENaC works in conjunction with the sodium
potassium pump on the basolateral side of the epithelial cell to maintain homeostasis in
the cell (4). Variations in expression levels cause a divergence from homeostasis as ENaC
is responsible for the last 2 – 5 % of sodium reabsorption (5).
3
FIG 2. Depiction of epithelial cells which line the distal convoluted tubules, representing the movement
of sodium and potassium ions through the cell. Sodium ions enter epithelial cells through ENaC located
on the apical membrane of epithelial cells. To maintain osmotic pressure, water is drawn in and out of
epithelial cells through aquaporins. Sodium ions are able to enter the bloodstream through the Na+/K+-
ATPase channel, facilitating the transfer of potassium into epithelial cells to be later excreted as urine.
Figure adapted from (6).
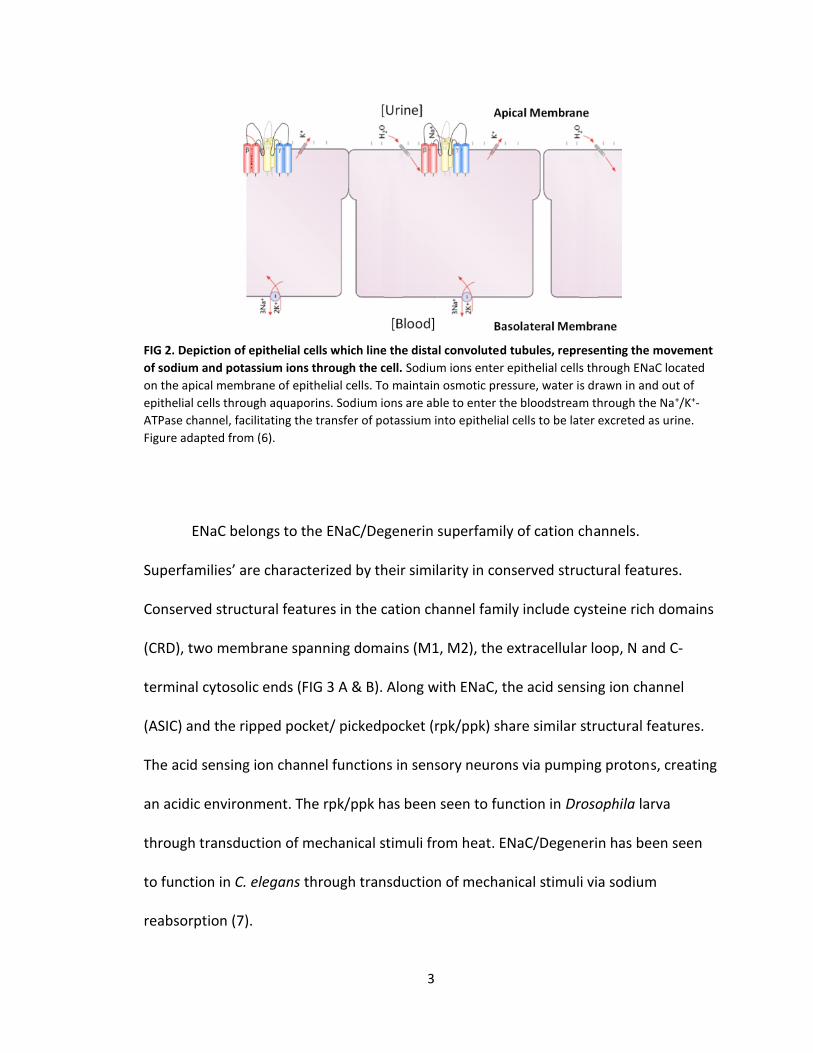
ENaC belongs to the ENaC/Degenerin superfamily of cation channels.
Superfamilies’ are characterized by their similarity in conserved structural features.
Conserved structural features in the cation channel family include cysteine rich domains
(CRD), two membrane spanning domains (M1, M2), the extracellular loop, N and C-
terminal cytosolic ends (FIG 3 A & B). Along with ENaC, the acid sensing ion channel
(ASIC) and the ripped pocket/ pickedpocket (rpk/ppk) share similar structural features.
The acid sensing ion channel functions in sensory neurons via pumping protons, creating
an acidic environment. The rpk/ppk has been seen to function in Drosophila larva
through transduction of mechanical stimuli from heat. ENaC/Degenerin has been seen
to function in C. elegans through transduction of mechanical stimuli via sodium
reabsorption (7).
4
FIG 3. ENaC/DEG family conserved protein sequences. (A) Conserved domains between ENaC/DEG
members. (B) Structure of an individual ENaC/DEG subunit where CRDI and ERD are specifically unique to
the superfamily. Figure adapted from (8).
An ENaC structural model was developed based on ASIC1 crystal structure (FIG
4). Renal ENaC is composed of three subunits, α, β, γ, however there is a δ subunit,
synonymous to the α subunit, present in pulmonary and colorectal organs (9). Each
subunit is encoded by a separate gene, SCNN1A, SCNN1B, and SCNN1G, respectively.
ENaC subunit stoichiometry is thought to be a 1:1:1 subunit ratio based on the highly
conserved homology with ASIC1 (10). Speculation of the stoichiometry arises due to
ENaC’s low expression levels and obtaining high enough concentrations to form crystals.
αENaC can form a functional homotrimeric channel, although the homotrimeric showed
lower sodium reabsorption compared to the heterotrimeric complex, αβγ, in
electrophysiological studies (11). The β and γ subunits cannot form a functional channel
without the presence of the α subunit (12). Due to αENaC’s ability to form functional
homotrimeric channels, it has been speculated that the α subunit could possibly form an
5
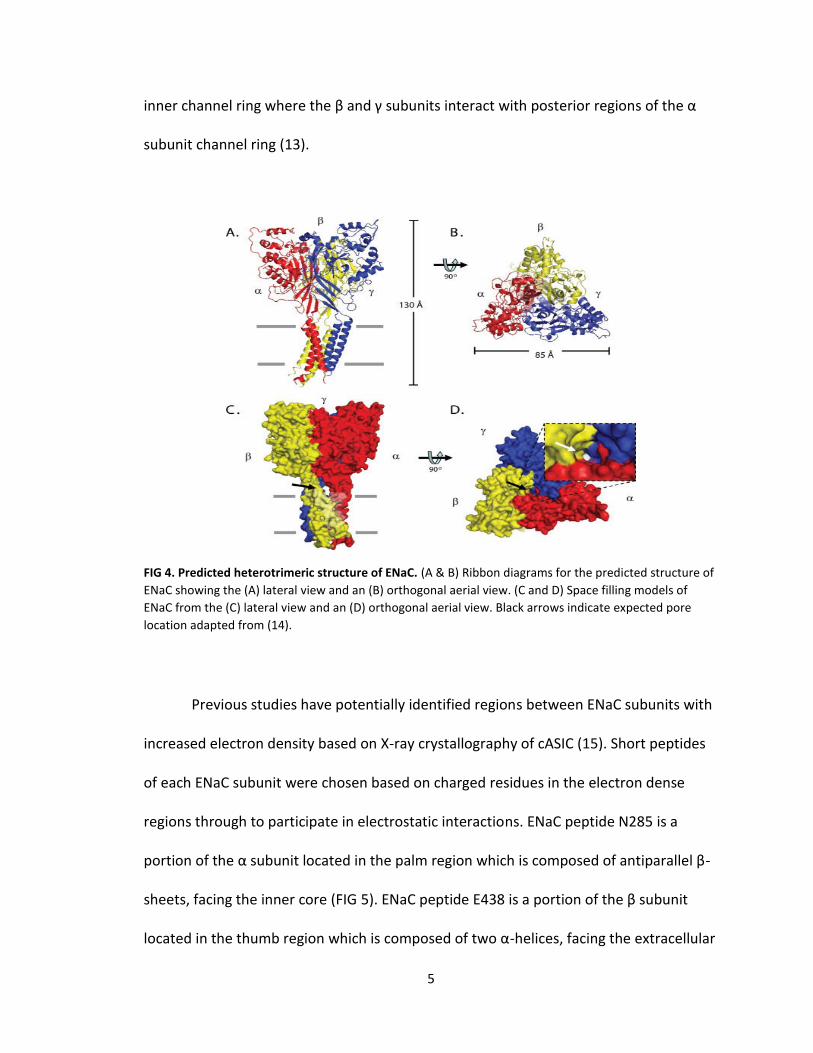
inner channel ring where the β and γ subunits interact with posterior regions of the α
subunit channel ring (13).
FIG 4. Predicted heterotrimeric structure of ENaC. (A & B) Ribbon diagrams for the predicted structure of
ENaC showing the (A) lateral view and an (B) orthogonal aerial view. (C and D) Space filling models of
ENaC from the (C) lateral view and an (D) orthogonal aerial view. Black arrows indicate expected pore
location adapted from (14).
Previous studies have potentially identified regions between ENaC subunits with
increased electron density based on X-ray crystallography of cASIC (15). Short peptides
of each ENaC subunit were chosen based on charged residues in the electron dense
regions through to participate in electrostatic interactions. ENaC peptide N285 is a
portion of the α subunit located in the palm region which is composed of antiparallel β-
sheets, facing the inner core (FIG 5). ENaC peptide E438 is a portion of the β subunit
located in the thumb region which is composed of two α-helices, facing the extracellular
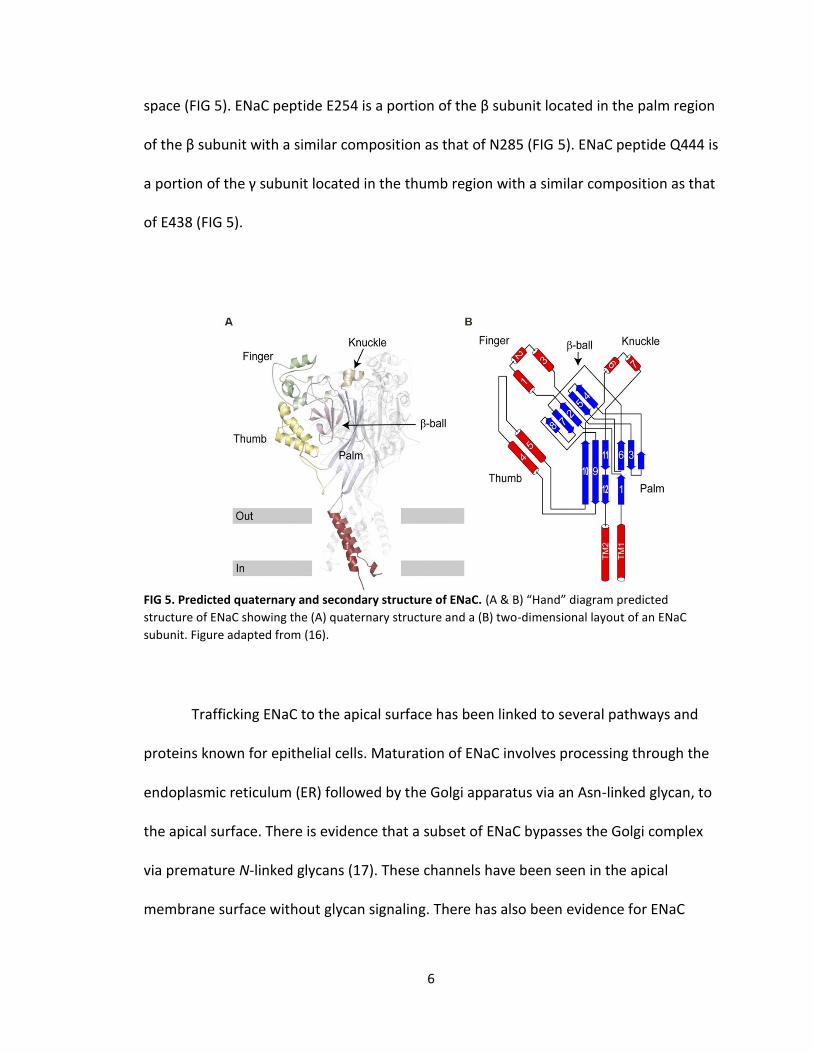
6
space (FIG 5). ENaC peptide E254 is a portion of the β subunit located in the palm region
of the β subunit with a similar composition as that of N285 (FIG 5). ENaC peptide Q444 is
a portion of the γ subunit located in the thumb region with a similar composition as that
of E438 (FIG 5).
FIG 5. Predicted quaternary and secondary structure of ENaC. (A & B) “Hand” diagram predicted
structure of ENaC showing the (A) quaternary structure and a (B) two-dimensional layout of an ENaC
subunit. Figure adapted from (16).
Trafficking ENaC to the apical surface has been linked to several pathways and
proteins known for epithelial cells. Maturation of ENaC involves processing through the
endoplasmic reticulum (ER) followed by the Golgi apparatus via an Asn-linked glycan, to
the apical surface. There is evidence that a subset of ENaC bypasses the Golgi complex
via premature N-linked glycans (17). These channels have been seen in the apical
membrane surface without glycan signaling. There has also been evidence for ENaC
7
trafficking via both a lipid raft-association and raft-free regulation (17). Studies for
targeting ENaC from the trans golgi network (TGN) have shown ENaC-coated vesicles
utilize the cytoskeleton and molecular motors to shuttle ENaC to the apical membrane.
This was demonstrated by interrupting actin or tubulin causing a loss of ENaC transport
to the apical membrane (17). Disruption of soluble N-ethylmaleimide-sensitive factor
attachment protein receptor (SNARE), responsible for final vesical fusion to the
membrane, and SNARE binding proteins prevented exocytosis of ENaC vesicles with
apical membrane (18).
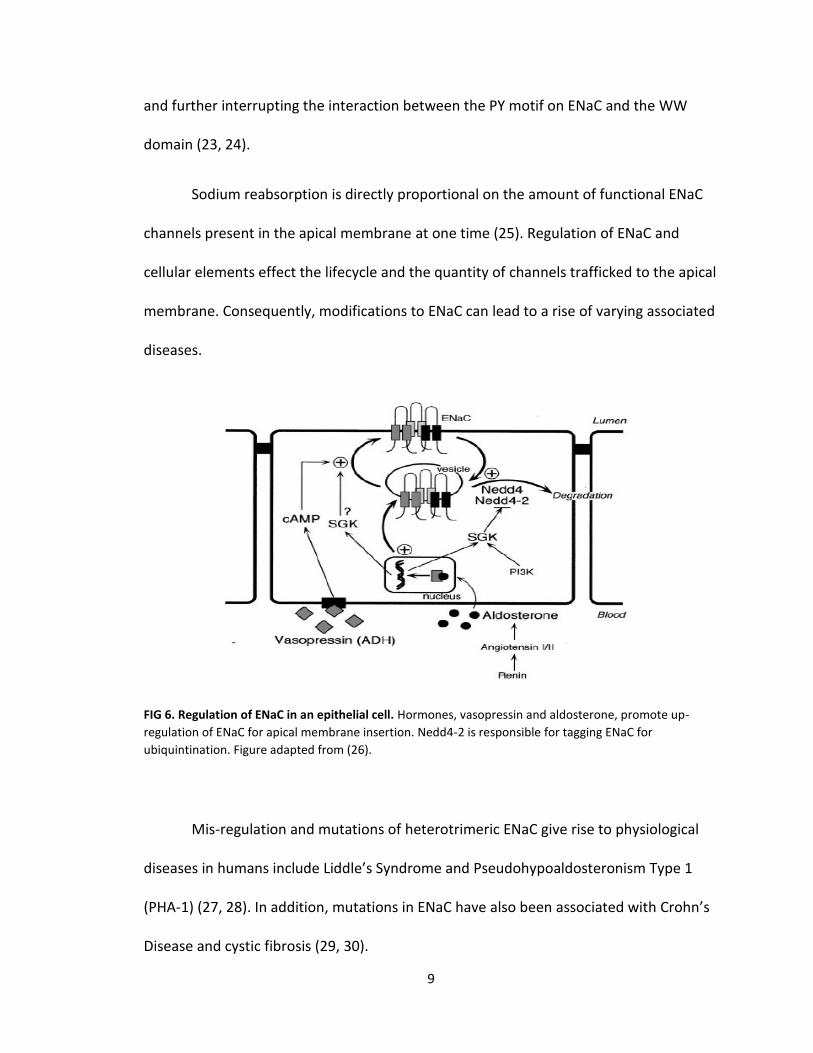
ENaC placement in the apical membrane is regulated by vasopressin, an
antidiuretic hormone (ADH), aldosterone, a mineralocorticoid hormone, and Nedd4, a
ubiquitin ligase (FIG 6). ENaC is up-regulated by vasopressin and aldosterone.
Vasopressin regulates the water retention by increasing water reabsorption in
the kidney’s collecting ducts namely the nephron by aquaporins and it also functions to
constrict blood vessels. Vasopressin is produced in the hypothalamus and stored at the
posterior pituitary to later be released into the bloodstream. Vasopressin binds to cell
surface receptors on the basolateral membrane which triggers a cAMP signaling
pathway (FIG 6). Increased cellular levels of cAMP activates Protein Kinase A (PKA) to
assist SNAREs for exocytosis of ENaC-containing vesicles to the apical membrane (FIG 6).
Vasopressin also up regulates aquaporin-2 trafficking to the apical membrane to
maintain osmotic pressure and homeostasis of epithelial cells (19).
8
Aldosterone regulates plasma sodium, extracellular potassium and arterial blood
pressure. It accomplishes this by acting directly on the distal tubules and collecting ducts
of the nephron. Aldosterone is produced in the zona glomerulosa of the adrenal cortex
in the adrenal gland and is then is activated by renin, an enzyme produced in the
juxtaglomerular cells. It accomplished activation by cleaving angiotensinogen, a peptide
hormone responsible for vasoconstriction produced by the liver, to form angiotensin I.
This intermediate product is further converted to angiotensin II by angiotensin-
converting enzyme (ACE), located in the pulmonary capillaries. Angiotensin II constricts
the blood vessels which in turn increases secretion of vasopressin and aldosterone
therefore stimulating the hypothalamus to activate. Aldosterone binds to cell surface
receptors on the basolateral membrane in which it is then transported to the nucleus
where it promotes transcription of ENaC mRNA (FIG 6). Aldosterone additionally
promotes the up-regulation in the transcription of serum and glucocorticoid-regulated
kinase 1 (SGK1) further upregulating ENaC (20).
When ENaC is being down regulated the HECT domain of Nedd4-2, located on
the C-terminal, is ubiquitinated followed by poly-ubiquitination resulting in endocytosis
of ENaC and is transported for lysosomal degradation (21, 22). ENaC is up-regulated by
SGK1, phosphorylating the WW domain of Nedd4-2, an E3 ubiquitin ligase responsible
for down regulation, blocking the interaction of the WW domain of Nedd4-2 with the C-
terminal PY motif of ENaC (FIG 6). Studies have shown that the protein 14-3-3 isoform
14-3-3β is induced by aldosterone, interacting with the phosphorylated WW domain
9
and further interrupting the interaction between the PY motif on ENaC and the WW
domain (23, 24).
Sodium reabsorption is directly proportional on the amount of functional ENaC
channels present in the apical membrane at one time (25). Regulation of ENaC and
cellular elements effect the lifecycle and the quantity of channels trafficked to the apical
membrane. Consequently, modifications to ENaC can lead to a rise of varying associated
diseases.
FIG 6. Regulation of ENaC in an epithelial cell. Hormones, vasopressin and aldosterone, promote up-
regulation of ENaC for apical membrane insertion. Nedd4-2 is responsible for tagging ENaC for
ubiquintination. Figure adapted from (26).
Mis-regulation and mutations of heterotrimeric ENaC give rise to physiological
diseases in humans include Liddle’s Syndrome and Pseudohypoaldosteronism Type 1
(PHA-1) (27, 28). In addition, mutations in ENaC have also been associated with Crohn’s
Disease and cystic fibrosis (29, 30).
10
Liddle’s Syndrome (pseudohyperaldosteronism) is an autosomal dominant gain-
of function disease that causes an excess of reabsorption of sodium ions and decrease
of potassium ions into the circulatory system therefore giving rise to hypertension and
hypokalemia. Additional effects include low plasma renin activity and metabolic
alkalosis. This is due to a deletion of 45 to 75 amino acids from the C-terminus of the β
and γ subunit of ENaC. This deletion removes the PY motif which hinders the ability of
Nedd4-2 to regulate the degradation of ENaC (31). Children are frequently
asymptomatic, whereas adults exhibit weakness, fatigue, cardiac arrhythmia, and
myasthenia (31).
PHA-1 is a loss-of-function disease categorized in two separate classes: renal
PHA-1, an autosomal dominant disease, and systemic PHA-1, an autosomal recessive
disease. Both types are generalized by salt wasting, high concentration of salts in the
urine, leading to hypotension and hyperkalemia. While both have effects on the kidneys,
systemic affects eccrine glands, salivary glands, and the colorectal organ (32). This arises
from either C133Y mutation in the α subunit of ENaC or a deletion or frameshift
mutations in β and γ subunits of ENaC, rendering it unresponsive to aldosterone (33).
Symptoms include weakness, fatigue, metabolic acidosis, vomiting and an inability to
gain weight or grow at expected rates as well as extreme dehydration during infancy.
Infants with systemic PHA-1 show more symptoms due to effects on multiple organs
including cardiac arrhythmia, recurrent pulmonary infections and lesions under the skin
(34).
11
Crohn’s Disease is an inflammatory bowel disease (IBD) effecting the
gastrointestinal tract. This occurs in any age range, although onset between 15 and 30
years of age is common. Symptoms include abdominal discomfort, diarrhea, intestinal
stenosis, and extra intestinal complications. This has been associated with a deficiency
of the γ subunit of ENaC leading to a lower reabsorption of sodium ions into the blood.
If left untreated leads to a high risk of cancer at inflamed regions (35).
Cystic fibrosis (CF) is an autosomal recessive disease causing thick mucus to
accumulate in the pulmonary system and gastrointestinal tract. Additionally, CF is
associated with defects in the pancreas, liver, and kidneys (36). This is due to mutations
in the cystic fibrosis transmembrane conductance regulator (CFTR) protein. CFTR is
responsible for transporting chlorine across epithelial cells. A mutation in the α subunit
of ENaC, W493R, and in the β subunit of ENaC have both been associated with cystic
fibrosis. This is due to an increase of chlorine ions traversing intracellular space between
epithelial cells which increase cAMP concentrations further inhibiting ENaC (37). This
disease effects approximately 1 out of 300 newborns and 1 out of 25 adults are carriers,
with no cure yet discovered (38).
The current project seeks to elucidate a purification scheme for the α subunit of
ENaC using different combinations of buffers and lysis methods. Once purification is
established, purified product will be subjected to Surface Plasmon Resonance (SPR)
studies where interaction studies will be performed by flowing portions of the α
subunit, β subunit, and γ subunit of the extracellular loop of ENaC, independently. This
study seeks to identify critical interactions for formation of a functional heterotrimeric
12
channel which can then be used to elucidate pharmaceutical agents to aid in
hypo/hypertension.
13
II. MATERIALS AND METHODS
A. Purification of αHis2-αENaC from S. cerevisiae
Cloning αHis2-αENaC for Yeast Expression
Polymerase chain reaction (PCR) reagents, cloning buffers, enzymes and NEB 5-α
competent E. coli cells were purchased from New England Biolabs (Ipswich, MA).
Plasmid DNA, pmαHis2-αENaC, was received from Dr. Jim Stockand (UTHSCSA, San
Antonio, TX) which contained the gene for αENaC with a 6X histidine tag (αHis2) located
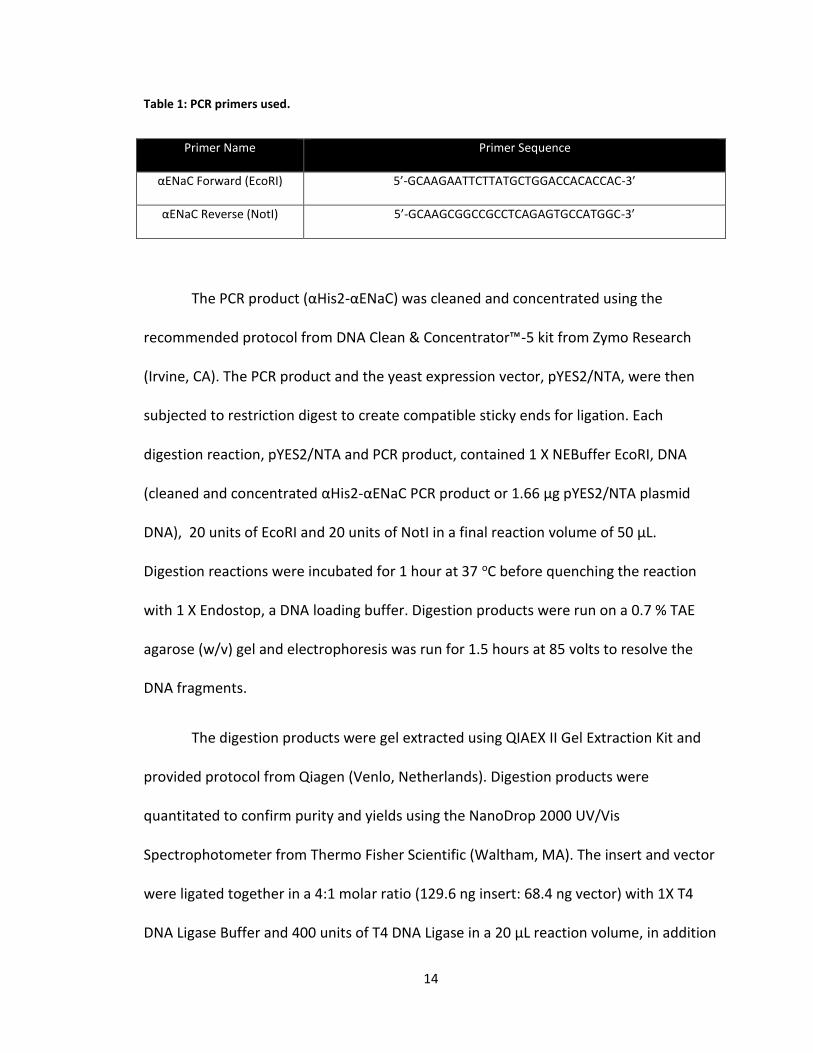
in the extracellular loop region of αENaC. Primers for PCR were previously designed
against αENaC and synthesized by Integrated DNA Technologies (Coralville, IA) (Table 1).
EcoRI and NotI restriction sites were engineered on the ends of the primers in order for
the gene to be subcloned into a yeast expression vector, pYES2/NTA, purchased from
Life Technologies (Carlsbad, CA). PCR conditions were performed using 150 ng pmαHis2-
αENaC template DNA, 1 μM forward and reverse primer (Table 1), 400 μM dNTPs, 1X Q5
Reaction Buffer, and 0.1 units of NEB Vent polymerase in a final reaction volume of 50
μL. PCR instrument parameters started at 94 oC for 2 min followed by 25 cycles run at 94
oC for 30 s, 45 oC for 30 s, and 72 oC for 2 min with a final extension after the last cycle at
72 oC for 10 min. The PCR product was subjected to agarose gel electrophoresis and
visualized with ethidium bromide to validate amplification of gene.
14
Table 1: PCR primers used.
Primer Name Primer Sequence
αENaC Forward (EcoRI) 5’-GCAAGAATTCTTATGCTGGACCACACCAC-3’
αENaC Reverse (NotI) 5’-GCAAGCGGCCGCCTCAGAGTGCCATGGC-3’
The PCR product (αHis2-αENaC) was cleaned and concentrated using the
recommended protocol from DNA Clean & Concentrator™-5 kit from Zymo Research
(Irvine, CA). The PCR product and the yeast expression vector, pYES2/NTA, were then
subjected to restriction digest to create compatible sticky ends for ligation. Each
digestion reaction, pYES2/NTA and PCR product, contained 1 X NEBuffer EcoRI, DNA
(cleaned and concentrated αHis2-αENaC PCR product or 1.66 μg pYES2/NTA plasmid
DNA), 20 units of EcoRI and 20 units of NotI in a final reaction volume of 50 μL.
Digestion reactions were incubated for 1 hour at 37 oC before quenching the reaction
with 1 X Endostop, a DNA loading buffer. Digestion products were run on a 0.7 % TAE
agarose (w/v) gel and electrophoresis was run for 1.5 hours at 85 volts to resolve the
DNA fragments.
The digestion products were gel extracted using QIAEX II Gel Extraction Kit and
provided protocol from Qiagen (Venlo, Netherlands). Digestion products were
quantitated to confirm purity and yields using the NanoDrop 2000 UV/Vis
Spectrophotometer from Thermo Fisher Scientific (Waltham, MA). The insert and vector
were ligated together in a 4:1 molar ratio (129.6 ng insert: 68.4 ng vector) with 1X T4
DNA Ligase Buffer and 400 units of T4 DNA Ligase in a 20 μL reaction volume, in addition
15
to a vector-only negative control. For each ligation reaction 5 μL were transformed into
Top 10™ E. coli cells following a modified protocol from Chung and Miller (39). Top 10™
E. coli cells were thawed on ice for 10 minutes followed by an addition of cold KCM
buffer (100 mM KCl, 30 mM CaCl2, and 50 mM MgCl2) at a 1:1 ratio along with ligation
reaction. The transformation reaction was incubated on ice for 20 minutes followed by
incubation in a room temperature water bath for 10 minutes. LB media was added to
the transformation reaction and incubated at 37 oC with shaking at 225 rpm for 1 hour.
The resulting solution was spread on LB plates containing ampicillin (100 μg/mL) and
incubated overnight at 37 oC. Two clones were picked from transformation plates and
grown overnight shaking at 225 rpm at 37 oC in LB media containing ampicillin (100
μg/mL). The cloned plasmid DNA was isolated using the QIAprep Spin Miniprep Kit from
Qiagen with provided protocol with the exception of eluting with water as opposed to
elution buffer. Cloned DNA was sequenced by Quintara Biosciences (Albany, CA) to
verify ligation of insert into the vector. Verification was conducted by aligning the
sequencing data with αENaC using CLC Sequence Viewer from Qiagen.
Restriction digests were also conducted to confirm proper ligation using
pYES2/NTA (negative control), pYES2/NTA/αENaC (positive control), and
pYES2/NTA/αHis2-αENaC. Each double digestion reaction contained 1 μg of plasmid
DNA, 1X Cutsmart™ buffer from New England Biolabs with 20 units of EcoRI and 20 units
of NotI in a final reaction volume of 50 μL. The reaction was incubated for 1 hour at 37
oC before quenching the reaction with 1 X Endostop. Digestion products were then
subjected to agarose gel electrophoresis to analyze DNA fragments from the digestion.
16
Survival Dilution Growth “Pronging” Assay
S1 and BY4742 cells were transformed with pYES2/NTA (negative control),
pYES2/NTA/LacZ, pYES2/NTA/αENaC, and pYES2/NTA/αHis2-αENaC, separately,
following the high efficiency lithium acetate transformation protocol. S1 and BY4742
yeast cells were grown overnight shaking at 225 rpm at 30 oC in YPDA media (1% w/v
yeast extract, 2% w/v peptone, 2% w/v glucose, and 0.002% w/v adenine) and diluted
the subsequent day to an OD600 of 0.2. Yeast cultures were grown until an OD600 of 0.4-
0.6 was achieved. One milliliter of cells was pelleted by centrifugation at max speed for
1 min, discarding the supernatant. The following reagents were added to the remaining
pellet in order; 240 μL PEG 3350 (Mallinckrodt, St. Louis, MO), 36 μL 1 M lithium acetate
(Sigma-Aldrich, St. Louis, MO), 10 mg/mL sonicated salmon sperm DNA, heat activated
at 96 oC for 10 min (Agilent Technologies, Santa Clara, CA), 0.45% β-mercaptoethanol (G
Biosciences, St. Louis, MO), 1.5 μg plasmid DNA and ddH2O to a total volume of 360 μL
of transformation cocktail above the pellet. Transformation cocktail was vortexed for
one minute followed by an incubation period of 20 min at 42 oC. Transformation cocktail
was then centrifuged for 2 min at 2000 x g, supernatant discarded, and cell were
resuspended in 200 μL of ddH2O. The transformed cells were then spread on synthetic
media agar plates without uracil containing 2% w/v glucose and incubated at 30 oC for 2
days. Each cell strain was then placed in water at a 1/40 dilution. Each strain was
sonicated for 8 sec at 3 amps and then counted using a hemacytometer and microscope.
The cell concentration, 2 x 10⁷, was added to the first well of a 96-well plate and diluted
in a 5-fold series across 6 wells. Dilutions were pronged onto synthetic selective media
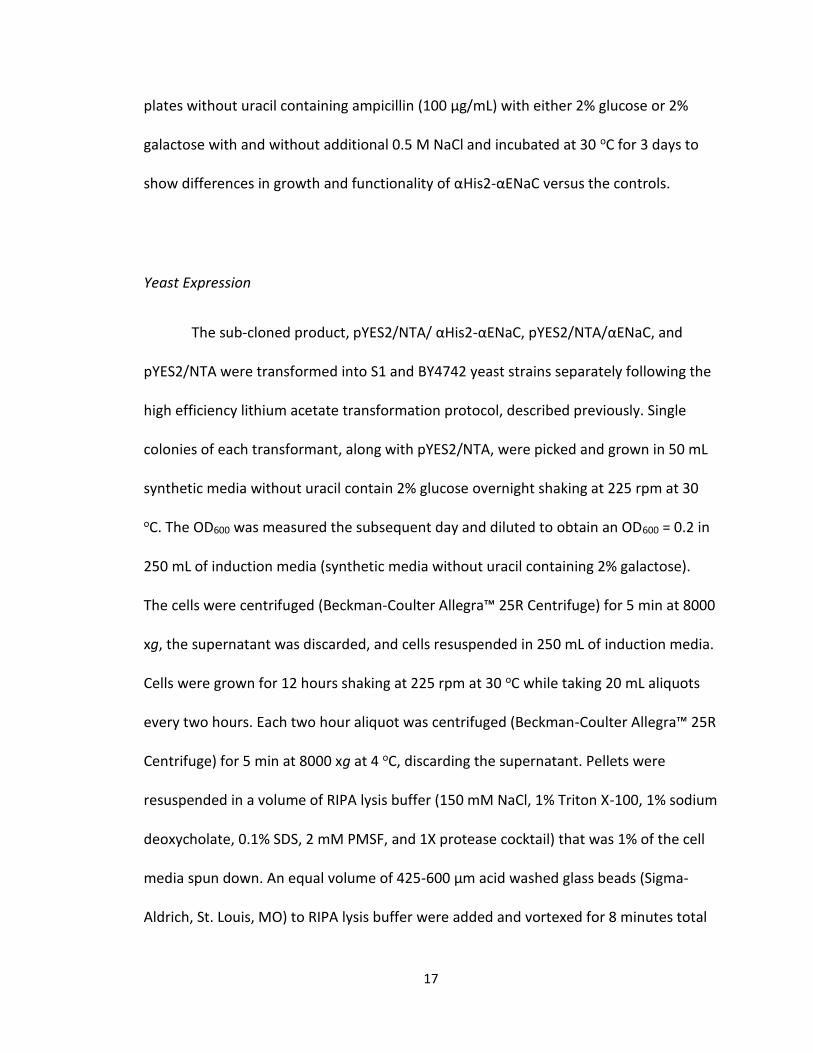
17
plates without uracil containing ampicillin (100 μg/mL) with either 2% glucose or 2%
galactose with and without additional 0.5 M NaCl and incubated at 30 oC for 3 days to
show differences in growth and functionality of αHis2-αENaC versus the controls.
Yeast Expression
The sub-cloned product, pYES2/NTA/ αHis2-αENaC, pYES2/NTA/αENaC, and
pYES2/NTA were transformed into S1 and BY4742 yeast strains separately following the
high efficiency lithium acetate transformation protocol, described previously. Single
colonies of each transformant, along with pYES2/NTA, were picked and grown in 50 mL
synthetic media without uracil contain 2% glucose overnight shaking at 225 rpm at 30
oC. The OD600 was measured the subsequent day and diluted to obtain an OD600 = 0.2 in
250 mL of induction media (synthetic media without uracil containing 2% galactose).
The cells were centrifuged (Beckman-Coulter Allegra™ 25R Centrifuge) for 5 min at 8000
xg, the supernatant was discarded, and cells resuspended in 250 mL of induction media.
Cells were grown for 12 hours shaking at 225 rpm at 30 oC while taking 20 mL aliquots
every two hours. Each two hour aliquot was centrifuged (Beckman-Coulter Allegra™ 25R
Centrifuge) for 5 min at 8000 xg at 4 oC, discarding the supernatant. Pellets were
resuspended in a volume of RIPA lysis buffer (150 mM NaCl, 1% Triton X-100, 1% sodium
deoxycholate, 0.1% SDS, 2 mM PMSF, and 1X protease cocktail) that was 1% of the cell
media spun down. An equal volume of 425-600 μm acid washed glass beads (Sigma-
Aldrich, St. Louis, MO) to RIPA lysis buffer were added and vortexed for 8 minutes total
18
with 30 s intervals of vortexing and ice incubation to prevent overheating. Cell lysates
were spun at 17,950 xg for 10 min and the supernatant was then collected and
subjected to Pierce™ BCA Protein Assay Kit from Thermo Fisher Scientific (Waltham,
MA) following supplied protocol. Cell lysate protein concentrations were determined
from the assay and 50 μg of each 2 hour time aliquot containing 1X NuPAGE LDS sample
buffer from Thermo Fisher Scientific (Waltham, MA) was heated at 90 oC for 10 min. Cell
lysates were subjected to SDS-PAGE using a 4% stacking and a 7.5% resolving gel using
PageRuler™ Prestained Protein Ladder from Thermo Fisher Scientific (Waltham, MA).
The protein was transferred to a nitrocellulose membrane for western blot analysis
using Trans-Blot® Turbo™ Transfer System from Bio-Rad (Hercules, CA) using parameters
of 20 volts at constant 1.3 amps for 20 min. The membrane was then placed in blocking
solution (1X TBS, 0.1% v/v Tween 20, and 5% w/v dry milk) for 30 minutes followed by a
5 min wash in 1X TBST. The membrane was then probed with mouse Anti-Xpress™
antibody (Life Technologies) using a dilution of 1:5000 in 1X TBST and incubated at 4 oC
overnight while shaking. The subsequent day, the primary antibody was decanted and
the membrane was washed three times in 1X TBST for 5 min each. The membrane was
then probed with a secondary conjugated HRP goat anti-mouse antibody (Jackson
ImmunoResearch, West Grove, PA) using a dilution of 1:1000 in 1X TBST shaking for one
hour at room temperature. The secondary antibody was discarded and the membrane
was washed three times in 1X TBST and a final wash in TBS, all for 5 min each. Western
Lightning Plus ECL (Perkin Elmer, Waltham, MA) chemiluminescence substrate was used
to detect αHis2- αENaC protein and imaged using ChemiDoc™ XRS+ System from Bio-
19
Rad Laboratories with a total exposure time of 5 min collecting images every 60 s. The
membrane was stripped of antibodies using a stripping buffer (0.7% v/v BME, 2% v/v
SDS, and 63 mM Tris, pH 8.0) and incubated at 55 oC followed by 5 washes with 10 mL of
TBS. Once stripped, the membrane was probed again with Anti- αENaC antibody from
StressMarq Biosciences (Victoria, BC) at a 1:5000 dilution in blocking solution to confirm
presence of αENaC. The membrane was stripped again of antibodies, by the previously
described method, and probed an additional time with an Anti-β-actin antibody from
Santa Cruz Biotechnology (Dallas, TX) at a 1:1000 dilution in blocking solution.
Purification
Purification was performed using immobilized metal affinity chromatography
(IMAC), with HisPur™ Ni-NTA Resin and 5 mL polypropylene columns from Pierce™
Thermo Fisher Scientific. S1 and BY4742 cell lysates containing αENaC and αHis2-αENaC
were independently immobilized on nickel resin after column was equilibrated with
three column volumes equilibration buffer (0.3 M NaCl in 50 mM monobasic sodium
phosphate, pH 8.0). Cell lysate flowthrough was collected and the column was washed
with six column volumes of wash buffer (10 mM Imidizole with 0.3 M NaCl in 50 mM
monobasic sodium phosphate, pH 8.0). Proteins were eluted with elution buffer (250
mM imidazole with 0.3 M NaCl in 50 mM monobasic sodium phosphate, pH 8.0) and 0.5
mL fractions were collected.
20
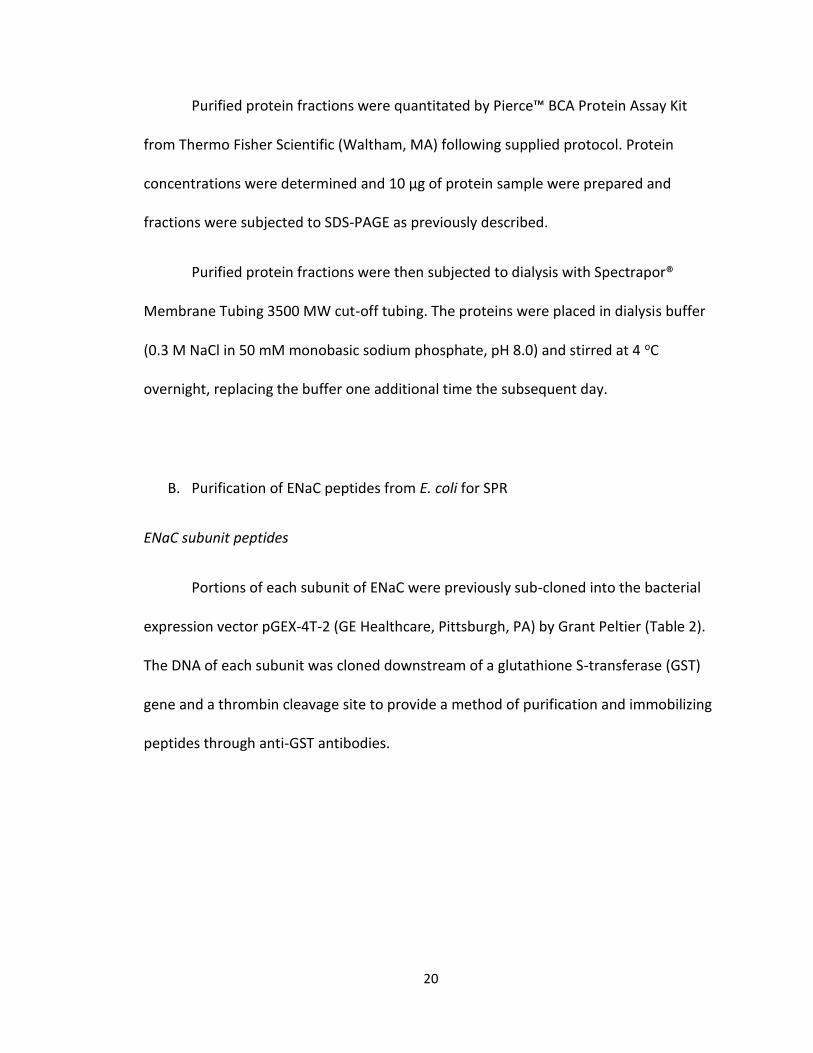
Purified protein fractions were quantitated by Pierce™ BCA Protein Assay Kit
from Thermo Fisher Scientific (Waltham, MA) following supplied protocol. Protein
concentrations were determined and 10 μg of protein sample were prepared and
fractions were subjected to SDS-PAGE as previously described.
Purified protein fractions were then subjected to dialysis with Spectrapor®
Membrane Tubing 3500 MW cut-off tubing. The proteins were placed in dialysis buffer
(0.3 M NaCl in 50 mM monobasic sodium phosphate, pH 8.0) and stirred at 4 oC
overnight, replacing the buffer one additional time the subsequent day.
B. Purification of ENaC peptides from E. coli for SPR
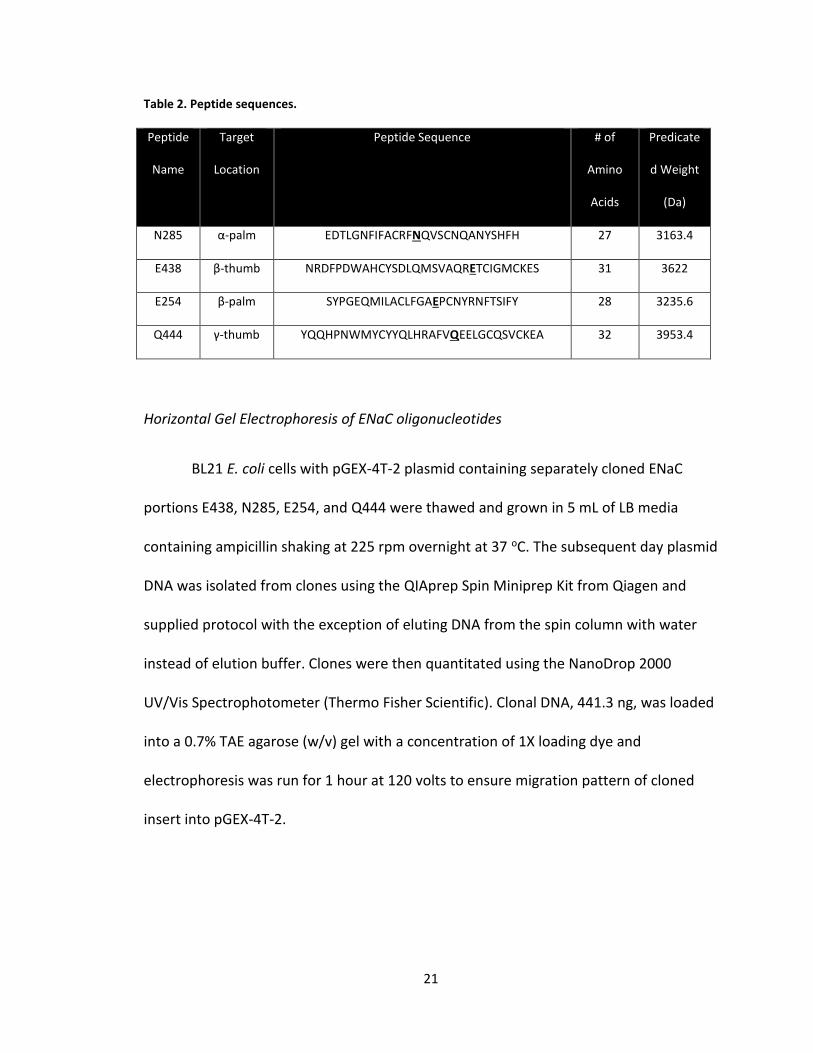
ENaC subunit peptides
Portions of each subunit of ENaC were previously sub-cloned into the bacterial
expression vector pGEX-4T-2 (GE Healthcare, Pittsburgh, PA) by Grant Peltier (Table 2).
The DNA of each subunit was cloned downstream of a glutathione S-transferase (GST)
gene and a thrombin cleavage site to provide a method of purification and immobilizing
peptides through anti-GST antibodies.
21
Table 2. Peptide sequences.
Peptide
Name
Target
Location
Peptide Sequence # of
Amino
Acids
Predicate
d Weight
(Da)
N285 α-palm EDTLGNFIFACRFNQVSCNQANYSHFH 27 3163.4
E438 β-thumb NRDFPDWAHCYSDLQMSVAQRETCIGMCKES 31 3622
E254 β-palm SYPGEQMILACLFGAEPCNYRNFTSIFY 28 3235.6
Q444 γ-thumb YQQHPNWMYCYYQLHRAFVQEELGCQSVCKEA 32 3953.4
Horizontal Gel Electrophoresis of ENaC oligonucleotides
BL21 E. coli cells with pGEX-4T-2 plasmid containing separately cloned ENaC
portions E438, N285, E254, and Q444 were thawed and grown in 5 mL of LB media
containing ampicillin shaking at 225 rpm overnight at 37 oC. The subsequent day plasmid
DNA was isolated from clones using the QIAprep Spin Miniprep Kit from Qiagen and
supplied protocol with the exception of eluting DNA from the spin column with water
instead of elution buffer. Clones were then quantitated using the NanoDrop 2000
UV/Vis Spectrophotometer (Thermo Fisher Scientific). Clonal DNA, 441.3 ng, was loaded
into a 0.7% TAE agarose (w/v) gel with a concentration of 1X loading dye and
electrophoresis was run for 1 hour at 120 volts to ensure migration pattern of cloned
insert into pGEX-4T-2.
22
Expression of GST- ENaC subunit peptides
Cloned plasmid DNA, 1 μg, was transformed into E. coli BL21 cells using the
previously describe method. A full scale expression was conducted by placing the
transformants in LB media containing ampicillin (100 μg/mL) overnight at 37 oC.
Overnight cultures were added to 2X-YTG media containing ampicillin (100 μg/mL) and
incubated at 37 oC for 3 hours shaking at 225 rpm. GST-peptides were induced by adding
IPTG (Promega) at a final concentration of 0.1 mM and incubating at 37 oC for an
additional 3 hours while shaking at 225 rpm. The resulting culture was centrifuged
(Beckman-Coulter Allegra™ 25R Centrifuge) at 4600 xg for 5 minutes, discarding the
supernatant.
The pellet was thawed in 1X PBS –Mg2+-Ca2+ at a ratio of 0.05 to 1 mL of culture
and was resuspended. The cells were lysed by conducting four freeze/thaw (-80 oC/ 22
oC) cycles. The cell lysate was treated with DNase 1 (Sigma Aldrich) and incubated at 37
oC for 30 minutes. The resulting cell lysate was centrifuged (Beckman-Coulter Allegra™
25R Centrifuge) at 10500 xg for 20 minutes, retaining the supernatant.
The cell lysate was subjected to Pierce™ BCA Protein Assay Kit from Thermo
Fisher Scientific (Waltham, MA) following supplied protocol. Cell lysate concentrations
were calculated and 10 μg of each GST-peptide containing 1X NuPAGE LDS sample
buffer from Thermo Fisher Scientific (Waltham, MA) were heated at 90 oC for 10 min.
Cell lysates were subjected to SDS-PAGE using a 4% stacking and a 7.5% resolving gel
23
using PageRuler™ Prestained Protein Ladder from Thermo Fisher Scientific (Waltham,
MA).
Purification
GST-peptides were purified by affinity chromatography using glutathione
agarose resin from Pierce™ Thermo Fischer Scientific. Cell lysates were batch purified by
adding 2 mL of glutathione agarose resin to each respected lysate and incubated on a
rocker for 1 hour at 4 oC. The lysate was then added to a 5 mL polypropylene column
from Pierce™ Thermo Fischer Scientific, allowing the resin to settle while collecting flow
through fraction. The column was washed with 6 column volumes of 1X PBS-Mg-Ca
followed by elution of GST-peptides using 3 mL of 10 mM reduced glutathione in 50 mM
Tris-HCl pH 8, collecting three 1 mL fractions. The eluate was subjected back into the
column, resuspending the glutathione agarose resin, and incubated for 10 minutes
before collecting the final three 1 mL fractions, to increase amount of the GST-peptide
bound to glutathione resin.
GST-peptides were dialyzed with Spectrapor® Membrane Tubing 3500 MW cut-
off tubing. The GST-peptides were placed in dialysis buffer (20 mM Tris-HCl, pH 8.0) and
stirred at 4 oC overnight, replacing the buffer one additional time the subsequent day. A
1 mL aliquot was saved after dialysis from each GST-peptide to use later for
immobilization in SPR.
24
Thrombin Cleavage of GST-peptides
Glutathione agarose resin was regenerated for each respective peptide column
by washing with 5 bed volumes of regeneration buffer 1 (0.5 M NaCl and 0.1% SDS in 0.1
M Tris-HCl, pH 8.5). The column was then washed with 5 bed volumes of ddH20 followed
by an additional wash with 5 bed volumes of regeneration buffer 2 (0.5 M NaCl and
0.1% SDS in 0.1 M sodium acetate, pH 4.5). A final wash with ddH20 was conducted and
stored with 1X PBS-Mg-Ca at 4 oC.
Dialyzed GST-peptides were subjected to regenerated glutathione columns
shaking at room temperature for 1 hour. The column was washed with 3 column
volumes of 1X PBS-Mg2+-Ca2+ and incubated overnight, at room temperature, while
shaking in thrombin reaction mixture (1:20 ratio of 35 units of Thrombin to 1X PBS-Mg-
Ca). The eluate was collected and thrombin was separated from cleaved peptides by
subjecting eluate to 1 ml p-AminoBenzamidine agarose resin (Sigma Aldrich) in a 5 mL
polypropylene column from Pierce™ Thermo Fisher Scientific. The resin was previously
washed with 3 bed volumes of Tris Buffer (0.4 M NaCl in 50 mM Tris-HCl, pH 8.15) to
equilibrate the resin. The cleaved peptides were subjected to the column and incubated
overnight while shaking at 4 oC. The subsequent day the cleaved peptides were eluted
with Tris buffer, collecting in 0.5 mL fractions.
25
Quantitation of Peptides
Cleaved peptides were quantitated from measuring the absorbance at 280 nm
with BIO-RAD SmartSpec™ 3000 and solved using the tryptophan/tyrosine extinction
coefficient concentration equation:
where A280 is the absorbance at 280 nm, DF is the dilution factor, MW is the molecular
weight in mg/mmole, #W is the number of tryptophan residues, 5560 is the extinction
coefficient of tryptophan at 280 nm at a neutral pH in a 1 cm cell with units of
AU/mmole/mL, #Y is the number of tyrosine residues, 1200 is the extinction coefficient
of tyrosine at 280 nm at a neutral pH in1 cm cell with units of AU/mmole/mL. An
additional method for peptide quantitation employed Pierce™ Quantitative Colorimetric
Peptide Assay from Thermo Fisher Scientific following supplied protocol.
C. SPR Analysis
Binding Assays
Binding assays were conducted by SPR on a Biacore® X (GE Healthcare). The
binding assays were performed with 0.4 M NaCl in 50 mM Tris-HCl, pH 8.15 at 5 μL/min.
Peptide analytes were injected at increasing concentrations at 50 μL sample size. Kinetic
data calculations were performed using BIAevaluation software version 2.3.
26
CM5 Chip Setup
All reagents for activation of the CM5 chip were provided from GE Healthcare’s
Amine Coupling Kit and GST Capture Kit. The CM5 chip was activated on both flow cells
with a 1:1 EDC/NHS solution injection of 35 μL injection at 5μL/min with a 7 minute
contact time. Anti-GST was diluted to 15 μg/mL with an injection of 25 μL for a 5 minute
contact time. The remaining activated NHS-esters are deactivated/blocked with a 35 μL
injection ethanolamine for a 7 minute contact time. High affinity sites on anti-GST were
blocked by injecting 15 μL of a 5μg/mL recombinant GST for a 3 minute contact time.
Only one flow cell was regenerated with a 10 μL injection for a 2 minute contact time,
leaving the remaining flow cell as a reference.
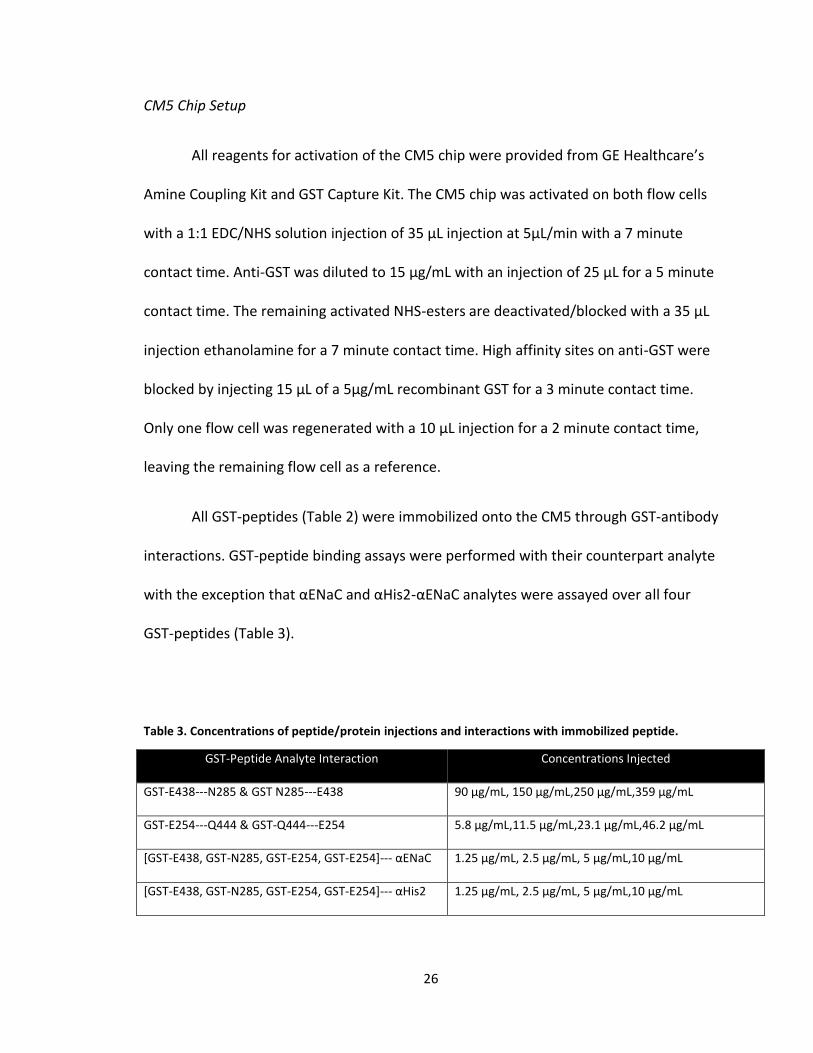
All GST-peptides (Table 2) were immobilized onto the CM5 through GST-antibody
interactions. GST-peptide binding assays were performed with their counterpart analyte
with the exception that αENaC and αHis2-αENaC analytes were assayed over all four
GST-peptides (Table 3).
Table 3. Concentrations of peptide/protein injections and interactions with immobilized peptide.
GST-Peptide Analyte Interaction Concentrations Injected
GST-E438---N285 & GST N285---E438 90 μg/mL, 150 μg/mL,250 μg/mL,359 μg/mL
GST-E254---Q444 & GST-Q444---E254 5.8 μg/mL,11.5 μg/mL,23.1 μg/mL,46.2 μg/mL
[GST-E438, GST-N285, GST-E254, GST-E254]--- αENaC 1.25 μg/mL, 2.5 μg/mL, 5 μg/mL,10 μg/mL
[GST-E438, GST-N285, GST-E254, GST-E254]--- αHis2 1.25 μg/mL, 2.5 μg/mL, 5 μg/mL,10 μg/mL
27
III. RESULTS AND DISCUSSION
To study the location of interaction between the subunits of ENaC, purification
and SPR studies were performed to determine KA and KD values of the full length alpha
subunit of ENaC interacting with peptide portions of each subunit of ENaC. This
information could be used to perform site specific mutagenesis studies to elucidate if a
residue is critical for proper association and dissociation as well as to perform similar
studies but with ENaC peptides upstream and downstream of the currently studied
ENaC peptide. In these studies, gene encoding for the alpha subunit of ENaC containing
a 6X histidine tag (αHis2- αENaC), located in the extracellular loop region, was
subcloned into a yeast expression vector and expressed. This was followed by survival
growth studies, purification of native αENaC as well as αHis2- αENaC, and SPR studies to
determine KD and KA values of ENaC peptides with the full subunit αENaC.
A. Purification of αHis2-αENaC from S. cerevisiae
Cloning αHis2-αENaC for Yeast Expression
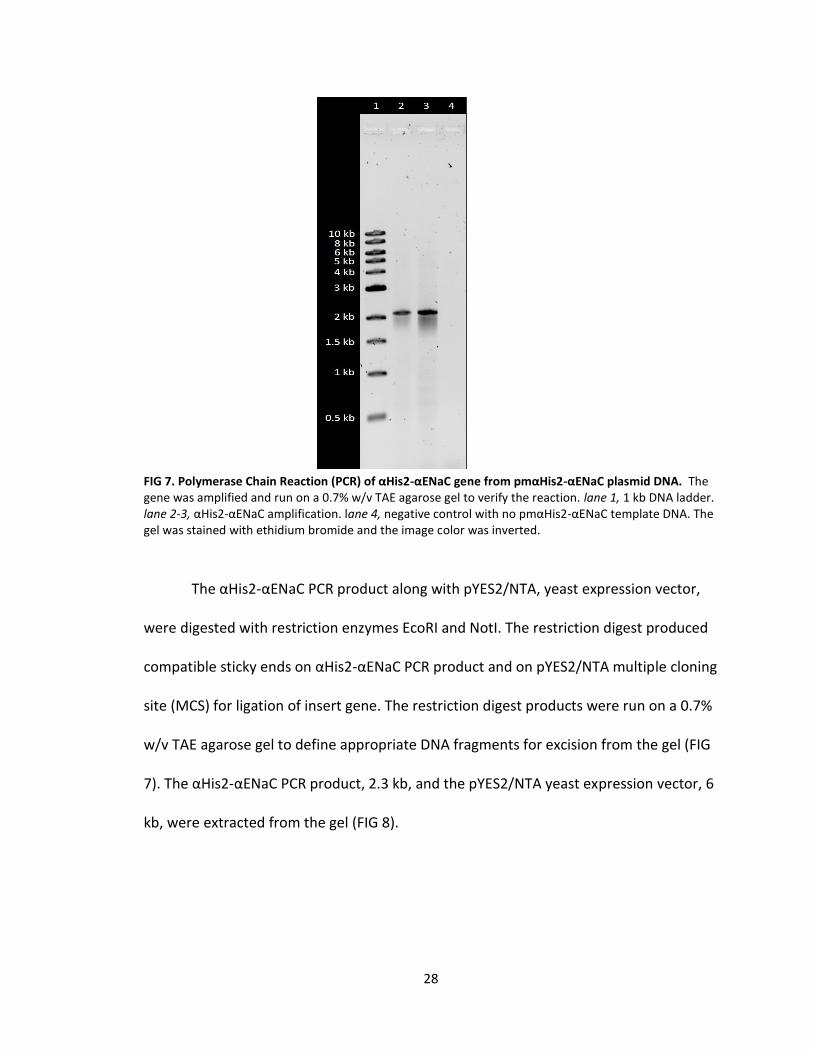
αHis2-αENaC gene was amplified by PCR from pmαHis2-αENaC, a mammalian
expression vector (donated by the Stockand lab, UTHSCSA). The PCR products were
approximately 2 kb in size and compared to a control reaction containing no template
DNA (FIG 7). The αENaC gene from Mus musculus is 2238 bp and with the addition of a
6x histidine tag located in the extracellular loop, αHis2, provide the 2.3 kb fragment
seen in gel electrophoresis (FIG 7).
28
FIG 7. Polymerase Chain Reaction (PCR) of αHis2-αENaC gene from pmαHis2-αENaC plasmid DNA. The gene was amplified and run on a 0.7% w/v TAE agarose gel to verify the reaction. lane 1, 1 kb DNA ladder. lane 2-3, αHis2-αENaC amplification. lane 4, negative control with no pmαHis2-αENaC template DNA. The gel was stained with ethidium bromide and the image color was inverted.
The αHis2-αENaC PCR product along with pYES2/NTA, yeast expression vector,
were digested with restriction enzymes EcoRI and NotI. The restriction digest produced
compatible sticky ends on αHis2-αENaC PCR product and on pYES2/NTA multiple cloning
site (MCS) for ligation of insert gene. The restriction digest products were run on a 0.7%
w/v TAE agarose gel to define appropriate DNA fragments for excision from the gel (FIG
7). The αHis2-αENaC PCR product, 2.3 kb, and the pYES2/NTA yeast expression vector, 6
kb, were extracted from the gel (FIG 8).
29
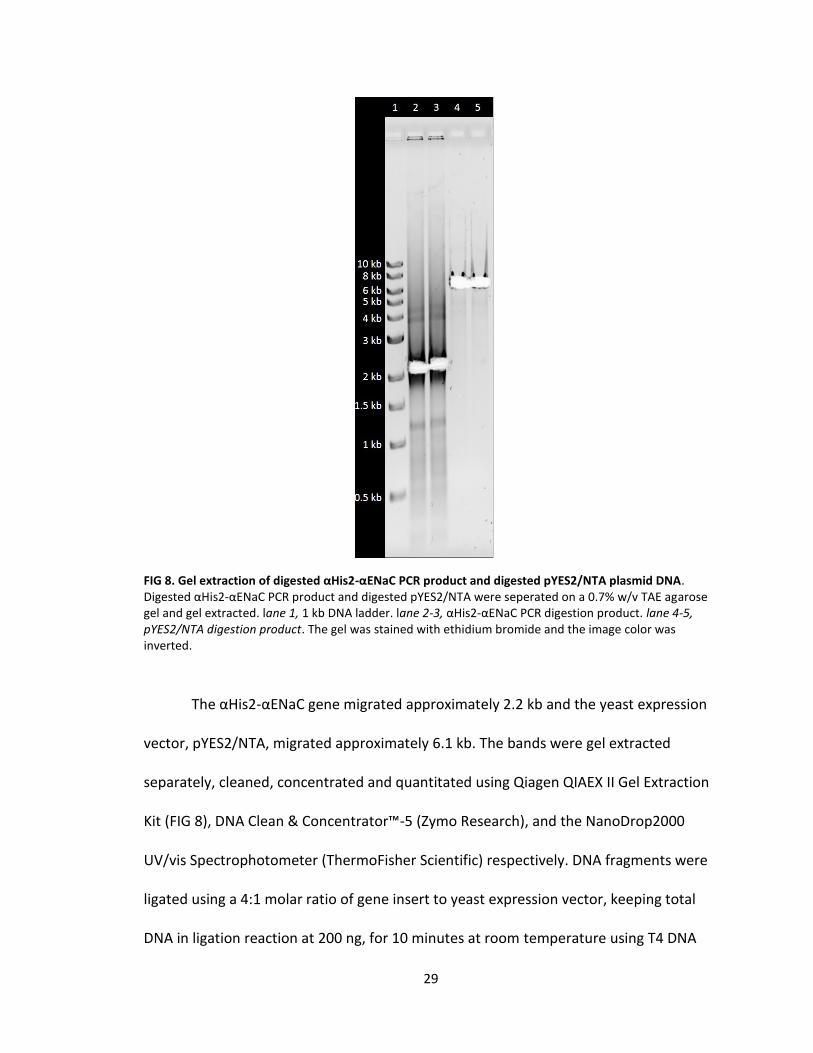
FIG 8. Gel extraction of digested αHis2-αENaC PCR product and digested pYES2/NTA plasmid DNA. Digested αHis2-αENaC PCR product and digested pYES2/NTA were seperated on a 0.7% w/v TAE agarose gel and gel extracted. lane 1, 1 kb DNA ladder. lane 2-3, αHis2-αENaC PCR digestion product. lane 4-5, pYES2/NTA digestion product. The gel was stained with ethidium bromide and the image color was inverted.
The αHis2-αENaC gene migrated approximately 2.2 kb and the yeast expression
vector, pYES2/NTA, migrated approximately 6.1 kb. The bands were gel extracted
separately, cleaned, concentrated and quantitated using Qiagen QIAEX II Gel Extraction
Kit (FIG 8), DNA Clean & Concentrator™-5 (Zymo Research), and the NanoDrop2000
UV/vis Spectrophotometer (ThermoFisher Scientific) respectively. DNA fragments were
ligated using a 4:1 molar ratio of gene insert to yeast expression vector, keeping total
DNA in ligation reaction at 200 ng, for 10 minutes at room temperature using T4 DNA
30
ligase (New England Biolabs) in 1X T4 DNA ligase buffer. After room temperature
incubation, the ligation reaction was transformed into Top 10™ E. coli cells following a
protocol from Chung and Miller (31), plated on LB containing ampicillin plates, selecting
for transformants expressing an ampicillin resistant gene, and grown overnight at 37 oC.
Once the ligation reaction was transformed into Top 10™ E. coli,
pYES2/NTA/αHis2-αENaC was isolated from a bacterial cell culture using QIAprep Spin
Miniprep Kit (Qiagen). To confirm that the αHis2-αENaC gene was properly cloned, a
pYES2/NTA/αHis2-αENaC (8.2 kb) restriction map was created and analyzed using
NEBcutter® from New England Biolabs website. The restriction enzymes EcoRI and NotI
were predicted to cut pYES2/NTA/αHis2-αENaC into two fragments of approximately 6
kb and 2.2 kb. pYES2/NTA/αHis2-αENaC, as well as restriction digestion product, were
run on a 0.7% w/v TAE agarose gel (FIG 8). The uncut pYES2/NTA, yeast expression
vector (6 kb), migrated approximately 4 kb and the restriction-digested pYES2/NTA
reaction created a band that migrated approximately 6 kb (FIG 8, lanes 2 and 3). The
uncut pYES2/NTA/αENaC (8 kb) migrated approximately 6 kb and the restriction
digested pYES2/NTA/αENaC reaction created two fragments, one being the linear
pYES2/NTA vector migrating approximately 6 kb and the second band being the αENaC
gene migrating approximately 2 kb (FIG 9, lanes 4 and 5). The uncut pYES2/NTA/αHis2-
αENaC plasmid (8 kb) migrated approximately 6 kb (FIG 9, lanes 6 and 8) and the
restriction digested pYES2/NTA/αHis2-αENaC reaction created two bands, one being the
pYES2/NTA vector migrating approximately 6 kb and the second band being the αHis2-
αENaC gene migrating approximately 2 kb (FIG 9, lanes 7 and 9). Differences between
31
the controls, pYES2/NTA and and pYES2/NTA/αENaC, compared to pYES2/NTA/αHis2-
αENaC are due to the plasmid DNAs conformations, seen in a supercoiled form as
opposed to a linear form or nicked open circular form, which migrate at slower rates
due to its topology and hydrodynamic radius. (32). The digestion products of
pYES2/NTA/αHis2-αENaC compared to pYES2/NTA/αENaC ran as expected with each of
their bands at 6 kb and 2.2 kb, indicating that the αHis2-αENaC was cloned in (FIG 9,
lane 5, lanes 7 and 9). An increase shift in the migration pattern between the 2 kb band
of αHis2-αENaC when compared to αENaC was not expected based on the 18 nt
difference from the 6X histidine tag (FIG 9, Lane 5, lanes 7 and 9). The
pYES2/NTA/αHis2-αENaC plasmid was sequenced by Quintara Biosciences. A sequence
alignment was created using CLC Sequence Viewer program, available from Qiagen
Bioinformatics website, to identify inaccuracies and verify the 6X histidine tag was
present between the αENaC and αHis2-αENaC genes.
32
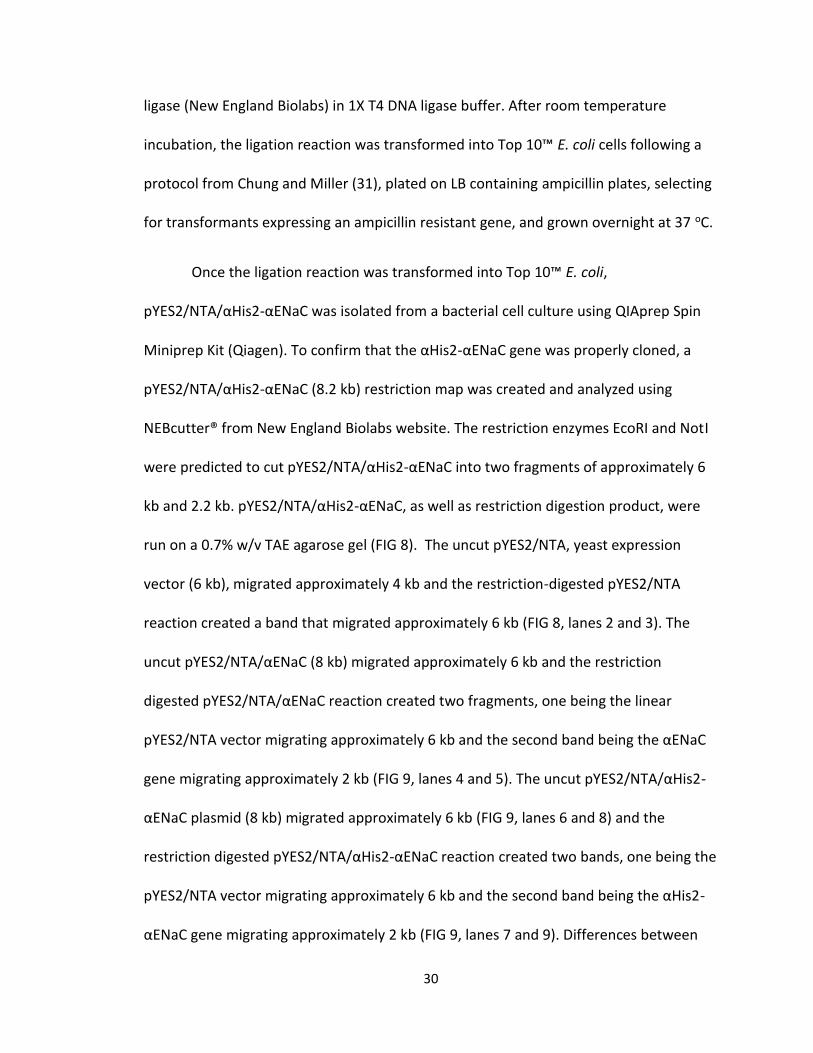
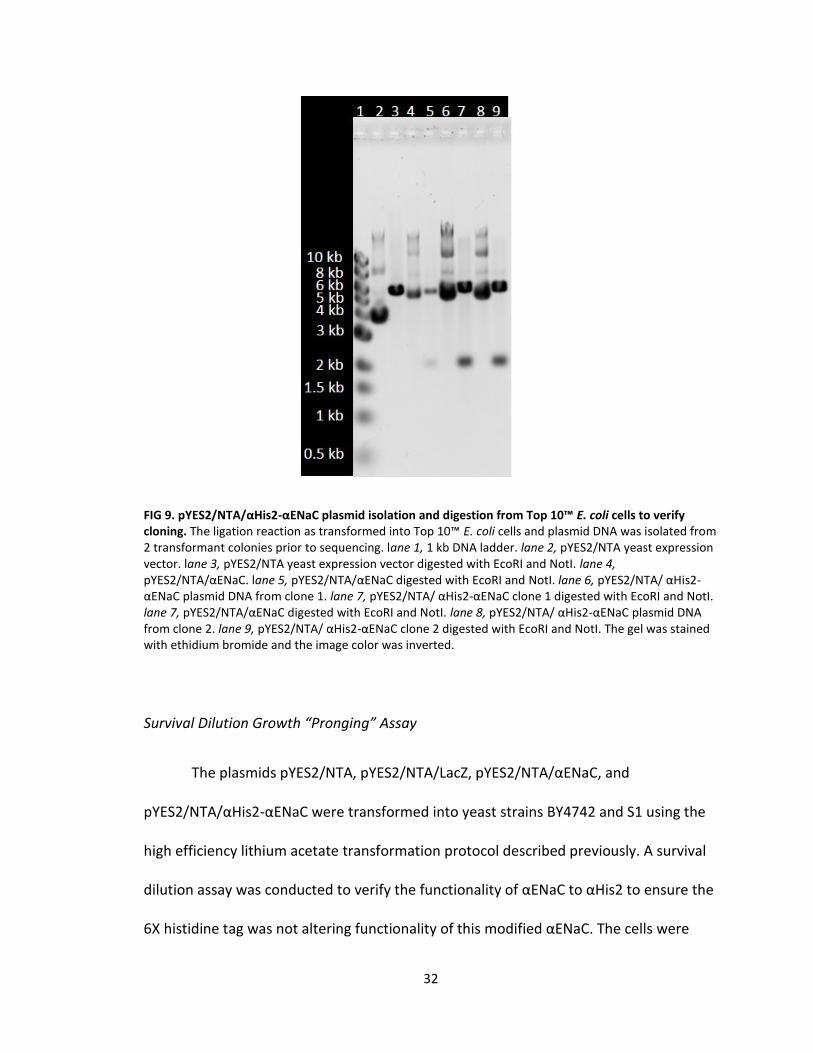
FIG 9. pYES2/NTA/αHis2-αENaC plasmid isolation and digestion from Top 10™ E. coli cells to verify cloning. The ligation reaction as transformed into Top 10™ E. coli cells and plasmid DNA was isolated from 2 transformant colonies prior to sequencing. lane 1, 1 kb DNA ladder. lane 2, pYES2/NTA yeast expression vector. lane 3, pYES2/NTA yeast expression vector digested with EcoRI and NotI. lane 4, pYES2/NTA/αENaC. lane 5, pYES2/NTA/αENaC digested with EcoRI and NotI. lane 6, pYES2/NTA/ αHis2-αENaC plasmid DNA from clone 1. lane 7, pYES2/NTA/ αHis2-αENaC clone 1 digested with EcoRI and NotI. lane 7, pYES2/NTA/αENaC digested with EcoRI and NotI. lane 8, pYES2/NTA/ αHis2-αENaC plasmid DNA from clone 2. lane 9, pYES2/NTA/ αHis2-αENaC clone 2 digested with EcoRI and NotI. The gel was stained with ethidium bromide and the image color was inverted.
Survival Dilution Growth “Pronging” Assay
The plasmids pYES2/NTA, pYES2/NTA/LacZ, pYES2/NTA/αENaC, and
pYES2/NTA/αHis2-αENaC were transformed into yeast strains BY4742 and S1 using the
high efficiency lithium acetate transformation protocol described previously. A survival
dilution assay was conducted to verify the functionality of αENaC to αHis2 to ensure the
6X histidine tag was not altering functionality of this modified αENaC. The cells were
33
plated on synthetic media without uracil containing ampicillin and either 2% glucose,
GAL1 promoter is suppressed, 2% galactose, GAL1 promoter is unoccupied, and in the
presence of excess salt, 0.5 M (FIG 10 and 11).
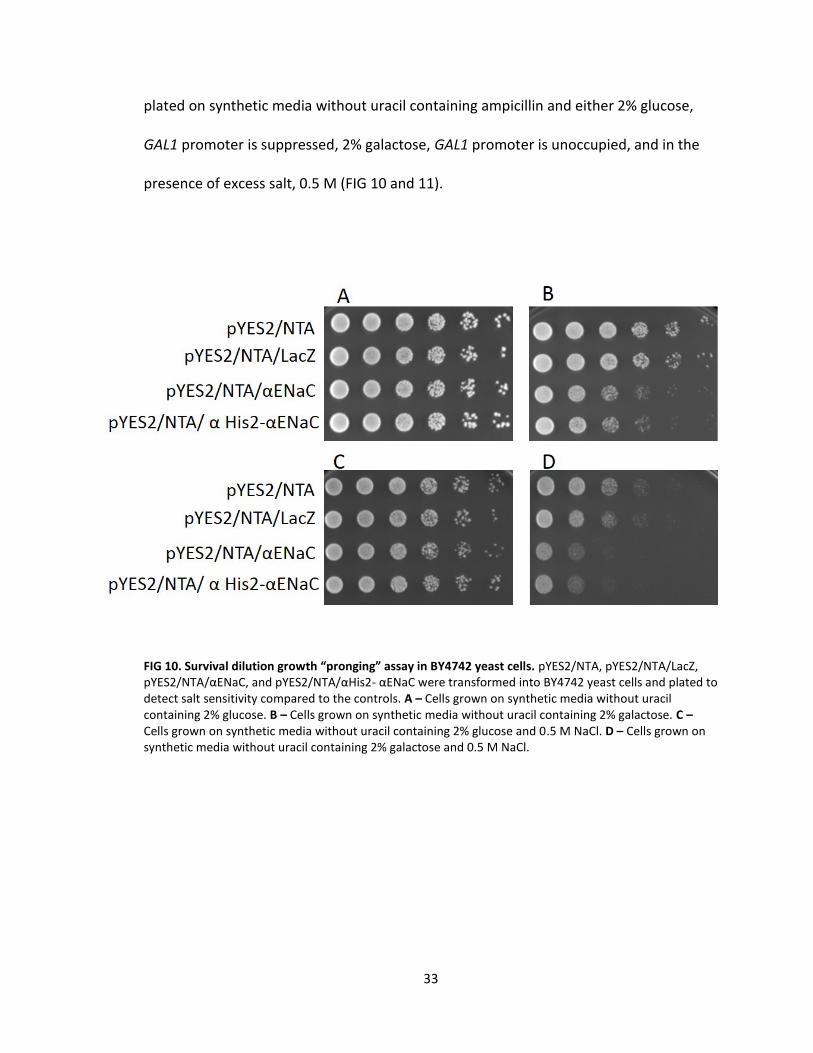
FIG 10. Survival dilution growth “pronging” assay in BY4742 yeast cells. pYES2/NTA, pYES2/NTA/LacZ, pYES2/NTA/αENaC, and pYES2/NTA/αHis2- αENaC were transformed into BY4742 yeast cells and plated to detect salt sensitivity compared to the controls. A – Cells grown on synthetic media without uracil containing 2% glucose. B – Cells grown on synthetic media without uracil containing 2% galactose. C – Cells grown on synthetic media without uracil containing 2% glucose and 0.5 M NaCl. D – Cells grown on synthetic media without uracil containing 2% galactose and 0.5 M NaCl.
34
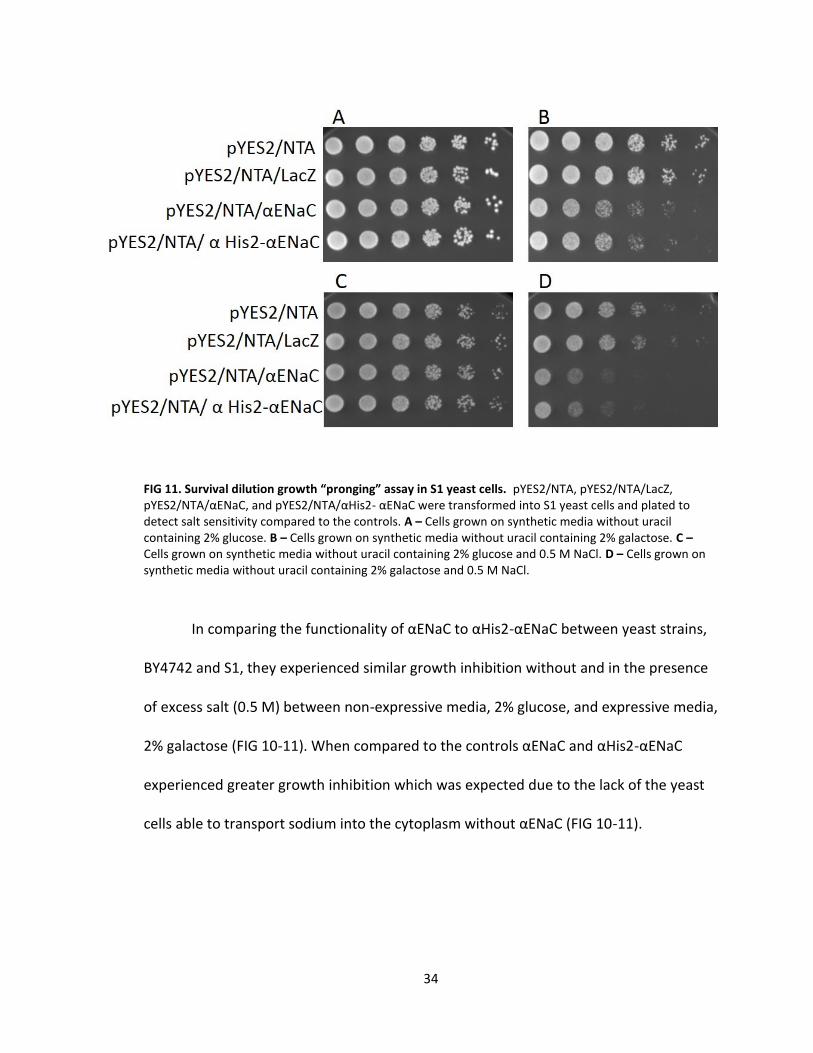
FIG 11. Survival dilution growth “pronging” assay in S1 yeast cells. pYES2/NTA, pYES2/NTA/LacZ, pYES2/NTA/αENaC, and pYES2/NTA/αHis2- αENaC were transformed into S1 yeast cells and plated to detect salt sensitivity compared to the controls. A – Cells grown on synthetic media without uracil containing 2% glucose. B – Cells grown on synthetic media without uracil containing 2% galactose. C – Cells grown on synthetic media without uracil containing 2% glucose and 0.5 M NaCl. D – Cells grown on synthetic media without uracil containing 2% galactose and 0.5 M NaCl.
In comparing the functionality of αENaC to αHis2-αENaC between yeast strains,
BY4742 and S1, they experienced similar growth inhibition without and in the presence
of excess salt (0.5 M) between non-expressive media, 2% glucose, and expressive media,
2% galactose (FIG 10-11). When compared to the controls αENaC and αHis2-αENaC
experienced greater growth inhibition which was expected due to the lack of the yeast
cells able to transport sodium into the cytoplasm without αENaC (FIG 10-11).
35
Yeast Cell Lysis Screen
In order to purify αHis2-αENaC a yeast cell lysis screen was conducted, along
with a αENaC control, to elucidate which lysis method and buffer conditions would be
ideal for purification. Eight, 20 milliliter samples of αHis2-αENaC were induced for 8
hours, as previously described. Alkaline lysis is a harsh chemical treatment to lyse yeast
cells. It is similar to SDS sample buffer however it contains a final concentration of 100
mM NaOH, to help break open the cell wall. Proteins that undergo this process are not
able to be further purified due to treatment of the whole cell lysate, it was conducted
here as a positive control. αENaC ran approximately 100 kDa similar to that of αHis2-
αENaC and also contain another band at approximately 35 kDa which most likely is
degradation of the protein (FIG 12, lanes 2-3). An additional band could be seen at
approximately 99 kDa which is due to glycosylation of αENaC (FIG 12, lanes 2-9). Also,
the signal for αENaC was more intense than that of αHis2-αENaC which could be
attributed to the lysis method itself (FIG 12, lanes 2-3). Acid washed glass beads, 425-
600 μm in size, were used along with a monobasic sodium phosphate buffer pH 7.4.
However, the intensity of αENaC and αHis2-αENaC bands are very faint, migrating
approximately 100 kDa with the absence of second glycosylation product band (FIG 12,
lanes 4-5). The alternative lysis buffer used with the acid washed glass beads was a RIPA
buffer. This buffer contains sodium deoxycholate, an ionic detergent, and Triton X-100,
a non-ionic detergent. These two chemicals help solubilize the membrane and due to
their nature, help stabilize the hydrophilic and hydrophobic portions of αENaC. αENaC
and αHis2-αENaC ran approximately 100 kDa with the presence of a second glycosylated
36
product band at approximately 99 kDa (FIG 12, lanes 6-7). Lysis by sonication was
conducted in the presence of a NaH2PO4 buffer which applies ultrasonic frequencies to
the sample causing the formation and collapse of microspheres which creates shear
force to break cell walls. αENaC and αHis2-αENaC ran at approximately 100 kDa with the
presence of a second glycosylation product band at approximately 99 kDa. However the
signal intensity of the former was higher than latter (FIG 12, lanes 8-9). When comparing
the different lysis methods and buffer conditions tested, the acid washed glass beads
with RIPA buffer was chosen for further purification studies (FIG 12).
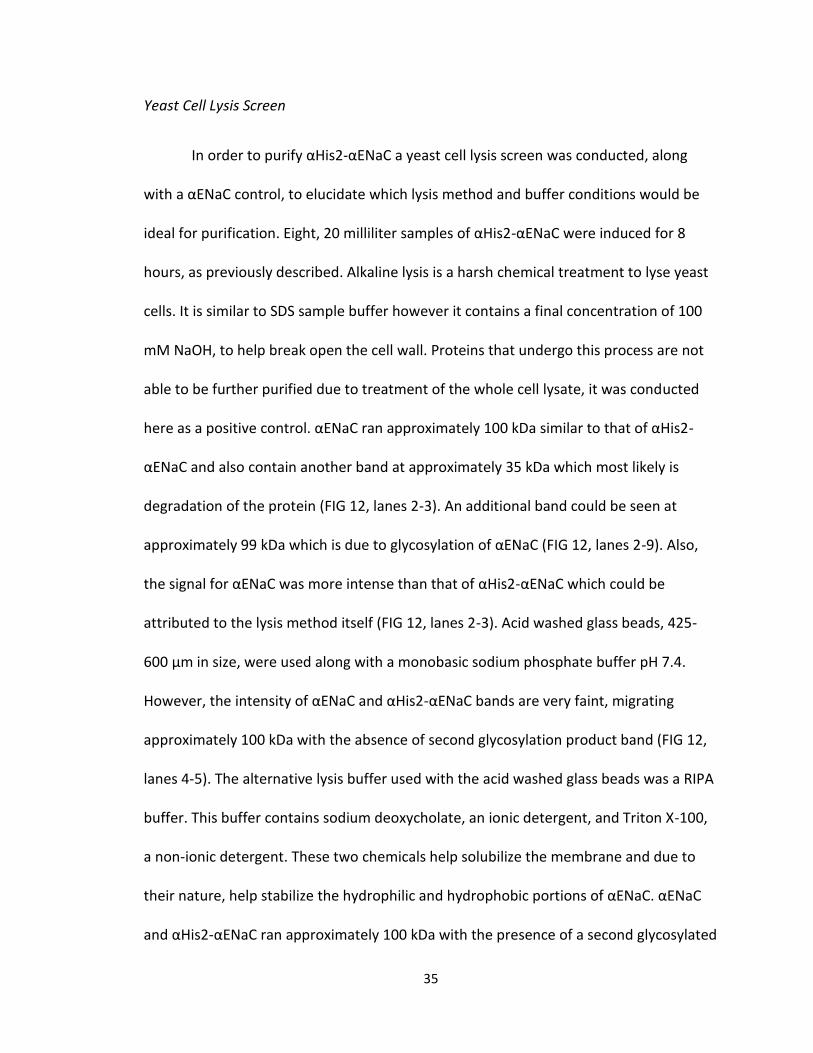
FIG 12. Western blot analysis of αHis2- αENaC using different lysis conditions. pYES2/NTA/αENaC and pYES2/NTA/αHis2- αENaC plasmids were transformed into S1 yeast cells and different lysis conditions were performed to identify an optimal method for protein extraction. Total protein of each sample was 50 μg. Membrane was probed with primary anti-Xpress™ antibody followed by probing with a secondary goat anti-mouse antibody conjugated with HRP. lane 1, PageRuler™ Plus Prestained protein ladder. lane 2, alkaline lysis of αENaC. lane 3, alkaline lysis of αHis2-αENaC. lane 4, Glass bead lysis of αENaC in NaH2PO4. lane 5, Glass bead lysis of αHis2-αENaC in NaH2PO4. lane 6, Glass bead lysis of αENaC in RIPA. lane 7, Glass bead lysis of αHis2-αENaC in RIPA. lane 8, Sonication αENaC in NaH2PO4. lane 9, Sonication of αHis2-αENaC in NaH2PO4.
250 kDa
130 kDa 100 kDa
70 kDa
55 kDa
35 kDa
25 kDa
1 2 3 4 5 6 7 8 9
37
Yeast Expression
BY4742 and S1 yeast cells containing pYES2/NTA, empty vector (EV) control, and
pYES2/NTA/αHis2-αENaC were expressed in yeast independently to confirm protein
production in each strain. Each sample was grown for 16 hours in synthetic media
without uracil containing 2% glucose and an OD600 was measured to determine cell
density. The samples were then back diluted down to an OD600 of 0.2 in expression
synthetic media without uracil contain 2% galactose. Twenty milliliter aliquots were
collected every two hours for a total time of 12 hours. The aliquots were centrifuged,
the supernatant was discarded and the samples were resuspended in RIPA buffer
containing PMSF and EDTA-free protease cocktail. Acid washed glass beads were added
to the cell suspension and vortexed to lyse the cells. Cellular debris was removed
through centrifugation and total protein of cell lysates was quantitated through a BCA
assay. Equal protein amounts, 50 μg, of each sample, along with its control, were run on
a 7.5% SDS-PAGE and transferred to a nitrocellulose membrane.
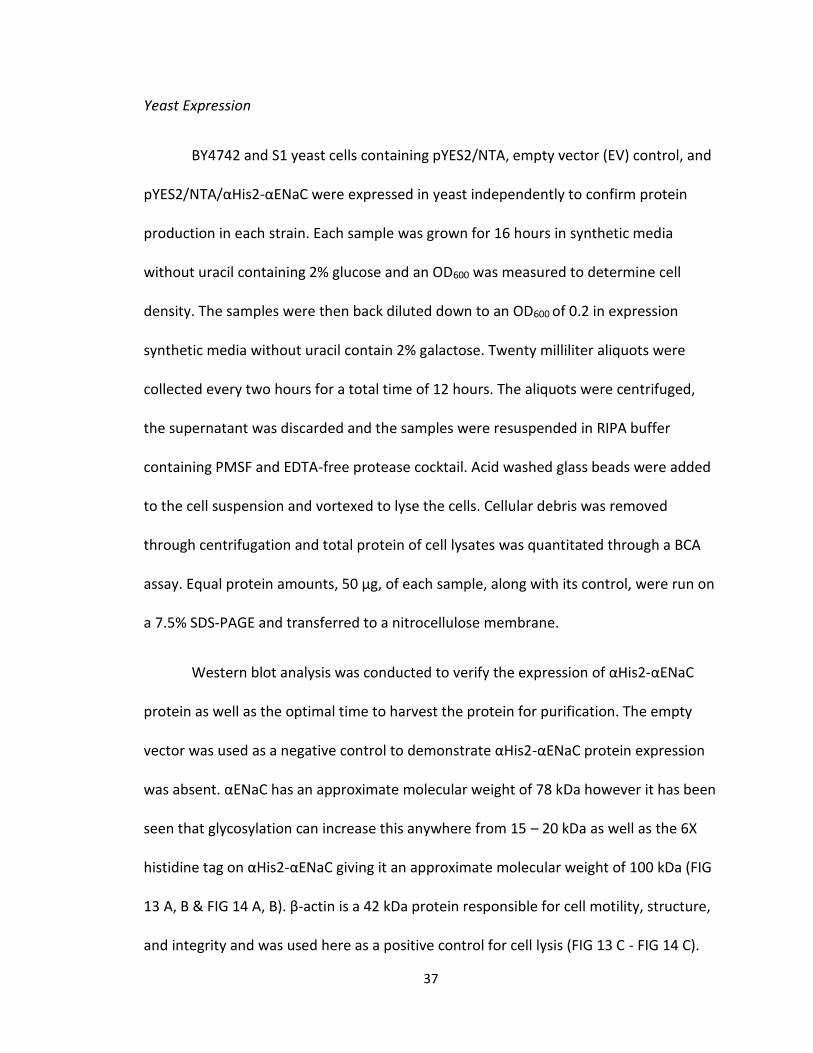
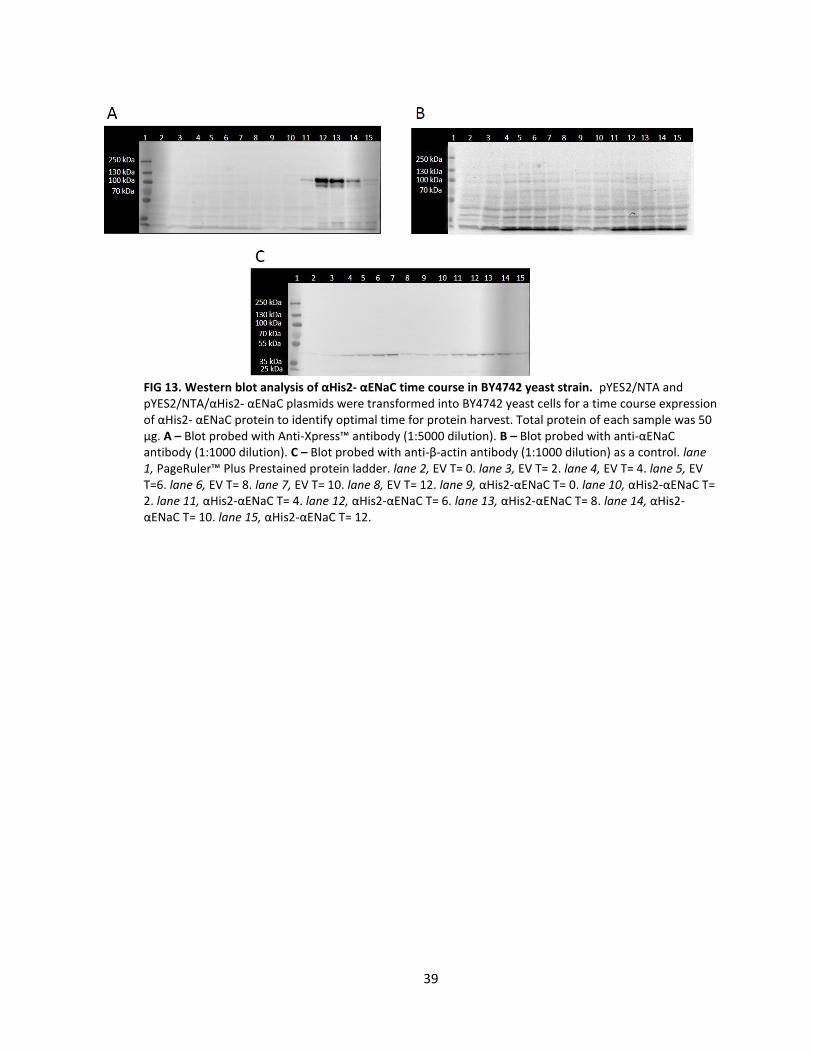
Western blot analysis was conducted to verify the expression of αHis2-αENaC
protein as well as the optimal time to harvest the protein for purification. The empty
vector was used as a negative control to demonstrate αHis2-αENaC protein expression
was absent. αENaC has an approximate molecular weight of 78 kDa however it has been
seen that glycosylation can increase this anywhere from 15 – 20 kDa as well as the 6X
histidine tag on αHis2-αENaC giving it an approximate molecular weight of 100 kDa (FIG
13 A, B & FIG 14 A, B). β-actin is a 42 kDa protein responsible for cell motility, structure,
and integrity and was used here as a positive control for cell lysis (FIG 13 C - FIG 14 C).
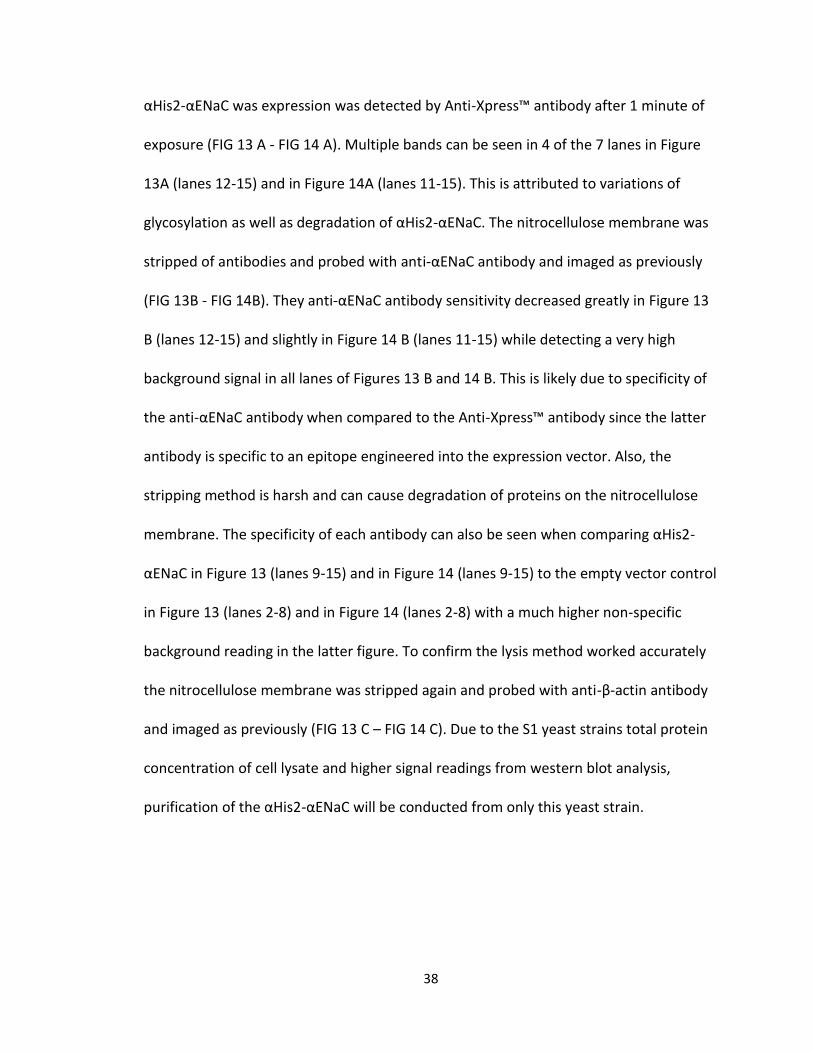
38
αHis2-αENaC was expression was detected by Anti-Xpress™ antibody after 1 minute of
exposure (FIG 13 A - FIG 14 A). Multiple bands can be seen in 4 of the 7 lanes in Figure
13A (lanes 12-15) and in Figure 14A (lanes 11-15). This is attributed to variations of
glycosylation as well as degradation of αHis2-αENaC. The nitrocellulose membrane was
stripped of antibodies and probed with anti-αENaC antibody and imaged as previously
(FIG 13B - FIG 14B). They anti-αENaC antibody sensitivity decreased greatly in Figure 13
B (lanes 12-15) and slightly in Figure 14 B (lanes 11-15) while detecting a very high
background signal in all lanes of Figures 13 B and 14 B. This is likely due to specificity of
the anti-αENaC antibody when compared to the Anti-Xpress™ antibody since the latter
antibody is specific to an epitope engineered into the expression vector. Also, the
stripping method is harsh and can cause degradation of proteins on the nitrocellulose
membrane. The specificity of each antibody can also be seen when comparing αHis2-
αENaC in Figure 13 (lanes 9-15) and in Figure 14 (lanes 9-15) to the empty vector control
in Figure 13 (lanes 2-8) and in Figure 14 (lanes 2-8) with a much higher non-specific
background reading in the latter figure. To confirm the lysis method worked accurately
the nitrocellulose membrane was stripped again and probed with anti-β-actin antibody
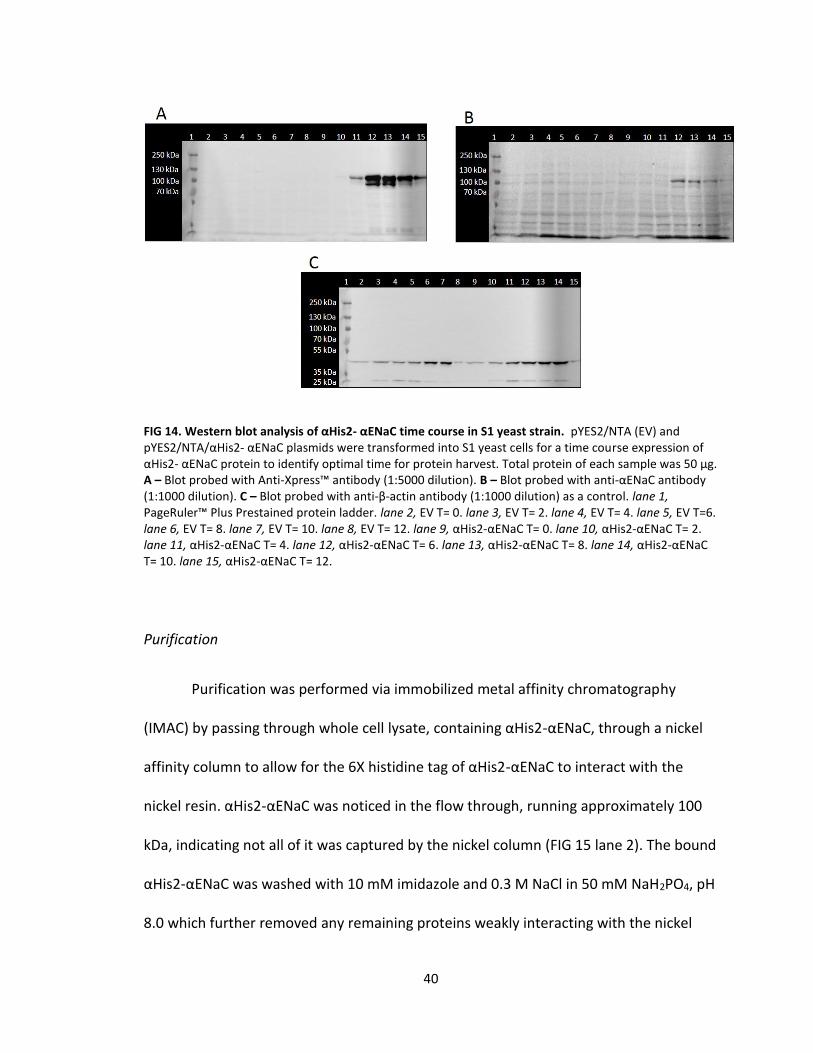
and imaged as previously (FIG 13 C – FIG 14 C). Due to the S1 yeast strains total protein
concentration of cell lysate and higher signal readings from western blot analysis,
purification of the αHis2-αENaC will be conducted from only this yeast strain.
39
FIG 13. Western blot analysis of αHis2- αENaC time course in BY4742 yeast strain. pYES2/NTA and pYES2/NTA/αHis2- αENaC plasmids were transformed into BY4742 yeast cells for a time course expression of αHis2- αENaC protein to identify optimal time for protein harvest. Total protein of each sample was 50 μg. A – Blot probed with Anti-Xpress™ antibody (1:5000 dilution). B – Blot probed with anti-αENaC antibody (1:1000 dilution). C – Blot probed with anti-β-actin antibody (1:1000 dilution) as a control. lane 1, PageRuler™ Plus Prestained protein ladder. lane 2, EV T= 0. lane 3, EV T= 2. lane 4, EV T= 4. lane 5, EV T=6. lane 6, EV T= 8. lane 7, EV T= 10. lane 8, EV T= 12. lane 9, αHis2-αENaC T= 0. lane 10, αHis2-αENaC T= 2. lane 11, αHis2-αENaC T= 4. lane 12, αHis2-αENaC T= 6. lane 13, αHis2-αENaC T= 8. lane 14, αHis2-αENaC T= 10. lane 15, αHis2-αENaC T= 12.
40
FIG 14. Western blot analysis of αHis2- αENaC time course in S1 yeast strain. pYES2/NTA (EV) and pYES2/NTA/αHis2- αENaC plasmids were transformed into S1 yeast cells for a time course expression of αHis2- αENaC protein to identify optimal time for protein harvest. Total protein of each sample was 50 μg. A – Blot probed with Anti-Xpress™ antibody (1:5000 dilution). B – Blot probed with anti-αENaC antibody (1:1000 dilution). C – Blot probed with anti-β-actin antibody (1:1000 dilution) as a control. lane 1, PageRuler™ Plus Prestained protein ladder. lane 2, EV T= 0. lane 3, EV T= 2. lane 4, EV T= 4. lane 5, EV T=6. lane 6, EV T= 8. lane 7, EV T= 10. lane 8, EV T= 12. lane 9, αHis2-αENaC T= 0. lane 10, αHis2-αENaC T= 2. lane 11, αHis2-αENaC T= 4. lane 12, αHis2-αENaC T= 6. lane 13, αHis2-αENaC T= 8. lane 14, αHis2-αENaC T= 10. lane 15, αHis2-αENaC T= 12.
Purification
Purification was performed via immobilized metal affinity chromatography
(IMAC) by passing through whole cell lysate, containing αHis2-αENaC, through a nickel
affinity column to allow for the 6X histidine tag of αHis2-αENaC to interact with the
nickel resin. αHis2-αENaC was noticed in the flow through, running approximately 100
kDa, indicating not all of it was captured by the nickel column (FIG 15 lane 2). The bound
αHis2-αENaC was washed with 10 mM imidazole and 0.3 M NaCl in 50 mM NaH2PO4, pH
8.0 which further removed any remaining proteins weakly interacting with the nickel
41
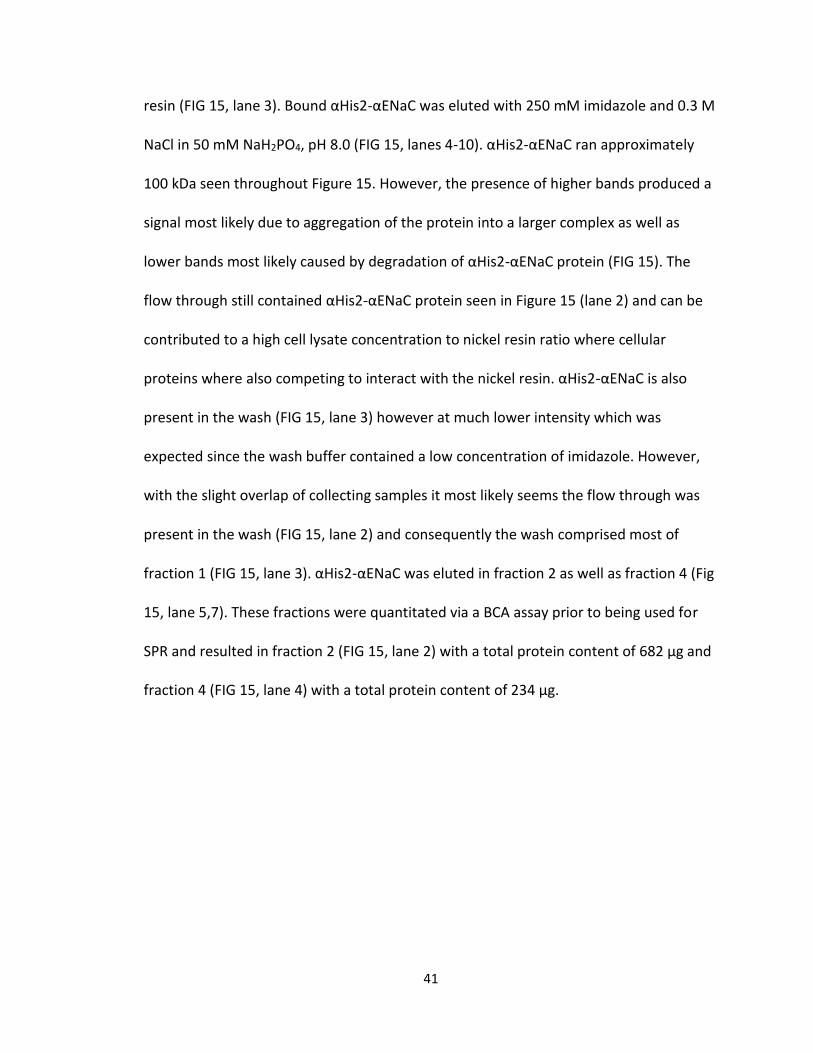
resin (FIG 15, lane 3). Bound αHis2-αENaC was eluted with 250 mM imidazole and 0.3 M
NaCl in 50 mM NaH2PO4, pH 8.0 (FIG 15, lanes 4-10). αHis2-αENaC ran approximately
100 kDa seen throughout Figure 15. However, the presence of higher bands produced a
signal most likely due to aggregation of the protein into a larger complex as well as
lower bands most likely caused by degradation of αHis2-αENaC protein (FIG 15). The
flow through still contained αHis2-αENaC protein seen in Figure 15 (lane 2) and can be
contributed to a high cell lysate concentration to nickel resin ratio where cellular
proteins where also competing to interact with the nickel resin. αHis2-αENaC is also
present in the wash (FIG 15, lane 3) however at much lower intensity which was
expected since the wash buffer contained a low concentration of imidazole. However,
with the slight overlap of collecting samples it most likely seems the flow through was
present in the wash (FIG 15, lane 2) and consequently the wash comprised most of
fraction 1 (FIG 15, lane 3). αHis2-αENaC was eluted in fraction 2 as well as fraction 4 (Fig
15, lane 5,7). These fractions were quantitated via a BCA assay prior to being used for
SPR and resulted in fraction 2 (FIG 15, lane 2) with a total protein content of 682 μg and
fraction 4 (FIG 15, lane 4) with a total protein content of 234 μg.
42
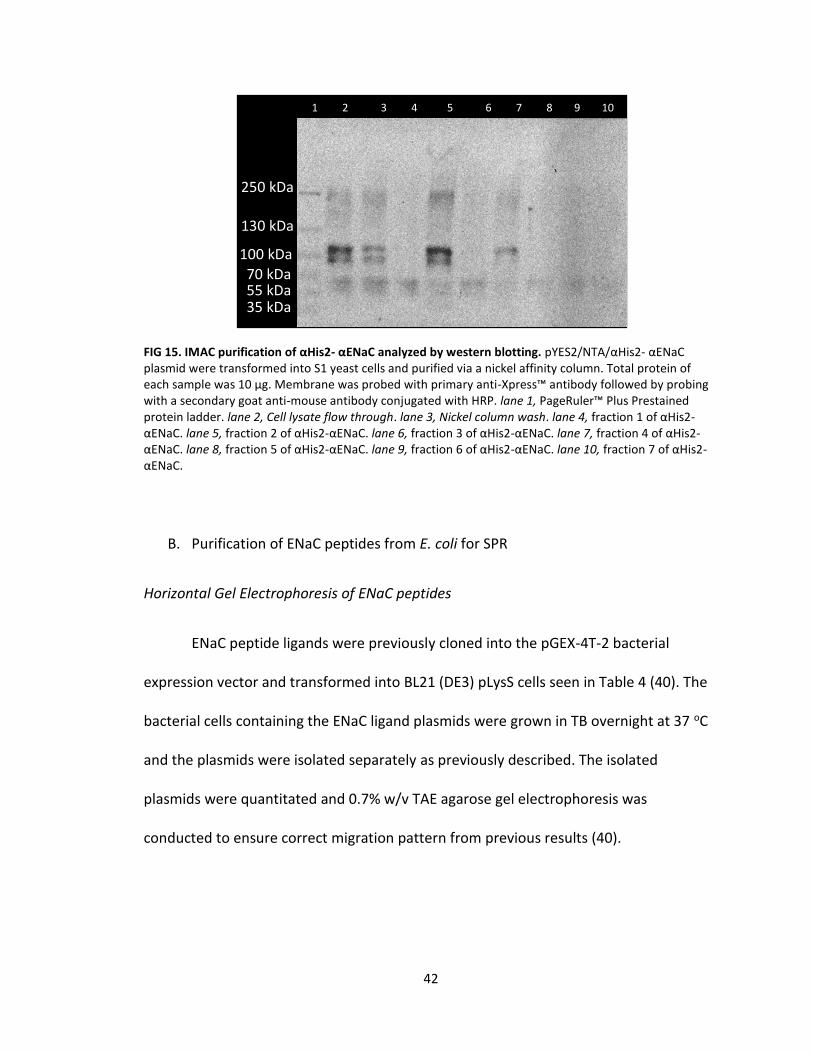
FIG 15. IMAC purification of αHis2- αENaC analyzed by western blotting. pYES2/NTA/αHis2- αENaC plasmid were transformed into S1 yeast cells and purified via a nickel affinity column. Total protein of each sample was 10 μg. Membrane was probed with primary anti-Xpress™ antibody followed by probing with a secondary goat anti-mouse antibody conjugated with HRP. lane 1, PageRuler™ Plus Prestained protein ladder. lane 2, Cell lysate flow through. lane 3, Nickel column wash. lane 4, fraction 1 of αHis2-αENaC. lane 5, fraction 2 of αHis2-αENaC. lane 6, fraction 3 of αHis2-αENaC. lane 7, fraction 4 of αHis2-αENaC. lane 8, fraction 5 of αHis2-αENaC. lane 9, fraction 6 of αHis2-αENaC. lane 10, fraction 7 of αHis2-αENaC.
B. Purification of ENaC peptides from E. coli for SPR
Horizontal Gel Electrophoresis of ENaC peptides
ENaC peptide ligands were previously cloned into the pGEX-4T-2 bacterial
expression vector and transformed into BL21 (DE3) pLysS cells seen in Table 4 (40). The
bacterial cells containing the ENaC ligand plasmids were grown in TB overnight at 37 oC
and the plasmids were isolated separately as previously described. The isolated
plasmids were quantitated and 0.7% w/v TAE agarose gel electrophoresis was
conducted to ensure correct migration pattern from previous results (40).
250 kDa
130 kDa
100 kDa
70 kDa 55 kDa 35 kDa
1 2 3 4 5 6 7 8 9 10
43
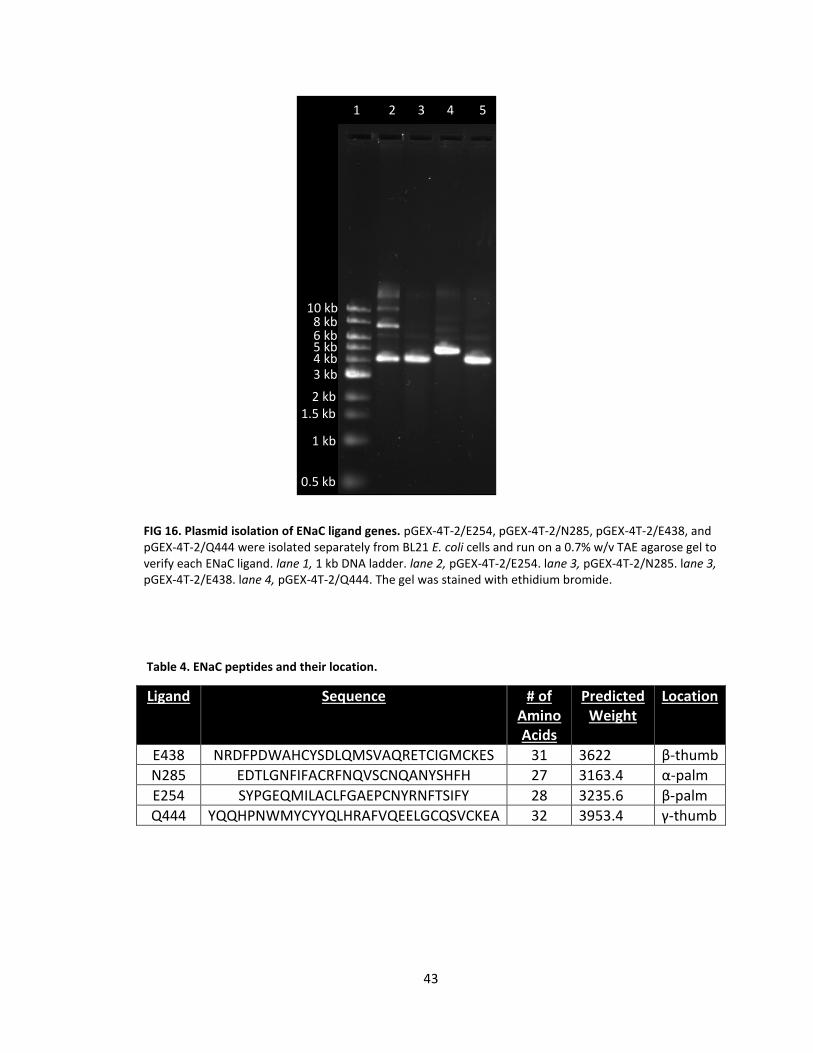
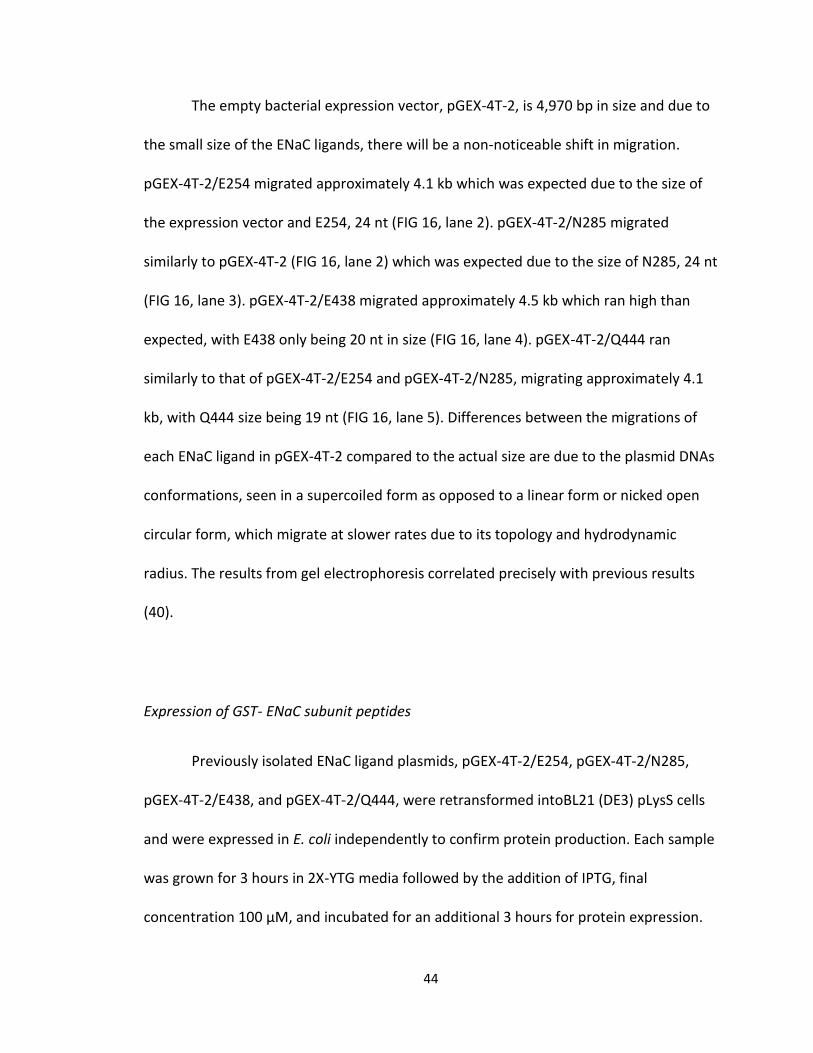
FIG 16. Plasmid isolation of ENaC ligand genes. pGEX-4T-2/E254, pGEX-4T-2/N285, pGEX-4T-2/E438, and pGEX-4T-2/Q444 were isolated separately from BL21 E. coli cells and run on a 0.7% w/v TAE agarose gel to verify each ENaC ligand. lane 1, 1 kb DNA ladder. lane 2, pGEX-4T-2/E254. lane 3, pGEX-4T-2/N285. lane 3, pGEX-4T-2/E438. lane 4, pGEX-4T-2/Q444. The gel was stained with ethidium bromide.
Table 4. ENaC peptides and their location.
Ligand Sequence # of Amino Acids
Predicted Weight
Location
E438 NRDFPDWAHCYSDLQMSVAQRETCIGMCKES 31 3622 β-thumb
N285 EDTLGNFIFACRFNQVSCNQANYSHFH 27 3163.4 α-palm
E254 SYPGEQMILACLFGAEPCNYRNFTSIFY 28 3235.6 β-palm
Q444 YQQHPNWMYCYYQLHRAFVQEELGCQSVCKEA 32 3953.4 γ-thumb
10 kb 8 kb 6 kb 5 kb 4 kb 3 kb
2 kb 1.5 kb
1 kb
0.5 kb
1 2 3 4 5
44
The empty bacterial expression vector, pGEX-4T-2, is 4,970 bp in size and due to
the small size of the ENaC ligands, there will be a non-noticeable shift in migration.
pGEX-4T-2/E254 migrated approximately 4.1 kb which was expected due to the size of
the expression vector and E254, 24 nt (FIG 16, lane 2). pGEX-4T-2/N285 migrated
similarly to pGEX-4T-2 (FIG 16, lane 2) which was expected due to the size of N285, 24 nt
(FIG 16, lane 3). pGEX-4T-2/E438 migrated approximately 4.5 kb which ran high than
expected, with E438 only being 20 nt in size (FIG 16, lane 4). pGEX-4T-2/Q444 ran
similarly to that of pGEX-4T-2/E254 and pGEX-4T-2/N285, migrating approximately 4.1
kb, with Q444 size being 19 nt (FIG 16, lane 5). Differences between the migrations of
each ENaC ligand in pGEX-4T-2 compared to the actual size are due to the plasmid DNAs
conformations, seen in a supercoiled form as opposed to a linear form or nicked open
circular form, which migrate at slower rates due to its topology and hydrodynamic
radius. The results from gel electrophoresis correlated precisely with previous results
(40).
Expression of GST- ENaC subunit peptides
Previously isolated ENaC ligand plasmids, pGEX-4T-2/E254, pGEX-4T-2/N285,
pGEX-4T-2/E438, and pGEX-4T-2/Q444, were retransformed intoBL21 (DE3) pLysS cells
and were expressed in E. coli independently to confirm protein production. Each sample
was grown for 3 hours in 2X-YTG media followed by the addition of IPTG, final
concentration 100 μM, and incubated for an additional 3 hours for protein expression.
45
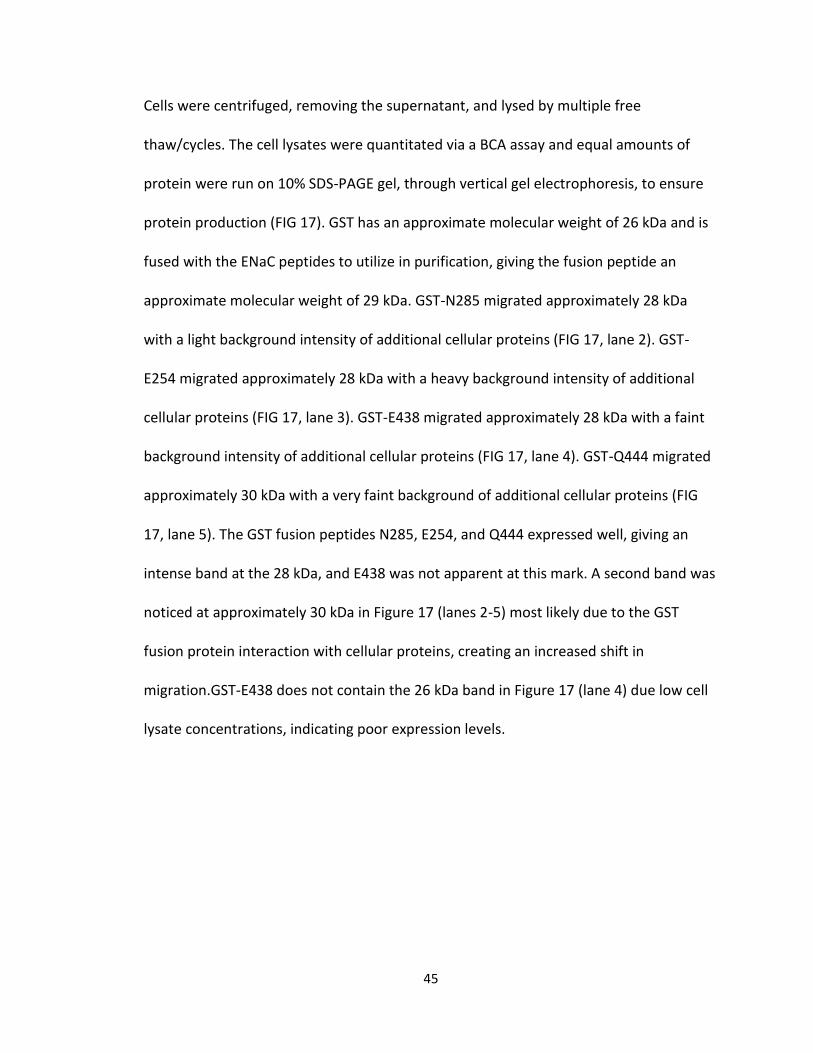
Cells were centrifuged, removing the supernatant, and lysed by multiple free
thaw/cycles. The cell lysates were quantitated via a BCA assay and equal amounts of
protein were run on 10% SDS-PAGE gel, through vertical gel electrophoresis, to ensure
protein production (FIG 17). GST has an approximate molecular weight of 26 kDa and is
fused with the ENaC peptides to utilize in purification, giving the fusion peptide an
approximate molecular weight of 29 kDa. GST-N285 migrated approximately 28 kDa
with a light background intensity of additional cellular proteins (FIG 17, lane 2). GST-
E254 migrated approximately 28 kDa with a heavy background intensity of additional
cellular proteins (FIG 17, lane 3). GST-E438 migrated approximately 28 kDa with a faint
background intensity of additional cellular proteins (FIG 17, lane 4). GST-Q444 migrated
approximately 30 kDa with a very faint background of additional cellular proteins (FIG
17, lane 5). The GST fusion peptides N285, E254, and Q444 expressed well, giving an
intense band at the 28 kDa, and E438 was not apparent at this mark. A second band was
noticed at approximately 30 kDa in Figure 17 (lanes 2-5) most likely due to the GST
fusion protein interaction with cellular proteins, creating an increased shift in
migration.GST-E438 does not contain the 26 kDa band in Figure 17 (lane 4) due low cell
lysate concentrations, indicating poor expression levels.
46
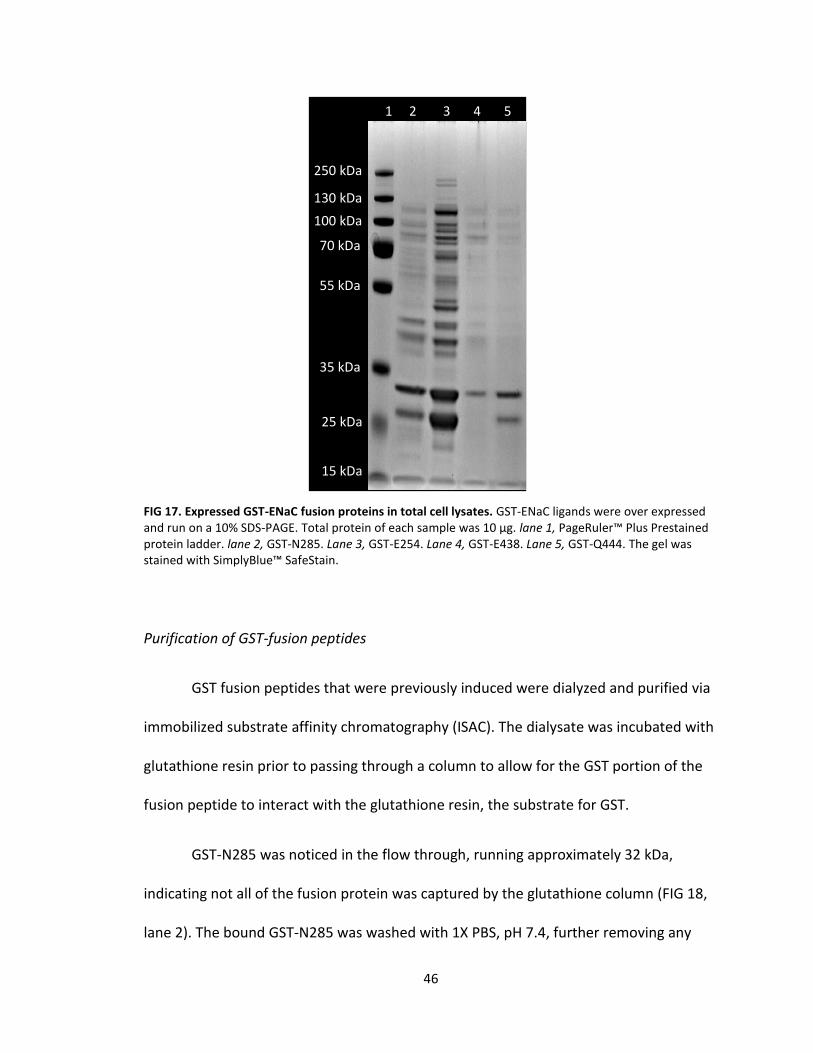
FIG 17. Expressed GST-ENaC fusion proteins in total cell lysates. GST-ENaC ligands were over expressed and run on a 10% SDS-PAGE. Total protein of each sample was 10 μg. lane 1, PageRuler™ Plus Prestained protein ladder. lane 2, GST-N285. Lane 3, GST-E254. Lane 4, GST-E438. Lane 5, GST-Q444. The gel was stained with SimplyBlue™ SafeStain.
Purification of GST-fusion peptides
GST fusion peptides that were previously induced were dialyzed and purified via
immobilized substrate affinity chromatography (ISAC). The dialysate was incubated with
glutathione resin prior to passing through a column to allow for the GST portion of the
fusion peptide to interact with the glutathione resin, the substrate for GST.
GST-N285 was noticed in the flow through, running approximately 32 kDa,
indicating not all of the fusion protein was captured by the glutathione column (FIG 18,
lane 2). The bound GST-N285 was washed with 1X PBS, pH 7.4, further removing any
250 kDa
130 kDa
100 kDa
70 kDa
55 kDa
35 kDa
25 kDa
15 kDa
1 2 3 4 5
47
weakly bound proteins interaction with the glutathione resin (FIG 18, lane 3). Bound
GST-N285 was eluted with 10 mM reduced glutathione in 50 mM Tris-HCl, pH 7.4 (FIG
18, lanes 5-7). GST-N285 ran at a single intense band approximately 28 kDa seen in
Figure 18 (lanes 5-7), indicating precise purification. The flow through still contained a
portion of GST-N285 seen in Figure 18 (lane 2) and can be contributed to high cell lysate
concentration to glutathione resin ratio. There is no presence of proteins in the wash
see in Figure 18 (lane 3) indicating GST-N285 was strongly interacting with the
glutathione resin. GST-N285 was eluted throughout all fractions collected (Fig 18, lanes
5-7) and quantitated via a BCA assay prior to being used for SPR. This resulted in fraction
1 having a total protein content of 427 μg, fraction 2 having a total protein content of
679 μg and fraction 3 having a total protein content of 206 μg (Fig 18, lane 5-7),
respectively.
GST-E254 was noticed in the flow through, running approximately 32 kDa,
indicating not all of the fusion protein was captured by the glutathione column (FIG 19,
lane 2). The bound GST-E254 was washed with 1X PBS, pH 7.4, further removing any
weakly bound proteins interaction with the glutathione resin (FIG 19, lane 3). Bound
GST-E254 was eluted with 10 mM reduced glutathione in 50 mM Tris-HCl, pH 7.4 (FIG
19, lanes 4-6). GST-E254 ran at a single intense band approximately 28 kDa seen in
Figure 19 (lanes 4-6), indicating precise purification. The flow through still contained a
portion of GST-E254 seen in Figure 19 (lane 1) and can be contributed to high cell lysate
concentration to glutathione resin ratio. There is a high presence of proteins in the wash
see in Figure 19 (lane 2) indicating GST-E254 was not intensely interacting with the
48
glutathione resin. GST-E254 was eluted throughout all fractions collected (Fig 19, lanes
4-6) and quantitated via a BCA assay prior to being used for SPR. This resulted in fraction
1 having a total protein content of 929 μg, fraction 2 having a total protein content of
1.12 mg and fraction 3 having a total protein content of 662 μg (Fig 19, lane 4-6),
respectively.
GST-E438 was noticed in the flow through, running approximately 32 kDa,
indicating not all of the fusion protein was captured by the glutathione column (FIG 20,
lane 2). The bound GST-E438 was washed with 1X PBS, pH 7.4, further removing any
weakly bound proteins interaction with the glutathione resin (FIG 20, lane 3). Bound
GST-E438 was eluted with 10 mM reduced glutathione in 50 mM Tris-HCl, pH 7.4 (FIG
20, lanes 4-6). GST-E438 ran at approximately 28 kDa as well as higher molecular
weights seen in Figure 20 (lanes 4-6), indicating dimerization. The flow through still
contained a portion of GST-E438 seen in Figure 20 (lane 2) and can be contributed to
high cell lysate concentration to glutathione resin ratio. There is a presence of proteins
in the wash see in Figure 20 (lane 3) indicating GST-E438 was not intensely interacting
with the glutathione resin. GST-E438 was eluted throughout all fractions collected,
though very weak, (FIG 20, lanes 4-6) and quantitated via a BCA assay prior to being
used for SPR. This resulted in fraction 1 having a total protein content of 1.31 mg,
fraction 2 having a total protein content of 1.28 mg and fraction 3 having a total protein
content of 914 μg (FIG 20, lane 4-6), respectively.
GST-Q444 was noticed in the flow through, running approximately 32 kDa,
indicating not all of the fusion protein was captured by the glutathione column (FIG 21,
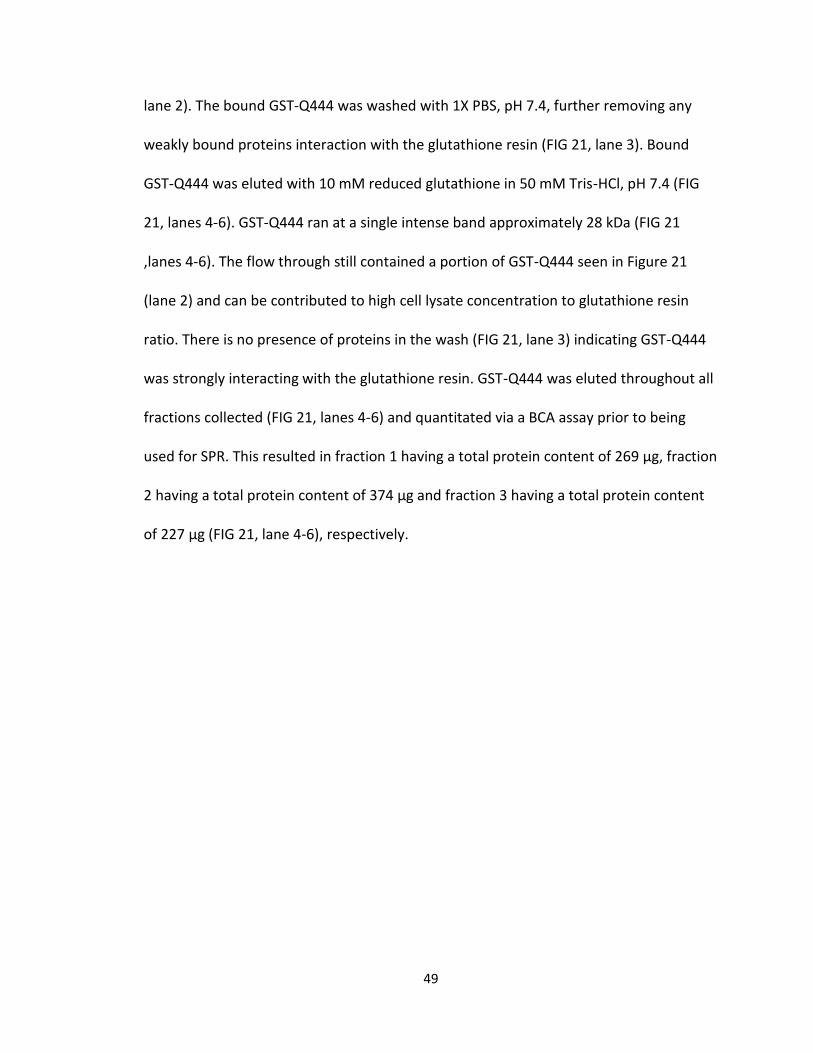
49
lane 2). The bound GST-Q444 was washed with 1X PBS, pH 7.4, further removing any
weakly bound proteins interaction with the glutathione resin (FIG 21, lane 3). Bound
GST-Q444 was eluted with 10 mM reduced glutathione in 50 mM Tris-HCl, pH 7.4 (FIG
21, lanes 4-6). GST-Q444 ran at a single intense band approximately 28 kDa (FIG 21
,lanes 4-6). The flow through still contained a portion of GST-Q444 seen in Figure 21
(lane 2) and can be contributed to high cell lysate concentration to glutathione resin
ratio. There is no presence of proteins in the wash (FIG 21, lane 3) indicating GST-Q444
was strongly interacting with the glutathione resin. GST-Q444 was eluted throughout all
fractions collected (FIG 21, lanes 4-6) and quantitated via a BCA assay prior to being
used for SPR. This resulted in fraction 1 having a total protein content of 269 μg, fraction
2 having a total protein content of 374 μg and fraction 3 having a total protein content
of 227 μg (FIG 21, lane 4-6), respectively.
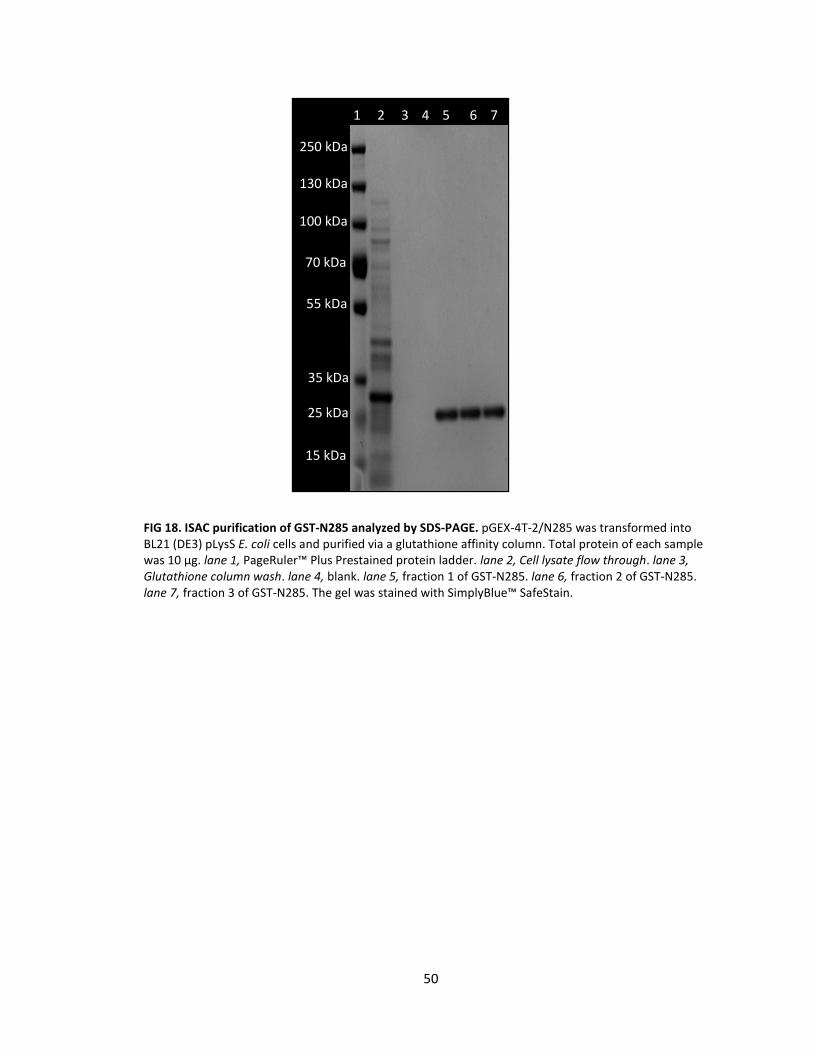
50
FIG 18. ISAC purification of GST-N285 analyzed by SDS-PAGE. pGEX-4T-2/N285 was transformed into BL21 (DE3) pLysS E. coli cells and purified via a glutathione affinity column. Total protein of each sample was 10 μg. lane 1, PageRuler™ Plus Prestained protein ladder. lane 2, Cell lysate flow through. lane 3, Glutathione column wash. lane 4, blank. lane 5, fraction 1 of GST-N285. lane 6, fraction 2 of GST-N285. lane 7, fraction 3 of GST-N285. The gel was stained with SimplyBlue™ SafeStain.
250 kDa
130 kDa
100 kDa
70 kDa
55 kDa
35 kDa
25 kDa
15 kDa
1 2 3 4 5 6 7
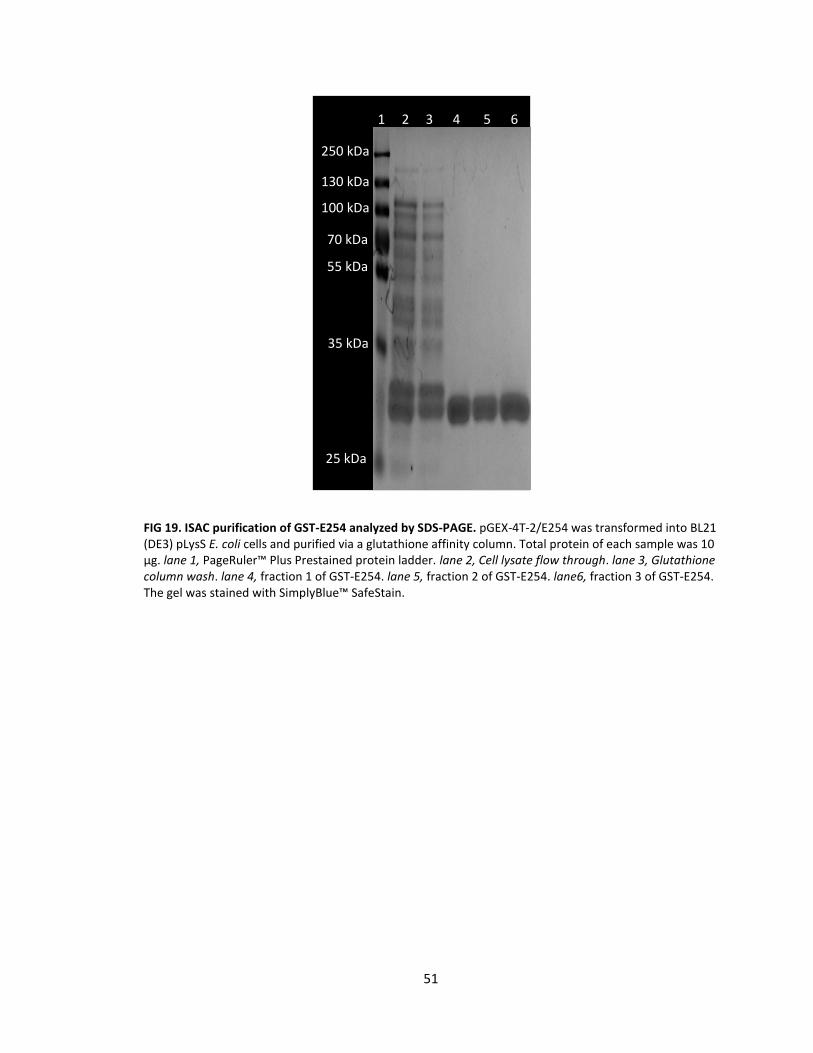
51
FIG 19. ISAC purification of GST-E254 analyzed by SDS-PAGE. pGEX-4T-2/E254 was transformed into BL21 (DE3) pLysS E. coli cells and purified via a glutathione affinity column. Total protein of each sample was 10 μg. lane 1, PageRuler™ Plus Prestained protein ladder. lane 2, Cell lysate flow through. lane 3, Glutathione column wash. lane 4, fraction 1 of GST-E254. lane 5, fraction 2 of GST-E254. lane6, fraction 3 of GST-E254. The gel was stained with SimplyBlue™ SafeStain.
250 kDa
130 kDa
100 kDa
70 kDa
55 kDa
35 kDa
25 kDa
1 2 3 4 5 6
52
FIG 20. ISAC purification of GST-E438 analyzed by SDS-PAGE. pGEX-4T-2/E438 was transformed into BL21 (DE3) pLysS E. coli cells and purified via a glutathione affinity column. Total protein of each sample was 10 μg. lane 1, PageRuler™ Plus Prestained protein ladder. lane 2, Cell lysate flow through. lane 3, Glutathione column wash. lane 4, fraction 1 of GST-E438. lane 5, fraction 2 of GST-E438. Lane6, fraction 3 of GST-E438. The gel was stained with SimplyBlue™ SafeStain and the image was inverted.
250 kDa
130 kDa
100 kDa
70 kDa
55 kDa
35 kDa
25 kDa
15 kDa
1 2 3 4 5 6
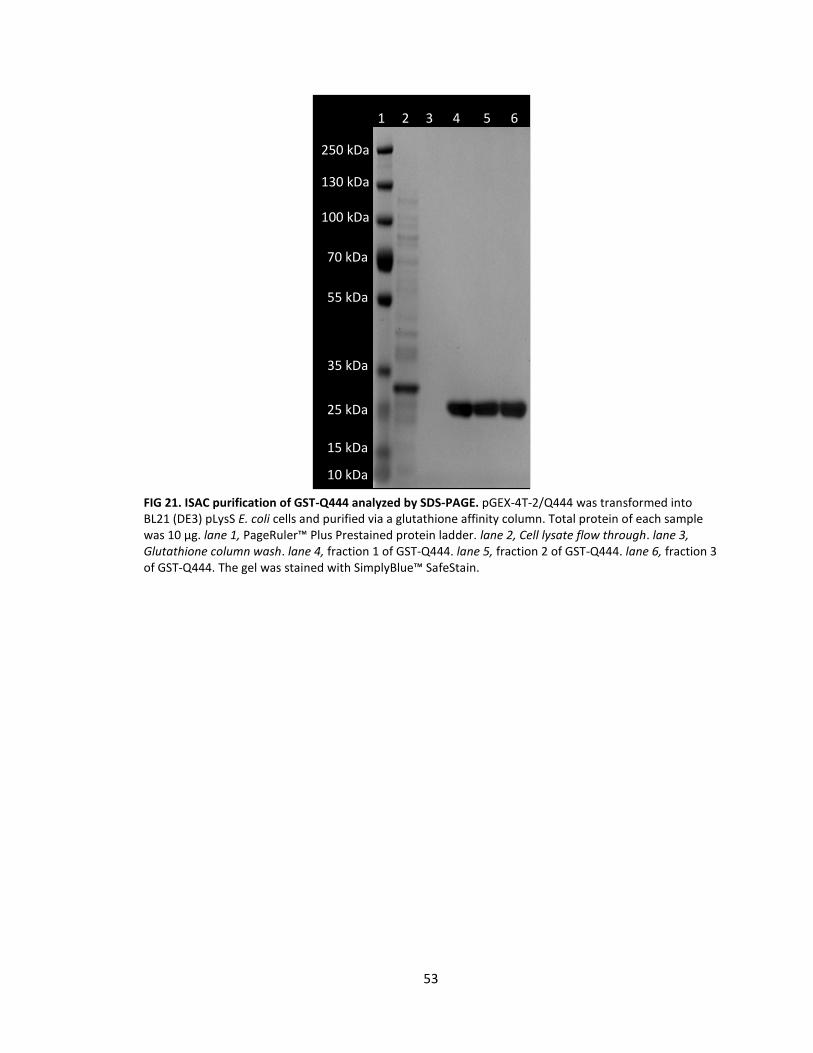
53
FIG 21. ISAC purification of GST-Q444 analyzed by SDS-PAGE. pGEX-4T-2/Q444 was transformed into BL21 (DE3) pLysS E. coli cells and purified via a glutathione affinity column. Total protein of each sample was 10 μg. lane 1, PageRuler™ Plus Prestained protein ladder. lane 2, Cell lysate flow through. lane 3, Glutathione column wash. lane 4, fraction 1 of GST-Q444. lane 5, fraction 2 of GST-Q444. lane 6, fraction 3 of GST-Q444. The gel was stained with SimplyBlue™ SafeStain.
250 kDa
130 kDa
100 kDa
70 kDa
55 kDa
35 kDa
25 kDa
15 kDa
1 2 3 4 5 6
10 kDa
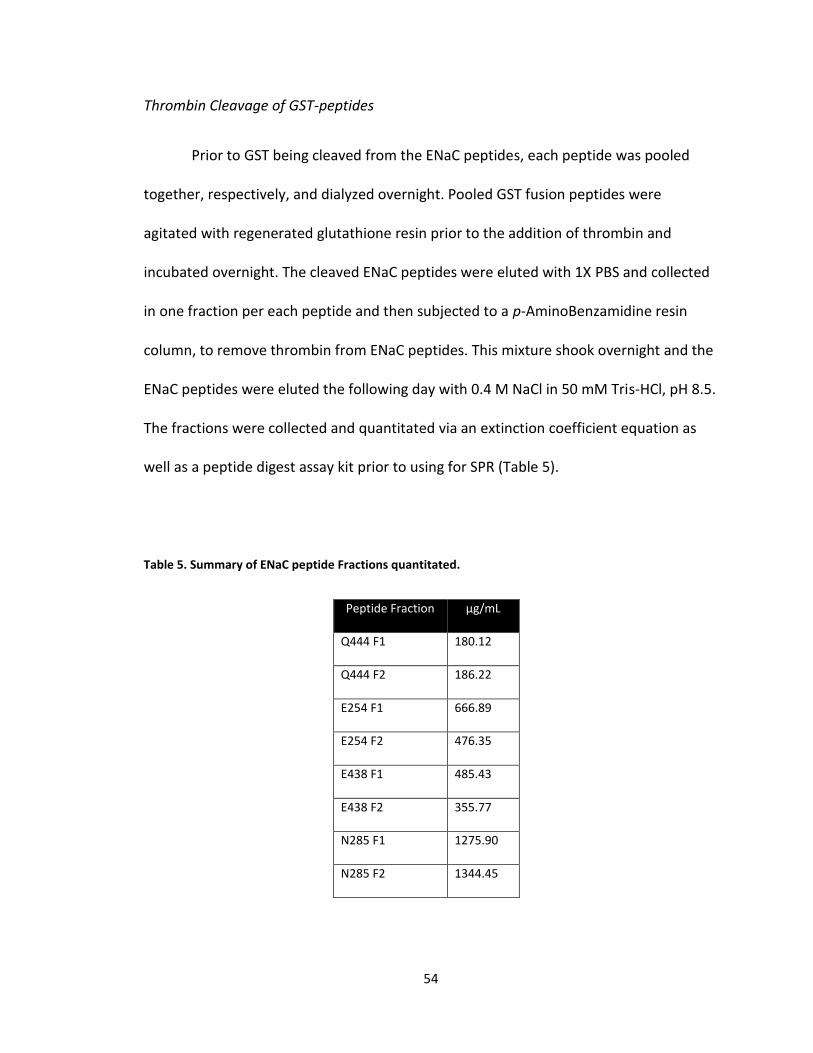
54
Thrombin Cleavage of GST-peptides
Prior to GST being cleaved from the ENaC peptides, each peptide was pooled
together, respectively, and dialyzed overnight. Pooled GST fusion peptides were
agitated with regenerated glutathione resin prior to the addition of thrombin and
incubated overnight. The cleaved ENaC peptides were eluted with 1X PBS and collected
in one fraction per each peptide and then subjected to a p-AminoBenzamidine resin
column, to remove thrombin from ENaC peptides. This mixture shook overnight and the
ENaC peptides were eluted the following day with 0.4 M NaCl in 50 mM Tris-HCl, pH 8.5.
The fractions were collected and quantitated via an extinction coefficient equation as
well as a peptide digest assay kit prior to using for SPR (Table 5).
Table 5. Summary of ENaC peptide Fractions quantitated.
Peptide Fraction μg/mL
Q444 F1 180.12
Q444 F2 186.22
E254 F1 666.89
E254 F2 476.35
E438 F1 485.43
E438 F2 355.77
N285 F1 1275.90
N285 F2 1344.45
55
C. SPR Analysis
CM5 Chip Activation
After the CM5 chip was activated, anti-GST was immobilized onto the chip
through amine coupling. Anti-GST was bound to both flow cells, 1 and 2, to analyze and
reference the kinetic interactions (FIG 22 A). Recombinant GST was ran over both flow
cells to block high affinity binding sites to prevent inaccurate readings during binding
assays. An increase in response units was observed on both flow cells indicating the
recombinant GST bound. The immobilization captured approximately 5000 pg on flow
cell 1 and 5000 pg on flow cell 2. Regeneration solution was added to flow cell 1 to
remove recombinant GST from anti-GST, for binding of GST fusion peptides, and flow
cell 2 was left untouched to server as a reference cell (FIG 22 A). Immediately after flow
cell 1 was regenerated, GST fusion peptide E438 was immobilized to anti-GST by two
injections at a concentration of 200 mg/mL with a response change of 200 RU, 200 pg of
material (FIG 22 B). This can be seen more clearly in Figure 22 (C-D) elucidating unbound
fusion peptide and immobilization of fusion peptide, respectively. Each fusion peptide
was bound under these same conditions with regeneration solution used to completely
unbind each fusion peptide to add the next one. Also, when whole αENaC subunits were
run over each GST fusion peptide, lower concentrations had to be used due to high
buffer shift effects since αENaC and αHis2-αENaC were purified and isolated in a weak
ionic/non-ionic buffer. αENaC here is used as a control to ensure that the 6X histidine
tag of αHis2-αENaC is not responsible for the interaction with the peptide.
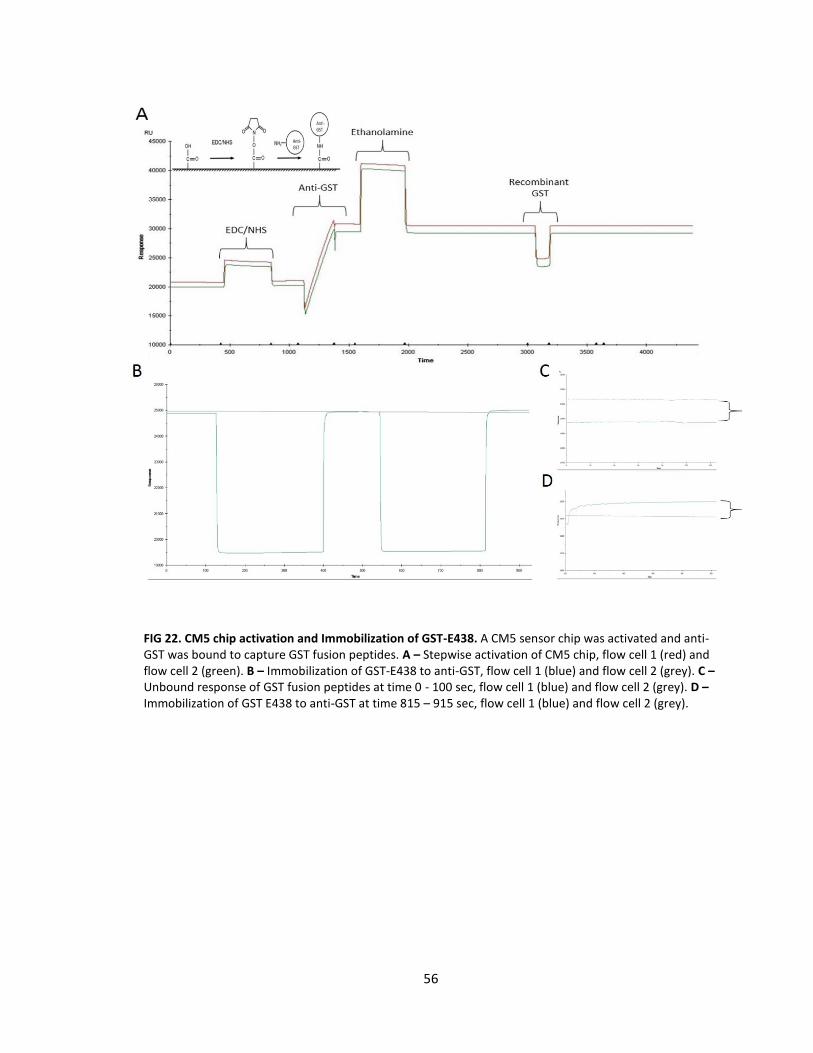
56
FIG 22. CM5 chip activation and Immobilization of GST-E438. A CM5 sensor chip was activated and anti-GST was bound to capture GST fusion peptides. A – Stepwise activation of CM5 chip, flow cell 1 (red) and flow cell 2 (green). B – Immobilization of GST-E438 to anti-GST, flow cell 1 (blue) and flow cell 2 (grey). C – Unbound response of GST fusion peptides at time 0 - 100 sec, flow cell 1 (blue) and flow cell 2 (grey). D – Immobilization of GST E438 to anti-GST at time 815 – 915 sec, flow cell 1 (blue) and flow cell 2 (grey).
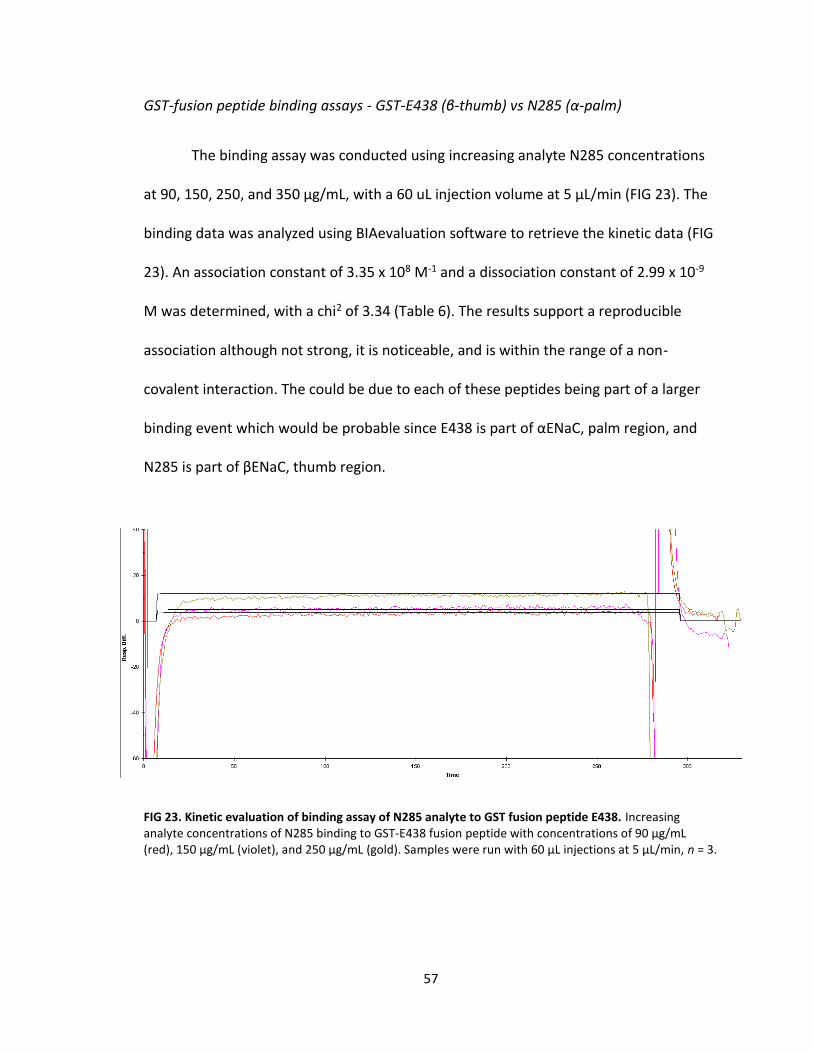
57
GST-fusion peptide binding assays - GST-E438 (β-thumb) vs N285 (α-palm)
The binding assay was conducted using increasing analyte N285 concentrations
at 90, 150, 250, and 350 μg/mL, with a 60 uL injection volume at 5 μL/min (FIG 23). The
binding data was analyzed using BIAevaluation software to retrieve the kinetic data (FIG
23). An association constant of 3.35 x 10⁸ M-1 and a dissociation constant of 2.99 x 10⁻⁹
M was determined, with a chi2 of 3.34 (Table 6). The results support a reproducible
association although not strong, it is noticeable, and is within the range of a non-
covalent interaction. The could be due to each of these peptides being part of a larger
binding event which would be probable since E438 is part of αENaC, palm region, and
N285 is part of βENaC, thumb region.
FIG 23. Kinetic evaluation of binding assay of N285 analyte to GST fusion peptide E438. Increasing analyte concentrations of N285 binding to GST-E438 fusion peptide with concentrations of 90 μg/mL (red), 150 μg/mL (violet), and 250 μg/mL (gold). Samples were run with 60 μL injections at 5 μL/min, n = 3.
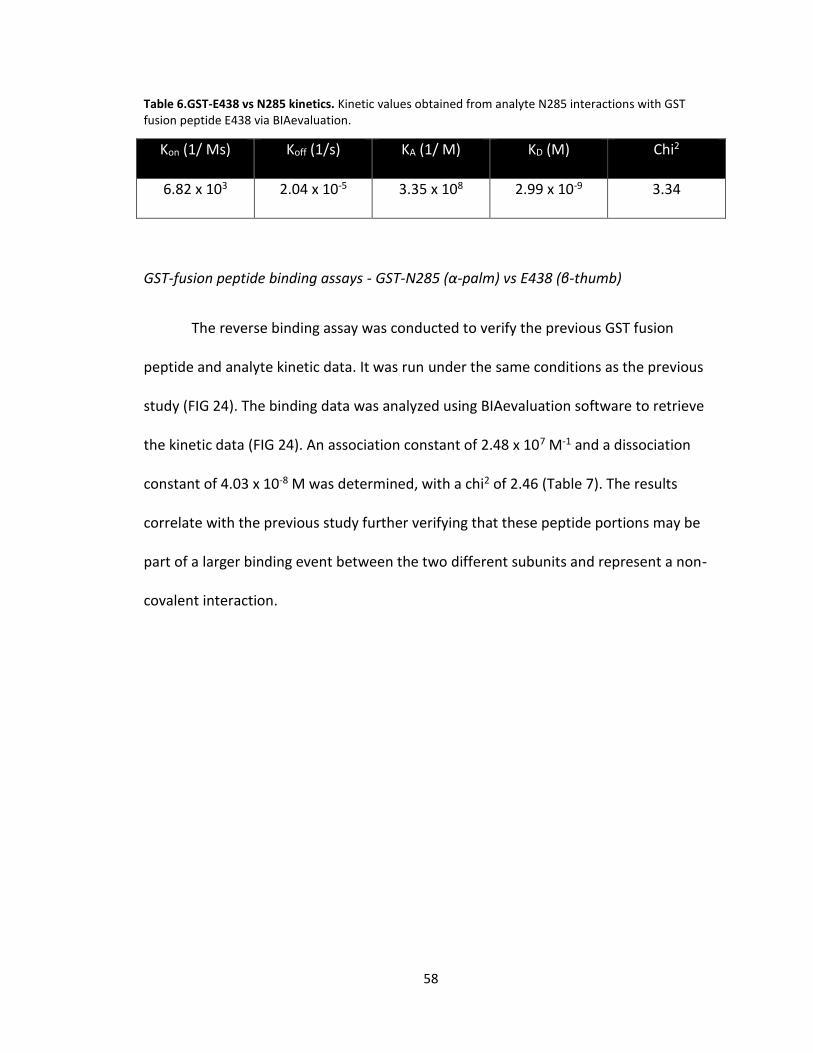
58
Table 6.GST-E438 vs N285 kinetics. Kinetic values obtained from analyte N285 interactions with GST fusion peptide E438 via BIAevaluation.
Kon (1/ Ms) Koff (1/s) KA (1/ M) KD (M) Chi2
6.82 x 10³ 2.04 x 10⁻⁵ 3.35 x 10⁸ 2.99 x 10⁻⁹ 3.34
GST-fusion peptide binding assays - GST-N285 (α-palm) vs E438 (β-thumb)
The reverse binding assay was conducted to verify the previous GST fusion
peptide and analyte kinetic data. It was run under the same conditions as the previous
study (FIG 24). The binding data was analyzed using BIAevaluation software to retrieve
the kinetic data (FIG 24). An association constant of 2.48 x 10⁷ M-1 and a dissociation
constant of 4.03 x 10⁻⁸ M was determined, with a chi2 of 2.46 (Table 7). The results
correlate with the previous study further verifying that these peptide portions may be
part of a larger binding event between the two different subunits and represent a non-
covalent interaction.
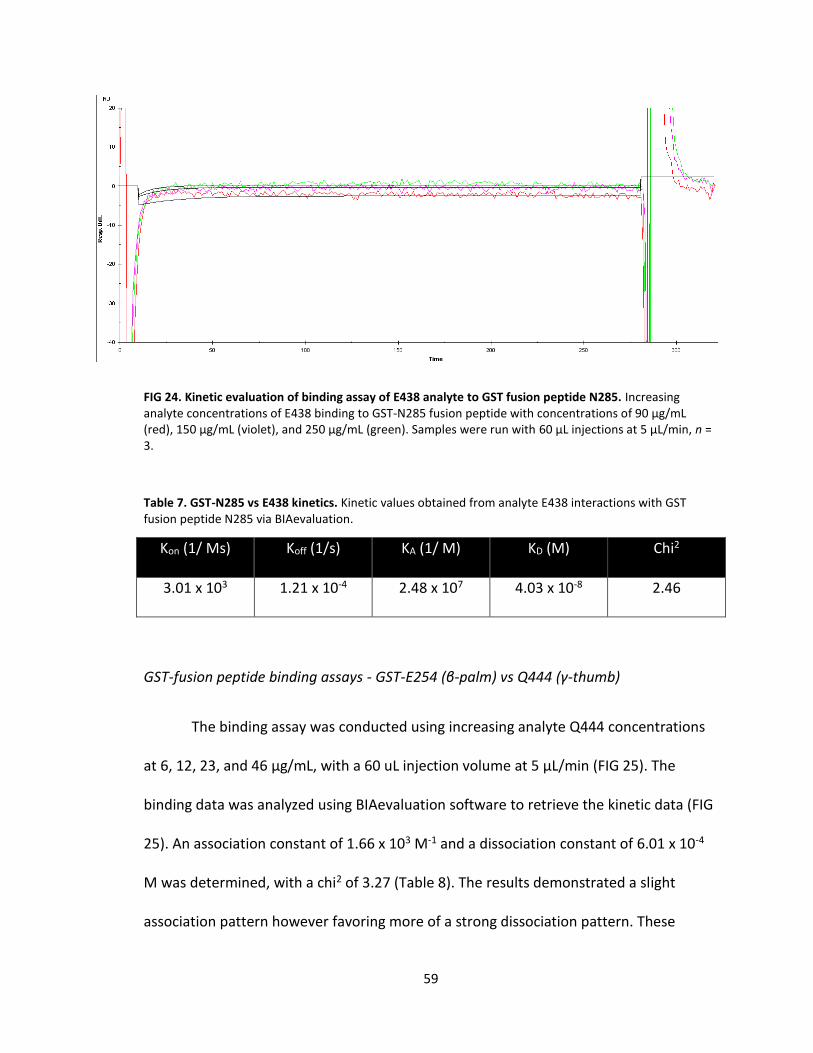
59
FIG 24. Kinetic evaluation of binding assay of E438 analyte to GST fusion peptide N285. Increasing analyte concentrations of E438 binding to GST-N285 fusion peptide with concentrations of 90 μg/mL (red), 150 μg/mL (violet), and 250 μg/mL (green). Samples were run with 60 μL injections at 5 μL/min, n = 3.
Table 7. GST-N285 vs E438 kinetics. Kinetic values obtained from analyte E438 interactions with GST fusion peptide N285 via BIAevaluation.
Kon (1/ Ms) Koff (1/s) KA (1/ M) KD (M) Chi2
3.01 x 10³ 1.21 x 10⁻⁴ 2.48 x 10⁷ 4.03 x 10⁻⁸ 2.46
GST-fusion peptide binding assays - GST-E254 (β-palm) vs Q444 (γ-thumb)
The binding assay was conducted using increasing analyte Q444 concentrations
at 6, 12, 23, and 46 μg/mL, with a 60 uL injection volume at 5 μL/min (FIG 25). The
binding data was analyzed using BIAevaluation software to retrieve the kinetic data (FIG
25). An association constant of 1.66 x 10³ M-1 and a dissociation constant of 6.01 x 10⁻⁴
M was determined, with a chi2 of 3.27 (Table 8). The results demonstrated a slight
association pattern however favoring more of a strong dissociation pattern. These
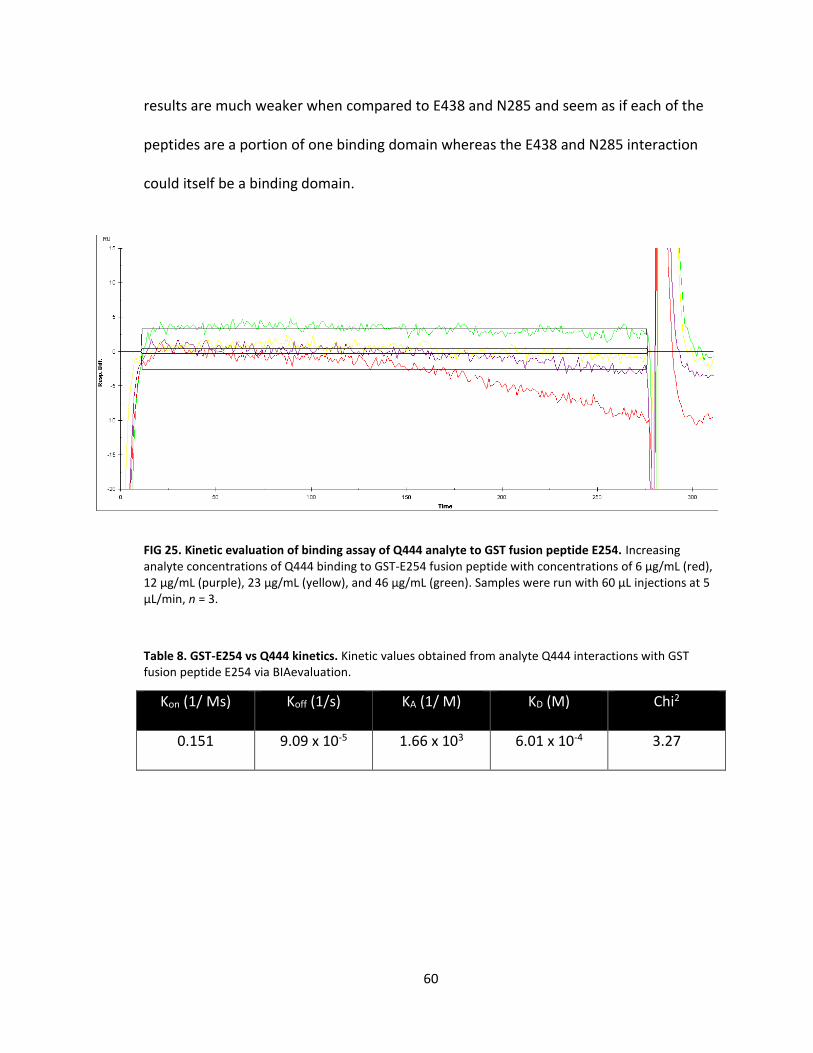
60
results are much weaker when compared to E438 and N285 and seem as if each of the
peptides are a portion of one binding domain whereas the E438 and N285 interaction
could itself be a binding domain.
FIG 25. Kinetic evaluation of binding assay of Q444 analyte to GST fusion peptide E254. Increasing analyte concentrations of Q444 binding to GST-E254 fusion peptide with concentrations of 6 μg/mL (red), 12 μg/mL (purple), 23 μg/mL (yellow), and 46 μg/mL (green). Samples were run with 60 μL injections at 5 μL/min, n = 3.
Table 8. GST-E254 vs Q444 kinetics. Kinetic values obtained from analyte Q444 interactions with GST fusion peptide E254 via BIAevaluation.
Kon (1/ Ms) Koff (1/s) KA (1/ M) KD (M) Chi2
0.151 9.09 x 10⁻⁵ 1.66 x 10³ 6.01 x 10⁻⁴ 3.27
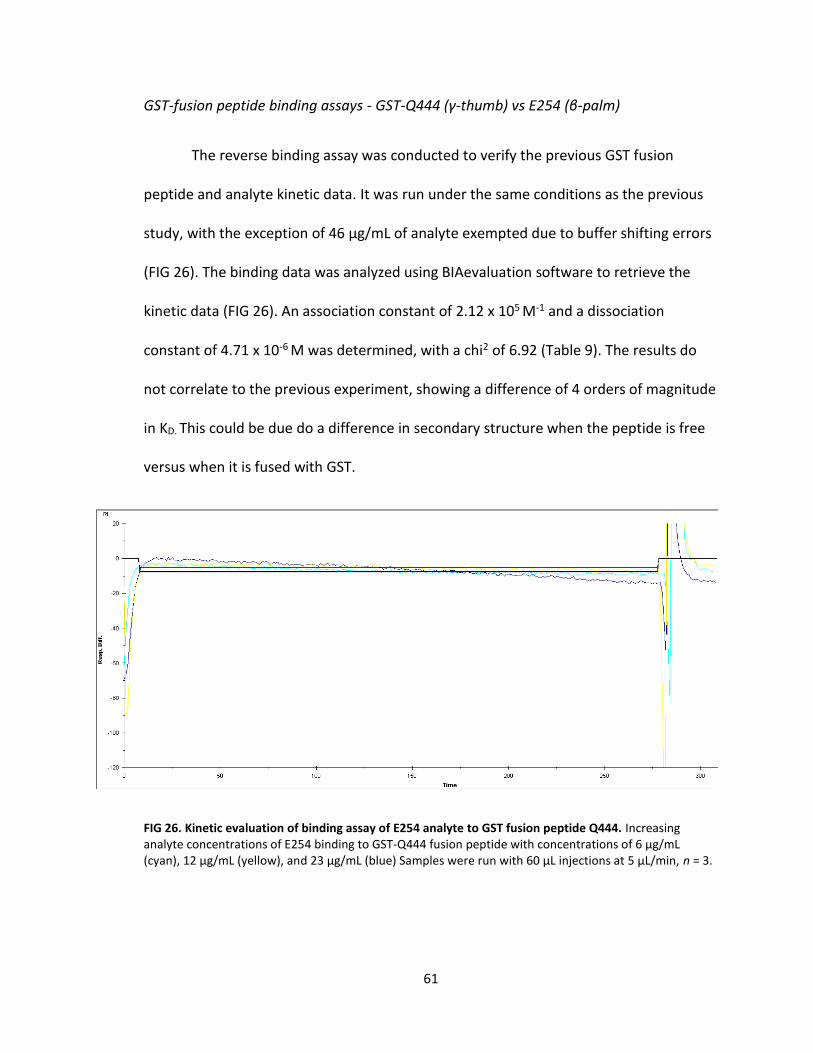
61
GST-fusion peptide binding assays - GST-Q444 (γ-thumb) vs E254 (β-palm)
The reverse binding assay was conducted to verify the previous GST fusion
peptide and analyte kinetic data. It was run under the same conditions as the previous
study, with the exception of 46 μg/mL of analyte exempted due to buffer shifting errors
(FIG 26). The binding data was analyzed using BIAevaluation software to retrieve the
kinetic data (FIG 26). An association constant of 2.12 x 10⁵ M-1 and a dissociation
constant of 4.71 x 10⁻⁶ M was determined, with a chi2 of 6.92 (Table 9). The results do
not correlate to the previous experiment, showing a difference of 4 orders of magnitude
in KD. This could be due do a difference in secondary structure when the peptide is free
versus when it is fused with GST.
FIG 26. Kinetic evaluation of binding assay of E254 analyte to GST fusion peptide Q444. Increasing analyte concentrations of E254 binding to GST-Q444 fusion peptide with concentrations of 6 μg/mL (cyan), 12 μg/mL (yellow), and 23 μg/mL (blue) Samples were run with 60 μL injections at 5 μL/min, n = 3.
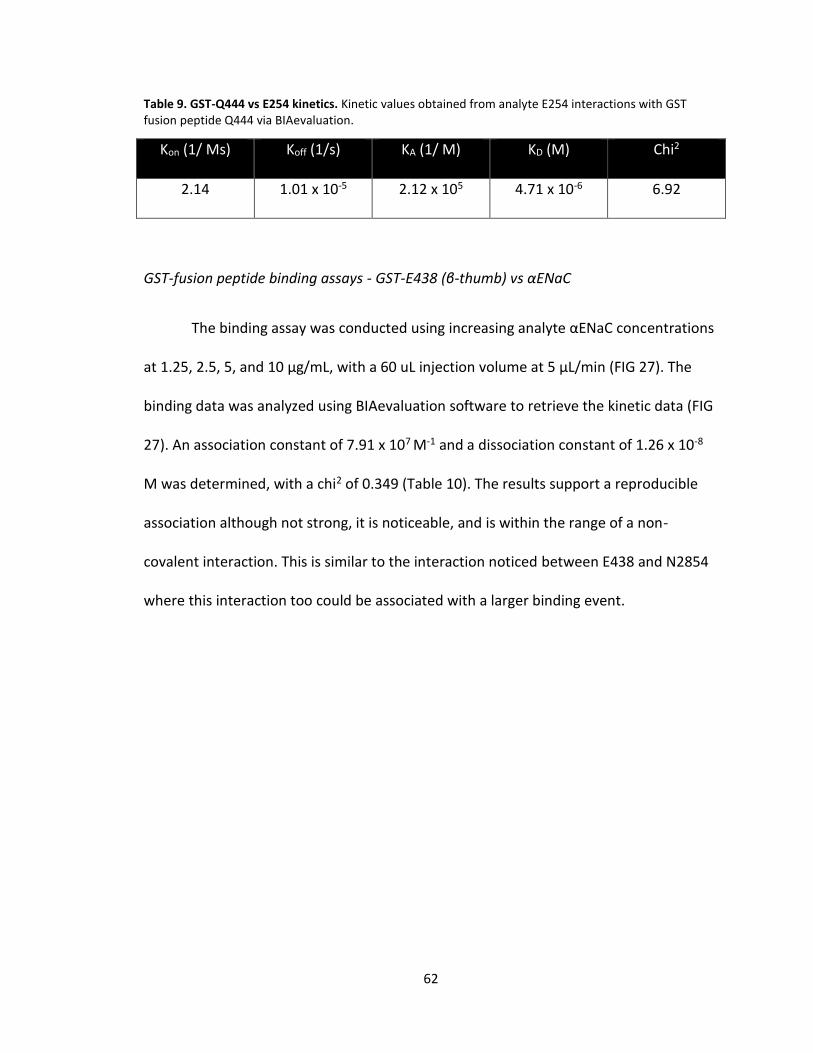
62
Table 9. GST-Q444 vs E254 kinetics. Kinetic values obtained from analyte E254 interactions with GST fusion peptide Q444 via BIAevaluation.
Kon (1/ Ms) Koff (1/s) KA (1/ M) KD (M) Chi2
2.14 1.01 x 10⁻⁵ 2.12 x 10⁵ 4.71 x 10⁻⁶ 6.92
GST-fusion peptide binding assays - GST-E438 (β-thumb) vs αENaC
The binding assay was conducted using increasing analyte αENaC concentrations
at 1.25, 2.5, 5, and 10 μg/mL, with a 60 uL injection volume at 5 μL/min (FIG 27). The
binding data was analyzed using BIAevaluation software to retrieve the kinetic data (FIG
27). An association constant of 7.91 x 10⁷ M-1 and a dissociation constant of 1.26 x 10⁻⁸
M was determined, with a chi2 of 0.349 (Table 10). The results support a reproducible
association although not strong, it is noticeable, and is within the range of a non-
covalent interaction. This is similar to the interaction noticed between E438 and N2854
where this interaction too could be associated with a larger binding event.
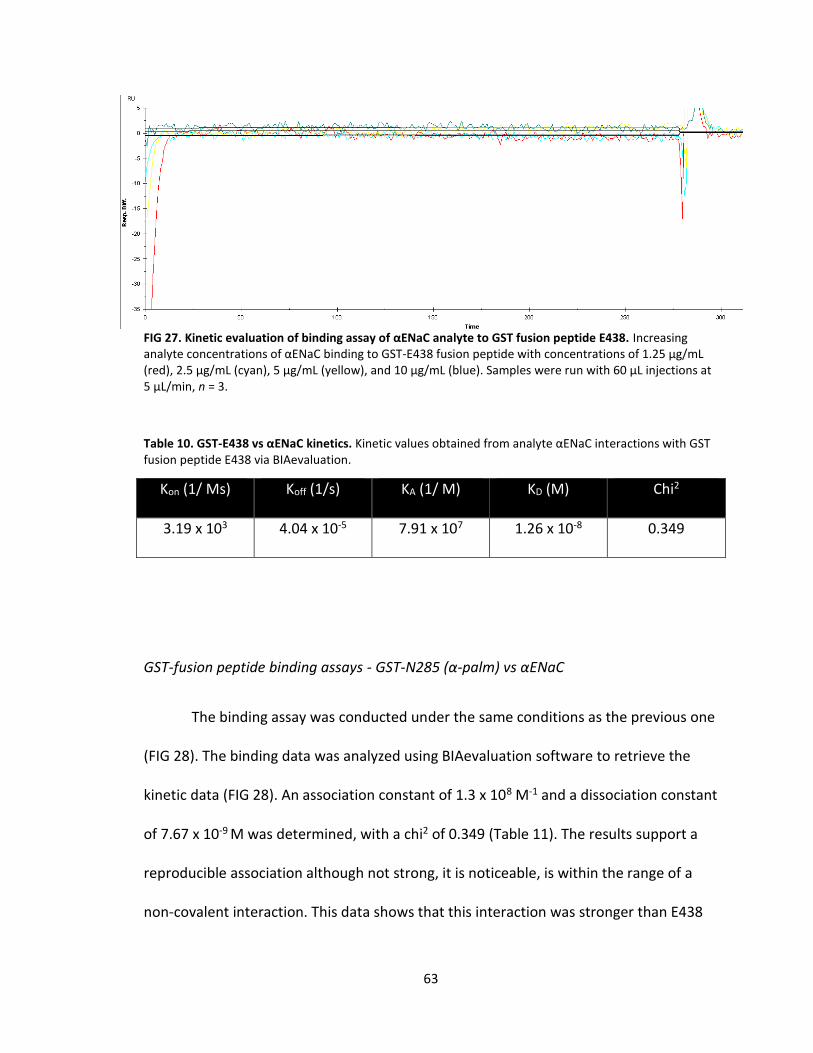
63
FIG 27. Kinetic evaluation of binding assay of αENaC analyte to GST fusion peptide E438. Increasing analyte concentrations of αENaC binding to GST-E438 fusion peptide with concentrations of 1.25 μg/mL (red), 2.5 μg/mL (cyan), 5 μg/mL (yellow), and 10 μg/mL (blue). Samples were run with 60 μL injections at 5 μL/min, n = 3.
Table 10. GST-E438 vs αENaC kinetics. Kinetic values obtained from analyte αENaC interactions with GST fusion peptide E438 via BIAevaluation.
Kon (1/ Ms) Koff (1/s) KA (1/ M) KD (M) Chi2
3.19 x 10³ 4.04 x 10⁻⁵ 7.91 x 10⁷ 1.26 x 10⁻⁸ 0.349
GST-fusion peptide binding assays - GST-N285 (α-palm) vs αENaC
The binding assay was conducted under the same conditions as the previous one
(FIG 28). The binding data was analyzed using BIAevaluation software to retrieve the
kinetic data (FIG 28). An association constant of 1.3 x 10⁸ M-1 and a dissociation constant
of 7.67 x 10⁻⁹ M was determined, with a chi2 of 0.349 (Table 11). The results support a
reproducible association although not strong, it is noticeable, is within the range of a
non-covalent interaction. This data shows that this interaction was stronger than E438
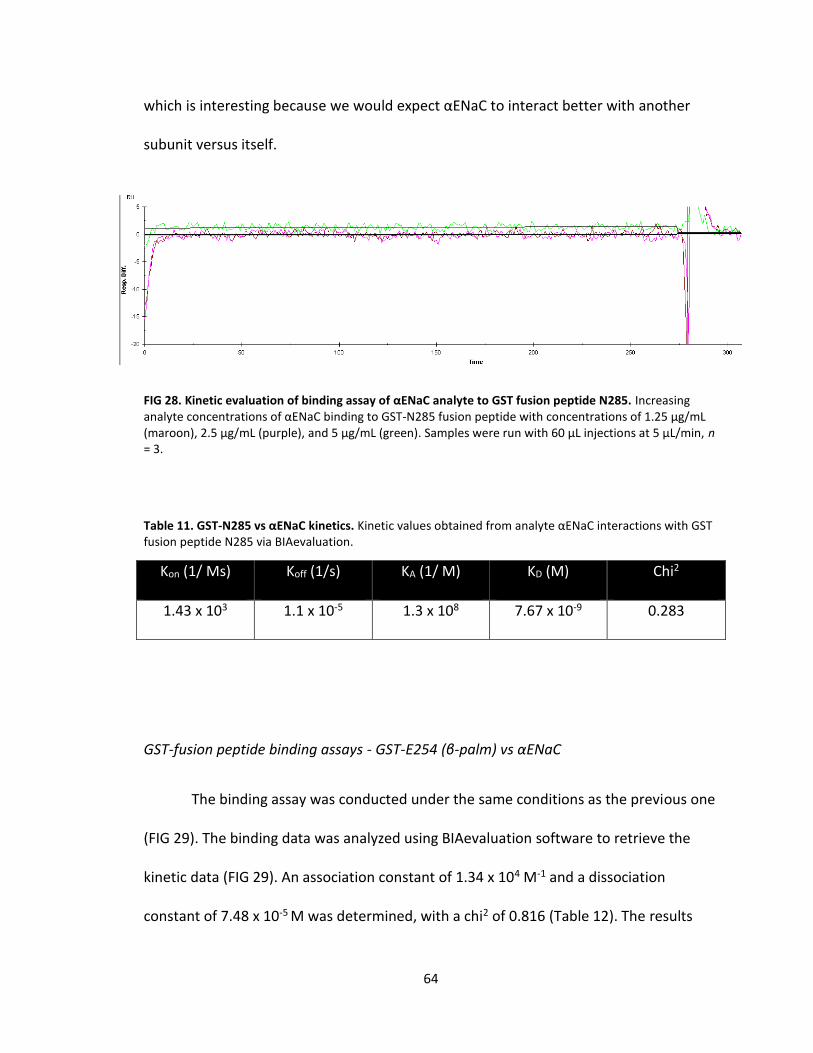
64
which is interesting because we would expect αENaC to interact better with another
subunit versus itself.
FIG 28. Kinetic evaluation of binding assay of αENaC analyte to GST fusion peptide N285. Increasing analyte concentrations of αENaC binding to GST-N285 fusion peptide with concentrations of 1.25 μg/mL (maroon), 2.5 μg/mL (purple), and 5 μg/mL (green). Samples were run with 60 μL injections at 5 μL/min, n = 3.
Table 11. GST-N285 vs αENaC kinetics. Kinetic values obtained from analyte αENaC interactions with GST fusion peptide N285 via BIAevaluation.
Kon (1/ Ms) Koff (1/s) KA (1/ M) KD (M) Chi2
1.43 x 10³ 1.1 x 10⁻⁵ 1.3 x 10⁸ 7.67 x 10⁻⁹ 0.283
GST-fusion peptide binding assays - GST-E254 (β-palm) vs αENaC
The binding assay was conducted under the same conditions as the previous one
(FIG 29). The binding data was analyzed using BIAevaluation software to retrieve the
kinetic data (FIG 29). An association constant of 1.34 x 10⁴ M-1 and a dissociation
constant of 7.48 x 10⁻⁵ M was determined, with a chi2 of 0.816 (Table 12). The results
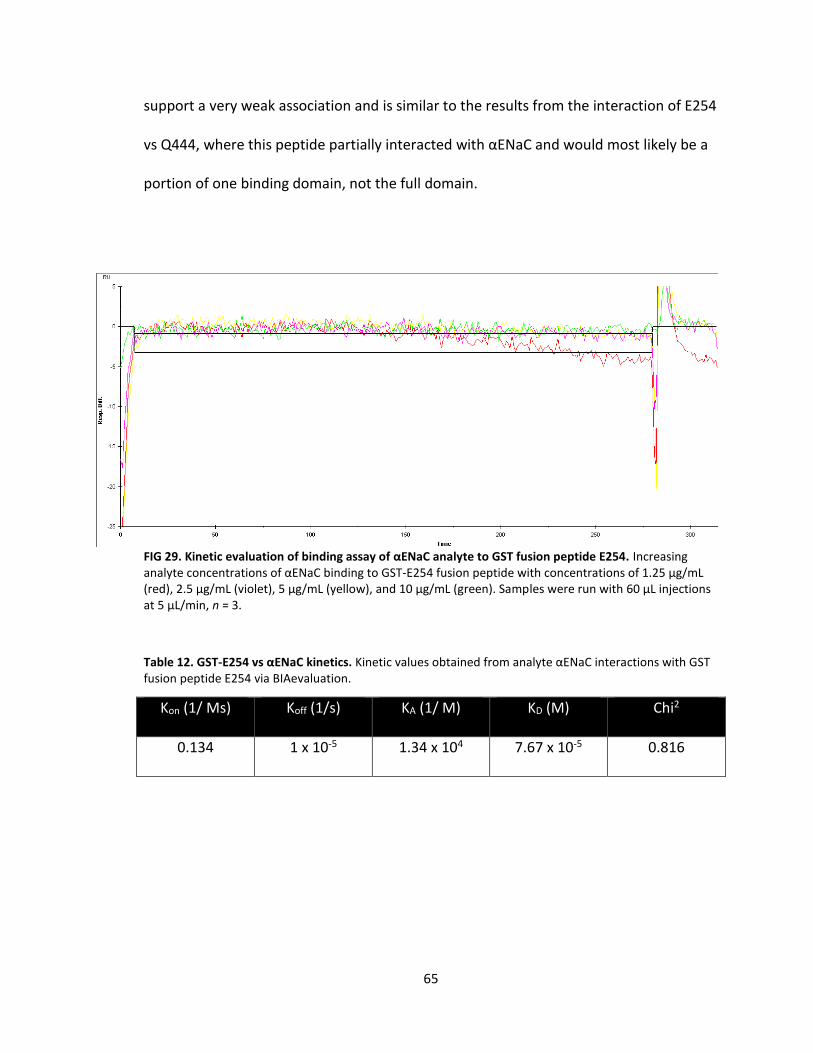
65
support a very weak association and is similar to the results from the interaction of E254
vs Q444, where this peptide partially interacted with αENaC and would most likely be a
portion of one binding domain, not the full domain.
FIG 29. Kinetic evaluation of binding assay of αENaC analyte to GST fusion peptide E254. Increasing analyte concentrations of αENaC binding to GST-E254 fusion peptide with concentrations of 1.25 μg/mL (red), 2.5 μg/mL (violet), 5 μg/mL (yellow), and 10 μg/mL (green). Samples were run with 60 μL injections at 5 μL/min, n = 3.
Table 12. GST-E254 vs αENaC kinetics. Kinetic values obtained from analyte αENaC interactions with GST fusion peptide E254 via BIAevaluation.
Kon (1/ Ms) Koff (1/s) KA (1/ M) KD (M) Chi2
0.134 1 x 10⁻⁵ 1.34 x 10⁴ 7.67 x 10⁻⁵ 0.816
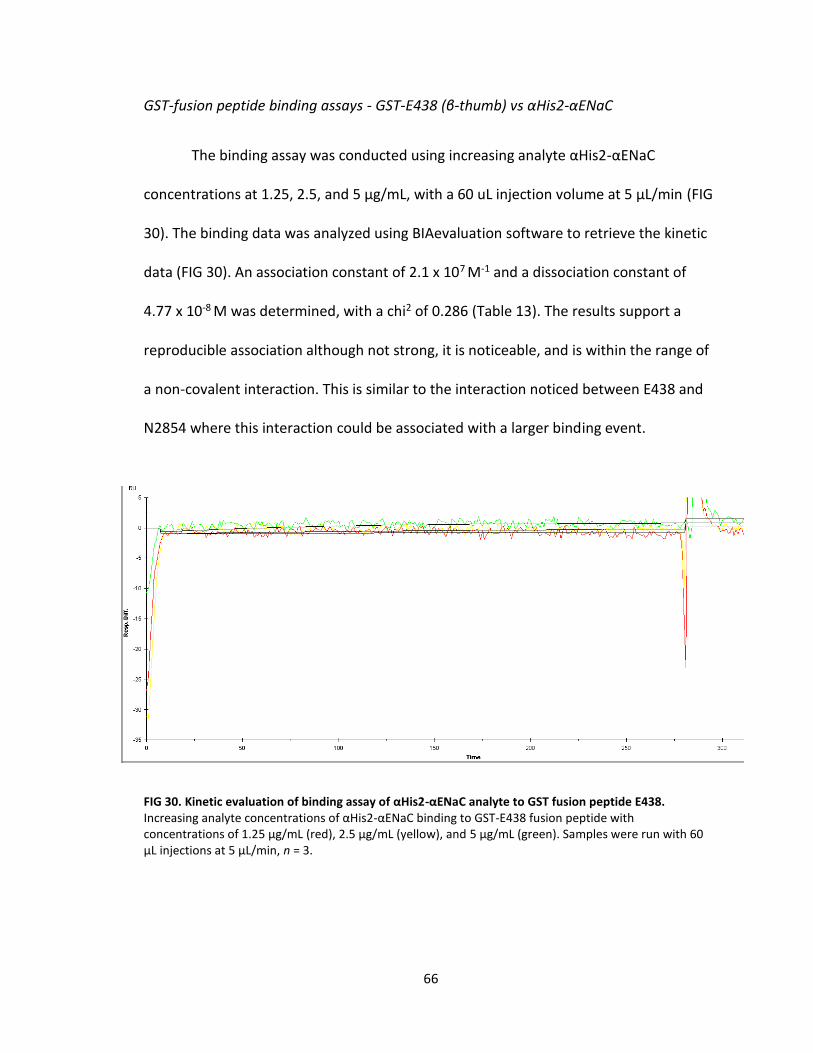
66
GST-fusion peptide binding assays - GST-E438 (β-thumb) vs αHis2-αENaC
The binding assay was conducted using increasing analyte αHis2-αENaC
concentrations at 1.25, 2.5, and 5 μg/mL, with a 60 uL injection volume at 5 μL/min (FIG
30). The binding data was analyzed using BIAevaluation software to retrieve the kinetic
data (FIG 30). An association constant of 2.1 x 10⁷ M-1 and a dissociation constant of
4.77 x 10⁻⁸ M was determined, with a chi2 of 0.286 (Table 13). The results support a
reproducible association although not strong, it is noticeable, and is within the range of
a non-covalent interaction. This is similar to the interaction noticed between E438 and
N2854 where this interaction could be associated with a larger binding event.
FIG 30. Kinetic evaluation of binding assay of αHis2-αENaC analyte to GST fusion peptide E438. Increasing analyte concentrations of αHis2-αENaC binding to GST-E438 fusion peptide with concentrations of 1.25 μg/mL (red), 2.5 μg/mL (yellow), and 5 μg/mL (green). Samples were run with 60 μL injections at 5 μL/min, n = 3.
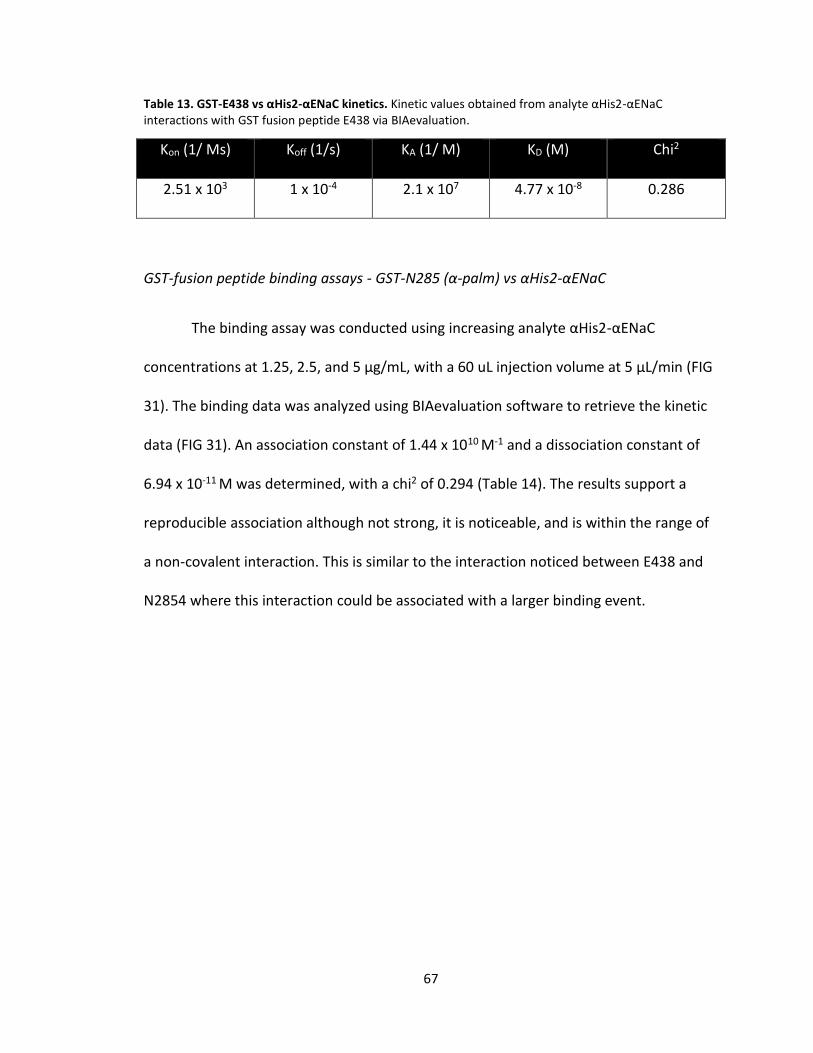
67
Table 13. GST-E438 vs αHis2-αENaC kinetics. Kinetic values obtained from analyte αHis2-αENaC interactions with GST fusion peptide E438 via BIAevaluation.
Kon (1/ Ms) Koff (1/s) KA (1/ M) KD (M) Chi2
2.51 x 10³ 1 x 10⁻⁴ 2.1 x 10⁷ 4.77 x 10⁻⁸ 0.286
GST-fusion peptide binding assays - GST-N285 (α-palm) vs αHis2-αENaC
The binding assay was conducted using increasing analyte αHis2-αENaC
concentrations at 1.25, 2.5, and 5 μg/mL, with a 60 uL injection volume at 5 μL/min (FIG
31). The binding data was analyzed using BIAevaluation software to retrieve the kinetic
data (FIG 31). An association constant of 1.44 x 10¹⁰ M-1 and a dissociation constant of
6.94 x 10⁻¹¹ M was determined, with a chi2 of 0.294 (Table 14). The results support a
reproducible association although not strong, it is noticeable, and is within the range of
a non-covalent interaction. This is similar to the interaction noticed between E438 and
N2854 where this interaction could be associated with a larger binding event.
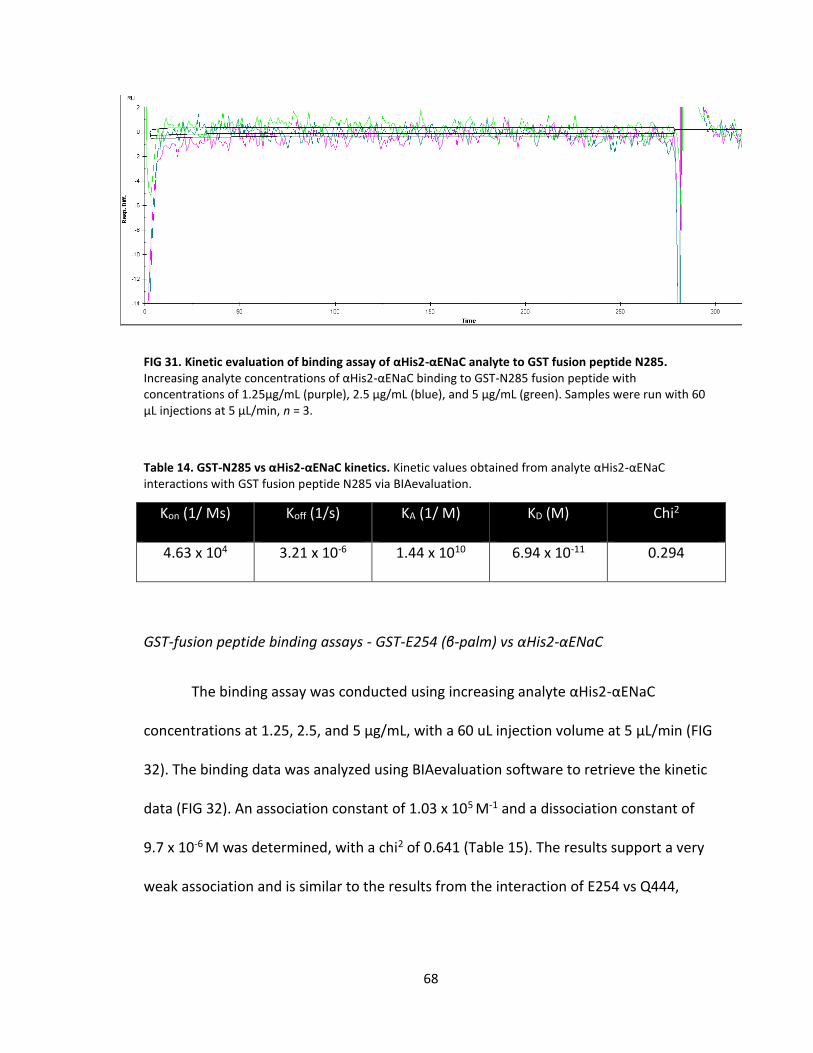
68
FIG 31. Kinetic evaluation of binding assay of αHis2-αENaC analyte to GST fusion peptide N285. Increasing analyte concentrations of αHis2-αENaC binding to GST-N285 fusion peptide with concentrations of 1.25μg/mL (purple), 2.5 μg/mL (blue), and 5 μg/mL (green). Samples were run with 60 μL injections at 5 μL/min, n = 3.
Table 14. GST-N285 vs αHis2-αENaC kinetics. Kinetic values obtained from analyte αHis2-αENaC interactions with GST fusion peptide N285 via BIAevaluation.
Kon (1/ Ms) Koff (1/s) KA (1/ M) KD (M) Chi2
4.63 x 10⁴ 3.21 x 10⁻⁶ 1.44 x 10¹⁰ 6.94 x 10⁻¹¹ 0.294
GST-fusion peptide binding assays - GST-E254 (β-palm) vs αHis2-αENaC
The binding assay was conducted using increasing analyte αHis2-αENaC
concentrations at 1.25, 2.5, and 5 μg/mL, with a 60 uL injection volume at 5 μL/min (FIG
32). The binding data was analyzed using BIAevaluation software to retrieve the kinetic
data (FIG 32). An association constant of 1.03 x 10⁵ M-1 and a dissociation constant of
9.7 x 10⁻⁶ M was determined, with a chi2 of 0.641 (Table 15). The results support a very
weak association and is similar to the results from the interaction of E254 vs Q444,
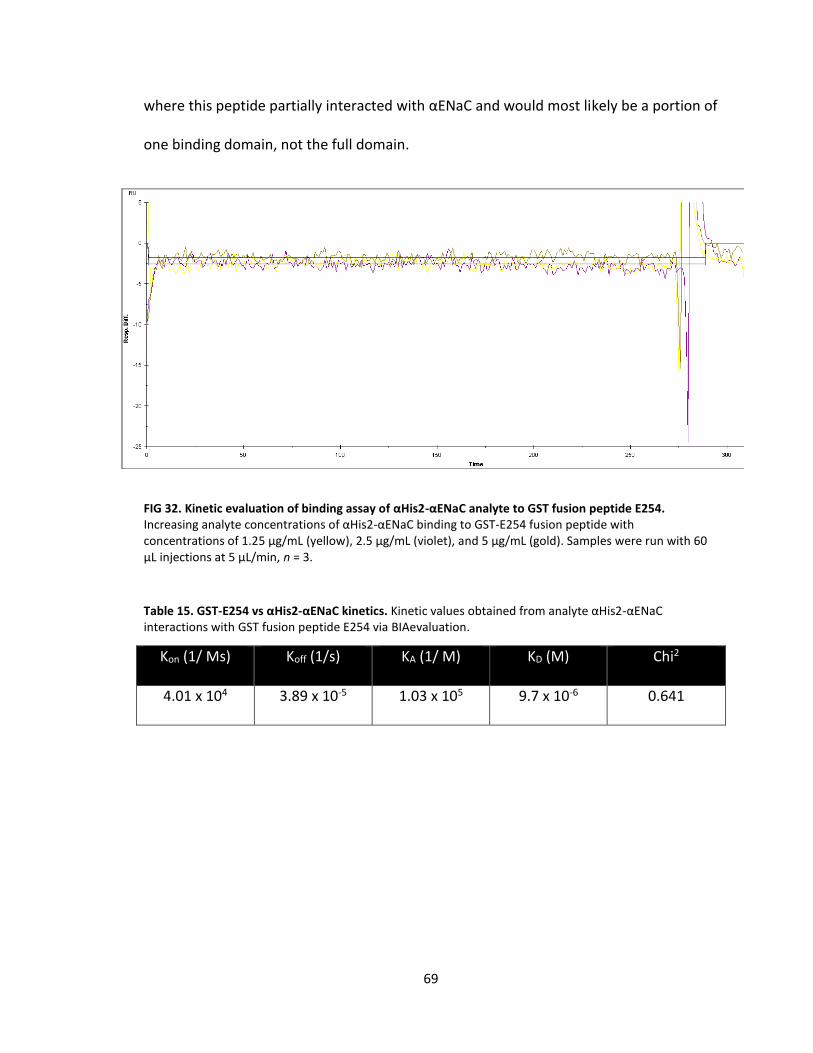
69
where this peptide partially interacted with αENaC and would most likely be a portion of
one binding domain, not the full domain.
FIG 32. Kinetic evaluation of binding assay of αHis2-αENaC analyte to GST fusion peptide E254. Increasing analyte concentrations of αHis2-αENaC binding to GST-E254 fusion peptide with concentrations of 1.25 μg/mL (yellow), 2.5 μg/mL (violet), and 5 μg/mL (gold). Samples were run with 60 μL injections at 5 μL/min, n = 3.
Table 15. GST-E254 vs αHis2-αENaC kinetics. Kinetic values obtained from analyte αHis2-αENaC interactions with GST fusion peptide E254 via BIAevaluation.
Kon (1/ Ms) Koff (1/s) KA (1/ M) KD (M) Chi2
4.01 x 10⁴ 3.89 x 10⁻⁵ 1.03 x 10⁵ 9.7 x 10⁻⁶ 0.641
70
IV. CONCLUSION
The alpha subunit of the epithelial sodium channel containing a 6X histidine tag
(αHis2-αENaC) has been partially purified in this study. It was established that an 8 hr
induction time was ideal for maximum protein production and that using acid washed
glass beads with RIPA buffer was ideal for protein extraction. The methods employed
eliminated non-ENaC proteins and gave μg concentrations. Do to the total protein of
purified αENaC isolated through immobilize nickel affinity chromatography, studies can
now benefit from this purification scheme to perform structural studies.
The peptide portions of ENaC were purified in a vigorous step wise manner
through glutathione affinity chromatography and p-Benzamidine chromatography,
allowing them to be subjected to SPR.
Interactions between immobilized E438 (β-thumb) and peptide N285 (α-palm)
showed an associative binding interaction when compared to the reference flow cell.
The kinetic evaluation of this interaction presenting kinetic constants in the range of
non-covalent interactions, this was also true for the reverse interaction (FIG 23, 24).
Interactions between immobilized E254 (β-palm) and peptide Q444 (γ-thumb) also
showed an associative binding interaction however much weaker than the previous
reaction, this was also true for the reverse interaction (FIG 25, 26).
Interactions between immobilized E254 (β-palm) with αENaC and αHis-αENaC,
separately, showed a weak association interaction action similar to that between E254
(β-palm) and Q444 (γ-thumb) seen in Figure 29 and 32. Interactions between
71
immobilized E438 (β-thumb) with αENaC and αHis-αENaC, separately, showed a strong
associative binding interaction giving kinetic constants in the non-covalent range, also
seen above with E438 (β-thumb) and peptide N285 (α-palm) seen in Figure 27 and 30.
This was also seen in the interaction between immobilized N285 with αENaC and αHis-
αENaC, separately (FIG 28, 31).
The results of this study prove a purification scheme to isolate native αENaC as
well as modified ENaCs with extracellular loop histidine tags. They show associated
kinetic interactions in the range of non-covalent interactions between the β-thumb
region of βENaC and the α-palm region of αENaC (Table 16). Due to high buffer shifts,
immobilized Q444 could not be assayed with αENaC or αHis-αENaC. Future studies
would seek to use longer peptides containing these ENaC subunit regions to elucidate if
they are part of a larger binding event for the formation of heterotrimeric ENaC in
structural studies.
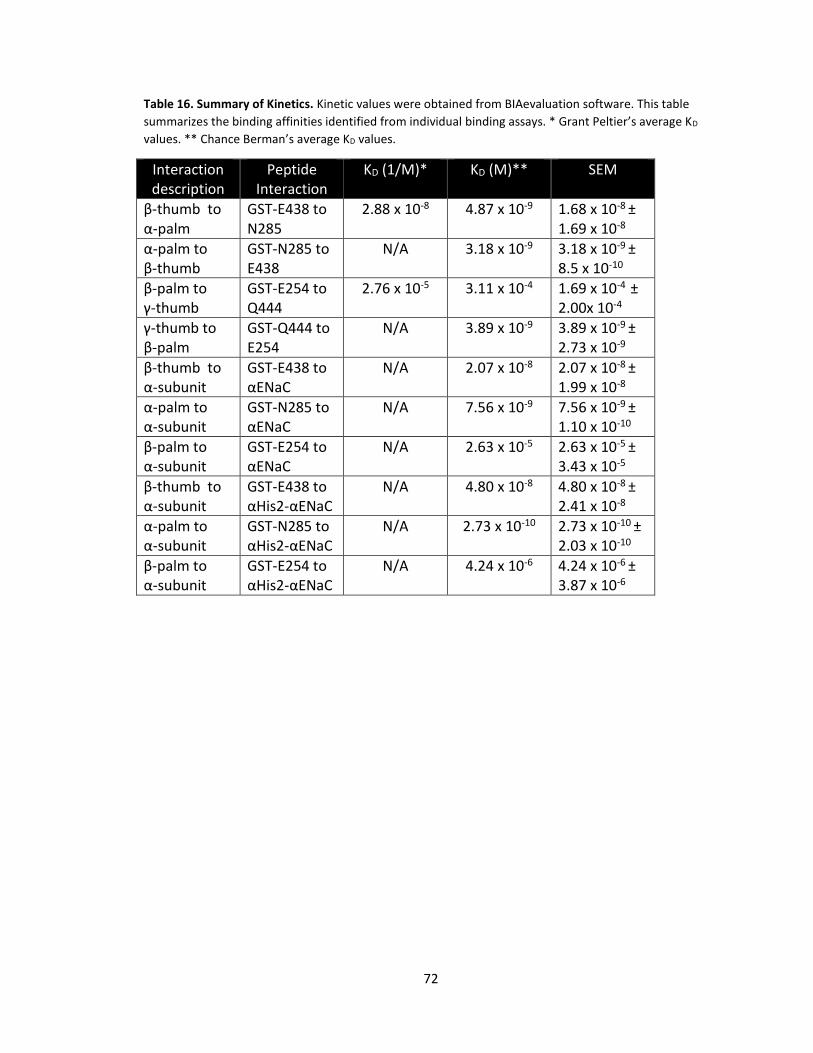
72
Table 16. Summary of Kinetics. Kinetic values were obtained from BIAevaluation software. This table
summarizes the binding affinities identified from individual binding assays. * Grant Peltier’s average KD
values. ** Chance Berman’s average KD values.
Interaction description
Peptide Interaction
KD (1/M)* KD (M)** SEM
β-thumb to α-palm
GST-E438 to N285
2.88 x 10⁻⁸ 4.87 x 10⁻⁹ 1.68 x 10⁻⁸ ± 1.69 x 10⁻⁸
α-palm to β-thumb
GST-N285 to E438
N/A 3.18 x 10⁻⁹ 3.18 x 10⁻⁹ ± 8.5 x 10⁻¹⁰
β-palm to γ-thumb
GST-E254 to Q444
2.76 x 10⁻⁵ 3.11 x 10⁻⁴ 1.69 x 10⁻⁴ ± 2.00x 10⁻⁴
γ-thumb to β-palm
GST-Q444 to E254
N/A 3.89 x 10⁻⁹ 3.89 x 10⁻⁹ ± 2.73 x 10⁻⁹
β-thumb to α-subunit
GST-E438 to αENaC
N/A 2.07 x 10⁻⁸ 2.07 x 10⁻⁸ ± 1.99 x 10⁻⁸
α-palm to α-subunit
GST-N285 to αENaC
N/A 7.56 x 10⁻⁹ 7.56 x 10⁻⁹ ± 1.10 x 10⁻¹⁰
β-palm to α-subunit
GST-E254 to αENaC
N/A 2.63 x 10⁻⁵ 2.63 x 10⁻⁵ ± 3.43 x 10⁻⁵
β-thumb to α-subunit
GST-E438 to αHis2-αENaC
N/A 4.80 x 10⁻⁸ 4.80 x 10⁻⁸ ± 2.41 x 10⁻⁸
α-palm to α-subunit
GST-N285 to αHis2-αENaC
N/A 2.73 x 10⁻¹⁰ 2.73 x 10⁻¹⁰ ± 2.03 x 10⁻¹⁰
β-palm to α-subunit
GST-E254 to αHis2-αENaC
N/A 4.24 x 10⁻⁶ 4.24 x 10⁻⁶ ± 3.87 x 10⁻⁶
73
LITERATURE CITED
1. Alvarez de la Rosa, D., Navarro-González, J.F., and Giraldez, T. Curr. Mol. Pharmacol. 2013, 6, 35-43.
2. Bhalla, V., and Hallows, K.R. JASN. 2008, 19, 1845-54. 3. http://www.beltina.org/pics/nephron.jpg 4. Post, R., Sen, A., and Rosenthal, A. J. Biol. Chem. 1965, 240, 1437-45. 5. Schild, L. Biochim. Biophys. Acta. 2010, 1802, 1159-65. 6. http://www.hkmacme.org/course/2009BM0011-01-00/sp1109_f7.png 7. Giraldez, T., Rojas, P., Jou, J., Flores, C., and Alvarez de la Rosa, D. Am. J. Physiol.
2012, 303, F328-F38. 8. Kellenberger, S. and Schild, L. Physiol Rev. 2002, 82 (3): 735-767. 9. Hangukoglu, I., and Hanukoglu, A. Gene. 2016, 579, 95-132. 10. Kashlan, O.B., et al. J. Biol. Chem. 2011, 286, 649-60. 11. Starushenko, A., Adams, E., Booth, R.E., and Stockand, J.D. 2005, 88, 3966-75. 12. Hanukoglu, I. FEBS J. 2016, doi: 10.1111/febs.13840. 13. McNicholas, C., and Canessa, C. J. Gen. Pysiol. 1997, 109¸ 681-92. 14. Stockand, J.D., Staruschenko, A., Pochynyuk, O., Booth, R.E., and Silverthorn,
D.U. Life. 2008, 60, 620-28. 15. Jasti, J., Furukawa, H., Gonzales, E.B., and Gouaux, E. Nature. 2007, 449, 316 -23. 16. http://ajprenal.physiology.org/content/ajprenal/301/4/F684/F1.large.jpg 17. Butterworth, M.B. Biochim. Biophys. Acta. 2010, 1802, 1166-77. 18. Peters, K.W., Qi, J., Johnson, J.P. et al. Pflügers Arch.-Eur. J. Physiol. 2001, 443,
S65. 19. Stockand, J.D. Kidney Int. 2010, 78, 849-56. 20. Butterworth, M.B., Edinger, R.S., and Frizzell, R.A. Am. J. Physiol. Renal Physiol.
2008, 296, F10-24. 21. Yu, L., Helms, M.N., Yue, W., and Eaton, D.C. Am. J. Physiol. Renal. Physiol. 2008,
295, F1519-F27. 22. Snyder, P.M., Cheng, C., Prince, L.S., Rodgers, J.C., and Welsh, M.J. J. Biol. Chem.
1998, 273, 681-84. 23. Zhou, R., Patel S.V., and Snyder, P.M. J. Biol. Chem. 2007, 282, 20207-12. 24. Liang, X. et al. J. Biol. Chem. 2008, 283, 27418-25. 25. Staub, O., Gautschi, I., Ciechanover, A., Schild, L, and Rotin, D. EMBO J. 1997, 21,
6325-36. 26. Snyder, P.M. Endocrine Reviews. 2002, 23, 258-75. 27. Oh, Y.S., and Warnock, D.G. Exp. Nephrol. 2000, 8, 320-5. 28. Gründer, S. et al. EMBO J. 1997, 16, 899-907. 29. Zeissg, S. et al. Am. J. Gastroenterol. 2008, 134, 1436-47. 30. Azad, A.K. et al. Hum. Mutat. 2009, 30, 1093-103. 31. Sinha, R., Salphale, I., and Agarwal, I. Indian. J. Pediatr. 2013, 80, 878-80. 32. Hummler, E. et al. Proc. Natl. Acad. Sci. 1997, 94, 11710-15.
74
33. Bonny, O. et al. J. Clin. Invest. 1999, 104, 967-74. 34. Geller, D.S. et al. J. Am. Soc. Nephrol. 2006, 17, 1429-36. 35. Zeissig, S. et al. Am. J. Gastroent. 2008, 134, 1436-47. 36. Hobbs, C.A., Da Tan, C., and Tarran R. J. Physiol. 2013, 591, 4388-87. 37. Rauh, R. et al. J. Physiol. 2010, 588, 1211-25. 38. Collawn, J.F., Lazark, A., Bebok, Z., and Matalon, S. Am. J. Phsyiol. Lung Cell Mol.
Physiol. 2012, 302, L1141-46. 39. Chung, C.T., and Miller, R.H. Nucleic Acids Research. 1988, 16(8), 3580. 40. Peltier, G.C. 2012, Determining Critical Residues for Intersubunit Binding of the
Human Epithelial Sodium Channel. M.S. Thesis.


![[Final] Purification Of B-Gal Formal Report](https://static.fdocument.org/doc/165x107/55a666af1a28abcc1b8b4897/final-purification-of-b-gal-formal-report.jpg)