Potentially toxic trace elements accumulating in marine...
7
Desalination and Water Treatment www.deswater.com 1944-3994 / 1944-3986 © 2011 Desalination Publications. All rights reserved. doi: 10.5004/dwt.2011.1753 25 (2011) 106–112 January Potentially toxic trace elements accumulating in marine sediment and bivalves in the outfall area of a desalination plant Ming-Hsun Lin a , Cheng-Haw Lee a *, Yung-Chang Lin b , Kuo-Hsin Yang c a Department of Resources Engineering, Cheng-Kung University, Taiwan, No. 1, University Rd., Tainan City 701, Taiwan Tel. +886 (6) 2757575 ext 62833; Fax +886 (6) 2380421; email: [email protected] b Department of Electrical Engineering, Cheng-Shiu University, Taiwan, No. 840, Chengcing Rd., Niaosong Township, Kaohsiung County 833, Taiwan c Depazrtment of Construction Engineering, National Taiwan University of Science and Technology, 43, Sec. 4, Keelung Rd., Taipei 106, Taiwan Received 12 January 2010; Accepted in revised form 20 May 2010 abstract This study evaluated the environmental impact of seawater desalination effluent discharged into a water body by investigating potentially toxic trace elements in the outfall area of a desalination facility on the southeastern coast of the Penghu Island (Taiwan). Trace element concentrations are analyzed using various samples (sediment, water and bivalves). Copper, zinc and arsenic were detected in sediment samples in the outfall area and decreased progressively as one moved away from this area. A contour ploing technique was applied to assess and visualize trace element pol- lution point sources (inputs) in the study area. Trace element concentrations measured directly in the desalination plant effluent confirm analytical results. Bivalve samples such as oysters and clams were collected 50 m from the desalination coastal area. Trace element concentrations in bivalves varied randomly. A clear increasing tendency over time (bioaccumulation) was not observed. This study cannot support the use of trace element bioaccumulation as a bio-monitoring index for ma- rine environments polluted by seawater desalination effluent. We recommend that investigations of bioaccumulation should be targeted close to pollution sources. Keywords: Potentially toxic trace element; Desalination plant; Sediment; Bioaccumulation 1. Introduction Due to limited water resources in some countries, the use of desalinated seawater as a drinking-water source has increased significantly. However, many desalination plants release concentrated brine containing potentially toxic trace elements (PTTEs) into marine environments. Thus, PTTEs were oſten detected in desalination-plant ef- fluent outfall areas [1]. The PTTEs discharged from desali- nation plants are mainly from the following three sources. (1) Scale inhibitors: chemical compounds added to raw water that inhibited scale formaing during desalination processes. These scale inhibitors containing PTTEs may be retained in discharged water as environmental con- taminants. (2) Brines: seawater contains seawater-borne PTTEs naturally that become increasingly concentrated in discarded brine. (3) Corrosion of permeated tubes and other utility pipes is also a source of PTTEs [2]. In brief, PTTEs can be released by various sources from a seawater desalination plant; as a result, discharges of effluent from * Corresponding author.
Transcript of Potentially toxic trace elements accumulating in marine...
Desalination and Water Treatmentwww.deswater.com1944-3994 / 1944-3986 © 2011 Desalination Publications. All rights reserved.doi: 10.5004/dwt.2011.1753
25 (2011) 106–112 January
Potentially toxic trace elements accumulating in marine sediment and bivalves in the outfall area of a desalination plant
Ming-Hsun Lina, Cheng-Haw Leea*, Yung-Chang Linb, Kuo-Hsin Yangc
aDepartment of Resources Engineering, Cheng-Kung University, Taiwan, No. 1, University Rd., Tainan City 701, TaiwanTel. +886 (6) 2757575 ext 62833; Fax +886 (6) 2380421; email: [email protected] of Electrical Engineering, Cheng-Shiu University, Taiwan, No. 840, Chengcing Rd., Niaosong Township, Kaohsiung County 833, TaiwancDepazrtment of Construction Engineering, National Taiwan University of Science and Technology, 43, Sec. 4, Keelung Rd., Taipei 106, Taiwan
Received 12 January 2010; Accepted in revised form 20 May 2010
abstractThis study evaluated the environmental impact of seawater desalination effluent discharged into a water body by investigating potentially toxic trace elements in the outfall area of a desalination facility on the southeastern coast of the Penghu Island (Taiwan). Trace element concentrations are analyzed using various samples (sediment, water and bivalves). Copper, zinc and arsenic were detected in sediment samples in the outfall area and decreased progressively as one moved away from this area. A contour plotting technique was applied to assess and visualize trace element pol-lution point sources (inputs) in the study area. Trace element concentrations measured directly in the desalination plant effluent confirm analytical results. Bivalve samples such as oysters and clams were collected 50 m from the desalination coastal area. Trace element concentrations in bivalves varied randomly. A clear increasing tendency over time (bioaccumulation) was not observed. This study cannot support the use of trace element bioaccumulation as a bio-monitoring index for ma-rine environments polluted by seawater desalination effluent. We recommend that investigations of bioaccumulation should be targeted close to pollution sources.
Keywords: Potentially toxic trace element; Desalination plant; Sediment; Bioaccumulation
1. Introduction
Due to limited water resources in some countries, the use of desalinated seawater as a drinking-water source has increased significantly. However, many desalination plants release concentrated brine containing potentially toxic trace elements (PTTEs) into marine environments. Thus, PTTEs were often detected in desalination-plant ef-fluent outfall areas [1]. The PTTEs discharged from desali-
nation plants are mainly from the following three sources. (1) Scale inhibitors: chemical compounds added to raw water that inhibited scale formatting during desalination processes. These scale inhibitors containing PTTEs may be retained in discharged water as environmental con-taminants. (2) Brines: seawater contains seawater-borne PTTEs naturally that become increasingly concentrated in discarded brine. (3) Corrosion of permeated tubes and other utility pipes is also a source of PTTEs [2]. In brief, PTTEs can be released by various sources from a seawater desalination plant; as a result, discharges of effluent from * Corresponding author.
M.-H. Lin et al. / Desalination and Water Treatment 25 (2011) 106–112 107
seawater desalination plants have a potential to enhance the concentration of PTTEs in outfall areas.
Sediment polluted with PTTEs discharged from seawater desalination plants has been investigated in-tensively in the Arabian Gulf (e.g. Sadiq et al.) [1,3,4]. Notably, Cd, Co, Cu, Hg, V, Fe, P and Zn have been found in very high concentrations in sediment samples from the immediate vicinity of the outfall area; these concentrations decreased progressively moving away from the area. However, concentrations of Ni, Pb, and Ti exhibited no general trend in sediment samples. The impact of PTTEs on organisms, specifically for some commercially important fish and shrimp species, has been evaluated for potential human health impacts by Miri and Chouikhi [5]. Miri and Chouikhi [5] claimed the PTTEs in effluent from seawater desalination plants may adversely affect marine and estuarine aquatic communities. Some chemical components released by desalination plants pose a potential hazard to estuarine organisms due to their toxicities. Among these chemical components, Cl and PTTEs deserve attention as they cause considerable amounts of mortality of susceptible organisms. Miri and Chouikhi [5] also reported that the ultimate effects on estuarine communities are changes to ecological structures due to polluted discharge. These changes include alterations to species composition, spe-cies diversity, and population density; such changes are commonly observed in discharge areas. Based on the study by Miri and Chouikhi [5], PTTE bioaccumulation in marine biota may serve as a bio-monitoring index for marine environments polluted with seawater desalination effluent. Notably, PTTE bioaccumulation may be affected by sediment composition [6–9].
The area offshore of the Penghu Island, Taiwan, is one of aforementioned cases suffering from PTTE pollution. Penghu, a county in Taiwan, is an offshore island located in the Taiwan Strait. Penghu’s marine environment breeds many fish and shellfish species that are important natural and tourism resources for Penghu Island. However, due to the geography of Penghu, precipitation on the Penghu Island is very rare and potable water is obtained by sea-water desalination. Sediment and organisms (the Pacific Oyster, Crassostrea gigas) have been sampled from an area offshore the Penghu Island during 1991–1998 [10–14]. The PTTE concentrations of Cu, Zn, Cd and As were determined. Although the possible association between seafood consumption and human exposure to many of these contaminants has not yet been investigated exten-sively, these high PTTE concentrations may not affect organisms directly, but rather high PTTE concentrations may transfer toxicity to humans through the food chain and thereby accumulate in human bodies. Moreover, increased stress to the Penghu Island ecosystem, such as that from pollution, can result in a decline of seafood resources and adversely affect human health.
As all the issues stated above, this research was
designed to study the PTTEs from a desalination plant focusing on the effluent outfall area near the coast of the Penghu Island, Taiwan. The remainder of this paper is organized by first introducing the geography, materials and methodology for this study. Afterward, the analyti-cal results of metal concentrations will be discussed. The highlights of this paper are threefold: PTTE concentra-tions in sediment samples, directly measured from desali-nation plant effluent and in sampled bivalves. The study of PTTE concentrations in desalination plant effluent is compared with PTTE concentrations in sediment samples to prove that the point source of PTTEs is desalination effluent. The study of PTTE concentrations in organisms is used to assess the impact of desalination plant effluent on bivalves and PTTE bioaccumulation.
2. Materials and methods
2.1. Sediment sampling and analysis
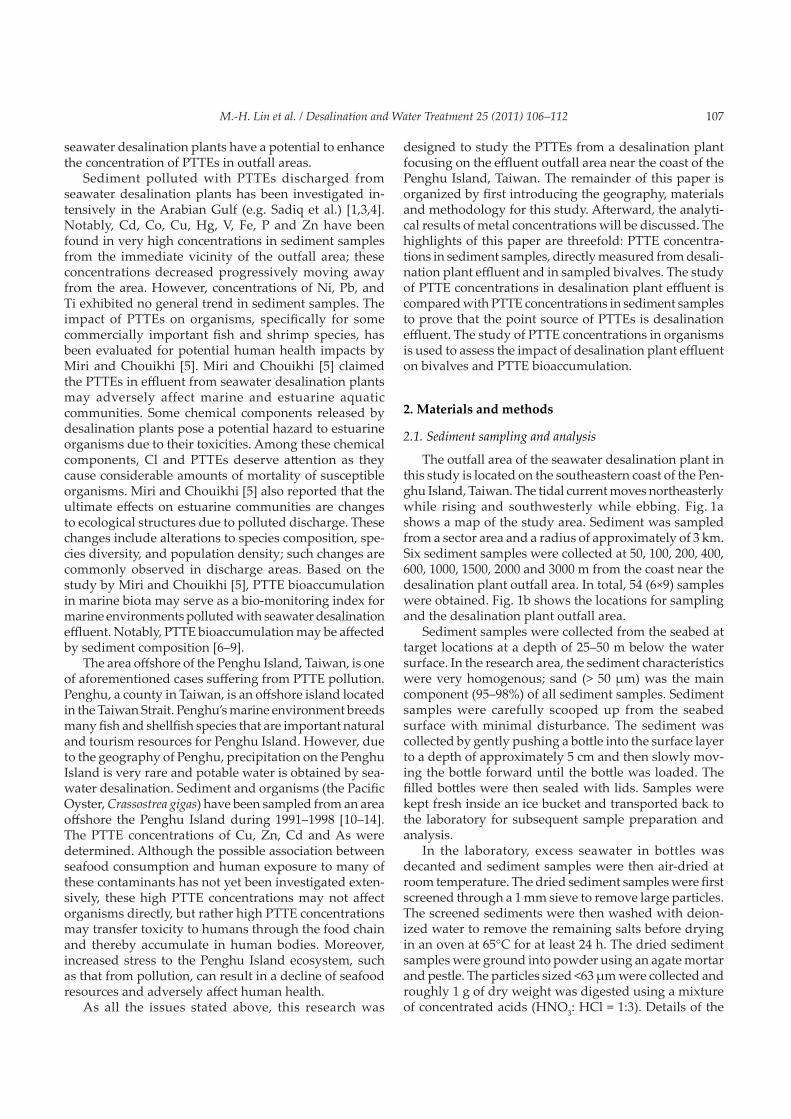
The outfall area of the seawater desalination plant in this study is located on the southeastern coast of the Pen-ghu Island, Taiwan. The tidal current moves northeasterly while rising and southwesterly while ebbing. Fig. 1a shows a map of the study area. Sediment was sampled from a sector area and a radius of approximately of 3 km. Six sediment samples were collected at 50, 100, 200, 400, 600, 1000, 1500, 2000 and 3000 m from the coast near the desalination plant outfall area. In total, 54 (6×9) samples were obtained. Fig. 1b shows the locations for sampling and the desalination plant outfall area.
Sediment samples were collected from the seabed at target locations at a depth of 25–50 m below the water surface. In the research area, the sediment characteristics were very homogenous; sand (> 50 μm) was the main component (95–98%) of all sediment samples. Sediment samples were carefully scooped up from the seabed surface with minimal disturbance. The sediment was collected by gently pushing a bottle into the surface layer to a depth of approximately 5 cm and then slowly mov-ing the bottle forward until the bottle was loaded. The filled bottles were then sealed with lids. Samples were kept fresh inside an ice bucket and transported back to the laboratory for subsequent sample preparation and analysis.
In the laboratory, excess seawater in bottles was decanted and sediment samples were then air-dried at room temperature. The dried sediment samples were first screened through a 1 mm sieve to remove large particles. The screened sediments were then washed with deion-ized water to remove the remaining salts before drying in an oven at 65°C for at least 24 h. The dried sediment samples were ground into powder using an agate mortar and pestle. The particles sized <63 μm were collected and roughly 1 g of dry weight was digested using a mixture of concentrated acids (HNO3: HCl = 1:3). Details of the
108 M.-H. Lin et al. / Desalination and Water Treatment 25 (2011) 106–112
Fig. 1. Sampling locations. (a) Location (●) of the Penghu Islands, Taiwan. (b) Sediment sampling locations ( ).
119º 120 º 121 º
26º
22º
23º
24º
25º
Penghu Islands
119º 120 º 121 º
26º
22º
23º
24º
25º
Penghu Islands
(a) (b)119°40' 119°43'
23°31'
23°34'
Outfall
digesting procedures can be found in Rauret et al. [15]. The digested samples were then ready for analysis of PTTEs (e.g., Cu, Zn, Cd, Pb, Cr, and As). Sample prepara-tion was according to the procedure published by Hung and Hsu [16] and Chen et al. [17].
The PTTEs in sediment samples were digested and determined using Inductively Coupled Plasma-Mass Spectrometry (ICP-MS) (Agilent-7500a) according to the USEPA Method 6020. Blanks were included in each batch test for quality assurance and quality control (QA/QC). The standard calibration procedure was followed to ensure analytical method accuracy. A certified reference standard sediment, PACS-1, from the National Research Council of Canada was utilized to test instrument and analytical method accuracies. The difference between certified and measurement results was <10% for samples in this study. The minimum detection limits (MDL) were 0.404, 0.159, 0.128, 0.118, 0.179, 0.117, and 0.350 mg kg–1 for Zn, Pb, Cr, Cu, As, Cd, and Hg, respectively. Further statistical analysis of data including mean, standard de-viation, maximum and minimum of PTTE concentrations in various samples were conducted using commercial statistical software SPSS 12.0.1C (SPSS, Inc., 2000).
2.2. Effluent sampling and analysis
The volumetric flow rate of the desalination plant effluent was 30,000 m3 d–1. The water samples were col-lected directly from desalination wastewater in the efflu-ent pipe and outfall area roughly 600 m from the coast during May 2006 to November 2007 (Fig. 1b). The water samples were returned to the laboratory and digested using a microwave digester with a solution comprised of a mixture of nitric and sulfuric acids (1/1, v/v). The Cu, Zn, Cd, Pb, and Cr concentrations were measured using ICP-Atomic Emission Spectrometry (ICP-AES) (Perkin Elmer-2000DV) according to USEPA Method 6020. The
As and Hg concentrations were determined by graphite atomic absorption spectrometry (Perkin Elmer AA700). Standard addition procedures were employed to derive the analytical concentration. A certified reference stan-dard material, NIST 1640, representing a mine-impacted creek, was applied to test analytical method and instru-ment accuracy. The difference between certified and measured results was insignificant. The MDL were 0.19, 0.06, 0.03, 0.03, 0.14, 0.9, and 0.2 μg L–1 for Zn, Pb, Cr, Cu, As, Cd, and Hg, respectively.
2.3. Bivalve sampling and analysis
The organisms sampled were mainly oysters and clams of marine bivalves. These bivalves were captured at 50 m from the coast. Samples were returned to the laboratory, individually scrubbed, and shucked. Bivalve flesh was placed in weighed acid-washed Teflon beakers for reweighing to obtain individual wet-weight values. Roughly fifteen to twenty individual bivalves of similar size (3.21±0.40 cm in shell length) were sampled and digested using a microwave digester with a mixed solu-tion of nitric and sulfuric acids (1/1, v/v). The Cu, Zn, Cd, Pb, Cr, Hg and As concentrations were measured by ICP-MS (Agilent-7500a). Certified reference standard material SRM 1566a Oyster Tissue was employed to test the analytical method and instrument accuracy at regular intervals. The MDL were 0.0082, 0.0018, 0.0022, 0.001, 0.0052, 0.0035, and 0.0018 mg kg–1 for Zn, Pb, Cr, Cu, As, Cd, and Hg, respectively. Measurement results were in most cases in good agreement with certified values.
3. Results and discussion
3.1. Concentrations of PTTEs in sediment samples
Sediment samples were collected in duplicate from
M.-H. Lin et al. / Desalination and Water Treatment 25 (2011) 106–112 109
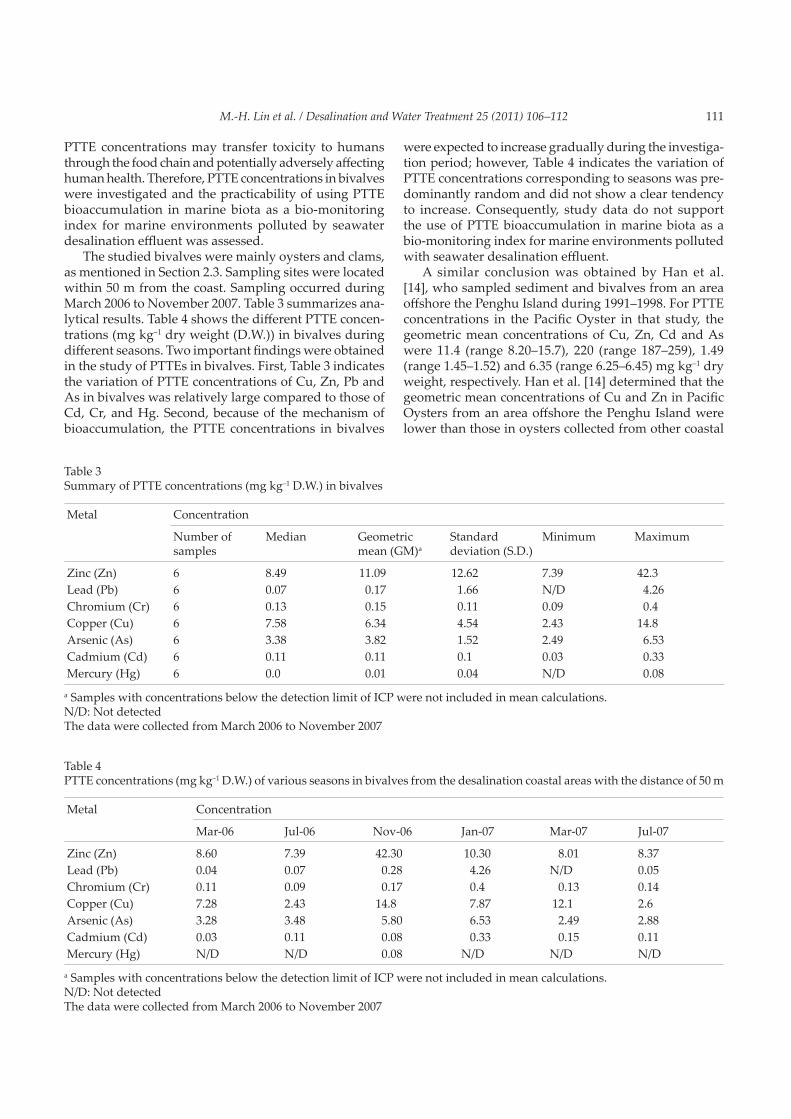
54 locations scattered throughout the sector area and a radius of approximately of 3 km around the effluent discharge point. Fig. 1b shows the sampling locations. Table 1 summarizes analytical results for PTTE concen-trations in sediment samples. Sadiq [1] studied the PTTE concentrations in sediment samples released from a de-salination plant on the coast of the Arabian Gulf (Saudi Arabia). He identified the difference between maximum and minimum concentrations are considerable when the maximum concentrations of elements in sediment sam-ples were more than 10 times higher than the minimum concentrations. In this study, the maximum Cu, Zn and As concentrations were more than 10 times higher than their respective minimum concentrations. These large differences between maximum and minimum concentra-tions in Sadiq’s study [1] and in this study imply variation in PTTE concentrations at different sampling locations. This inference is strongly supported by Cu, Zn and As concentrations (Table 1). In addition, Table 1 shows no variation (i.e. S.D.= 0.0) of Cd and Hg concentrations
Table 1Summary of PTTE concentrations (mg kg–1 dry sediment) in sediment samples
Metal Concentration
Number of sediment samples
Median Meana Standard deviation (S.D.)
Minimum Maximum
Zinc (Zn) 54 (54)b 7.38 8.67 7.44 0.4 37.9Lead (Pb) 54 (54) 7.62 7.51 1.86 2.14 12.2Chromium (Cr) 54 (54) 9.62 8.72 2.79 0.12 12.9Copper (Cu) 54 (54) 2.08 2.04 1.32 0.36 10.5Arsenic (As) 54 (54) 2.05 2.18 0.92 0.75 8.35Cadmium (Cd) 54 (6) 0.13 0.13 0.0 N/D 0.13Mercury (Hg) 54 (4) 0.35 0.35 0.0 N/D 0.35
a Samples with concentrations below the detection limit of ICP were not included in mean calculations.b Number within parentheses indicates the number of samples above MDL.N/D: Not detected
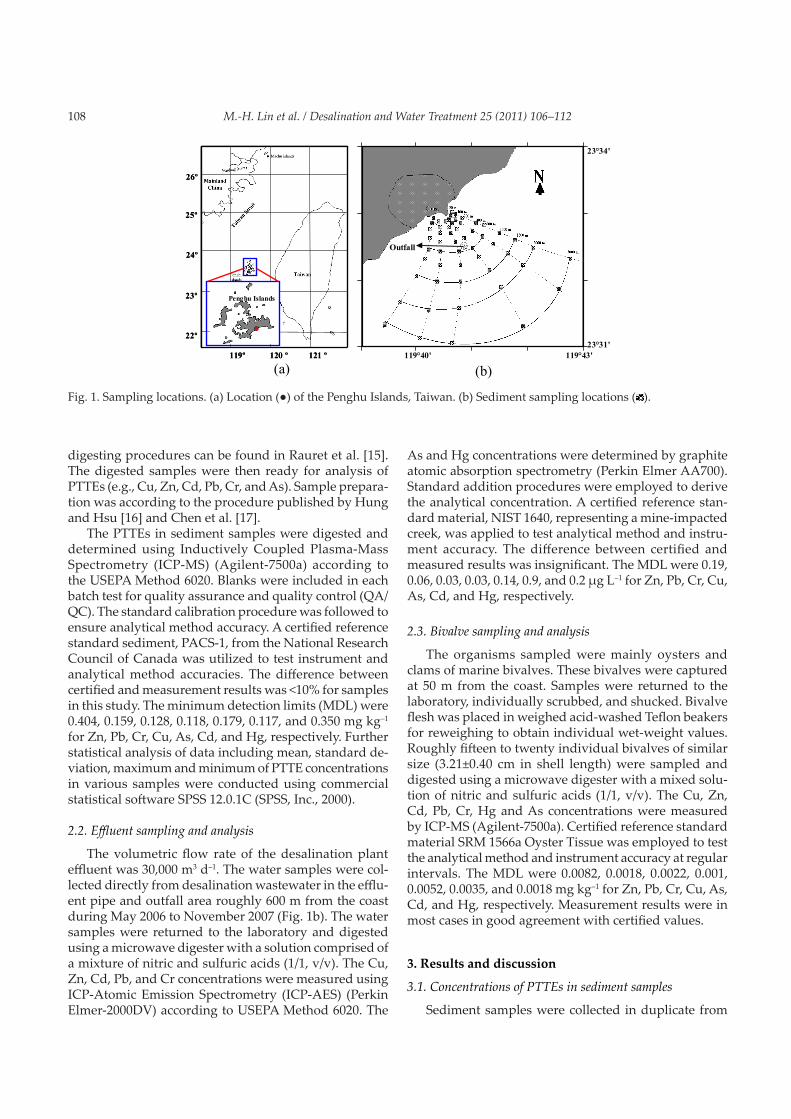
Fig. 2. Average concentrations of various PTTEs in sediment samples. The inset figure provides an enlarged vision of Cd and Hg.
0
2
4
6
8
10
12
14
16
100
600
2000 10
060
020
00 100
600
2000 10
060
020
00 100
600
2000 10
060
020
00 100
600
2000
Distance from coastaline(m)
Con
cent
ratio
n(m
g/kg
sedi
men
t) Zn
PbCr
Cu
Cd Hg
0
0.1
0.2
0.3
0.4
100
600
2000 100
600
2000
Cd
Hg
As
0
2
4
6
8
10
12
14
16
100
600
2000 10
060
020
00 100
600
2000 10
060
020
00 100
600
2000 10
060
020
00 100
600
2000
Distance from coastaline(m)
Con
cent
ratio
n(m
g/kg
sedi
men
t) Zn
PbCr
Cu
Cd Hg
0
0.1
0.2
0.3
0.4
100
600
2000 100
600
2000
Cd
Hg
As
with sampling locations. This may be because only a few samples contained detectable amounts of Cd and Hg and were thus useful for statistical analysis.
Fig. 2 shows analytical results of each PTTE concentra-tion in sediment samples obtained at various distances from the coast of the Penghu Island. The PTTE concentra-tions vary among different sampling locations. The Cu and As concentrations were highest 600 m from the coast, which is nearest to the desalination plant effluent pipe, and Zn concentration was highest 2000 m from the coast (Fig. 1b). Beyond 600 m, the effect of the outfall plume was diluted, as demonstrated by uncontaminated sedi-ment samples. Miri and Chouikhi [5] reported that Cu and Zn may originate from dissolution of piping within a condenser cooling system. Therefore, we suggest the distributions of Cu and Zn can be used as a yardstick for evaluating the pollution potential of desalination plant effluent.
As point source, such as the desalination effluent discharge outfall, existed in the study area, significant
110 M.-H. Lin et al. / Desalination and Water Treatment 25 (2011) 106–112
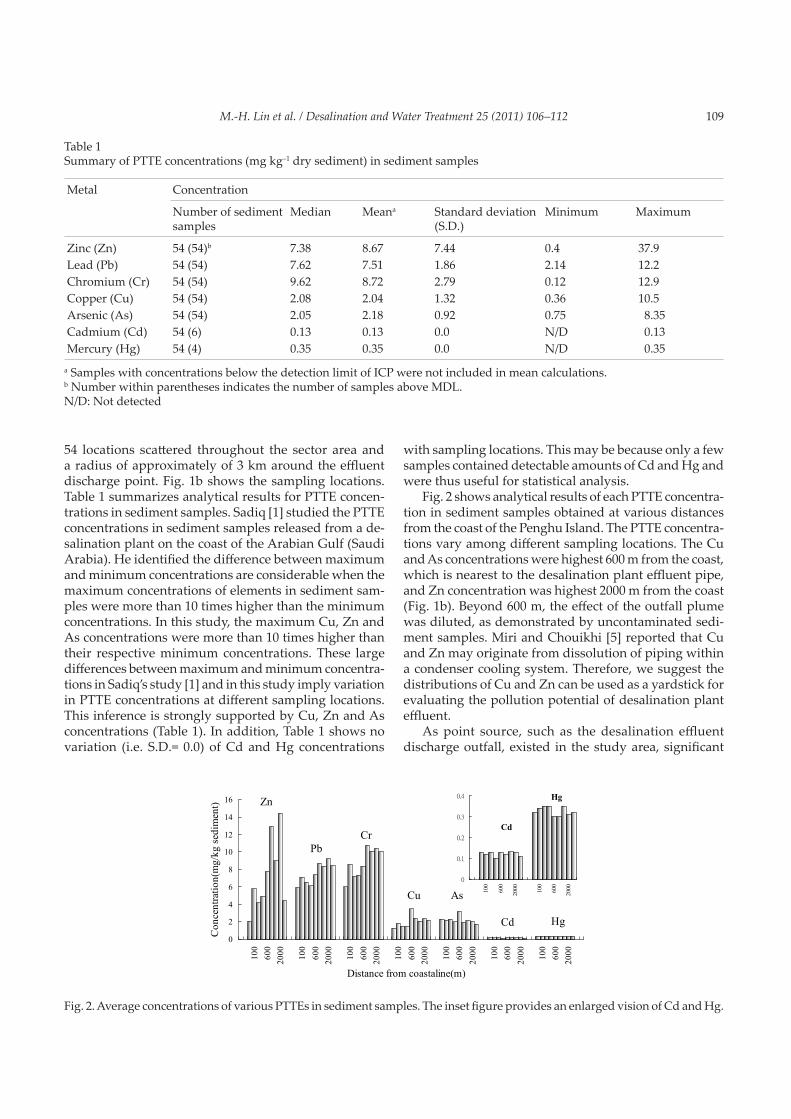
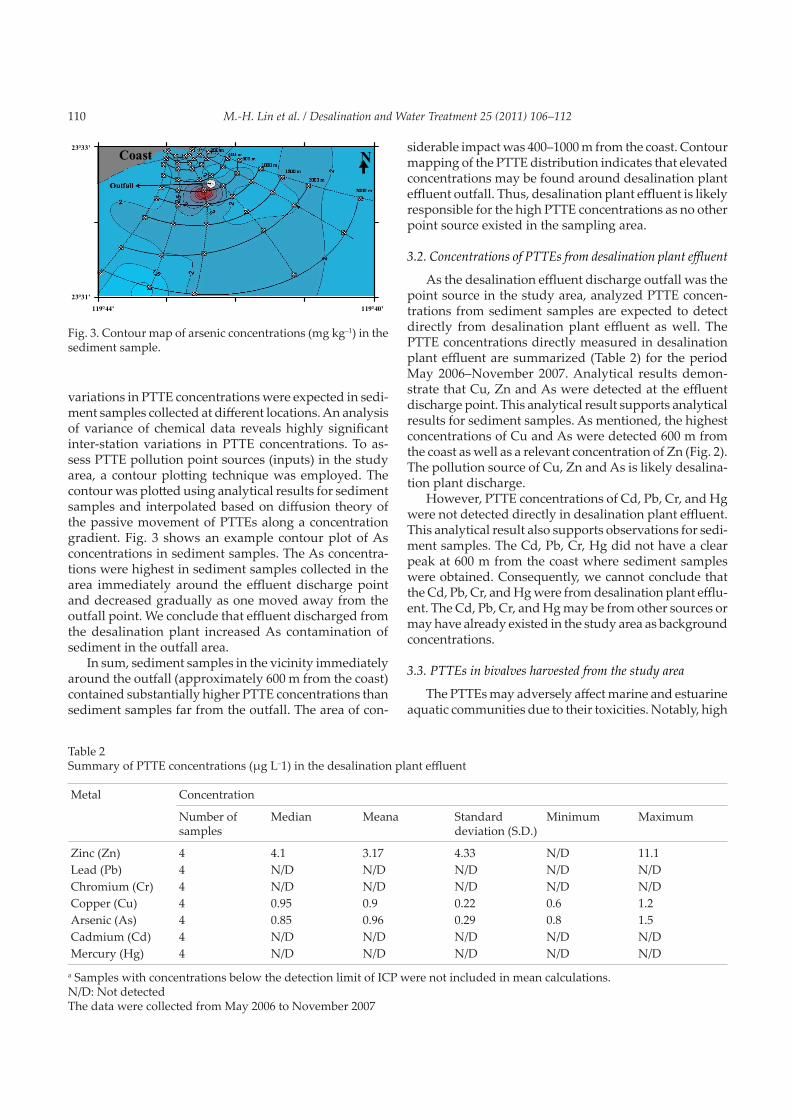
Fig. 3. Contour map of arsenic concentrations (mg kg–1) in the sediment sample.
NCoast NCoast
119°44' 119°40'
23°31'
23°33'
variations in PTTE concentrations were expected in sedi-ment samples collected at different locations. An analysis of variance of chemical data reveals highly significant inter-station variations in PTTE concentrations. To as-sess PTTE pollution point sources (inputs) in the study area, a contour plotting technique was employed. The contour was plotted using analytical results for sediment samples and interpolated based on diffusion theory of the passive movement of PTTEs along a concentration gradient. Fig. 3 shows an example contour plot of As concentrations in sediment samples. The As concentra-tions were highest in sediment samples collected in the area immediately around the effluent discharge point and decreased gradually as one moved away from the outfall point. We conclude that effluent discharged from the desalination plant increased As contamination of sediment in the outfall area.
In sum, sediment samples in the vicinity immediately around the outfall (approximately 600 m from the coast) contained substantially higher PTTE concentrations than sediment samples far from the outfall. The area of con-
Table 2Summary of PTTE concentrations (μg L–1) in the desalination plant effluent
Metal Concentration
Number of samples
Median Meana Standard deviation (S.D.)
Minimum Maximum
Zinc (Zn) 4 4.1 3.17 4.33 N/D 11.1Lead (Pb) 4 N/D N/D N/D N/D N/DChromium (Cr) 4 N/D N/D N/D N/D N/DCopper (Cu) 4 0.95 0.9 0.22 0.6 1.2Arsenic (As) 4 0.85 0.96 0.29 0.8 1.5Cadmium (Cd) 4 N/D N/D N/D N/D N/DMercury (Hg) 4 N/D N/D N/D N/D N/D
a Samples with concentrations below the detection limit of ICP were not included in mean calculations. N/D: Not detectedThe data were collected from May 2006 to November 2007
siderable impact was 400–1000 m from the coast. Contour mapping of the PTTE distribution indicates that elevated concentrations may be found around desalination plant effluent outfall. Thus, desalination plant effluent is likely responsible for the high PTTE concentrations as no other point source existed in the sampling area.
3.2. Concentrations of PTTEs from desalination plant effluent
As the desalination effluent discharge outfall was the point source in the study area, analyzed PTTE concen-trations from sediment samples are expected to detect directly from desalination plant effluent as well. The PTTE concentrations directly measured in desalination plant effluent are summarized (Table 2) for the period May 2006–November 2007. Analytical results demon-strate that Cu, Zn and As were detected at the effluent discharge point. This analytical result supports analytical results for sediment samples. As mentioned, the highest concentrations of Cu and As were detected 600 m from the coast as well as a relevant concentration of Zn (Fig. 2). The pollution source of Cu, Zn and As is likely desalina-tion plant discharge.
However, PTTE concentrations of Cd, Pb, Cr, and Hg were not detected directly in desalination plant effluent. This analytical result also supports observations for sedi-ment samples. The Cd, Pb, Cr, Hg did not have a clear peak at 600 m from the coast where sediment samples were obtained. Consequently, we cannot conclude that the Cd, Pb, Cr, and Hg were from desalination plant efflu-ent. The Cd, Pb, Cr, and Hg may be from other sources or may have already existed in the study area as background concentrations.
3.3. PTTEs in bivalves harvested from the study area
The PTTEs may adversely affect marine and estuarine aquatic communities due to their toxicities. Notably, high
M.-H. Lin et al. / Desalination and Water Treatment 25 (2011) 106–112 111
PTTE concentrations may transfer toxicity to humans through the food chain and potentially adversely affecting human health. Therefore, PTTE concentrations in bivalves were investigated and the practicability of using PTTE bioaccumulation in marine biota as a bio-monitoring index for marine environments polluted by seawater desalination effluent was assessed.
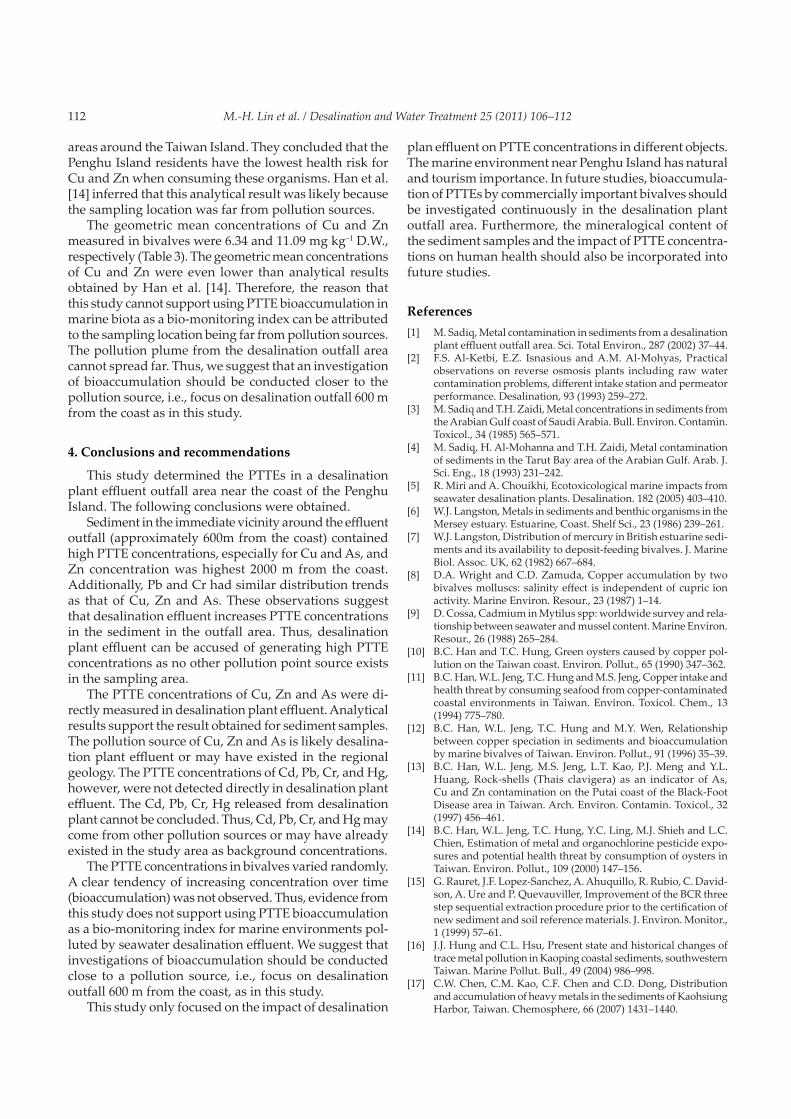
The studied bivalves were mainly oysters and clams, as mentioned in Section 2.3. Sampling sites were located within 50 m from the coast. Sampling occurred during March 2006 to November 2007. Table 3 summarizes ana-lytical results. Table 4 shows the different PTTE concen-trations (mg kg–1 dry weight (D.W.)) in bivalves during different seasons. Two important findings were obtained in the study of PTTEs in bivalves. First, Table 3 indicates the variation of PTTE concentrations of Cu, Zn, Pb and As in bivalves was relatively large compared to those of Cd, Cr, and Hg. Second, because of the mechanism of bioaccumulation, the PTTE concentrations in bivalves
Table 3Summary of PTTE concentrations (mg kg–1 D.W.) in bivalves
Metal Concentration
Number of samples
Median Geometric mean (GM)a
Standard deviation (S.D.)
Minimum Maximum
Zinc (Zn) 6 8.49 11.09 12.62 7.39 42.3Lead (Pb) 6 0.07 0.17 1.66 N/D 4.26Chromium (Cr) 6 0.13 0.15 0.11 0.09 0.4Copper (Cu) 6 7.58 6.34 4.54 2.43 14.8Arsenic (As) 6 3.38 3.82 1.52 2.49 6.53Cadmium (Cd) 6 0.11 0.11 0.1 0.03 0.33Mercury (Hg) 6 0.0 0.01 0.04 N/D 0.08
a Samples with concentrations below the detection limit of ICP were not included in mean calculations. N/D: Not detectedThe data were collected from March 2006 to November 2007
Table 4PTTE concentrations (mg kg–1 D.W.) of various seasons in bivalves from the desalination coastal areas with the distance of 50 m
Metal Concentration
Mar-06 Jul-06 Nov-06 Jan-07 Mar-07 Jul-07
Zinc (Zn) 8.60 7.39 42.30 10.30 8.01 8.37Lead (Pb) 0.04 0.07 0.28 4.26 N/D 0.05Chromium (Cr) 0.11 0.09 0.17 0.4 0.13 0.14Copper (Cu) 7.28 2.43 14.8 7.87 12.1 2.6Arsenic (As) 3.28 3.48 5.80 6.53 2.49 2.88Cadmium (Cd) 0.03 0.11 0.08 0.33 0.15 0.11Mercury (Hg) N/D N/D 0.08 N/D N/D N/D
a Samples with concentrations below the detection limit of ICP were not included in mean calculations. N/D: Not detectedThe data were collected from March 2006 to November 2007
were expected to increase gradually during the investiga-tion period; however, Table 4 indicates the variation of PTTE concentrations corresponding to seasons was pre-dominantly random and did not show a clear tendency to increase. Consequently, study data do not support the use of PTTE bioaccumulation in marine biota as a bio-monitoring index for marine environments polluted with seawater desalination effluent.
A similar conclusion was obtained by Han et al. [14], who sampled sediment and bivalves from an area offshore the Penghu Island during 1991–1998. For PTTE concentrations in the Pacific Oyster in that study, the geometric mean concentrations of Cu, Zn, Cd and As were 11.4 (range 8.20–15.7), 220 (range 187–259), 1.49 (range 1.45–1.52) and 6.35 (range 6.25–6.45) mg kg–1 dry weight, respectively. Han et al. [14] determined that the geometric mean concentrations of Cu and Zn in Pacific Oysters from an area offshore the Penghu Island were lower than those in oysters collected from other coastal
112 M.-H. Lin et al. / Desalination and Water Treatment 25 (2011) 106–112
areas around the Taiwan Island. They concluded that the Penghu Island residents have the lowest health risk for Cu and Zn when consuming these organisms. Han et al. [14] inferred that this analytical result was likely because the sampling location was far from pollution sources.
The geometric mean concentrations of Cu and Zn measured in bivalves were 6.34 and 11.09 mg kg–1 D.W., respectively (Table 3). The geometric mean concentrations of Cu and Zn were even lower than analytical results obtained by Han et al. [14]. Therefore, the reason that this study cannot support using PTTE bioaccumulation in marine biota as a bio-monitoring index can be attributed to the sampling location being far from pollution sources. The pollution plume from the desalination outfall area cannot spread far. Thus, we suggest that an investigation of bioaccumulation should be conducted closer to the pollution source, i.e., focus on desalination outfall 600 m from the coast as in this study.
4. Conclusions and recommendations
This study determined the PTTEs in a desalination plant effluent outfall area near the coast of the Penghu Island. The following conclusions were obtained.
Sediment in the immediate vicinity around the effluent outfall (approximately 600m from the coast) contained high PTTE concentrations, especially for Cu and As, and Zn concentration was highest 2000 m from the coast. Additionally, Pb and Cr had similar distribution trends as that of Cu, Zn and As. These observations suggest that desalination effluent increases PTTE concentrations in the sediment in the outfall area. Thus, desalination plant effluent can be accused of generating high PTTE concentrations as no other pollution point source exists in the sampling area.
The PTTE concentrations of Cu, Zn and As were di-rectly measured in desalination plant effluent. Analytical results support the result obtained for sediment samples. The pollution source of Cu, Zn and As is likely desalina-tion plant effluent or may have existed in the regional geology. The PTTE concentrations of Cd, Pb, Cr, and Hg, however, were not detected directly in desalination plant effluent. The Cd, Pb, Cr, Hg released from desalination plant cannot be concluded. Thus, Cd, Pb, Cr, and Hg may come from other pollution sources or may have already existed in the study area as background concentrations.
The PTTE concentrations in bivalves varied randomly. A clear tendency of increasing concentration over time (bioaccumulation) was not observed. Thus, evidence from this study does not support using PTTE bioaccumulation as a bio-monitoring index for marine environments pol-luted by seawater desalination effluent. We suggest that investigations of bioaccumulation should be conducted close to a pollution source, i.e., focus on desalination outfall 600 m from the coast, as in this study.
This study only focused on the impact of desalination
plan effluent on PTTE concentrations in different objects. The marine environment near Penghu Island has natural and tourism importance. In future studies, bioaccumula-tion of PTTEs by commercially important bivalves should be investigated continuously in the desalination plant outfall area. Furthermore, the mineralogical content of the sediment samples and the impact of PTTE concentra-tions on human health should also be incorporated into future studies.
References[1] M. Sadiq, Metal contamination in sediments from a desalination
plant effluent outfall area. Sci. Total Environ., 287 (2002) 37–44.[2] F.S. Al-Ketbi, E.Z. Isnasious and A.M. Al-Mohyas, Practical
observations on reverse osmosis plants including raw water contamination problems, different intake station and permeator performance. Desalination, 93 (1993) 259–272.
[3] M. Sadiq and T.H. Zaidi, Metal concentrations in sediments from the Arabian Gulf coast of Saudi Arabia. Bull. Environ. Contamin. Toxicol., 34 (1985) 565–571.
[4] M. Sadiq, H. Al-Mohanna and T.H. Zaidi, Metal contamination of sediments in the Tarut Bay area of the Arabian Gulf. Arab. J. Sci. Eng., 18 (1993) 231–242.
[5] R. Miri and A. Chouikhi, Ecotoxicological marine impacts from seawater desalination plants. Desalination. 182 (2005) 403–410.
[6] W.J. Langston, Metals in sediments and benthic organisms in the Mersey estuary. Estuarine, Coast. Shelf Sci., 23 (1986) 239–261.
[7] W.J. Langston, Distribution of mercury in British estuarine sedi-ments and its availability to deposit-feeding bivalves. J. Marine Biol. Assoc. UK, 62 (1982) 667–684.
[8] D.A. Wright and C.D. Zamuda, Copper accumulation by two bivalves molluscs: salinity effect is independent of cupric ion activity. Marine Environ. Resour., 23 (1987) 1–14.
[9] D. Cossa, Cadmium in Mytilus spp: worldwide survey and rela-tionship between seawater and mussel content. Marine Environ. Resour., 26 (1988) 265–284.
[10] B.C. Han and T.C. Hung, Green oysters caused by copper pol-lution on the Taiwan coast. Environ. Pollut., 65 (1990) 347–362.
[11] B.C. Han, W.L. Jeng, T.C. Hung and M.S. Jeng, Copper intake and health threat by consuming seafood from copper-contaminated coastal environments in Taiwan. Environ. Toxicol. Chem., 13 (1994) 775–780.
[12] B.C. Han, W.L. Jeng, T.C. Hung and M.Y. Wen, Relationship between copper speciation in sediments and bioaccumulation by marine bivalves of Taiwan. Environ. Pollut., 91 (1996) 35–39.
[13] B.C. Han, W.L. Jeng, M.S. Jeng, L.T. Kao, P.J. Meng and Y.L. Huang, Rock-shells (Thais clavigera) as an indicator of As, Cu and Zn contamination on the Putai coast of the Black-Foot Disease area in Taiwan. Arch. Environ. Contamin. Toxicol., 32 (1997) 456–461.
[14] B.C. Han, W.L. Jeng, T.C. Hung, Y.C. Ling, M.J. Shieh and L.C. Chien, Estimation of metal and organochlorine pesticide expo-sures and potential health threat by consumption of oysters in Taiwan. Environ. Pollut., 109 (2000) 147–156.
[15] G. Rauret, J.F. Lopez-Sanchez, A. Ahuquillo, R. Rubio, C. David-son, A. Ure and P. Quevauviller, Improvement of the BCR three step sequential extraction procedure prior to the certification of new sediment and soil reference materials. J. Environ. Monitor., 1 (1999) 57–61.
[16] J.J. Hung and C.L. Hsu, Present state and historical changes of trace metal pollution in Kaoping coastal sediments, southwestern Taiwan. Marine Pollut. Bull., 49 (2004) 986–998.
[17] C.W. Chen, C.M. Kao, C.F. Chen and C.D. Dong, Distribution and accumulation of heavy metals in the sediments of Kaohsiung Harbor, Taiwan. Chemosphere, 66 (2007) 1431–1440.