POSTERS OZONE DOSES AND KINETIC - consolider · PDF filepH 8.5 and were always kept above 8.0...
10
1 Ozone-based reclamation of an STP effluent: Ozone Doses and Kinetic A. Rodríguez*, R. Rosal*, J.A. Perdigón-Melón*, Alice Petre*, M. J. Gomez**, E. García- Calvo* and A.R. Fernandez-Alba** Phone: ++34918854974, Fax: ++34918855088, E-Mail: [email protected] * Department of Chemical Engineering, University of Alcala , 28771 Alcala de Henares, Spain ** Department of Analytical Chemistry, University of Almerıa, 04010 Almerıa, Spain Abstract The system ozone and hydrogen peroxide was used to reclaim wastewater from the secondary clarifier from a Sewage Treatment Plant (STP) of Alcalá de Henares (Madrid-Spain). The assays were performed by bubbling a gas mixture of oxygen and ozone, with ~ 24 g Nm -3 of ozone concentration, through a volume of wastewater samples for 20 minutes at 25 ºC. The removal of dissolved micropollutants such as Pharmaceutical and Personal Care Products (PPCPs) and Organic Carbon (TOC) was enhanced by adding periodic pulses of hydrogen peroxide while keeping pH above 8.0 throughout the runs. Removal efficiency ratios in the range of 7 – 13 mg O 3 /mg TOC and 0.24 mg O 3 /ng micropollutants at 5 minutes of ozonation were assessed as reference data to reclaim wastewater from STP. The relation between the extent of TOC removed and ozone doses used was related by a second-order kinetic model in which the time-integrated ozone-hydrogen peroxide concentration was included. Keywords: Advanced Oxidation Processes, Kinetics, Reclaim Water, Ozonation, Water Pollution Control. Introduction The aim of EC Water Framework Directive (200/60/EC) is to achieve good ecological water status in terms of the presence of chemicals from human activity. In this connection, increasing water scarcity enhances wastewater reuse, which is especially geared to the large amount of effluents from Sewage Treatment Plants (STP) that currently are discharged to surface bodies. Possible reuse targets for biotreated municipal wastewater include industrial, agricultural and domestic uses. Any of these reuse options require different water qualities, but in general tertiary treatments must be implemented after the secondary settling of activated sludge treatments to avoid the presence of organic pollutants in treated waters (EPA/625/R-04/108 US). Certain regulations include TOC as a quality parameter for practices of indirect drinking water reuse such as spreading basins or injection (van der Graaf et al, 2005). Organic compounds, even in very low amounts, severely endanger water reuse in many applications. This is the case of endocrine- disrupting compounds and other emerging pollutants that are only partially removed from wastewater in conventional wastewater treatments in the STPs and whose presence is repeatedly reported in effluents (Termes, 1998; Carballa el al., 2004; Gagne et al, 2006; Roberts et al., 2006; Al-Rifai et al., 2007). Technologies based on Advanced Oxidation Processes (AOP) as Fenton, photo-Fenton, photocatalysis on TiO 2 , ultraviolet-based oxidation processes (H 2 O 2 /UV and O 3 /UV), and the ozone based O 3 /HO - and O 3 /H 2 O 2 can be used to reclaim water (Gogate et al., 2004; Ikehata et al., 2006). All of these involve the generation of hydroxyl radicals, a highly reactive and unselective species, in sufficient amounts to oxidize the organics in wastewater. Technologies based on O 3 /H 2 O 2 system provides a high degree of mineralization (Yang et al., 2005) which ensures the absence of any oxidation intermediates and a reduction in toxicity, as well as the removal of persistent, emerging or any other individual pollutant from the many compounds identified in STP effluents (Gomez et al, 2007). Furthermore, the ozone base technologies are well admitted by society and are easy to combine with others such as UV, biological, electrolysis and membranes to mineralize organic matter or to remove micropollutants from
Transcript of POSTERS OZONE DOSES AND KINETIC - consolider · PDF filepH 8.5 and were always kept above 8.0...
1
Ozone-based reclamation of an STP effluent: Ozone Doses and Kinetic A. Rodríguez*, R. Rosal*, J.A. Perdigón-Melón*, Alice Petre*, M. J. Gomez**, E. García-Calvo* and A.R. Fernandez-Alba**
Phone: ++34918854974, Fax: ++34918855088, E-Mail: [email protected] *Department of Chemical Engineering, University of Alcala , 28771 Alcala de Henares, Spain **Department of Analytical Chemistry, University of Almerıa, 04010 Almerıa, Spain Abstract The system ozone and hydrogen peroxide was used to reclaim wastewater from the secondary clarifier from a Sewage Treatment Plant (STP) of Alcalá de Henares (Madrid-Spain). The assays were performed by bubbling a gas mixture of oxygen and ozone, with ~ 24 g Nm-3 of ozone concentration, through a volume of wastewater samples for 20 minutes at 25 ºC. The removal of dissolved micropollutants such as Pharmaceutical and Personal Care Products (PPCPs) and Organic Carbon (TOC) was enhanced by adding periodic pulses of hydrogen peroxide while keeping pH above 8.0 throughout the runs. Removal efficiency ratios in the range of 7 – 13 mg O3/mg TOC and 0.24 mg O3 /ng micropollutants at 5 minutes of ozonation were assessed as reference data to reclaim wastewater from STP. The relation between the extent of TOC removed and ozone doses used was related by a second-order kinetic model in which the time-integrated ozone-hydrogen peroxide concentration was included. Keywords: Advanced Oxidation Processes, Kinetics, Reclaim Water, Ozonation, Water Pollution Control. Introduction The aim of EC Water Framework Directive (200/60/EC) is to achieve good ecological water status in terms of the presence of chemicals from human activity. In this connection, increasing water scarcity enhances wastewater reuse, which is especially geared to the large amount of effluents from Sewage Treatment Plants (STP) that currently are discharged to surface bodies. Possible reuse targets for biotreated municipal wastewater include industrial, agricultural and domestic uses. Any of these reuse options require different water qualities, but in general tertiary treatments must be implemented after the secondary settling of activated sludge treatments to avoid the presence of organic pollutants in treated waters (EPA/625/R-04/108 US). Certain regulations include TOC as a quality parameter for practices of indirect drinking water reuse such as spreading basins or injection (van der Graaf et al, 2005). Organic compounds, even in very low amounts, severely endanger water reuse in many applications. This is the case of endocrine-disrupting compounds and other emerging pollutants that are only partially removed from wastewater in conventional wastewater treatments in the STPs and whose presence is repeatedly reported in effluents (Termes, 1998; Carballa el al., 2004; Gagne et al, 2006; Roberts et al., 2006; Al-Rifai et al., 2007). Technologies based on Advanced Oxidation Processes (AOP) as Fenton, photo-Fenton, photocatalysis on TiO2, ultraviolet-based oxidation processes (H2O2/UV and O3/UV), and the ozone based O3/HO- and O3/H2O2 can be used to reclaim water (Gogate et al., 2004; Ikehata et al., 2006). All of these involve the generation of hydroxyl radicals, a highly reactive and unselective species, in sufficient amounts to oxidize the organics in wastewater. Technologies based on O3/H2O2 system provides a high degree of mineralization (Yang et al., 2005) which ensures the absence of any oxidation intermediates and a reduction in toxicity, as well as the removal of persistent, emerging or any other individual pollutant from the many compounds identified in STP effluents (Gomez et al, 2007). Furthermore, the ozone base technologies are well admitted by society and are easy to combine with others such as UV, biological, electrolysis and membranes to mineralize organic matter or to remove micropollutants from
2
wastewater (Alaton et al., 2004; Agustina et al., 2005; Kishimoto et al., 2005; Lafi et al., 2006; Bennera et al., 2008) and make them an attractive candidate to optimize the reclaim water processes. This work is focused on the need to provide adequate information to model the ozonation processes in a real matrix as wastewater from STP in order to optimize the reclaim water technologies based on ozone and to broaden the water reuse practices. This work presents results concerning three water samples taken from the STP of Alcala de Henares (Madrid-Spain) during February, March and May of 2008. These were treated in alkaline condition by O3/H2O2 system for 20 minutes. An accurate monitoring of dissolved ozone as the key measured variable in the system to extent of TOC and PPCPs micropollutants removed at different ozonation times was used. The ozone doses used were related to extent contaminants removed by a kinetic model based in the time-integrated ozone-hydrogen peroxide concentration. Methods Materials and ozonation procedure Wastewater was collected from the secondary clarifier of a STP located in Alcalá de Henares (Madrid-Spain) that receives a mixture of domestic and industrial wastewater from facilities located around the city. This STP has a capacity of 375000 equivalent inhabitants and is designed to treat a maximum volume of wastewater of 3000 m3/h. All samples were composites of 1-L aliquots collected on an hourly basis during 24 h sampling periods and they were immediately processed or stored in a refrigerator (< 4ºC) inside glass bottles. The ozonation runs were performed in batch mode in a 5-L glass jacketed reactor at 25ºC. The temperature was controlled by a Huber Polystat cc2 and monitored throughout the experiment by means of a Pt100 Resistance Thermometer Detector (RTD). Ozone was produced by a corona discharge ozonator (Ozomatic, 118 SWO100) fed by an AirSep AS-12 PSA oxygen generation unit. The gas containing ozone was bubbled into the liquid by means of a porous glass disk with a gas flow of 0.36 Nm3/h. The concentration of ozone in the gas was ~ 24 g Nm-3 and measured immediately before each run. The off-gas was vented to an ozone destruction unit. The reaction vessel was agitated with a Teflon four-blade impeller at 1000 rpm. During the runs, injections of 0.15 mL of H2O2 (30 % w/v Sigma-Aldrich) were performed every 5 min starting at the beginning of ozone bubbling. This amount was chosen in order to keep the overall H2O2/O3 molar ratio lower than 1, to enhance the production of hydroxyl radicals and to maintain sufficient dissolved ozone throughout the runs to guarantee the chemical step control process. Pulses were intended to avoid a great excess of hydrogen peroxide, well-known radical scavenger of hydroxyl radicals (Beltran, 2004). During the runs, certain samples were withdrawn for analysis after previously removing ozone by bubbling nitrogen in order to prevent further oxidation reactions. The experiments started at pH 8.5 and were always kept above 8.0 by pumping a diluted solution of sodium hydroxide (Panreac) with a feed-back PID control device. The decomposition of ozone acidified the reaction mixture but the general trend during most of the run was a moderate increase of pH. This effect was attributed to reactions between hydroxyl radicals and carbonate and bicarbonate ions formed during the mineralization process (Chandrakanth et al, 1998). Analysis The concentration of dissolved ozone was measured by means of an amperometric Rosemount 499A OZ analyser calibrated against the Indigo Colorimetric Method (SM 4500-O3 B). The signal, transmitted by a Rosemount 1055 SoluComp II Dual Input Analyser was recorded by means of a data acquisition unit. The concentration of ozone in gas phase was measured using an Anseros Ozomat GM6000 Pro photometer calibrated against a chemical method [21]. The pH of the reaction mixture was measured by means of a CRISON electrode connected to a Eutech αlpha-pH100 feed-back control system whose final control element was a LC10AS Shimadzu pump delivering a solution of sodium hydroxide. The signals from the concentration of dissolved ozone, pH and temperature were recorded by means of an Agilent 34970 Data Acquisition Unit connected to a computer with a sampling period of 5 s. Total Organic Carbon (TOC) analyses were performed with the aid of a Shimadzu TOC-VCSH analyzer equipped
3
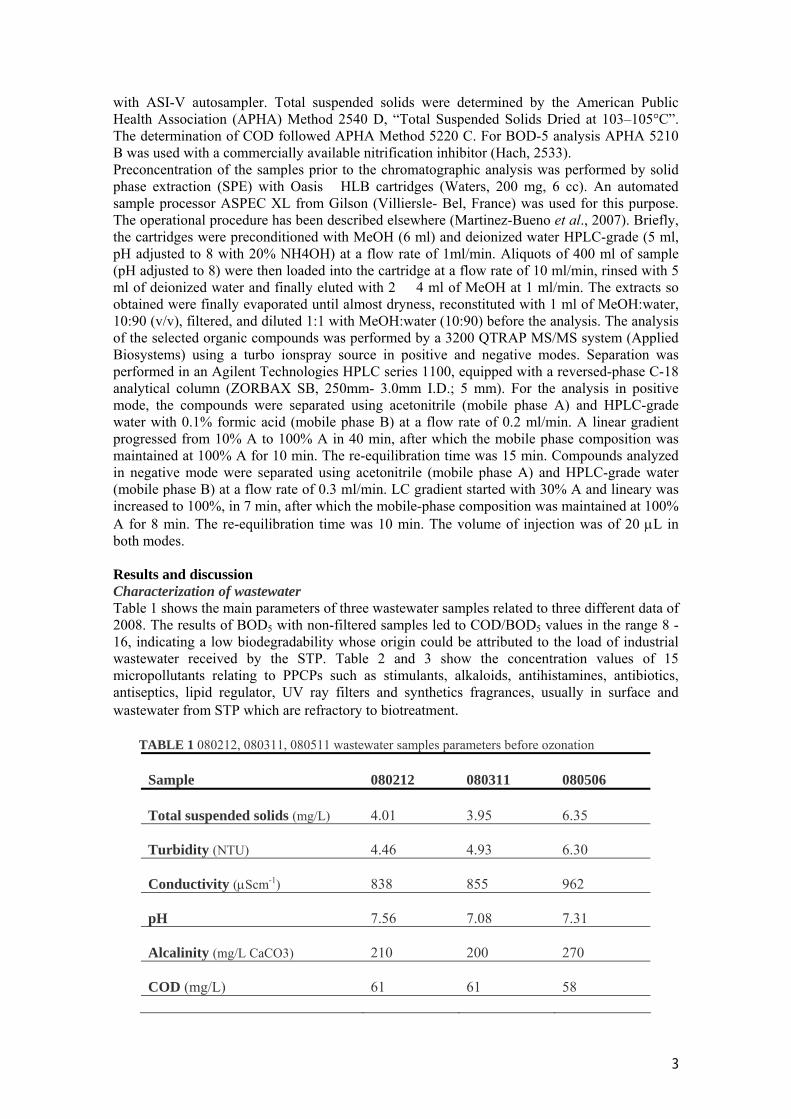
with ASI-V autosampler. Total suspended solids were determined by the American Public Health Association (APHA) Method 2540 D, “Total Suspended Solids Dried at 103–105°C”. The determination of COD followed APHA Method 5220 C. For BOD-5 analysis APHA 5210 B was used with a commercially available nitrification inhibitor (Hach, 2533). Preconcentration of the samples prior to the chromatographic analysis was performed by solid phase extraction (SPE) with Oasis� HLB cartridges (Waters, 200 mg, 6 cc). An automated sample processor ASPEC XL from Gilson (Villiersle- Bel, France) was used for this purpose. The operational procedure has been described elsewhere (Martinez-Bueno et al., 2007). Briefly, the cartridges were preconditioned with MeOH (6 ml) and deionized water HPLC-grade (5 ml, pH adjusted to 8 with 20% NH4OH) at a flow rate of 1ml/min. Aliquots of 400 ml of sample (pH adjusted to 8) were then loaded into the cartridge at a flow rate of 10 ml/min, rinsed with 5 ml of deionized water and finally eluted with 2 � 4 ml of MeOH at 1 ml/min. The extracts so obtained were finally evaporated until almost dryness, reconstituted with 1 ml of MeOH:water, 10:90 (v/v), filtered, and diluted 1:1 with MeOH:water (10:90) before the analysis. The analysis of the selected organic compounds was performed by a 3200 QTRAP MS/MS system (Applied Biosystems) using a turbo ionspray source in positive and negative modes. Separation was performed in an Agilent Technologies HPLC series 1100, equipped with a reversed-phase C-18 analytical column (ZORBAX SB, 250mm- 3.0mm I.D.; 5 mm). For the analysis in positive mode, the compounds were separated using acetonitrile (mobile phase A) and HPLC-grade water with 0.1% formic acid (mobile phase B) at a flow rate of 0.2 ml/min. A linear gradient progressed from 10% A to 100% A in 40 min, after which the mobile phase composition was maintained at 100% A for 10 min. The re-equilibration time was 15 min. Compounds analyzed in negative mode were separated using acetonitrile (mobile phase A) and HPLC-grade water (mobile phase B) at a flow rate of 0.3 ml/min. LC gradient started with 30% A and lineary was increased to 100%, in 7 min, after which the mobile-phase composition was maintained at 100% A for 8 min. The re-equilibration time was 10 min. The volume of injection was of 20 μL in both modes. Results and discussion Characterization of wastewater Table 1 shows the main parameters of three wastewater samples related to three different data of 2008. The results of BOD5 with non-filtered samples led to COD/BOD5 values in the range 8 -16, indicating a low biodegradability whose origin could be attributed to the load of industrial wastewater received by the STP. Table 2 and 3 show the concentration values of 15 micropollutants relating to PPCPs such as stimulants, alkaloids, antihistamines, antibiotics, antiseptics, lipid regulator, UV ray filters and synthetics fragrances, usually in surface and wastewater from STP which are refractory to biotreatment. TABLE 1 080212, 080311, 080511 wastewater samples parameters before ozonation
Sample
080212
080311
080506
Total suspended solids (mg/L)
4.01
3.95
6.35
Turbidity (NTU)
4.46
4.93
6.30
Conductivity (μScm-1)
838
855
962
pH
7.56
7.08
7.31
Alcalinity (mg/L CaCO3)
210
200
270
COD (mg/L)
61
61
58
4
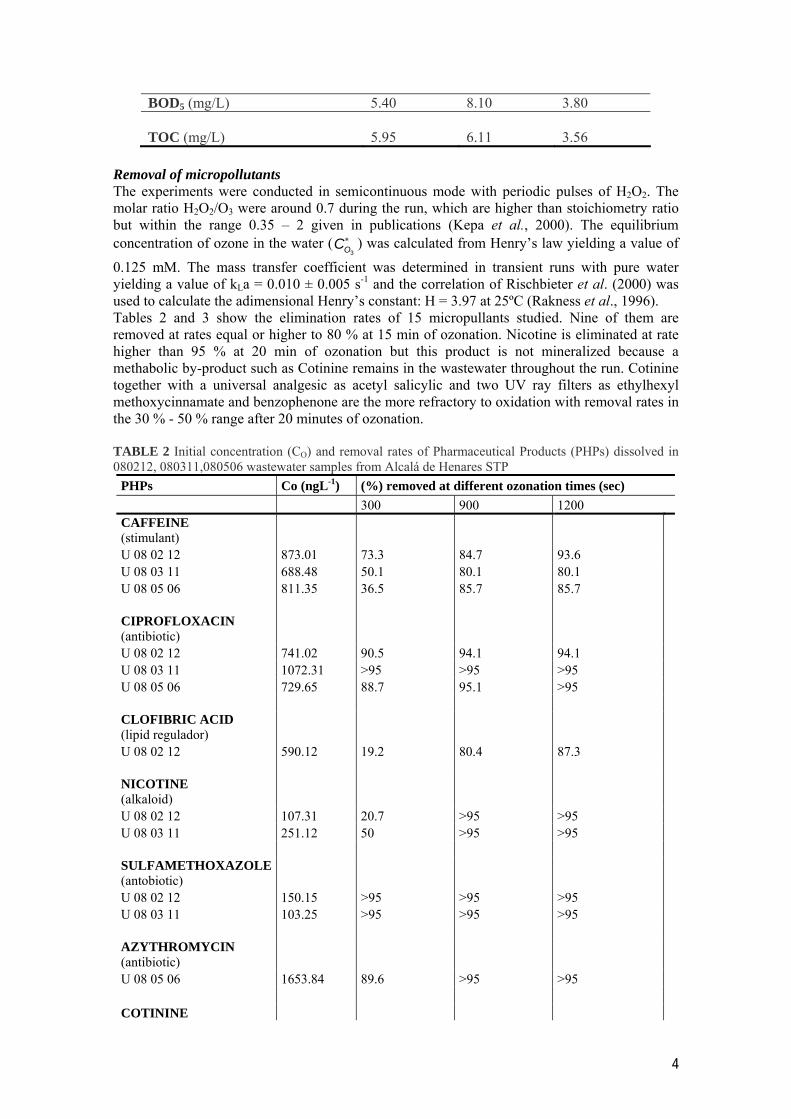
BOD5 (mg/L) 5.40 8.10 3.80 TOC (mg/L)
5.95
6.11
3.56
Removal of micropollutants The experiments were conducted in semicontinuous mode with periodic pulses of H2O2. The molar ratio H2O2/O3 were around 0.7 during the run, which are higher than stoichiometry ratio but within the range 0.35 – 2 given in publications (Kepa et al., 2000). The equilibrium concentration of ozone in the water (
3OC∗ ) was calculated from Henry’s law yielding a value of
0.125 mM. The mass transfer coefficient was determined in transient runs with pure water yielding a value of kLa = 0.010 ± 0.005 s-1 and the correlation of Rischbieter et al. (2000) was used to calculate the adimensional Henry’s constant: H = 3.97 at 25ºC (Rakness et al., 1996). Tables 2 and 3 show the elimination rates of 15 micropullants studied. Nine of them are removed at rates equal or higher to 80 % at 15 min of ozonation. Nicotine is eliminated at rate higher than 95 % at 20 min of ozonation but this product is not mineralized because a methabolic by-product such as Cotinine remains in the wastewater throughout the run. Cotinine together with a universal analgesic as acetyl salicylic and two UV ray filters as ethylhexyl methoxycinnamate and benzophenone are the more refractory to oxidation with removal rates in the 30 % - 50 % range after 20 minutes of ozonation. TABLE 2 Initial concentration (CO) and removal rates of Pharmaceutical Products (PHPs) dissolved in 080212, 080311,080506 wastewater samples from Alcalá de Henares STP
PHPs Co (ngL-1) (%) removed at different ozonation times (sec) 300 900 1200 CAFFEINE (stimulant) U 08 02 12 873.01 73.3 84.7 93.6 U 08 03 11 688.48 50.1 80.1 80.1 U 08 05 06 811.35 36.5 85.7 85.7 CIPROFLOXACIN (antibiotic) U 08 02 12 741.02 90.5 94.1 94.1 U 08 03 11 1072.31 >95 >95 >95 U 08 05 06 729.65 88.7 95.1 >95 CLOFIBRIC ACID (lipid regulador) U 08 02 12 590.12 19.2 80.4 87.3 NICOTINE (alkaloid) U 08 02 12 107.31 20.7 >95 >95 U 08 03 11 251.12 50 >95 >95 SULFAMETHOXAZOLE (antobiotic) U 08 02 12 150.15 >95 >95 >95 U 08 03 11 103.25 >95 >95 >95 AZYTHROMYCIN (antibiotic) U 08 05 06 1653.84 89.6 >95 >95 COTININE
5
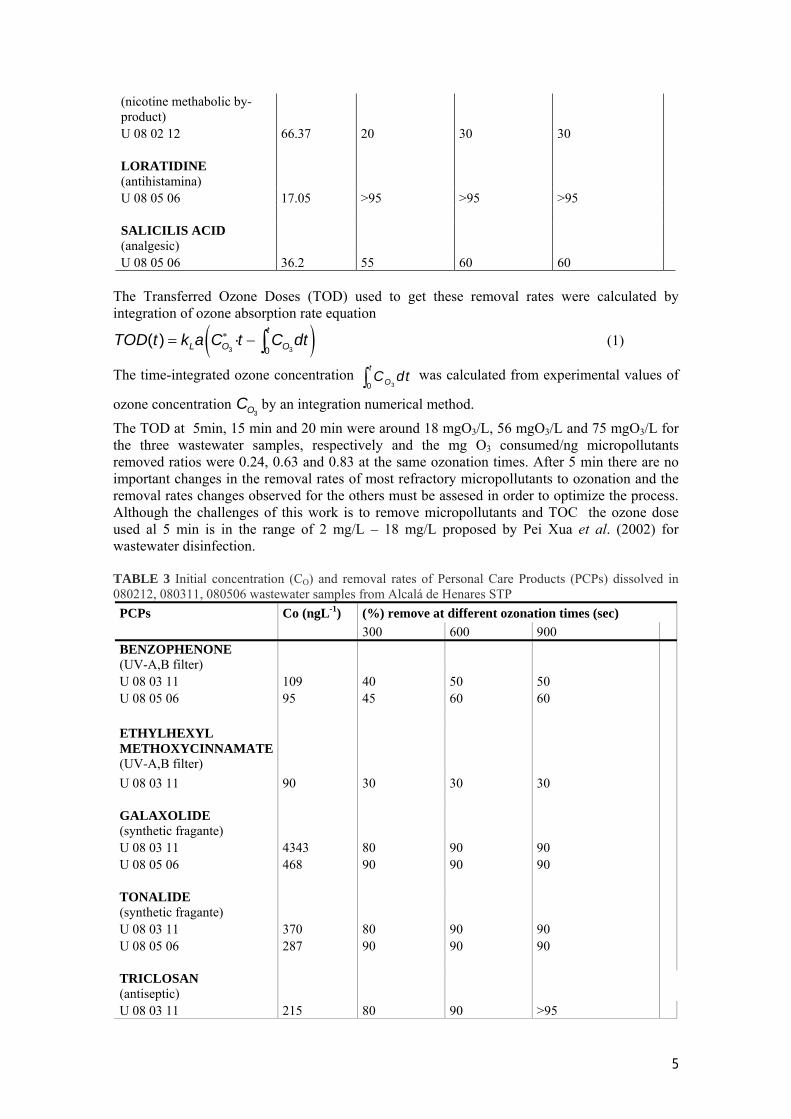
(nicotine methabolic by-product) U 08 02 12 66.37 20 30 30 LORATIDINE (antihistamina) U 08 05 06 17.05 >95 >95 >95 SALICILIS ACID (analgesic) U 08 05 06 36.2 55 60 60
The Transferred Ozone Doses (TOD) used to get these removal rates were calculated by integration of ozone absorption rate equation
( )3 30( ) ·
t
L O OTOD t k a C t C dt∗= − ∫ (1)
The time-integrated ozone concentration 30
t
OC dt∫ was calculated from experimental values of
ozone concentration 3OC by an integration numerical method.
The TOD at 5min, 15 min and 20 min were around 18 mgO3/L, 56 mgO3/L and 75 mgO3/L for the three wastewater samples, respectively and the mg O3 consumed/ng micropollutants removed ratios were 0.24, 0.63 and 0.83 at the same ozonation times. After 5 min there are no important changes in the removal rates of most refractory micropollutants to ozonation and the removal rates changes observed for the others must be assesed in order to optimize the process. Although the challenges of this work is to remove micropollutants and TOC the ozone dose used al 5 min is in the range of 2 mg/L – 18 mg/L proposed by Pei Xua et al. (2002) for wastewater disinfection. TABLE 3 Initial concentration (CO) and removal rates of Personal Care Products (PCPs) dissolved in 080212, 080311, 080506 wastewater samples from Alcalá de Henares STP PCPs Co (ngL-1) (%) remove at different ozonation times (sec) 300 600 900 BENZOPHENONE (UV-A,B filter) U 08 03 11 109 40 50 50 U 08 05 06 95 45 60 60 ETHYLHEXYL METHOXYCINNAMATE (UV-A,B filter) U 08 03 11 90 30 30 30 GALAXOLIDE (synthetic fragante) U 08 03 11 4343 80 90 90 U 08 05 06 468 90 90 90 TONALIDE (synthetic fragante) U 08 03 11 370 80 90 90 U 08 05 06 287 90 90 90 TRICLOSAN (antiseptic) U 08 03 11 215 80 90 >95
6
0
0.1
0.2
0.3
0.4
0.5
0.6
0.7
0 200 400 600 800 1000 1200 1400
time (s)
% T
OC
elim
itate
d
U 08 05 06 75 80 83 90 MUSK XILENE (synthetic fragante) U 08 03 11 113 60 80 >95
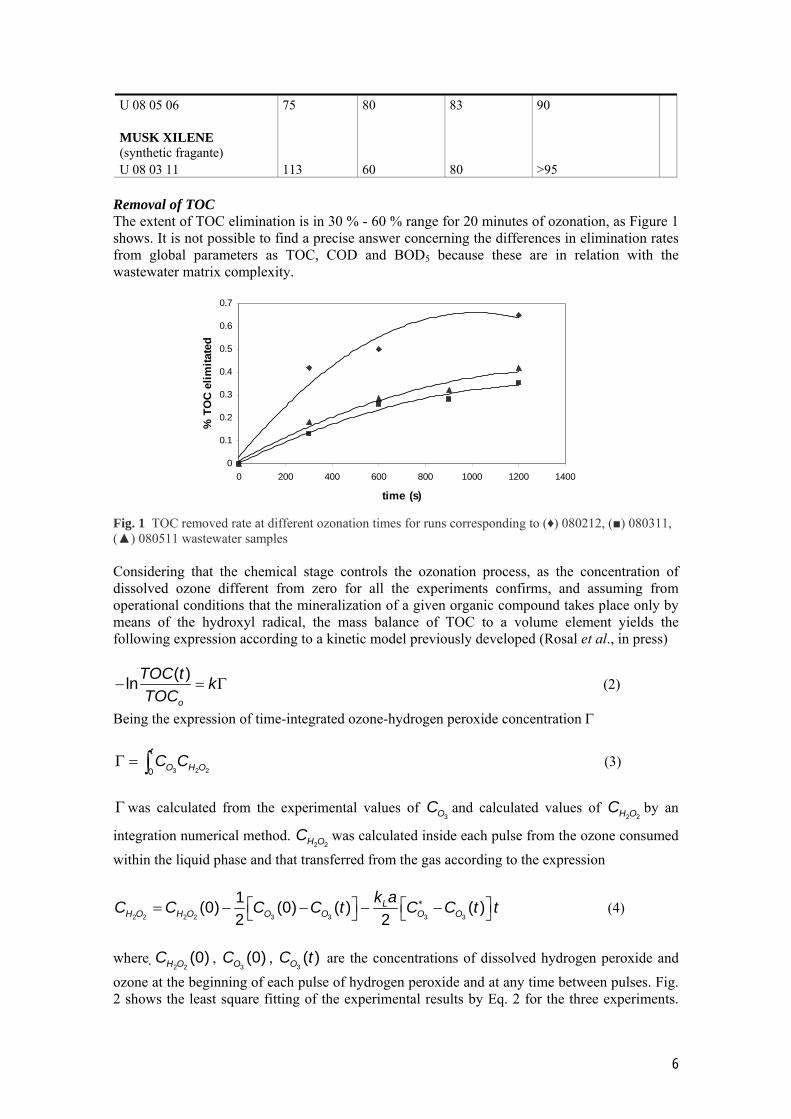
Removal of TOC The extent of TOC elimination is in 30 % - 60 % range for 20 minutes of ozonation, as Figure 1 shows. It is not possible to find a precise answer concerning the differences in elimination rates from global parameters as TOC, COD and BOD5 because these are in relation with the wastewater matrix complexity. Fig. 1 TOC removed rate at different ozonation times for runs corresponding to (♦) 080212, (■) 080311, (▲) 080511 wastewater samples Considering that the chemical stage controls the ozonation process, as the concentration of dissolved ozone different from zero for all the experiments confirms, and assuming from operational conditions that the mineralization of a given organic compound takes place only by means of the hydroxyl radical, the mass balance of TOC to a volume element yields the following expression according to a kinetic model previously developed (Rosal et al., in press)
( )lno
TOC t kTOC
− = Γ (2)
Being the expression of time-integrated ozone-hydrogen peroxide concentration Γ
3 2 20
t
O H OC CΓ = ∫ (3)
Γwas calculated from the experimental values of
3OC and calculated values of 2 2H OC by an
integration numerical method. 2 2H OC was calculated inside each pulse from the ozone consumed
within the liquid phase and that transferred from the gas according to the expression
2 2 2 2 3 3 3 3
1(0) (0) ( ) ( )2 2
LH O H O O O O O
k aC C C C t C C t t∗⎡ ⎤ ⎡ ⎤= − − − −⎣ ⎦ ⎣ ⎦ (4)
where
2 2(0)H OC ,
3(0)OC ,
3( )OC t are the concentrations of dissolved hydrogen peroxide and
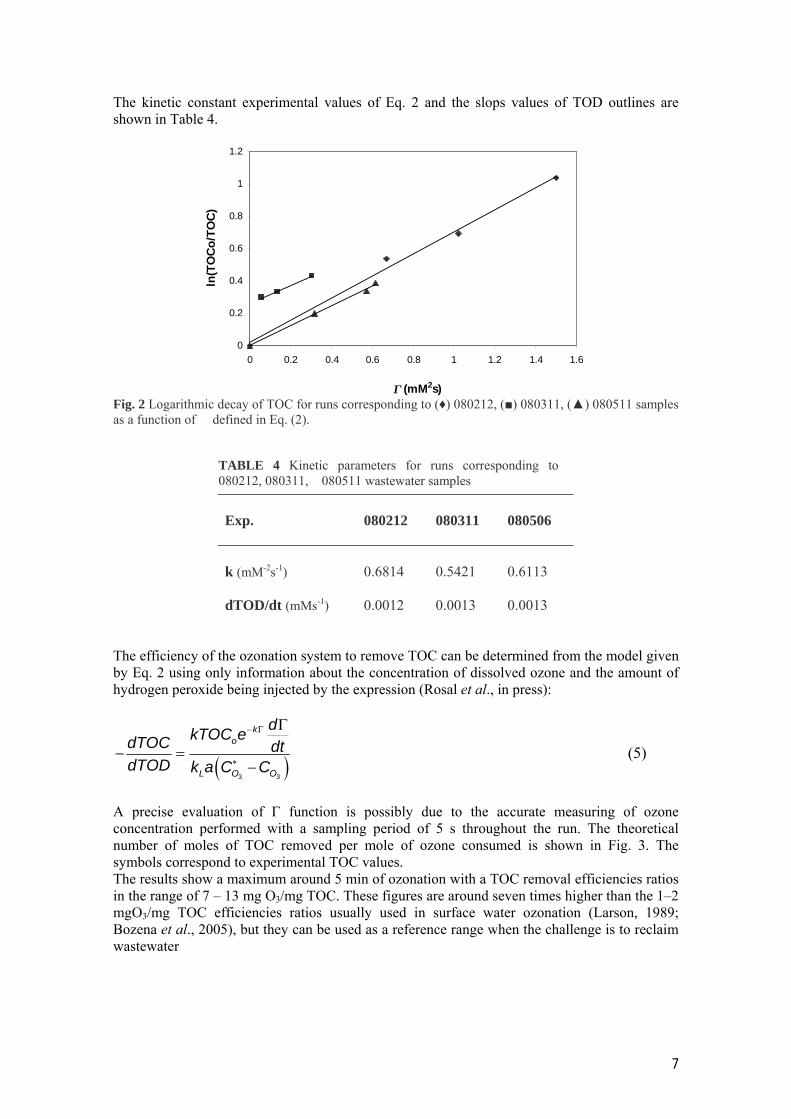
ozone at the beginning of each pulse of hydrogen peroxide and at any time between pulses. Fig. 2 shows the least square fitting of the experimental results by Eq. 2 for the three experiments.
7
0
0.2
0.4
0.6
0.8
1
1.2
0 0.2 0.4 0.6 0.8 1 1.2 1.4 1.6
Γ (mM2s)
ln(T
OC
o/TO
C)
The kinetic constant experimental values of Eq. 2 and the slops values of TOD outlines are shown in Table 4. Fig. 2 Logarithmic decay of TOC for runs corresponding to (♦) 080212, (■) 080311, (▲) 080511 samples as a function of � defined in Eq. (2).
Exp.
080212
080311
080506
k (mM-2s-1)
0.6814
0.5421
0.6113
dTOD/dt (mMs-1)
0.0012
0.0013
0.0013
The efficiency of the ozonation system to remove TOC can be determined from the model given by Eq. 2 using only information about the concentration of dissolved ozone and the amount of hydrogen peroxide being injected by the expression (Rosal et al., in press):
( )3 3
ko
L O O
dkTOC edTOC dtdTOD k a C C
− Γ
∗
Γ
− =−
(5)
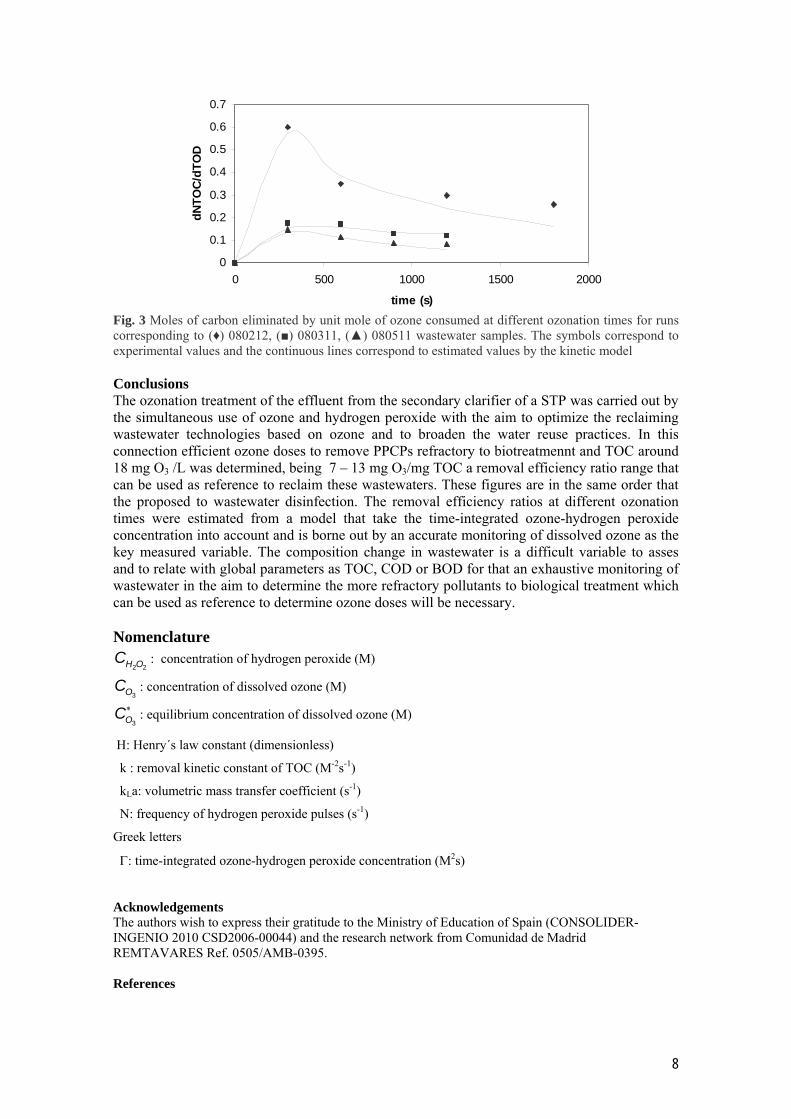
A precise evaluation of Γ function is possibly due to the accurate measuring of ozone concentration performed with a sampling period of 5 s throughout the run. The theoretical number of moles of TOC removed per mole of ozone consumed is shown in Fig. 3. The symbols correspond to experimental TOC values. The results show a maximum around 5 min of ozonation with a TOC removal efficiencies ratios in the range of 7 – 13 mg O3/mg TOC. These figures are around seven times higher than the 1–2 mgO3/mg TOC efficiencies ratios usually used in surface water ozonation (Larson, 1989; Bozena et al., 2005), but they can be used as a reference range when the challenge is to reclaim wastewater
TABLE 4 Kinetic parameters for runs corresponding to 080212, 080311, 080511 wastewater samples
8
0
0.1
0.2
0.3
0.4
0.5
0.6
0.7
0 500 1000 1500 2000
time (s)
dNTO
C/dT
OD
Fig. 3 Moles of carbon eliminated by unit mole of ozone consumed at different ozonation times for runs corresponding to (♦) 080212, (■) 080311, (▲) 080511 wastewater samples. The symbols correspond to experimental values and the continuous lines correspond to estimated values by the kinetic model Conclusions The ozonation treatment of the effluent from the secondary clarifier of a STP was carried out by the simultaneous use of ozone and hydrogen peroxide with the aim to optimize the reclaiming wastewater technologies based on ozone and to broaden the water reuse practices. In this connection efficient ozone doses to remove PPCPs refractory to biotreatmennt and TOC around 18 mg O3 /L was determined, being 7 – 13 mg O3/mg TOC a removal efficiency ratio range that can be used as reference to reclaim these wastewaters. These figures are in the same order that the proposed to wastewater disinfection. The removal efficiency ratios at different ozonation times were estimated from a model that take the time-integrated ozone-hydrogen peroxide concentration into account and is borne out by an accurate monitoring of dissolved ozone as the key measured variable. The composition change in wastewater is a difficult variable to asses and to relate with global parameters as TOC, COD or BOD for that an exhaustive monitoring of wastewater in the aim to determine the more refractory pollutants to biological treatment which can be used as reference to determine ozone doses will be necessary. Nomenclature
2 2H OC : concentration of hydrogen peroxide (M)
3OC : concentration of dissolved ozone (M)
3OC∗ : equilibrium concentration of dissolved ozone (M)
H: Henry´s law constant (dimensionless)
k : removal kinetic constant of TOC (M-2s-1)
kLa: volumetric mass transfer coefficient (s-1)
N: frequency of hydrogen peroxide pulses (s-1)
Greek letters
Γ: time-integrated ozone-hydrogen peroxide concentration (M2s)
Acknowledgements The authors wish to express their gratitude to the Ministry of Education of Spain (CONSOLIDER-INGENIO 2010 CSD2006-00044) and the research network from Comunidad de Madrid REMTAVARES Ref. 0505/AMB-0395. References
9
Agustina T.E., Ang H.M., Vareek V.K. (2005). A review of synergistic effect of photocatalysis and ozonation on wastewater treatment. Journal of Photochemistry and Photobiology C: Photochemistry, 6, 264–273. Alaton A, Dogruel S., Baykal E., Gerone G. (2004). Combined chemical and biological oxidation of penicillin formulation effluent. Journal of Environmental Management, 73, 155–163. Al-Rifai J.H., Gabelish C.L., Schäfer A.I. (2007). Occurrence of pharmaceutically active and non-steroidal estrogenic compounds in three different wastewater recycling schemes in Australia, Chemosphere, 69, 803-815. Beltrán F.J. ( 2004). Ozone reaction kinetics for water and wastewater systems. CRC Press, Boca Raton, pp 178-179. Bennera J., Salhib E., Ternesa T., von Gunten U. (2008). Ozonation of reverse osmosis concentrate: Kinetics and efficiency of beta blocker oxidation. Wat. Res., 42, 3003 – 3012. Bozena M.T., Morawsky A.W. (2005). Removal of micropollutants from water by ozonation/biofiltration process. Desalination, 182 (1–3) 51–157. Carballa M., Omil F., Lema J.M., Llompart M., García-Jares C., Rodríguez I., Gómez M. (2004). Ternes T., Behavior of pharmaceuticals, cosmetics and hormones in a sewage treatment plant. Water Res., 38, 2918-2926. Chandrakanth M.S., Amy G.L. (1998). Effects of NOM source variations and calcium complexation capacity on ozone-induced particle destabilization. Water Res., 32, 115–124. EC (2000). Directive of the European Parliament and of the Council 2000/60/EC establishing a framework for community action in the field of water policy, Official Journal, C513, 23/10/2000. Gagné F., Blaise C., André C. (2006). Occurrence of pharmaceutical products in a municipal effluent and toxicity to rainbow trout (Oncorhynchus mykiss) hepatocytes, Ecotoxicol. Environ. Saf., 64, 329-336. Gogate P.R., Pandit A.B. (2004). A review of imperative technologies for wastewater treatment I: oxidation technologies at ambient conditions. Adv. Environ. Res., 8, 501-551. Gómez M.L., Martínez M.J, Lacorte S., . Fernández-Alba A.R, Agüera A. (2007). Pilot survey monitoring pharmaceuticals and related compounds in a sewage treatment plant located on the Mediterranean coast. Chemosphere, 66, 993-1002. Guidelines for Water Reuse EPA/625/R-04/108 (2004). Environmental Protection Agency, US EPA, U.S., Agency for International Development Washington, DC. Ikehata K., Naghashkar N.J., El-Din M.G. (2006). Degradation of aqueous pharmaceuticals by ozonation and advanced ozonation processes: A review. Ozone Sci. Eng., 28, 353-414. Kepa U., Stanczyk-Mazanek E., Stepniak L. (2008). The use of the advanced oxidation process in the ozone + hydrogen peroxide system for the removal of cyanide from water. Desalination, 223, 187–193 Kishimoto N., Morita Y., Tsuno H., Oomura T., Mizutani H. (2005). Advanced oxidation effect of ozonation combined with electrolysis. Wat. Res., 39, 4661 – 4672. Lafi W. K., Al-Qodah Z. (2006). Combined advanced oxidation and biological treatment processes for the removal of pesticides from aqueous solutions. Journal of Hazardous Materials, 137, 489-497. Larson R.A. (1989). Biohazards of Drinking Water Treatment. Lewis Publishers/CRC Press, Boca Rarton. Martinez-Bueno M.J., Agüera A., Gómez M.J., Hernando M.D., García J.F., Fernández-Alba A.R. (2007). Application of Liquid Chromatography/Quadrupole-Linear Ion Trap Mass Spectrometry and Time-of-Flight Mass Spectrometry to the determination of pharmaceuticals and related contaminants in wastewater. Anal. Chem., 79, 9372-9384. Pei Xua, Janex M., Savoye P., Cockx A., Lazarova V. (2002). Wastewater disinfection by ozone: main parameters for process design. Wat. Res., 36, 1043–1055. Rakness K.L., Demers L.D., Blank B.D., Henry D.J. (1996). Gas phase ozone concentration comparisons from a commercial UV meter and KI wet-chemistry tests. Ozone Sci. Eng., 18, 231-249. Rischbieter E., Stein H., Shumpe A. (2000). Ozone Solubilities in Water and Aqueous Salt. J. Chem. Eng. Data, 45, 338-340. Roberts P.H., Thomas K.V. (2006). The occurrence of selected pharmaceuticals in wastewaters effluent and surface waters of lower Tyne catchment. Sci. Total Environ., 356 143–153. Rosal R., Rodrıguez A, Perdigon-Melon J.A., Petre A., Garcıa-Calvo E. (in press doi: 0.1016/j.cej.2008.11.019). Oxidation of dissolved organic matter in the effluent of a sewage treatment plant using ozone combined with hydrogen peroxide (O3/H2O2). Cem. Eng. J. Ternes T.A. (1998). Occurrence of drugs in German sewage treatment plants and rivers. Water Res., 32, 3245–3260. van der Graaf J.H.J.M., de Koning J., Ravazzini A.M., Miska V. (2005). Treatment matrix for reuse of upgraded wastewater. Water Sci. Technol.: Water Supply, 5, 87–94.
10
Yang C., Xu Y.R., Teo K.C., Goh N.K., Chia L.S., Xie R.J. (2005). Destruction of organic pollutants in reusable wastewater using advanced oxidation technology. Chemosphere, 59, 441-445.