The analysis of fat-soluble vitamins in dairy cow milk by ...
Bovine milk TGF-β2, IGF-I and insulin in indirect heat treatments and
filtration processes
Pia Ollikainen
Valio Ltd. Research and Development
and
Division of Biochemistry and Biotechnology
Department of Biosciences
Faculty of Biological and Environmental Sciences
University of Helsinki
ACADEMIC DISSERTATION
To be presented for public examination with the permission of the Faculty of Biological and
Environmental Sciences of University of Helsinki in Auditorium 1041, Biokeskus 2, Viikinkaari
5, Helsinki on 15th February 2013, at 12 noon.
Helsinki 2013
Supervisors
Dr. Matti Harju Research and Development Valio Ltd. Helsinki, Finland
Dr. Olli Tossavainen Research and Development Valio Ltd. Helsinki, Finland
Thesis advisory Committee
Professor Riitta Korpela Institute of Biomedicine University of Helsinki Helsinki, Finland
Dr. Tuomas Haltia Department of Biosciences University of Helsinki Helsinki, Finland
Reviewers
Professor Hannu J. Korhonen Biotechnology and Food Research MTT Agrifood Research Finland Jokioinen, Finland
Professor Yves Pouliot STELA Dairy Research Center Universite’ Laval Quebec, Canada
Opponent
Professor Ulrich Kulozik ZIEL Research Center for Nutrition and Food Sciences Technical University of Munich Munich, Germany
Custos
Professor Kari Keinänen Division of Biochemistry and Biotechnology Department of Biosciences University of Helsinki Helsinki, Finland
Cover: …and cows fly! Maria Ollikainen, 2013
ISBN 978-952-10-8570-3 (paperback)
ISBN 978-952-10-8571-0 (PDF)
Unigrafia
Helsinki 2013

Iucundi acti labores
Cicero
Contents
List of publications and the author’s contributions in the publications
List of abbreviations
Abstract
Tiivistelmä
1. Introduction ..................................................................................................................................... 1
2. Literature review ................................................................................................................................. 1
2.1. Milk proteins ................................................................................................................................ 1
2.1.1. Major milk proteins ............................................................................................................... 1
2.1.2. Minor milk proteins ............................................................................................................... 2
2.2. Transforming growth factor-β (TGF-β) ......................................................................................... 3
2.2.1. The TGF-β family ................................................................................................................... 3
2.2.2. The structure of TGF-β .......................................................................................................... 4
2.2.3. TGF-β binding proteins .......................................................................................................... 4
2.2.4. Activation of TGF-β ................................................................................................................ 5
2.3. Insulin-like growth factor I (IGF-I) ................................................................................................ 7
2.3.1. The IGF family ........................................................................................................................ 7
2.3.2. The structure of IGF-I ............................................................................................................ 7
2.3.3. IGF binding proteins .............................................................................................................. 8
2.3.4. Activation of IGF-I .................................................................................................................. 9
2.4. Bovine insulin ............................................................................................................................. 10
2.5. Analysis of TGF-β and IGF-I ......................................................................................................... 11
2.5.1. Bioassays ............................................................................................................................. 11
2.5.2. Immunochemical methods .................................................................................................. 12
2.6. TGF-β2 and IGF-I in bovine milk ................................................................................................. 14
2.6.1. Analysis of TGF-β and IGF-I from bovine milk ..................................................................... 14
2.6.2. TGF-β2 and IGF-I concentrations in milk and in colostrum ................................................. 15
2.6.3. Effects of heat treatments on TGF-β and IGF-I in milk ........................................................ 16
2.6.4. Separation and concentration of TGF-β and IGF-I from milk .............................................. 18
2.6.4.1. Chromatographic separations .......................................................................................... 18
2.6.4.2. Membrane filtrations ....................................................................................................... 20
2.7. Physiological effects of IGF-I and TGF-β2 in milk ....................................................................... 22
2.7.1. IGF-I and linear growth ........................................................................................................ 22
2.7.2. TGF-β2 and growth .............................................................................................................. 24
2.8. Survival of TGF-β2 and IGF-I in digestion ................................................................................... 26
3. Aims of the study ............................................................................................................................... 29
4. Materials and methods ..................................................................................................................... 30
4.1. Origin and preparation of milk samples ..................................................................................... 30
4.2. Heat-stability experiments with growth factors and insulin (I, II, IV). ....................................... 30
4.2.1. Casein precipitation and whey separation .......................................................................... 32
4.2.2. Casein and whey separation by ultracentrifugation ........................................................... 32
4.3. Follow-up studies of the heat stability experiments .................................................................. 32
4.3.1. TGF-β2 analysis from cheese (I) .......................................................................................... 32
4.3.2. Determination of optimal heating time for IGF-I activation (II) .......................................... 32
4.3.3. Study of interfering proteins in IGF-I analysis (II) ................................................................ 33
4.3.4. Comparison of acid-ethanol extraction and heating as pre-treatments for IGF-I analysis (II) ....................................................................................................................................................... 33
4.4. Growth factor distribution during microfiltration and ultrafiltration with non-pasteurized and pasteurized milk (III and IV) ............................................................................................................... 33
4.4.1. Microfiltration equipment and procedures ........................................................................ 35
4.4.2. Ultrafiltration equipment and procedures .......................................................................... 35
4.5. Gastric-duodenal in vitro digestion of milk samples (unpublished experiment) ....................... 35
4.6. Chemical analyses ...................................................................................................................... 36
4.6.1. Immunochemical TGF-β2 analysis ( I and III and section 5.9) ............................................. 36
4.6.2. Immunochemical IGF-I analysis (II and IV and section 5.9) ................................................. 36
4.6.3. Immunochemical insulin analysis (IV) ................................................................................. 37
4.6.4. Other chemical analyses...................................................................................................... 37
4.7. Standards used for validation..................................................................................................... 37
4.8. Calculations (III and IV) ............................................................................................................... 38
4.9. Statistical analysis ....................................................................................................................... 38
5. Results and discussion ....................................................................................................................... 39
5.1 Heat stability of TGF-β2, IGF-I and insulin (I, II, IV) ..................................................................... 39
5.2. Heat-induced changes in the immuno-detectability of TGF-β2 and IGF-I (I, II) ......................... 39
5.3. Growth factor separation to casein and whey fractions (I, II).................................................... 41
5.4. TGF-β2 during cheese-making (I) ............................................................................................... 42
5.5. Determination of optimal heating time for IGF-I activation (II) ................................................. 42
5.6. Interfering proteins in IGF-I analysis (II) ..................................................................................... 43
5.7. Comparison of acid-ethanol extraction and heating as pre-treatment methods for analysis of IGF-I (II) .............................................................................................................................................. 43
5.8. Distribution of growth factors and bovine insulin during fractionation of pasteurized and non-pasteurized milk using microfiltration and ultrafiltration (III, IV) ..................................................... 44
5.8.1. Distribution of TGF-β2 (III) ................................................................................................... 44
5.8.2. Distribution of IGF-I (IV) ...................................................................................................... 45
5.8.3. Distribution of bovine insulin (IV) ....................................................................................... 45
5.9. Gastric-duodenal digestion of milk samples in vitro (unpublished results) ............................... 47
6. Conclusions and future directions ..................................................................................................... 50
Acknowledgements ............................................................................................................................... 52
References ............................................................................................................................................. 53
Appendices Publications (I – IV)
List of publications and the author’s contributions in the publications
The present thesis is based on the following publications, which are referred to in the text by their
Roman numerals I – IV.
I. Pia Ollikainen, (2011). Activation of transforming growth factor-β2 in bovine milk during indirect
heat treatments. International Dairy Journal, 21, 921-925.
II. Pia Ollikainen and Anne-Maria Riihimäki, (2012). Effects of heat treatment on insulin-like growth
factor-1 in bovine milk. International Dairy Journal, 23, 73-78.
III. Pia Ollikainen, Klaus Muuronen and Reetta Tikanmäki, (2012). Effect of pasteurization on the
distribution of bovine milk transforming growth factor-β2 in casein and whey fractions during micro-
and ultrafiltration processes. International Dairy Journal, 26, 141-146.
IV. Pia Ollikainen and Klaus Muuronen, (2013). Determination of Insulin-like growth factor-1 and
bovine insulin in raw milk and its casein and whey fractions after microfiltration and ultrafiltration.
International Dairy Journal, 28, 83-87.
The thesis also includes unpublished results, Figure 9b and section 5.9.
The original articles were reprinted with the permission of the original copyright holder.
The author’s contribution in the appended publications:
I. Pia Ollikainen planned the research and tests, interpreted the results and wrote the manuscript.
II. Pia Ollikainen planned the tests and processed the results and interpreted them in cooperation
with Anne-Maria Riihimäki. Pia Ollikainen wrote the manuscript.
III. Pia Ollikainen planned the tests and processed the results, which were interpreted with Klaus
Muuronen and Reetta Tikanmäki. Klaus Muuronen and Reetta Tikanmäki set up the filtration system
and ran the equipment. Klaus Muuronen participated in writing the manuscript together with Pia
Ollikainen.
IV. Pia Ollikainen planned the tests and processed the results, which were interpreted with Klaus
Muuronen. Klaus Muuronen set up the filtration system and ran the equipment. Pia Ollikainen wrote
the manuscript.
List of abbreviations
α-la alpha-lactalbumin
ACS American Chemical Society
AE acid-ethanol
ALS acid labile subunit
ANOVA analysis of variance test
AutoDELFIA automatic immunoassay system
BALB/c3T3 a special cell line for bioassay originated from an albino mouse
BMSs bone morphogenetic proteins
β-lg beta-lactoglobulin
BSA bovine serum albumin
BTC betacellulin
Da Dalton
DF diafiltration
DNA deoxyribonucleic acid
DSS dextran sodium sulphate
ECLIA electrochemiluminesce immunoassay
EGF epidermal growth factor
ELISA enzyme-linked immunosorbent assay
ECM extracellular matrix
FGF1, FGF2 fibroblast growth factors 1 and 2
HPLC high pressure liquid chromatography
IgA immunoglobulin A
IGFBP 1 – 6 IGF-binding protein 1, 2 – 6
IGF-I, IGF-II insulin-like growth factors 1 and 2
IgG immunoglobulin G
KIRA kinase receptor activation assay
L6 myoblasts a special cell line for bioassay
LAP latency-associated peptide
Lf lactoferrin
LL-TGF-β large latent TGF-β
LPS lipopolysaccharide
LTBP latent TGF-β binding protein
MF microfiltration
MGF milk growth factor
Mv-1-Lu/CCL-64) a special mink lung epithelial cell line for bioassay
MW molecular weight
N nitrogen
NHANES National Health and Nutrition Examination Survey
NIBSC/WHO National Institute for Biological Standards and Control, World Health
Organization
NPN non-protein nitrogen
NRK normal rat kidney
PAI-I plasminogen activator inhibitor-1
PDGF platelet-derived growth factor
RIA radioimmunoassay
RP-HPLC reversed phase high pressure liquid chromatography
RRA radioreceptor assays
RTK tyrosine kinase receptor
S sulphur
SDS-PAGE sodium dodecyl sulphate polyacryl amide gel electrophoresis
-SH sulphydryl
SL-TGF-β small latent TGF-β
-S-S-bridge disulphide bridge
TGF-β1, TGF- β2, TGF-β3 transforming growth factors beta 1, beta 2 and beta 3
TMP transmembrane pressure
TR-IMFA time-resolved immuno-fluorescence assay
U enzyme activity unit
UF ultrafiltration
UTMP uniform transmembrane pressure mode
VCF volumetric concentration factor
WPC whey protein concentrate
WPI whey protein isolate
Abstract
Bovine milk is a rich source of nutrients, such as protein, fat, carbohydrate, minerals and vitamins. In
addition to the major protein components of casein and whey proteins, milk has low concentrations
of compounds with bioactivity, growth factors and insulin. Insulin-like growth factor I (IGF-I) and
transforming growth factor-β2 (TGF-β2) are the most studied because of their various growth-
promoting activities and the possibility to use them as bioactive supplements in foodstuffs.
In the present work heat-stability and separation of IGF-I, TGF-β2 and insulin were studied using
ELISA immunoassay. Milk from a dairy farm was heat-treated at 65, 72, 90 or 135⁰C for 15 s using an
indirect pilot heating processor. Both IGF-I and TGF-β2 showed good heat stability up to 90⁰C, but at
135⁰C both growth factors had lost most of their immunochemical activity. Heating also activated the
latent forms of IGF-I and TGF-β2 to immunoreactive form, which was possible to analyse without any
separate pre-treatment. Heat-activation of TGF-β2 was temperature-dependent and at 90⁰C all the
TGF-β2 concentration was activated by heat. IGF-I was less sensitive, but at 90⁰C it showed a sharp
increase in immunoreactivity. Heating as a pre-treatment method was introduced as a new method
to analyse and compare IGF-I concentrations in samples with no or low whey protein concentrations.
When heat-treated milks were separated to casein and whey fractions by acid, ultracentrifugation or
membrane filtration, the heat-activated immunoreactive form of the growth factor followed the
casein fraction and the latent form remained in whey.
Bovine insulin was heat stable during pasteurization at 65 and 72⁰C, but lost some of its
immunochemical activity at higher temperatures. During membrane filtration a higher share of
insulin was concentrated in MF retentate than in UF retentate when compared to IGF-I.
An in vitro digestion experiment was performed in order to compare the digestibility of the latent
and active forms of TGF-β2. In the adult model TGF-β2 was hydrolysed in gastric phase, but in the
infant model a small share of TGF-β2 survived the gastric and duodenal phases. There was no
difference in survival or digestibility between the latent or active forms of the growth factor. The
digestibility of IGF-I was tested in the infant model and this growth factor was hydrolysed during
duodenal phase.
The results obtained in this study have great importance when separating and concentrating the
growth factors from milk or colostrum. If the separation and concentration is performed from whey,
these results show that the heating history of milk has a great effect on the yields. The results also
demonstrate that heating as a pre-treatment method and membrane filtration can be used to lead
growth factors to different fractions, depending on the intended usage.
Tiivistelmä
Lehmän maito sisältää runsaasti ravintoaineita, kuten proteiinia, rasvaa, hiilihydraatteja, mineraaleja
ja vitamiineja. Tärkeimpien maidon proteiinikomponenttien, kaseiinin ja heraproteiinien lisäksi
maidossa on pieninä konsentraatioina bioaktiivisia yhdisteitä, kasvutekijöitä ja insuliinia. Insuliinin
kaltainen kasvutekijä I (IGF-I) ja transformoiva kasvutekijä β2 (TGF-β2) ovat eniten tutkittuja, koska
niillä on kasvua edistäviä vaikutuksia ja niitä on mahdollista käyttää bioaktiivisina komponentteina
elintarvikkeissa.
Tässä työssä tutkittiin IGF-I:n ja TGF-β2:n lämpökestävyyttä ja erottamista käyttäen immunologista
ELISA-menetelmää. Tilamaitoa lämpökäsiteltiin 65, 72, 90 tai 135 C:ssa 15 s ajan käyttäen
kuumennukseen epäsuoraa pilot-kuumennuslaitteistoa. Sekä IGF-I että TGF-β2 olivat
lämmönkestäviä 90 C:een saakka, mutta 135 C:ssa ne menettivät suurimman osan
immunologisesta aktiivisuudestaan. Lämpökäsittely aktivoi IGF-I:n ja TGF-β2:n latentit muodot
immunologisesti aktiiviksi muodoiksi, mikä mahdollisti niiden analysoinnin ilman erillistä
esikäsittelyä. TGF-β2:n aktivoituminen oli riippuvainen lämpötilasta ja 90 C kaikki kasvutekijä oli
aktivoituneina. IGF-I ei ollut yhtä herkkä lämmölle, mutta 90 C:ssa senkin aktiivisuus kasvoi
merkittävästi. Ensi kertaa osoitettiin, että lämpökäsittelyä voidaan käyttää esikäsittelymenetelmänä
verratessa pieniä IGF-I-pitoisuuksia samankaltaisista näytteistä, joissa on alhainen
heraproteiinipitoisuus.
Kun lämpökäsitelty maito jaettiin kaseiini- ja herafraktioihin käyttäen happoa, ultrasentrifugointia tai
membraanisuodatusta, kasvutekijän lämpöaktivoitunut immunoreaktiivinen muoto siirtyi
kaseiinifraktioon kun taas latentti muoto jäi heraan.
Naudan insuliini kesti 65 ja 72 C 15 s lämpökäsittelyn, mutta menetti osan immunologisesta
aktiivisuudestaan korkeammissa lämpötiloissa. Membraanisuodatuksessa suurempi osa insuliinista
jäi MF retentaattiin kuin UF retentaattiin kun tulosta verrattiin IGF-I:n konsentroitumiseen.
Työssä tehtiin in vitro digestiokoe, jossa verrattiin latentin ja aktiivisen TGF-β2:n digestiota.
Aikuismallissa TGF-β2 hydrolysoitui mahassa, mutta imeväismallissa osa kasvutekijästä säilyi sekä
maha- että suolivaiheessa. Tulos oli sama kasvutekijän latentilla ja aktiivisella muodolla. IGF-I
digestiokoe tehtiin vain imeväismallissa ja tämä kasvutekijä digestoitui suolivaiheessa.
Tässä työssä saaduilla tuloksilla on suuri merkitys kun kasvutekijöitä eristetään tai konsentroidaan
maidosta tai ternimaidosta. Jos eristäminen ja konsentrointi tehdään herasta, tutkimustulokset
osoittavat, että maidon saamalla lämpökäsittelyllä on suuri vaikutus saantoon. Tulokset osoittivat
myös, että lämpökäsittelyä esikäsittelymenetelmänä ja membraanisuodatusta voidaan käyttää
ohjaamaan kasvutekijöitä haluttuihin fraktioihin riippuen siitä, miten niitä halutaan käyttää.
1
1. Introduction
Milk secretion is characteristic to all mammalian species. The name “mammalia” was given by
Carolus Linnaeus (Carl von Linné) in 1758 to unite all species which have mammary glands (Latin
mamma = teat (Oftendal, 2012). Lactation provides all nutrients to offspring because the diet of the
adult mammal is too specialized or too difficult to capture or to digest (Oftedal, 2012). The
composition of milk varies with the species, the breed, health, nutritional status, stage of lactation,
age, etc. (Fox and McSweeney, 1998). The protein content in milk is directly related to the growth
rate of the young of that species and varies from about 1% to 24%, reflecting the requirements of
protein for growth (Fox and McSweeney, 1998).
Bovine milk has been used for human nutrition for at least about 8000 years. The main purpose has
been to provide nutrition for offspring, because bovine milk is a rich source of fatty acids,
carbohydrates and proteins, vitamins and minerals. Milk is an unusual food with bioactive properties,
but also contains nutrients that are not unique to milk. Milk is a potent stimulator of growth in vivo
and in vitro (Donovan and Odle, 1994).
2. Literature review
2.1. Milk proteins
2.1.1. Major milk proteins
The protein content of bovine milk is about 3.5%. Milk protein is not a single protein, but consists of
several different proteins. The major milk protein is casein, which comprises about 80% of the total
protein content. Casein is defined as the part of milk protein which precipitates at pH 4.6 (Fox and
McSweeney, 1998). The 20% of protein which remains soluble, is called whey proteins. Casein has
also been considered as a nutrient protein, while whey proteins are biologically active (Fox and
McSweeney, 1998).
Casein consists of several different forms, which were named after their electrophoretic mobility. αs1-
and αs2 –caseins account for 37% and 10% of the milk casein, respectively. β-Casein accounts for
about 35% and κ-casein for about 12% of whole casein (Fox and McSweeney, 1998). γ-Caseins have
also been recognized from milk, but these are the products of the β-casein cleavage by the
indigenous proteolytic enzyme, plasmin (EC 3.4.21.7.) (Kelly et al., 2006).
Caseins are quite small proteins with molecular weights of about 20 -25 kDa (Fox and McSweeney,
1998). The heterogeneity of major milk proteins increases due to several genetic variants. Casein
molecules are relatively hydrophobic molecules. They have a high proline content, which results in a
very low content of α-helix and β-sheet structures (Fox and McSweeney, 1998). All the caseins are
phosphorylated with the result that they bind calcium strongly. This affects the stability of the
2
molecules, and makes caseins very heat stable (Fox and McSweeney, 1998). In cold storage β-casein
dissociates from the micelle (Klostermeyer and Reimerdes, 1976)
The casein molecules are arranged into a micellar stucture, which has a diameter of about 120 nm
and a molecular weight of 106 - 109 Da. The different casein molecules are arranged so that the
hydrophobic β-casein is inside the molecule, the hydrophilic α-caseins are outside and κ-casein forms
the core. The micelle has a negative net charge, which keeps the micelles soluble when they are
repulsing each other (Fox and McSweeney, 1998).
Whey proteins consist of two major components, α-lactalbumin and β-lactoglobulin. β-Lactoglobulin
is the major component comprising about 50% of whey proteins and 12% of total milk proteins while
α-lactalbumin accounts for about 20% of whey proteins and 3.5% of the total milk proteins. Whey
proteins are globular proteins, with high levels of secondary and tertiary structures. The proteins
contain sulphydryl/disulphide residues, which make them very sensitive to denaturation by heat
treatments (Dalgleish, 1990; Lowe et al., 2004). The molecular weight of the β-lactoglobulin
monomer is 18 kDa and that of α-lactalbumin is 14 kDa (Fox and McSweeney, 1998).
2.1.2. Minor milk proteins
Besides the major proteins, bovine milk has several components which are present in much lower
concentrations, mainly in the whey fraction. These include such as bovine serum albumin (BSA),
lactoferrin (Lf), immunoglobulins (Igs), hormones, enzymes and growth factors (Table 1).
Growth factors are peptides which carry signals providing the basis for intracellular communication
in multicellular organisms. They stimulate growth and differentiation of mammalian cells, but they
are also inhibitors; in general they regulate cellular functions. Growth factors act by binding to
functional receptors which transduce their signals (Sporn and Roberts, 1988).
Growth factors in milk are either synthesized in the mammary gland de novo or transported from
blood (Campbell and Baumrucker, 1989; Campbell et al.,1991). Several growth factors are found in
bovine milk and colostrum such as epidermal growth factor (EGF) (Iacopetta et al., 1992), betacellulin
(BTC) (Bastian et al., 2001), insulin-like growth factors 1 and 2 (IGF-I, IGF-II) and transforming growth
factor betas 1 and 2, (TGF-β1, TGF-β2) (Jin, et al., 1991; Tokuyama and Tokuyama, 1993; Rogers et
al., 1996; Belford et al., 1997), fibroblast growth factors 1 and 2 (FGF1, FGF2) (Hironaka et al., 1997)
and platelet-derived growth factor (PDGF) (Shing and Klagsbrun, 1987; Belford et al., 1997). The
growth factor concentrations are highest in the first milk after parturition and decline rapidly
thereafter (Ginjala and Pakkanen, 1998; Pakkanen, 1998; Purup et al., 2007, Montoni et al., 2009).
Human milk is rich in growth factors, which has provided the impetus to study the importance of
these components in bovine milk. The concentrations of growth factors in human milk are highest
after parturition and decrease gradually during lactation, but at least 3 months after parturition there
are physiologically relevant concentrations breast-fed infants (Donovan and Odle, 1994; Hawkes et
al., 1999). It is probable that human milk TGF-β has an important role in the prevention of
autoimmunity and anti-inflammatory processes at an early age, when the production of endogenous
3
TGF-β is very low (Lönnerdal, 2010). Mother’s milk can protect the epithelial surface of the intestine
and promote IgA production in infants (Ogawa et al., 2004)
Because of their high growth-promoting activity milk growth factors IGF-I and TGF-β2 have given rise
to commercial interest especially in sport nutrition, wound healing, treatment of Crohn’s disease and
psoriasis (Donnet-Hughes et al., 2000; Pouliot and Gauthier, 2006; Drouin et al., 2007; Crittenden et
al., 2009).
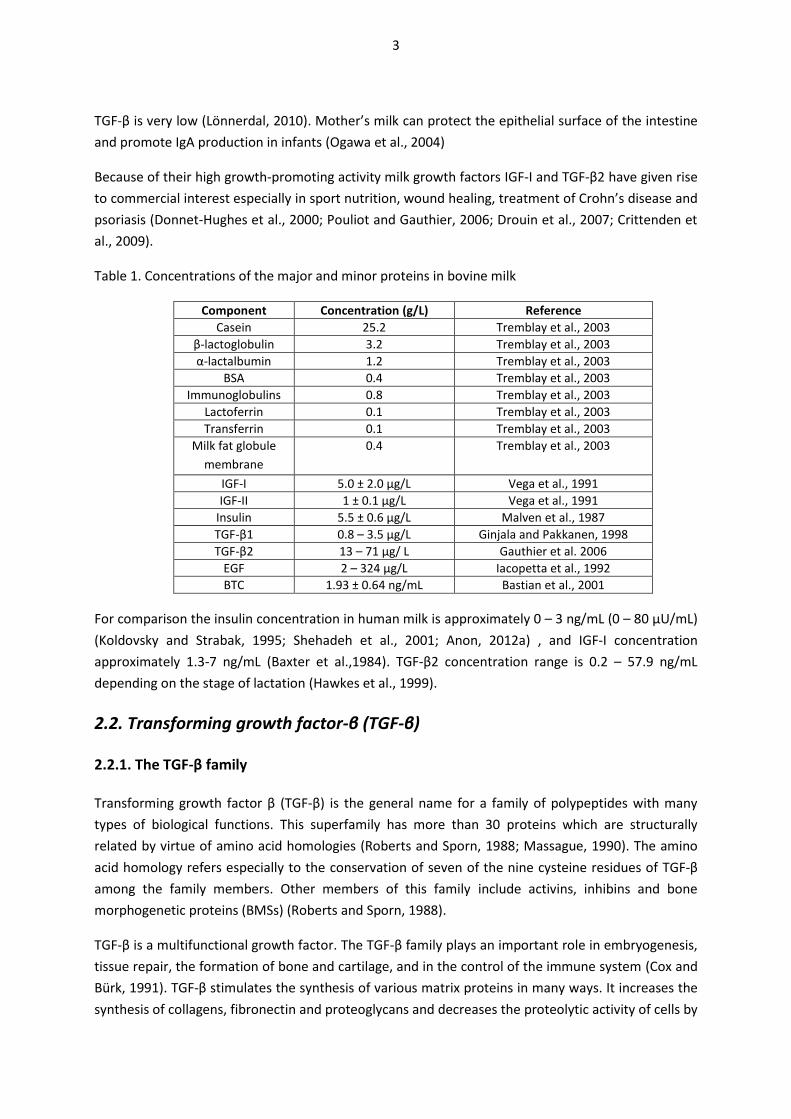
Table 1. Concentrations of the major and minor proteins in bovine milk
Component Concentration (g/L) Reference
Casein 25.2 Tremblay et al., 2003
β-lactoglobulin 3.2 Tremblay et al., 2003
α-lactalbumin 1.2 Tremblay et al., 2003
BSA 0.4 Tremblay et al., 2003
Immunoglobulins 0.8 Tremblay et al., 2003
Lactoferrin 0.1 Tremblay et al., 2003
Transferrin 0.1 Tremblay et al., 2003
Milk fat globule
membrane
0.4 Tremblay et al., 2003
IGF-I 5.0 ± 2.0 μg/L Vega et al., 1991
IGF-II 1 ± 0.1 μg/L Vega et al., 1991
Insulin 5.5 ± 0.6 μg/L Malven et al., 1987
TGF-β1 0.8 – 3.5 μg/L Ginjala and Pakkanen, 1998
TGF-β2 13 – 71 μg/ L Gauthier et al. 2006
EGF 2 – 324 μg/L Iacopetta et al., 1992
BTC 1.93 ± 0.64 ng/mL Bastian et al., 2001
For comparison the insulin concentration in human milk is approximately 0 – 3 ng/mL (0 – 80 µU/mL)
(Koldovsky and Strabak, 1995; Shehadeh et al., 2001; Anon, 2012a) , and IGF-I concentration
approximately 1.3-7 ng/mL (Baxter et al.,1984). TGF-β2 concentration range is 0.2 – 57.9 ng/mL
depending on the stage of lactation (Hawkes et al., 1999).
2.2. Transforming growth factor-β (TGF-β)
2.2.1. The TGF-β family
Transforming growth factor β (TGF-β) is the general name for a family of polypeptides with many
types of biological functions. This superfamily has more than 30 proteins which are structurally
related by virtue of amino acid homologies (Roberts and Sporn, 1988; Massague, 1990). The amino
acid homology refers especially to the conservation of seven of the nine cysteine residues of TGF-β
among the family members. Other members of this family include activins, inhibins and bone
morphogenetic proteins (BMSs) (Roberts and Sporn, 1988).
TGF-β is a multifunctional growth factor. The TGF-β family plays an important role in embryogenesis,
tissue repair, the formation of bone and cartilage, and in the control of the immune system (Cox and
Bürk, 1991). TGF-β stimulates the synthesis of various matrix proteins in many ways. It increases the
synthesis of collagens, fibronectin and proteoglycans and decreases the proteolytic activity of cells by
4
modulating the expression and secretion of proteases and their regulators including
metalloproteinases, plasmin, plasmin activators and plasminogen activator inhibitors (Keski-Oja et
al., 1987; Laiho et al., 1987; Roberts and Sporn, 1991; Saharinen et al., 1999). TGF-βs act as growth
inhibitors of some cells, e.g. lymphocytes and epithelial cells (Moses, 1992). TGF-β can also act in
bone remodeling. Osteoclastic activity can produce a locally acid, proteolytic environment which
would activate matrix-associated latent TGF-β. Once activated, this would inhibit new osteoclast
formation (Roberts and Sporn, 1991). TGF-βs also promote growth in pathological conditions; in
practice they either inhibit or promote cell action depending on the state of the cell (Hyytiäinen et
al., 2004)
2.2.2. The structure of TGF-β
Five different members of the TGF-β family have been recognized, TGF-β 1–5, which share 66 – 82%
sequence homology and nine strictly conserved cysteines (Cheifetz et al., 1987; Roberts and Sporn,
1988; Daopin et al., 1992). TGF-β1 - TGF-β3 have been cloned from mammalian tissues (Hyytiäinen et
al. 2004) and they display more than 98% sequence homology between species (Massague, 1990).
No mammalian TGF-β4 or 5 have been described (Massague, 1990).
TGF-βs 1 – 3 are 25 kDa proteins, which have two identical 12.5 kDa polypeptides and they are called
mature TGF-βs (Massague, 1990). TGF-β originates from a 55 kDa polypeptide, which dimerizes
shortly after synthesis (Gentry et al., 1988). After dimerization the protein is proteolyzed to yield a
mature growth factor and the N-terminal propeptide part. The N-terminal part is called latency-
associated peptide (LAP) and it remains non-covalently bound to the mature TGF-β (Koli et al., 2001).
This complex is called small latent TGF-β (SL-TGF-β) and it associates covalently with another protein,
latent TGF-β binding protein (LTBP), forming a large latent TGF-β (LL-TGF-β)(Koli et al., 2001).
The action of TGF-β is mediated through binding to specific cell membrane receptors. Three distinct
classes of integral cell membrane components bind TGF-β with high affinity (Roberts and Sporn,
1991). Type I and type II are glycoproteins with N-linked carbohydrates whereas the most abundant
type III is a proteoglycan called betaglycan (Boyd et al.1990; Massague, 1990). The role of betaglycan
is to introduce TGF-β to the receptors, which activate through serine/threonine kinase receptor
(Massagué, 1998; Hyytiäinen et al., 2004)
2.2.3. TGF-β binding proteins
Small latent TGF-β is disulphide-linked to one of its four binding proteins (LTBPs), forming a large
latent TGF-β (LL-TGF-β). LTBPs are glycoproteins with molecular weights of 120 – 220 kDa (Hyytiäinen
et al., 2004).
They all share structural similarities in comprising of N-terminal region, epidermal growth factor
repeats and eight cysteine repeats, and a proline-rich hinge region which is sensitive for proteolytic
clevage (Saharinen et al., 1999). IGFBPs have a central role in TGF-β secretion, folding of TGF-β and
localization to extracellular matrix (ECM). LTBPs have only partially overlapping expression patterns,
which suggest important functions in different tissues (Koli et al., 2001). SL-TGF-β2 is bound by
5
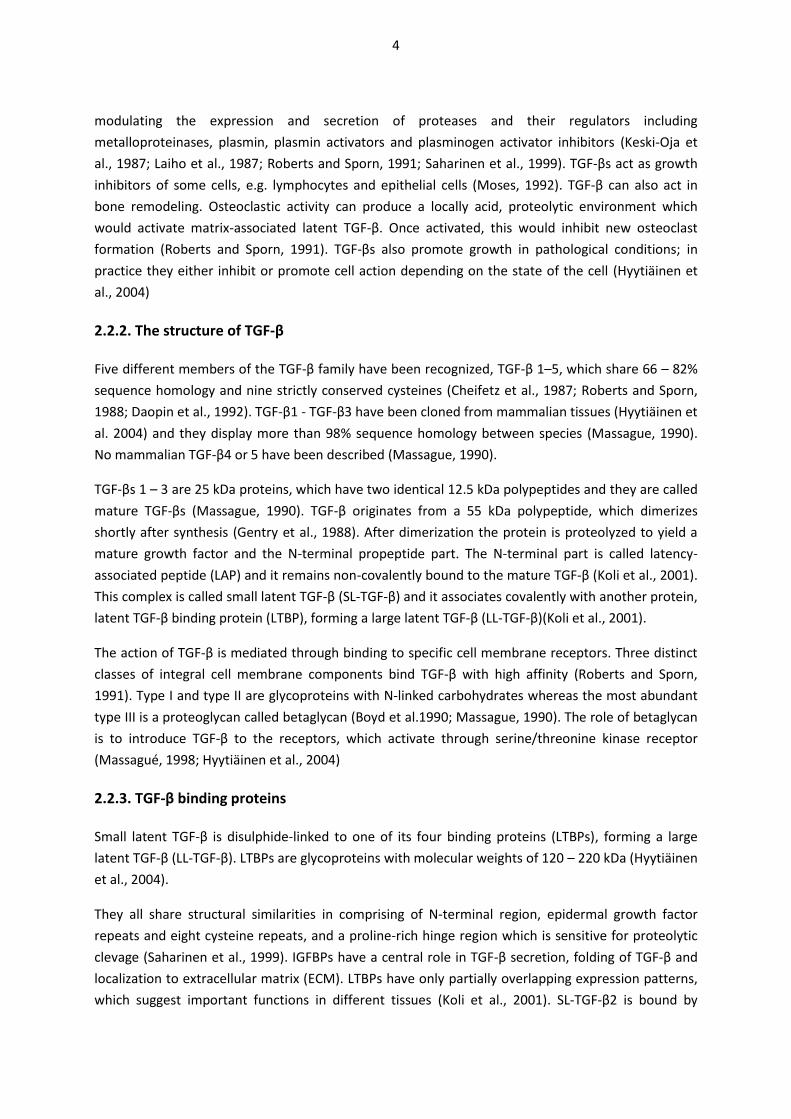
TGFBP-1 and 3 (Saharinen and Keski-Oja, 2000). When the LL-TGF-β is secreted from the cell, it binds
to ECM fibers (Koli et al., 2001). LL-TGF-β is illustrated in Figure 1.
Figure 1. Schematic representation of the large latent TGF-β complex. The small latent complex
contains the C-terminal of mature TGF-β and its N-terminal pro-domain, LAP (latency associated
peptide). This complex forms a disulphide-bonded complex with the third 8-Cys repeat of LTBP
(latent TGF-βbinding protein). The hinge region is proline-rich and sensitive to proteolysis, (ECM =
extracellular matrix) (Koli et al., 2001).
2.2.4. Activation of TGF-β
The majority of TGF-β is in the latent form, and it is necessary for the latent form to convert to the
active form in vivo in order to exert its biological effects (Lyons et al., 1990). Latent TGF-β molecules
cannot bind to their cell surface receptors or mediate their effects (Koli et al., 2001). Latent TGF-β is
not detectable in the radioimmunoassay established using antibodies raised against native TGF-β
(Keski-Oja et al., 1987).
Activation of latent TGF- involves disruption of the non-covalent interaction between LAP and TGF-
by removal of the N terminal chains by changes in ionic strength, acidification or proteolytic
enzymes (Lyons and Moses, 1990; Gleizes et al., 1997; Saharinen et al., 1999).
6
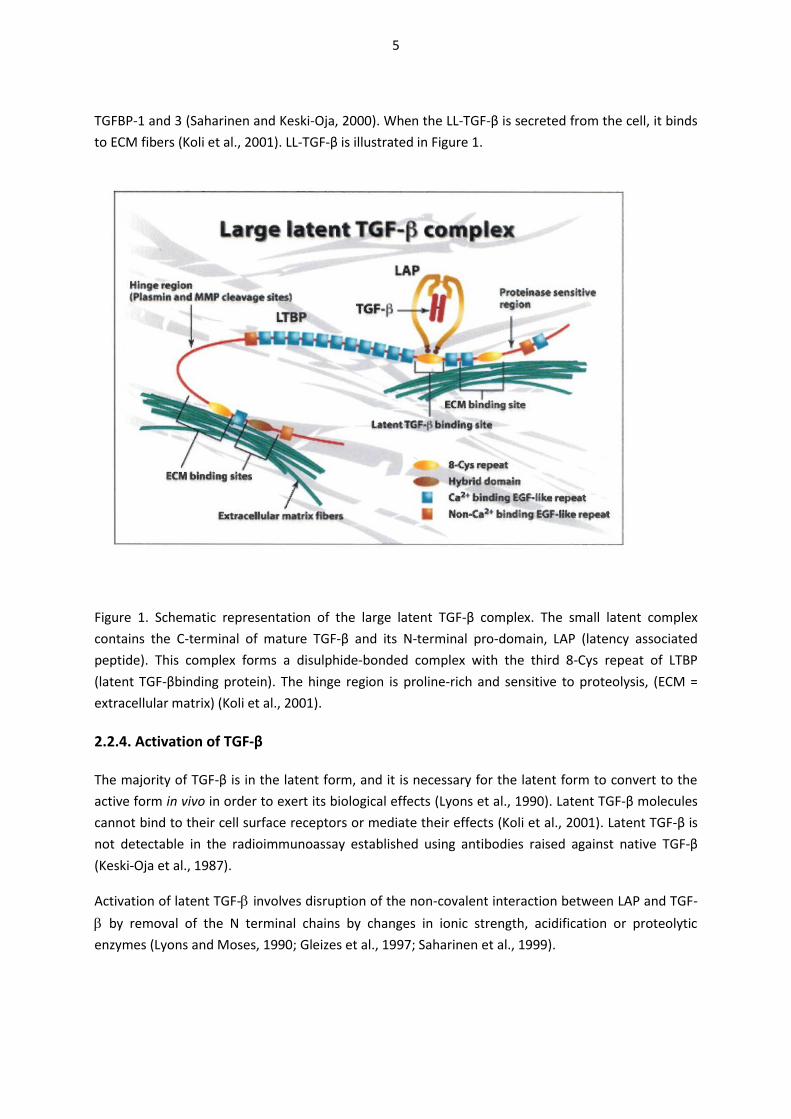
The activation of latent TGF-β2 is well known in vitro. Activation methods for latent forms of TGF-
include several non-enzymatic treatments, such as acidic or basic pH, heat treatment or urea
(Lawrence et al.,1985; Lyons et al., 1988; Brown et al., 1990).
The activation of latent TGF-β by acid is strongly increased with increasing acidity. pH 3.1 – 4.1 is the
optimum pH for activation of TGF-β1 and TGF-β2 (Brown et al., 1990). Active TGF-β can also be
obtained by alkaline treatment above pH 9; pH 11.0 – 11.9 is optimum for TGF-β1 and TGF-β2 (Brown
et al., 1990). Both acid and alkaline treatment needs a neutralization step before analysis. Once
activated by acidification the TGF-β can totally or partially reaggregate with larger molecules under
neutral conditions , without any major alteration of its activity (Lawrence et al., 1985).
Heating at 100⁰C for 3 minutes has been reported to be strongly activating as was exposure to 8 M
urea (Lawrence et al., 1985). Brown et al. (1990) found that complete activation of TGF-β1 was
obtained after heating to 70⁰C for 10 min, 75⁰C for 5 min or 89 – 90⁰C for 1 min. Thermal
denaturation was observed after 10 min heating at 80⁰C (Brown et al., 1990). Similar behaviour was
seen with TGF-β2, although it was more stable at 100⁰C (Brown et al., 1990). While comparing the
total activity of TGF-β1 after different activation methods, Brown et al. (1990) found that TGF-β1
activity was slightly lower after acid activation than after heat activation and the authors
recommended thermal activation as the method of choice for activating latent TGF-β.
Activation is also possible with the proteolytic enzymes plasmin or neuraminidase; plasmin-mediated
proteolysis by LAP digestion is the major mechanism (Miyazono and Heldin, 1989; Lyons et al., 1990).
The in vitro study of Brown et al. (1990) showed that the activation of TGF-β using these enzymes at
concentrations of 0.03 and 0.1 U/ml was about 15 – 20%. Lyons et al.(1988) found that plasmin was
able to activate about 30% of the total TGF-β concentration in a conditioned medium. The same
effect is observed with a mild acid treatment at pH 4.5. Lyons et al. (1988) proposed that there are
two activation steps: the first one is a mild activation by plasmin or mild pH and the second is
activation by lower pH. The first step is more obvious in cell cultures, and plasmin has been
suggested to be the physiological activator of TGF-β (Lyons et al., 1990).
Plasmin-mediated TGF-β activation is neutralized via feedback inhibition, since TGF-β induces the
production of plasminogen activator inhibitor-1 (PAI-1), which decreases the formation of active
plasmin (Laiho et al., 1987).
Once released from the latent complex, active TGF-β, if not associated rapidly with a cell signal
receptor, can be bound by various extracellular matrix components and serum proteins, such as type
IV collagen, fibronectin, betaglycan, αs2-macroglobulin (Wakefield et al., 1988) and IgG (Bouchard et
al.1995; Koli et al., 2001; Arandjelovic et al., 2003). The binding of activated TGF-β is very rapid (<3
min) (Coffey et al., 1987). High affinity binding of TGF-β to extracellular proteins protects TGF-β from
degradation, or might function as a long-term reservoir (Andres et al., 1989; Boyd et al., 1990;
Massague, 1990), since latent TGF-β has a longer half life than active TGF-β (Wakefield et al., 1990).
7
2.3. Insulin-like growth factor I (IGF-I)
2.3.1. The IGF family
The insulin-like family of peptides consists of four peptides, insulin-like growth factor-1 (IGF-I),
insulin-like growth factor-II, insulin and relaxin. (Donovan and Odle, 1994). They have all been found
in milk of various species (Donovan and Odle, 1994). The IGF system consists of the insulin-like
growth factors (IGF-I, IGF-II), the type I and type II IGF receptors, and six known IGF binding proteins,
IGFBP 1 – 6. The insulin-like growth factor is a member of the growth hormone dependent group of
hormones, which were previously known as somatomedin (Daughaday et al., 1972).
The role of IGF-I in vivo is to mediate the action of growth hormones on skeletal structures and it is
positively regulated by growth hormone (GH) (Rechler and Nissley, 1991; Hober et al., 1992). IGFs are
involved in cell proliferation and metabolism. They participate in the response to tissue injury in
nerve, muscle and endothelial cells. Locally produced IGFs and IGFBPs regulate tissue growth and
differentiation (Rechler and Nissley, 1991; Hober et al., 1992).
The in vivo role of IGF-II is less well understood. IGF-II is minimally growth hormone-dependent and it
has been associated with the fetus and embryo in early development, as well as with the nervous
system and brain (Rechler and Nissley, 1991).
Insulin-like growth factors and insulin perform apparently unique roles. They both act by causing
cellular hypertrophy, but there are different consequences. IGF is associated with cell survival,
hyperplasia and differentiation, whereas insulin enhances cell hypertrophy primarily as a means to
increase nutrient stores (McCusker, 1998).
2.3.2. The structure of IGF-I
Human insulin-like growth factor I (IGF-I) is a single chain peptide of 70 amino acids with three
disulphide bridges, originally isolated from serum (Rinderknecht and Humbel, 1978). Its calculated
molecular weight is 7649 Da (Rinderknecht and Humbel, 1978). The amino acid sequence of bovine
and porcine IGF-I is identical to that of human IGF-I (Francis et al., 1988). Rat and mouse IGF-I differ
from human IGF-I in three or four positions (Rechler and Nissley, 1991).
Insulin, IGF-I and IGF-II are closely related; three cysteine bonds stabilize very similar tertiary
structures (McCusker, 1998). IGF-I has a 49% homology with proinsulin. They share equal peptide
structures; amino acid positions 1 to 29 are homologous to insulin B chain and positions 42 to 62 to
insulin A chain (Rinderknecht and Humbel, 1978). IGF is about 50% larger than insulin in molecular
weight, because the mature insulin molecule lacks the C and D domains (McCusker, 1998).
The biological actions of IGF-I and –II are primarily mediated through two types of receptors. The
receptors are based on their relative ability to bind IGF-I or IGF-II and whether they recognize insulin
(Rechler and Nissley, 1991) . The type I IGF receptor is a tyrosine kinase receptor, which has higher
affinity to IGF-I than to IGF-II and it recognizes insulin but binds it only weekly. It has a binding
subunit of 130 kDa. Another 250 kDa receptor that binds IGF-II rather than IGF-I and does not
8
recognize insulin, is a single polypeptide without a subunit. This receptor is also called IGF-II receptor
or mannose-6-phosphate subunit (Rechler and Nissley, 1991).
IGF-I and insulin receptors are distinct, but they show high similarity (Rechler and Nissley, 1991).
Type I IGF receptors are generally found on cells that are capable of proliferation and differentiation.
Insulin receptors are found on cells that are responsible for nutrient storage. Many proliferative
component cells have more type I IGF receptors than insulin receptors (McCusker, 1998). Differences
are in the tertiary structures of IGF-I and insulin; IGF-I is unable to bind antibodies to insulin and
binds insulin receptor only with low affinity (Blundell et al. 1978).
2.3.3. IGF binding proteins
IGF-I has six binding proteins, of which IGF-binding protein-3 (IGFBP-3) is the most abundant in serum
and milk (Rosenfeld et al., 1994; Rajaram et al., 1997). The binding proteins differ significantly in their
biochemical characteristics, which accounts for many types of differences that have been observed in
their biological actions (Clemmons, 1997).
IGFBP 1 - 6 were named in the historical order in which they were recognized (Clemmons, 1997). The
most impressive similarity in structure among the IGFBPs is the conservation of the cysteine residues,
which varies from 14 to 20 (Rosenfeld et al., 1994). Disulphide bonding determines the IGF binding
site of each IGFBP (Rosenfeld et al., 1994). The principal carrier of IGF-I and II in serum is IGFBP-3,
which is synthesized in liver (Rechler and Nissley, 1991). IGFBP-3 binds 90-96% of IGF-I and II and its
molar concentration is usually almost equal to that of IGF-I and II combined (Clemmons, 1997).
IGF-I/IGFBP 3 is a complex molecule, which also binds an additional 85 kDa protein, termed acid
labile subunit (ALS). IGF-I/IGFBP 3 complex with ALS makes a 150 kDa ternary complex (Furlanetto,
1980; Baxter, 1988). Milk is the only physiological fluid other than serum that contains the 150 kDa
IGFBP-complex (Simmen et al. 1988; Rechler and Nissley, 1991). The role of this complex has been
proposed to be a reservoir of IGF, which prolongs the half lives of IGF-I and II and cannot leave the
bloodstream (Zapf et al. 1986). IGF-binding protein complexes are not recognized by IGF receptors
and are biologically inactive (Rechler and Nissley, 1991). If circulating IGF is biologically functional, a
mechanism is needed to allow IGF-I to leave the vascular space (Rechler and Nissley, 1991). IGFBPs
may also act independently in cellular metabolism and replication in the absence of IGF (Rosenfeld et
al., 1994).
IGFBPs bind IGF-I and II with very high affinity, between 2-50 fold greater affinity than the IGF-I
receptor (Clemmons, 1997). IGFBPs modulate the action of IGFs in several ways including an
inhibitory model in which IGFBPs sequester IGFs from their receptors and an enhancing model in
which IGFBPs transport IGFs to their site of action (Lalou et al. 1994). The molar ratio of IGF-I to
IGFBP-3 may reflect free, biologically active IGF-I in circulation (Juul, 2003). The modulation of IGF
levels by IGFBPs is further regulated by IGFBP proteases, which cleave the high affinity IGFBPs into
fragments with lower affinity for IGFs, thereby increasing free IGF bioavailability (Lalou et al. 1994).
9
In addition to ALS, IGFBP-3 is also able to bind heparin-containing molecules of extracellular matrix
(Fowlkes and Serra, 1996). Baumrucker et al. (2003) demonstrated that lactoferrin also binds IGFBP-
3. Lactoferrin is a highly positively charged iron-binding glycoprotein of milk origin (Baumrucker and
Erondu, 2000). Enhanced production of lactoferrin will free IGFs from their association of IGFBP-3 in
the extracellular matrix and it is involved in the regulation of the IGF system (Baumrucker and
Erondu, 2000). Decrease in Lf concentration will provide an environment that allows the binding of
IGF-I and IGFBP-3 and thus reduces growth signal (Baumrucker et al., 2003).
Several factors can affect the IGF-IGFBP interaction in vitro, such as ionic strength and pH (Baxter,
2001). IGF binding has a broad pH optimum between 4.0 – 5.5, whereas binding is greatly inhibited at
pH 7.4 (Baxter, 2001). The IGF-system is illustrated in Figure 2.
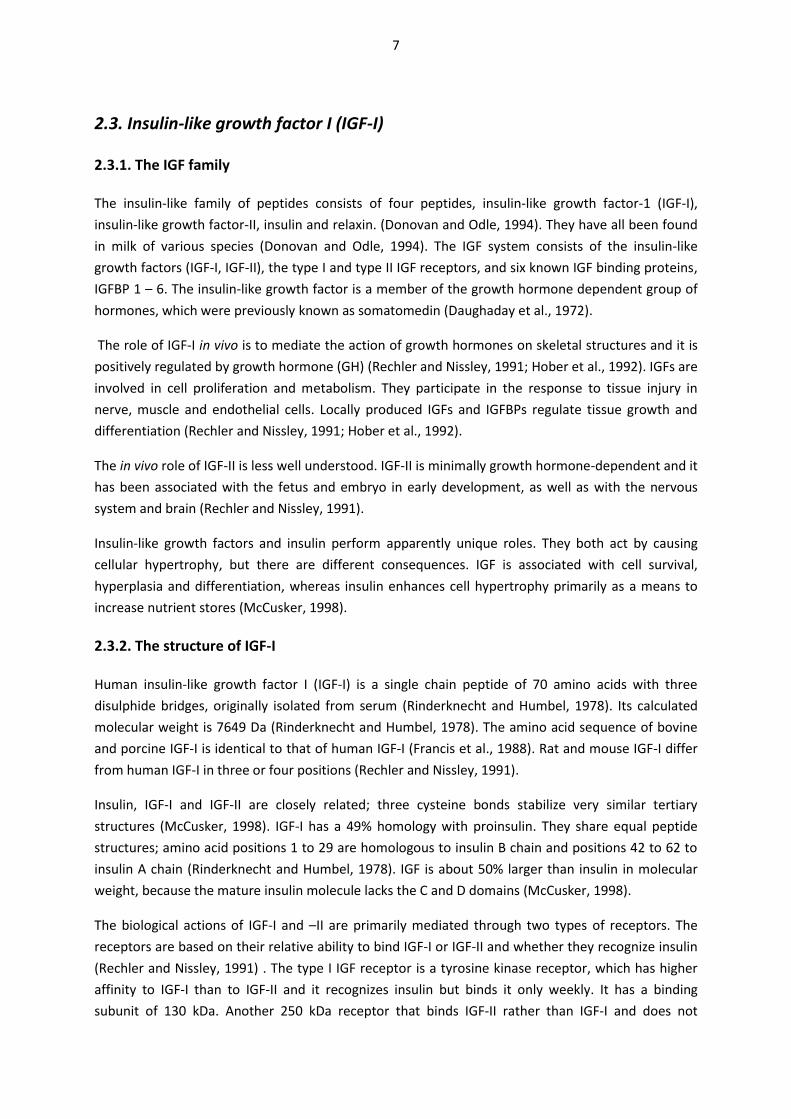
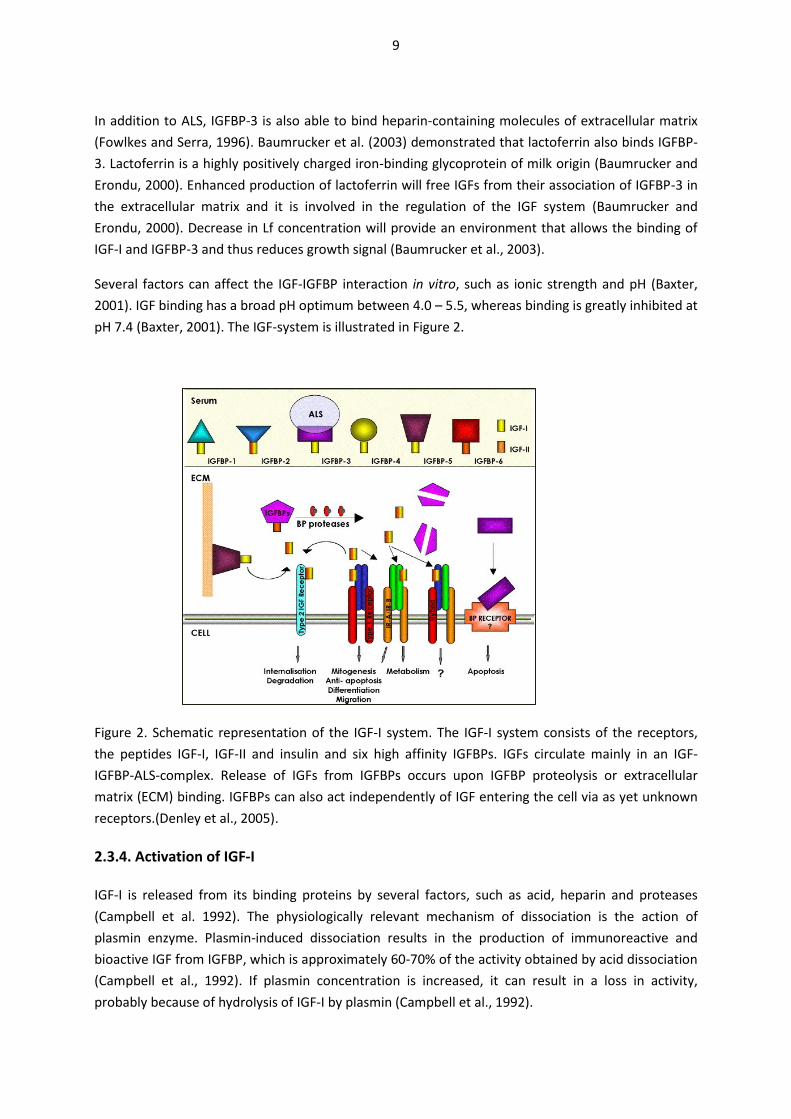
Figure 2. Schematic representation of the IGF-I system. The IGF-I system consists of the receptors,
the peptides IGF-I, IGF-II and insulin and six high affinity IGFBPs. IGFs circulate mainly in an IGF-
IGFBP-ALS-complex. Release of IGFs from IGFBPs occurs upon IGFBP proteolysis or extracellular
matrix (ECM) binding. IGFBPs can also act independently of IGF entering the cell via as yet unknown
receptors.(Denley et al., 2005).
2.3.4. Activation of IGF-I
IGF-I is released from its binding proteins by several factors, such as acid, heparin and proteases
(Campbell et al. 1992). The physiologically relevant mechanism of dissociation is the action of
plasmin enzyme. Plasmin-induced dissociation results in the production of immunoreactive and
bioactive IGF from IGFBP, which is approximately 60-70% of the activity obtained by acid dissociation
(Campbell et al., 1992). If plasmin concentration is increased, it can result in a loss in activity,
probably because of hydrolysis of IGF-I by plasmin (Campbell et al., 1992).
10
IGF-I activity in vitro was first measured from native serum directly without pre-treatment (Marshall
et al. 1974). This procedure received much negative feedback in the literature, because the method
was considered to lead to serious artifacts especially in conditions including abnormalities of binding
proteins (Daughaday et al. 1987). The next step in the development of releasing free IGF-I was during
the development of radioimmunoassay (RIA), in which acid gel filtration was used (Zapf et al. 1977).
The recoveries were improved using the acid-ethanol (AE) pre-treatment step which is needed to
release the immunoreactive growth factor from its binding protein, and a subsequent neutralization
step at pH 7.4, at which binding is greatly inhibited (Daughaday et al., 1980; Daughaday et al., 1987).
Because of the high affinity of IGFBP-3 to IGF-I, it is extremely important to keep IGFBPs separate
from IGFs during analysis (Baxter, 2001). There has also been criticism of the AE pre-treatment,
which is mostly used in commercial analysis kits (Breier et al., 1991). According to Baxter (2001), acid-
ethanol pre-treatment removes only about 80% of the immunoreactive IGFBP-3.
2.4. Bovine insulin
Insulin is a member of the IGF superfamily with IGF-I, IGF-II and relaxin (Donovan and Odle, 1994).
The insulin molecule has a high similarity to IGF-I and the molecule is highly preserved during
evolution between species. Insulin has no activity with IGF-binding proteins (Rosenfeld et al., 1994).
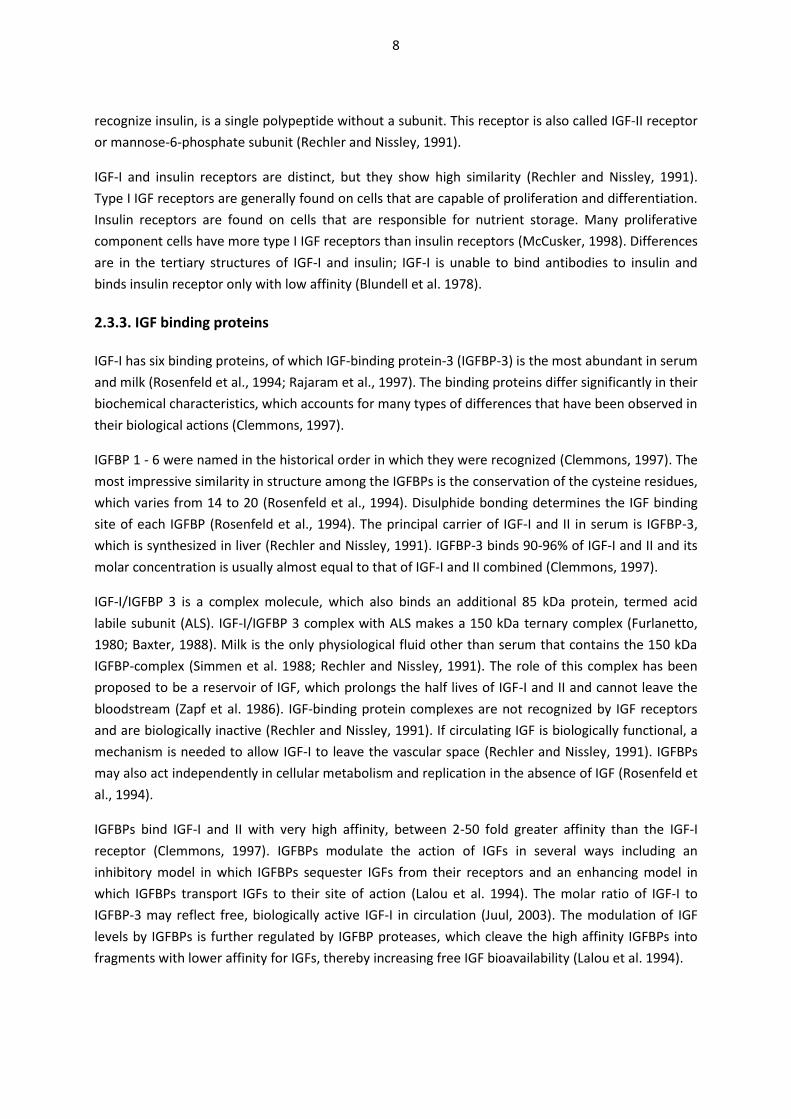
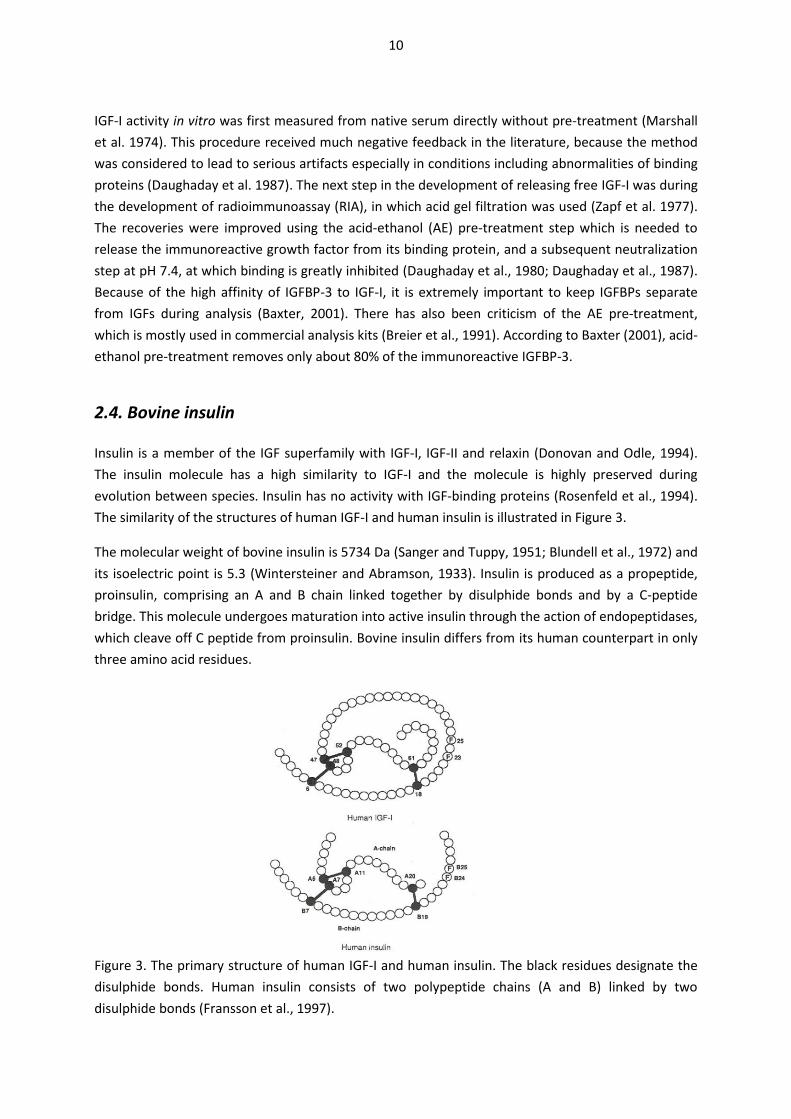
The similarity of the structures of human IGF-I and human insulin is illustrated in Figure 3.
The molecular weight of bovine insulin is 5734 Da (Sanger and Tuppy, 1951; Blundell et al., 1972) and
its isoelectric point is 5.3 (Wintersteiner and Abramson, 1933). Insulin is produced as a propeptide,
proinsulin, comprising an A and B chain linked together by disulphide bonds and by a C-peptide
bridge. This molecule undergoes maturation into active insulin through the action of endopeptidases,
which cleave off C peptide from proinsulin. Bovine insulin differs from its human counterpart in only
three amino acid residues.
Figure 3. The primary structure of human IGF-I and human insulin. The black residues designate the
disulphide bonds. Human insulin consists of two polypeptide chains (A and B) linked by two
disulphide bonds (Fransson et al., 1997).
11
Insulin is the principal agent for regulating blood sugar in higher vetebrates, but it is also an
important agent in regulating cell growth in vivo and in vitro. Insulin enchances cell hyperthrophy
primarily via an increase in nutrient stores whereas IGF-I enchances cell hyperthrophy that is
requisite for cell survival, hyperplasia, and differentiation (McCusker, 1998) . Insulin receptors are
abundant on cells that are incapable of division. The major action of insulin is to increase protein,
lipid, glycogen, and mineral stores (McCusker, 1998).
The role of bovine insulin in milk is to increase protein and especially casein content, thus increasing
milk yield (McGuire et al., 1995; Molento et al., 2002; Menzies et al., 2009). Insulin accumulates in
the bovine mammary gland in late gestation (Donovan and Odle, 1994). Malven et al. (1987) found
that insulin is readily taken up from the maternal circulation by the lactating bovine mammary gland.
62% of the insulin taken up by the mammary gland appeared in milk in an immunoreactive form.
The insulin concentration in bovine milk varies depending on the stage of lactation. High
concentrations have been reported by Ballard et al. (1982) and also by Aranda et al. (1991), who
obtained the highest recorded concentration of 327 ng/mL in the first milking of one cow. Seven days
postpartum the concentration had stabilized to 46 ng/mL. Malven et al. (1987) reported a
concentration of 5.5 ± 0.6 ng/mL 4 -6 d postpartum.
Insulin has been shown to be absorbed from the neonatal GI tract in a biologically active form in
piglets and calves (Shams and Eispanier, 1991; Burrin et al., 1992). In some studies bovine insulin has
been seen as a possible causative protein in the development of type I diabetes in early childhood
because of modulations in the gut barrier mechanism, which affect gut permeability and intestinal
immunity (Luopajarvi et al., 2008; Vaarala, 2011; Vaarala, 2012).
2.5. Analysis of TGF-β and IGF-I
2.5.1. Bioassays
Typical methods used to analyse growth factor activity are bioassays. A bioassay is any technique
that assesses the bioactivity of a given ligand by measuring its induction of a response by an intact
cell in a controlled environment (Sadick et al., 1999). Different types of cells can be grown in vitro.
When choosing the correct cell type/line for bioassay, it is critical that the cells, which are grown on
fetal bovine serum media have receptors for the target ligand. Cellular response has generally
implied proliferation, differentiation, enhanced survival, production/secretion of a product,
cytotoxity or apoptosis (Sadick et al., 1999).
The bioassays used for TGF-β analysis are associated with the history of the purification and
identification of TGF-βs (Roberts and Sporn, 1988). A wide spectrum of biological activities of TGF-β
have been recognized by the different bioassays used.
12
Assays which have been typically used to monitor the purification and activity of TGF-β include:
The ability of TGF-β to induce normal rat kidney (NRK) fibroblasts to grow and form colonies
of cells in soft agar in the presence of epidermal growth factor (de Larco and Todaro, 1978).
A cell growth inhibition assay, in which mink lung epithelial cells (Mv-1-Lu/CCL-64) are
strongly inhibited by TGF-β (Tucker et al., 1984; Abe et al., 1994).
In a further development of this method mink lung epithelial cells are transfected with a
plasminogen activator inhibitor-I promoter-luciferase construct. Active TGF-β binds to the
receptor and induces inhibitor expression, which results in a dose-dependent increase in
luciferase activity (Abe et al., 1994; van Waarde et al., 1997).
The inhibition of myoblast differentiation (Florini et al., 1986).
A commonly used method for IGF-I activity is proliferation of mouse BALB/c3T3 fibroblast cells (Burk,
1973).This method uses the tyrosine kinase receptor (RTK) of IGF-I and it is an endpoint bioassay,
which takes several days to perform. Kinase receptor activation assay (KIRA) has been developed to
perform the analysis faster within one day (Sadick et al., 1999; Chen et al., 2003).
The drawback of bioassays is the susceptibility of the cell lines, which affects the assay sensitivity
(Meager, 1991). Problems with poor assay sensitivity and lack of reproducibility have led to the use
of more specific and reliable alternatives.
Radioreceptor assays (RRA) for TGF-β are based on the knowledge that all TGF-β receptors are widely
distributed in different cell types, and that different TGF-β subtypes bind them similarly (Meager,
1991). RRA measures the ability of antisera to block the binding of radiolabeled TGF-β subtypes to
cultured cells. Indirect competitive RRA measures the concentration of radiolabeled TGF-β using
corresponding TGF-β subtypes present in samples (Danielpour et al., 1989). This method is useful to
estimate TGF-β content of samples in which only one TGF-β subtype is present. It cannot measure
the proportion of different subtypes (Meager, 1991).
2.5.2. Immunochemical methods
Immunoassays are taking over from bioassays because they are sensitive and reproducible and also
rapid and easy to perform. Immunochemical methods use antibodies, which are specific to their
antigens.
IGF-I, TGF-β1 and TGF-β2 concentrations have been measured by radioimmunoassay (RIA) and
enzyme-linked immunosorbent assay (ELISA). In RIA the radioactively labeled, usually I125-labeled,
antigen (growth factor) is competing with binding to a specific antibody with unlabeled growth factor
(Keski-Oja et al., 1987).
13
ELISA is replacing to RIA, because of the safety and disposal problems associated with radioisotopes
(Meager, 1991). The ELISA method does not use any radiolabelled molecules. Sandwich ELISA uses
two different antibodies, which recognize different epitopes of the same antigen. The specific
antibody is immobilized on a microplate with wells, where the antigen (growth factor) recognizes and
binds the antibody. A second antibody, which carries a conjugated label, recognizes and binds the
antigen. The detection is made using a chromogenic substrate or fluorescence reaction, which can be
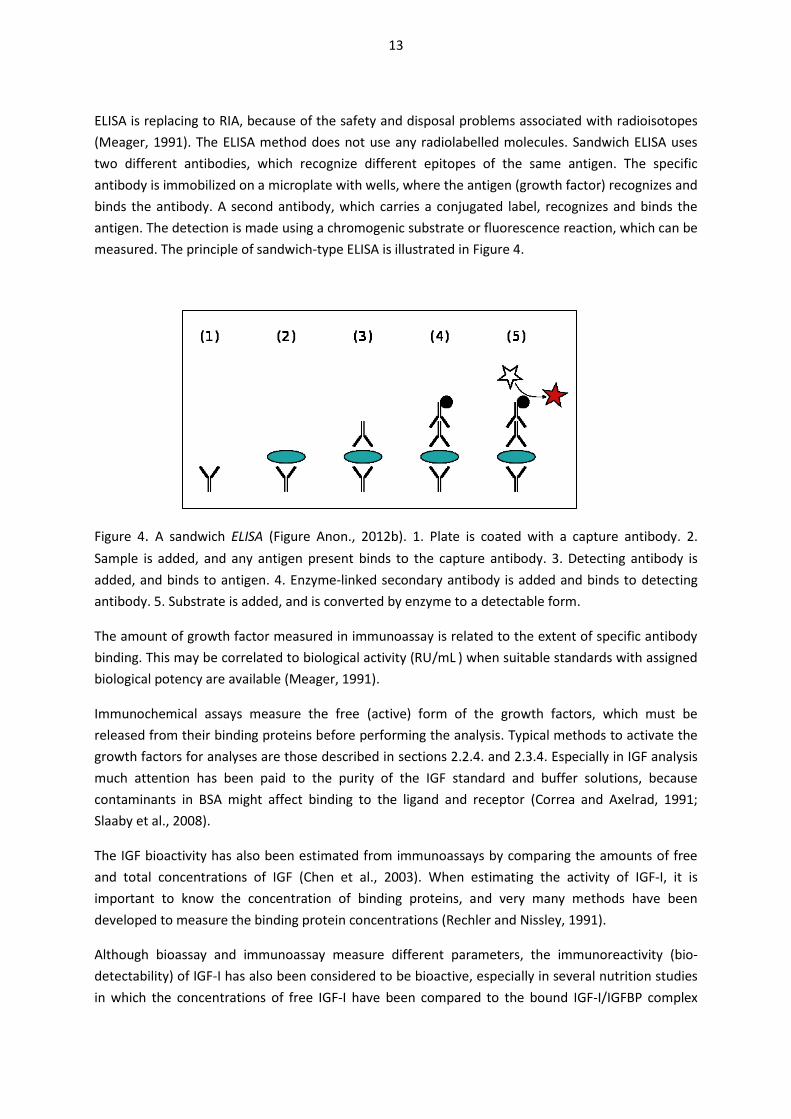
measured. The principle of sandwich-type ELISA is illustrated in Figure 4.
Figure 4. A sandwich ELISA (Figure Anon., 2012b). 1. Plate is coated with a capture antibody. 2.
Sample is added, and any antigen present binds to the capture antibody. 3. Detecting antibody is
added, and binds to antigen. 4. Enzyme-linked secondary antibody is added and binds to detecting
antibody. 5. Substrate is added, and is converted by enzyme to a detectable form.
The amount of growth factor measured in immunoassay is related to the extent of specific antibody
binding. This may be correlated to biological activity (RU/mL ) when suitable standards with assigned
biological potency are available (Meager, 1991).
Immunochemical assays measure the free (active) form of the growth factors, which must be
released from their binding proteins before performing the analysis. Typical methods to activate the
growth factors for analyses are those described in sections 2.2.4. and 2.3.4. Especially in IGF analysis
much attention has been paid to the purity of the IGF standard and buffer solutions, because
contaminants in BSA might affect binding to the ligand and receptor (Correa and Axelrad, 1991;
Slaaby et al., 2008).
The IGF bioactivity has also been estimated from immunoassays by comparing the amounts of free
and total concentrations of IGF (Chen et al., 2003). When estimating the activity of IGF-I, it is
important to know the concentration of binding proteins, and very many methods have been
developed to measure the binding protein concentrations (Rechler and Nissley, 1991).
Although bioassay and immunoassay measure different parameters, the immunoreactivity (bio-
detectability) of IGF-I has also been considered to be bioactive, especially in several nutrition studies
in which the concentrations of free IGF-I have been compared to the bound IGF-I/IGFBP complex
14
(Hoppe et al., 2006). Samples which have had measurable TGF-β concentrations in ELISA have also
shown activity in bioassays (Ginjala and Pakkanen, 1998; Lonnerdal et al., 2009; Ozawa et al., 2009).
Immunoassays may be used to determine the subtype concentration and activity, but they are not
able to account for any regulation of biological activity by other factors which may be observed in
bioassays (Meager, 1991).
2.6. TGF-β2 and IGF-I in bovine milk
2.6.1. Analysis of TGF-β and IGF-I from bovine milk
Milk is a complex physiological liquid, which presents many challenges for analysis. Milk or its
fraction is never a sample of one component, but a mixture of several compounds, which can
interact with or interfere with the analysis. Bioassays and immunoassays have been used to analyse
growth factors in milk. Generally they are adapted from clinical chemistry and validated to measure
milk samples.
The commercial ELISA assay kit for TGF-β2 is widely used and it also has a good reliability in milk. The
immunoassay of IGF-I is much more difficult to perform. The kits are usually calibrated to measure
concentrations from 0.1 to 6 ng/mL. The drawback of this method, when analysing normal bovine
milk, is the acid-ethanol (AE) pre-treatment step which is needed to release the immunoreactive
growth factor from its binding protein and the subsequent neutralization step at pH 7.4, at which
binding is greatly inhibited (Daughaday et al., 1980). When performing the analysis according to the
manufacturer’s instructions, the sample is diluted 1:100, leading to a concentration which is too low
for the analysis.
Many attempts have been made to avoid the dilution. Guidi et al. ( 2007) and Castigliego et al. (2011)
developed a method based on ELISA immunoassay, in which the acid-ethanol pre-treatment was
replaced by simultaneous pre-treatment and immunoassay. In their modification, the acid-released
IGF-I binding protein (IGFBP) was blocked using an excess of IGF-II in the reaction buffer solution to
keep the IGF-I free for analysis. In this way they were able to analyze concentrations from 0.3 to 10
ng/mL .
McGrath et al. (2008) developed an electrochemiluminescent immunoassay (ECLIA) method, in which
the detection sensitivity was improved; the detection limit for IGF-I was < 1 pg/mL . The method also
needed a pre-treatment step, which diluted the milk 66-fold. Two individual bovine milk samples
analyzed with ECLIA gave concentrations of 6 and 8 ng/mL . The sensitivity has also been increased
using non-competitive time-resolved immuno-fluorescense assay (TR-IMFA) (Frystyk et al., 1994).
Usually when the detection of the sample has been improved, the samples have needed more
purification steps.

15
2.6.2. TGF-β2 and IGF-I concentrations in milk and in colostrum
In bovine milk TGF-β2 is the major isoform of TGF-βs and the rest is TGF-β1 (Jin et al., 1991;
Tokuyama and Tokuyama, 1993). TGF-β3 has not been detected either in bovine milk or colostrum
(Pakkanen, 1998).
The concentration of growth factors during lactation has been investigated in several studies. The
mink lung epithelial cell test (Abe et al., 1994) was used by Rogers et al. (1996), who studied the
concentration and stability of TGF-β in pasteurized bovine milk. After acid activation they obtained
concentrations of 4.3 ± 0.8 ng/mL and 3.7 ± 0.7 ng/mL in milk and whey, respectively.
Pakkanen (1998) and Ginjala and Pakkanen, (1998) measured TGF-β2 and IGF-I concentrations using
the fibroblast migration assay (Burk, 1973) and ELISA. The concentrations with the bioassay were
about one eighth of that by ELISA, which were 150 – 1150 ng/mL of TGF-β2 and 248 – 1850 ng/mL of
IGF-I in the first milking of five cows. Pakkanen (1998) also found that the concentration of the active
TGF-β, which was analysed by ELISA without acid pre-treatment, is close to the total TGF-β
concentration obtained by bioassay. The concentration of growth factors declined rapidly and after 1
week postpartum the concentration was approximately at the level found in regular dairy milk, which
is about 10 -70 ng /mL for TGF-β2 and 4 -100 ng/ mL for IGF-I (Gauthier et al., 2006). Pakkanen (1998)
analysed normal pasteurized dairy milk and obtained a TGF-β2 concentration of 37.7 ng/mL. Akbache
et al. (2011) got 3.6 ng/mL for whole milk and Ozawa et al. (2009) 3 μg/L using the same ELISA
method as Pakkanen (1998).
Elfstrand et al. (2002) studied growth factor concentrations 0-80 h postpartum using ELISA for TGF-
β2 and RIA for IGF-I analysis. During that time the initial concentration of TGF-β2, 289-310 ng/mL,
decreased to 66 ng/mL and the concentration of IGF-I decreased from 870 to 150 ng/mL .
Campbell and Baumrucker (1989) found on the basis of an RIA method that milk from multiparous
cows had higher IGF-I concentrations (40 μmol/L) than that from primiparous cows (19.2 μmol/L).
Collier et al. (1991) examined factors affecting the concentration of IGF-I in bovine milk. In their
study, they analyzed milk from 409 individual cows and pooled milks from 100 farms using an RIA
method. The average IGF-I concentration in milk from individual cows was 2.6 ng/mL and that of 100
bulk tank milk samples was 4.32 ng/mL, with a range of 1.27 to 8.1 ng/mL.
Sejrsen et al. (2001) studied the concentration and biological activity of IGF-I in colostrum and milk.
They found a high concentration of IGF-I in colostrum, about 300 ng/mL, which declined rapidly to 7
ng/mL during the week after calving. The concentration declined further towards mid lactation, when
it was below 2 ng/mL. IGF-I concentration was measured using TR-IMFA. They also found mitogenic
activity when whey from milk stimulated the proliferation of epithelial cells in vitro (Purup et al.,
2007).
There are some discrepancies between published growth factor concentrations. These could be
solved if the concentrations were expressed per protein content as proposed by Montoni et al.
(2009). They studied the optimal collection period of colostrum in order to maximize the growth
factor yields of TGF-β2, TGF-β1 and IGF-1 and found a strong correlation (R2>0.90) between growth
16
factor concentrations and the total protein content. They also pointed out that if the maximal
concentration of growth factors is the target, milk should be collected during the first 12 hours after
parturition, but if it is important to obtain a preparation higher in TGF-βs than IGF-1, the optimal
collection period is between days 3 and 6, because the ratio between TGF-βs and IGF-1 varies with
time. During the proposed period the IGF-1 concentration is lowest, but TGF-βs are still present at a
reasonable level for concentration (Montoni et al., 2009).
2.6.3. Effects of heat treatments on TGF-β and IGF-I in milk
Dairy milks are subjected to different types of heat treatments depending on the hygienic standards
of the products in which they are used. In dairy manufacturing plants bovine milk undergoes heat
treatments in order to destroy all or some of the microorganisms present in milk, while retaining the
good organoleptic and nutritive properties of milk. Milk can be sterilized at temperatures above
100°C using indirect or direct heating technology. In direct heating milk comes into contact with the
heating steam, whereas in indirect systems heat is transferred to milk via a tubular or plate heater
(Kessler, 2002). Furthermore the technology to make dairy products might require heat treatments
in order to arrive at an optimal product. Table 2 presents the typical heat-treatments used for milk.
Table 2. Typical heat-treatments of milk in dairy plants (Kessler, 2002; Anon, 2012c).
Heat treatment Method Temperature and time Purpose Thermization Short term heating 62 – 65°C, 15 – 20 s to reduce heat sensitive
microorganisms, Pseudomonas
Pasteurization Batch 62 – 65°C, 30 min to reduce the number of pathogens
Short term heating 72 – 75°C, 15 – 30 s to reduce the number of pathogens
High temperature ≥ 85°C to reduce the number of pathogens
ESL, extended shelf life ESL
130 – 145°C, <1 s to reduce the number of pathogens, shelf life
extension Sterilization Autoclave 109 – 120°C, 40 – 20 min to destroy all
microorganisms UHT (ultra high
temperature) 135 – 150°C, 10 – 1 s to destroy all
microorganisms
Caseins are very stable molecules in heat treatments (Fox and McSweeney, 1998). They are not
susceptible to thermal denaturation during regular dairy processes, but extreme conditions, such as
long term heating at high temperature, basic environments and dephosphorylation and
concentration, can create intra- or intermolecular aggregation (Fox and McSweeney, 1998). The
major whey proteins, α-lactalbumin and β-lactoglobulin, are very heat sensitive due to their
molecular structure. At 75⁰C and above the whey proteins start to denature, which leads to the
formation of β-lactoglobulin and κ-casein aggregates via thiol-disulphide bond interchange reactions
(Dannenberg, 1986; Dalgleish, 1990; Fox and McSweeney, 1998; Lowe et al., 2004; Oldfield, Singh, &
Taylor, 2005).
17
The knowledge of the thermal behaviour of growth factors in milk and colostrum is based on studies
concerned with the heat sensitivity and denaturation of the total growth factor concentration. In the
work of Akbache et al. (2011) the same batch of milk was heated to different temperatures and the
effects of heating on TGF-β2 were studied. Using temperatures and holding times of 68°C for 20 s,
72°C for 20 s and 140 °C for 4 s they concluded that the critical temperature for TGF-β2 was 66 -
76°C, beyond which no change in TGF-β2 was measurable. Akbache et al. (2011) suggested that a
rapid denaturation of the molecule had occurred. It was also found that in pasteurized milk the
casein fraction contained most of the growth factor of the original raw milk. Akbache et al. (2011) did
not measure the latent and active forms separately, and reached their conclusions based on the total
concentration of TGF-β2. They also compared the concentration of TGF-β2 in whole and skimmed
milk and found that in raw milk the cream contained 55% and in pasteurized milk 62% of the total
TGF-β2 concentration when cream was separated by a cream separator.
Ginjala and Pakkanen (1998) concluded that pasteurization does not affect TGF-βs. The same
observation was made by Elfstrand et al. (2002), who studied the effects of heating on the
mechanical stability of growth factors from colostrum. Pasteurization and freeze drying of
serocolostrum did not affect the concentrations of IGF-I and TGF-β2, but if filtration techniques, such
as microfiltration, ultrafiltration and diafiltration, were used to concentrate the whey, the IGF-I and
TGF-β concentrations were reduced by 25% (Elfstrand et al., 2002).
Breast milks have also been studied, because breast milk delivered from milk banks must be heat-
treated prior to delivery and there has been concern that the heat treatment might affect the growth
factors. McPherson and Wagner (2001) found that after heating of breast milk at 56.5°C for 30 min
both TGF-α and TGF-β were well preserved. A similar result was also obtained by Donovan et al.
(1991) with IGF-I and IGF-II from human milk.
Collier et al. (1991) found that IGF-I is unaffected by the pasteurization of bovine milk (79°C, 45 s) or
by heat treatment of banked human milk (56°C 30 min), but is either removed or destroyed during
the processing of infant formulas.
Yun et al. (2007) examined the thermal behaviour of IGF-I, which was separated from bovine
colostrum and lyophilized. They used several temperatures (65, 70, 80 and 90°C) and compared the
stability of this growth factor in buffer solution and in commercial UHT milk using RIA. The
experiment was performed on a very small scale, but they found that IGF-I is very heat stable, and in
UHT milk is even more stable than in buffer solution. Using thermodynamic calculations, they
concluded that the thermal resistance of IGF-I is higher than that of other whey proteins, such as β-
lactoglobulin, α-lactalbumin, lactoferrin, IgG and IgA.
Kang et al. (2006) studied the effects of dairy processes and storage on IGF-I concentration. They
used raw milk, the natural level of IGF-I in which was increased by adding lyophilized colostrum whey
powder, and the analyses were performed using RIA. Homogenization of raw milk did not affect the
concentration, but heat treatment at 75 °C or 85°C for 15 min decreased the concentration by 45.0
and 45.2%, respectively. When milk was autoclaved at 121°C for 15 min, no IGF-I was detected in the
18
milk. They also found that IGF-I did not survive in fermented milk product, probably due to the
microbial proteases, which might hydrolyse the IGF-I.
2.6.4. Separation and concentration of TGF-β and IGF-I from milk
Separation and concentration of growth factors has been performed using either chromatography or
membrane filtration processes such as microfiltration and ultrafiltration. The raw material is usually
whey from cheese making or colostrum. If colostrum is used, the described methods typically start
with the pre-treatment, during which the casein fraction is separated and discarded. Many articles,
which are referred to in the following sub-chapters, describe methods for concentrating bovine TGF-
β, but the separated fractions also contain other growth factors. TGF-β is used as a marker protein,
because TGF-β is easier to analyse than to IGF-I.
2.6.4.1. Chromatographic separations
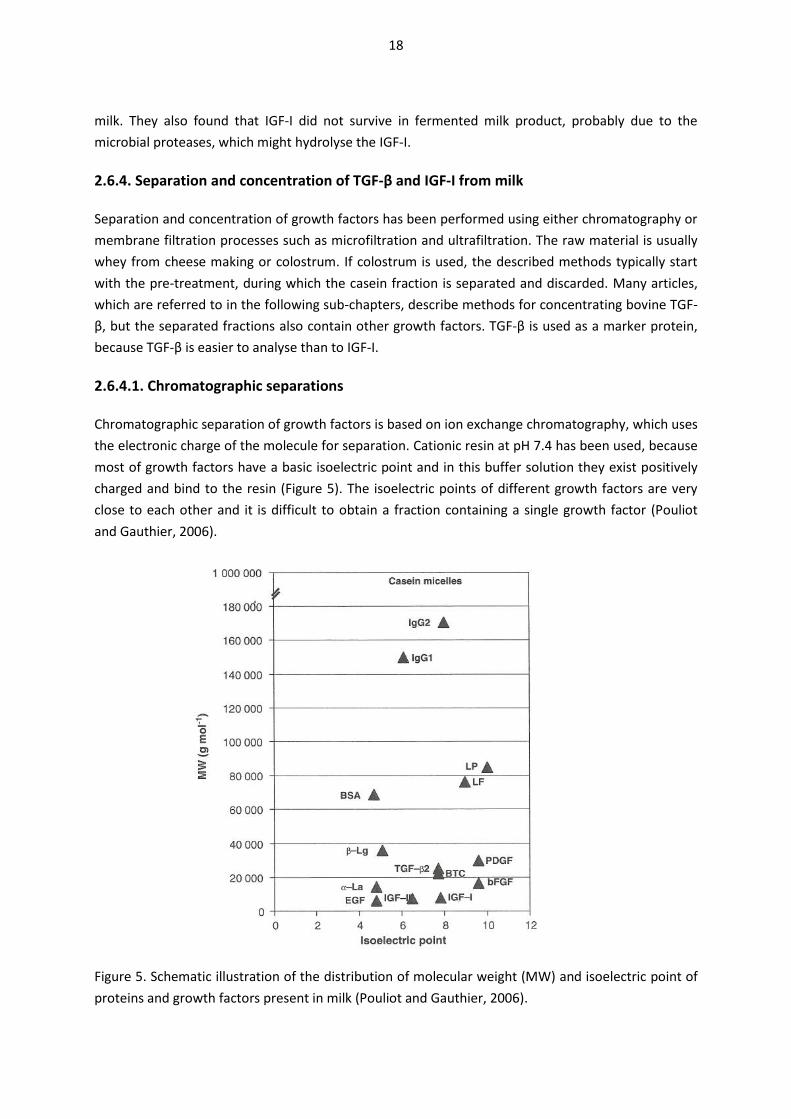
Chromatographic separation of growth factors is based on ion exchange chromatography, which uses
the electronic charge of the molecule for separation. Cationic resin at pH 7.4 has been used, because
most of growth factors have a basic isoelectric point and in this buffer solution they exist positively
charged and bind to the resin (Figure 5). The isoelectric points of different growth factors are very
close to each other and it is difficult to obtain a fraction containing a single growth factor (Pouliot
and Gauthier, 2006).
Figure 5. Schematic illustration of the distribution of molecular weight (MW) and isoelectric point of
proteins and growth factors present in milk (Pouliot and Gauthier, 2006).
19
The first attempt to isolate a growth factor-rich fraction from bovine milk, was that of Cox and Bürk,
(1991). Using cation-exchange chromatography combined with low-pressure hydrophopic-interaction
chromatography and high pressure liquid chromatography (HPLC), they obtained a fraction which
was further purified using HPLC size-exclusion chromatography. This pure fraction was termed milk
growth factor (MGF) and it was tested using normal rat kidney (NRK) fibroblast assay. Subsequent
SDS-PAGE and amino acid analysis comfirmed that MGF was related to TGF-β2. Soon after this
reseach Jin et al. (1991) confirmed that WGF was composed of TGF-β1 and TGF-β2.
Among the first experiments for growth factor separation and concentration from dairy whey for
commercial purposes were those of Francis et al. (1995). The aim of these experiments was to
prepare a source of growth-stimulating factors to be used as a replacement or supplement for fetal
bovine serum in cell cultures. A cationic chromatography was selected for this process to remove the
major whey proteins, α-lactalbumin and β-lactoglobulin and to bind most of the growth factors.
Before chromatography, whey was clarified and concentrated by microfiltration and ultrafiltration.
Adsorbtion and elution from Sepharose Fast Flow-S resin yielded a fraction that contained only 1 –
2% of the protein present in the original whey, but was rich in growth factors. The growth-promoting
activity was identified with three cell lines (Balb/c 3T3 cells, L6 myoblasts and human skin
fibroblasts). After separation the extract still contained lactoperoxidase and immunoglobulin G,
which could be removed by heat treatment (lactoperoxidase) and affinity chromatography, without
significant loss of growth-promoting activity. The work was completed by Kivits et al.(2003), who
separated TGF-β2 and IGF-I in this fraction from each other by using a hydroxyapatite column.
Teintenier-Cousin et al. (2009) developed chromatographic separation methods in order to prepare a
latent TGF-β2-rich fraction from bovine colostrum, from which casein was precipitated by renneting
to obtain serocolostrum. During the experiment they tested several chromatography techiques in
order to study the physicochemical properties of TGF-β2 and thereby optimise the yield. Gel filtration
showed that TGF-β2 existed in several forms. Part of the TGF-β2 was bound to α2-macroglobulin or
immunoglobulin G. TGF-β2+LAP (80-105 kDa) was also found. Hydrophopic interaction
chromatography showed that latent TGF-β2 was much more hydrophopic than other whey proteins,
except IgG. A fraction rich in TGF-β2 was obtained by Cibacron Blue chromatography eluting TGF-β2
in 0.01 sodium phosphate buffer, pH 7.4, 1 M NaCl. With this method they obtained a fraction which
was concentrated 26 fold. The fraction contained 40 ng TGF-β2 /mg protein and also contained IgG.
70% recovery from the original concentration was obtained, 80% of which was in the latent form as it
was in colostrum originally. Teintenier-Cousin et al. (2009) concluded that since TGF-β2 was in the
latent form, the half-life of the preparation was long enough to pass through the gastrointestinal
tract. They also found the preparation to be suitable for pharmaceutical purposes, e.g. for the
treatment of Crohn’s disease, because it contained both IgG and TGF-β2, which both have anti-
inflammatory activities.
Affinity chromatography has also been used. TGF-β has a hydrophopic character, which favors its
binding with other proteins (Wakefield et al., 1988; Daopin et al., 1992). Ben Ounis et al. (2008) used
heparin affinity chromatography to separate minor protein components from whey isolates (WPIs)
which were produced by ion-exchange chromatography or microfiltration and ultrafiltration. Heparin
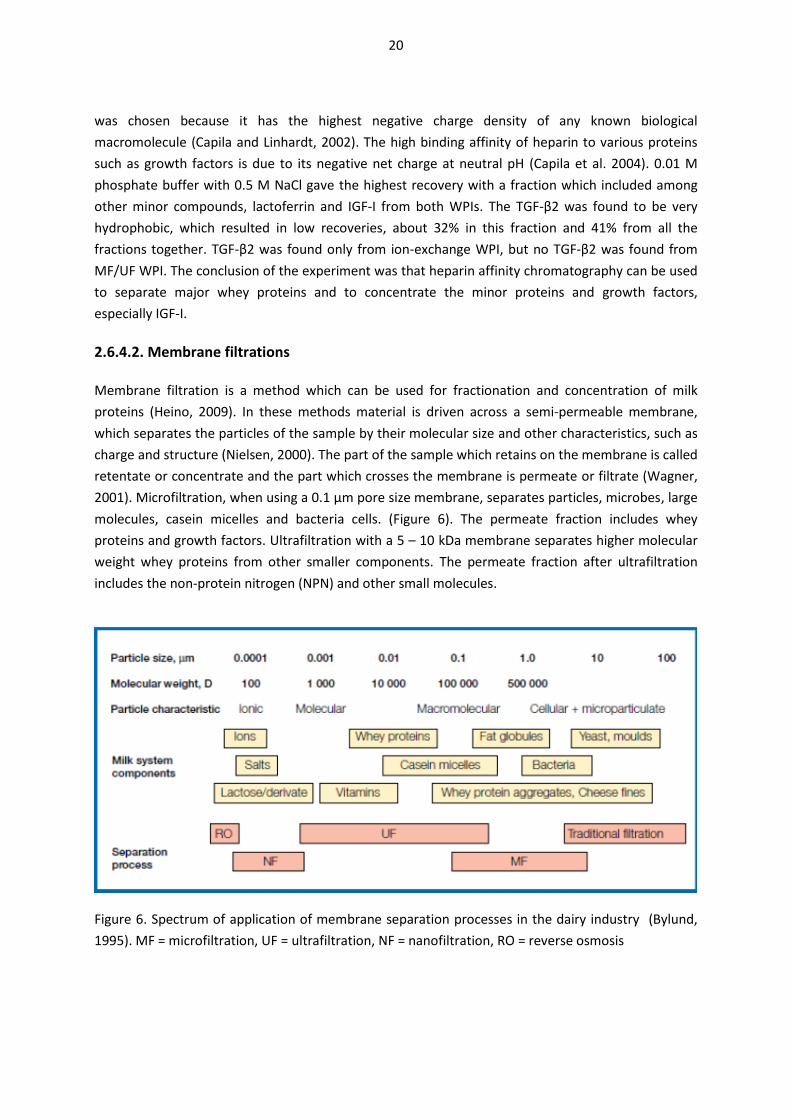
20
was chosen because it has the highest negative charge density of any known biological
macromolecule (Capila and Linhardt, 2002). The high binding affinity of heparin to various proteins
such as growth factors is due to its negative net charge at neutral pH (Capila et al. 2004). 0.01 M
phosphate buffer with 0.5 M NaCl gave the highest recovery with a fraction which included among
other minor compounds, lactoferrin and IGF-I from both WPIs. The TGF-β2 was found to be very
hydrophobic, which resulted in low recoveries, about 32% in this fraction and 41% from all the
fractions together. TGF-β2 was found only from ion-exchange WPI, but no TGF-β2 was found from
MF/UF WPI. The conclusion of the experiment was that heparin affinity chromatography can be used
to separate major whey proteins and to concentrate the minor proteins and growth factors,
especially IGF-I.
2.6.4.2. Membrane filtrations
Membrane filtration is a method which can be used for fractionation and concentration of milk
proteins (Heino, 2009). In these methods material is driven across a semi-permeable membrane,
which separates the particles of the sample by their molecular size and other characteristics, such as
charge and structure (Nielsen, 2000). The part of the sample which retains on the membrane is called
retentate or concentrate and the part which crosses the membrane is permeate or filtrate (Wagner,
2001). Microfiltration, when using a 0.1 μm pore size membrane, separates particles, microbes, large
molecules, casein micelles and bacteria cells. (Figure 6). The permeate fraction includes whey
proteins and growth factors. Ultrafiltration with a 5 – 10 kDa membrane separates higher molecular
weight whey proteins from other smaller components. The permeate fraction after ultrafiltration
includes the non-protein nitrogen (NPN) and other small molecules.
Figure 6. Spectrum of application of membrane separation processes in the dairy industry (Bylund,
1995). MF = microfiltration, UF = ultrafiltration, NF = nanofiltration, RO = reverse osmosis
21
Piot et al. (2004) described a membrane separation method to obtain a preparation from
serocolostrum. In this method they started from 80 kg of bovine colostrum, which was diluted and
skimmed. The process continued with microfiltration and diafiltration using a 0.1 μm membrane. The
retentate, which was the casein fraction, was discarded, and the process was continued by
ultrafiltration using a 8 kDa membrane. They obtained 45 kg of retentate, which was freeze dried to
4.15 kg of powder, and had a concentration of 2.0 ng IGF-I and 1.7 ng TGF-β in mg of powder. The
recovery of TGF-β2 at the end of UF was about 40%, but the total recovery calculated form the
original amount in colostrum was only about 20%. The powder obtained from the experiment was
fed to piglets and it was found to improve their gut health. Compared to the control group there was
a 22% increase in the duodenal villous height and 21% increase in the protein synthesis of
duodenum.
Maubois et al. (2006) patented a method to prepare a TGF-β2 rich fraction from regenerated whey
protein isolate (WPI) powder using a combination of temperature between 55 °C and 68 °C and pH
from 4 to 5.5 to precipate the growth factor and part of the whey proteins. Followed by
microfiltration and diafiltration the precipate was separated to retentate and permeate, from which
the retentate was rich in TGF-β, and was dried to obtain a TGF-β rich powder. With this method they
obtained a biologically active fraction which contained 80% of the original TGF-β2, 70% of which was
active TGF-β2. They considered it to be very important to obtain the fraction in active form, because
in the opinion of the authors only the biologically active form is suitable for therapeutic applications.
Akbache et al. (2009) concentrated IGF-I and TGF-β2 from bovine milk and whey using MF with 1.4
μm pore size membrane followed by UF with a 5 or 10 kDa membrane. In their process, pasteurized
or thermized cheese whey was clarified by MF and the subsequent concentration was performed by
UF and DF. The results were compared to whey which was obtained by microfiltration of non-heat-
treated milk. There was a conciderable loss of 11 – 63% in the TGF-β2 concentration during the whey
clarification process, which was performed using a 1.4 μm pore size membrane. The loss was
depending on the type of whey used. The concentration of TGF-β increased during ultrafiltration,
whereas that of IGF-I decreased. The concentrate preserved its bioactivity as indicated by the
lymphocyte proliferation assay.
Wheys used for the described experiment had different TGF-β2 concentrations and Akbache et al.
(2009) concluded that heating during the cheese-making process was probably responsible for this.
Pasteurized Cheddar and Mozzarella wheys showed the lowest TGF-β2 concentrations (0.5 and 2.2
ng/L) and microfiltered whey gave the highest value (8.8 ng/L). They proposed that ultrafiltration of
cheese whey may be suitable for growth factor concentration, because it provides the possibility to
modify TGF-β2/IGF-I ratio in the product.
Rocafi et al. (2011) used the growth factor separation method of Maubois et al. (2006) to
characterize the effects of preheating on the TGF-β2 yield from whey. Whey from non-heat-treated
raw milk was compared to those obtained after heating at 63⁰C or 68⁰C for 20 s. Heating decreased
the TGF-β2 concentration in whey, 68⁰C more than 63⁰C. After casein separation by acid and
cheesecloth, followed by neutralization, the whey was concentrated using UF and DF. The separated
casein was discarded and the TGF-β2 recoveries from the whey fraction were studied using different
22
heat treatments and pH values. The best TGF-β2 yield in whey concentrate was obtained from non-
pasteurized milk after pasteurization of the whey. After this treatment the highest yield was about
2.6 pg/mg (2.6 ng/g) protein. Using a suitable pH and a second heat treatment, it was possible to
increase the TGF-β2 concentration further. The best recovery of TGF-β2 in whey protein concentrate
(WPC) was obtained when milk was heat-treated at 63⁰C for 20 s and whey was separated and
pasteurized and concentrated using ultrafiltration followed by precipitation at pH 4.5. With this
method the yield in lyophilized powder was > 10 000 pg (>10 ng) TGF-β2/mg solids.
A patent application from Kwon et al. (2006) is a combination of precipitation and membrane
separation methods in order to concentrate growth factors from bovine colostrum or whey. In this
method major milk proteins were separated using precipitation at their isoelectric points. After
casein separation at pH 4.6 the whey proteins were separated from whey, also by isoelectric
precipitation. The remaining liquid phase was first filtered with a ≤30 kDa membrane followed by
filtration with a ≥1 kDa membrane. The obtained fraction, which was rich in growth factors, was
tested with rats and the change in femur length was observed with an amount of 1- 1000 mg/kg
body weight/day.
2.7. Physiological effects of IGF-I and TGF-β2 in milk
2.7.1. IGF-I and linear growth
Milk consumption has been connected to linear growth and there are several studies concerning milk
and growth. The Boyd Orr study which was performed in 1928 in Scotland was the first one which
showed the great effect of milk when the diet of school children were supplemented either with
whole milk, skimmed milk or biscuits. The groups who received whole milk or skimmed milk gained
20% more (0.7 cm) height during the period of seven months compared to other groups (Orr, 1928).
The same conclusion was made by Bogin (1998) who proposed that greater consumption of bovine
milk during infancy and childhood will result in taller adult stature. According to Bogin (1998), the
reason for this was not the energy or the protein quantity supplied by milk, but rather a “height
factor”, which could be a nutrient or a combination of nutrients.
In general the comparison between these studies is difficult, because there are several differences
between them; how they have been performed and in energy and protein intake, minor components
of milk, such as calcium, or socioeconomical background of the population (Hoppe et al., 2006).
Furthermore some of the articles are old, the data has not been studied by methods used today and
conclusions have been made by non-experimental methods. Instead of looking at individual articles,
it is better to rely on research articles or reviews, such as that of Hoppe (Hoppe et al., 2006) which
have compared several studies and excluded the different nutritional factors.
According to Hoppe et al. (2006) adult height is programmed before puberty. Especially the first two
years of life appear to be critical. Nutrition during this period may be a more important determinant
than nutrition in older ages. Hoppe et al. (2006) also examined IGF-I as one possible factor for
growth. Not only the concentration of IGF-I in circulation, but the ratio of IGF-I / IGFBP is very
23
important, because only the active IGF-I is available for tissues. High intake of milk has increased the
IGF-I levels and IGF-I/IGFBP ratios in blood in children, adolescents and even in adults. This has not
been seen in the case of meat or vegetarian meals. Although there were also conflicting results,
Hoppe concluded that increased intake of cow’s milk is able to increase the IGF-I concentration in
circulation. The so-called IGF axis is programmed by early growth.
An important research article is that written by Wiley (2012), in which the author studied the life
history consequences of bovine milk consumption at different stages of life from prenatal to
adolescence with regard to linear growth and IGF-I. In this study he used the United States National
Health and Nutrition Examination Survey (NHANES) and data from 1999 to 2004 from the literature.
Wiley proposed that IGF-I may support the growth and development of the neonatal gastrointestinal
tract or enhance lactase activity, but it is not known whether IGF-I is absorbed intact and whether it
is able to exert systematic effects. It is not clear whether the increase in serum levels is due to IGF-I
from milk or whether milk stimulates endogenous production.
Wiley (2012) observed that during the prenatal period maternal milk intake is positively related to
birth weight. IGF-I does not cross the placenta and the growth must be through alteration in
placental function. Prenatal supplementation with milk, combined with additional milk over the first
5 years of life have a negative relationship with adult IGF-I levels in the next generation.
Wiley (2012) observed that during infancy (0-1 years), formula-fed infants have higher IGF-I levels
than breast-fed infants. During the preschool age (about 24 – 59 months), children who consume
more cow’s milk are taller than those who consume less. In the case of prepubertal children (5 – 11
years) Wiley (2012) concluded that there were no differences in height between those who drank
milk daily and those who drank milk less frequently or never. During adolescence (12 – 17 years), a
positive impact was shown especially with girls. Wiley concluded that there is stronger evidence in
favor of positive effects of milk intake and linear growth in early life and adolescence and weaker
evidence for primary school age children. IGF-I levels peak during adolescence, which correspond a
rapid growth (Juul et al., 1994). Wiley (2012) also remarked that milk consumption is a novel dietary
behavior that has the potential to alter human life history parameters, but may also have long-term
biological consequences.
de Beer (2011) performed a meta-analysis of 12 studies concerning the relationship between growth
and consumption of dairy products. In this meta-study only those studies were included in which
trials evaluated the effect of supplementation of the normal diet with dairy products on linear
growth. Only trials reporting height, change in body height, height percentiles or height z-scores
were included. Both randomised and non-randomised controlled trials on children and adolescents
(aged 2–18 years) were included. Meta-analysis and sensitivity analysis showed that the most likely
effect of dairy product supplementation is 0.4 cm per annum additional growth per ca 245 ml of milk
daily. Meta-regression analysis indicated that milk might have more effect on growth than other
dairy products.
The difficulty of discerning the immediate effects of milk and growth factor intake was explained by
McCusker (1998) when he compared the differences in the growth promoting activity between
24
insulin and IGF-I. Insulin secretion markedly increases following the consumption of a meal in
response to elevated blood glucose concentrations. The secretion of IGF does not increase with
excess intake, but a pool of IGF is maintained in the circulation (McCusker, 1998). Growth and cell
differentiation should not occur during periods of nutrient deficiency or environmental stress and
nutrients are stored only in times of plenty. McCusker (1998) enumerated four primary inputs, which
control IGF-I concentrations. Each of these monitor specific environmental or metabolic parameters
to ensure that cellular proliferation or differentiation does not begin unless conditions are optimal.
Once cells begin to proliferate or differentiate adequate IGF-I exposure is necessary for them to
complete the process (McCusker, 1998).
The four primary inputs, which control IGF-I are:
GH stimulates IGF-I secretion
Conditions are favorable for growth, cells have ample receptor stimuli to complete the
process
Stress response, stress-free environment
Temperature
The role of multivalent cations is also important to control the adherence of IGFBP to cell surfaces
(McCusker, 1998). During Zn2+ deficiency IGFBP is dislodged from cell surfaces and the ability of
IGFBP to target IGF ability could be altered. These changes could mediate the decrease in growth
rate during Zn deficiency (McCusker, 1998).
Associations between circulating IGF-I and diseases have also been recorded. In adults, low
concentrations of IGF-I may increase rates of cardiovascular disease, whereas high concentrations
are associated with an increased risk of prostate, breast, and colorectal cancer. Patients with high
IGF-I and low IGFBP had the greatest risk (Hoppe et al., 2006). In the latest review article Chagas et
al. (2012) presented human studies that evaluated the role of milk or dairy product consumption in
the development of cancer. The authors pointed out that the recommended intake of milk and dairy
products (3 servings /day) is safe and does not increase the risk of cancer.
2.7.2. TGF-β2 and growth
The importance of oral TGF-β for growth and differentiation has been shown by animal studies using
so-called knock-out mice as in the study of Letterio et al. (1994). In this study TGF-β1 gene knock-out
mice survived during the first weeks due to breastfeeding, indicating that maternal sources of TGF-β1
via placental transfer and milk were essential for the normal development.
One human study is the wide review study of Oddy and Rosales (2010), in which the authors were
investigating the association between TGF-β identified in human milk and immunological outcomes
in infancy and early childhood. 67% of twelve human studies showed a positive association between
TGF-β1 and TGF-β2 and protection against allergy-related diseases such as wheeze, atopy and
eczema in infancy and early childhood.
25
Another review of Oddy and McMahon (2011) looked for an answer to the question whether oral
administration of TGF-β, through maternal milk, cow’s milk, formula or recombinant TGF-β, may
bring balance to the immune system in animal studies. The result was similar to that of humans: 12
studies out of 13 showed a positive association with TGF-β1 or TGF-β2 and immunological outcomes.
In naturally suckling animals, the gut is exposed to maternal milk cytokines that assist in the
regulation of immune responses until the gut has matured sufficiently to produce its own
immunoregulatory cytokines for normal gut homeostasis (Penttila et al., 2003). It is thus possible that
administration of TGF-β through an oral route stimulates many types of cells, e.g. intestinal epithelial
cells (Penttila et al., 2003).
In the earlier study Penttila et al. (2001) compared young rats which received orally a growth factor-
enriched fraction from milk, bovine serum albumin or casein. They found that a daily oral dose of
growth factor extract down-regulated immune activation to ovalbumin, which was the test material.
They concluded that whey extract could be a potential additive in infant formulas.
Beattie et al. (1994) reported an experiment performed with seven children with active small bowel
Crohn's disease. As a treatment they were given a commercial casein-based feed rich in TGF-β2 as
complete nutrition for 8 weeks. All the children showed a significant improvement in condition, with
C-reactive protein returning to normal, an increase in serum albumin and good weight gain. Initial
and follow-up ileal biopsies were assessed and showed reduced mucosal inflammation in six of the
seven children, with complete healing in two.
In the study of Fell (2005) the effect of enteral nutrition therapy with liquid diet was studied with 29
children, aged between 8 – 17 years, as a treatment to Crohn's disease. Two commercial casein-
based products, each rich in TGF-β, were studied as treatments. They were both shown to induce
clinical remission associated with mucosal healing. The results indicated that the products were
influencing the disease process itself, and thus suggest that the clinical remission achieved was a
result of a reduction in inflammation, rather than a consequence of some other nutrition effect.
Donnet-Hudges et al. (2000) discussed the role of transforming growth factor-β in health and disease
especially from the point of view of regular milk and infant milk formula, which has been subjected
to effective heat treatment. The authors pointed out that the growth factors may not survive
technological processing for example in infant milk formulas. Because of this, newborns may not get
all the benefits of the formulas. Modifying the manufacturing processes may preserve the biological
activity of some bioactive molecules, such as TGF-β in end products. Milk products containing
naturally occurring TGF-β2 could be exploited in functional foods for infants or as therapies for
specific intestinal diseases.
Consumption of unpasteurized cow's milk has been associated with less atopy prevalence (Peroni et
al., 2009). Not only the microbial load but also cytokines such as TGF-β1 have been suggested to play
a role in the effect of unpasteurized milk. Levels of TGF-β1 in different cow's milk samples were
evaluated, including raw unpasteurized milk before and after boiling, commercial pasteurized and
microfiltrated cow's milk and different commercially available cow's milk formulas. TGF-β1
26
concentration in raw unpasteurized cow's milk was highest before boiling, 642 ± 52.9 pg/mL, and
decreased significantly after boiling to 302.7 ± 50.59 pg/mL. TGF-β1 concentrations were also
significantly lower in commercial pasteurized milk (246 ± 43 pg/mL) and in microfiltrated milk (213 ±
31 pg/mL) in comparison to unpasteurized milk (Peroni et al., 2009).
2.8. Survival of TGF-β2 and IGF-I in digestion
One great uncertainty concerning growth factors from oral milk is whether they survive digestion or
even cross the gut and/or expose the activity to milk drinkers. Furthermore the form of the growth
factor, latent or active, has been discussed. The model for comparison is usually breast milk, which is
rich in growth factors, especially the first milking. Milk-derived proteins of human milk origin have
been thought to be important in infant gut immune development during breast-feeding and weaning
due to their immune down-regulatory activity (Cummins and Thompson, 1997).
TGF-β, secreted in a latent form, is activated extracellulary by extremes of pH, heat, and by proteases
(Massagué, 1998). Therefore, the gastric proteolysis that normally occurs with ingested food is
considerably reduced in newborn infants. Further, during the first week after delivery the neonatal
gut is ‘leaky’, facilitating macromolecular passage through the mucosa at a time when cytokine levels
are in highest supply from milk (Massagué, 1998).
It is not possible to perform experiments with humans, in which immediate response could be
measured, and therefore the studies have been made with animal models, bioassays or in vitro
digestion studies. Studies with piglets have demonstrated stimulation of gastrointestinal DNA and
protein synthesis by both mature milk and colostrum (Donovan and Odle, 1994). The importance of
latent and active form of TGF-β was studied by Nakamura et al. (2009). They studied the pepsin
digestion of latent and active TGF-β at pH 1.2 and 7.0 in vitro and reported that 30 min pepsin
digestion did not affect either latent or active TGF-β. The result was confirmed by bioassay, which
demonstrated that latent TGF-β was resistant to gastric protease and activated at the low pH in the
presence of pepsin. In vivo studies were performed with mice, and the results suggested that oral
administration of latent TGF-β (5 μg/mouse) activated the TGF-β transcriptonal response of TGF-β
target genes in the mouse intestine depending on the gastric acidity. This experiment was followed
using human milk as a source of growth factor, when mice were treated orally with 1200 μL/day of
human milk containing 3 μg/L TGF-β and the result confirmed the earlier result. Nakamura et al.
(2009) concluded that gastric acidity plays a very important role in the fate of orally administered
latent TGF-β. TGF-β was found to be relatively resistant to pepsin digestion during 30 min incubation,
but a prolonged incubation of > 2 h caused degradation of the protein. Nakamura et al. (2009)
proposed that the acid- and pepsin-resistant properties of TGF-β might be important in its ability to
retain its activity in the human intestinal mucosa and mediate its activity in vivo.
Ozawa et al. (2009) investigated TGF-β activity in commercially available pasteurized bovine milks in
vivo and in vitro and their efficacy in reducing inflammation. Six of the seven commercially available
cow’s milk samples had TGF-β2 concentrations about 0.3 – 3 μg/L after pasteurization and
manufacturing processes. About half of the concentration was in the active form. Two milks with the
27
highest TGF-β concentrations were chosen for further experiments and it was found that such an
activity was able to provide protection against dextran sodium sulphate (DSS) -induced colitis and
lipopolysaccharide (LPS) -induced endotoxemia in mice. This was mainly due to circulating TGF-β, but
other mechanisms might also be involved (Ozawa et al., 2009). When milk with about 3 μg/L TGF-β2
was administered to humans (10 mL/kg), the serum plasma TGF-β2 levels were increased 4 hours
after the intake. Ozawa et al. (2009) concluded that cow’s milk might provide benefits for human
health. This implication was strengthened by the studies of Ando et al. (2007) which showed that
orally administered TGF-β retains sufficient biological activity in intestinal mucosa of mice and
enhances oral tolerance and thus might become a potential strategy to prevent allergic diseases,
such as food allergies.
Lönnerdal et al. (2009) studied the digestion of human milk and infant milk formulas in vitro. They
incubated the samples with pepsin in different pHs (5.0, 3.5, 2.0) which reflect the maturity of the
infant gut. Digestion at pH 2.0 or 3.5 increased the immunodetectability of the samples and following
pancreatin incubation even increased it. The immunodetectable samples were also highly bioactive
with both methods used, indicating that TGF-β can survive digestion and exert its biological activity.
Nabil et al. (2011) studied the digestion of TGF-β2 and IGF-I in a computer-controlled dynamic
gastrointestinal system (TIM-1). They used a bovine whey protein extract, which was rich in growth
factors. In their study, which simulated the gastrointestinal system in vitro, they found that TGF-β2
survived the digestion, but IGF-I was totally hydrolyzed in the same conditions. They concluded that
TGF-β2 ingested as a component of protein material could exert its biological activity and give
benefit for the consumer, because at the same time the potential cancer risk associated with IGF-I
can be avoided because of the total hydrolysis of this component.
The survival of IGF-I in digestions is not clear or as well demonstrated as that of TGF-β2. It is generally
believed that IGF-I is hydrolysed by proteolytic enzymes. Xian et al. ( 1995) studied the survival of
IGF-I in rats’ gut using radiolabeled (125I) IGF-I. It was found that IGF-I was degraded very rapidly,
within 2 min, in duodenum and ileum segments. IGF-I was slightly more stable in the stomach and
considerably more stable in the colon. However, it was found that casein, and to a lesser extent, BSA
and Lf, were effective in the preserving the structural integrity and receptor binding activity of IGF-I
in both stomach and duodenum fluids. Xian et al. (1995) concluded that IGF-I cannot be expected to
retain bioactivity if delivered orally because of rapid proteolysis in the upper gut. IGF antibodies and
dietary protein casein may protect the IGF-I from degradation in the gastrointestinal tract.
In the work of Mero et al. (1997) the effects of bovine colostrum base preparation were studied on
serum IGF-I, IgG, growth hormone, and amino acid and saliva IgA concentrations during a strength
and speed training period. During 8 days two different amounts of colostrum drink were given to
athletes, with IGF-I concentrations of 67.6 μg/L and 13.5 μg/L. The placebo sample was regular whey
from milk, which according to the author had undetectable concentration of IGF-I. There was a
significant increase in IGF-I levels especially with the higher dose of colostrum drink in athletes during
strength and speed training. There was also an increase in insulin levels. Mero et al. (1997) discussed
the possible mechanism for growth and increase in IGF-I concentration after colostrum
supplementation. They proposed that the natural target of growth factors in colostrum is the
28
gastrointestinal tract. The increased growth and turnover of the intestine can provide healthier gut
and better intake of dietary components, which may enhance growth generally. The strong
relationship between IGF-I and insulin concentrations observed in this experiment confirmed the role
of IGF-I and insulin in protein anabolism. IGF-I promotes muscle protein anabolism by stimulating
protein synthesis, whereas insulin inhibits proteolysis in human muscles and thus increases protein
synthesis (Mero et al., 1997).
The second experiment of Mero et al. (2002) concerned about the effect of orally administered
colostrum preparation rich in IGF-I on blood and saliva variables in athletes during a period of two
weeks. The athletes were given 20 g of colostrum preparation daily, which contained 74 μg IGF-I.
During this time circulating IGF-I and saliva IgA levels increased significantly compared to subjects
receiving a placebo, which in this experiment was maltodextrin. The increase in IGF-I was 17% and
that of IgA 33%. In the same experiment the intake of IGF-I was studied with radiolabelled
recombinant IGF-I. This study showed that long-term supplementation of IGF-I increased the serum
IGF-I levels and saliva IgA concentrations, but it was also shown that radiolabelled IGF-I was
fragmented in circulation and that no free IGF-I or its binding proteins was found, indicating that
there is no absorption of IGF-I from colostrum. The increase of IgA in saliva was proposed to be due
to TGF-β in colostrum.
29
3. Aims of the study
Growth factors in bovine milk have attracted considerable interest in the dairy industry because of
their growth-promoting activity. There have been several attempts to separate and concentrate
these molecules for use as bioactive supplements to regular dairy products. Growth factor separation
in the dairy industry has generally meant a process which produces a growth factor concentrate
which includes several other growth factors besides IGF-I and TGF-β2. However these are the two
which have been the most studied and analysed, not only because of their effects but also because
there have been suitable analysis methods available. The interest to bovine insulin is opposite
because of the possible connection for type I diabetes.
In industrial processes the growth factor concentration has started from dairy whey after cheese
making or some other manufacturing process. In experiments in which colostrum has been used, the
casein fraction has been separated and discarded. Knowledge concerning the thermal behavior of
growth factors is based on observations of how these growth factors can survive different time-
temperature combinations. The possibility to find an active form of the growth factor in milk has
been considered only in very few studies. There is no study in which the thermal behavior of IGF-I
and TGF-β2 has systematically been studied in milk while simultaneously investigating how heat
treatment affects the growth factor activation and separation in different fractionation processes.
Very few studies have been made of bovine insulin in general. In this study insulin was studied due to
the similarities, but also differences between insulin and IGF-I molecules.
The aims of the present study were:
To study the heat-stability and the effects of heating on bovine milk IGF-I, TGF-β2 and insulin
in different heat treatments
To study how the fractionation of milk by acid precipitation and ultracentrifugation affect the
growth factor separation in vitro
To study how membrane filtration techniques, MF and UF, affect the growth factors and
insulin in pilot scale
To study whether pasteurization as a pre-treatment before fractionation affects the
separation in MF and UF
To study whether there is a difference in the digestibility of active and latent TGF-β2 and IGF-
I in vitro
30
4. Materials and methods
4.1. Origin and preparation of milk samples
Milk used for all the experiments was non-pasteurized pooled milk from a single dairy farm taken on
the day of milking. The farm had 22 cows, 21 of which were Ayrshire and 1 Friesian cattle. Milk
samples (20-40 L) were taken all the year round and the cows were at different stages of lactation.
On the day of milking fat was removed from the milk by centrifuging at 3625 g for 20 min at 4 °C
(Beckman Model J-6M Induction Drive Centrifuge, Beckman Instruments Inc. Palo Alto CA USA). After
fat removal, the milk was stored at 4°C overnight. This procedure was performed for every
experiment.
Five colostrum samples (publication II) came from the same farm as the other milk samples and the
fat was removed in the same way as for normal milks. Three of the samples were from the first
milking, two were from the second and third milkings.
4.2. Heat-stability experiments with growth factors and insulin (I, II, IV).
On the day after fat removal, the fat-free milk sample was divided into 5 portions, each about 4-5
litres, and heat-treated in pilot scale equipment (DIP processor, MicroThermics Inc. Raleigh, NC, USA)
using an indirect tubular heater with a flow rate of 1 L/min. The heat treatments were 65, 72, 90 or
135°C for 15 s, followed by cooling to 15-20°C. Dry matter was analysed to make sure that there was
no dilution of samples during heat treatment.
The heat-treated milks were divided into smaller portions, (5 – 100 mL) and frozen at -20°C to wait
for the growth factor and insulin analyses and the next step in the experiment, which was separation
to casein and whey. The scheme of the experiment is presented in Figure 7.
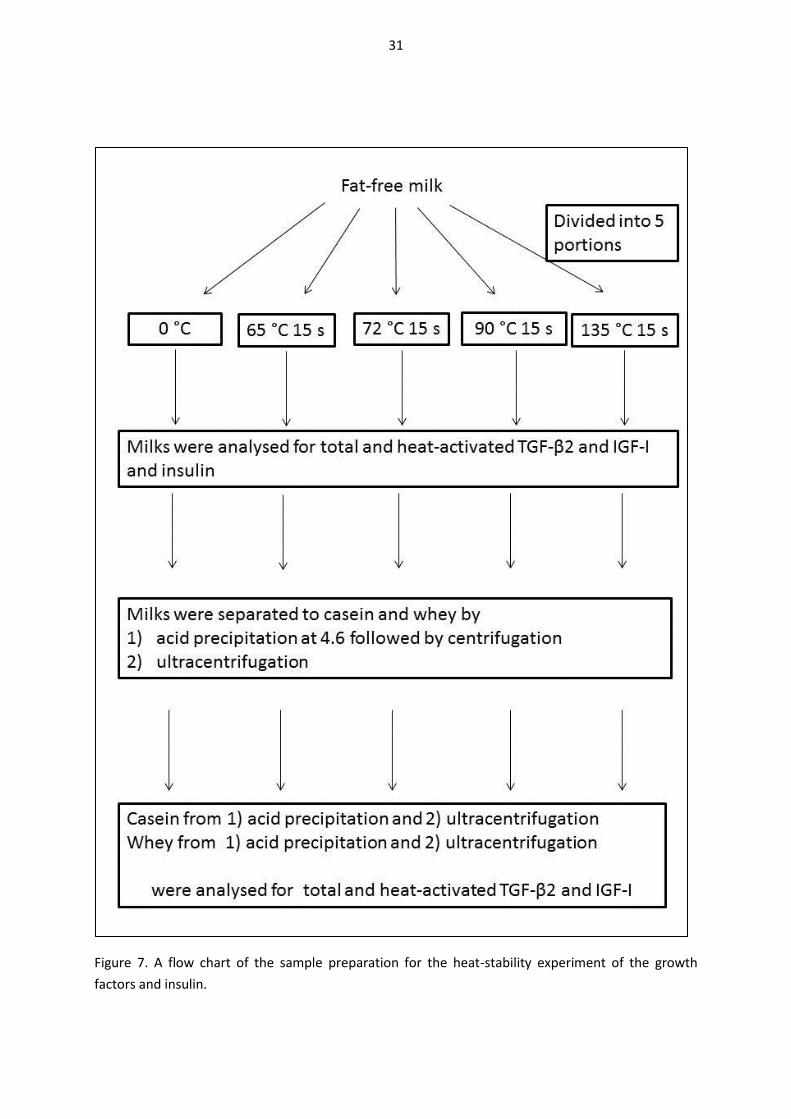
31
Figure 7. A flow chart of the sample preparation for the heat-stability experiment of the growth
factors and insulin.
32
4.2.1. Casein precipitation and whey separation
A 20 mL aliquot of each heat-treated milk sample was adjusted to pH 4.6 with 1 N HCl. The
precipitated casein was separated by centrifugation at 3000 g for 20 min (Heraeus Sepatech
megafuge 1.0 DJB Labcare, Newport Pagnell, UK) at room temperature. The clear supernatant, whey,
was neutralized to pH 7 for analysis. The precipitate, casein, was dissolved in the original milk volume
of 0.05 M Tris-HCl buffer - 0.1M EDTA, pH 7.4, containing BSA at 0.5 mg/mL. The samples obtained
from the described treatments were used for TGF-β2 and IGF-I analyses.
Tris-hydrochloride (AppliChem GmbH, Darmstadt, Germany), EDTA disodium salt (Merck KGaA
Darmstadt, Germany), BSA (Sigma, catalogue number A7638, Sigma Co, St Louis, MO), HCl and NaOH
(Mallinkrodt Baker, Deventer, the Netherlands) were of analytical grade.
4.2.2. Casein and whey separation by ultracentrifugation
The second set of heat-treated milk samples were separated to casein and whey by
ultracentrifugation at 60 000 g for 1 h at 4°C (Beckman L8-70M Ultracentrifuge, Beckman Coulter
Inc., Fullerton, CA, USA). The casein pellet was dissolved in Tris-BSA buffer as in the acid
precipitation. Whey was used for analysis as such. The total and active amounts of TGF-β2 and heat-
activated IGF-I were analysed from the whey and casein fractions from each heat treatment.
4.3. Follow-up studies of the heat stability experiments
The results of the heat-stability tests were examined in order to confirm the results either from the
analytical point of view or to determine whether they were applicable to the industrial scale.
4.3.1. TGF-β2 analysis from cheese (I)
In publication I four cheese samples, milk from cheese vats and whey were analysed for total and
heat-activated TGF-β2. The samples came from the Valio Lapinlahti and Haapavesi plants.
Five grams of finely grated cheese were mixed with 45 mL of Tris-BSA buffer and homogenized to a
fine slurry with a chopper (Moulinette S type 643, Groupe SEB, Ecully Cedex, France) at room
temperature for 40 s. The slurry, milk and whey were analysed for TGF-β2 as described in section
4.6.1.
4.3.2. Determination of optimal heating time for IGF-I activation (II)
The optimal heating time for IGF-I activation was studied in vitro, when six test tubes with 2 mL of
raw milk were heat-treated in a water bath at 90⁰C for 15 or 30 s or for 1, 2, 3 or 4 min. The specified
time was the exact holding time at 90⁰C after this temperature was reached, which took about 1 min.
After heat treatment the tubes were cooled rapidly in running water and the samples were analysed
for active IGF-I.

33
4.3.3. Study of interfering proteins in IGF-I analysis (II)
The effects of lactoferrin and other protein components of milk which could interfere with the IGF-I
analysis, were studied in the following experiment. Defatted non-heat-treated raw milk was spiked
with 2.6 ng/mL of the kit’s active IGF-I standard and the milk was divided into several 2 ml portions.
Two concentrations, 0.2 mg/mL and 0.4 mg/mL , of Lf (Bioferrin 1000, Glanbia Foods, Twin Falls, ID,
USA) or 0.2 and 0.4 mg/mL of BSA were added to the spiked milks. One sample was also prepared
containing both Lf and BSA at concentrations of 0.4 mg/mL. The samples were analysed for IGF-I
before and after heating at 90 C for 1 min. Micellar casein, which was free of whey proteins
(Aaltonen and Ollikainen, 2011) and whey protein isolate (WPI, Alacen 894, Fonterra, Wellington,
New Zealand) was made up to a 3% solution in the kit’s calibrator diluent and spiked with IGF-I and
analysed before and after heat treatment. The buffer with and without 0.4 mg/mL BSA was also
treated similary.
4.3.4. Comparison of acid-ethanol extraction and heating as pre-treatments for IGF-I
analysis (II)
The total IGF-I concentrations in five colostrum samples were compared using either acid-ethanol
extraction or heating at 90⁰C for 1 min as a pre-treatment method. The samples for acid-ethanol
extraction were analysed from dilutions of 1:100 – 1:400. The samples for heat treatment were first
diluted 1:50 – 1:200 to avoid coagulation in the kit’s calibrator diluent and then heated at 90 C for 1
min. Heated samples were analysed directly without any other treatments.
4.4. Growth factor distribution during microfiltration and ultrafiltration with
non-pasteurized and pasteurized milk (III and IV)
Membrane filtrations, MF and UF, were used to separate and concentrate milk casein from whey
proteins. IGF-I, TGF-β2 and insulin were followed throughout the process. About thirty litres of non-
fat milk was used to feed the microfiltration unit. If milk was pasteurized, this was performed on the
same day when milk fat was removed. The concentration was continued until the volumetric
concentration factor (VCF) reached 3.0. Retentate was then washed with 15 litres of water in a
diafiltration (DF) phase. The permeate was kept overnight at 4 C and the following day the process
was continued by UF of the obtained MF permeate, to further concentrate whey proteins. After
concentration, the UF retentate was washed with 20 litres of water. Exact amounts of milk and
permeates were recorded for calculation. The filtration procedure is illustrated in Figure 8.
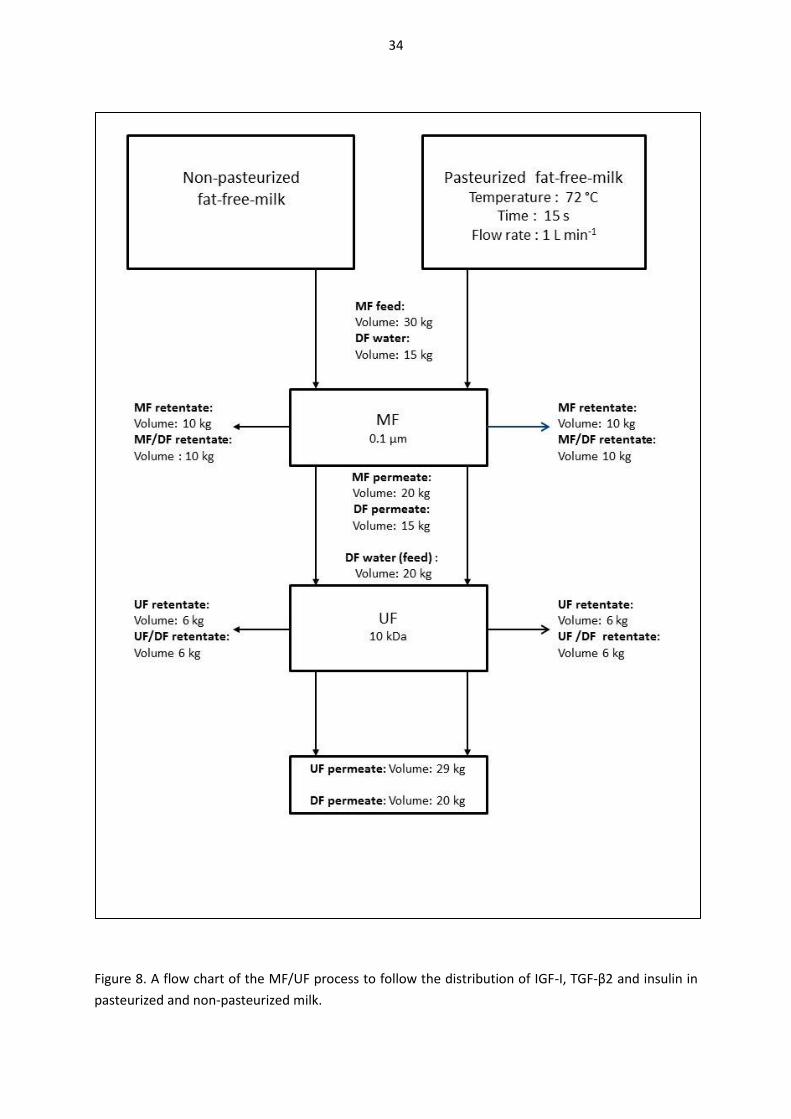
34
Figure 8. A flow chart of the MF/UF process to follow the distribution of IGF-I, TGF-β2 and insulin in
pasteurized and non-pasteurized milk.
35
During filtrations, several samples were taken from MF and MF/DF retentates and permeates and UF
and UF/DF retentates and permeates. The samples were divided into small aliquots and each sample
was frozen at -20°C and thawed only once for analysis. The samples were analyzed for total and
active TGF-β2, total IGF-I, bovine insulin, dry matter, protein, casein, α-lactalbumin, β-lactoglobulin
and lactose.
4.4.1. Microfiltration equipment and procedures
Microfiltration was performed using a crossflow microfiltration unit (Tetra Alcross, Tetra Pak, Lund,
Sweden). The ceramic membrane was Membralox P19-40 (SCT, Bazet, France) with a nominal pore
size of 0.1 μm and membrane area of 0.24 m2. The transmembrane pressure (TMP) was kept at 0.5
bar by manually adjusting the pressure on the permeate side. As the unit was run in the uniform
transmembrane pressure mode (UTMP), the TMP was constant along the length of the membrane
element. The temperature during the filtration was maintained at 10 -20C. The filtration process
was operated in batch mode and was continued until a VCF of 3.0 was reached. The retentate was
then washed in three consecutive diafiltration steps, in which 15 litres of water was added in 5 L
aliquots after 0, 5 and 10 L of permeate had been collected. The total amount of permeate obtained
from the MF was 35 litres; this was used as feed in ultrafiltration.
4.4.2. Ultrafiltration equipment and procedures
Ultrafiltration was performed using a Millipore ProScale equipment (Multi-Purpose Filtration System
type ProScale, Millipore S.A., Molsheim, France). The membrane was Koch HFK-131 (Koch Membrane
Systems Inc., Wilmington, MA, USA), with a molecular weight cut-off of 10 kDa. The permeate flux
during filtration was maintained at 13 – 18 kg m-2 h-1 . The filtration was started by concentrating the
MF permeate until the feed tank was drained, at which point a VCF of 8 – 10 was reached. Filtration
was then continued with four diafiltration steps, in which 20 litres of water was added in 5 L aliquots
after 0, 5, 10 and 15 L of permeate had been collected. The purpose of the diafiltration was to
further purify the fraction containing the growth factor by washing lactose, non-protein-nitrogen
(NPN) and inorganic components into the permeate.
4.5. Gastric-duodenal in vitro digestion of milk samples (unpublished
experiment)
Two milk samples, one with no heat treatment and the other heat-treated at 90⁰C for 15 s, were sent
to VTT Technical Research Centre of Finland in order to study the digestion of TGF-β2 in vitro. The
aim of the experiment was to determine whether there is a difference in the gastric-duodenal
digestion when TGF-β2 is latent (non-heat-treated milk) or active (heat-treated milk) and whether
there is a difference between the adult and infant model. The differences in the experiment between
the adult and infant model are presented in Table 3.The digestion was performed by the method of
Dupont et al. (2010) except that no phosphatidylcholine vesicles were used. The experiments were
performed with the milk protein concentration of 5 mg/mL. Samples for the total and activated TGF-
36
β2 analyses were taken during the incubation of both phases (Table 3). The adult model was also
performed without digestion enzymes in order to ensure that the experimental conditions did not
interrupt the result.
The samples from the infant model and control experiment were also analysed for the total
concentration of IGF-I using the method of Castigliego et al. (2011).
Table 3. Experimental conditions during the gastric duodenal digestion of milk at 37°C.
Parameter Infant model Adult model Incubation time
pH 3.0 2.5 Amount of pepsin 22.75 U/ mg protein 182 U/ mg protein 5 min (infant), 20 min, 60
min
Amount of trypsin 3.45 U/ mg protein 34.5 U/ mg protein 10 min, 30 min
Amount of chymotrypsin 0.04 U/ mg protein 0.4 U/ mg protein 10 min, 30 min
4.6. Chemical analyses
4.6.1. Immunochemical TGF-β2 analysis ( I and III and section 5.9)
The concentration of TGF-β2 was analysed with an immunological sandwich type ELISA analysis kit
(Quantikine® Human TGF-2 from R&D Systems, Inc. Minneapolis, USA). Other reagents for protein
release and analysis were HEPES-free acid (MP Biomedicals LLC, Solon, Ohio USA), HCl and NaOH
(Mallinkrodt Baker, Deventer, the Netherlands). All the reagents were of ACS quality or equivalent.
The samples were diluted in the kit’s Calibrator diluent after acid activation of their latent TGF-β2 to
the immunoreactive form, and the analysis was performed according to the manufacturer’s
instructions. The samples were also measured without acid activation in order to study the
proportion of naturally active or heat-activated TGF-β2. The dilutions were made suitable to match
the linear part of the standard curve. Two or three different dilutions of each sample were used and
each dilution was made in duplicate. All the dilutions were made using polypropylene test tubes.
4.6.2. Immunochemical IGF-I analysis (II and IV and section 5.9)
In the publication II, concentrations of IGF-I were analysed with an immunological sandwich-type
ELISA analysis kit (Quantikine® Human IGF-I from R&D Systems, Inc. Minneapolis, MN, USA). The
analyses were performed according to the manufacturer’s instructions, but no acid-ethanol pre-
treatment was made because only the heat-activated immunoreactive form of IGF-I was detected.
The milk, casein or whey samples were undiluted or diluted 1:2 – 1:4 in the kit’s calibrator buffer
using polypropylene test tubes. At least two of the dilutions 1:1 – 1:4 were used for analysis and each
dilution was made in duplicate.
In the publication IV and section 5.9. the different filtration fractions were analysed for IGF-I as
described by Guidi et al. (2007) and modified by Castigliego et al. (2011 ). In this method IGF-I is
released from its binding protein by acid treatment and the free binding protein is bound to an
excess amount of IGF-II (recombinant human TGF-β2 302-B2, R&D Systems, Minneapolis, MN, USA).
37
The dilution of the sample is only 1:4. The method was originally developed for milk, but it was
validated for each of the sample matrices used in this study.
The heat-treated milk samples from the heat stability experiment described in section 4.2. were also
tested with the method of Castigliego et al. (2011).
4.6.3. Immunochemical insulin analysis (IV)
Insulin concentrations in milk samples were analyzed using an AutoDELFIA® Human Insulin Kit
(PerkinElmer Life and Analytical Sciences, Wallac Oy, Turku, Finland). The kit was a solid phase, two-
site fluoroimmunoassay based on the direct sandwich technique using Eu-labelled antibody. The
analysis was performed according to the manufacturer’s instructions and validated for milk. The
AutoDelfia kit was designed for automatic analysis, but in this study it was performed manually. Each
sample was measured at least in triplicate, directly and with 1:2 dilution.
4.6.4. Other chemical analyses
Dry matter was analysed by the method of the International Dairy Federation (1987) or rapid
microwave analysis (Cartwright et al., 2005)
Total protein content (total nitrogen x 6.38) was analysed according to the Kjeldahl method
(International Dairy Federation, 2001)
Total casein content was calculated from the total casein nitrogen using the method of the
International Dairy Federation (2004).
Lactose was analysed using a modified enzymatic method (International Dairy Federation, 2002).
α-Lactalbumin (α-LA) and β-lactoglobulin (β-LG) were determined with a reverse phase high pressure
liquid chromatography (RP-HPLC) method (Thomä et al., 2006).
β-casein was analysed with fast protein liquid chromatogaphy equipment as described by Syväoja
(1992).
4.7. Standards used for validation
Each of the immunochemical methods was validated for the matrices in which it was used using the
following standards of NIBSC/WHO (National Institute for Biological Standards and Control,
Hertfordshire, UK):
Bovine TGF-β2 standard 89/ 518
IGF-I standard 02-254
Bovine insulin standard (83/511)
38
4.8. Calculations (III and IV)
The volumetric concentration factor (VCF) was calculated from the equation (1)
VCF = Vfeed / Vret (1)
where Vfeed is the initial feed volume and Vret the current retentate volume
Vret was determined from equation (2)
Vret = Vfeed - Vperm (2)
where Vperm is the current permeate volume
The yield obtained during the filtration process was calculated from equation (3)
Yield (%) =(Mass of component (μg) in retentate/Mass of component (μg) in feed) x 100 (3)
4.9. Statistical analysis
The experiments were performed three or four times.The results were evaluated by statistical
analysis using one way analysis of variance (ANOVA). The analyses were performed using Excel
software (Excel version 2007, Microsoft, Redmond, Washington, USA).
39
5. Results and discussion
5.1 Heat stability of TGF-β2, IGF-I and insulin (I, II, IV)
TGF-β2, IGF-I and insulin showed good heat stability during pasteurization at 65 and 72°C; the
concentrations were the same as in the non-heat-treated milks (I Figure 1; IV Figure 1; Figure 9). At
90°C the concentrations started to decline probably due to denaturation and at 135°C only 37% of
TGF-β2, 27% of IGF-I and 37% of insulin were detectable by the immunochemical method.
The average TGF-β2 concentration in three non-heat-treated pooled milk samples was 43.1 ± 3.5
ng/mL. The TGF-β2 concentration of approximately 40 ng/mL was a good average of the farm and
dairy milks used in the present work. This concentration level was also obtained in the experiment in
which milk from cheese-making was analysed for TGF-β2. This milk represented a greater number of
dairy farms and a larger volume of milk. It was also verified that skimming did not affect the TGF-β2
concentration. The fat layer which was separated and analysed, had approximately 70% fat and 73%
dry matter and 5.9 ng/mL TGF-β2. There was no difference in TGF-β2 concentrations before and after
skimming.
The average IGF-I concentration of three non-heat-treated milk samples was 1.6 ng /mL using the
method of Guidi et al. (2007) and Castigliego et al. (2011) (Figure 9). The average concentration of
1.1 ng/mL was obtained using heating as a pre-treatment method, indicating interference due to β-
lactoglobulin (section 5.6). In the filtration experiments the average IGF-I concentration of all the
non-heat-treated milks was 1.8 ± 0.2 according to the method of Guidi et al. (2007).
The average insulin concentration of all the milk samples during this study was 0.6 ± 0.05 ng/mL , but
the true concentration is probably closer to 1 ng/mL, because the recovery of insulin in milk was only
about 50 – 60% with the immunochemical method which was used.
Dry matter analyses confirmed that there was no dilution of milks during heat treatments.
5.2. Heat-induced changes in the immuno-detectability of TGF-β2 and IGF-I (I,
II)
In non-heat-treated farm milk TGF-β2 and IGF-I existed in the latent form. When milks were heat-
treated at 65, 72, 90 or 135°C with the same holding time, TGF-β2 and IGF-I changed from latent to
active form (I Figure 1; II Figure I;Figure 9). This was seen during the growth factor analyses, which
were performed directly or after a suitable dilution using ELISA immunoassay. There was no need to
perform a separate acid or acid-ethanol pre-treatment step to release the binding proteins. TGF-β2
was more sensitive to heat activation than IGF-I (I figure 1; II Figure 1; Figure 9). When milk was
heated at 65°C for 15 s, TGF-β2 started to activate and the share of active form increased with
increasing temperature. At a heat treatment of 90°C for 15 s, all the growth factor was in the active
form. This was verified with the acid pre-treatment method, which gave the same concentration. In
this experiment the highest temperature for heating was 135°C, at in which all the TGF-β2 was in the
40
active form, but the total concentration was less than at 90°C, probably due to denaturation of the
growth factor. The heat-induced changes in the concentrations of active TGF-β2 were significant (p<
0.01, p< 0.001) compared to the non-heat-treated milks. A small share, about 16%, of the total TGF-
β2 concentration was in the active form in fresh, non-heat-treated milk probably due to the plasmin
activity in bovine milk, which can release the active form of the growth factor (Lyons et al., 1990).
The result supported the study of Akbache et al. (2011) who found that in pasteurized milk the casein
fraction contained most of TGF-β2. They also found that heating of milk decreased TGF-β2 content in
whey and was not measurable after heating at UHT temperature.
IGF-I exhibited the same kind of behavior, but was less sensitive to heating. A significant change (p=
0.003) from latent to active form was seen at 90°C, when the concentration of active IGF-I sharply
increased and was measurable without a separate pre-treatment (II Figure 1; Figure 9). The
activation was not 100%, but this was due to the short heating time, which is discussed in section 5.5.
Milks which were heat-treated at 65⁰C or 72⁰C for 15 s had a low concentration, which was just
above the detection threshold of 0.17 ng/mL. The reason for the sharp increase in the immuno-
detectability of IGF-I at 90°C was not studied on the molecular level. It is possible that at this
temperature the –S-S- disulphide bridges between active IGF-I and its binding proteins are affected
and the free IGF-I is released. It is more probable that the binding protein or proteins are denatured
at this temperature, thus enabling the IGF-I to react in immunoassay (Baumrucker, 2012). No active
IGF-I was found in non-heat-treated milk.
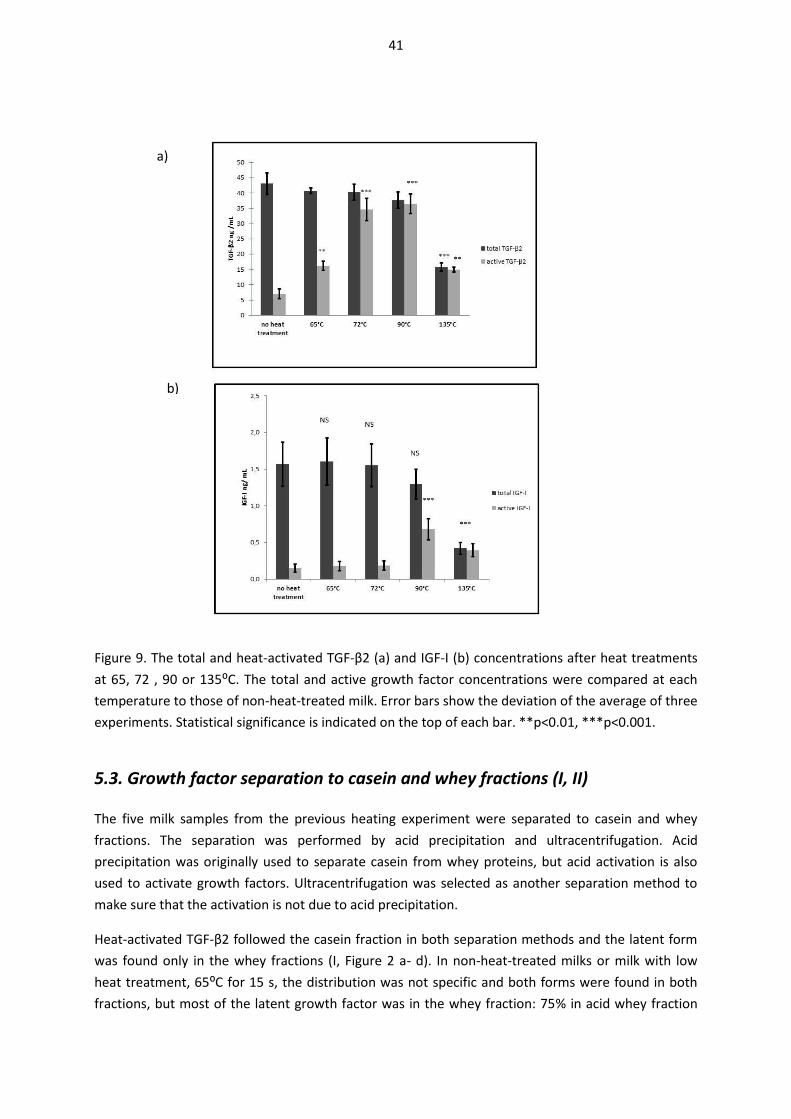
41
Figure 9. The total and heat-activated TGF-β2 (a) and IGF-I (b) concentrations after heat treatments
at 65, 72 , 90 or 135⁰C. The total and active growth factor concentrations were compared at each
temperature to those of non-heat-treated milk. Error bars show the deviation of the average of three
experiments. Statistical significance is indicated on the top of each bar. **p<0.01, ***p<0.001.
5.3. Growth factor separation to casein and whey fractions (I, II)
The five milk samples from the previous heating experiment were separated to casein and whey
fractions. The separation was performed by acid precipitation and ultracentrifugation. Acid
precipitation was originally used to separate casein from whey proteins, but acid activation is also
used to activate growth factors. Ultracentrifugation was selected as another separation method to
make sure that the activation is not due to acid precipitation.
Heat-activated TGF-β2 followed the casein fraction in both separation methods and the latent form
was found only in the whey fractions (I, Figure 2 a- d). In non-heat-treated milks or milk with low
heat treatment, 65⁰C for 15 s, the distribution was not specific and both forms were found in both
fractions, but most of the latent growth factor was in the whey fraction: 75% in acid whey fraction
a)
b)
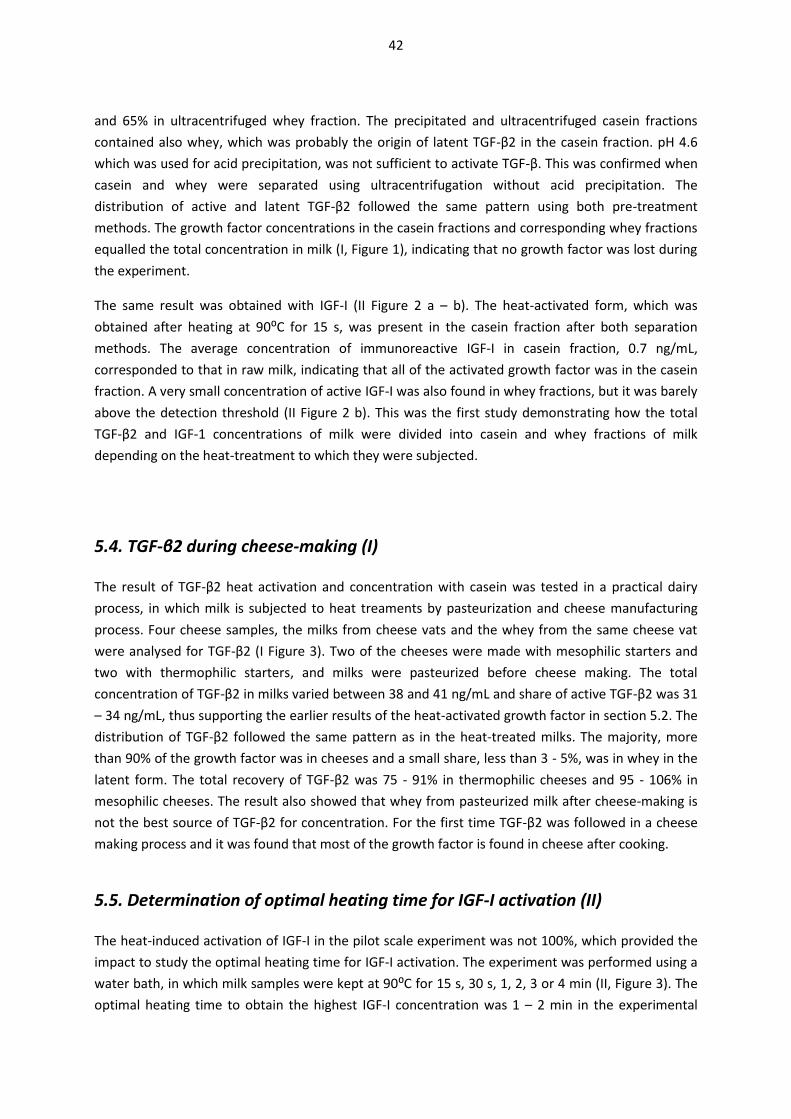
42
and 65% in ultracentrifuged whey fraction. The precipitated and ultracentrifuged casein fractions
contained also whey, which was probably the origin of latent TGF-β2 in the casein fraction. pH 4.6
which was used for acid precipitation, was not sufficient to activate TGF-β. This was confirmed when
casein and whey were separated using ultracentrifugation without acid precipitation. The
distribution of active and latent TGF-β2 followed the same pattern using both pre-treatment
methods. The growth factor concentrations in the casein fractions and corresponding whey fractions
equalled the total concentration in milk (I, Figure 1), indicating that no growth factor was lost during
the experiment.
The same result was obtained with IGF-I (II Figure 2 a – b). The heat-activated form, which was
obtained after heating at 90⁰C for 15 s, was present in the casein fraction after both separation
methods. The average concentration of immunoreactive IGF-I in casein fraction, 0.7 ng/mL,
corresponded to that in raw milk, indicating that all of the activated growth factor was in the casein
fraction. A very small concentration of active IGF-I was also found in whey fractions, but it was barely
above the detection threshold (II Figure 2 b). This was the first study demonstrating how the total
TGF-β2 and IGF-1 concentrations of milk were divided into casein and whey fractions of milk
depending on the heat-treatment to which they were subjected.
5.4. TGF-β2 during cheese-making (I)
The result of TGF-β2 heat activation and concentration with casein was tested in a practical dairy
process, in which milk is subjected to heat treaments by pasteurization and cheese manufacturing
process. Four cheese samples, the milks from cheese vats and the whey from the same cheese vat
were analysed for TGF-β2 (I Figure 3). Two of the cheeses were made with mesophilic starters and
two with thermophilic starters, and milks were pasteurized before cheese making. The total
concentration of TGF-β2 in milks varied between 38 and 41 ng/mL and share of active TGF-β2 was 31
– 34 ng/mL, thus supporting the earlier results of the heat-activated growth factor in section 5.2. The
distribution of TGF-β2 followed the same pattern as in the heat-treated milks. The majority, more
than 90% of the growth factor was in cheeses and a small share, less than 3 - 5%, was in whey in the
latent form. The total recovery of TGF-β2 was 75 - 91% in thermophilic cheeses and 95 - 106% in
mesophilic cheeses. The result also showed that whey from pasteurized milk after cheese-making is
not the best source of TGF-β2 for concentration. For the first time TGF-β2 was followed in a cheese
making process and it was found that most of the growth factor is found in cheese after cooking.
5.5. Determination of optimal heating time for IGF-I activation (II)
The heat-induced activation of IGF-I in the pilot scale experiment was not 100%, which provided the
impact to study the optimal heating time for IGF-I activation. The experiment was performed using a
water bath, in which milk samples were kept at 90⁰C for 15 s, 30 s, 1, 2, 3 or 4 min (II, Figure 3). The
optimal heating time to obtain the highest IGF-I concentration was 1 – 2 min in the experimental
43
conditions. The highest average concentration which was obtained, was 1.1 ng/mL, compared to 0.7
ng/mL obtained after heating for 15 s in the pilot experiment in section 5.2. This increase of the IGF-I
concentration was statistically significant (p<0.001). It was concluded that heat treatment at 90⁰C for
1 min is a suitable method to activate IGF-I for analyses of milk samples with low IGF-I concentration
and to avoid the acid pre-treatment, which dilutes the sample. It was also noted that every time
heating is used as an activation method the optimal heating time for the experiment must be tested,
because the amount of the sample in the experiment affects the activation.
The recovery of standard IGF-I was studied in the same experimental conditions (II Figure 4). Addition
of the standard before and after the heat treatments was also compared. If the standard was added
before heating, the recoveries were highest, 86% and 77%, after heating for 30 s and 1 min
respectively. With longer heating times the recoveries were lower. When the standard was added
after heat-treatment, recoveries were 85 – 93%, indicating that heating affects the growth factor
probably by denaturation or there is an interference by other molecules during heating. Interference
by “an active factor” during IGF-1 analyses was also reported by Castigliego et al. (2011), who
proposed that it was due to IGFBPs that were not blocked.
5.6. Interfering proteins in IGF-I analysis (II)
The interfering proteins of IGF-I analysis were studied in the experiment in which standard IGF-I was
added in milk along with milk proteins such as casein, WPI, BSA and Lf. The recoveries of the heat-
treated samples were compared to those of non-heat-treated samples (II Figure 5). Standard IGF-I
was not affected by heat treatment. BSA, casein and Lf showed no interference during heat
treatments, but the recoveries in general in non-heat-treated samples were only about 47 – 50% for
BSA and lactoferrin and about 76% to casein indicating that there is a matrix effect. β-Lactoglobulin
showed the greatest effect on IGF-I during heating. When 3% WPI solution with or without standard
was heat-treated at 90⁰C for 1 min, the recovery of IGF-I diminished to 13 – 15% during heat
treatment. WPI had a milk-originated IGF-I concentration of 49 ng/g, which explained the decrease
during heating without the standard. β-Lactoglobulin interferes with the IGF-I activation strongly,
probably due to denaturation, which provides free –SH groups to bind IGF-I or mask the growth
factor for analysis. This may also be the reason, why the standard IGF-I recoveries in milk were
always less than 100%. The conclusion in the previous section that heating can be used as a pre-
treatment method for milk samples, also applies to casein samples and to milk protein samples with
low β-lactoglobulin concentration. This was the first study, where heating has been considered as a
pre-treatment method to activate milk IGF-1 for immunochemical analyses.
5.7. Comparison of acid-ethanol extraction and heating as pre-treatment
methods for analysis of IGF-I (II)
Heating at 90⁰C for 1 min as a pre-treatment method was compared to acid-ethanol pre-treatment
by analyzing five colostrum samples (II, Figure 6). The two methods did not give the same results,
44
probably because of the interference of β-lactoglobulin during heating. However these two pre-
treatment methods showed a good correlation: R2 was 0.9483, the slope was 18.624 and the Y-
intercept was 0.6458 indicating that heating can be used as a pre-treatment method when
comparing the IGF-I concentrations between similar samples.
5.8. Distribution of growth factors and bovine insulin during fractionation of
pasteurized and non-pasteurized milk using microfiltration and ultrafiltration
(III, IV)
Pasteurized and non-pasteurized milks were fractionated by MF and UF to separate and concentrate
casein from whey proteins. MF retentate comprised 90% casein of the total protein content, the rest
being whey proteins (IV, Table 2). DF which followed MF washed most of β-lactoglobulin and α-
lactalbumin to the MF permeate and after DF the casein content in MF retentate increased to 95%.
Because of this, MF retentate is also called the casein fraction in this study (III). UF retentate (whey
fraction), which was obtained after ultrafiltration of MF permeate, was 78% β-lactoglobulin and α-
lactalbumin and 8 - 11% casein. DF washed lactose from MF and UF retentates, which increased the
purity of these fractions.
5.8.1. Distribution of TGF-β2 (III)
During filtrations, TGF-β2 followed the same pattern as was found with heat-treated milks. The share
of TGF-β2 in casein fraction was 80% of the total amount of TGF-β2 in the milk used in this
experiment. All the activated TGF-β2 was in the casein fraction (III Figure 2 a and b; Figure 10 a). In
non-pasteurized milk the growth factor was mostly in the latent form and it was divided into both in
the MF and UF retentates (III Figure 2 a; Figure 10 a). There was significantly more (p <0.001) latent
TGF-β2 in the casein than in the whey fraction (55% vs. 37%), but this was probably due to the lower
concentration factor during MF (K=3) compared to the acid precipitation or ultracentrifugation (I
Figure 2), where the most of the latent form was in the whey. No TGF-β2 was found in the UF/DF
permeates, as predicted by the size of the TGF-β molecule (12.5 kDa) and the cut-off of the UF
membrane.
DF, which followed MF and UF, verified that MF retentate (casein fraction) retained the active TGF-
β2 and it was not washed out. This indicates that free or active TGF-β2 must have some kind of
interaction with casein, or high affinity for casein, because the molecular weight of TGF-β2 is less
than that of β-lactoglubulin and α-lactalbumin, which are separated from casein during MF. Active
TGF-β2 separation in the MF retentate was also seen in the TGF-β2 concentrations of MF permeates.
The permeate of pasteurized milk had lower TGF-β2 concentration than that of non-pasteurized milk,
5 ng/mL and 20 ng/mL respectively (III Figure 4). When the TGF-β2 concentrations were calculated
per protein content, the highest TGF-β2 concentration, 3.5 μg/g protein, was obtained in the MF
retentate of non-pasteurized milk (III Figure 3). In this fraction TGF-β2 was in the latent form. It is
noteworthy that the total concentration of TGF-β2 in this fraction is low and the high concentration
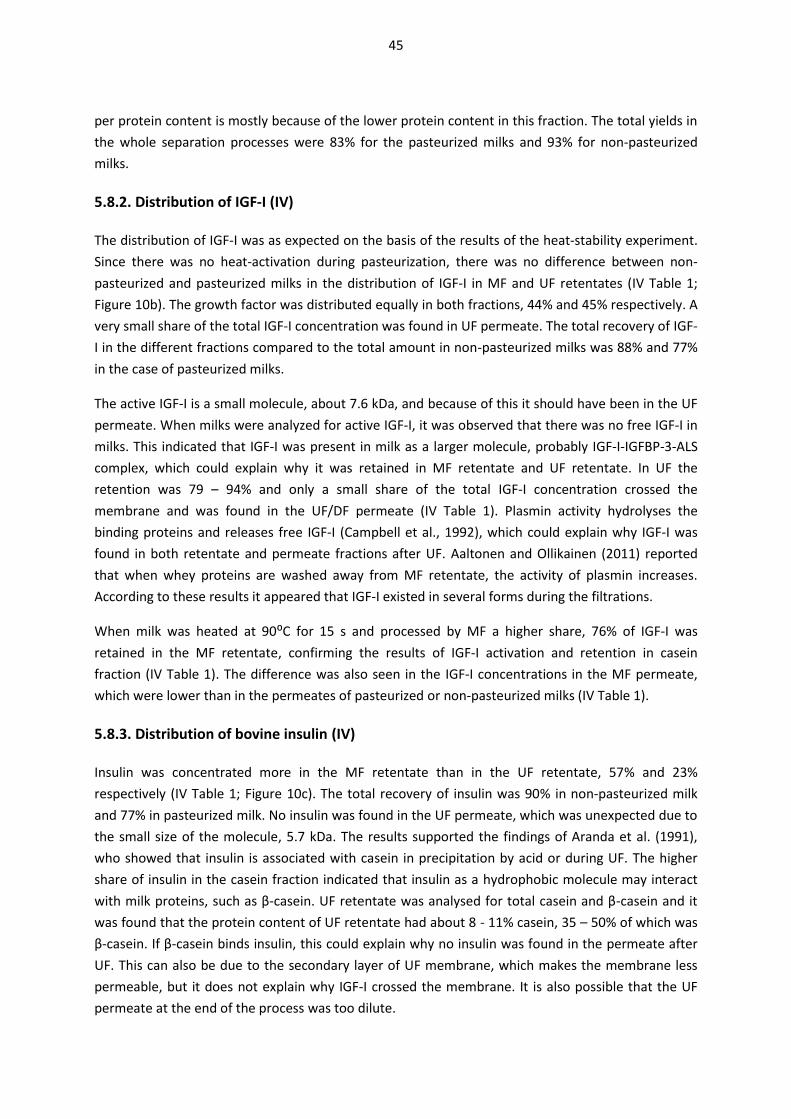
45
per protein content is mostly because of the lower protein content in this fraction. The total yields in
the whole separation processes were 83% for the pasteurized milks and 93% for non-pasteurized
milks.
5.8.2. Distribution of IGF-I (IV)
The distribution of IGF-I was as expected on the basis of the results of the heat-stability experiment.
Since there was no heat-activation during pasteurization, there was no difference between non-
pasteurized and pasteurized milks in the distribution of IGF-I in MF and UF retentates (IV Table 1;
Figure 10b). The growth factor was distributed equally in both fractions, 44% and 45% respectively. A
very small share of the total IGF-I concentration was found in UF permeate. The total recovery of IGF-
I in the different fractions compared to the total amount in non-pasteurized milks was 88% and 77%
in the case of pasteurized milks.
The active IGF-I is a small molecule, about 7.6 kDa, and because of this it should have been in the UF
permeate. When milks were analyzed for active IGF-I, it was observed that there was no free IGF-I in
milks. This indicated that IGF-I was present in milk as a larger molecule, probably IGF-I-IGFBP-3-ALS
complex, which could explain why it was retained in MF retentate and UF retentate. In UF the
retention was 79 – 94% and only a small share of the total IGF-I concentration crossed the
membrane and was found in the UF/DF permeate (IV Table 1). Plasmin activity hydrolyses the
binding proteins and releases free IGF-I (Campbell et al., 1992), which could explain why IGF-I was
found in both retentate and permeate fractions after UF. Aaltonen and Ollikainen (2011) reported
that when whey proteins are washed away from MF retentate, the activity of plasmin increases.
According to these results it appeared that IGF-I existed in several forms during the filtrations.
When milk was heated at 90⁰C for 15 s and processed by MF a higher share, 76% of IGF-I was
retained in the MF retentate, confirming the results of IGF-I activation and retention in casein
fraction (IV Table 1). The difference was also seen in the IGF-I concentrations in the MF permeate,
which were lower than in the permeates of pasteurized or non-pasteurized milks (IV Table 1).
5.8.3. Distribution of bovine insulin (IV)
Insulin was concentrated more in the MF retentate than in the UF retentate, 57% and 23%
respectively (IV Table 1; Figure 10c). The total recovery of insulin was 90% in non-pasteurized milk
and 77% in pasteurized milk. No insulin was found in the UF permeate, which was unexpected due to
the small size of the molecule, 5.7 kDa. The results supported the findings of Aranda et al. (1991),
who showed that insulin is associated with casein in precipitation by acid or during UF. The higher
share of insulin in the casein fraction indicated that insulin as a hydrophobic molecule may interact
with milk proteins, such as β-casein. UF retentate was analysed for total casein and β-casein and it
was found that the protein content of UF retentate had about 8 - 11% casein, 35 – 50% of which was
β-casein. If β-casein binds insulin, this could explain why no insulin was found in the permeate after
UF. This can also be due to the secondary layer of UF membrane, which makes the membrane less
permeable, but it does not explain why IGF-I crossed the membrane. It is also possible that the UF
permeate at the end of the process was too dilute.
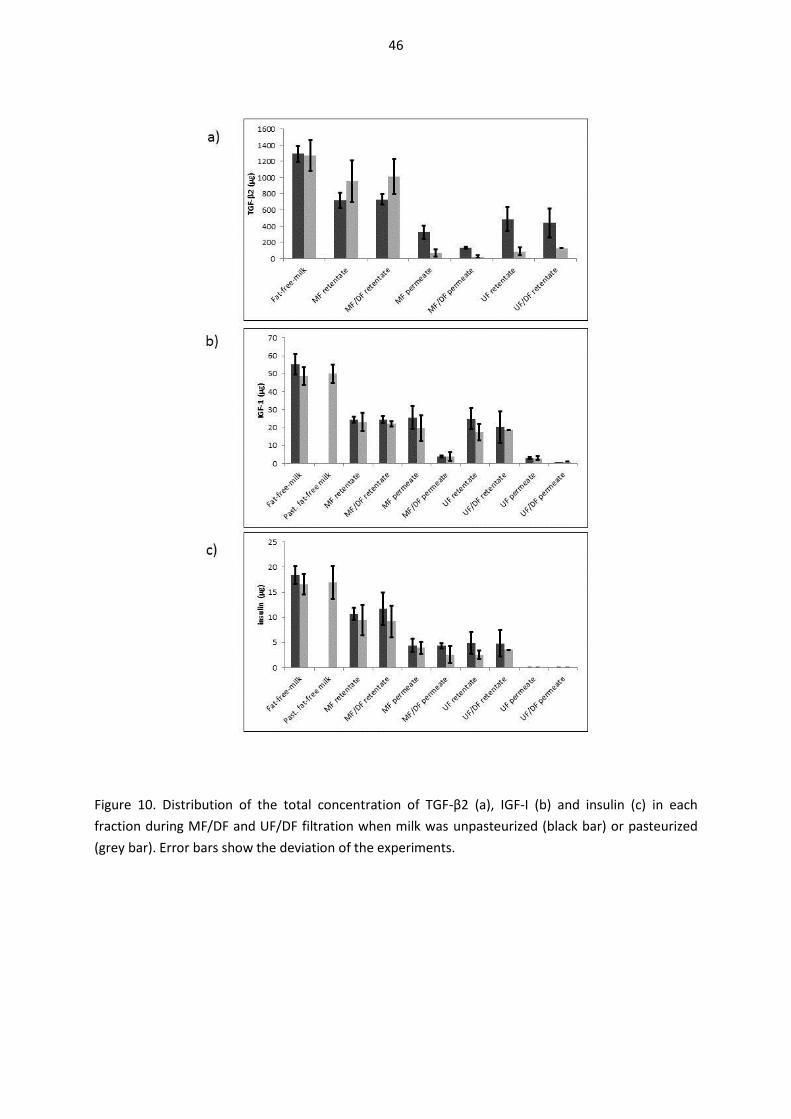
46
Figure 10. Distribution of the total concentration of TGF-β2 (a), IGF-I (b) and insulin (c) in each
fraction during MF/DF and UF/DF filtration when milk was unpasteurized (black bar) or pasteurized
(grey bar). Error bars show the deviation of the experiments.
47
5.9. Gastric-duodenal digestion of milk samples in vitro (unpublished results)
The result of the in vitro digestion experiment is illustrated in Figures 11 a – f for TGF-β2 and 12 a and
b for IGF-I.
a) b)
c) d)
e) f)
Figure 11. Gastric duodenal in vitro digestion of TGF-β2 in non-heat-treated and heat-treated milks in
an adult and infant model. Dark grey bar = latent TGF-β2, light grey bar = activated TGF-β2.
a = Non-heat-treated milk, adult model b = Heat-treated milk, adult model c = Non-heat-treated milk, infant model d = Heat-treated milk, infant model e = Non-heat-treated milk, adult model, no enzymes f = Heat-treated milk, adult model, no enzymes
In Figures 11 a and b the digestion of milk with the latent and active TGF-β2 is compared in the adult
model. The first samples in this model were taken after 20 min of pepsin digestion (gastric phase)
48
and the figures show that all the growth factor had been digested by this time. The result is the same
for latent and active TGF-β2. In the infant model (Figures 11 c and d) the first samples were taken
after 5 minutes of incubation with pepsin and it was observed that more than half of the TGF-β2
concentration remained. The TGF-β2 concentration diminished during the gastric phase and after 20
min of pepsin digestion about 50% of the original concentration remained. Following the duodenal
phase, after 30 min of trypsin-chymotrypsin digestion there was still a small share, less than 10%, of
TGF-β2 concentration left at the end of the experiment. The result was the same for the latent and
active forms. Figure 11 e and f are the control samples of the experiment, which verified that the
experimental conditions did not affect the experiment. Figure e shows that pH of the gastric phase
experiment activates the latent growth factor to active form.
The result is from one experiment, but it supports those of Lönnerdal et al. (2009), who also found
immunodetectable TGF-β2 after a digestion experiment with an infant formula. Lönnerdal et al.
(2009) also analysed the samples with two bioassays, which both showed the activity to be
biologically active. If the survival of TGF-β2 in vitro digestion is an indication that the molecule
survives digestion in vivo, it appears that infants and especially new-borns obtain more benefit from
growth factors in milk and milk-based infant formulas than adults do from regular milk. The
experiment also showed that the latent and active forms have no difference in digestion, because
the latent form is activated at the gastric pH.
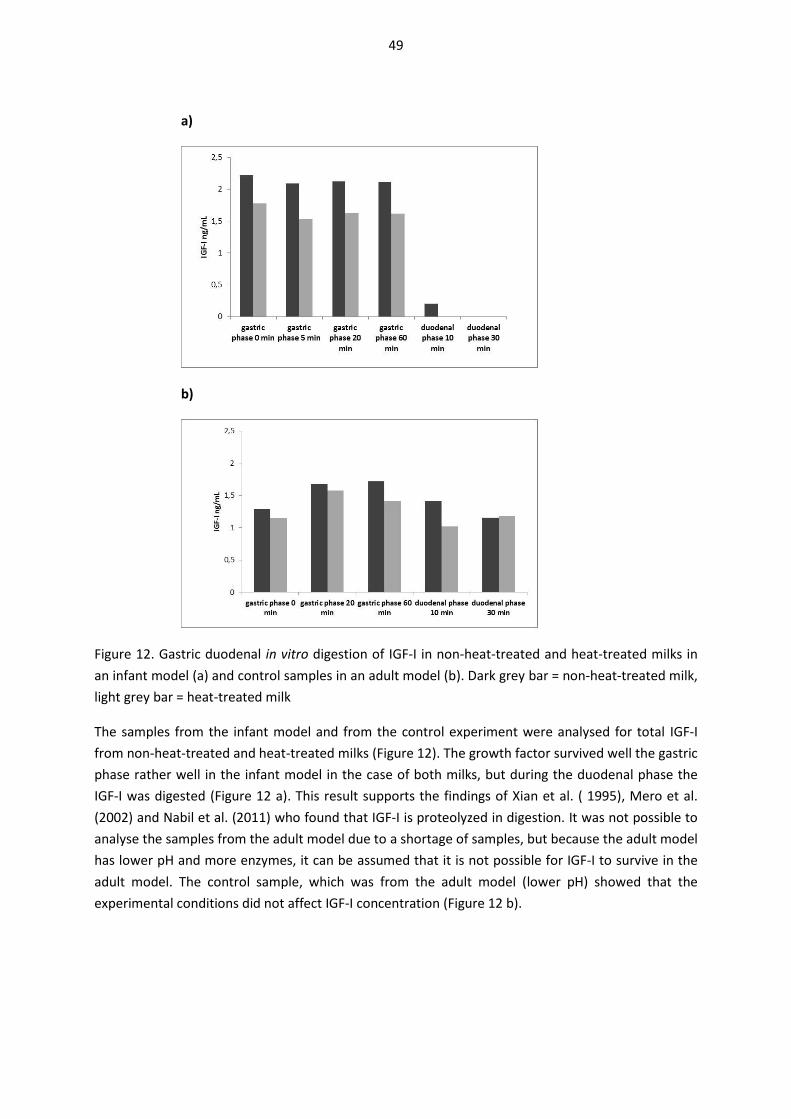
49
a)
b)
Figure 12. Gastric duodenal in vitro digestion of IGF-I in non-heat-treated and heat-treated milks in
an infant model (a) and control samples in an adult model (b). Dark grey bar = non-heat-treated milk,
light grey bar = heat-treated milk
The samples from the infant model and from the control experiment were analysed for total IGF-I
from non-heat-treated and heat-treated milks (Figure 12). The growth factor survived well the gastric
phase rather well in the infant model in the case of both milks, but during the duodenal phase the
IGF-I was digested (Figure 12 a). This result supports the findings of Xian et al. ( 1995), Mero et al.
(2002) and Nabil et al. (2011) who found that IGF-I is proteolyzed in digestion. It was not possible to
analyse the samples from the adult model due to a shortage of samples, but because the adult model
has lower pH and more enzymes, it can be assumed that it is not possible for IGF-I to survive in the
adult model. The control sample, which was from the adult model (lower pH) showed that the
experimental conditions did not affect IGF-I concentration (Figure 12 b).
50
6. Conclusions and future directions
Whey from bovine milk or colostrum has usually been the raw material for growth factor separation
and concentration from milk. A typical process is one, in which casein is separated by acid
precipitation or microfiltration and discarded. The remaining whey fraction is used for growth factor
separation either by chromatography or membrane filtration. Whey from cheese-making process has
also been used for growth factor separation especially in industrial processes.
In this study it was shown that heating of milk affected the growth factors. Heating activated TGF-β2
and IGF-I from latent to immunoreactive form, which can be measured by ELISA immunoassay
without any separate pre-treatment. The activation of TGF-β2 was dependent on the heating
temperature; at 90⁰C the growth factor was totally in the immunoreactive form. IGF-I was more
resistant to heating, but at 90⁰C it also showed a sharp increase in immunoreactivity. At 135⁰C both
TGF-β2 and IGF-I concentrations were diminished, probably due to denaturation. Bovine insulin was
stable during pasteurization, but showed a lower concentration in higher temperatures.
Heating at 90⁰C was introduced as a new pre-treatment method for IGF-I analysis of milk and milk
fractions with low β-lactoglobulin concentrations. This pre-treatment method needs no separate
acid-ethanol pre-treatment, and provides the possibility to analyse low IGF-I concentrations in milk.
When non-heat-treated and heat-treated milks were separated in casein and whey fractions using
acid precipitation or ultracentrifugation, the active forms followed the casein fraction whereas the
latent form was in whey. The same effect of heating was also seen during membrane filtration when
milk was separated in MF retentate (casein fraction) and UF retentate (whey fraction) by MF and UF.
If pasteurized milk was used for membrane processing, TGF-β2 was found in the MF retentate in the
immunoreactive form. If non-pasteurized milk was used, a greater share of TGF-β2 was found in
whey. Washing the fractions by diafiltration did not affect the growth factors, but washed out most
of β-lactoglobulin and α-lactalbumin in the MF permeate. During DF lactose was washed to MF
permeate and UF permeate, thus increasing the purity of the retentate fractions.
The result of TGF-β2 activation was confirmed in dairy processes. During cheese-making process TGF-
β2, which was activated during the process, was found in cheese. Whey from the same process had
only a small share of the total growth factor concentration and it was in the latent form.
IGF-I was not activated during pasteurization and because of this it did not show a higher
concentration in MF retentate than in UF retentate during membrane processing compared to non-
pasteurized milk. The total amount of IGF-I in milk was divided equally between the MF retentate
and UF retentate. A small share of IGF-I was found in UF permeate, indicating that IGF-I might have
existed in several forms during processing.
Bovine insulin showed the same kind of behaviour as IGF-I, but a larger amount was found in the MF
retentate than in the UF retentate. No insulin was found in the UF permeate.
There was no difference in the digestibility of the latent and active forms of TGF-β2 during digestion
in vitro. The gastric pH activated the latent form. In the adult model TGF-β2 was fully digested during
51
the early gastric phase whereas in the infant model a small share of intact TGF-β2 was left after the
gastric and duodenal phases. The result indicated that infants might get more benefit than adults
from milk and milk-based infant formulas. IGF-I was analysed in the infant model. The growth factor
survived the gastric phase but was digested during the duodenal phase.
The results of the present work have great importance if whey from dairy processing is used for
growth factor concentration and separation. It was shown that it is very important to know the
heating history of milk in order to obtain the maximum yield during separation. It was also shown
that heating as a pre-treatment method can be used to channel TGF-β2 to different fractions during
filtrations, which provides possibilities either to concentrate or reduce this growth factor in different
milk fractions. Membrane filtration and fractionation provide several possibilities for growth factor
and insulin fractionation and concentration.
It is the topic of future studies to confirm, whether the immunological activity of TGF-β2 and IGF-I
obtained by heating also shows activity in bioassays. The heat-induced immunodetectability of IGF-I
needs more studies to determine whether it is the IGF-I or IGFBP which is affected by heat. More
studies are also needed to determine whether the protein components in heat-treated milk are the
true carriers of the growth factors and insulin, and what kinds of interaction they have. Especially the
affinity to casein is of interest.
The gastric-duodenal digestion experiment in vitro was a good method to study growth factor
digestion. More studies are needed to confirm the results and it would also be interesting to
determine the fate of bovine insulin in this type of experiment.
52
Acknowledgements
The research of this study was carried out at Valio Research and Development, New Technologies,
Helsinki during the years 2010 – 2012.
I am very grateful to Professor Tiina Mattila-Sandholm, Executive Vice President of Valio R&D for
providing me the opportunity and facilities to carry out this work alongside my permanent work at
Valio R&D. I want to express my warmest thanks to my supervisors, Matti Harju, PhD and Olli
Tossavainen, PhD for the encouraging and supportive guidance during this work. Olli, with your own
example you gave me the final push to start this work! I also want to thank Professor Riitta Korpela
and Tuomas Haltia, PhD for being active members of the thesis advisory committee and initiating
many interesting discussions in the committee meetings. Thank you also to Professor Kari Keinänen
for your positive support during this work.
I express my thanks to the reviewers, Professor Hannu J. Korhonen at MTT, Jokioinen and Professor
Yves Pouliot at Laval University, Quebec for their expertise during the pre-examination.
I warmly thank Professor Jorma Keski-Oja from Biomedicum Helsinki for his interest in my work.
Several discussions and articles helped me to understand the behaviour of TGF-β. Many thanks also
go to Professor Craig Baumrucker from Penn State University for valuable comments concerning IGF-
I.
I am very grateful to Anne Ala-Kahrakuusi for her technical assistance throughout this work. Anne’s
positive attitude and accuracy made it possible to proceed rapidly and with confidence in this study.
Thanks to my co-authors Reetta Tikanmäki, MSc Tech., and Klaus Muuronen, MSc Tech. for their
expertise in filtration processes and Anna-Maria Riihimäki BSc for the guidance in the immunological
analyses. Thanks also to Outi Kerojoki MSc and Valio R&D Analytical Services for the chemical
analyses and to Martina Lille, PhD at VTT in Espoo for the digestion experiments.
I warmly thank all my friends and colleagues at Valio, who have shared the past 30 years with me.
Thank you for the interesting discussions, innovative ideas, critical comments as well as happy
moments!
I am warmly grateful to my good friend Anna-Maija Lampi, PhD, who was always there when
practical advice was needed. I thank Michael Bailey, BSc, for language consultancy and valuable
comments during this work. Special thanks also go to my daughter, Ilona Kärki, BSc. Tech. for
proofreading the manuscript.
Matti, Pyry and Ilona, thank you for your love and care.
Helsinki, January 2013
Pia Ollikainen
53
References
Aaltonen, T., & Ollikainen, P. (2011). Effect of microfiltration of milk on plasmin activity. International
Dairy Journal, 21(4), 193-197.
Anon., National Institute for Biological Standards and Control, http://www.nibsc.ac.uk/
documents/ifu/83-500.pdf, 19.9.2012a.
Anon.,http://www.elisa-antibody.com/index.php?page=sandwich-elisa, 17.12.2012b.
Anon., GEA Liquid processing, http://www.gealiquid.com/gealiquid /cmsdoc.nsf/webdoc
/webb8g3k2s, 19.9.2012c.
Abe, M., Harpel, J. G., Metz, C. N., Nunes, I., Loskutoff, D. J., & Rifkin, D. B. (1994). An assay for
transforming growth factor-[beta] using cells transfected with a plasminogen activator inhibitor-1
promoter-luciferase construct. Analytical Biochemistry, 216(2), 276-284.
Akbache, A., Lamiot, E., Moroni, O., Turgeon, S., Gauthier, S. F., & Pouliot, Y. (2009). Use of
membrane processing to concentrate TGF-β2 and IGF-I from bovine milk and whey. Journal of
Membrane Science, 326(2), 435-440.
Akbache, A., Rocafi, A., Saffon, M., Lamiot, E., Moroni, O., Turgeon, S., et al. (2011). Effect of heating
on the distribution of transforming growth factor-β2 in bovine milk. Food Research International,
44(1), 28-32.
Ando, T., Hatsushika, K., Wako, M., Ohba, T., Koyama, K., Ohnuma, Y., et al. (2007). Orally
administered TGF-beta is biologically active in the intestinal mucosa and enhances oral tolerance.
The Journal of Allergy and Clinical Immunology, 120(4), 916-923.
Andres, J. L., Stanley, K., Cheifetz, S., & Massague, J. (1989). Membrane-anchored and soluble forms
of betaglycan, a polymorphic proteoglycan that binds transforming growth factor-beta. The Journal
of Cell Biology, 109(6), 3137-3145.
Aranda, P., Sanchez, L., Perez, M. D., Ena, J. M., & Calvo, M. (1991). Insulin in bovine colostrum and
milk: Evolution throughout lactation and binding to caseins. Journal of Dairy Science, 74(12), 4320-
4325.
Arandjelovic, S., Freed, T. A., & Gonias, S. L. (2003). Growth factor-binding sequence in human
alpha2-macroglobulin targets the receptor-binding site in transforming growth factor-beta.
Biochemistry, 42(20), 6121-6127.
Ballard, F. J., Nield, M. K., Francis, G. L., Dahlenburg, G. W., & Wallace, J. C. (1982). The relationship
between the insulin content and inhibitory effects of bovine colostrum on protein breakdown in
cultured cells. Journal of Cellular Physiology, 110(3), 249-254.
54
Bastian, S. E., Dunbar, A. J., Priebe, I. K., Owens, P. C., & Goddard, C. (2001). Measurement of
betacellulin levels in bovine serum, colostrum and milk. The Journal of Endocrinology, 168(1), 203-
212.
Baumrucker, C.R. (2012). Personal communication.
Baumrucker, C. R., & Erondu, N. E. (2000). Insulin-like growth factor (IGF) system in the bovine
mammary gland and milk. Journal of Mammary Gland Biology and Neoplasia, 5(1), 53-64.
Baumrucker, C. R., Gibson, C. A., & Schanbacher, F. L. (2003). Bovine lactoferrin binds to insulin-like
growth factor-binding protein-3. Domestic Animal Endocrinology, 24(4), 287-303.
Baxter, R. C. (1988). Characterization of the acid-labile subunit of the growth hormone-dependent
insulin-like growth factor binding protein complex. The Journal of Clinical Endocrinology and
Metabolism, 67(2), 265-272.
Baxter, R. C., Zaltsman, Z., & Turtle, J. R. (1984). Immunoreactive somatomedin-C/insulin-like growth
factor I and its binding protein in human milk. The Journal of Clinical Endocrinology and
Metabolism, 58(6), 955-959.
Baxter, R. C. (2001). Inhibition of the insulin-like growth factor (IGF)–IGF-binding protein interaction.
Hormone Research, 55, 68-72.
Beattie, R. M., Schiffrin, E. J., Donnet-Hughes, A., Huggett, A. C., Domizio, P., MacDonald, T. T., et al.
(1994). Polymeric nutrition as the primary therapy in children with small bowel crohn's disease.
Alimentary Pharmacology & Therapeutics, 8(6), 609-615.
Belford, D. A., Rogers, M. L., Francis, G. L., Payne, C., Ballard, F. J., & Goddard, C. (1997). Platelet-
derived growth factor, insulin-like growth factors, fibroblast growth factors and transforming
growth factor beta do not account for the cell growth activity present in bovine milk. The Journal of
Endocrinology, 154(1), 45-55.
Ben Ounis, W., Gauthier, S. F., Turgeon, S. L., Roufik, S., & Pouliot, Y. (2008). Separation of minor
protein components from whey protein isolates by heparin affinity chromatography. International
Dairy Journal, 18(10-11), 1043-1050.
Blundell, T. L., Bedarkar, S., Rinderknecht, E., & Humbel, R. E. (1978). Insulin-like growth factor: A
model for tertiary structure accounting for immunoreactivity and receptor binding. Proceedings of
the National Academy of Sciences of the United States of America, 75(1), 180-184.
Blundell, T. L., Cutfield, J. F., Cutfield, S. M., Dodson, E. J., Dodson, G. G., Hodgkin, D. C., et al. (1972).
Three-dimensional atomic structure of insulin and its relationship to activity. Diabetes, 21(2 Suppl),
492-505.
55
Bogin, B. (1998). Milk and human development: An essay on the "milk hypthesis". Antropologia
Portuguesa, 15, 23-36.
Bouchard, C., Galinha, A., Tartour, E., Fridman, W. H., & Sautes, C. (1995). A transforming growth
factor beta-like immunosuppressive factor in immunoglobulin G-binding factor. The Journal of
Experimental Medicine, 182(6), 1717-1726.
Boyd, F. T., Cheifetz, S., Andres, J., Laiho, M., & Massague, J. (1990). Transforming growth factor-beta
receptors and binding proteoglycans. Journal of Cell Science, Supplement, 13, 131-138.
Breier, B. H., Gallaher, B. W., & Gluckman, P. D. (1991). Radioimmunoassay for insulin-like growth
factor-I: Solutions to some potential problems and pitfalls. The Journal of Endocrinology, 128(3),
347-357.
Brown, P., Wakefield, L., Levinson, A., & Sporn, M. (1990). Physicochemical activation of recombinant
latent transforming growth factor-beta's 1,2,3. Growth Factors, 3(1), 35-43.
Burk, R. R. (1973). A factor from a transformed cell line that affects cell migration. Proceedings of the
National Academy of Sciences of the United States of America, 70(2), 369-372.
Burrin, D. G., Schulman, R. J., Reeds, P. J., Davis, T. A., & Gravitt, K. R. (1992). Porcine colostrum and
milk stimulate visceral organ and skeletal muscle protein synthesis in neonatal piglets. Journal of
Nutrition, 122, 1205-1213.
Bylund, G. (1995). Membrane filters in Dairy processing Handbook, (p.124).Tetra Pack processing
systems, Lund, Sweden.
Campbell, P. G., & Baumrucker, C. R. (1989). Insulin-like growth factor-I and its association with
binding proteins in bovine milk. The Journal of Endocrinology, 120(1), 21-29.
Campbell, P. G., Novak, J. F., Yanosick, T. B., & McMaster, J. H. (1992). Involvement of the plasmin
system in dissociation of the insulin-like growth factor-binding protein complex. Endocrinology,
130(3), 1401-1412.
Campbell, P. G., Skaar, T. C., Vega, J. R., & Baumrucker, C. R. (1991). Secretion of insulin-like growth
factor-I (IGF-I) and IGF-binding proteins from bovine mammary tissue in vitro. The Journal of
Endocrinology, 128(2), 219-228.
Capila, I., & Linhardt, R. J. (2002). Heparin-protein interactions. Angewandte Chemie , 41(3), 391-412.
Cartwright, G., McManus, B. H., Leffler, T. P., & Moser, C. R. (2005). Rapid determination of
Moisture/Solids and fat in dairy products by microwave and nuclear magnetic resonance analysis.
Journal of AOAC International, 88(1), 107-120.
56
Castigliego, L., Li, X., Armani, A., Mazzi, M., & Guidi, A. (2011). An immunoenzymatic assay to
measure insulin-like growth factor 1 (IGF-I) in buffalo milk with an IGF binding protein blocking pre-
treatment of the sample. International Dairy Journal, 21(6), 421-426.
Chagas, C.E.A., Rogero, M.M., & Martini, L.A. (2012). Evaluating the links between intake of
milk/dairy products and cancer. Nutrition reviews, 70 (5), 294-300.
Cheifetz, S., Weatherbee, J. A., Tsang, M. L., Anderson, J. K., Mole, J. E., Lucas, R., et al. (1987). The
transforming growth factor-β system, a complex pattern of cross-reactive ligands and receptors.
Cell, 48(3), 409-415.
Chen, J., Ledet, T., Ørskov, H., Jessen, N., Lund, S., Whittaker, J., et al. (2003). A highly sensitive and
specific assay for determination of IGF-I bioactivity in human serum. American Journal of
Physiology - Endocrinology and Metabolism, 284(6), E1149-E1155.
Chen, M. J., Kuo, Y. H., Tian, X. C., & Chen, T. T. (2002). Novel biological activities of the fish pro-IGF-I
E-peptides: Studies on effects of fish pro-IGF-I E-peptide on morphological change, anchorage-
dependent cell division, and invasiveness in tumor cells. General and Comparative Endocrinology,
126(3), 342-351.
Clemmons, D. R. (1997). Insulin-like growth factor binding proteins and their role in controlling IGF
actions. Cytokine & Growth Factor Reviews, 8(1), 45-62.
Coffey, R. J.,Jr, Kost, L. J., Lyons, R. M., Moses, H. L., & LaRusso, N. F. (1987). Hepatic processing of
transforming growth factor β in the rat. uptake, metabolism, and biliary excretion. The Journal of
Clinical Investigation, 80(3), 750-757.
Collier, R. J., Miller, M. A., Hildebrandt, J. R., Torkelson, A. R., White, T. C., Madsen, K. S. et al. (1991).
Factors affecting insulin-like growth factor-I concentration in bovine milk . Journal of Dairy Science,
74(9) 2905-2911.
Correa, P. N., & Axelrad, A. A. (1991). Production of erythropoietic bursts by progenitor cells from
adult human peripheral blood in an improved serum-free medium: Role of insulinlike growth factor
1. Blood, 78, 2823 - 2833.
Cox, D., & Bürk, R. (1991). Isolation and characterization of milk growth factor, a transforming-
growth-factor-β2-related polypeptide, from bovine milk. European Journal of Biochemistry, 197,
353-358.
Crittenden, R., Buckley, J., Cameron-Smith, D., Brown, A., Thomas, K., Davey, S., et al. (2009).
Functional dairy protein supplements for elite athletes. The Australian Journal of Dairy Technology,
64(1), 133-137.
57
Cummins, A. G., & Thompson, F. M. (1997). Postnatal changes in mucosal immune response: A
physiological perspective of breast feeding and weaning. Immunology and Cell Biology, 75(5), 419-
429.
Dalgleish, D. G. (1990). Denaturation and aggregation of serum proteins and caseins in heated milk.
Journal of Agricultural and Food Chemistry, 38, 1995-1998.
Danielpour, D., Dart, L. L., Flanders, K. C., Roberts, A. B., & Sporn, M. B. (1989). Immunodetection and
quantitation of the two forms of transforming growth factor-beta (TGF-beta 1 and TGF-beta 2)
secreted by cells in culture. Journal of Cellular Physiology, 138(1), 79-86.
Dannenberg, F. (1986). Zur reaktionkinetik der molkenproteindenaturierung und deren
technologische bedeutung. Dissertation, TU Munchen-Weichenstephan.
Daopin, S., Piez, K. A., Ogawa, Y., & Davies, D. R. (1992). Crystal structure of transforming growth
factor-beta 2: An unusual fold for the superfamily. Science, 257(5068), 369-373.
Daughaday, W. H., Mariz, I., K., & Blethen, S. L. (1980). Inhibition of access of bound somatomedin to
membrane receptor and immunobinding sites: A comparison of radioreceptor and
radioimmunoassay of somatomedin in native and acid-ethanol-extracted serum. Journal of Clinical
Endocrinology & Metabolism, 51(4), 781-788.
Daughaday, W. H., Hall, K., Raben, M. S., Salmon, W. D.,Jr, van den Brande, J. L., & van Wyk, J. J.
(1972). Somatomedin: Proposed designation for sulphation factor. Nature, 235(5333), 107.
Daughaday, W. H., Kapadia, M., & Mariz, I. (1987). Serum somatomedin binding proteins: Physiologic
significance and interference in radioligand assay. The Journal of Laboratory and Clinical Medicine,
109(3), 355-363.
de Beer, H. (2011). Dairy products and physiological stature: A systematic review and meta-analysis
of controlled trials. Economics and Human Biology, 10(3), 299-309.
de Larco, J. E., & Todaro, G. J. (1978). Growth factors from murine sarcoma virus-transformed cells.
Proceedings of the National Academy of Sciences of the United States of America, 75(8), 4001-4005.
Denley, A., Cosgrove, L. J., Booker, G. W., Wallace, J. C., & Forbes, B. E. (2005). Molecular interactions
of the IGF system. Cytokine & Growth Factor Reviews, 16(4–5), 421-439.
Donnet-Hughes, A., Duc, N., Serrant, P., Vidal, K., & Schiffrin, E. (2000). Bioactive molecules in milk
and their role in health and disease: The role of transforming growth factor-β. Immunology and Cell
Biology, 78(1), 74-79.
58
Donovan, S. M., Hintz, R. L., & Rosenfeld, R. G. (1991). Insulin-like growth factors I and II and their
binding proteins in human milk: Effect of heat treatment on IGF and IGF binding protein stability.
Journal of Pediatric Gastroenterology and Nutrition, 13(3), 242-253.
Donovan, S. M., & Odle, J. (1994). Growth factors in milk as mediators of infant development. Annual
Review of Nutrition, 14, 147-167.
Drouin, R., Lamiot, E., Cantin, K., Gauthier, S. F., Pouliot, Y., Poubelle, P. E., et al. (2007). XP-828L
(dermylex), a new whey protein extract with potential benefit for mild to moderate psoriasis.
Canadian Journal of Physiology and Pharmacology, 85(9), 943-951.
Dupont, D., Mandalari, G., Molle, D., Jardin, J., Léonil, J., Faulks, R. M., et al. (2010). Comparative
resistance of food proteins to adult and infant in vitro digestion models. Molecular Nutrition &
Food Research, 54(6), 767-780.
Elfstrand, L., Lindmark-Månsson, H., Paulsson, M., Nyberg, L., & Åkesson, B. (2002).
Immunoglobulins, growth factors and growth hormone in bovine colostrum and the effects of
processing. International Dairy Journal, 12(11), 879-887.
Fell, J. M. (2005). Control of systemic and local inflammation with transforming growth factor beta
containing formulas. Journal of Parenteral and Enteral Nutrition, 29(4), 126-33.
Feng, W., Zhao, L., & Wang, K. (2004). Interaction of polysaccharides with interferon-gamma using an
improved ELISA approach. Carbohydrate Polymers, 58(1), 89-94.
Florini, J. R., Roberts, A. B., Ewton, D. Z., Falen, S. L., Flanders, K. C., & Sporn, M. B. (1986).
Transforming growth factor-beta. A very potent inhibitor of myoblast differentiation, identical to
the differentiation inhibitor secreted by buffalo rat liver cells. The Journal of Biological Chemistry,
261(35), 16509-16513.
Fowlkes, J. L., & Serra, D. M. (1996). Characterization of glycosaminoglycan-binding domains present
in insulin-like growth factor-binding protein-3. The Journal of Biological Chemistry, 271(25), 14676-
14679.
Fox, P. F., & McSweeney, P. L. H. (1998). Milk proteins. In Dairy chemistry and biochemistry (1st ed.),
(pp.146 -211). Springer - Verlag, London.
Francis, G. L., Upton, F. M., Ballard, F. J., McNeil, K. A., & Wallace, J. C. (1988). Insulin-like growth
factors 1 and 2 in bovine colostrum. Sequences and biological activities compared with those of a
potent truncated form. Biochemical Journal 25(1), 95-103.
Francis, G. L., Regester, G. O., Webb, H. A., & Ballard, F. J. (1995). Extraction from cheese whey by
cation-exchange chromatography of factors that stimulate the growth of mammalian cells. Journal
of Dairy Science, 78(6), 1209-1218.
59
Fransson, J., Hallen, D., & Florin-Robertsson, E. (1997). Solvent effects on the solubility and physical
stability of human insulin-like growth factor I. Pharmaceutical Research, 14(5), 606-612.
Frystyk, J., Skjærbæk, C., Dinesen, B., & Ørskov, H. (1994). Free insulin-like growth factors (IGF-I and
IGF-II) in human serum. FEBS Letters, 348(2), 185-191.
Furlanetto, R. W. (1980). The somatomedin C binding protein: Evidence for a heterologous subunit
structure. The Journal of Clinical Endocrinology and Metabolism, 51(1), 12-19.
Gauthier, S., Pouliot, Y., & Maubois, J - L. (2006). Growth factors from bovine milk and colostrum:
Composition, extraction and biological activities. Lait, 86, 99-125.
Gentry, L. E., Lioubin, M. N., Purchio, A. F., & Marquardt, H. (1988). Molecular events in the
processing of recombinant type 1 pre-pro-transforming growth factor beta to the mature
polypeptide. Molecular and Cellular Biology, 8(10), 4162-4168.
Ginjala, V., & Pakkanen, R. (1998). Determination of transforming growth factor- β1 (TGF- β1) and
insulin-like growth factor 1 (IGF-I) in bovine colostrum samples. Journal of Immunoassay, 19(2-3),
195-207.
Gleizes, P., Munger, J. S., Nunes, I., Harpel, J. G., Mazzieri, R., Noguera, I., et al. (1997). TGF-β latency:
Biological significance and mechanisms of activation. Stem Cells, 15(3), 190-197.
Guidi, A., Castigliego, L., Iannone, G., Armani, A., & Gianfaldoni, D. (2007). An immunoenzymatic
method to measure IGF-I in milk. Veterinary Research Communications, 31(0), 373-376.
Hawkes, J. S., Bryan, D. L., James, M. J., & Gibson, R. A. (1999). Cytokines (IL-1beta, IL-6, TNF-alpha,
TGF-beta1, and TGF-beta2) and prostaglandin E2 in human milk during the first three months
postpartum. Pediatric Research, 46(2), 194-199.
Heino, A. (2009). Microfiltration in cheese and whey processing. PhD thesis, University of Helsinki.
EKT Series 1460.
Hironaka, T., Ohishi, H., & Masaki, T. (1997). Identification and partial purification of a basic fibroblast
growth factor-like growth factor derived from bovine colostrum. Journal of Dairy Science, 80(3),
488-495.
Hober, S., Forsberg, G., Palm, G., Hartmanis, M., & Nilsson, B. (1992). Disulphide exchange folding in
insulin-like growth factor I. Biochemistry, 31, 1749-1756.
Hoppe, C., Molgaard, C., & Michaelsen, K. F. (2006). Cow's milk and linear growth in industrialized
and developing countries. Annual Review of Nutrition, 26, 131-173.
60
Hyytiäinen, M., Penttinen, C., & Keski-Oja, J. (2004). Latent TGF-β binding proteins: Extracellular
matrix association and roles in TGF-β activation. Critical Reviews in Clinical Laboratory Sciences,
41(3), 233-264.
Iacopetta, B. J., Grieu, F., Horisberger, M., & Sunahara, G. I. (1992). Epidermal growth factor in
human and bovine milk. Acta Paediatrica, 81(4), 287-291.
IDF (1987). Milk cream and evaporated milk. Determination of total solid content. International Dairy
Federation Standard 21 B. Brussels, Belgium: International Dairy Federation.
IDF (2001). Milk. Determination of nitrogen content, part 1. Kjeldahl method. International Dairy
Federation Standard 20-1. Brussels, Belgium: International Dairy Federation.
IDF (2002). Dried milk, dried ice mixes and processed cheese. Determination of Lactose Content. Part
2. International Dairy Federation Standard 79-2/ISO 5765. Brussels, Belgium: International Dairy
Federation.
IDF (2004). Determination of Casein-Nitrogen Content. International Dairy Federation Standard 29-
1/ISO 17997-1. Brussels, Belgium: International Dairy Federation.
Jin, Y., Cox, D. A., Knecht, R., Raschdorf, F., & Cerletti, N. (1991). Separation, purification, and
sequence identification of TGF-β1 and TGF- β2 from bovine milk. Journal of Protein Chemistry,
10(5), 565-575.
Juul, A. (2003). Serum levels of insulin-like growth factor I and its binding proteins in health and
disease. Growth Hormone & IGF Research, 13(4), 113-170.
Juul, A., Bang, P., Hertel, N. T., Main, K., Dalgaard, P., Jorgensen, K., et al. (1994). Serum insulin-like
growth factor-I in 1030 healthy children, adolescents, and adults: Relation to age, sex, stage of
puberty, testicular size, and body mass index. The Journal of Clinical Endocrinology and
Metabolism, 78(3), 744-752.
Kang, S. H., Kim, J. U., Imm, J. Y., Oh, S., & Kim, S. H. (2006). The effects of dairy processes and
storage on insulin-like growth factor-I (IGF-I) content in milk and in model IGF-1-Fortified dairy
products .Journal of Dairy Science, 89(2), 402-409.
Kelly, A. L., O’Flaherty, F., & Fox, P. F. (2006). Indigenous proteolytic enzymes in milk: A brief
overview of the present state of knowledge. International Dairy Journal, 16(6), 563-572.
Keski-Oja, J., Lyons, R. M., & Moses, H. L. (1987). Immunodetection and modulation of cellular
growth with antibodies against native transforming growth factor-beta. Cancer Research, 47, 6451-
6458.

61
Kessler, H. G. (2002). Heat treatment, processes and effects - microorganisms and conditions of
inactivation. In Food and bio process engineering - dairy technology (pp. 130-216). Verlag A.
Kessler, München, Germany.
Kivits, M., Galama, C., & Hendriks, A. (2003). Process for obtaining growth factor (TGF-beta 2 and IGF-
I), lactoperoxidase and immunoglobulins preparations from milk products having low mutual
crosscontamination. the Netherlands: WO 03/008447 A1.
Klagsbrun, M., & Neumann, J. (1979). The serum-free growth of Balb/c 3T3 cells in medium
supplemented with bovine colostrum. Journal of Supramolecular Structure, 11(3), 349-359.
Klostermeyer, H., & Reimerdes, E. H. (1976). Chemico-physical changes in refrigerated raw milk.
Molkerei-Zeitung Welt Der Milch, 30, 135-138.
Koldovsky, O., & Strabak, V. (1995). Hormones and Growth Factors in Human Milk. In Jensen, R. G.
(editor), Handbook of milk composition, (pp.428 - 431). Academic Press Limited, London.
Koli, K., Saharinen, J., Hyytiäinen, M., Carita Penttinen, & Keski-Oja, J. (2001). Latency, activation, and
binding proteins of TGF-β Microscopy Research and Technique, 52(4), 354-362.
Kwon, S. H., Lee, J. R., Kim, H. M., Kim, K. H., & Yoon, E. J. (2006). Food composition for stimulating
growth comprising fraction isolated from mammalian coclostrum or milk whey. Korea:
WO2006/126758 A1.
Laiho, M., Saksela, O., & Keski-Oja, J. (1987). Transforming growth factor-beta induction of type-1
plasminogen activator inhibitor. The Journal of Biological Chemistry, 262(36), 17467-17474.
Lalou, C., Silve, C., Rosato, R., Segovia, B., & Binoux, M. (1994). Interactions between insulin-like
growth factor-I (IGF-I) and the system of plasminogen activators and their inhibitors in the control
of IGF-binding protein-3 production and proteolysis in human osteosarcoma cells. Endocrinology,
135(6), 2318-2326.
Lawrence, D. A., Pircher, R., & Jullien, P. (1985). Conversion of a high molecular weight latent β-TGF
from chicken embryo fibroblasts into a low molecular weight active β-TGF under acidic conditions.
Biochemical and Biophysical Research Communications, 133(3), 1026-1034.
Letterio, J., Geiser, A., Kulkarni, A., Roche, NS., Sporn, MB., & Roberts, A. (1994). Maternal rescue of
transforming growth factor-beta 1 null mice. Science, 264, 1936-1938.
Lonnerdal, B. (2010). Novel insights into human lactation as a driver of infant formula development.
In B. Koletzko, S. Koletzko & F. Ruemmele (Eds.), Drivers of innovation in pediatric nutrition (pp. 19-
29). S. Karger AG. Basel.
62
Lonnerdal, B., Du, X., Morris, K., Jouni, Z., Rai, G., & Waworuntu, R. (2009). TGF β2 is present in infant
formula, resists digestion in vitro and is biologically active. The FASEB Journal,
23(1_MeetingAbstracts), 344.1.
Lowe, E. K., Anema, S. G., Bienvenue, A., Boland, M. J., Creamer, L. K., & Jiménez-Flores, R. (2004).
Heat-induced redistribution of disulphide bonds in milk proteins. 2. disulphide bonding patterns
between bovine β-lactoglobulin and κ-casein. Journal of Agricultural and Food Chemistry, 52(25),
7669-7680.
Luopajarvi, K., Savilahti, E., Virtanen, S. M., Ilonen, J., Knip, M., Akerblom, H. K., et al. (2008).
Enhanced levels of cow's milk antibodies in infancy in children who develop type 1 diabetes later in
childhood. Pediatric Diabetes, 9(5), 434-441.
Lyons, R. M., Keski-Oja, J., & Moses, H. L. (1988). Proteolytic activation of latent transforming growth
factor-beta from fibroblast-conditioned medium. The Journal of Cell Biology, 106, 1659-1665.
Lyons, R. M., Gentry, L. E., Purchio, A. F., & Moses, H. L. (1990). Mechanism of activation of latent
recombinant transforming growth factor beta 1 by plasmin. The Journal of Cell Biology, 110(4),
1361-1367.
Lyons, R. M., & Moses, H. L. (1990). Transforming growth factors and the regulation of cell
proliferation. European Journal of Biochemistry / FEBS, 187(3), 467-473.
Malven, P. V., Head, H. H., Collier, R. J., & Buonomo, F. C. (1987). Periparturient changes in secretion
and mammary uptake of insulin and in concentrations of insulin and insulin-like growth factors in
milk and dairy cows. Journal of Dairy Science, 70, 2254-2265.
Marshall, R. N., Underwood, L. E., Voina, S. J., Foushee, D. B., & Van Wyk, J. J. (1974).
Characterization of the insulin and somatomedin-C receptors in human placental cell membranes.
The Journal of Clinical Endocrinology and Metabolism, 39(2), 283-292.
Massague, J. (1990). The transforming growth factor-beta family. Annual Review of Cell Biology, 6(1),
597-641.
Massagué, J. (1998). TGF-beta signal transduction. Annual Review of Biochemistry, 67, 753-791.
Maubois, J., Fauguant, J., Jouan, P., & Bourtourault, M. (2006). Method for obtaining a TFG-beta
enriched protein fraction in activated form, protein fraction and therapeutic applications. US Patent
7,141,262 B2.
McCusker, R. H. (1998). Controlling insulin-like growth factor activity and the modulation of insulin-
like growth factor binding protein and receptor binding. Journal of Dairy Science, 81(6), 1790-1800.
63
McGrath, M. F., Bogosian, G., Fabellar, A. C., Staub, R. L., Vicini, J. L., & Widger, L. A. (2008).
Measurement of bovine somatotropin (bST) and insulin-like growth factor-1 (IGF-I) in bovine milk
using an electrochemiluminescent assay. Journal of Agricultural and Food Chemistry, 56(16), 7044-
7048.
McGuire, M. A., Griinari, J. M., Dwyer, D. A., & Bauman, D. E. (1995). Role of insulin in the regulation
of mammary synthesis of fat and protein. Journal of Dairy Science, 78(4), 816-824.
McPherson, R.J., & Wagner, C.L. (2001). The effect of pasteurization on transforming growth factor
alpha and transforming growth factor beta 2 concentrations in human milk. Advances in
Experimental Medicine and Biology, 501, 559-566.
Meager, A. (1991). Assays for transforming growth factor [beta]. Journal of Immunological Methods,
141(1), 1-14.
Menzies, K. K., Lefevre, C., Macmillan, K. L., & Nicholas, K. R. (2009). Insulin regulates milk protein
synthesis at multiple levels in the bovine mammary gland. Functional & Integrative Genomics, 9(2),
197-217.
Mero, A., Kähkonen, J., Nykänen, T., Parviainen, T., Jokinen, I., Takala, T., et al. (2002). IGF-I, IgA, and
IgG responses to bovine colostrum supplementation during training. Journal of Applied Physiology
93(2), 732-739.
Mero, A., Miikkulainen, H., Riski, J., Pakkanen, R., Aalto, J., & Takala, T. (1997). Effects of bovine
colostrum supplementation on serum IGF-I, IgG, hormone, and saliva IgA during training. Journal of
Applied Physiology, 83(4), 1144-1151.
Miyazono, K., & Heldin, C. H. (1989). Role for carbohydrate structures in TGF-beta 1 latency. Nature,
338(6211), 158-160.
Molento, C. F. M., Block, E., Cue, R. I., & Petitclerc, D. (2002). Effects of insulin, recombinant bovine
somatotropin, and their interaction on insulin-like growth factor-I secretion and milk protein
production in dairy cows. Journal of Dairy Science, 85(4), 738-747.
Montoni, A.; Gauthier, S.F.; Richard, C.; Poubelle, P.E.; Chouinard, Y., & Pouliot, Y. (2009). Bovine
colostrum as a substrate for the preparation of growth factor-enriched protein extracts: Identifying
the optimal collection period during lactation. Dairy Science Technology, 89 (5), 511 -518.
Moses, H. L. (1992). TGF-beta regulation of epithelial cell proliferation. Molecular Reproduction and
Development, 32(2), 179-184.
Nabil, S., Gauthier, S. F., Drouin, R., Poubelle, P. E.,Pouliot, Y. (2011). In vitro digestion of proteins and
growth factors in a bovine whey protein extract as determined using a computer-controlled
dynamic gastrointestinal system (TIM-1). Food Digestion, 2(1-3), 13-22.
64
Nakamura, Y., Miyata, M., Ando, T., Shimokawa, N., Ohnuma, Y., Katoh, R., et al. (2009). The latent
form of transforming growth factor-β administered orally is activated by gastric acid in mice. The
Journal of Nutrition, 139(8), 1463-1468.
Nielsen, W.K. (2000). Processes. In Nielsen, W.K. (editor). Membrane filtration and related molecular
separation technologies, (p.25). Silkeborg Bogtrykkeri A/S, Silkeborg.
Oddy, W. H., McMahon, R.J. (2011). Milk-derived or recombinant transforming growth factor-beta
has effects on immunological outcomes: A review of evidence from animal experimental studies.
Clinical and Experimental Allergy, 41(6), 783-793.
Oddy, W. H., & Rosales, F. (2010). A systematic review of the importance of milk TGF-beta on
immunological outcomes in the infant and young child. Pediatric Allergy and Immunology, 21(1 Pt
1), 47-59.
Oftedal, O. T. (2012). The evolution of milk secretion and its ancient origins. Animal, 6 (Special Issue
03), 355-368.
Ogawa, J., Sasahara, A., Yoshida, T., Sira, M. M., Futatani, T., Kanegane, H., et al. (2004). Role of
transforming growth factor-beta in breast milk for initiation of IgA production in newborn infants.
Early Human Development, 77(1-2), 67-75.
Oldfield, D. J., Singh, H., & Taylor, M. W. (2005). Kinetics of heat-induced whey protein denaturation
and aggregation in skim milks with adjusted whey protein concentration. Journal of Dairy Research,
72(03), 369-378.
Orr, J. B. (1928). Influence of amount of milk consumption on the rate of growth of school children.
British Medical Journal, 1(3499), 140-141.
Ozawa, T., Miyata, M., Nishimura, M., Ando, T., Ouyang, Y., Ohba, T., et al. (2009). Transforming
growth factor-β activity in commercially available pasteurized cow milk provides protection against
inflammation in mice. The Journal of Nutrition, 139(1), 69-75.
Pakkanen, R. (1998). Determination of transforming growth factor- β2 (TGF- β2) in bovine colostrum
samples. Journal of Immunoassay, 19(1), 23-37.
Penttila, I. A., Flesch, I. E., McCue, A. L., Powell, B. C., Zhou, F. H., Read, L. C., et al. (2003). Maternal
milk regulation of cell infiltration and interleukin 18 in the intestine of suckling rat pups. Gut,
52(11), 1579-1586.
Penttila, I. A., Zhang, M. F., Bates, E., Regester, G., Read, L. C., & Zola, H. (2001). Immune modulation
in suckling rat pups by a growth factor extract derived from milk whey. Journal of Dairy Research,
68(04), 587-599.
65
Peroni, D. G., Piacentini, G. L., Bodini, A., Pigozzi, R., & Boner, A. L. (2009). Transforming growth
factor- β1 is elevated in unpasteurized cow's milk. Pediatric Allergy and Immunology, 20(1), 42-44.
Piot, M., Fauquant, J., Madec, M., & Maubois, J. (2004). Preparation of serocolostrum by membrane
microfiltration. Lait, 84, 333-341.
Pouliot, Y., & Gauthier, S. F. (2006). Milk growth factors as health products: Some technological
aspects. International Dairy Journal, 16(11), 1415-1420.
Purup, S., Vestergaard, M., Pedersen L.O., & Sejrsen, K. (2007). Biological activity of bovine milk on
proliferation of human intestinal cells. Journal of Dairy Research, 74, 58-65.
Rajaram, S., Baylink, D. J., & Mohan, S. (1997). Insulin-like growth factor-binding proteins in serum
and other biological fluids: Regulation and functions. Endocrine Reviews, 18(6), 801-831.
Rechler, M. M., & Nissley, S. P. (1991). Insulin like growth factors. In M. B. Sporn, & L. A. Roberts
(Eds.), Peptide growth factors and their receptors I, (pp. 263-346). Springer-Verlag New York Inc.,
Ann Arbor, Michigan.
Rinderknecht, E., & Humbel, R. E. (1978). The amino acid sequence of human insulin-like growth
factor I and its structural homology with proinsulin. The Journal of Biological Chemistry, 253(8),
2769-2776.
Roberts, A. B., & Sporn, M. B. (1991). The transforming growth factor-betas. In M. B. Sporn, & A. B.
Roberts (Eds.), Peptide growth factors and their receptors I,(pp. 419-472). Springer-Verlag New
York Inc., Ann Arbor, Michigan
Roberts, A. B., & Sporn, M. B. (1988). Transforming growth factor beta. Advances in Cancer Research,
51, 107-145.
Rocafi, A., Lamiot, E., Moroni, O., Turgeon, S. L., Gauthier, S. F.,Pouliot, Y. (2011). Effect of milk
thermal history on the recovery of TGF-beta2 by acid precipitation of whey protein concentrates.
Dairy Science & Technology, 91(5), 615-627.
Rogers, M., Goddard, C., Regester, G. O., Ballard, F. J., & Belford, D. A. (1996). Transforming growth
factor β in bovine milk: Concentration, stability and molecular mass forms. Journal of
Endocrinology, 151(1), 77-86.
Rosenfeld, R., Pham, H., Cohen, P., Fielder, P., Gargosky, S., Muller, H., et al. (1994). Insulin-like
growth factor binding proteins and their regulation. Acta Pædiatrica, 83, 154-158.
Sadick, M. D., Intintoli, A., Quarmby, V., McCoy, A., Canova-Davis, E., & Ling, V. (1999). Kinase
receptor activation (KIRA): A rapid and accurate alternative to end-point bioassays. Journal of
Pharmaceutical and Biomedical Analysis, 19(6), 883-891.
66
Saharinen, J., & Keski-Oja, J. (2000). Specific sequence motif of 8-cys repeats of TGF-beta binding
proteins, LTBPs, creates a hydrophobic interaction surface for binding of small latent TGF-beta.
Molecular Biology of the Cell, 11(8), 2691-2704.
Saharinen, J., Hyytiäinen, M., Taipale, J., & Keski-Oja, J. (1999). Latent transforming growth factor-
[beta] binding proteins (LTBPs)-structural extracellular matrix proteins for targeting TGF-[beta]
action. Cytokine & Growth Factor Reviews, 10(2), 99-117.
Sanger,F., & Tuppy,H. (1951). The amino-acid sequence in the phenylalanyl chain of insulin. 1. the
identification of lower peptides from enzymic hydrolysates. Biochemical Journal, 49, 463-481.
Sejrsen, K., Pedersen, L. O., Vestergaard, M., & Purup, S. (2001). Biological activity of bovine milk:
Contribution of IGF-I and IGF binding proteins. Livestock Production Science, 70(1-2), 79-85.
Shams, D., & Eispanier, R. (1991). Growthe hormone, IGF-I and insulin in mammary gland secretions
before and after partituration andpossibility of transfer into the calf. Endocrine Regulations, 25,
139-143.
Shehadeh, N., Gelertner, L., Blazer, S., Perlman, R., Solovachik, L., & Etzioni, A. (2001). Importance of
insulin content in infant diet: Suggestion for a new infant formula. Acta Pædiatrica, 90(1), 93-95.
Shing, Y., & Klagsbrun, M. (1987). Purification and characterization of a bovine colostrum-derived
growth factor. Molecular Endocrinology , 1(5), 335-338.
Simmen, F. A., Simmen, R. C., & Reinhart, G. (1988). Maternal and neonatal somatomedin C/insulin-
like growth factor-I (IGF-I) and IGF binding proteins during early lactation in the pig. Developmental
Biology, 130(1), 16-27.
Slaaby, R., Andersen, A. S., & Brandt, J. (2008). IGF-I binding to the IGF-I receptor is affected by
contaminants in commercial BSA: The contaminants are proteins with IGF-I binding properties.
Growth Hormone & IGF Research, 18(4), 267-274.
Sporn, M. B., & Roberts, A. B. (1988). Peptide growth factors are multifunctional. Nature, 332(6161),
217-219.
Syväoja, E. (1992). Quantitative determination of the main casein components and purification of
alfa s2 and kappa-casein from bovine milk. Milk Science International, 47, 563-566.
Teintenier-Cousin, C., Lefranc-Millot, C., Froidevaux, G., Slomianny, M., Guillochon, D., & Vercaigne-
Marko, D. (2009). Preparation from bovine colostrum of a fraction rich in latent transforming
growth factor-β2 and cleared of most allergenic proteins by one-step cibacron blue
chromatography. International Dairy Journal, 19(5), 286-294.
67
Thomä, C., Krause, I., & Kulozik, U. (2006). Precipitation behaviour of caseinomacropeptides and their
simultaneous determination with whey proteins by RP-HPLC. International Dairy Journal, 16(4),
285-293.
Tokuyama, Y., & Tokuyama, H. (1993). Purification and identification of TGF-β2-related growth factor
from bovine colostrum. Journal of Dairy Research, 60(01), 99-109.
Tremblay, L., Laporte, M.F., Leonil, J., Dupont, D.,& Paquin, P. (2003). Quantitation of Proteins in Milk
and Milk Products. In Fox, P.F. and McSweeney, P.L.H. (editors) Advanced Dairy Chemistry, Vol 1:
Proteins 3rd edn., (p.55). Kluwer Academic Plenum Publishers, New York.
Tucker, R. F., Shipley, G. D., Moses, H. L., & Holley, R. W. (1984). Growth inhibitor from BSC-1 cells
closely related to platelet type beta transforming growth factor. Science , 226(4675), 705-707.
Vaarala, O. (2011). The gut as a regulator of early inflammation in type 1 diabetes. Current Opinion in
Endocrinology, Diabetes, and Obesity, 18(4), 241-247.
Vaarala, O. (2012). Is the origin of type 1 diabetes in the gut? Immunology and Cell Biology, 90(3),
271-276.
van Waarde, M. A. W. H., van Assen, A. J., Kampinga, H. H., Konings, A. W. T., & Vujaskovic, Z. (1997).
Quantification of transforming growth factor-[beta] in biological material using cells transfected
with a plasminogen activator inhibitor-1 promoter-luciferase construct. Analytical Biochemistry,
247(1), 45-51.
Wagner, J. (2001). Definitions and Buzzwords. In Wagner, J. (editor) Membrane Filtration Handbook –
Practical Tips and Hints, (p. 5). Osmonics Inc., Minnetoka, USA.
Wakefield, L. M., Smith, D. M., Flanders, K. C., & Sporn, M. B. (1988). Latent transforming growth
factor-beta from human platelets. A high molecular weight complex containing precursor
sequences. Journal of Biological Chemistry, 263(16), 7646-7654.
Wakefield, L. M., Winokur, T. S., Hollands, R. S., Christopherson, K., Levinson, A. D., & Sporn, M. B.
(1990). Recombinant latent transforming growth factor beta 1 has a longer plasma half-life in rats
than active transforming growth factor beta 1, and a different tissue distribution. The Journal of
Clinical Investigation, 86(6), 1976-1984.
Vega, J. R., Gibson, C. A., Skaar, T. C., Hadsell, D. L., & Baumrucker, C. R. (1991). Insulin-like growth
factor (IGF)-I and -II and IGF binding proteins in serum and mammary secretions during the dry
period and early lactation in dairy cows. Journal of Animal Science, 69(6), 2538-2547.
Wiley, A. S. (2012). Cow milk consumption, insulin-like growth factor-I, and human biology: A life
history approach. American Journal of Human Biology, 24(2), 130-138.
68
Wintersteiner, O., & Abramson, H. A. (1933). The isoelectric point of insulin. The Journal of Biological
Chemistry, 99, 741-753.
Xian, C. J., Shoubridge, C. A., & Read, L. C. (1995). Degradation of IGF-I in the adult rat gastrointestinal
tract is limited by a specific antiserum or the dietary protein casein. The Journal of Endocrinology,
146(2), 215-225.
Yun, Z. Y., Zhang, H. P., Cai, X. Z., Wang, A. P., & Zhang Lie B. (2007). Kinetic and thermodynamic
studies on the thermal denaturation of bovine milk insulin-like grwth factor-I in model systems.
Lait, 87, 139 -148.
Zapf, J., Hauri, C., Waldvogel, M., & Froesch, E. R. (1986). Acute metabolic effects and half-lives of
intravenously administered insulinlike growth factors I and II in normal and hypophysectomized
rats. The Journal of Clinical Investigation, 77(6), 1768-1775.
Zapf, J., Kaufmann, U., Eigenmann, E. J., & Froesch, E. R. (1977). Determination of nonsuppressible
insulin-like activity in human serum by a sensitive protein-binding assay. Clinical Chemistry, 23(4),
677-682.
69
Appendices
Publications I – IV