Ocean Uptake of Atmospheric CO2 and its Impact … Calcification Rate (% of rate at Ω arag = 4.6)...
32
Dr. Christopher L. Sabine, oceanographer at Dr. Christopher L. Sabine, oceanographer at NOAA NOAA ’ ’ s Pacific Marine Environmental Laboratory s Pacific Marine Environmental Laboratory Ocean Uptake of Atmospheric CO 2 and its Impact on Marine Ecosystems
Transcript of Ocean Uptake of Atmospheric CO2 and its Impact … Calcification Rate (% of rate at Ω arag = 4.6)...
Dr. Christopher L. Sabine, oceanographer atDr. Christopher L. Sabine, oceanographer atNOAANOAA’’s Pacific Marine Environmental Laboratorys Pacific Marine Environmental Laboratory
Ocean Uptake of Atmospheric CO2 and its Impact on Marine Ecosystems
Rising Atmospheric CO2 was first documented by Dr. David Keeling in the mid 1900s.
Slope2.1 ppm/yr
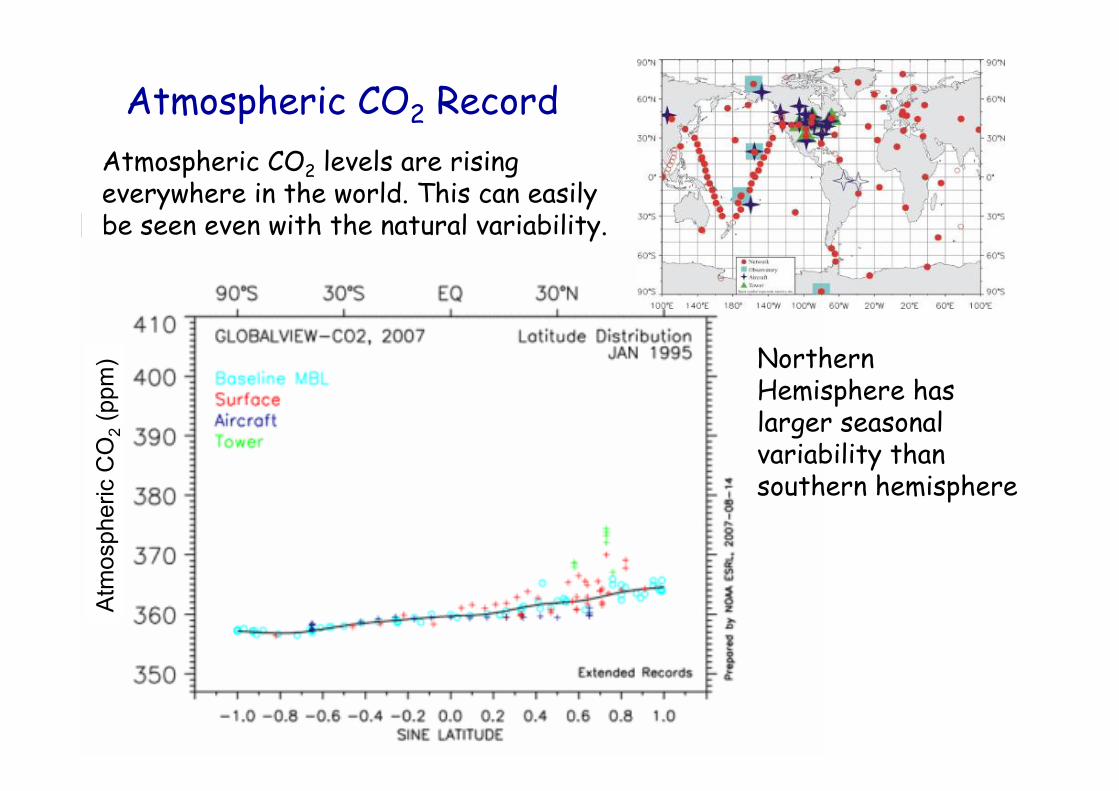
Atmospheric CO2 Record
Northern Hemisphere has larger seasonal variability than southern hemisphere
Atmospheric CO2 levels are rising everywhere in the world. This can easily be seen even with the natural variability.
Atm
osph
eric
CO
2(p
pm)
1990 1995 2000 2005 2010
CO
2 Em
issi
ons
(GtC
y-1)
5
6
7
8
9
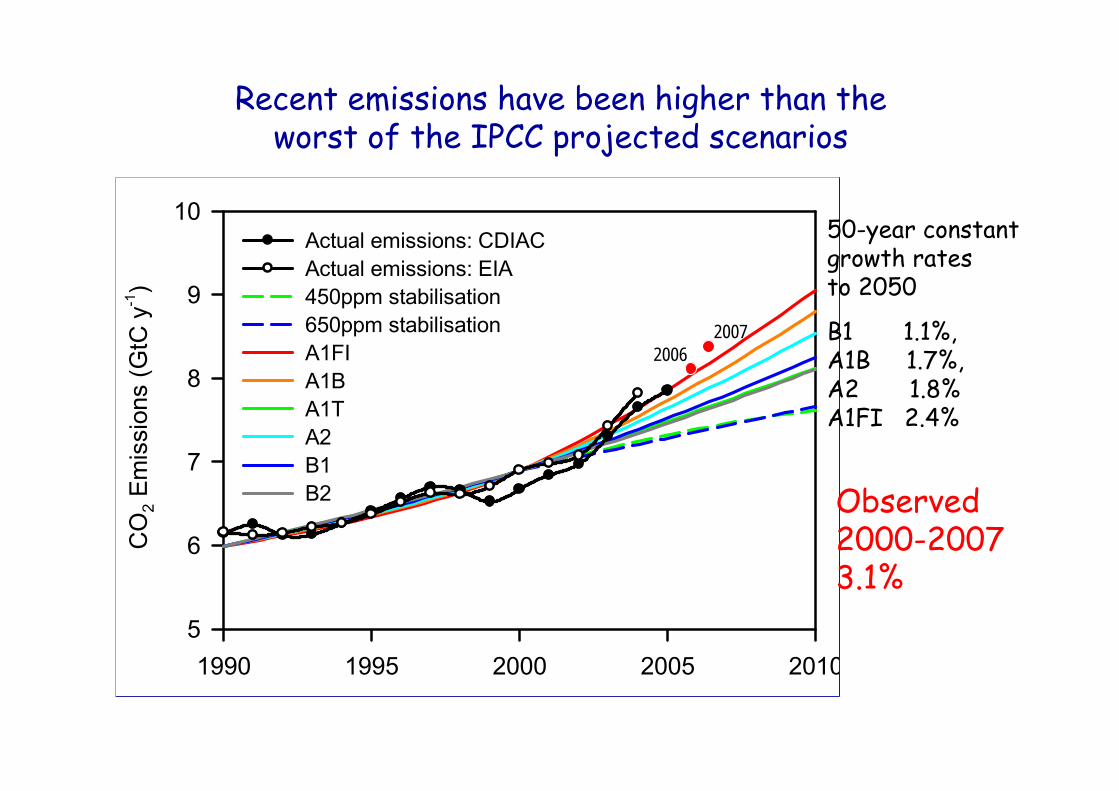
10Actual emissions: CDIACActual emissions: EIA450ppm stabilisation650ppm stabilisationA1FI A1B A1T A2 B1 B2
50-year constant growth rates to 2050
B1 1.1%,A1B 1.7%,A2 1.8% A1FI 2.4%
Observed2000-2007 3.1%
20072006
Recent emissions have been higher than the worst of the IPCC projected scenarios
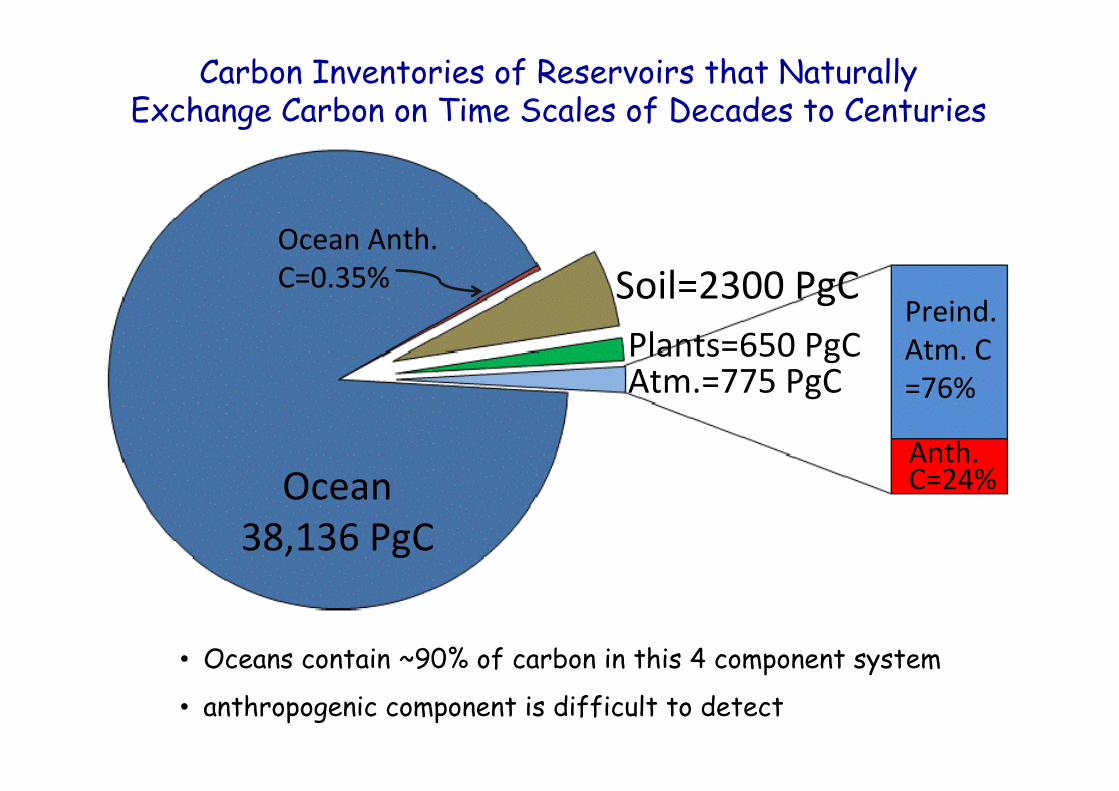
Carbon Inventories of Reservoirs that Naturally Exchange Carbon on Time Scales of Decades to Centuries
Ocean38,136 PgC
Soil=2300 PgCPlants=650 PgCAtm.=775 PgC
Preind.Atm. C=76%
Ocean Anth. C=0.35%
• Oceans contain ~90% of carbon in this 4 component system
• anthropogenic component is difficult to detect
Anth. C=24%
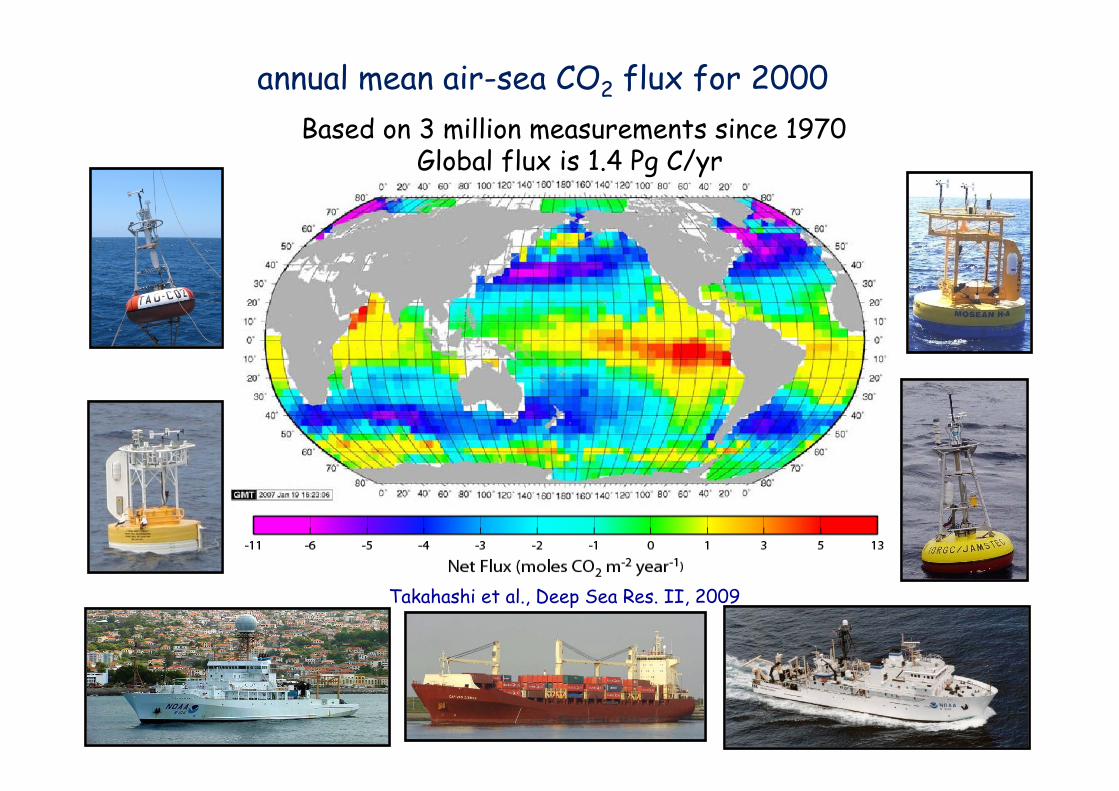
annual mean air-sea CO2 flux for 2000Based on 3 million measurements since 1970
Global flux is 1.4 Pg C/yr
Takahashi et al., Deep Sea Res. II, 2009
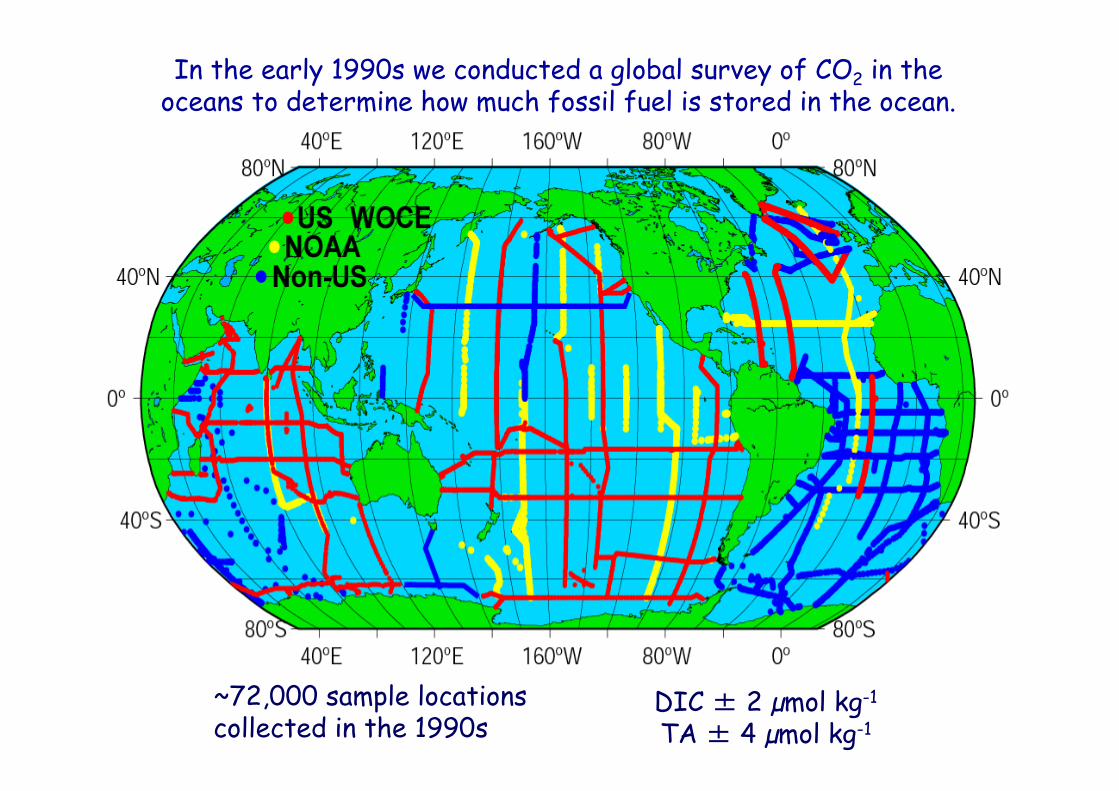
In the early 1990s we conducted a global survey of CO2 in the oceans to determine how much fossil fuel is stored in the ocean.
~72,000 sample locations collected in the 1990s
DIC ± 2 µmol kg-1
TA ± 4 µmol kg-1
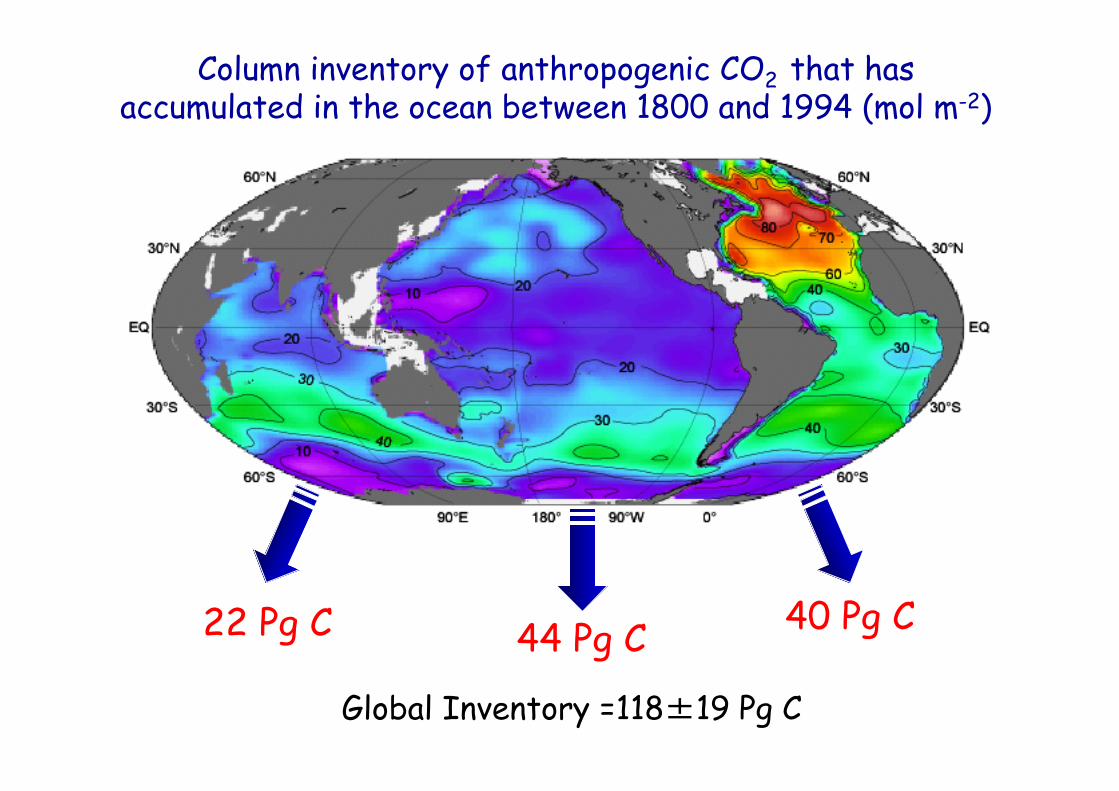
Column inventory of anthropogenic CO2 that has accumulated in the ocean between 1800 and 1994 (mol m-2)
Global Inventory =118±19 Pg C
22 Pg C 40 Pg C44 Pg C
adapted from Sabine et al., 2004
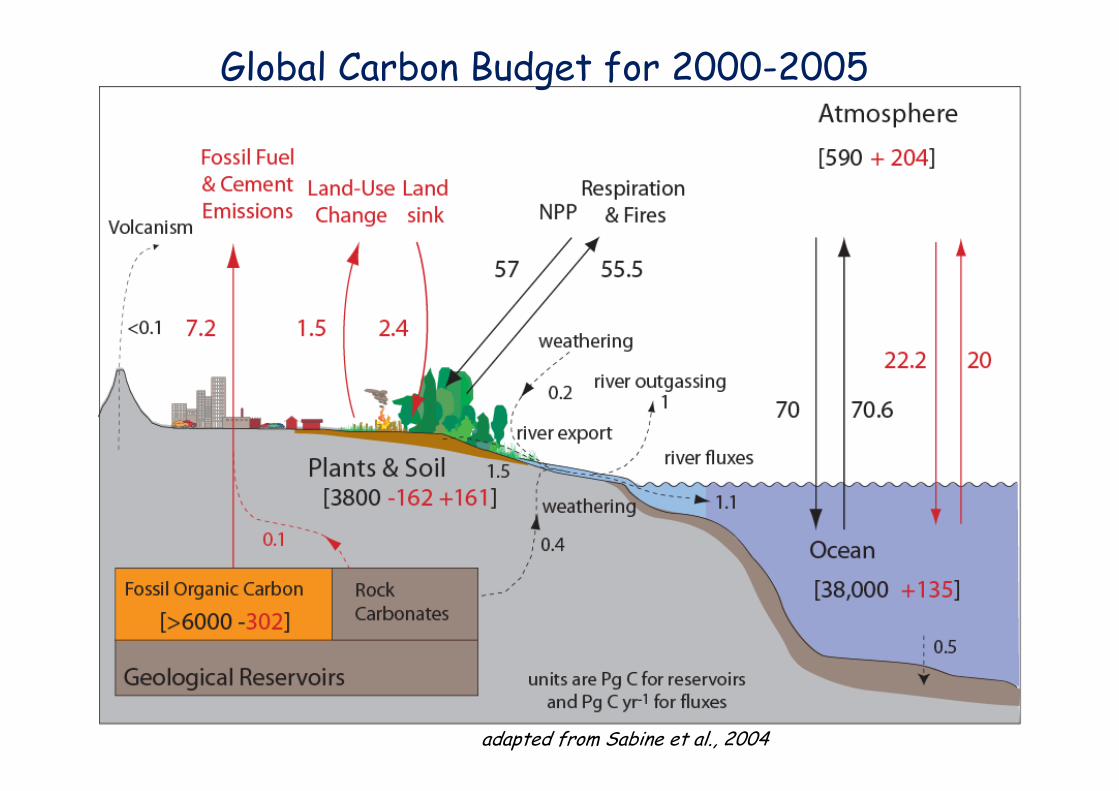
Global Carbon Budget for 2000-2005
After Turley et al., 2005
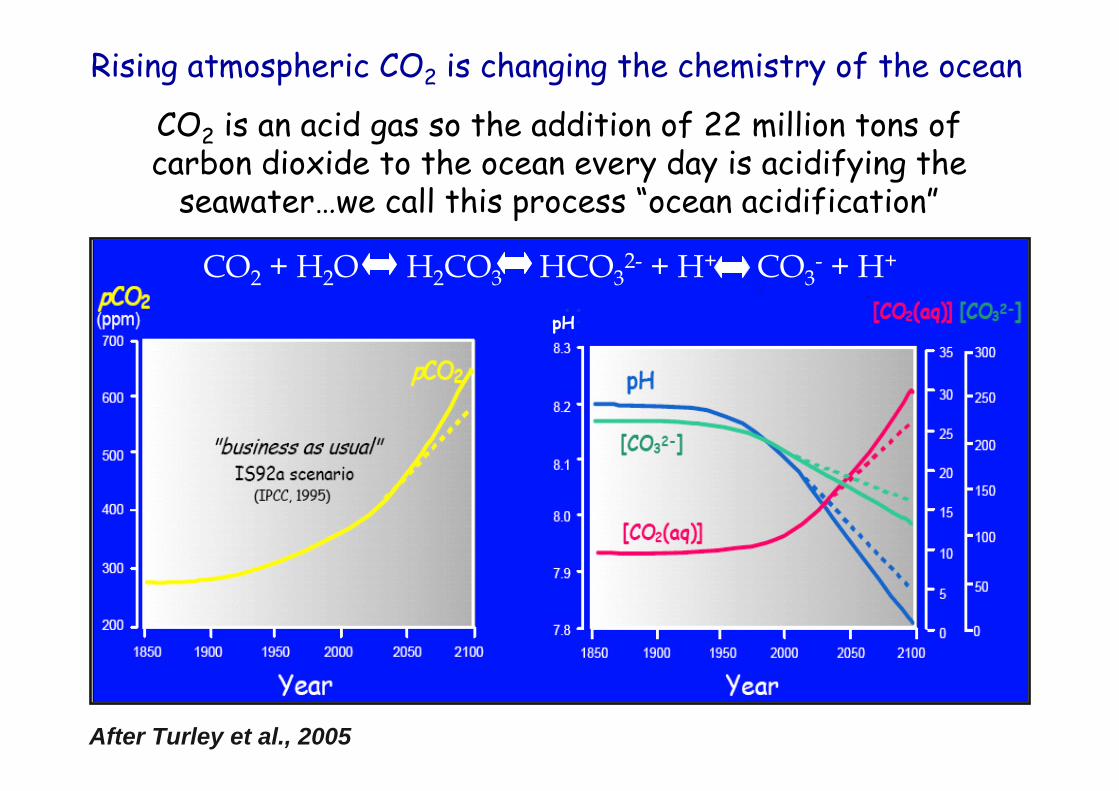
Rising atmospheric CO2 is changing the chemistry of the ocean
pH
CO2 + H2O H2CO3 HCO32- + H+ CO3
- + H+
CO2 is an acid gas so the addition of 22 million tons of carbon dioxide to the ocean every day is acidifying the
seawater…we call this process “ocean acidification”
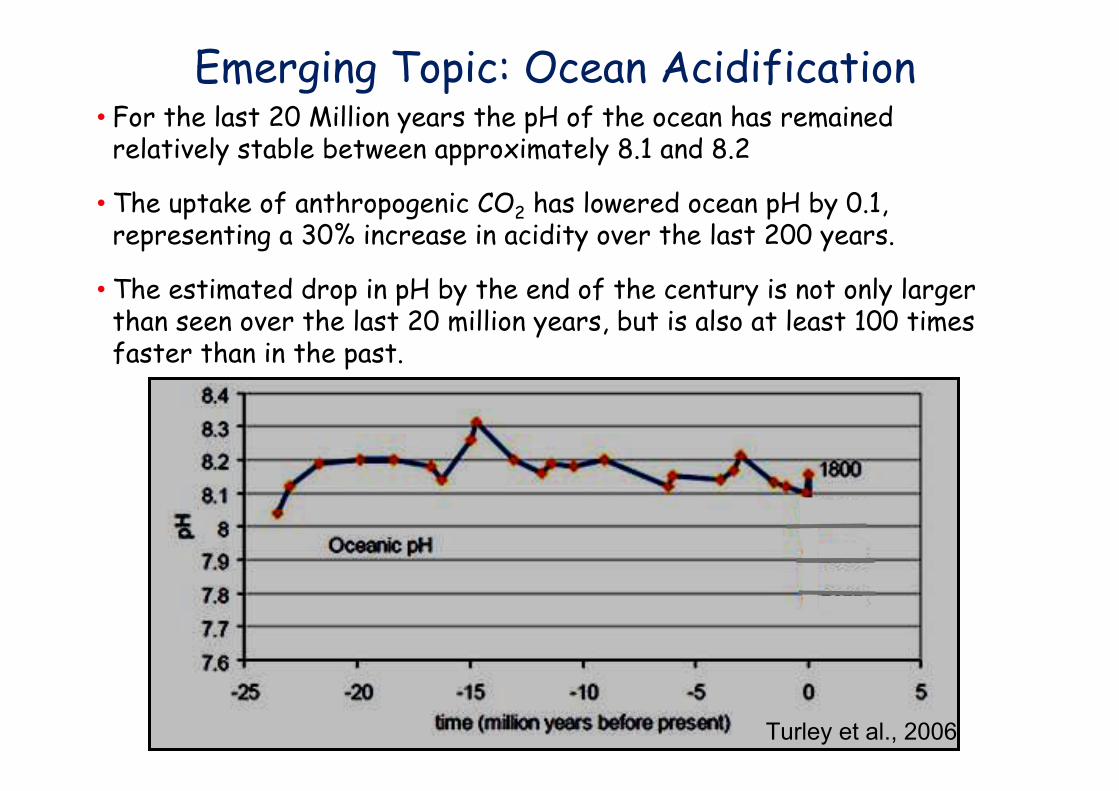
• For the last 20 Million years the pH of the ocean has remained relatively stable between approximately 8.1 and 8.2
• The uptake of anthropogenic CO2 has lowered ocean pH by 0.1, representing a 30% increase in acidity over the last 200 years.
• The estimated drop in pH by the end of the century is not only larger than seen over the last 20 million years, but is also at least 100 times faster than in the past.
Emerging Topic: Ocean Acidification
Turley et al., 2006
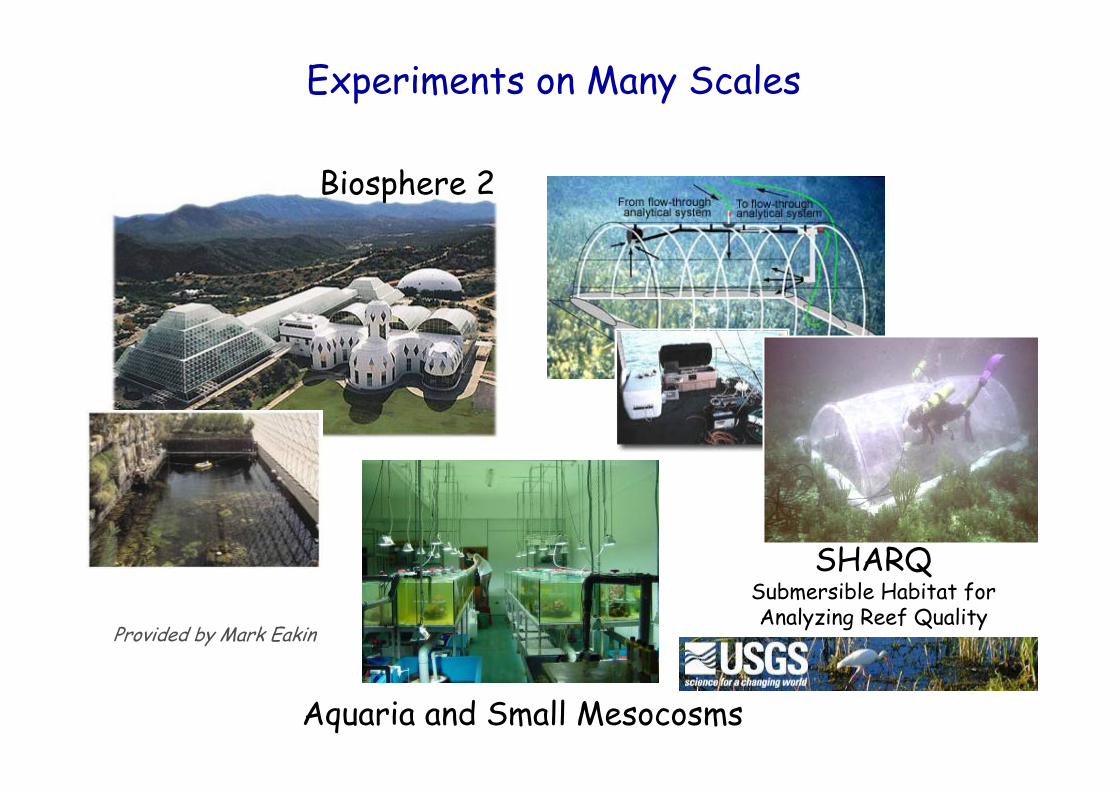
Experiments on Many Scales
SHARQSubmersible Habitat for Analyzing Reef Quality
Aquaria and Small Mesocosms
Biosphere 2
Provided by Mark Eakin
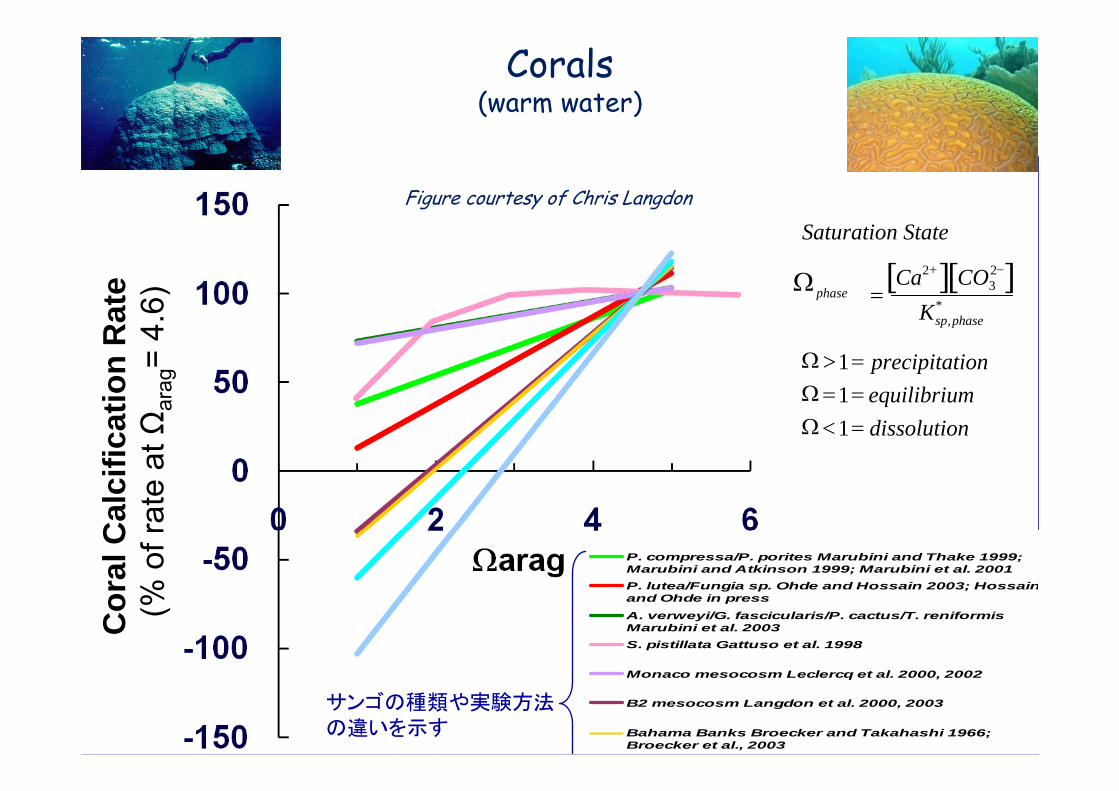
Cor
al C
alci
ficat
ion
Rat
e (%
of r
ate
at Ω
arag
= 4.
6)Figure courtesy of Chris Langdon
P. compressa/P. porites Marubini and Thake 1999;Marubini and Atkinson 1999; Marubini et al. 2001P. lutea/Fungia sp. Ohde and Hossain 2003; Hossainand Ohde in pressA. verweyi/G. fascicularis/P. cactus/T. reniformisMarubini et al. 2003S. pistillata Gattuso et al. 1998
Monaco mesocosm Leclercq et al. 2000, 2002
B2 mesocosm Langdon et al. 2000, 2003
Bahama Banks Broecker and Takahashi 1966;Broecker et al., 2003
Saturation State
Ω phase =Ca2+[ ] CO3
2−[ ]Ksp,phase
*
Ω>1= precipitationΩ=1= equilibriumΩ<1= dissolution
Corals(warm water)
サンゴの種類や実験方法の違いを示す
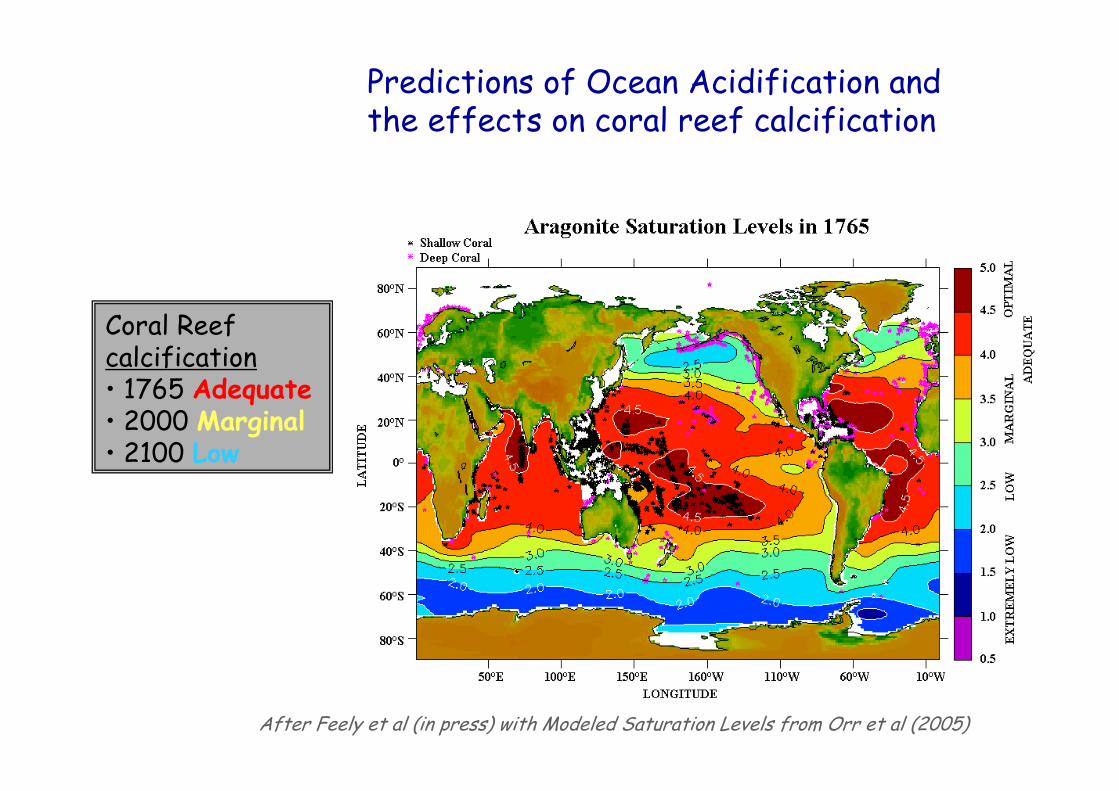
Predictions of Ocean Acidification and the effects on coral reef calcification
Coral Reefcalcification• 1765 Adequate• 2000 Marginal• 2100 Low
After Feely et al (in press) with Modeled Saturation Levels from Orr et al (2005)
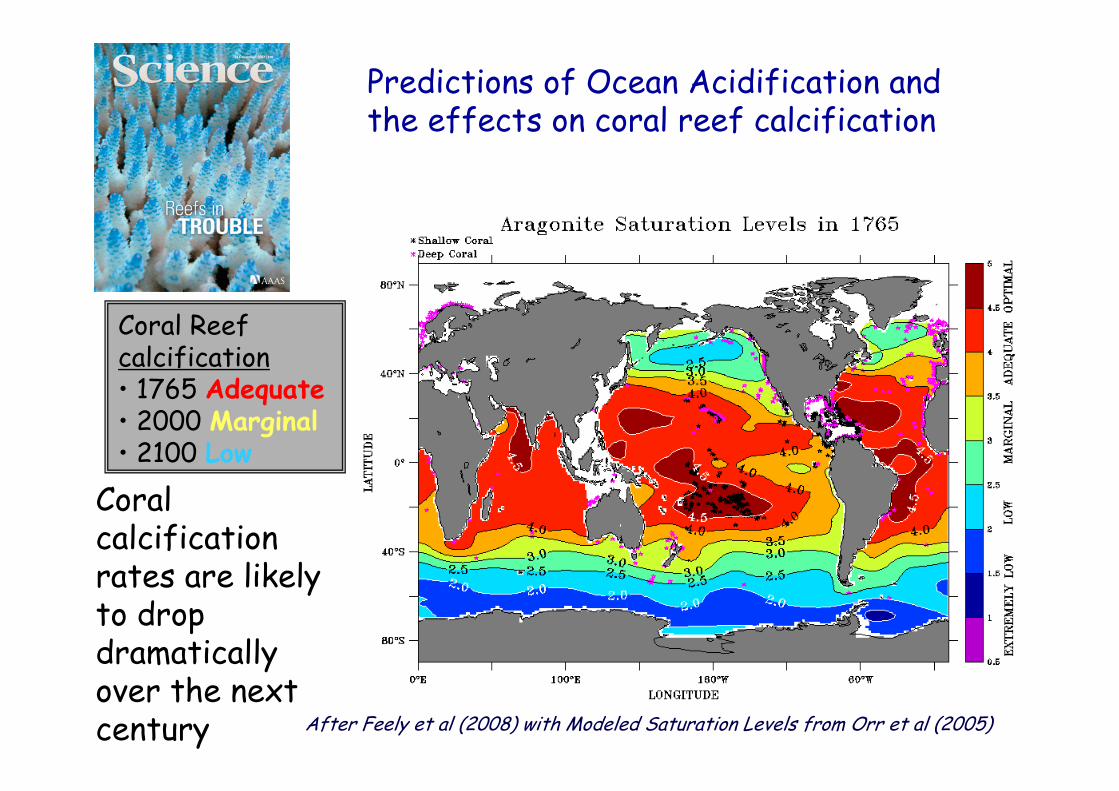
Coral calcification rates are likely to drop dramatically over the next century
Predictions of Ocean Acidification and the effects on coral reef calcification
After Feely et al (2008) with Modeled Saturation Levels from Orr et al (2005)
Coral Reefcalcification• 1765 Adequate• 2000 Marginal• 2100 Low
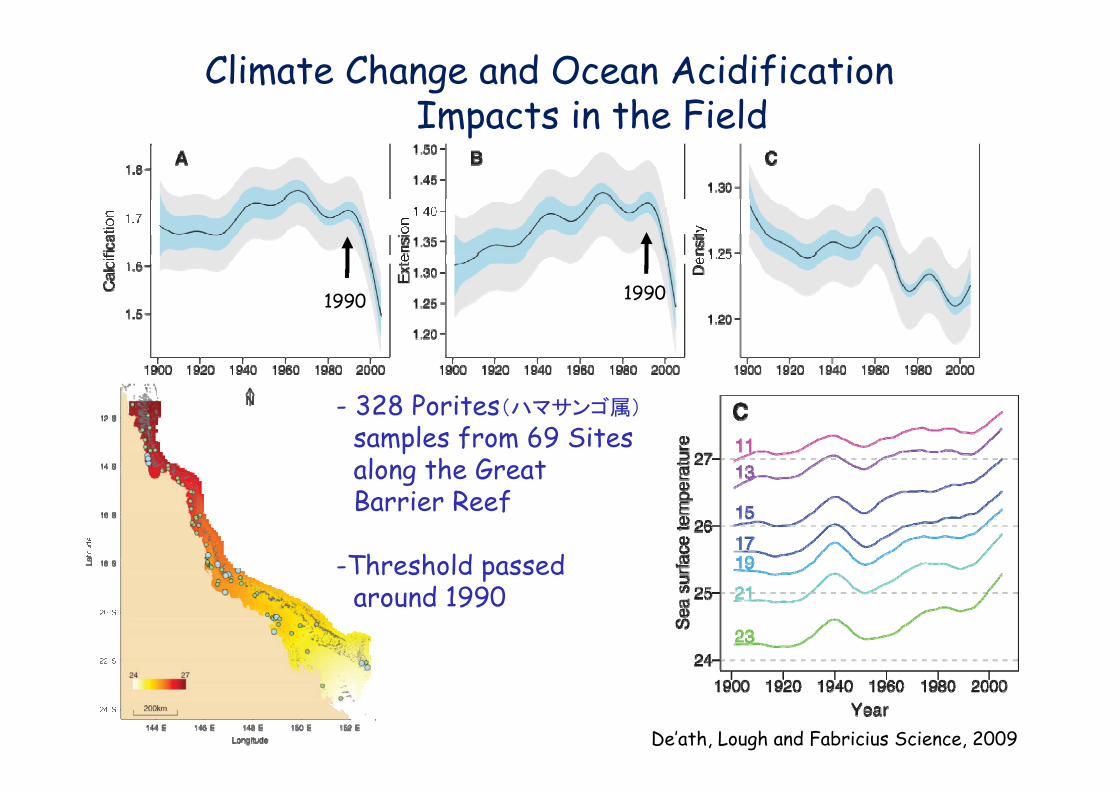
Climate Change and Ocean AcidificationImpacts in the Field
1990 1990
- 328 Porites(ハマサンゴ属)
samples from 69 Sites along the Great Barrier Reef
-Threshold passed around 1990
De’ath, Lough and Fabricius Science, 2009
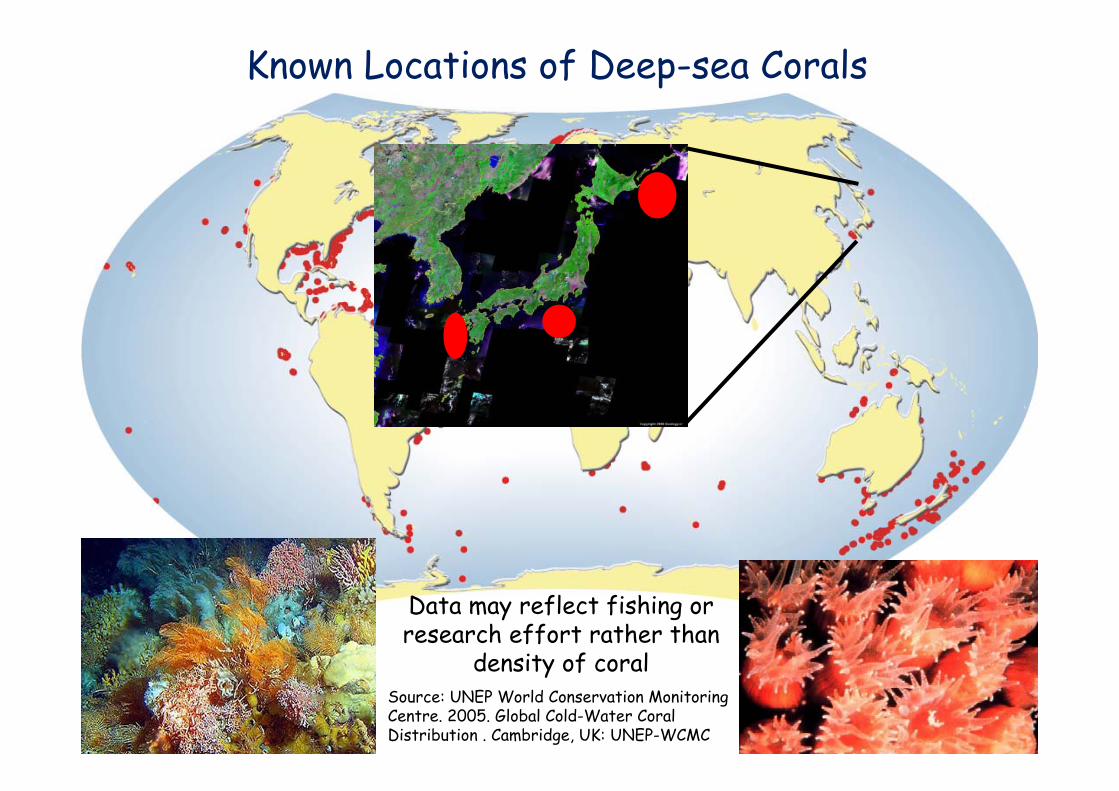
Known Locations of Deep-sea Corals
Data may reflect fishing or research effort rather than
density of coralSource: UNEP World Conservation Monitoring Centre. 2005. Global Cold-Water Coral Distribution . Cambridge, UK: UNEP-WCMC
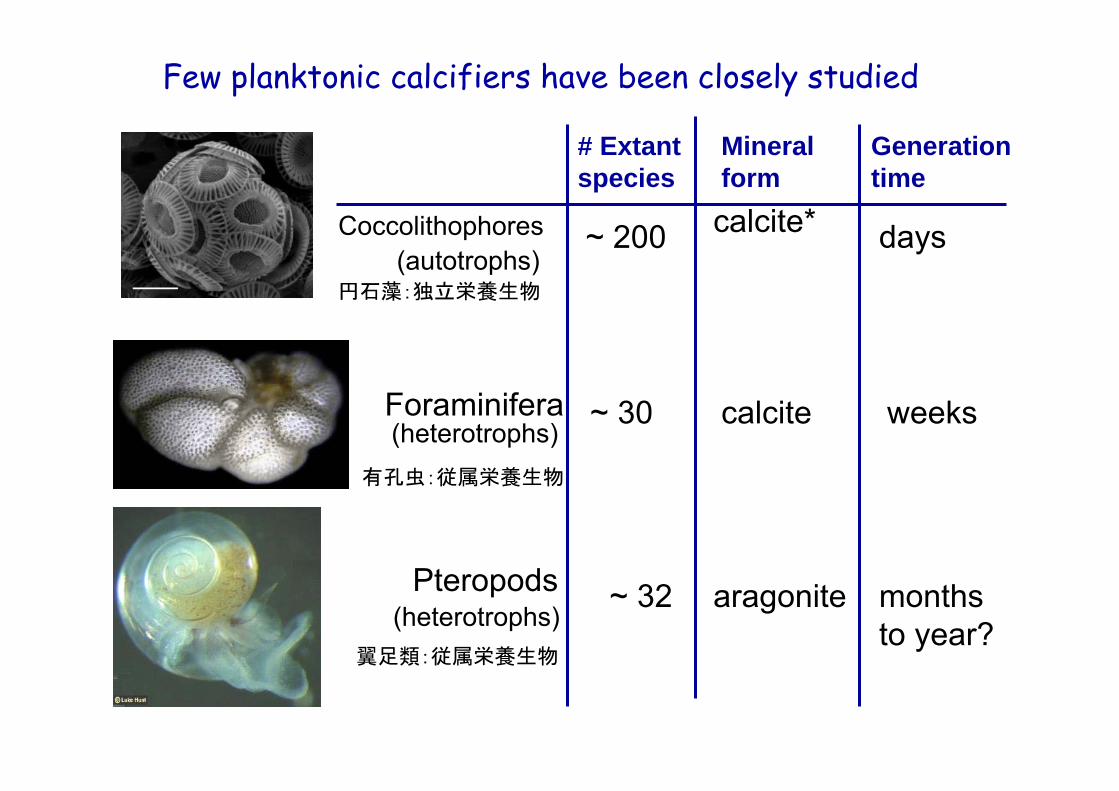
Few planktonic calcifiers have been closely studied
# Extant species
Mineral form
Generation time
Coccolithophores
円石藻:独立栄養生物
Foraminifera
有孔虫:従属栄養生物
Pteropods
翼足類:従属栄養生物
~ 200 calcite*
~ 30
~ 32
calcite
aragonite
days
weeks
months to year?
(autotrophs)
(heterotrophs)
(heterotrophs)
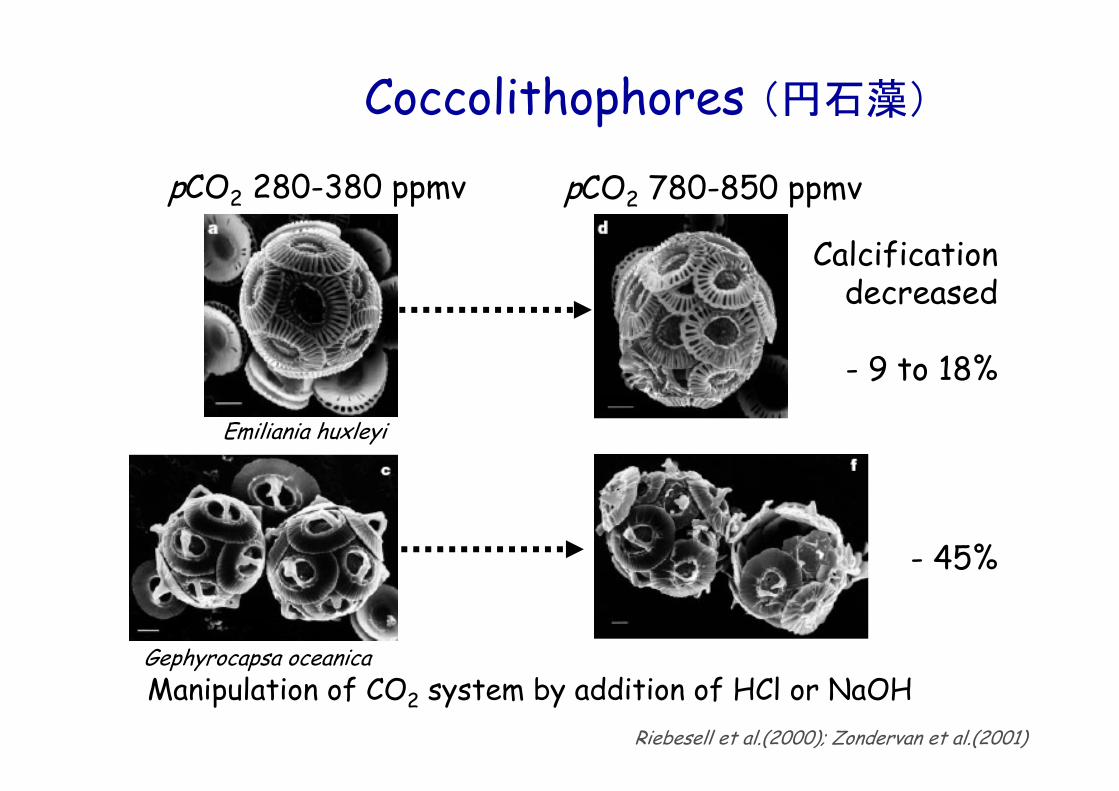
pCO2 280-380 ppmv pCO2 780-850 ppmv
Emiliania huxleyi
Gephyrocapsa oceanica
Coccolithophores (円石藻)
Riebesell et al.(2000); Zondervan et al.(2001)
Manipulation of CO2 system by addition of HCl or NaOH
Calcification decreased
- 9 to 18%
- 45%
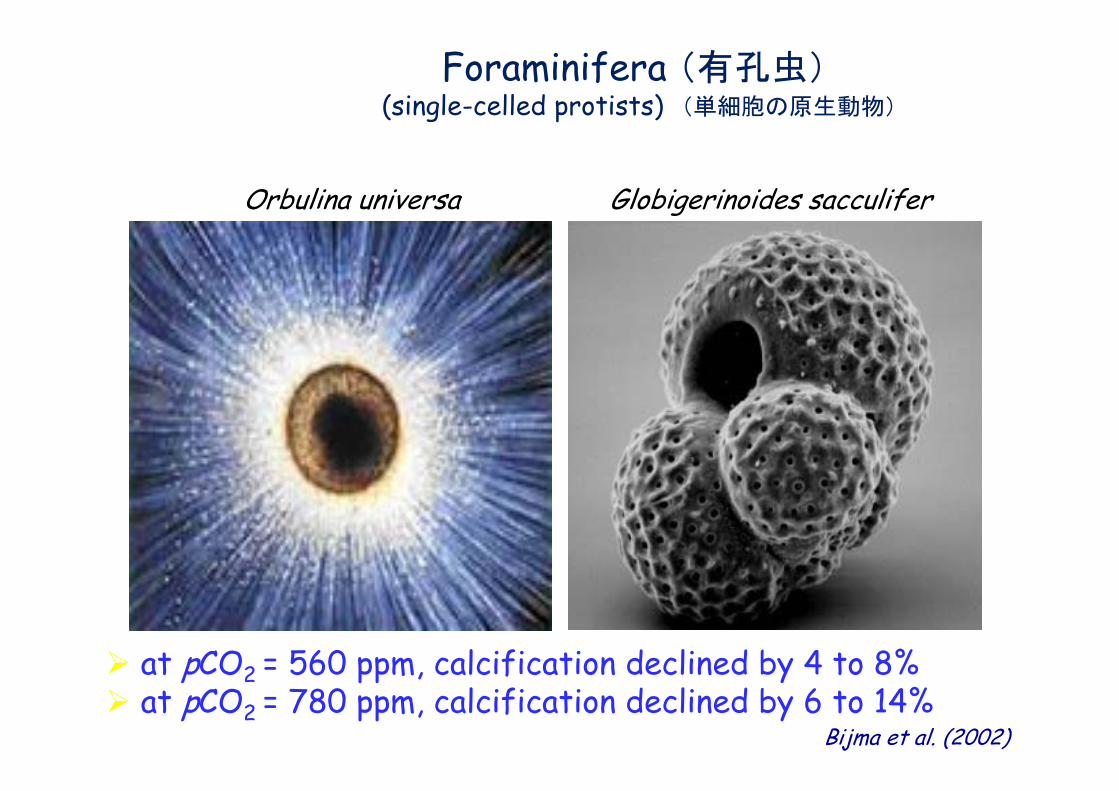
Foraminifera (有孔虫)(single-celled protists) (単細胞の原生動物)
Shell mass is negatively correlated with CO2
Bijma et al. (2002)
at pCO2 = 560 ppm, calcification declined by 4 to 8% at pCO2 = 780 ppm, calcification declined by 6 to 14%
Globigerinoides sacculiferOrbulina universa
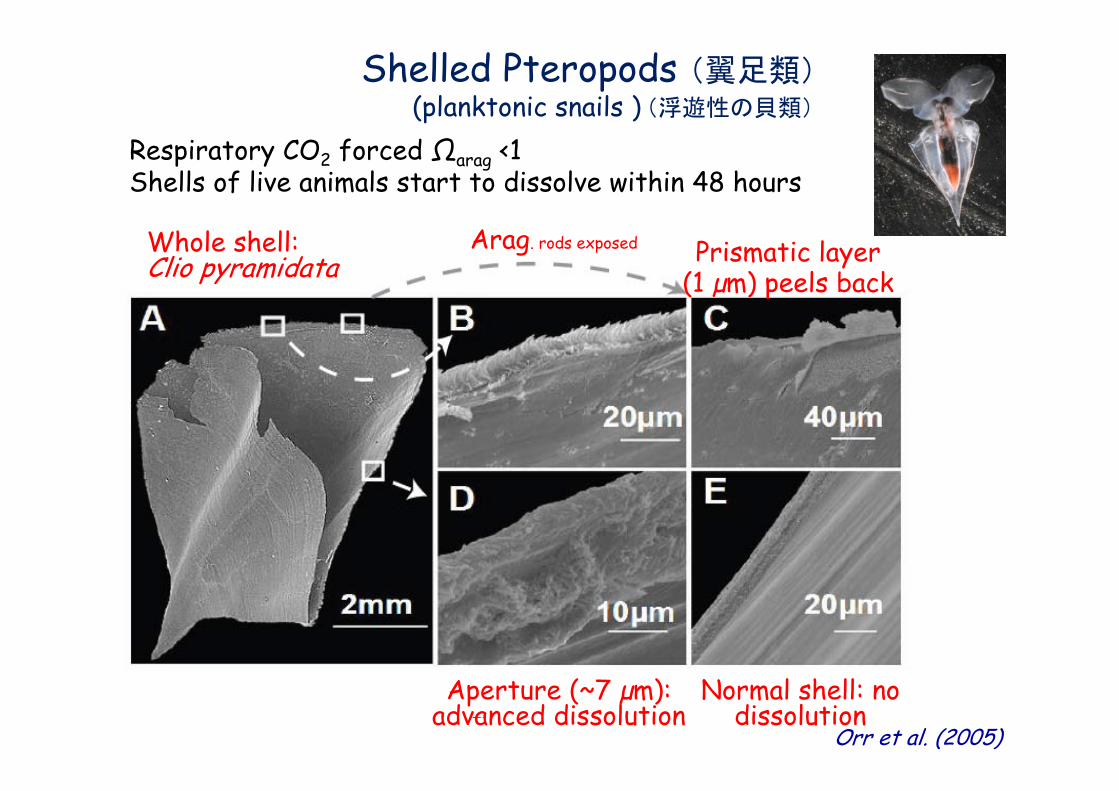
Shelled Pteropods (翼足類)(planktonic snails ) (浮遊性の貝類)
Orr et al. (2005)
Whole shell: Clio pyramidata
Arag. rods exposed Prismatic layer (1 µm) peels back
Aperture (~7 µm): advanced dissolution
Normal shell: nodissolution
Respiratory CO2 forced Ωarag <1Shells of live animals start to dissolve within 48 hours
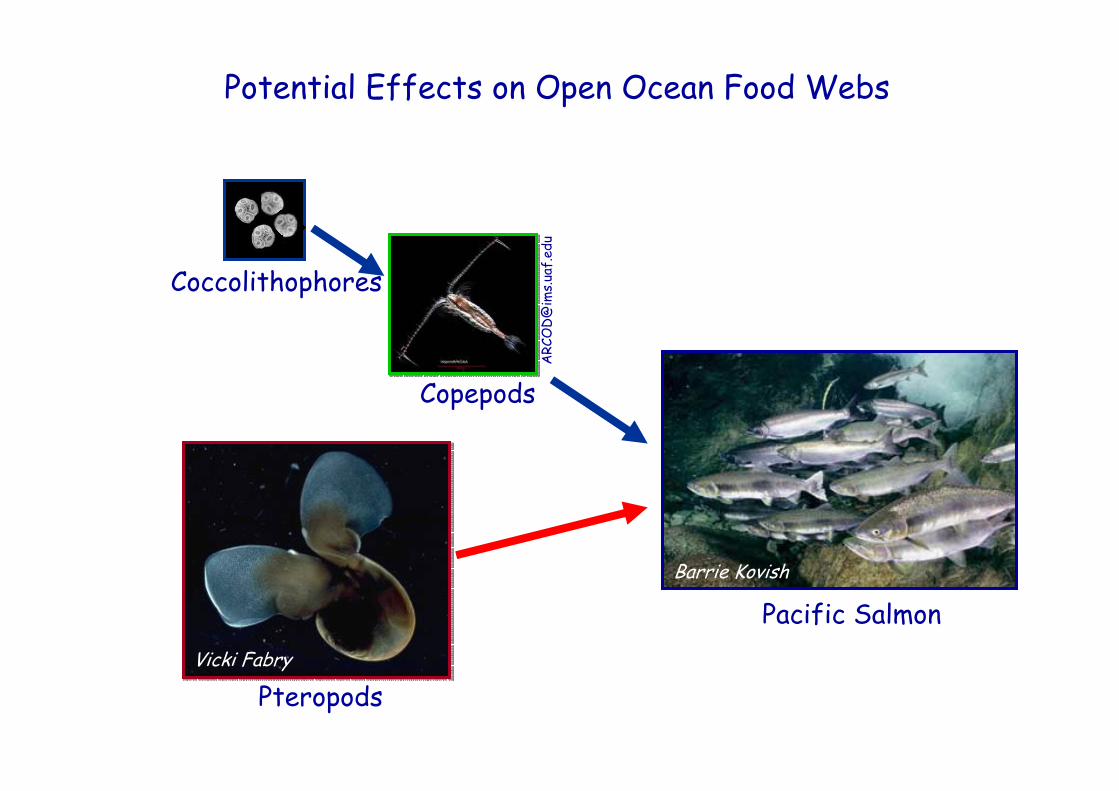
Potential Effects on Open Ocean Food Webs
Barrie Kovish
Vicki Fabry
ARC
OD
@im
s.ua
f.ed
u
Pacific Salmon
Copepods
Coccolithophores
Pteropods
Armstrong et al., 2005
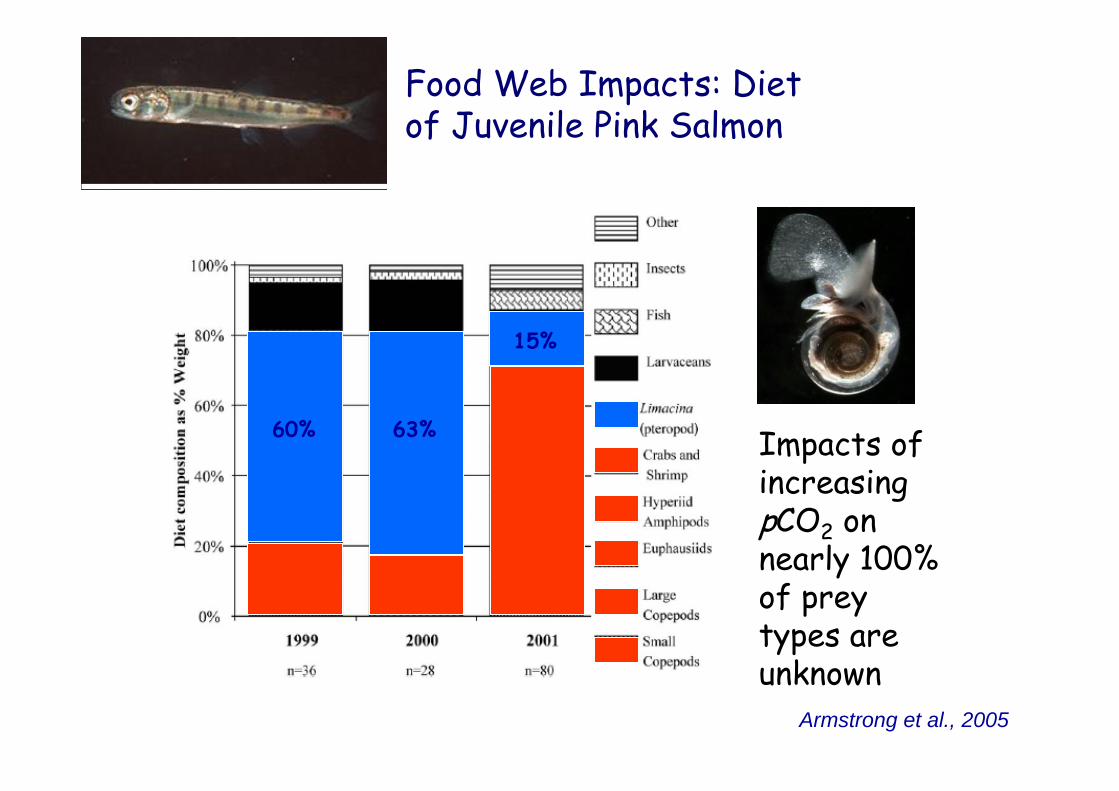
Food Web Impacts: Diet of Juvenile Pink Salmon
60% 63%
15%
Impacts of increasing pCO2 on nearly 100% of prey types are unknown
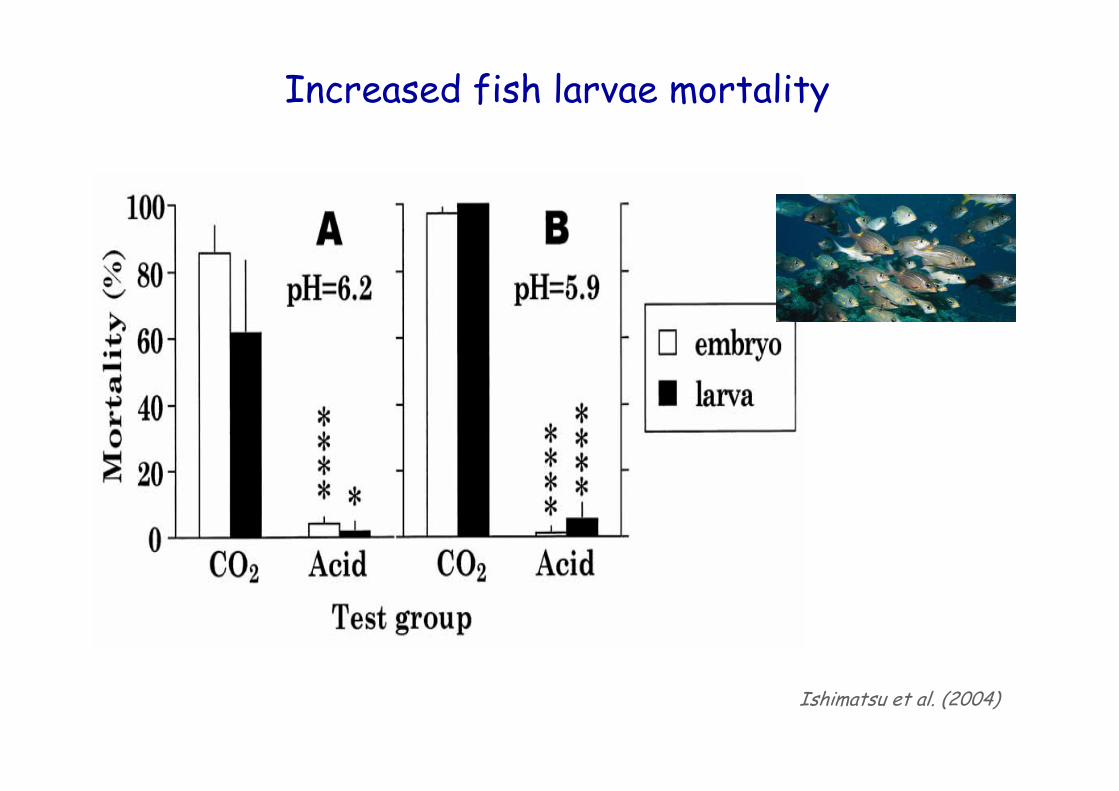
Increased fish larvae mortality
Ishimatsu et al. (2004)
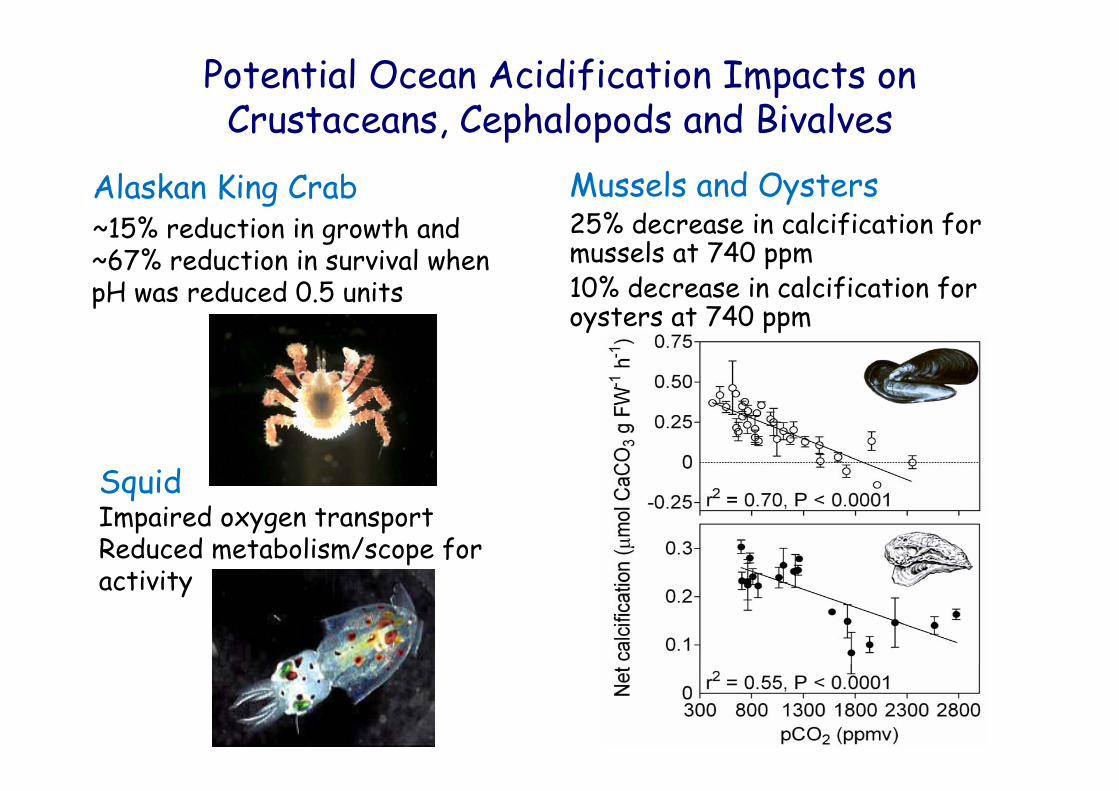
Potential Ocean Acidification Impacts on Crustaceans, Cephalopods and Bivalves
Alaskan King Crab~15% reduction in growth and ~67% reduction in survival when pH was reduced 0.5 units
SquidImpaired oxygen transport Reduced metabolism/scope for activity
Mussels and Oysters25% decrease in calcification for mussels at 740 ppm10% decrease in calcification for oysters at 740 ppm
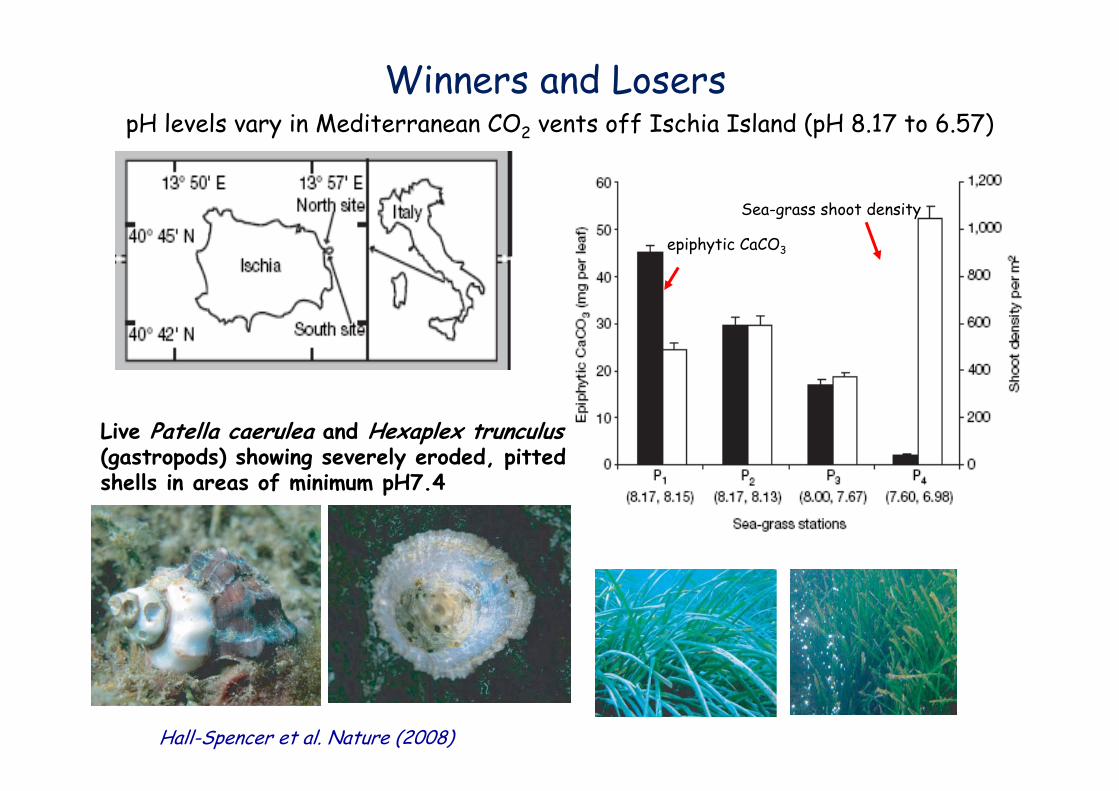
pH levels vary in Mediterranean CO2 vents off Ischia Island (pH 8.17 to 6.57)
Sea-grass shoot density
epiphytic CaCO3
Hall-Spencer et al. Nature (2008)
Winners and Losers
Live Patella caerulea and Hexaplex trunculus(gastropods) showing severely eroded, pitted shells in areas of minimum pH7.4
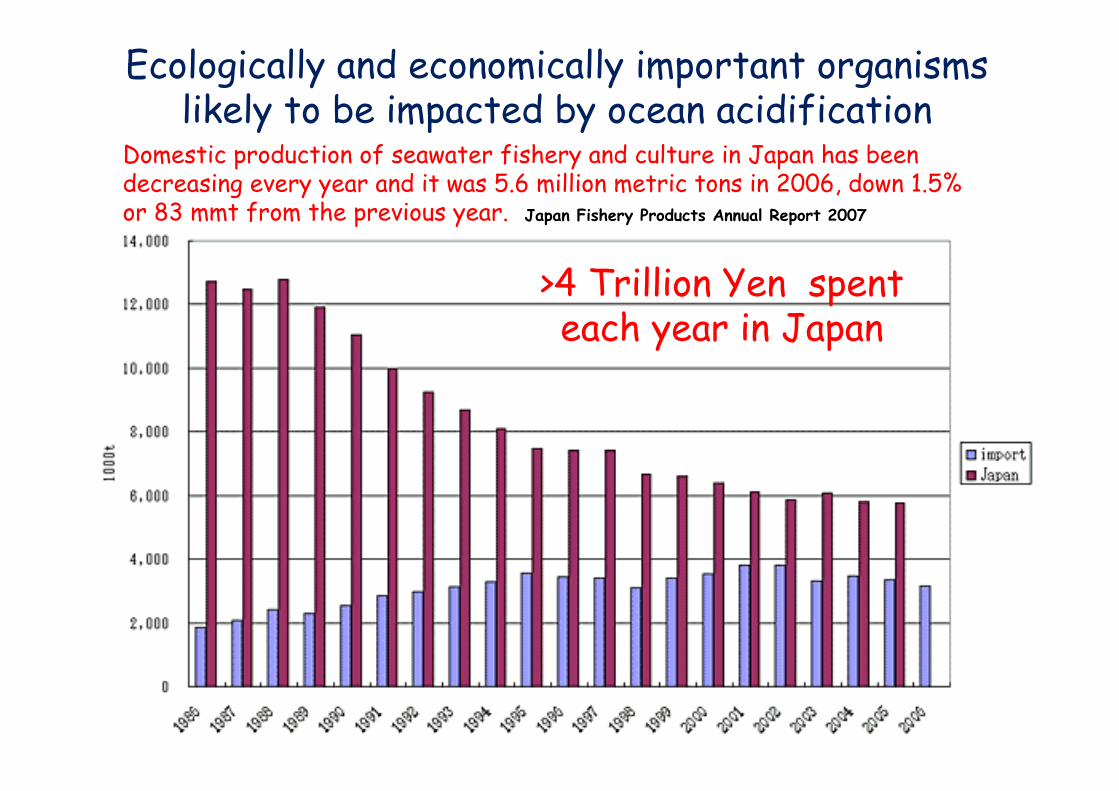
Ecologically and economically important organisms likely to be impacted by ocean acidification
Domestic production of seawater fishery and culture in Japan has been decreasing every year and it was 5.6 million metric tons in 2006, down 1.5% or 83 mmt from the previous year. Japan Fishery Products Annual Report 2007
>4 Trillion Yen spent each year in Japan
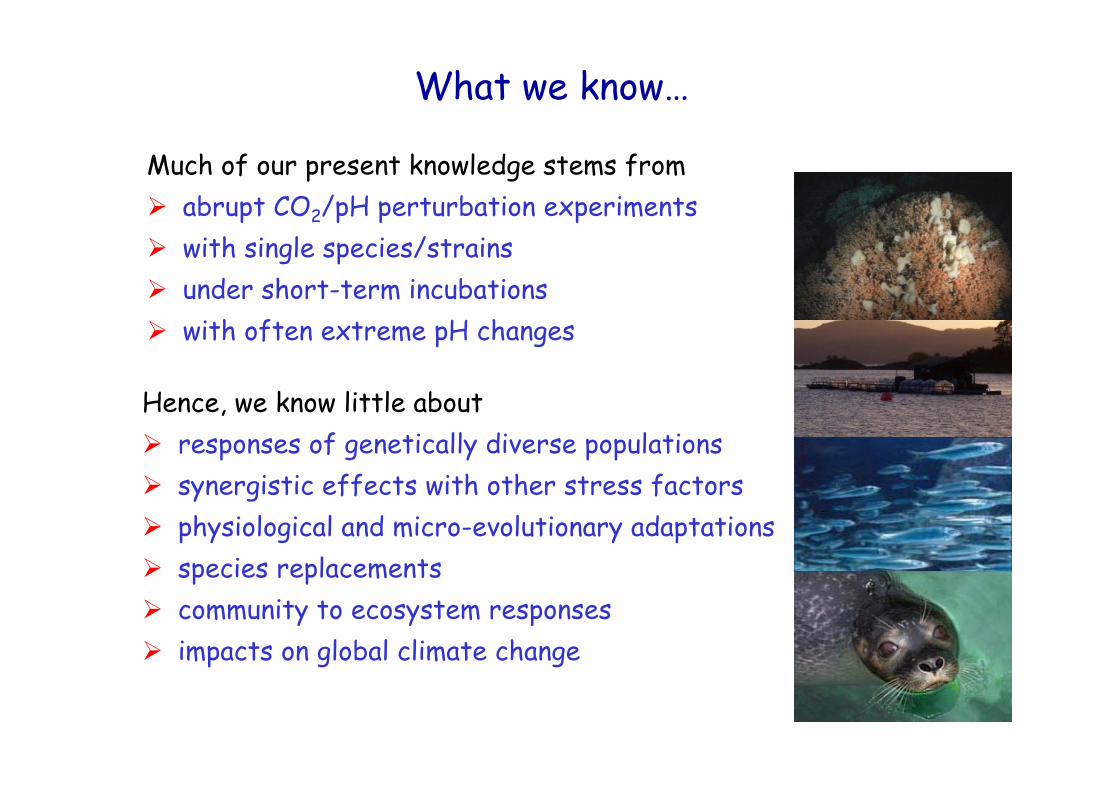
Much of our present knowledge stems fromabrupt CO2/pH perturbation experimentswith single species/strainsunder short-term incubationswith often extreme pH changes
Hence, we know little aboutresponses of genetically diverse populationssynergistic effects with other stress factorsphysiological and micro-evolutionary adaptationsspecies replacementscommunity to ecosystem responsesimpacts on global climate change
What we know…
Sinking
Org
anic
Debris
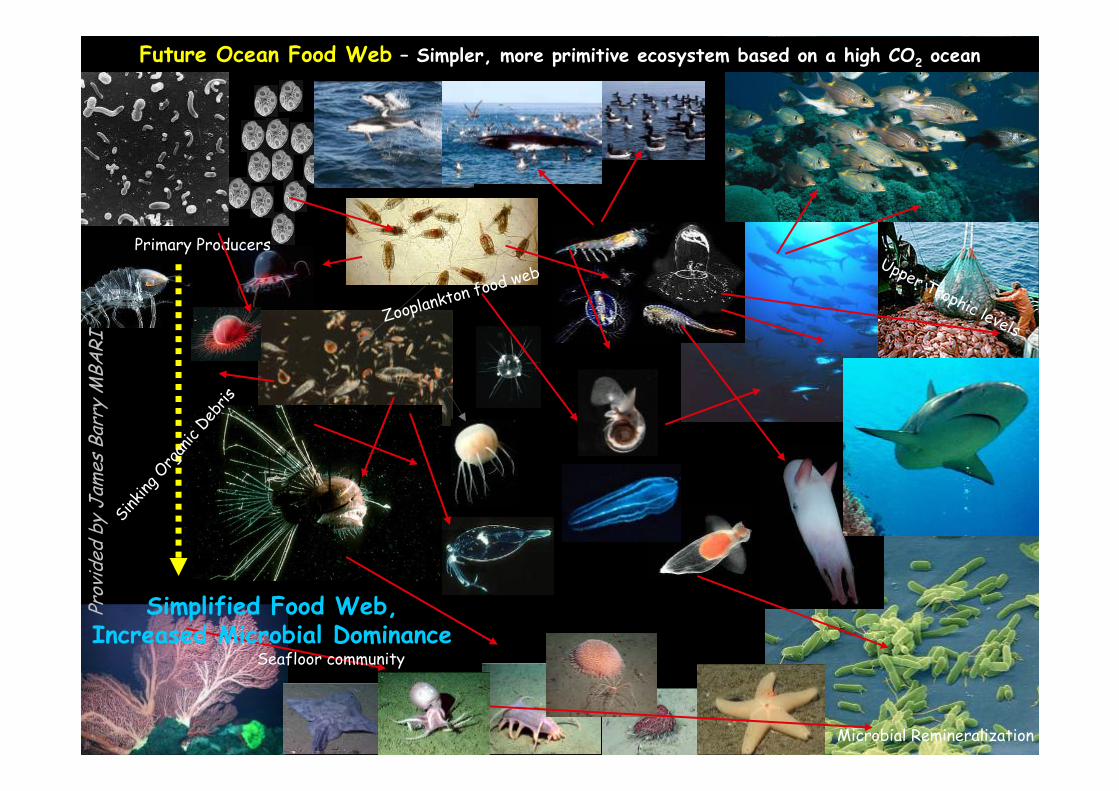
Present Ocean Food Web – Complex ecosystem interactions based on a low CO2 ocean
Microbial Remineralization
Primary Producers
Zooplankton food webUpper Trophic levels
Seafloor community
Simplified Food Web,Increased Microbial Dominance
Prov
ided
by
Jam
es B
arry
MBA
RI
Future Ocean Food Web – Simpler, more primitive ecosystem based on a high CO2 ocean
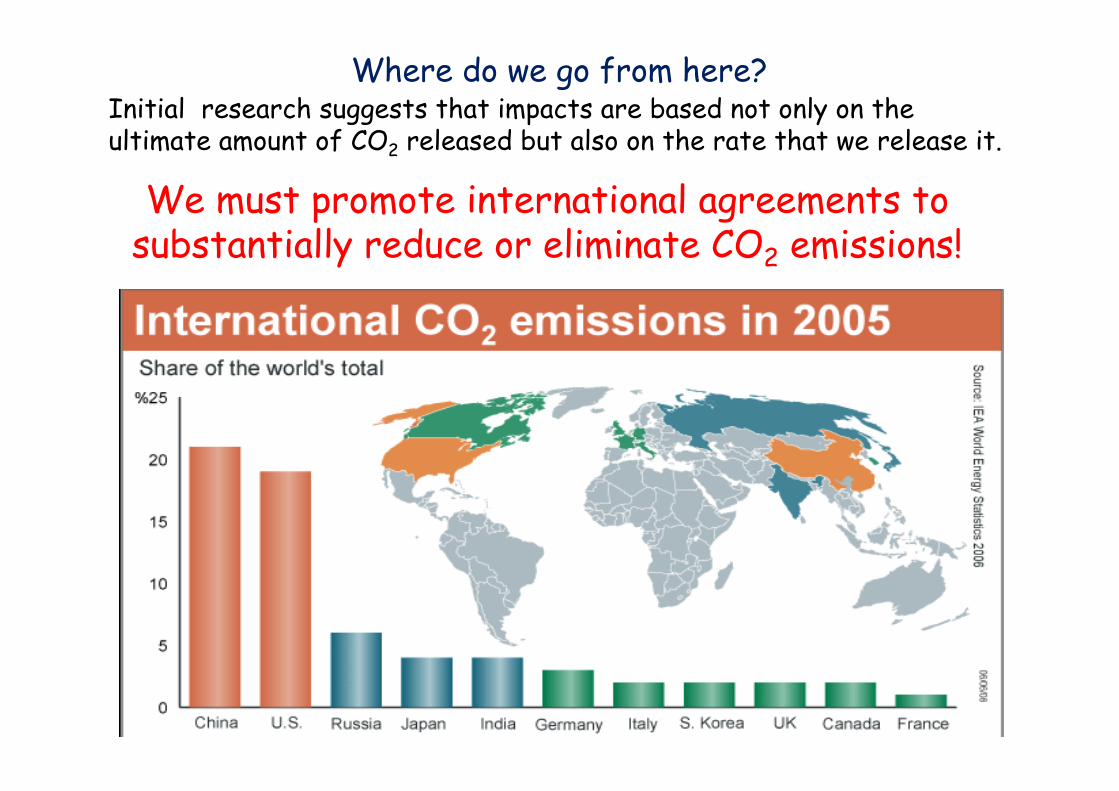
Where do we go from here?Initial research suggests that impacts are based not only on the ultimate amount of CO2 released but also on the rate that we release it.
We must promote international agreements to substantially reduce or eliminate CO2 emissions!
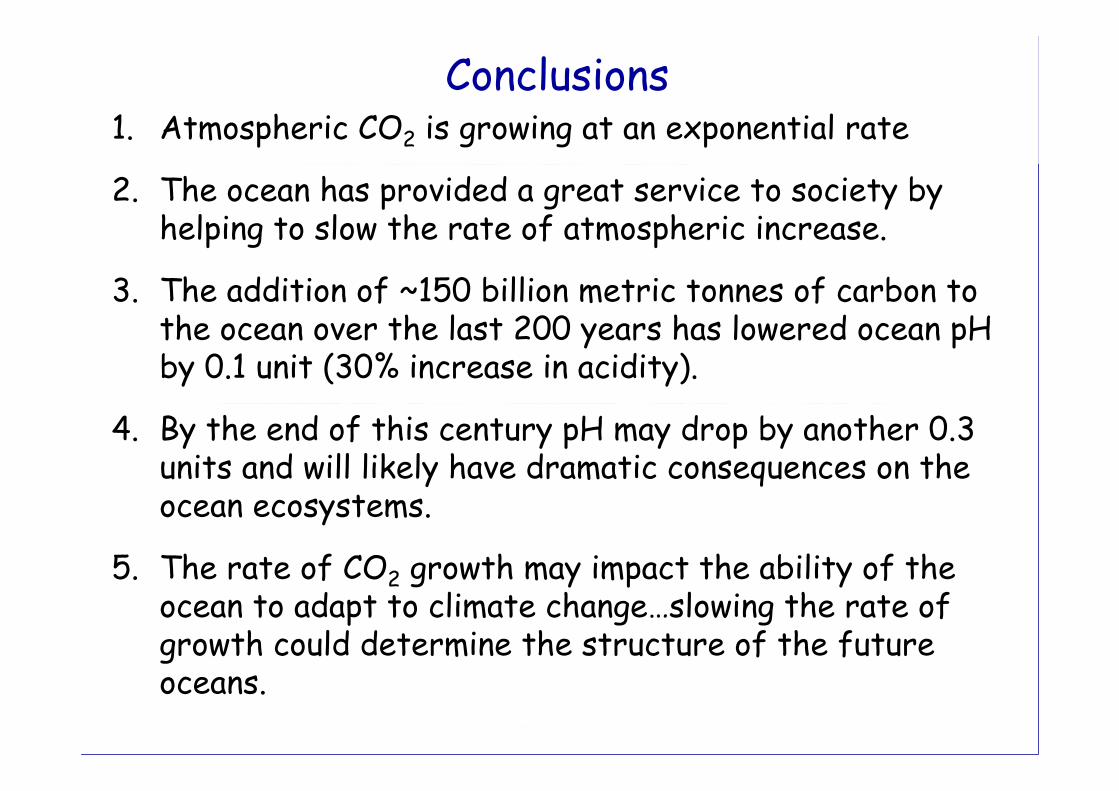
Conclusions1. Atmospheric CO2 is growing at an exponential rate
2. The ocean has provided a great service to society by helping to slow the rate of atmospheric increase.
3. The addition of ~150 billion metric tonnes of carbon to the ocean over the last 200 years has lowered ocean pH by 0.1 unit (30% increase in acidity).
4. By the end of this century pH may drop by another 0.3 units and will likely have dramatic consequences on the ocean ecosystems.
5. The rate of CO2 growth may impact the ability of the ocean to adapt to climate change…slowing the rate of growth could determine the structure of the future oceans.
結論 結 論
1.大気の二酸化炭素濃度は、指数関数的に増加している
2.海洋は、大気の二酸化炭素濃度の上昇を抑えることにより社会に大きく貢献している。
3.過去200年で、海洋に炭素量にして1500億トンぶんの二酸化炭素が吸収され、海洋のpHが約0.1低くなった(30%酸性化した)
4.今世紀末までに、pHはさらに0.3低くなり、海洋生態系に多大な影響を与える可能性がある。
5.二酸化炭素の増加率が、海洋の気候変化に対する適応能力に影響を与えるかもしれない・・・つまり二酸化炭素の増加率を抑えることで、将来の海洋構
造を決めることが出来るかもしれない。