
Observation of Iron Ore Beneficiation within a Spiral...
34
Observation of iron ore beneficiation within a spiral concentrator by positron emission particle tracking of large (Ø=1440m) and small (Ø=58m) hematite and quartz tracers Boucher, Darryel; Deng, Zhoutong; Leadbeater, Thomas; Langlois, Raymond; Waters, Kristian E. DOI: 10.1016/j.ces.2015.10.018 License: Creative Commons: Attribution-NonCommercial-NoDerivs (CC BY-NC-ND) Document Version Peer reviewed version Citation for published version (Harvard): Boucher, D, Deng, Z, Leadbeater, T, Langlois, R & Waters, KE 2016, 'Observation of iron ore beneficiation within a spiral concentrator by positron emission particle tracking of large (Ø=1440m) and small (Ø=58m) hematite and quartz tracers' Chemical Engineering Science, vol 140, pp. 217-232. DOI: 10.1016/j.ces.2015.10.018 Link to publication on Research at Birmingham portal Publisher Rights Statement: After an embargo period this document is subject to a Creative Commons Non-Commercial No Derivatives license Checked Feb 2016 General rights Unless a licence is specified above, all rights (including copyright and moral rights) in this document are retained by the authors and/or the copyright holders. The express permission of the copyright holder must be obtained for any use of this material other than for purposes permitted by law. • Users may freely distribute the URL that is used to identify this publication. • Users may download and/or print one copy of the publication from the University of Birmingham research portal for the purpose of private study or non-commercial research. • User may use extracts from the document in line with the concept of ‘fair dealing’ under the Copyright, Designs and Patents Act 1988 (?) • Users may not further distribute the material nor use it for the purposes of commercial gain. Where a licence is displayed above, please note the terms and conditions of the licence govern your use of this document. When citing, please reference the published version. Take down policy While the University of Birmingham exercises care and attention in making items available there are rare occasions when an item has been uploaded in error or has been deemed to be commercially or otherwise sensitive. If you believe that this is the case for this document, please contact [email protected] providing details and we will remove access to the work immediately and investigate. Download date: 18. May. 2018
Transcript of Observation of Iron Ore Beneficiation within a Spiral...
Observation of iron ore beneficiation within a spiralconcentrator by positron emission particle trackingof large (Ø=1440m) and small (Ø=58m) hematite andquartz tracersBoucher, Darryel; Deng, Zhoutong; Leadbeater, Thomas; Langlois, Raymond; Waters,Kristian E.DOI:10.1016/j.ces.2015.10.018
License:Creative Commons: Attribution-NonCommercial-NoDerivs (CC BY-NC-ND)
Document VersionPeer reviewed version
Citation for published version (Harvard):Boucher, D, Deng, Z, Leadbeater, T, Langlois, R & Waters, KE 2016, 'Observation of iron ore beneficiationwithin a spiral concentrator by positron emission particle tracking of large (Ø=1440m) and small (Ø=58m)hematite and quartz tracers' Chemical Engineering Science, vol 140, pp. 217-232. DOI:10.1016/j.ces.2015.10.018
Link to publication on Research at Birmingham portal
Publisher Rights Statement:After an embargo period this document is subject to a Creative Commons Non-Commercial No Derivatives license
Checked Feb 2016
General rightsUnless a licence is specified above, all rights (including copyright and moral rights) in this document are retained by the authors and/or thecopyright holders. The express permission of the copyright holder must be obtained for any use of this material other than for purposespermitted by law.
•Users may freely distribute the URL that is used to identify this publication.•Users may download and/or print one copy of the publication from the University of Birmingham research portal for the purpose of privatestudy or non-commercial research.•User may use extracts from the document in line with the concept of ‘fair dealing’ under the Copyright, Designs and Patents Act 1988 (?)•Users may not further distribute the material nor use it for the purposes of commercial gain.
Where a licence is displayed above, please note the terms and conditions of the licence govern your use of this document.
When citing, please reference the published version.
Take down policyWhile the University of Birmingham exercises care and attention in making items available there are rare occasions when an item has beenuploaded in error or has been deemed to be commercially or otherwise sensitive.
If you believe that this is the case for this document, please contact [email protected] providing details and we will remove access tothe work immediately and investigate.
Download date: 18. May. 2018
Author’s Accepted Manuscript
Observation of Iron Ore Beneficiation within aSpiral Concentrator by Positron Emission ParticleTracking of Large (Ø≈1440μm) and Small(Ø≈58μm) Hematite and Quartz Tracers
D. Boucher, Z. Deng, T. Leadbeater, R. Langlois,K. Waters
PII: S0009-2509(15)00684-3DOI: http://dx.doi.org/10.1016/j.ces.2015.10.018Reference: CES12639
To appear in: Chemical Engineering Science
Received date: 20 May 2015Revised date: 24 July 2015Accepted date: 6 October 2015
Cite this article as: D. Boucher, Z. Deng, T. Leadbeater, R. Langlois and K.Waters, Observation of Iron Ore Beneficiation within a Spiral Concentrator byPositron Emission Particle Tracking of Large (Ø≈1440μm) and Small (Ø≈58μm)Hematite and Quartz Tracers, Chemical Engineering Science,http://dx.doi.org/10.1016/j.ces.2015.10.018
This is a PDF file of an unedited manuscript that has been accepted forpublication. As a service to our customers we are providing this early version ofthe manuscript. The manuscript will undergo copyediting, typesetting, andreview of the resulting galley proof before it is published in its final citable form.Please note that during the production process errors may be discovered whichcould affect the content, and all legal disclaimers that apply to the journal pertain.
www.elsevier.com/locate/ces
1
Observation of Iron Ore Beneficiation within a Spiral Concentrator by
Positron Emission Particle Tracking of Large (Ø≈1440 μm) and Small
(Ø≈58 μm) Hematite and Quartz Tracers
D. Bouchera*, Z. Denga, T. Leadbeaterb, R. Langloisa, K.Watersa aDepartment of Mining and Materials Engineering, McGill University, 3610 University Street, Montreal, Quebec, H3A 0C5, Canada bSchool of Physics and Astronomy, University of Birmingham, Edgbaston, Birmingham, B15 2TT, United Kingdom
*Author for Correspondence:
Email: [email protected]
Tel: +1 514 398 4755 x09503
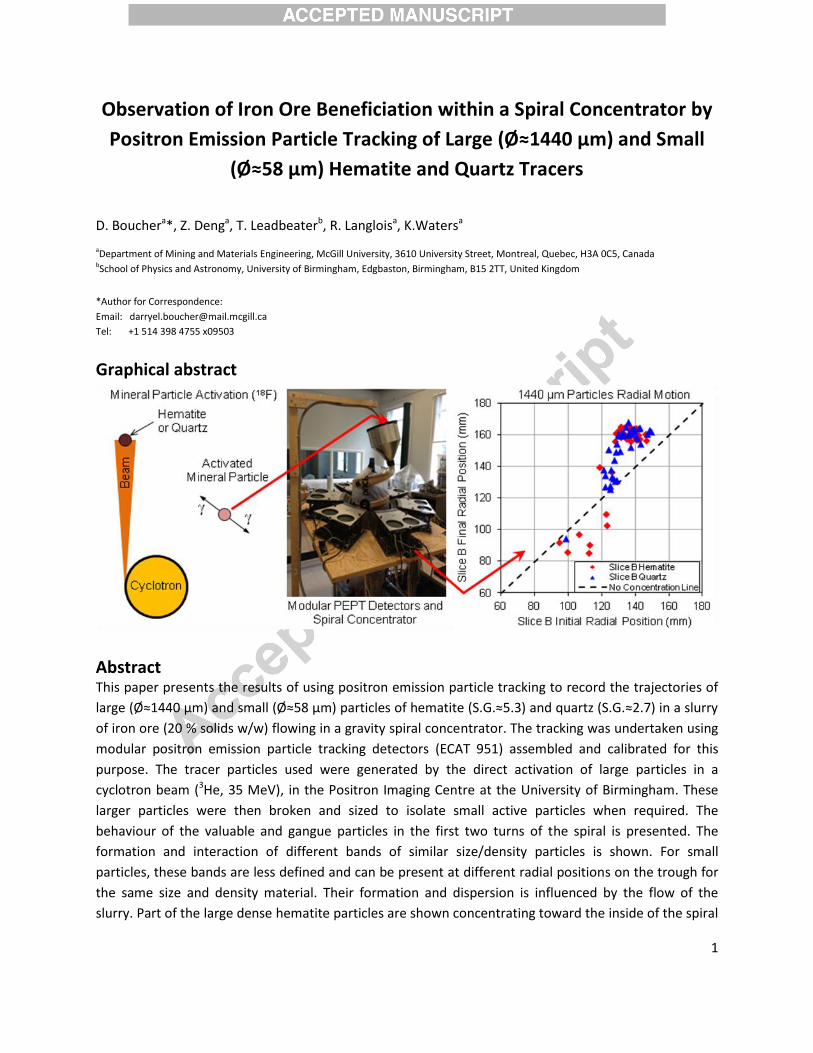
Graphical abstract
Abstract This paper presents the results of using positron emission particle tracking to record the trajectories of
large (Ø≈1440 μm) and small (Ø≈58 μm) particles of hematite (S.G.≈5.3) and quartz (S.G.≈2.7) in a slurry
of iron ore (20 % solids w/w) flowing in a gravity spiral concentrator. The tracking was undertaken using
modular positron emission particle tracking detectors (ECAT 951) assembled and calibrated for this
purpose. The tracer particles used were generated by the direct activation of large particles in a
cyclotron beam (3He, 35 MeV), in the Positron Imaging Centre at the University of Birmingham. These
larger particles were then broken and sized to isolate small active particles when required. The
behaviour of the valuable and gangue particles in the first two turns of the spiral is presented. The
formation and interaction of different bands of similar size/density particles is shown. For small
particles, these bands are less defined and can be present at different radial positions on the trough for
the same size and density material. Their formation and dispersion is influenced by the flow of the
slurry. Part of the large dense hematite particles are shown concentrating toward the inside of the spiral
2
trough while some others are shown remaining in the high flow-speed outer zone outside of a band of
large quartz particles. The behaviour in the feed device and first 0.3 turn of the spiral is related to the
later separation of some of the large particles and this highlights the effect of the feed radial distribution
of the particles on the trough.
Keywords
Gravity separation; spiral concentrator; iron ore; positron emission particle tracking; modular positron
detector; direct activation;
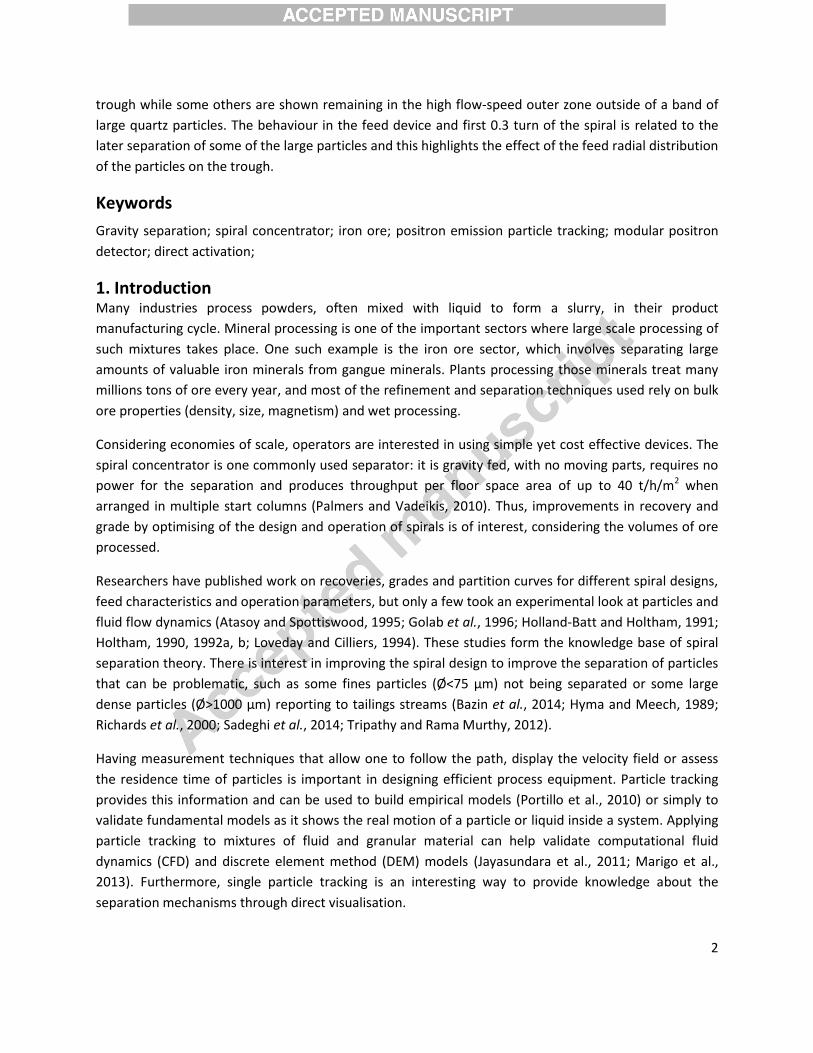
1. Introduction Many industries process powders, often mixed with liquid to form a slurry, in their product
manufacturing cycle. Mineral processing is one of the important sectors where large scale processing of
such mixtures takes place. One such example is the iron ore sector, which involves separating large
amounts of valuable iron minerals from gangue minerals. Plants processing those minerals treat many
millions tons of ore every year, and most of the refinement and separation techniques used rely on bulk
ore properties (density, size, magnetism) and wet processing.
Considering economies of scale, operators are interested in using simple yet cost effective devices. The
spiral concentrator is one commonly used separator: it is gravity fed, with no moving parts, requires no
power for the separation and produces throughput per floor space area of up to 40 t/h/m2 when
arranged in multiple start columns (Palmers and Vadeikis, 2010). Thus, improvements in recovery and
grade by optimising of the design and operation of spirals is of interest, considering the volumes of ore
processed.
Researchers have published work on recoveries, grades and partition curves for different spiral designs,
feed characteristics and operation parameters, but only a few took an experimental look at particles and
fluid flow dynamics (Atasoy and Spottiswood, 1995; Golab et al., 1996; Holland-Batt and Holtham, 1991;
Holtham, 1990, 1992a, b; Loveday and Cilliers, 1994). These studies form the knowledge base of spiral
separation theory. There is interest in improving the spiral design to improve the separation of particles
that can be problematic, such as some fines particles (Ø<75 μm) not being separated or some large
dense particles (Ø>1000 μm) reporting to tailings streams (Bazin et al., 2014; Hyma and Meech, 1989;
Richards et al., 2000; Sadeghi et al., 2014; Tripathy and Rama Murthy, 2012).
Having measurement techniques that allow one to follow the path, display the velocity field or assess
the residence time of particles is important in designing efficient process equipment. Particle tracking
provides this information and can be used to build empirical models (Portillo et al., 2010) or simply to
validate fundamental models as it shows the real motion of a particle or liquid inside a system. Applying
particle tracking to mixtures of fluid and granular material can help validate computational fluid
dynamics (CFD) and discrete element method (DEM) models (Jayasundara et al., 2011; Marigo et al.,
2013). Furthermore, single particle tracking is an interesting way to provide knowledge about the
separation mechanisms through direct visualisation.
3
Widely used particle tracking techniques include Laser Doppler Anemometry (LDA) (Darelius et al., 2007)
and Particle Image Velocimetry (PIV) (Li and Hishida, 2009). These are optical techniques which rely on
low particle concentrations and on transparent media and equipment. This is a limitation for
investigating opaque media, mixtures with high particle concentrations or non-transparent systems.
Computer-Automated Radioactive Particle Tracking (CARPT) (Rammohan et al., 2001), Magnetic
Resonance Imaging (MRI) (Kawaguchi, 2010) and Positron Emission Particle Tracking (PEPT) (Parker et
al., 1993) have made investigation of such systems possible.
Recent work (Boucher et al., 2014; Waters et al., 2012) has shown the potential of using PEPT to
investigate spiral concentrators. These studies were limited by the configuration and location rate of the
PEPT detector used (the University of Birmingham ADAC Forte Camera). This paper first aims to
characterize the limits of the PEPT technique with the use of small, directly activated, tracers. Then, the
paper presents the results obtained from tracking the motion of hematite and quartz particle over the
first two turn of a spiral with a new modular PEPT detector configuration. The two particles size
investigated were Ø≈1440 μm and Ø≈58 μm.
2. Theory This section describes the basics of the spiral concentrator as well as the PEPT technique, which has
been used to record the trajectories of tracer particles along the spiral trough.
2.1 Spiral concentrator
Spiral concentrators are used in the processing of ores composed of minerals with different densities. A
unit is composed of a profiled channel swept helically around a central post creating a spiralling trough.
Commonly used spirals have between three and seven turns, with a diameter between 0.4 and 1 m
(Palmers and Vadeikis, 2010). The feed mixture is composed of ground ore mixed with water, forming a
slurry that is gravity feed at the top of the trough. On its way to the bottom of the spiral, the denser
particles will generally report inward while the less dense ones normally flow towards the outer part of
the trough.
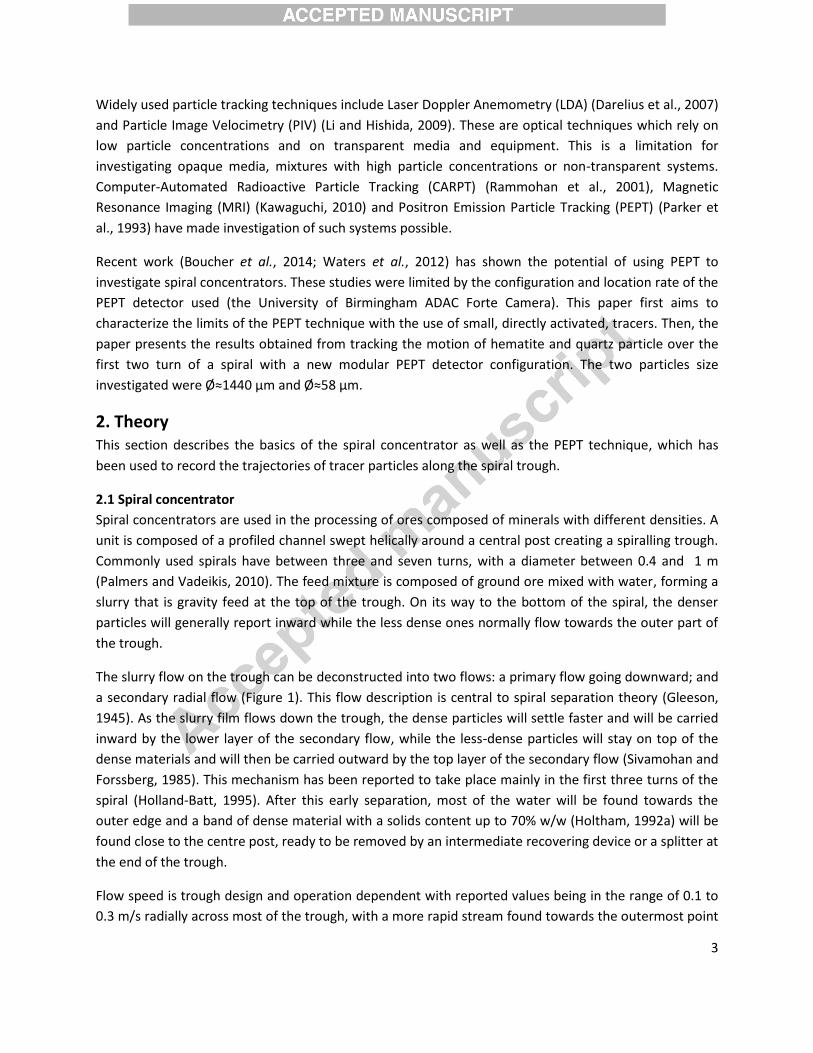
The slurry flow on the trough can be deconstructed into two flows: a primary flow going downward; and
a secondary radial flow (Figure 1). This flow description is central to spiral separation theory (Gleeson,
1945). As the slurry film flows down the trough, the dense particles will settle faster and will be carried
inward by the lower layer of the secondary flow, while the less-dense particles will stay on top of the
dense materials and will then be carried outward by the top layer of the secondary flow (Sivamohan and
Forssberg, 1985). This mechanism has been reported to take place mainly in the first three turns of the
spiral (Holland-Batt, 1995). After this early separation, most of the water will be found towards the
outer edge and a band of dense material with a solids content up to 70% w/w (Holtham, 1992a) will be
found close to the centre post, ready to be removed by an intermediate recovering device or a splitter at
the end of the trough.
Flow speed is trough design and operation dependent with reported values being in the range of 0.1 to
0.3 m/s radially across most of the trough, with a more rapid stream found towards the outermost point
4
of the trough. Here, speeds can reach up to 2.0 m/s with little variation in these values from turn to turn
for the same trough design (Holtham, 1990, 1992b). Speed values are based on slurry stream flowrate
sampling and slurry film thickness measurements.
Figure 1 - Cut view of a spiral trough showing the primary (downward) and secondary (radial) flow.
2.2 Positron emission particle tracking
Positron emission particle tracking (PEPT) is a technique based on the localisation of a single particle
labelled with a positron emitting radionuclide. The technique was developed at the University of
Birmingham, UK (Hawkesworth et al., 1986; Parker et al., 1993) and has been described in detail by
Leadbeater et al. (Leadbeater, 2009; Leadbeater et al., 2012). The advantage of PEPT, over other
techniques, is that it enables one to record the position of a tracer inside an opaque and dense system
as a function of time, therefore the trajectory in a slurry with high solids content can be determined.
Tracking a tracer over a long period of time or over many recirculations enables one to average the
behaviour of particles similar to the tracer, and show their typical motion.
Tracers can be produced via different methods: ion exchange; direct activation (as used in this study); or
surface modification (Fan et al., 2006a, b). During the direct activation process, the particle is placed in a
cyclotron beam, and some oxygen atoms from the surface layer are converted to 18F (Fan et al., 2006b)
via the competing capture reactions (Buffler et al., 2010). Further decay of these radioisotopes (half-life
of 110 min) occurs mostly by positron emission (β+ decay). Each positron will annihilate upon contact
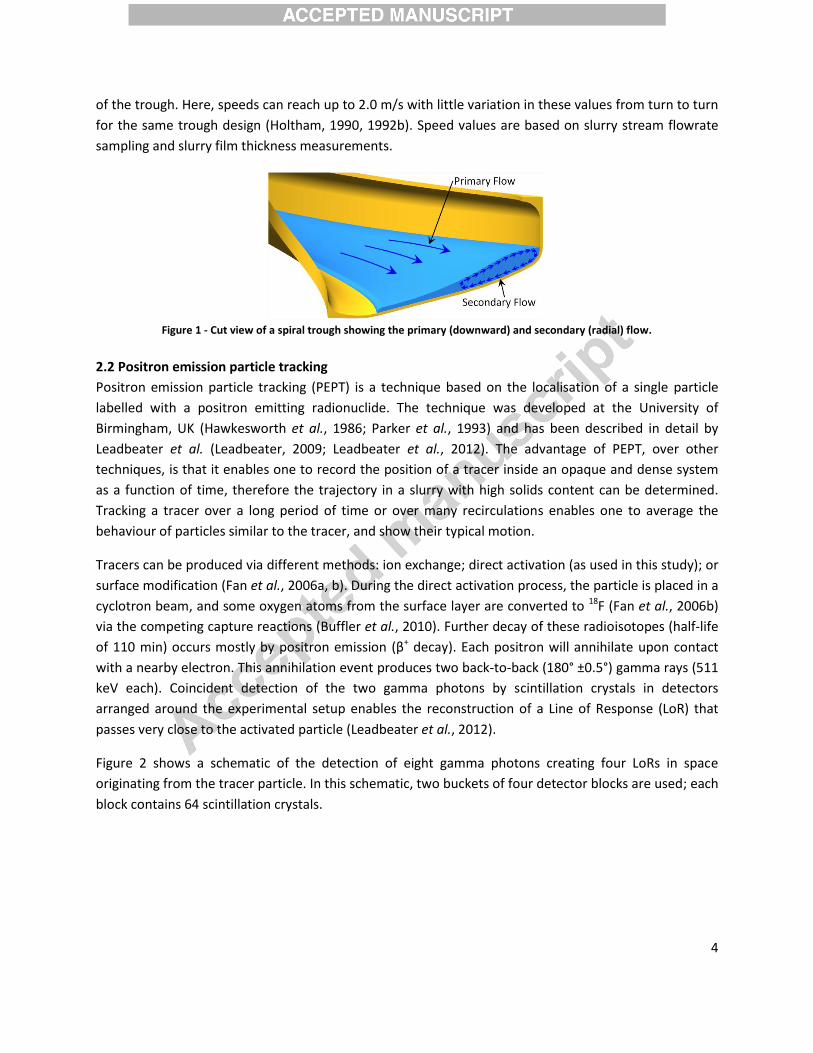
with a nearby electron. This annihilation event produces two back-to-back (180° ±0.5°) gamma rays (511
keV each). Coincident detection of the two gamma photons by scintillation crystals in detectors
arranged around the experimental setup enables the reconstruction of a Line of Response (LoR) that
passes very close to the activated particle (Leadbeater et al., 2012).
Figure 2 shows a schematic of the detection of eight gamma photons creating four LoRs in space
originating from the tracer particle. In this schematic, two buckets of four detector blocks are used; each
block contains 64 scintillation crystals.
5
Figure 2 - Schematic of two modular detector buckets with a tracer being located by a set of four LoRs.
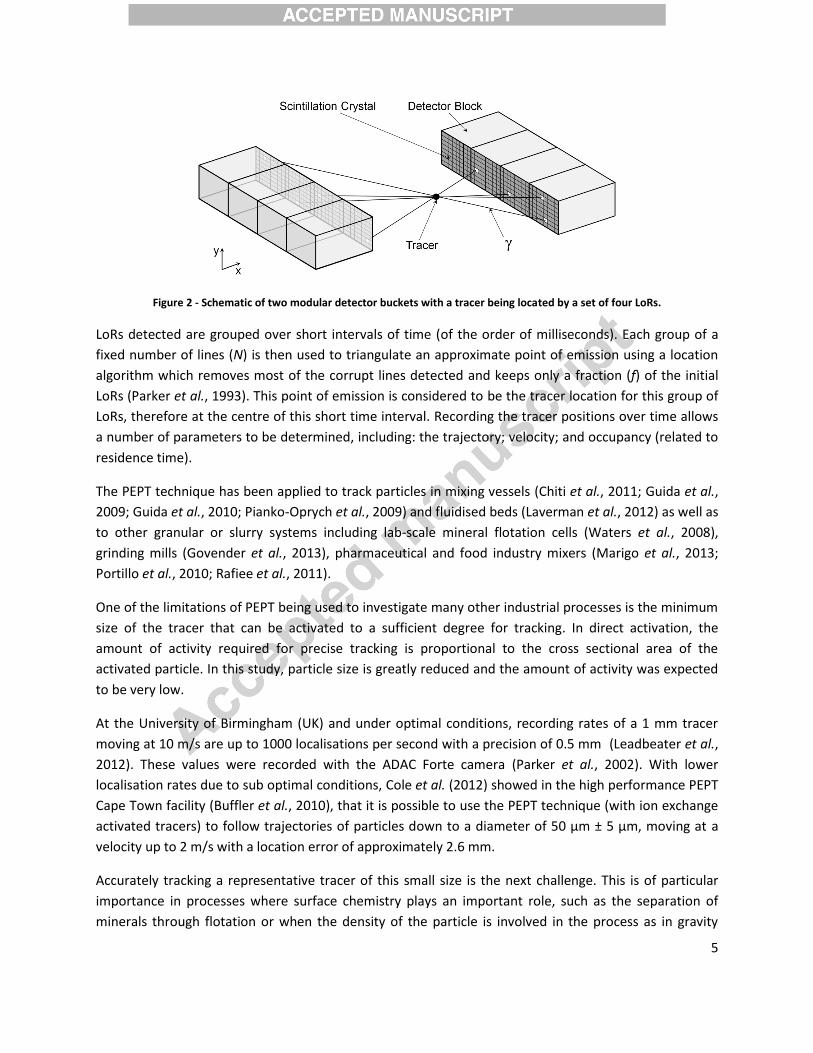
LoRs detected are grouped over short intervals of time (of the order of milliseconds). Each group of a
fixed number of lines (N) is then used to triangulate an approximate point of emission using a location
algorithm which removes most of the corrupt lines detected and keeps only a fraction (f) of the initial
LoRs (Parker et al., 1993). This point of emission is considered to be the tracer location for this group of
LoRs, therefore at the centre of this short time interval. Recording the tracer positions over time allows
a number of parameters to be determined, including: the trajectory; velocity; and occupancy (related to
residence time).
The PEPT technique has been applied to track particles in mixing vessels (Chiti et al., 2011; Guida et al.,
2009; Guida et al., 2010; Pianko-Oprych et al., 2009) and fluidised beds (Laverman et al., 2012) as well as
to other granular or slurry systems including lab-scale mineral flotation cells (Waters et al., 2008),
grinding mills (Govender et al., 2013), pharmaceutical and food industry mixers (Marigo et al., 2013;
Portillo et al., 2010; Rafiee et al., 2011).
One of the limitations of PEPT being used to investigate many other industrial processes is the minimum
size of the tracer that can be activated to a sufficient degree for tracking. In direct activation, the
amount of activity required for precise tracking is proportional to the cross sectional area of the
activated particle. In this study, particle size is greatly reduced and the amount of activity was expected
to be very low.
At the University of Birmingham (UK) and under optimal conditions, recording rates of a 1 mm tracer
moving at 10 m/s are up to 1000 localisations per second with a precision of 0.5 mm (Leadbeater et al.,
2012). These values were recorded with the ADAC Forte camera (Parker et al., 2002). With lower
localisation rates due to sub optimal conditions, Cole et al. (2012) showed in the high performance PEPT
Cape Town facility (Buffler et al., 2010), that it is possible to use the PEPT technique (with ion exchange
activated tracers) to follow trajectories of particles down to a diameter of 50 μm ± 5 µm, moving at a
velocity up to 2 m/s with a location error of approximately 2.6 mm.
Accurately tracking a representative tracer of this small size is the next challenge. This is of particular
importance in processes where surface chemistry plays an important role, such as the separation of
minerals through flotation or when the density of the particle is involved in the process as in gravity
6
separation of fine ores. A technique for coating the small tracer with bulk representative material is
under development (Cole et al., 2014). The direct activation technique is, however, interesting for this
small size as it allows a particle of the same composition as the bulk to be used as tracer.
On the detection system side, PEPT has developed to the point where modular detectors blocks can be
used in different configurations (Leadbeater and Parker, 2011; Parker et al., 2009). This enables the
study of systems of different shapes and size operated in a specific environment. These specifically
designed modular assemblies give more flexibility in the tracking, but the characterisation of such setup
is of great importance. One of the objectives of this work is to assess the performance of a specific
modular detector assembly made of ECAT 951 detectors for tracking tracers between 53 and 63 μm in
diameter.
3. Experimental The modular tracking system was used to investigate the path of large (≈1440 μm) and small (≈58 μm)
tracer particles inside an iron ore slurry processed in a spiral concentrators. As part of this investigation
targeted very small particles, for which no assessment of the tracking system performance was
available, the system was initially tested by tracking the path of small tracers under different conditions:
- Moving at a known trajectory (circular) and velocity in air.
- At rest in water.
- Freely moving in a water-filled, baffled container, stirred by a Rushton turbine.
These conditions were intended to provide a comparison between expected and recorded trajectory as
well as the effect of tracer velocity and media attenuation (air or water) on the localisation rate and
precision. Comparisons were made with the ADAC Forte camera performance. This section describes the
detector setup, the experimental systems, the ore samples and tracers used.
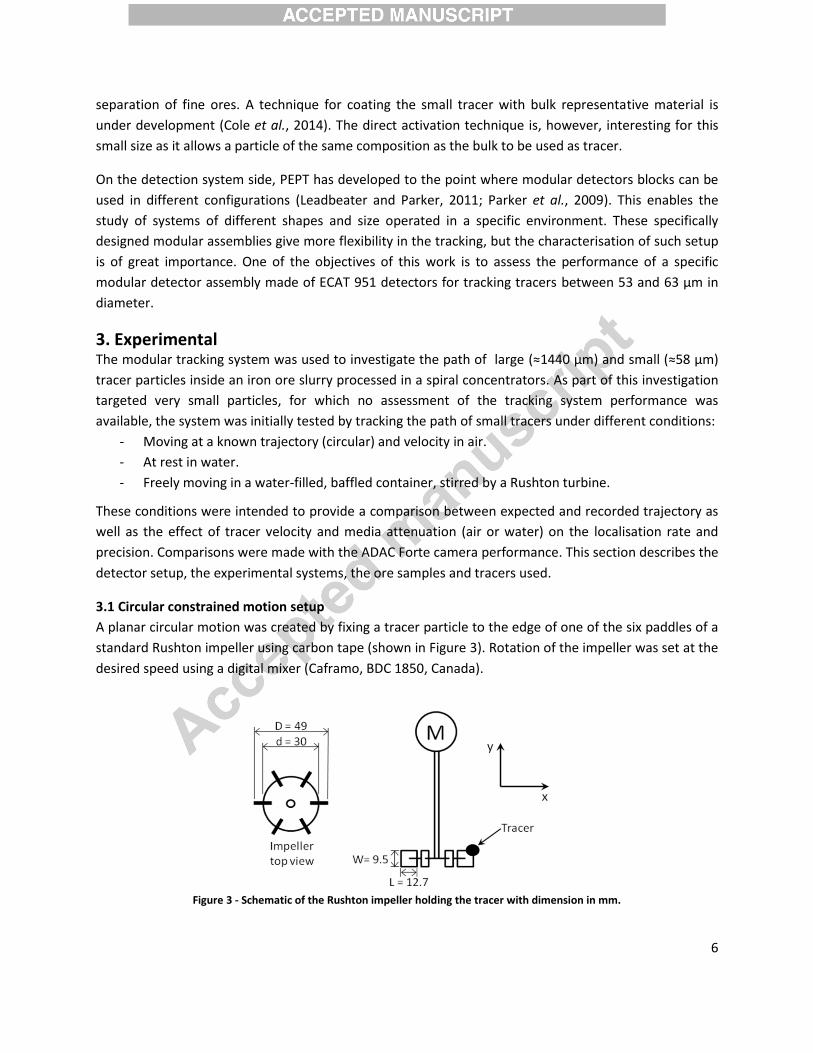
3.1 Circular constrained motion setup
A planar circular motion was created by fixing a tracer particle to the edge of one of the six paddles of a
standard Rushton impeller using carbon tape (shown in Figure 3). Rotation of the impeller was set at the
desired speed using a digital mixer (Caframo, BDC 1850, Canada).
Figure 3 - Schematic of the Rushton impeller holding the tracer with dimension in mm.
7
With this setup, the tracer follows a circular trajectory in the xz plane and the expected location over
time can be assumed to be a sinusoid in the x axis and another sinusoid in the z axis. In the y axis, the
expected location should be constant over time, provided that the plane of rotation is perpendicular to
the axis.
3.2 Determination of the location error
The different cases investigated can be characterised by a location error when the trajectory of the
tracer is constrained (Volkwyn et al., 2011). For a set of data, this error is calculated using the root mean
square error (RMSE) technique shown in Equation 1 for the x axis. The error (Δxi, Δyi, Δzi) on each
location is the difference between the PEPT located position and the expected position with n being the
number of locations used. The expected position is determined by fitting the best sinusoid to the
located position, starting with an approximate knowledge of the parameters based on rotational speed
and impeller dimensions. The RMSE was determined by using the MATLAB® Curve Fitting Toolbox™ (The
MathWorks Inc.).
(1)
3.3 Determination of tracer velocity
The velocity of the tracer at a location was calculated by using the five previous, the actual, and the five
next locations of the tracer with regards to the time for each of these locations and weighting factors
(Stewart et al., 2001). This method has the effect of smoothing the velocity and reducing the effect of
the tracer localisation error (Leadbeater et al., 2012). This method must be used carefully when tracking
a tracer moving in and out of the field of view of the camera, or at a very low location rates (low tracer
activity) as the previous and next locations can be non representative of the tracer motion over a short
timeframe.
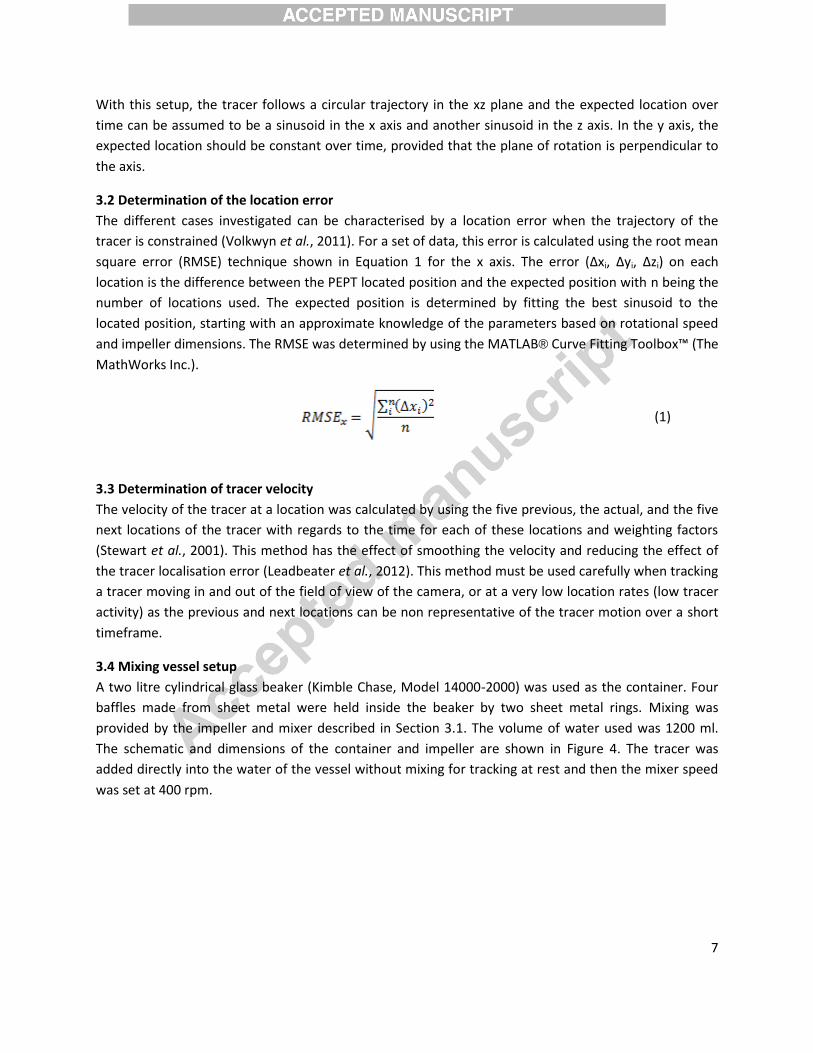
3.4 Mixing vessel setup
A two litre cylindrical glass beaker (Kimble Chase, Model 14000-2000) was used as the container. Four
baffles made from sheet metal were held inside the beaker by two sheet metal rings. Mixing was
provided by the impeller and mixer described in Section 3.1. The volume of water used was 1200 ml.
The schematic and dimensions of the container and impeller are shown in Figure 4. The tracer was
added directly into the water of the vessel without mixing for tracking at rest and then the mixer speed
was set at 400 rpm.
8
Figure 4 - Schematic of the baffled vessel and the Rushton turbine with dimensions in mm.
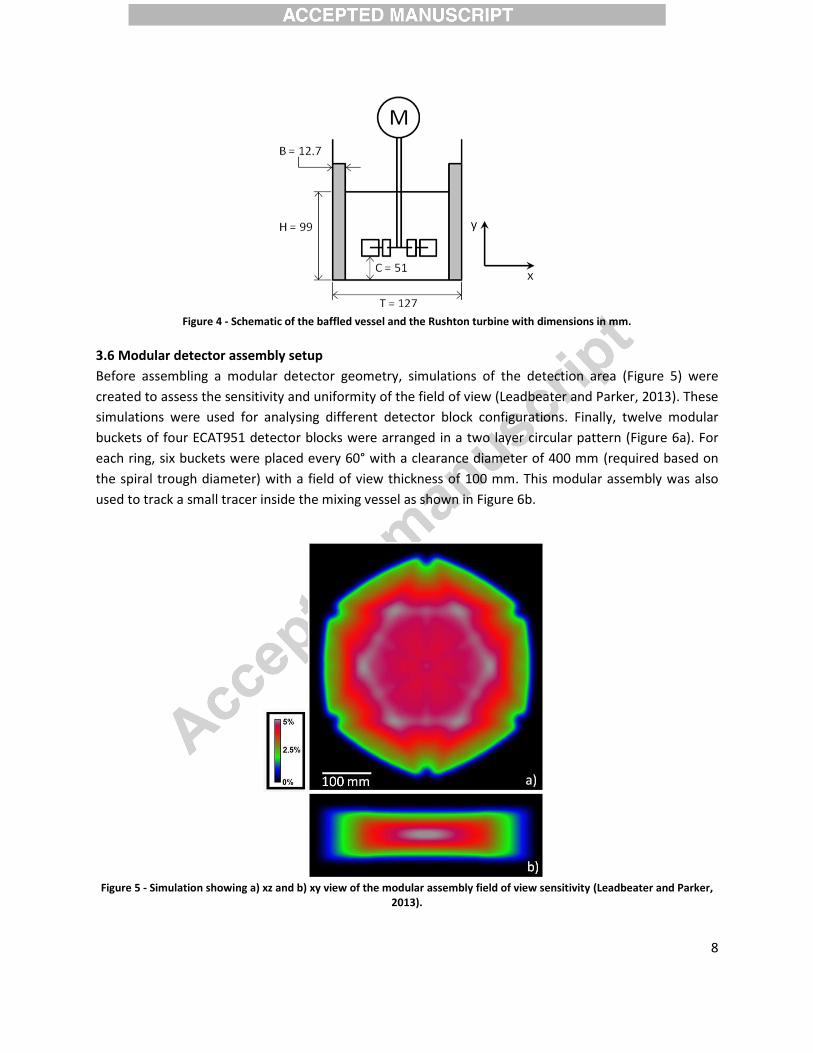
3.6 Modular detector assembly setup
Before assembling a modular detector geometry, simulations of the detection area (Figure 5) were
created to assess the sensitivity and uniformity of the field of view (Leadbeater and Parker, 2013). These
simulations were used for analysing different detector block configurations. Finally, twelve modular
buckets of four ECAT951 detector blocks were arranged in a two layer circular pattern (Figure 6a). For
each ring, six buckets were placed every 60° with a clearance diameter of 400 mm (required based on
the spiral trough diameter) with a field of view thickness of 100 mm. This modular assembly was also
used to track a small tracer inside the mixing vessel as shown in Figure 6b.
Figure 5 - Simulation showing a) xz and b) xy view of the modular assembly field of view sensitivity (Leadbeater and Parker,
2013).
9
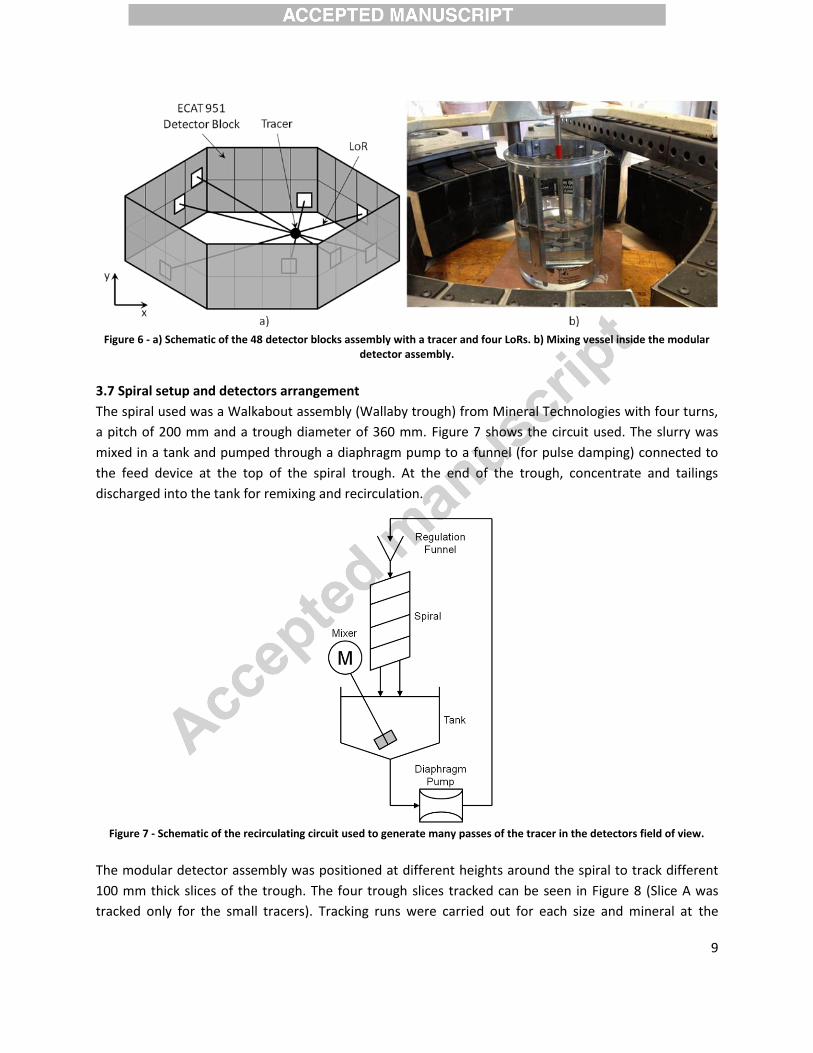
Figure 6 - a) Schematic of the 48 detector blocks assembly with a tracer and four LoRs. b) Mixing vessel inside the modular
detector assembly.
3.7 Spiral setup and detectors arrangement
The spiral used was a Walkabout assembly (Wallaby trough) from Mineral Technologies with four turns,
a pitch of 200 mm and a trough diameter of 360 mm. Figure 7 shows the circuit used. The slurry was
mixed in a tank and pumped through a diaphragm pump to a funnel (for pulse damping) connected to
the feed device at the top of the spiral trough. At the end of the trough, concentrate and tailings
discharged into the tank for remixing and recirculation.
Figure 7 - Schematic of the recirculating circuit used to generate many passes of the tracer in the detectors field of view.
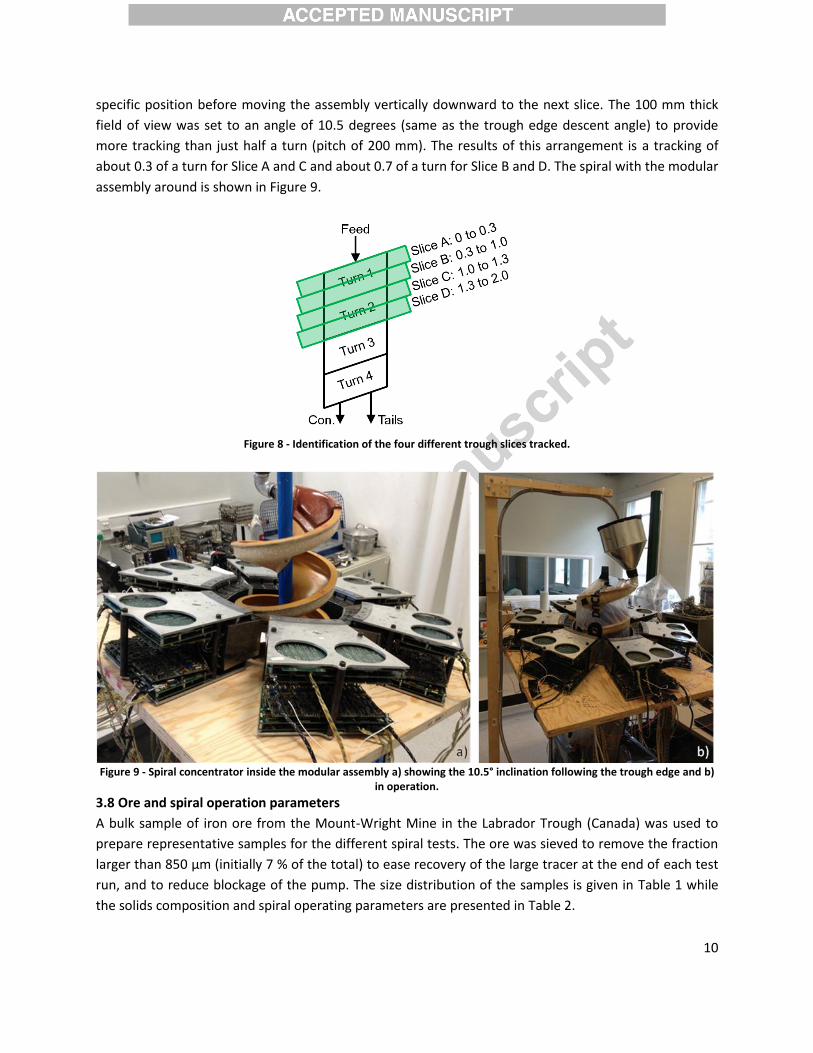
The modular detector assembly was positioned at different heights around the spiral to track different
100 mm thick slices of the trough. The four trough slices tracked can be seen in Figure 8 (Slice A was
tracked only for the small tracers). Tracking runs were carried out for each size and mineral at the
10
specific position before moving the assembly vertically downward to the next slice. The 100 mm thick
field of view was set to an angle of 10.5 degrees (same as the trough edge descent angle) to provide
more tracking than just half a turn (pitch of 200 mm). The results of this arrangement is a tracking of
about 0.3 of a turn for Slice A and C and about 0.7 of a turn for Slice B and D. The spiral with the modular
assembly around is shown in Figure 9.
Figure 8 - Identification of the four different trough slices tracked.
Figure 9 - Spiral concentrator inside the modular assembly a) showing the 10.5° inclination following the trough edge and b)
in operation.
3.8 Ore and spiral operation parameters
A bulk sample of iron ore from the Mount-Wright Mine in the Labrador Trough (Canada) was used to
prepare representative samples for the different spiral tests. The ore was sieved to remove the fraction
larger than 850 μm (initially 7 % of the total) to ease recovery of the large tracer at the end of each test
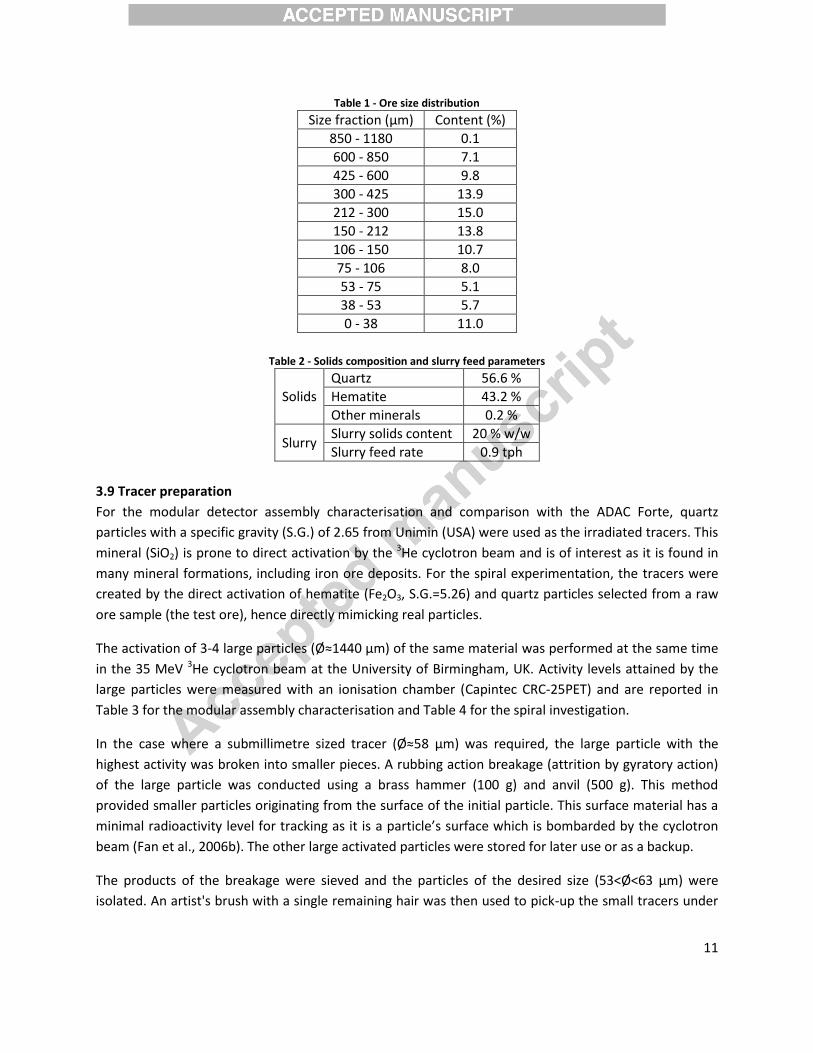
run, and to reduce blockage of the pump. The size distribution of the samples is given in Table 1 while
the solids composition and spiral operating parameters are presented in Table 2.
11
Table 1 - Ore size distribution
Size fraction (μm) Content (%)
850 - 1180 0.1
600 - 850 7.1
425 - 600 9.8
300 - 425 13.9
212 - 300 15.0
150 - 212 13.8
106 - 150 10.7
75 - 106 8.0
53 - 75 5.1
38 - 53 5.7
0 - 38 11.0
Table 2 - Solids composition and slurry feed parameters
Solids
Quartz 56.6 %
Hematite 43.2 %
Other minerals 0.2 %
Slurry Slurry solids content 20 % w/w
Slurry feed rate 0.9 tph
3.9 Tracer preparation
For the modular detector assembly characterisation and comparison with the ADAC Forte, quartz
particles with a specific gravity (S.G.) of 2.65 from Unimin (USA) were used as the irradiated tracers. This
mineral (SiO2) is prone to direct activation by the 3He cyclotron beam and is of interest as it is found in
many mineral formations, including iron ore deposits. For the spiral experimentation, the tracers were
created by the direct activation of hematite (Fe2O3, S.G.=5.26) and quartz particles selected from a raw
ore sample (the test ore), hence directly mimicking real particles.
The activation of 3-4 large particles (Ø≈1440 μm) of the same material was performed at the same time
in the 35 MeV 3He cyclotron beam at the University of Birmingham, UK. Activity levels attained by the
large particles were measured with an ionisation chamber (Capintec CRC-25PET) and are reported in
Table 3 for the modular assembly characterisation and Table 4 for the spiral investigation.
In the case where a submillimetre sized tracer (Ø≈58 μm) was required, the large particle with the
highest activity was broken into smaller pieces. A rubbing action breakage (attrition by gyratory action)
of the large particle was conducted using a brass hammer (100 g) and anvil (500 g). This method
provided smaller particles originating from the surface of the initial particle. This surface material has a
minimal radioactivity level for tracking as it is a particle’s surface which is bombarded by the cyclotron
beam (Fan et al., 2006b). The other large activated particles were stored for later use or as a backup.
The products of the breakage were sieved and the particles of the desired size (53<Ø<63 μm) were
isolated. An artist's brush with a single remaining hair was then used to pick-up the small tracers under

12
the field of view of an optical microscope. Measurement of the activity of the small particles was carried
out to select one with the larger activity for use in the small particle investigation.
For these smaller particles, the activation levels shown in Table 3 and Table 4 were very low and were
measured in counts per second (cps) using a contamination monitor (Tracerco T401). The probe of this
device is flat (pancake style), the value measured is thus only based on the gamma rays hitting the probe
and not on the whole particle activity and disintegration rate, hence providing a relative comparison of
the activity for the small particle selection. Activity values for the small particles shall then be taken
relatively as no efficient way of measuring it was available.
Once isolated, the tracers were either individually stuck to double sided carbon tape piece for the fixed
motion experiment; directly inserted into the water of the vessel; or added to the slurry in the spiral
setup.
The remaining particles which were too small, too large or with too low an activity were disposed of
accordingly.
This method of creating small tracers has some advantages as it provides a particle similar (surface
properties, density) to the particles forming the bulk material to be investigated. However, a large
number of small particles are created by the breakage, but only few of them are used, considering that
tracking is conducted on one tracer at the time and that the 18F short half-life limits the number of
consecutive experiments possible for each initial activation.
Table 3 - Initial activity of the quartz particles used as tracers for setup characterisation
Particles details Size (μm) Initial activity
ADAC Forte experiment
ECAT951 detectors experiment
Before breakage 1180 to 1700* 30 to 52 MBq 34 to 49 MBq
Tracer for constrained motion experiment in air 53 to 63** 2600 cps 1100 cps
Tracer for still and free motion experiment in water 53 to 63** 3700 cps 2400 cps
*Activity measured with a Capintec CRC-25PET **Activity measured with a Tracerco T401
Table 4 - Tracers material, size and initial activity for spiral investigation
Size (μm) Activity
Slice Quartz Hematite
1180 to 1700*
Not tracked Not tracked A
27.4 MBq 18.5 MBq B
16.1 MBq 18.3 MBq C
12.7 MBq 22.5 MBq D
53 to 63**
1500 cps 200 cps A
2000 cps 1000 cps B
1700 cps 1200 cps C
1800 cps 2500 cps D
*Activity measured with a Capintec CRC-25PET **Activity measured with a Tracerco T401

13
For the spiral setup, a data recording run starts with the tracking of the small tracer inside the slurry.
After approximately one hour of slurry recirculation on the trough, the decay of this small tracer
reduced the activity to the point where tracking was no longer possible. At this moment, one of the
remaining large activated particles was added to the slurry. This large tracer still had a high activity and
was thus able to be tracked. After about 30 min of data recording with this tracer, the pump was
stopped, the large tracer recovered for disposal and the system cleaned. A new slurry was prepared for
each tracer activation run to prevent contamination of the ore.
4. Results and discussion The expected and true position of the tracer were analysed for the tracer on the impeller and the tracer
at rest in water. Details about the mixing vessel free motion and the tracking inside the spiral
concentrator are then given.
4.1 Algorithm parameter optimisation and location precision with constrained trajectory The selection of the parameters (N and f, see Section 2.2) used in the tracking algorithm can be
optimised to reduce the root mean square error (RMSE). To do so, the RMSE values of 30 s samples of
recording the small tracer attached to the impeller rotating in air (constrained circular trajectory) were
calculated with different parameters. Different velocities were tracked for both setups. The rotational
speed of the impeller carrying a Ø≈58 µm tracer was initially set at 150 rpm then decreased to 75 rpm
and finally 15 rpm. Each speed was run for approximately 15 minutes.
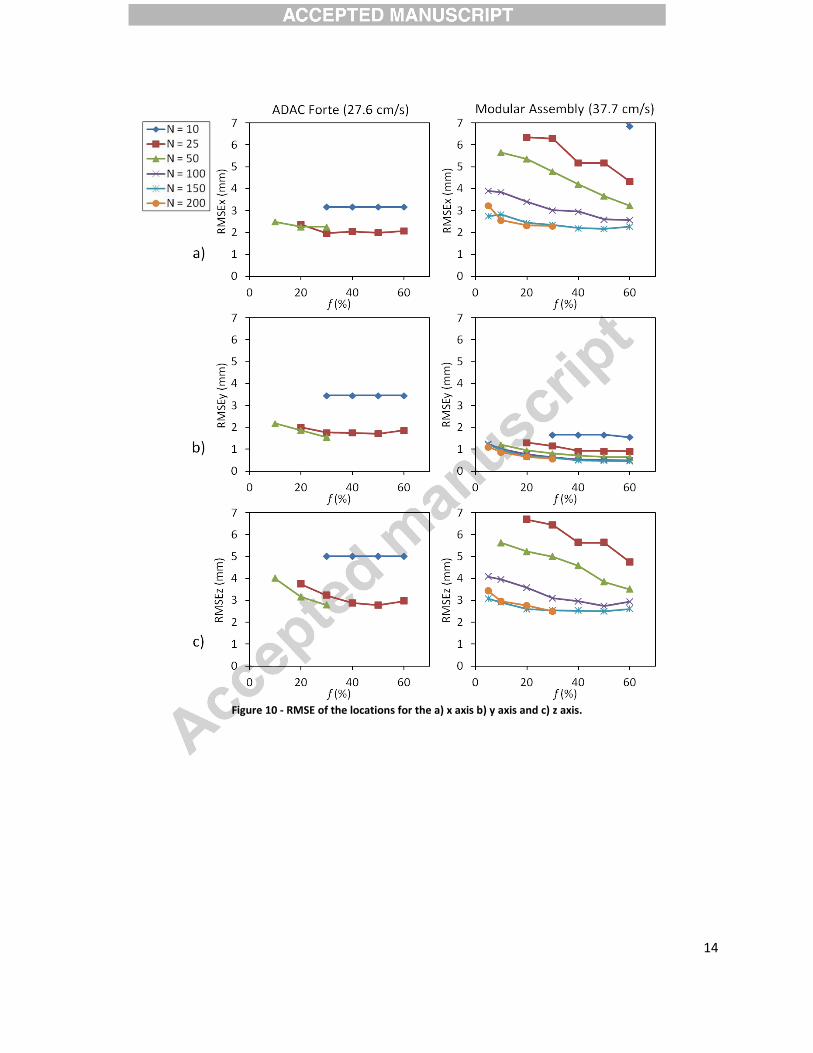
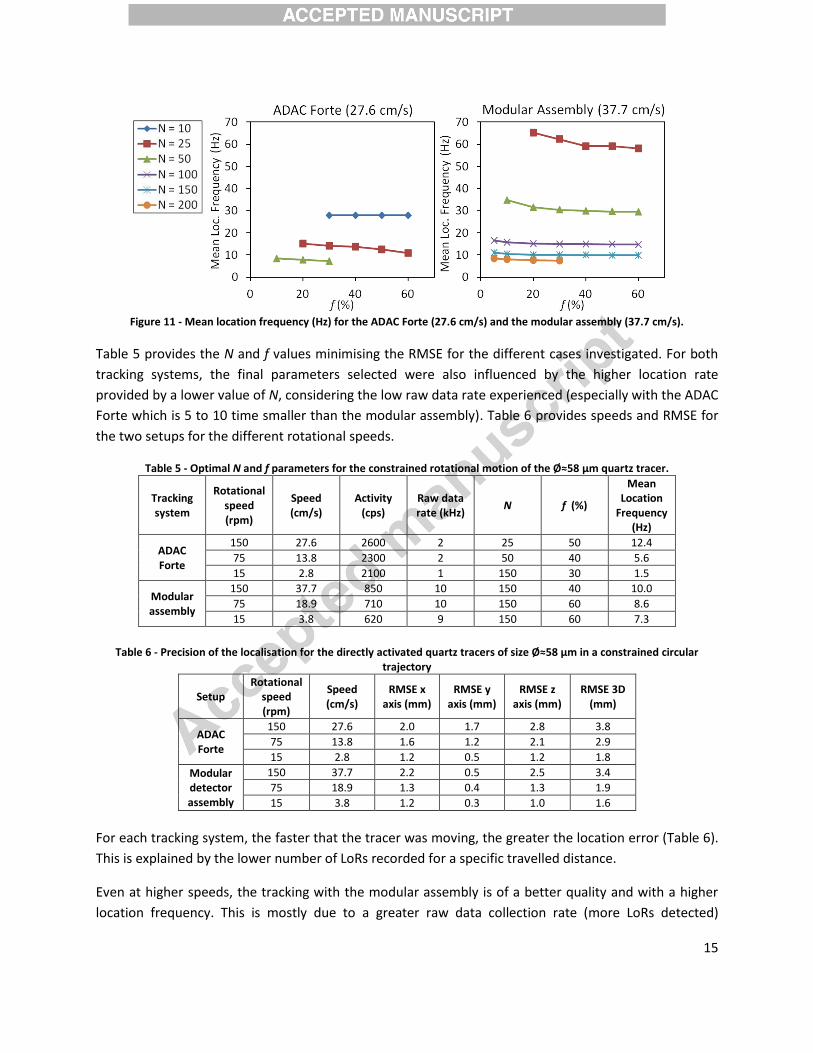
Figure 10 presents the different RMSE based on different N and f values for 150 rpm. Figure 11 shows
the mean location frequency associated with Figure 10. This type of graph was used to determine the
best parameters. In this case (150 rpm), the tracer velocity was 27.6 cm/s for the ADAC setup and 37.7
cm/s for the modular assembly. This difference is caused by the tracer being further out on the impeller
in the case of the modular setup. For any case when the location frequency was below three points per
rotation (e.g. below 7.5 Hz for 150 rpm), the RMSE was not further analysed. Therefore the errors
obtained are of interest for trajectories of a radius of curvature equal to or larger than that of the
impeller (≥25 mm). Smaller curvatures will be missed by the low location frequency.
14
Figure 10 - RMSE of the locations for the a) x axis b) y axis and c) z axis.
15
Figure 11 - Mean location frequency (Hz) for the ADAC Forte (27.6 cm/s) and the modular assembly (37.7 cm/s).
Table 5 provides the N and f values minimising the RMSE for the different cases investigated. For both
tracking systems, the final parameters selected were also influenced by the higher location rate
provided by a lower value of N, considering the low raw data rate experienced (especially with the ADAC
Forte which is 5 to 10 time smaller than the modular assembly). Table 6 provides speeds and RMSE for
the two setups for the different rotational speeds.
Table 5 - Optimal N and f parameters for the constrained rotational motion of the Ø≈58 µm quartz tracer.
Tracking system
Rotational speed (rpm)
Speed (cm/s)
Activity (cps)
Raw data rate (kHz)
N f (%)
Mean Location
Frequency (Hz)
ADAC Forte
150 27.6 2600 2 25 50 12.4
75 13.8 2300 2 50 40 5.6
15 2.8 2100 1 150 30 1.5
Modular assembly
150 37.7 850 10 150 40 10.0
75 18.9 710 10 150 60 8.6
15 3.8 620 9 150 60 7.3
Table 6 - Precision of the localisation for the directly activated quartz tracers of size Ø≈58 µm in a constrained circular
trajectory
Setup Rotational
speed (rpm)
Speed (cm/s)
RMSE x axis (mm)
RMSE y axis (mm)
RMSE z axis (mm)
RMSE 3D (mm)
ADAC Forte
150 27.6 2.0 1.7 2.8 3.8
75 13.8 1.6 1.2 2.1 2.9
15 2.8 1.2 0.5 1.2 1.8
Modular detector assembly
150 37.7 2.2 0.5 2.5 3.4
75 18.9 1.3 0.4 1.3 1.9
15 3.8 1.2 0.3 1.0 1.6
For each tracking system, the faster that the tracer was moving, the greater the location error (Table 6).
This is explained by the lower number of LoRs recorded for a specific travelled distance.
Even at higher speeds, the tracking with the modular assembly is of a better quality and with a higher
location frequency. This is mostly due to a greater raw data collection rate (more LoRs detected)
16
achievable with the ECAT951 detector blocks, which have a higher intrinsic efficiency for detecting 511
keV gamma photons compared to the ADAC Forte detectors. Another point of interest shown in Figure
10, is that the RMSEz is always larger than RMSEx and RMSEy for the ADAC Forte. This is caused by the
lack of angular sampling in the z direction due to the detectors' configuration (parallel to the xy plane) in
the ADAC camera (Parker et al., 1993).
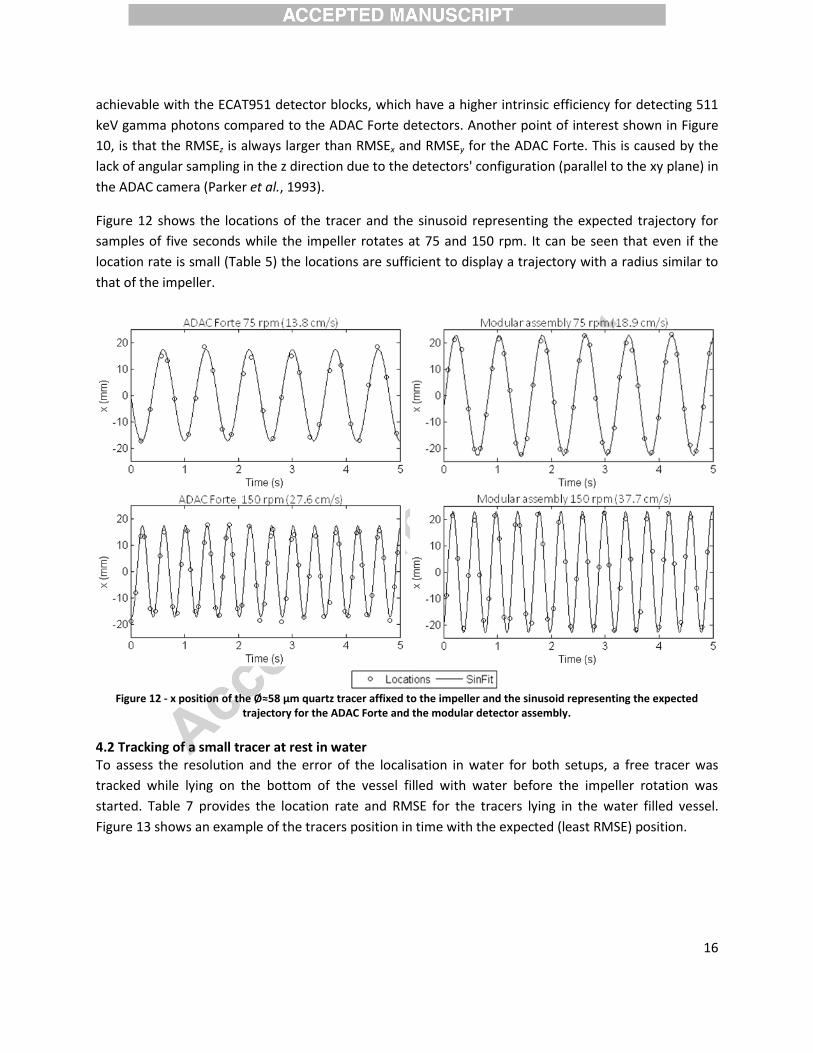
Figure 12 shows the locations of the tracer and the sinusoid representing the expected trajectory for
samples of five seconds while the impeller rotates at 75 and 150 rpm. It can be seen that even if the
location rate is small (Table 5) the locations are sufficient to display a trajectory with a radius similar to
that of the impeller.
Figure 12 - x position of the Ø≈58 µm quartz tracer affixed to the impeller and the sinusoid representing the expected
trajectory for the ADAC Forte and the modular detector assembly.
4.2 Tracking of a small tracer at rest in water To assess the resolution and the error of the localisation in water for both setups, a free tracer was
tracked while lying on the bottom of the vessel filled with water before the impeller rotation was
started. Table 7 provides the location rate and RMSE for the tracers lying in the water filled vessel.
Figure 13 shows an example of the tracers position in time with the expected (least RMSE) position.
17
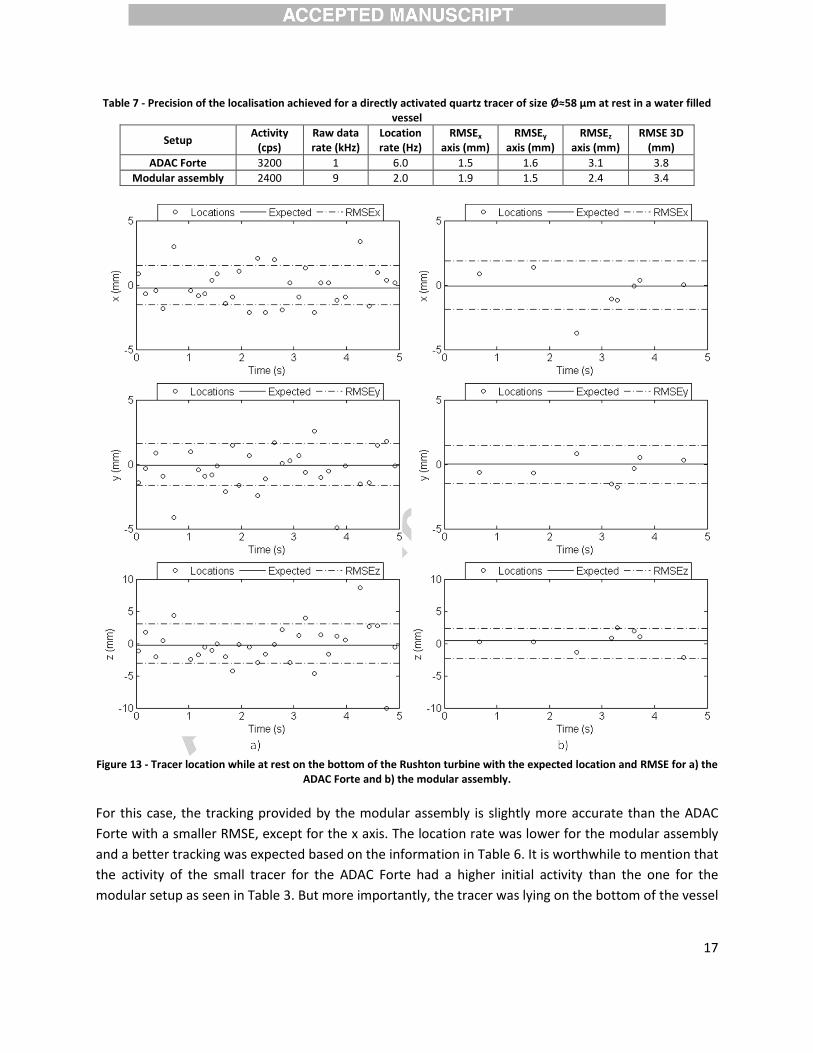
Table 7 - Precision of the localisation achieved for a directly activated quartz tracer of size Ø≈58 µm at rest in a water filled vessel
Setup Activity
(cps) Raw data rate (kHz)
Location rate (Hz)
RMSEx axis (mm)
RMSEy axis (mm)
RMSEz axis (mm)
RMSE 3D (mm)
ADAC Forte 3200 1 6.0 1.5 1.6 3.1 3.8
Modular assembly 2400 9 2.0 1.9 1.5 2.4 3.4
Figure 13 - Tracer location while at rest on the bottom of the Rushton turbine with the expected location and RMSE for a) the
ADAC Forte and b) the modular assembly.
For this case, the tracking provided by the modular assembly is slightly more accurate than the ADAC
Forte with a smaller RMSE, except for the x axis. The location rate was lower for the modular assembly
and a better tracking was expected based on the information in Table 6. It is worthwhile to mention that
the activity of the small tracer for the ADAC Forte had a higher initial activity than the one for the
modular setup as seen in Table 3. But more importantly, the tracer was lying on the bottom of the vessel
18
hence very close to the lower limit of the detection field of view of the modular setup where sensitivity
is lower (shown in Figure 5), this is a potential explanation for this low rate.
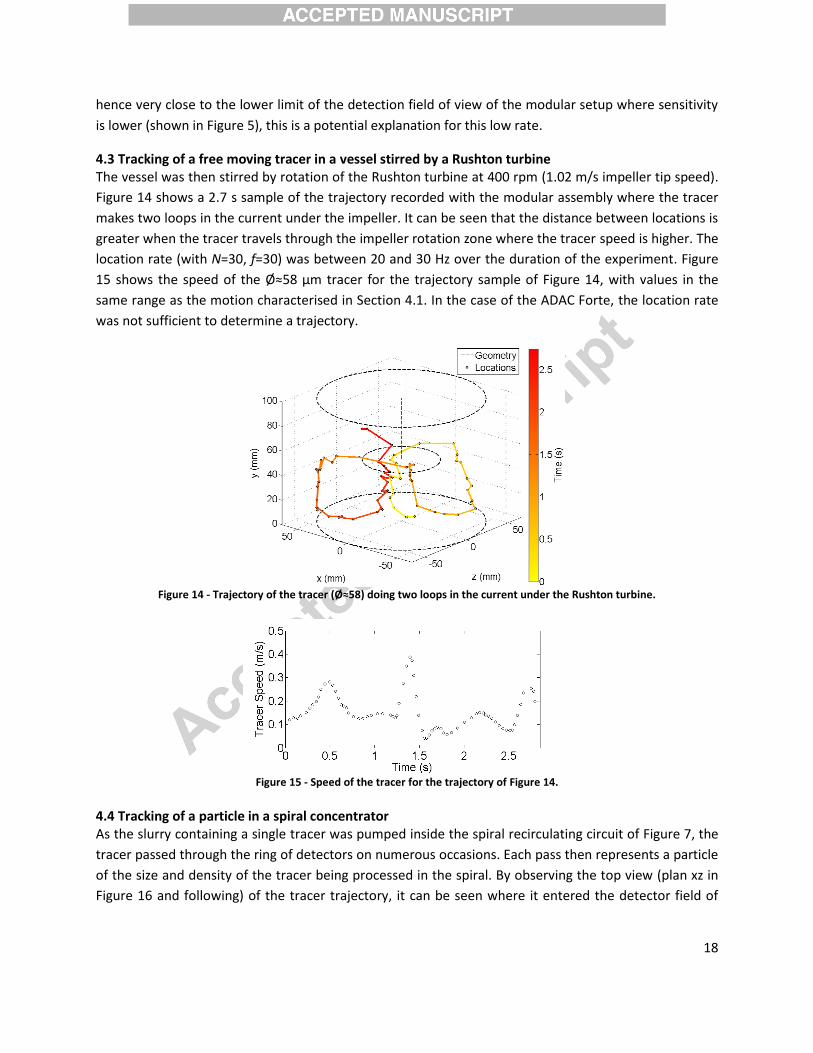
4.3 Tracking of a free moving tracer in a vessel stirred by a Rushton turbine The vessel was then stirred by rotation of the Rushton turbine at 400 rpm (1.02 m/s impeller tip speed).
Figure 14 shows a 2.7 s sample of the trajectory recorded with the modular assembly where the tracer
makes two loops in the current under the impeller. It can be seen that the distance between locations is
greater when the tracer travels through the impeller rotation zone where the tracer speed is higher. The
location rate (with N=30, f=30) was between 20 and 30 Hz over the duration of the experiment. Figure
15 shows the speed of the Ø≈58 µm tracer for the trajectory sample of Figure 14, with values in the
same range as the motion characterised in Section 4.1. In the case of the ADAC Forte, the location rate
was not sufficient to determine a trajectory.
Figure 14 - Trajectory of the tracer (Ø≈58) doing two loops in the current under the Rushton turbine.
Figure 15 - Speed of the tracer for the trajectory of Figure 14.
4.4 Tracking of a particle in a spiral concentrator As the slurry containing a single tracer was pumped inside the spiral recirculating circuit of Figure 7, the
tracer passed through the ring of detectors on numerous occasions. Each pass then represents a particle
of the size and density of the tracer being processed in the spiral. By observing the top view (plan xz in
Figure 16 and following) of the tracer trajectory, it can be seen where it entered the detector field of
19
view and where it exited with the location of the particle at different points along the trajectory
observed.
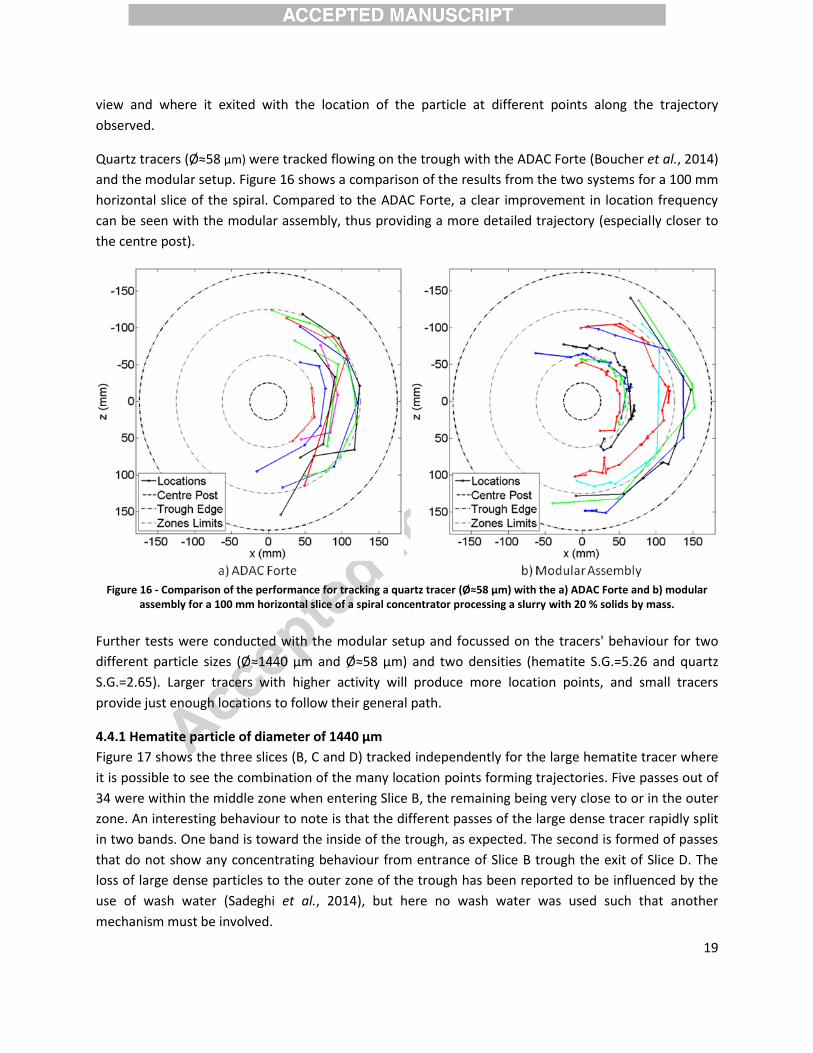
Quartz tracers (Ø≈58 µm) were tracked flowing on the trough with the ADAC Forte (Boucher et al., 2014)
and the modular setup. Figure 16 shows a comparison of the results from the two systems for a 100 mm
horizontal slice of the spiral. Compared to the ADAC Forte, a clear improvement in location frequency
can be seen with the modular assembly, thus providing a more detailed trajectory (especially closer to
the centre post).
Figure 16 - Comparison of the performance for tracking a quartz tracer (Ø≈58 µm) with the a) ADAC Forte and b) modular
assembly for a 100 mm horizontal slice of a spiral concentrator processing a slurry with 20 % solids by mass.
Further tests were conducted with the modular setup and focussed on the tracers' behaviour for two
different particle sizes (Ø≈1440 μm and Ø≈58 μm) and two densities (hematite S.G.=5.26 and quartz
S.G.=2.65). Larger tracers with higher activity will produce more location points, and small tracers
provide just enough locations to follow their general path.
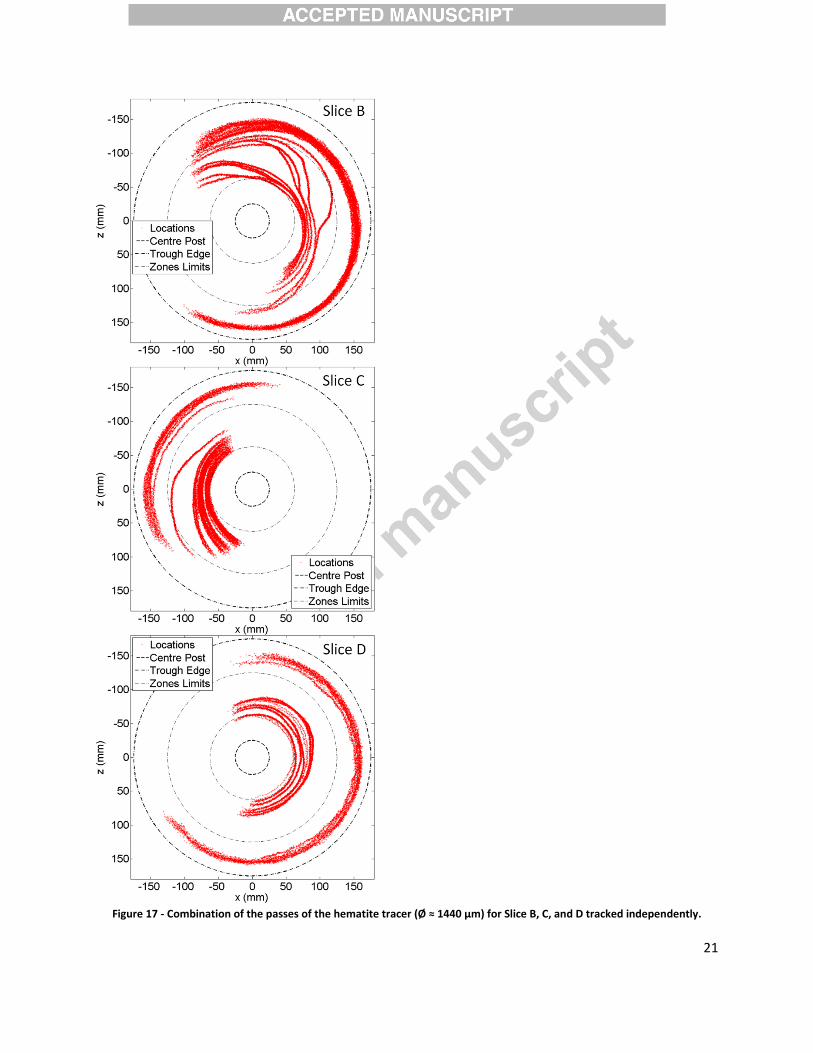
4.4.1 Hematite particle of diameter of 1440 μm
Figure 17 shows the three slices (B, C and D) tracked independently for the large hematite tracer where
it is possible to see the combination of the many location points forming trajectories. Five passes out of
34 were within the middle zone when entering Slice B, the remaining being very close to or in the outer
zone. An interesting behaviour to note is that the different passes of the large dense tracer rapidly split
in two bands. One band is toward the inside of the trough, as expected. The second is formed of passes
that do not show any concentrating behaviour from entrance of Slice B trough the exit of Slice D. The
loss of large dense particles to the outer zone of the trough has been reported to be influenced by the
use of wash water (Sadeghi et al., 2014), but here no wash water was used such that another
mechanism must be involved.

20
Another interesting behaviour is the fast inward migration of some passes starting on the outer zone
limits of Slice B. This fast migration take place where there is a wave inflation (visual observation) in the
slurry created by the flow climbing along the edge of the trough profile and coming back towards the
inside. This might initiate the secondary circulation (upper flow layer moving outwards and lower flow
layer moving inwards) in this small section of the trough which can explain why the large settling particle
is carried inward. This phenomenon is caused by the initial direction of the flow at the exit of the feeding
device. At the exit of Slice B, some trajectories show migration toward the outer zone, but this is caused
by the whole flow direction that has not yet stabilised radially and this material is seen coming back
toward the centre in Slice C, while Slice D show more circular trajectories with constant radius (no
concentration). For all of the passes, migration of the large hematite seems to be stabilized by the end
of Slice C (approximately 1.3 turns).
21
Figure 17 - Combination of the passes of the hematite tracer (Ø ≈ 1440 μm) for Slice B, C, and D tracked independently.

22
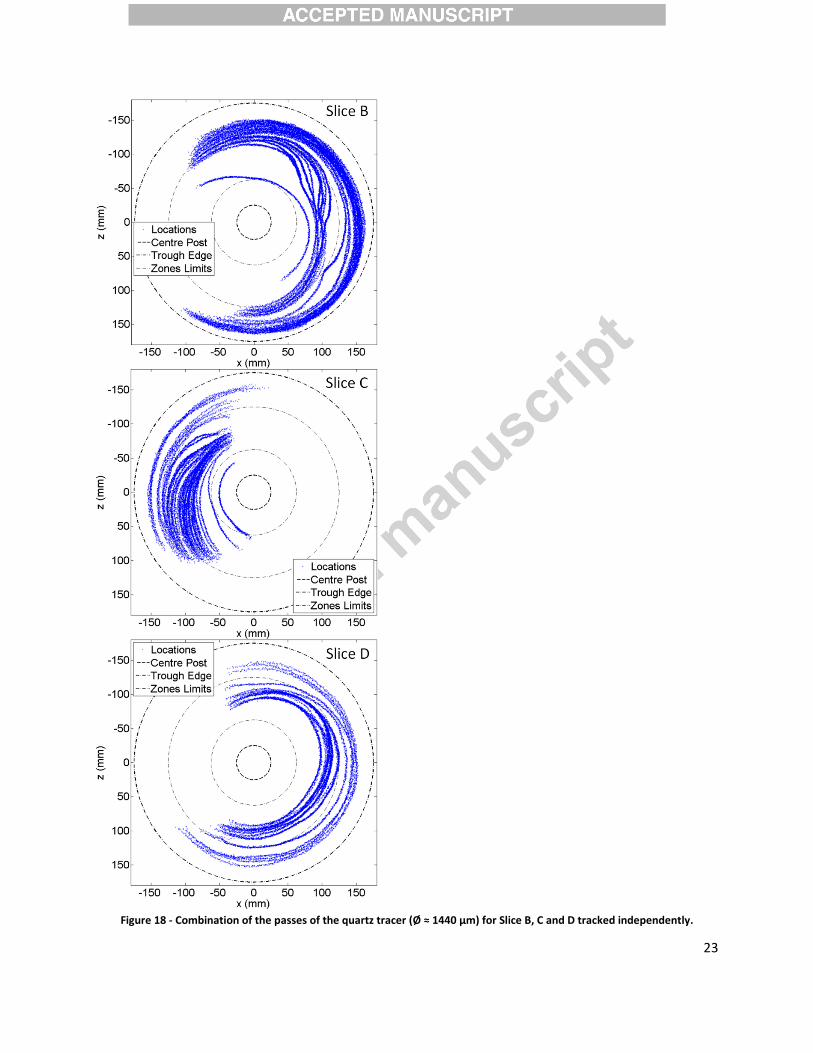
4.4.2 Quartz particle of diameter of 1440 μm
Figure 18 shows the same slices (B, C ,D) as Figure 17, but for the large quartz tracer runs. Looking at the
quartz entrance in Slice B, there is already a difference compared to the hematite tracer behaviour: 40
out of the 41 passes entered Slice B in the outer zone or very close to this region. This indicates that
there was already a slight selectivity in the first 0.3 turn of the trough (Slice A, not tracked for this size).
The same wave inflation effect on the slurry as with the hematite is seen with quartz in Slice B where
some passes suddenly migrate inwards. The trajectories then stay dispersed on the middle and outer
zone up to the end of slice C where they form a more concentrated band in the middle zone.
Later down the trough, the trajectories of the large quartz tracer in Slice D was found to be located
between the two bands of the hematite tracer of Figure 17. This shows that the large quartz and
hematite is differentiated by the spiral even after 1.3 turn (entrance Slice D). But it appears that some of
the large hematite is trapped outside of a material band carrying the large quartz tracer. Another
explanation is that some large particles are trapped in the high flow rate dilute water at the outside as
some passes of the large quartz and hematite tracers are in the outer zone for the three slices tracked
with no indication of radial movement (toward inside or outside).
23
Figure 18 - Combination of the passes of the quartz tracer (Ø ≈ 1440 μm) for Slice B, C and D tracked independently.
24
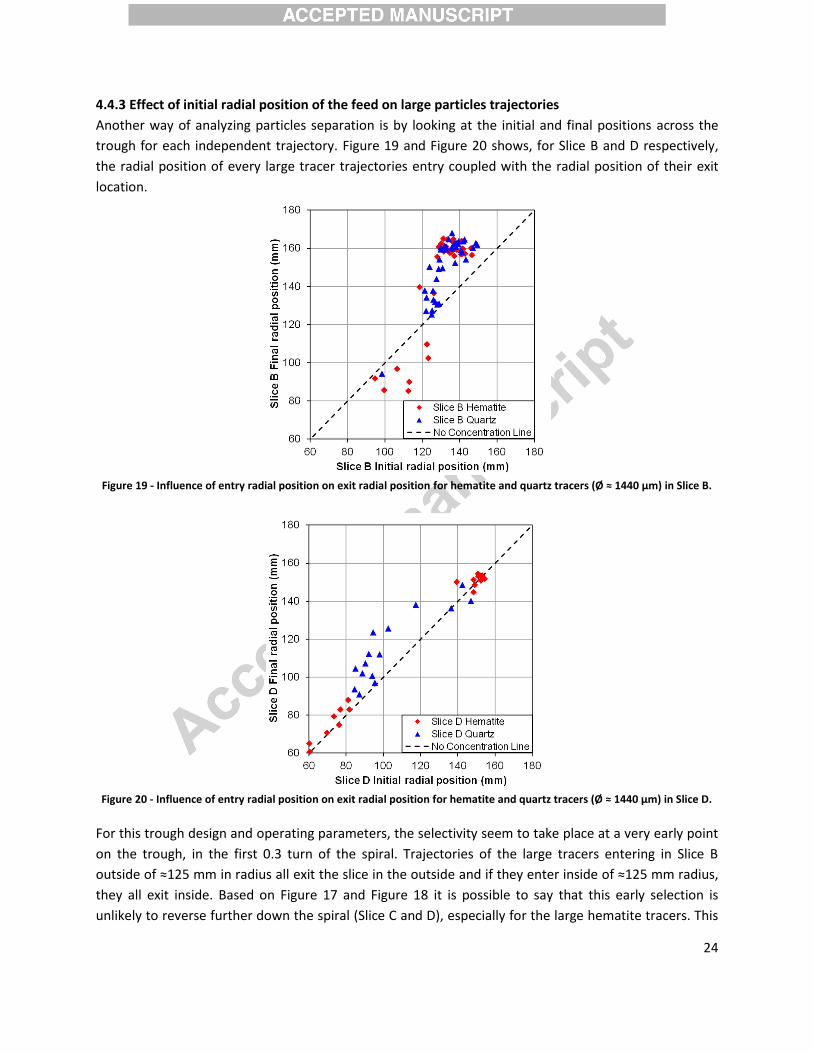
4.4.3 Effect of initial radial position of the feed on large particles trajectories
Another way of analyzing particles separation is by looking at the initial and final positions across the
trough for each independent trajectory. Figure 19 and Figure 20 shows, for Slice B and D respectively,
the radial position of every large tracer trajectories entry coupled with the radial position of their exit
location.
Figure 19 - Influence of entry radial position on exit radial position for hematite and quartz tracers (Ø ≈ 1440 μm) in Slice B.
Figure 20 - Influence of entry radial position on exit radial position for hematite and quartz tracers (Ø ≈ 1440 μm) in Slice D.
For this trough design and operating parameters, the selectivity seem to take place at a very early point
on the trough, in the first 0.3 turn of the spiral. Trajectories of the large tracers entering in Slice B
outside of ≈125 mm in radius all exit the slice in the outside and if they enter inside of ≈125 mm radius,
they all exit inside. Based on Figure 17 and Figure 18 it is possible to say that this early selection is
unlikely to reverse further down the spiral (Slice C and D), especially for the large hematite tracers. This
25
behaviour shows the high importance of the feeding device design and the particles radial distribution at
the exit of such device (the inner zone being the target to prevent the loss of the large dense particle). In
the case of the large quartz tracer, many trajectories are seen to come closer to the inner band of the
hematite tracer at the exit of Slice D (Figure 20). This is related to the non circular flow pattern seen at
the exit of Slice C (Figure 18) where trajectories tend toward the inside.
4.4.4 Hematite particle of diameter of 58 μm
The tracking of small particles (Ø≈58 μm) is more difficult due to their lower activity resulting in fewer
positron emissions and annihilations. Trajectories are thus less accurate than the large tracers
considering the lower number of LoRs detected and resultant location points. Even so, the high
recording rate of the modular detectors' assembly generated enough data to show the small tracers'
general trajectories (with N=30 and f=30). For the small hematite particles, the slices tracked (A, B, C and
D) are shown in Figure 21.

26
Figure 21 - Combination of the passes of the hematite tracer (Ø ≈ 58 μm) for Slice A, B, C and D.
As the location rate is in part related to the speed of the tracer, the outer zone trajectories have a lower
quality for this particle size. The trajectories should be looked at as the combination of points for a pass
rather than taking every point as the exact location of the tracer.
Slice A and B show fewer trajectories, 10 and 6 respectively and the lower activity of the tracer might be
the cause of this, highlighting one difficulty of the direct activation and breaking technique: finding small
particles and effectively measuring their activity to select one with high activity.
Slice A does not show any particular behaviour other than that the tracer became very slow for a few
moments at the inside limit of the slurry film at the exit of the feeding device, probably sticking to the
27
trough rubber surface. In Slice B, the tracer reports solely to the middle zone, but considering the low
number of passes for this slice, this is somewhat inconclusive. Slice C shows that the tracer is carried in
two principal bands with few passes in the high speed outer zone. Those bands seem to merge at the
exit of Slice C. In Slice D, the tracers' trajectories initially dispersed split into different bands with most of
the passes in the middle zone, but close to the inner zone limits. This show a slight concentration of this
fine sized dense hematite at the end of the second turn.
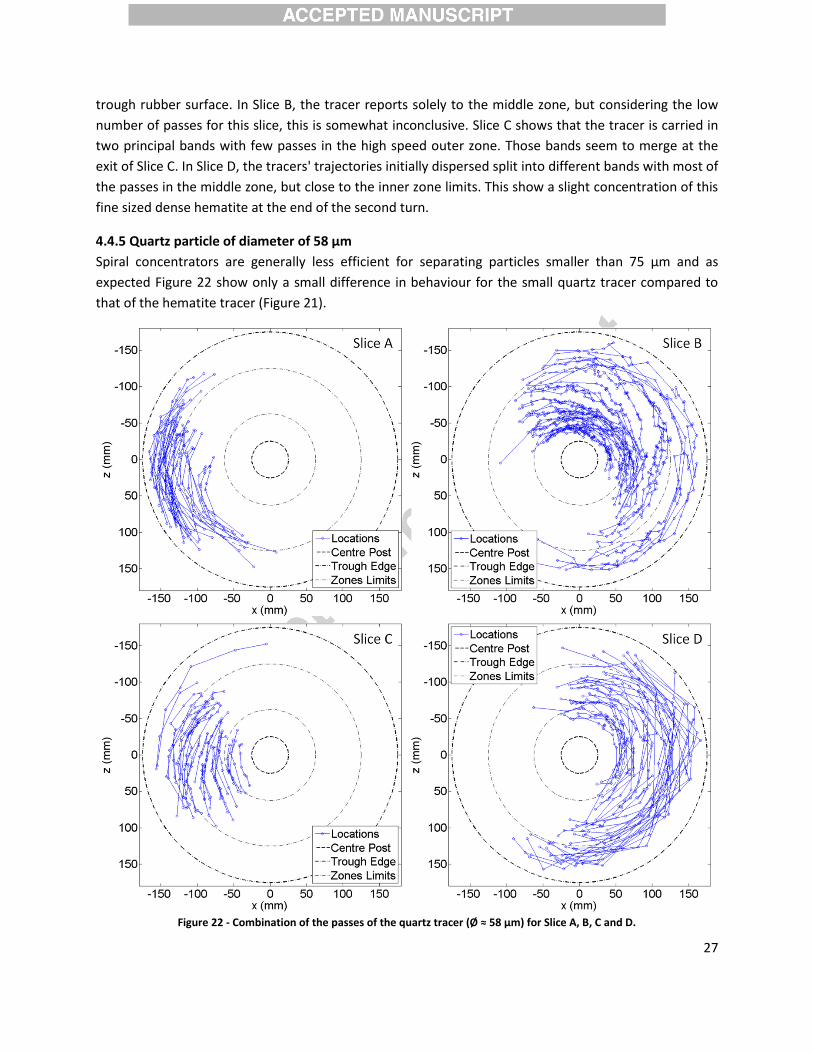
4.4.5 Quartz particle of diameter of 58 μm
Spiral concentrators are generally less efficient for separating particles smaller than 75 μm and as
expected Figure 22 show only a small difference in behaviour for the small quartz tracer compared to
that of the hematite tracer (Figure 21).
Figure 22 - Combination of the passes of the quartz tracer (Ø ≈ 58 μm) for Slice A, B, C and D.
28
Slice A shows that the tracer was mostly fed into the outer zone where the flow climbs up the edge part
of the trough profile shortly after entering. Slice B shows the same inward motion as the large tracers
for trajectories entering the slice at the outer limit of the middle zone. This may be due to the small
tracer just being carried in by the flow of water before the flow attains radial stabilisation. Surprisingly,
many trajectories are found in the inner part of the trough at the end of Slice B, but they are dispersed
in Slice C. This dispersion may be related to the temporary outward flow motion shown by the large
tracer (end of Slice B of Figure 17 and Figure 18). In this case, this natural dispersion of the inner
trajectories of Slice B would be beneficial for the hematite concentration as the small quartz is now
more outward in Slice D.
In Slice D, the slightly lower density of the trajectories in the middle zone shows that the passes are
more located inside or outside of the hematite trajectories of Slice D in Figure 21. This behaviour
indicate that bands of similar size and density particle form on the trough. These bands can split and
recombine under the effect of the overall flow behaviour.
5. Conclusions A specially assembled modular positron emission particle tracking setup made of 12 ECAT951 detectors
has been used to track large (Ø≈1440 µm) and small (Ø≈58 µm) particles of quartz and hematite. The
small tracers were created by breakage and sizing of a directly activated large particle. RMSE
performance in the order of 2.2 mm in x, 0.5 mm in y and 2.5 mm in z for velocities up to 37.7 cm/s with
a resolution of 10 Hz was achieved for the tracking of the small particle with the modular assembly. This
is an interesting improvement in location rate and slightly better in spatial resolution (even for higher
velocity) compared to the ADAC Forte positron camera RMSE performance of 2.0 mm in x, 1.7 mm in y
and 2.8 mm in z for a tracer particle moving at velocities up to 27.6 cm/s with a location rate of 12.4 Hz
for a similar tracer. These results provide information about the capabilities of the modular detector
assembly for tracking tracer particles of small size moving at low speed in granular and slurry processing
systems. The low activity of the small tracer can results in very low location rate and poor trajectory
quality which is also dependent on the tracer speed. Improvements in activation to a certain extend or
detection of lower activity levels as well as improvement in measurement of the small particle activity
are of interest to improve the applicability of the direct activation and breakage technique central to
investigation of surface or density related process.
With the modular detectors system, iron ore representative tracers trajectories inside the first two turns
of a spiral concentrator have been shown for the first time. The separation of the particles in different
radial bands has been shown and some effects present are related to the primary and secondary flow
separation theory, while others are related to the feeding process and trough design.
In the case of the large dense particle reporting to the outer zone of the trough, it appears that the
radial feed position and the first 0.3 turn into the trough is important. Based on the combination of
slices presented, it is highly improbable that large dense particles having an early outward radial
position (outer 30% of the trough radius) will ever come to the inside of the trough. This will lead them
to being discarded via the outer tailings port at the bottom of the spiral.
29
For the small tracer trajectories recorded, it has been shown that concentration is present in the first
two turns, but to a much smaller extent. The important observation for this size is the creation and
dispersion of less define material bands. These bands seem to be affected by the flow of water and
other size class as some fine quartz bands have been seen in the inner zone, event thought the quartz
density is low.
Finally, it is possible to say that the concentration on the spiral is not a constant process taking place all
the way down the spiral, but rather something occurring in specific sections with flow effects that are
different depending on the particle's size and density. Tracking other intermediate size fractions could
provide more information about the interaction between the different bands of material and how the
primary and secondary flows affect the separation; as well as the magnitude that each of them are
present along the trough.
Acknowledgements The authors are grateful for the financial support of COREM and The Natural Sciences and Engineering
Research Council of Canada (NSERC) through the Collaborative Research and Development Project Grant
(CRDPJ 437324-12). The McGill Engineering Doctoral Award (MEDA) from the Faculty of Engineering at
McGill University is also duly acknowledged (funding for D. Boucher). ArcelorMittal Exploitation Minière
is also acknowledged for providing the ore sample.
References Atasoy, Y., Spottiswood, D.J., 1995. A study of particle separation in a spiral concentrator. Minerals Engineering 8, 1197-1208. Bazin, C., Sadeghi, M., Bourassa, M., Roy, P., Lavoie, F., Cataford, D., Rochefort, C., Gosselin, C., 2014. Size recovery curves of minerals in industrial spirals for processing iron oxide ores. Minerals Engineering 65, 115-123. Boucher, D., Deng, Z., Leadbeater, T., Langlois, R., Renaud, M., Waters, K.E., 2014. PEPT studies of heavy particle flow within a spiral concentrator. Minerals Engineering 62, 120-128. Buffler, A., Govender, I., Cilliers, J.J., Parker, D.J., Franzidis, J.P., Mainza, A., Newman, R.T., Powell, M., van der Westhuizen, A., 2010. PEPT Cape Town: a new positron emission particle tracking facility at iThemba LABS, in: Agency, I.A.E. (Ed.), International Topical Meeting on Nuclear Research Applications and Utilization of Accelerators, , Vienna. Chiti, F., Bakalis, S., Bujalski, W., Barigou, M., Eaglesham, A., Nienow, A.W., 2011. Using positron emission particle tracking (PEPT) to study the turbulent flow in a baffled vessel agitated by a Rushton turbine: Improving data treatment and validation. Chemical Engineering Research and Design 89, 1947-1960. Cole, K., Buffler, A., Cilliers, J.J., Govender, I., Heng, J.Y.Y., Liu, C., Parker, D.J., Shah, U.V., van Heerden, M., Fan, X., 2014. A surface coating method to modify tracers for positron emission particle tracking (PEPT) measurements of froth flotation. Powder Technology 263, 26-30. Cole, K.E., Buffler, A., van der Meulen, N.P., Cilliers, J.J., Franzidis, J.P., Govender, I., Liu, C., van Heerden, M.R., 2012. Positron emission particle tracking measurements with 50 micron tracers. Chemical Engineering Science 75, 235-242. Darelius, A., Rasmuson, A., Niklasson Björn, I., Folestad, S., 2007. LDA measurements of near wall powder velocities in a high shear mixer. Chemical Engineering Science 62, 5770-5776.
30
Fan, X., Parker, D.J., Smith, M.D., 2006a. Enhancing 18F uptake in a single particle for positron emission particle tracking through modification of solid surface chemistry. Nuclear Instruments and Methods in Physics Research Section A: Accelerators, Spectrometers, Detectors and Associated Equipment 558, 542-546. Fan, X., Parker, D.J., Smith, M.D., 2006b. Labelling a single particle for positron emission particle tracking using direct activation and ion-exchange techniques. Nuclear Instruments and Methods in Physics Research Section A: Accelerators, Spectrometers, Detectors and Associated Equipment 562, 345-350. Gleeson, G.W., 1945. Why the Humphreys spiral works. Engineering and Mining Journal 146, 85-86. Golab, K.J., Holtham, P.N., Wu, J., 1996. Measurment of Water Velocities on the Spiral Separator by Particle Image Velocimetry, Chemeca '96 : 24th Australian and New Zealand chemical engineering conference. Govender, I., Cleary, P.W., Mainza, A.N., 2013. Comparisons of PEPT derived charge features in wet milling environments with a friction-adjusted DEM model. Chemical Engineering Science 97, 162-175. Guida, A., Fan, X., Parker, D.J., Nienow, A.W., Barigou, M., 2009. Positron emission particle tracking in a mechanically agitated solid–liquid suspension of coarse particles. Chemical Engineering Research and Design 87, 421-429. Guida, A., Nienow, A.W., Barigou, M., 2010. PEPT measurements of solid–liquid flow field and spatial phase distribution in concentrated monodisperse stirred suspensions. Chemical Engineering Science 65, 1905-1914. Hawkesworth, M.R., O'Dwyer, M.A., Walker, J., Fowles, P., Heritage, J., Stewart, P.A.E., Witcomb, R.C., Bateman, J.E., Connolly, J.F., Stephenson, R., 1986. A positron camera for industrial application. Nuclear Instruments and Methods in Physics Research Section A: Accelerators, Spectrometers, Detectors and Associated Equipment 253, 145-157. Holland-Batt, A.B., 1995. The dynamics of sluice and spiral separations. Minerals Engineering 8, 3-21. Holland-Batt, A.B., Holtham, P.N., 1991. Particle and fluid motion on spiral separators. Minerals Engineering 4, 457-482. Holtham, P.N., 1990. Flow visualisation of secondary currents on spiral separators. Minerals Engineering 3, 279-286. Holtham, P.N., 1992a. Particle transport in gravity concentrators and the Bagnold effect. Minerals Engineering 5, 205-221. Holtham, P.N., 1992b. Primary and secondary fluid velocities on spiral separators. Minerals Engineering 5, 79-91. Hyma, D.B., Meech, J.A., 1989. Preliminary tests to improve the iron recovery from the -212 micron fraction of new spiral feed at quebec cartier mining company. Minerals Engineering 2, 481-488. Jayasundara, C.T., Yang, R.Y., Guo, B.Y., Yu, A.B., Govender, I., Mainza, A., van der Westhuizen, A., Rubenstein, J., 2011. CFD–DEM modelling of particle flow in IsaMills – Comparison between simulations and PEPT measurements. Minerals Engineering 24, 181-187. Kawaguchi, T., 2010. MRI measurement of granular flows and fluid-particle flows. Advanced Powder Technology 21, 235-241. Laverman, J.A., Fan, X., Ingram, A., Annaland, M.v.S., Parker, D.J., Seville, J.P.K., Kuipers, J.A.M., 2012. Experimental study on the influence of bed material on the scaling of solids circulation patterns in 3D bubbling gas–solid fluidized beds of glass and polyethylene using positron emission particle tracking. Powder Technology 224, 297-305. Leadbeater, T.W., 2009. The Development of Positron Imaging Systems for Applications in Industrial Process Tomography, Ph.D. Thesis, School of Physics & Astronomy. University of Birmingham, Birmingham, UK, p. 168.

31
Leadbeater, T.W., Parker, D.J., 2011. A modular positron camera for the study of industrial processes. Nuclear Instruments and Methods in Physics Research Section A: Accelerators, Spectrometers, Detectors and Associated Equipment 652, 646-649. Leadbeater, T.W., Parker, D.J., 2013. Current trends in positron emission particle tracking, 7th World Congress on Industrial Process Tomography. Elsevier Ltd., Krakow, Poland. Leadbeater, T.W., Parker, D.J., Gargiuli, J., 2012. Positron imaging systems for studying particulate, granular and multiphase flows. Particuology 10, 146-153. Li, F.-C., Hishida, K., 2009. Chapter 3 Particle Image Velocimetry Techniques and its Applications in Multiphase Systems, in: Jinghai, L. (Ed.), Advances in Chemical Engineering. Academic Press, pp. 87-147. Loveday, G.K., Cilliers, J.J., 1994. Fluid flow modelling on spiral concentrators. Minerals Engineering 7, 223-237. Marigo, M., Davies, M., Leadbeater, T., Cairns, D.L., Ingram, A., Stitt, E.H., 2013. Application of Positron Emission Particle Tracking (PEPT) to validate a Discrete Element Method (DEM) model of granular flow and mixing in the Turbula mixer. International Journal of Pharmaceutics 446, 46-58. Palmers, M., Vadeikis, C., 2010. New Developments in Spirals and Spiral Plant Operations, XXV International Mineral Processing Congress (IMPC), Brisbane, QLD, Australia, pp. 1099-1108. Parker, D.J., Broadbent, C.J., Fowles, P., Hawkesworth, M.R., McNeil, P., 1993. Positron emission particle tracking - a technique for studying flow within engineering equipment. Nuclear Instruments and Methods in Physics Research Section A: Accelerators, Spectrometers, Detectors and Associated Equipment 326, 592-607. Parker, D.J., Forster, R.N., Fowles, P., Takhar, P.S., 2002. Positron emission particle tracking using the new Birmingham positron camera. Nuclear Instruments and Methods in Physics Research Section A: Accelerators, Spectrometers, Detectors and Associated Equipment 477, 540-545. Parker, D.J., Leadbeater, T.W., Fan, X., Hausard, M.N., Ingram, A., Yang, Z., 2009. Positron emission particle tracking using a modular positron camera. Nuclear Instruments and Methods in Physics Research Section A: Accelerators, Spectrometers, Detectors and Associated Equipment 604, 339-342. Pianko-Oprych, P., Nienow, A.W., Barigou, M., 2009. Positron emission particle tracking (PEPT) compared to particle image velocimetry (PIV) for studying the flow generated by a pitched-blade turbine in single phase and multi-phase systems. Chemical Engineering Science 64, 4955-4968. Portillo, P.M., Vanarase, A.U., Ingram, A., Seville, J.K., Ierapetritou, M.G., Muzzio, F.J., 2010. Investigation of the effect of impeller rotation rate, powder flow rate, and cohesion on powder flow behavior in a continuous blender using PEPT. Chemical Engineering Science 65, 5658-5668. Rafiee, M., Bakalisa, S., Fryer, P.J., Ingram, A., 2011. Study of laminar mixing in kenics static mixer by using Positron Emission Particle Tracking (PEPT). Procedia Food Science 1, 678-684. Rammohan, A.R., Kemoun, A., Al-Dahhan, M.H., Dudukovic, M.P., 2001. A Lagrangian description of flows in stirred tanks via computer-automated radioactive particle tracking (CARPT). Chemical Engineering Science 56, 2629-2639. Richards, R.G., MacHunter, D.M., Gates, P.J., Palmer, M.K., 2000. Gravity separation of ultra-fine (−0.1mm) minerals using spiral separators. Minerals Engineering 13, 65-77. Sadeghi, M., Bazin, C., Renaud, M., 2014. Effect of wash water on the mineral size recovery curves in a spiral concentrator used for iron ore processing. International Journal of Mineral Processing 129, 22-26. Sivamohan, R., Forssberg, E., 1985. Principles of spiral concentration. International Journal of Mineral Processing 15, 173-181. Stewart, R.L., Bridgwater, J., Parker, D.J., 2001. Granular flow over a flat-bladed stirrer. Chemical Engineering Science 56, 4257-4271. Tripathy, S.K., Rama Murthy, Y., 2012. Modeling and optimization of spiral concentrator for separation of ultrafine chromite. Powder Technology 221, 387-394.
32
Volkwyn, T.S., Buffler, A., Govender, I., Franzidis, J.P., Morrison, A.J., Odo, A., van der Meulen, N.P., Vermeulen, C., 2011. Studies of the effect of tracer activity on time-averaged positron emission particle tracking measurements on tumbling mills at PEPT Cape Town. Minerals Engineering 24, 261-266. Waters, K.E., Langlois, R., Leadbeater, T., 2012. Using positron emission particle tracking to understand spiral concentrators, 9th International Mineral Processing Conference. Procemin2012, Santiago, Chile, pp. 530-538. Waters, K.E., Rowson, N.A., Fan, X., Parker, D.J., Cilliers, J.J., 2008. Positron emission particle tracking as a method to map the movement of particles in the pulp and froth phases. Minerals Engineering 21, 877-882.
Highlights :
Activation and further breakage of 1440 μm mineral particles provides tracers of 58 μm.
A new PEPT detector assembly is presented and compared to a reference system.
3D root mean square location errors are in the order of 3.4 mm for 58 μm tracer.
58 and 1440 μm quartz and hematite particles are tracked in a spiral concentrator.
Initial radial position of large particle influence concentration.